Article

Solar Power Potential from Industrial Buildings and Impact on Electricity Supply in Bangladesh

Energy & Climate Change Division, Sustainable Energy Research Group, Faculty of Engineering & Physical Sciences, University of Southampton, Southampton SO16 7QF, UK
*
Authors to whom correspondence should be addressed.
Energies 2022, 15(11), 4037; https://doi.org/10.3390/en15114037
Submission received: 30 January 2022 / Revised: 22 April 2022 / Accepted: 27 April 2022 / Published: 31 May 2022

Abstract

:
Bangladesh has a rapidly increasing population and coupled with healthy economic growth, is resulting in a rising energy demand. The country also aims to increase its renewable share of electricity to 10% by 2030. However, due to limited wind resources, solar energy seems to be most appropriate to deliver such a target. However, in a land-scarce country, this presents a major challenge, which this work aims to partially address. Being a globally leading producer of commodities, Bangladesh has a considerable number of large manufacturing plants with appropriate roofs that could be used for deploying solar energy conversion systems at scale. A methodology is presented which identified and assessed 6045 such plants, which have roof areas ranging from 100 m2 to 50,000 m2, and modelled the deployment of solar photovoltaic (PV) technology that can provide power through site available grid infrastructure. Such deployment takes advantage of net metering regulations to enhance the case for such power generation. A techno-economic assessment was also presented, addressing how such utilisation can support the 10% renewables target of Bangladesh without impacting scarce lands. The results showed that around 7.4 GWp of PV capacity can be achieved on such roofs with a corresponding annual electricity generation of 11 TWh. This represents more than 6% of Bangladesh’s current electricity consumption and more than half of the 2030 target. Furthermore, the deployment will save 13,000 acres of farmland, as well as providing power through site available grid infrastructure saving on investment if the systems are deployed on land. These results are likely to influence policy to support the presented proposition, not only in terms of increasing the renewable energy share in the country’s electricity supply mix but also in conserving much-needed land for agriculture.

1. Introduction

Bangladesh is a developing country in Southeast Asia with a consistent ~7% G.D.P. growth rate over the last two decades [1]. Keeping pace with such growth and development, the energy demand is also rising rapidly [2]. In its first Renewable Energy Policy, released in 2014, Bangladesh declared plans to increase its renewable share of electricity to 10% by 2030 [3]. Recent updates revised the target to improve the country’s peak renewable power generation capacity to 40 G.W. by 2041 [4]. Among the available renewable power resources, solar energy is the most abundant and feasible option to exploit for Bangladesh [5]. In addition, solar PV technology provides the opportunity for power generation at the point of use, which is potentially attractive to industrial users such as garment manufacturers. Neighbouring countries, such as India, found grid-tied solar power plants to be promisingly feasible if capital subsidies, generation-based incentives and the inspiration of organisations and individuals are supported by the central and local governments [6]. To help achieve some of the projected capacity targets, Bangladesh enacted Solar Net Metering legislation in 2018, mainly for high-demand industrial prosumers (consumers who produce electricity) [7]. Net Energy Metering (NEM) refers to a policy mechanism that allows prosumers to connect their renewable power systems to the primary distribution grid. It offers a quick-to-adopt tool to enhance Bangladesh’s green power generation prospects, addressing the major challenge of land scarcity [7].
Bangladesh has land scarcity due to the enormously high density of the population (~165 million). Its economy is focused on agriculture arising from an expansive fulminous landscape [8]. The country’s per capita land availability has already fallen to 0.174 hectares (W.B., 2021), which is one of the lowest globally compared to the minimum of 2.02 hectares required to lead a standard civic life [9]. The amount of per capita arable land availability is even more alarming, considering its insufficiency to provide the minimum food for a living. Even this tiny amount is declining annually at a threatening rate (Figure 1). However, solar is the most exploitable renewable resource in Bangladesh [5], which needs land space for power harvesting on a mass scale.
Fortunately, a substantial portion of land exists where the population density is much lower than in the urban regions (Figure 2) and where the land is barely arable due to increased salinity (yellow shade in Figure 2) [10]; such landmasses could be used for generating solar power. However, since land prices are high everywhere in Bangladesh and legal disputes over ownership are rampant [11], this presents a significant challenge to deploying solar farms on such land.
In 2018, a 27 M.W. solar photovoltaic (PV) power plant was installed in Teknaf (Figure 2), a south-eastern sub-district of Bangladesh covering 47 hectares of land. This amount, on average, equates to 2.347 hectares of land per 1 MWp installed [14].
For a small agronomic country with a highly dense population (arable land 60%) like Bangladesh, where the total land area is only 147,570 km2, such a land requirement is rarely available in one contiguous area [15]. In comparison, neighbouring India and Pakistan have vast deserts, such as Thar in Rajasthan, where plenty of non-arable lands are available for large-scale solar farm deployment. Considering future improvements in the efficiency of solar modules, the solar power share in Bangladesh could increase at a commensurate pace. In Bangladesh, however, it is challenging to deploy solar power at a large scale at the expense of arable land where a higher rate of return from farming still possible. Even farming rice, the most common crop in Bangladesh, is more economical than generating solar power due to the increased initial investment for the latter. However, due to the reducing cost of PV systems coupled with environmental concerns, Bangladesh cannot ignore using renewable resources to cut down its emissions and adhering to the sustainable development goals that it has ratified [7]. That is why the government and the stakeholders are considering strategies to harness more renewables without putting stress on land use.
The deployment of net metering schemes with the industrial prosumers was preferred to help the planners in the following ways in this nexus:
(1)
The rooftop areas of the factory buildings can provide reasonable spaces for installing PV systems, producing green power whilst cutting energy bills and the carbon emissions of the plants.
(2)
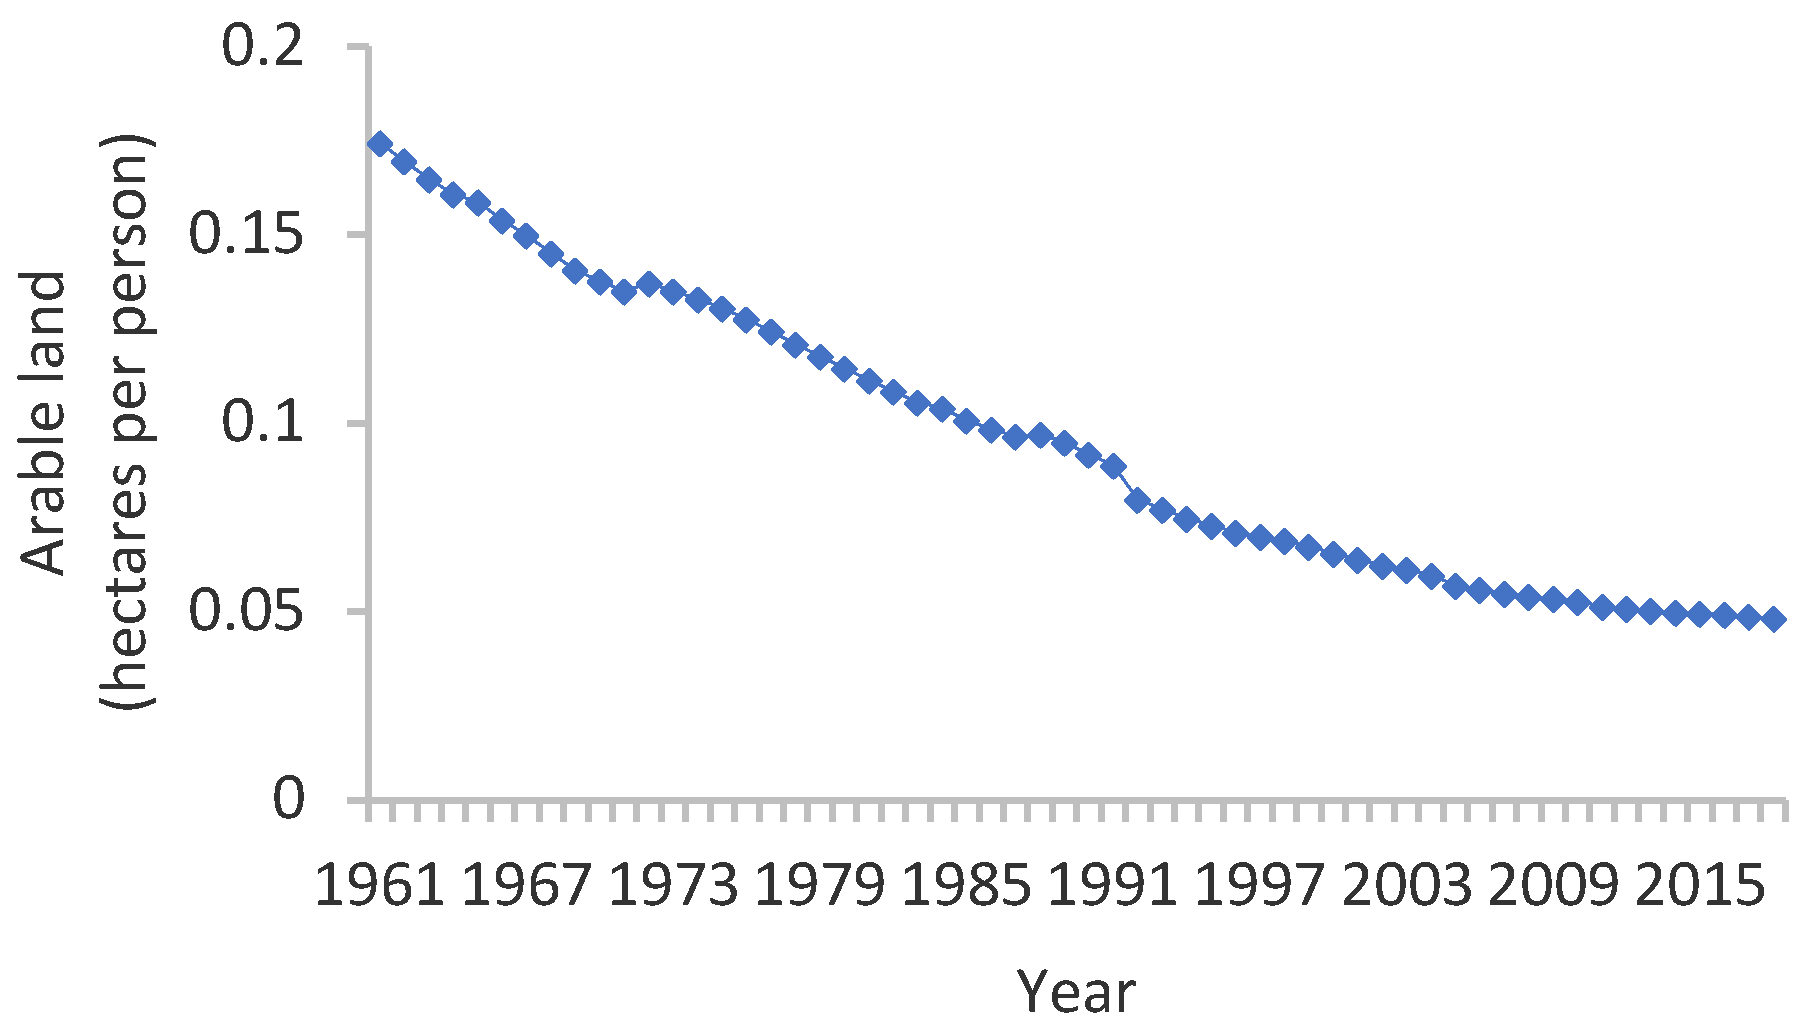
Scarce land can be saved for farming and other indispensable uses delivering a higher rate of return.
(3)
Solar energy can displace imports from the national grid, and excess energy can be fed back into the grid. These twin effects, coupled with net metering, will enhance the nationwide energy availability through a sustainable energy supply.
Bangladesh is a large producer of certain commodities like garments manufactured in many medium/large sized plants/factories across its landscape, occupying a significant portion of its available land. The available rooftop areas of these industrial-scale entities are immense, having significant prospects for providing a route for the deployment of large-scale solar photovoltaic systems, especially in the case of prosperous prosumers (who consume and produce the same commodity simultaneously).
This research addresses the complex relationships in transitioning Bangladesh to low carbon pathways, where the population and energy demands are rapidly rising and the land is scarce. Further, this work deals with renewable energy, particularly solar photovoltaic (PV), and its required land footprint in a land-scarce country, considering the opportunity presented in the net metering regulation to achieve a higher renewable share in Bangladesh’s energy mix. As can be seen from the presented literature, there is not much large-scale deployment of PV farms in Bangladesh. To our knowledge, this research and the resultant renewable energy potential in a Bangladeshi context is seminal and has not been studied to date.
This study provides a methodology to estimate the extractable solar power from systems installed on the rooftops of manufacturing plants following the new metering guidelines enunciated by the government of Bangladesh. Using statistical extrapolation and geographical information system (G.I.S.) tools, the research provides analyses of the prospects of solar electricity generation if net metering technology is used by the industrial prosumers who also have space available on their factory rooftops for installing photovoltaic solar systems.

2. Case for Solar Photovoltaics in Bangladesh

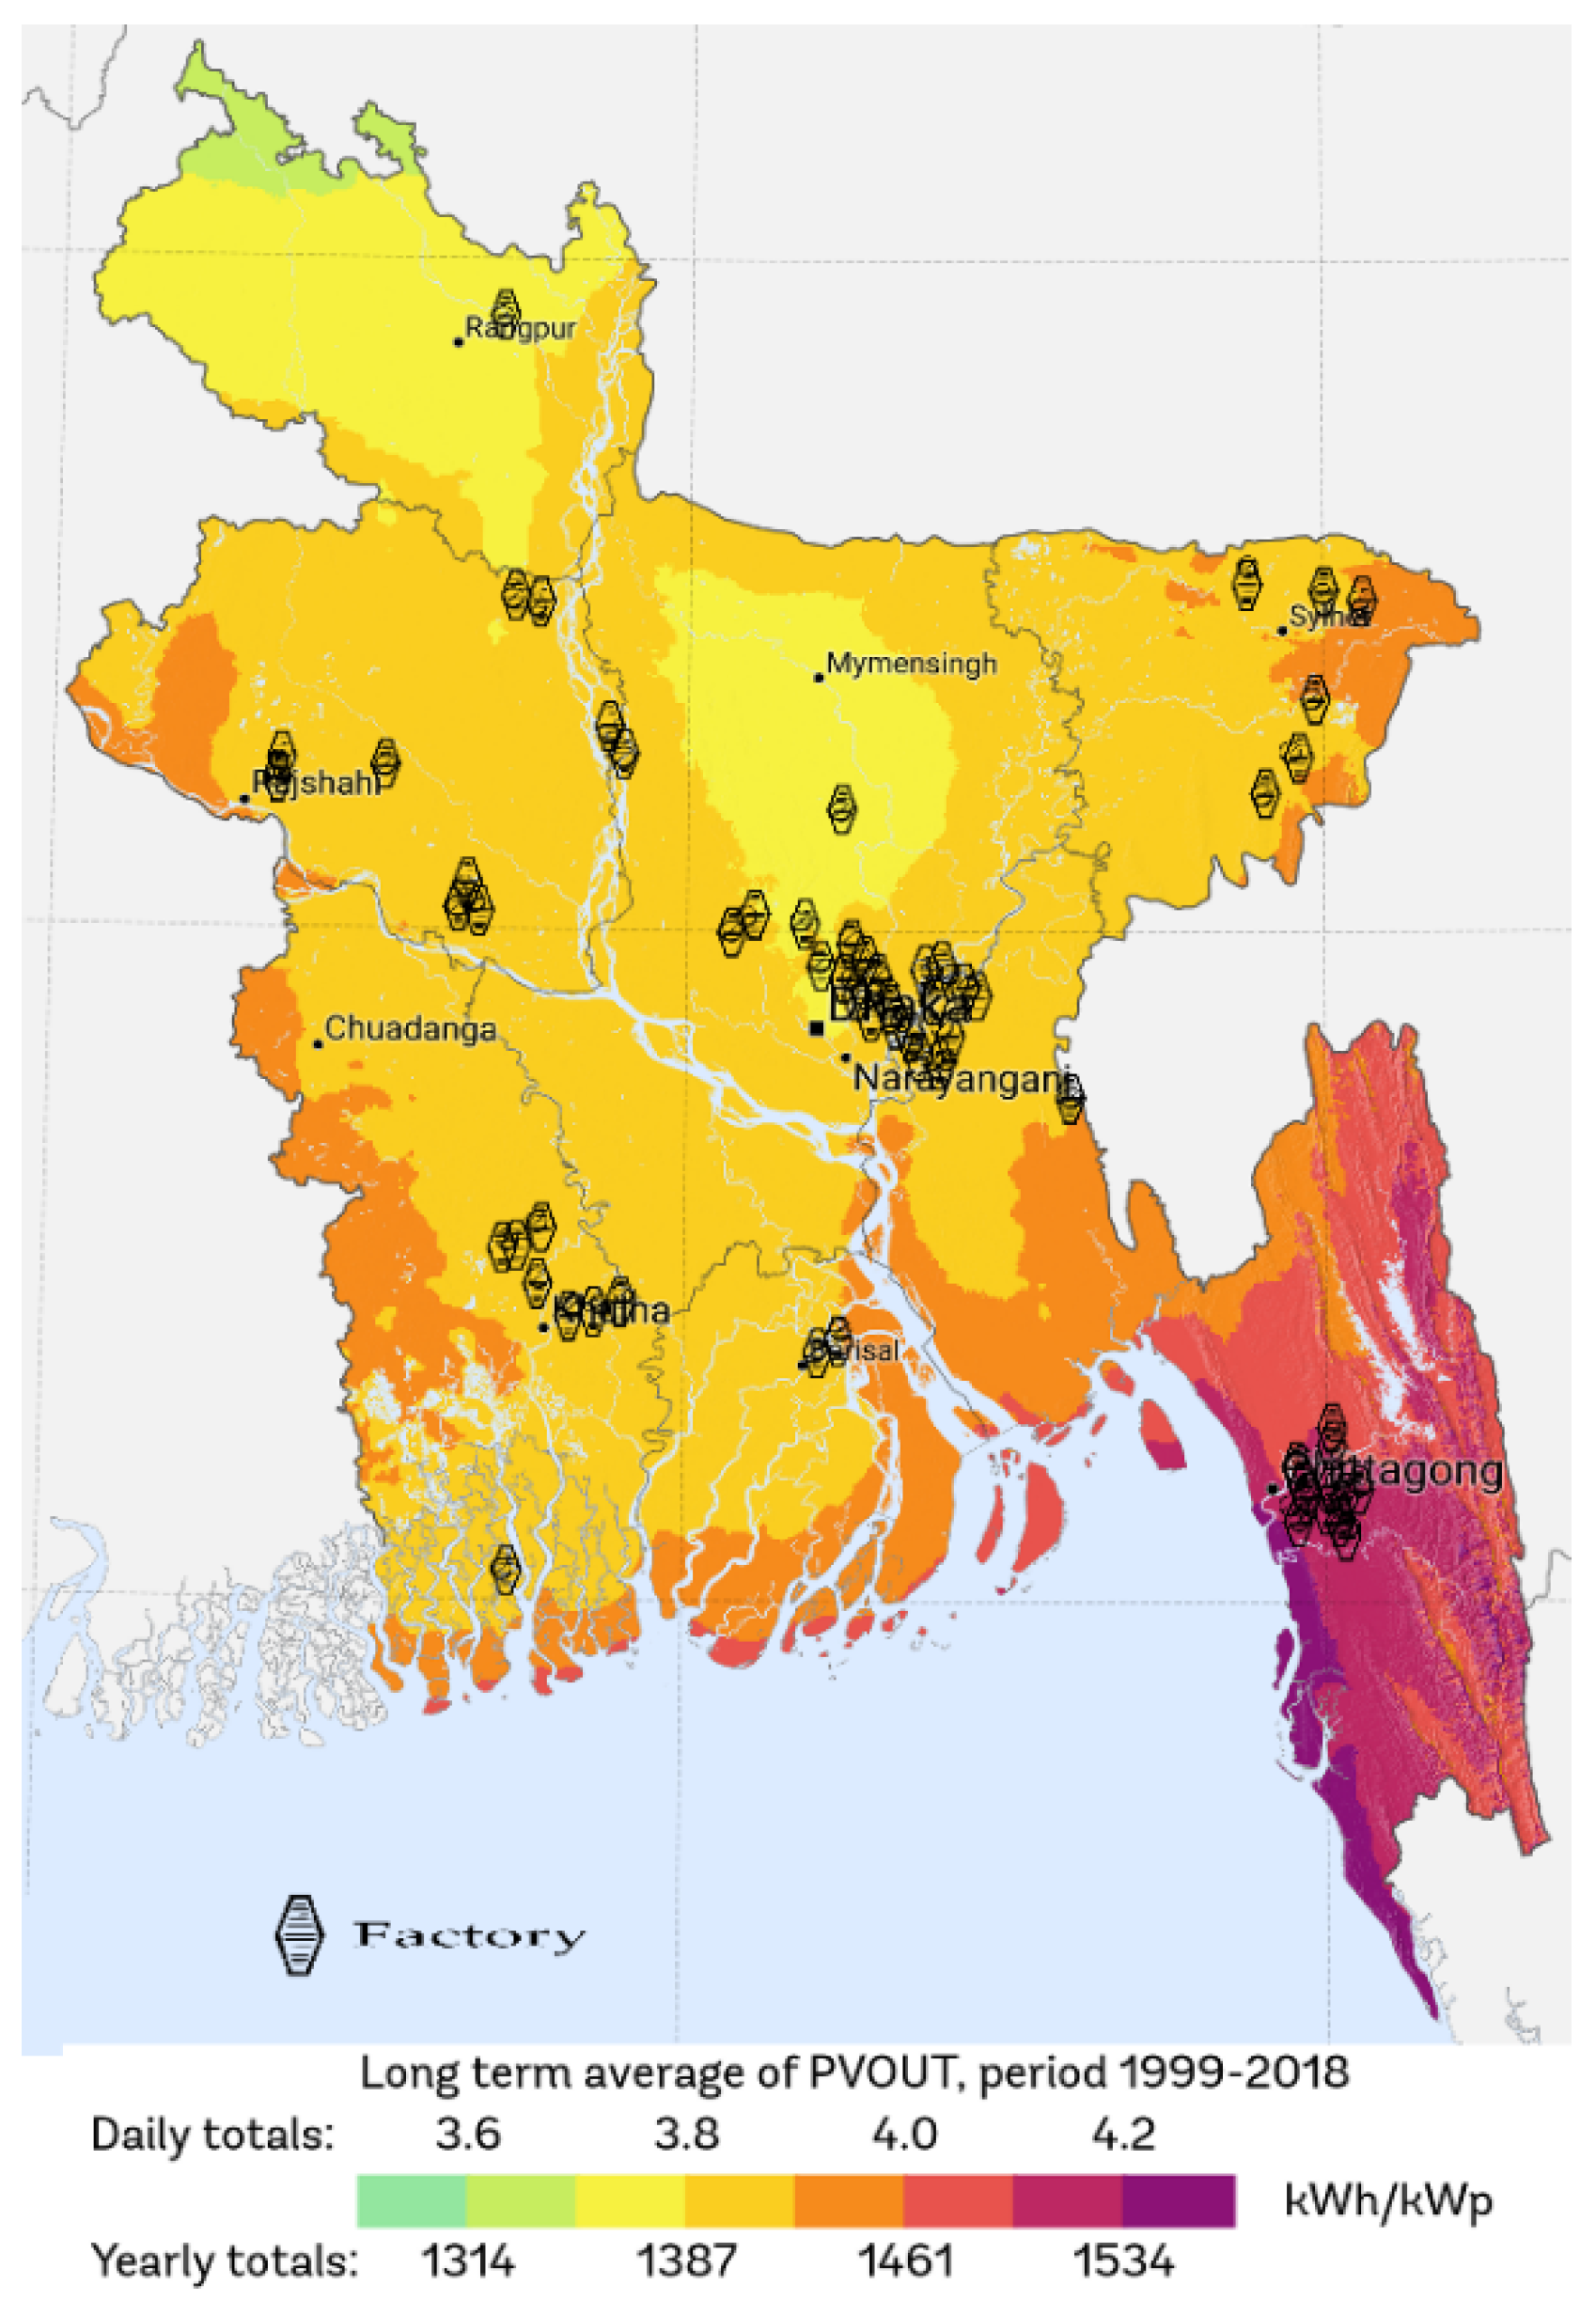
2.1. Solar Energy Potential in Bangladesh

Solar energy is one of the most abundant renewable energy resources globally. Concentrating solar power (C.S.P.) and solar PV systems are appropriate technologies to provide electrical power at scale. By 2021, the total global installed capacity of solar PV systems exceeded 843 GWp [15]. The solar resource in Bangladesh is abundant, however, as indicated earlier, there is a scarcity of land [16].
The main reason behind enacting net metering for solar PV systems only in Bangladesh is due to the abundance of uniform solar irradiance all over the country, as compared to other renewable energy sources. The daily solar irradiance is 4.2–5.5 kWh/m2 on average, or approximately 1825 kWh/m2/annum [17]. If one considers a 20% efficient PV module and combined losses of 25% (cell temperature effect, inverter losses, mismatch etc), an annual electricity generation of 0.2 × 1825 × (1 − 0.25) = 274 kWh/m2/annum can be achieved. As a comparison, a south-facing roof in the south of the U.K. would generate around 185 kWh/m2/annum.
Bangladesh has shown remarkable success and effective implementation of solar-based energy technologies, including solar home systems (S.H.S.), providing power at the household level [18].
Some scholars have studied the solar energy potential for different technologies in Bangladesh. Only grid-tied solar PV systems have a significant potential of 50,174 MW [17]. However, to utilise the entire prospect is challenging due to the required funding and mobilisation needed. However, in a government study, it is projected that by 2041, solar PV systems could contribute approximately 20% of the total electricity demand (240 TWh) of the country under high economic growth, when coupled with energy efficiency and conservation (EE&C) measures [7].
Bangladesh is the most riverine country in the world. Hence, floating solar PV systems may be installed on the surface of water bodies used for irrigation, low-lying lands, haors (a haor is a wetland ecosystem in the north-eastern part of Bangladesh, which physically is a bowl or saucer-shaped shallow depression, also known as a back swamp [19]), and other wetlands, including rivers. According to the Bangladesh Delta Plan 2100, there will be around 3200 km2 of newly reclaimed land on the Padma and Jamuna rivers/riverbanks. The proposed Teesta Multipurpose project will also reclaim nearly 170 km2 of new land. However, only ~4% of the reclaimed land may be used for solar PV system development upon the predicted future availability because of a probable increase in demand for other purposes like a habitation. However, even that amount is subject to policy dilemma regarding many uncertainties. Suppose the government provides such a volume of land to construct appropriate generation, distribution and transmission infrastructure based on solar. In that case, the installation of solar parks was proposed by the policymakers, government agencies, international and local entrepreneurs and a solar power hub may be erected through public and private investment [7]. However, as per 2018, the government tried to search for suitable landmasses to install large solar power parks but failed to locate anything significant for the prospective projects. Today, the situation appears to be even more complicated due to the rapid rise in land prices. In Bangladesh, redistributing state-owned land, generally named khas land, to landless people was undertaken in the 1980s and is endorsed and enacted in several policy documents. Initially, the government thought some khas land might be left for targeted solar schemes. Unfortunately, this was not the case as the land was occupied by the high population [20]. Hence, alternative approaches are needed to overcome these challenges.
A large-scale solar home systems (S.H.S.) programme was initiated to ensure clean energy was available to those without electricity access living off-grid in rural Bangladesh. Such a program is considered one of the largest, fastest-growing off-grid renewable programs in the world for S.H.S. The public-private partnership organisation I.D.C.O.L. (Infrastructure Development Company Limited) has installed more than six million solar home systems with a combined capacity of 262 MWp for 25 million off-grid households [21]. Installation growth is 58% year-on-year, and over 65,000 SHSs are being installed every month [22]. Through the S.H.S. program, nearly 1.14 million tons of kerosene valued at U.S. $411 million have been replaced annually. These systems have battery storage to ensure reliable power to the households during their use. However, having storage increases the initial investment cost and extends the payback period [4].
The global trends in (a) total installed cost and (b) the levelised cost of energy (LCoE) for solar PV systems until 2019 are shown in Figure 3 and Figure 4, respectively. The global weighted average total installed cost of solar PV systems significantly dropped to USD 995/kWp at the end of 2019, compared to USD 4702/kWp in 2010 [22]. A similar reduction was visible in the Bangladeshi scenario too. This progress was made possible by cutting down the cost of solar PV components through technological advancements, reduced operation and maintenance costs, and increased higher capacity factors (C.F.). Mass manufacturing of PV modules and accessories at a lower cost in China and accelerated imports from there has supported the growth of solar PV power penetration, both financially and technically, in Bangladesh [23].
Increased use of tracking facilities in large-scale projects, deployment in areas with comparatively higher radiation, and reduction in system losses, etc., contributed to a steadily reduced cost of C.F. As a result, the global weighted average LCoE for utility-scale solar PV projects is U.S. $68/MWh in 2021. This figure denotes an 82% reduction compared to 2010 [15].

2.2. Rooftop Solar PV in Bangladesh

Rooftop PV is the most feasible option among different renewable resources in Bangladesh because of the higher population density and scarcity of suitable and undisputed land. If proper instrumental support is provided for rooftop systems, such a policy would likely assist in achieving Bangladesh’s renewable energy goals [24].
The government has issued directives to prosumers to install rooftop PV as a pre-condition to being connected to the electricity grid (IEA, 2021). Industries are encouraged to install PV systems to offset a particular portion of their power demand, reducing their impact on grid supply systems. One hundred new economic zones (E.Z.s) will be developed by 2035, where around 15% of these areas are industrial sheds, parking sheds, and other suitable sheds that will be appropriate for solar PV system installation. It was estimated that the installed solar PV capacity in each of the E.Z. areas will be around 10 M.W., achieving a combined capacity of only 1 GWp [20].

2.3. Grid Stability

Grid stability is a crucial issue regarding the generation and transmission of intermittent renewable power. The power grid is a complex and ever-changing structure to provide electrical power reliably and economically, from generators to the loads [25]. Any fluctuation in the identified frequency is usually controlled through increasing or decreasing power flow in the grid. Deployment of large-scale PV power requires grid stability to a significant extent due to its spatiotemporal inconsistency over time and locations.
Grid stability also signifies the reliability and consistency in power generation and supply or electricity generation. Solar power has weak grid stability due to its dependence on daily varying sunlight hours and potential supply fluctuations due to cloud cover. The grid stability can be defined as “the ability of an electric power system, for a given initial operating condition, to regain a state of operating equilibrium after being subjected to a physical disturbance, with most system variables bounded so that, practically, the entire system remains intact” [25]. It must be appreciated that higher penetration of solar PV into the grid will necessitate understanding the implications for grid stability. However, it is anticipated that PV system deployment will be gradual, with high power absorption locally, and issues related to grid stability will be addressed through strengthening, where needed, before deployment. This point was further elaborated, in terms of the resilience of the connection point, at the factories in the Section 4 results and discussion sections. In addition, the government of Bangladesh has taken the issue of grid stability into account and planned to address it with the adoption and development of smart grid technology. The government has declared a plan to make the distribution and transmission grid smart by 2030.

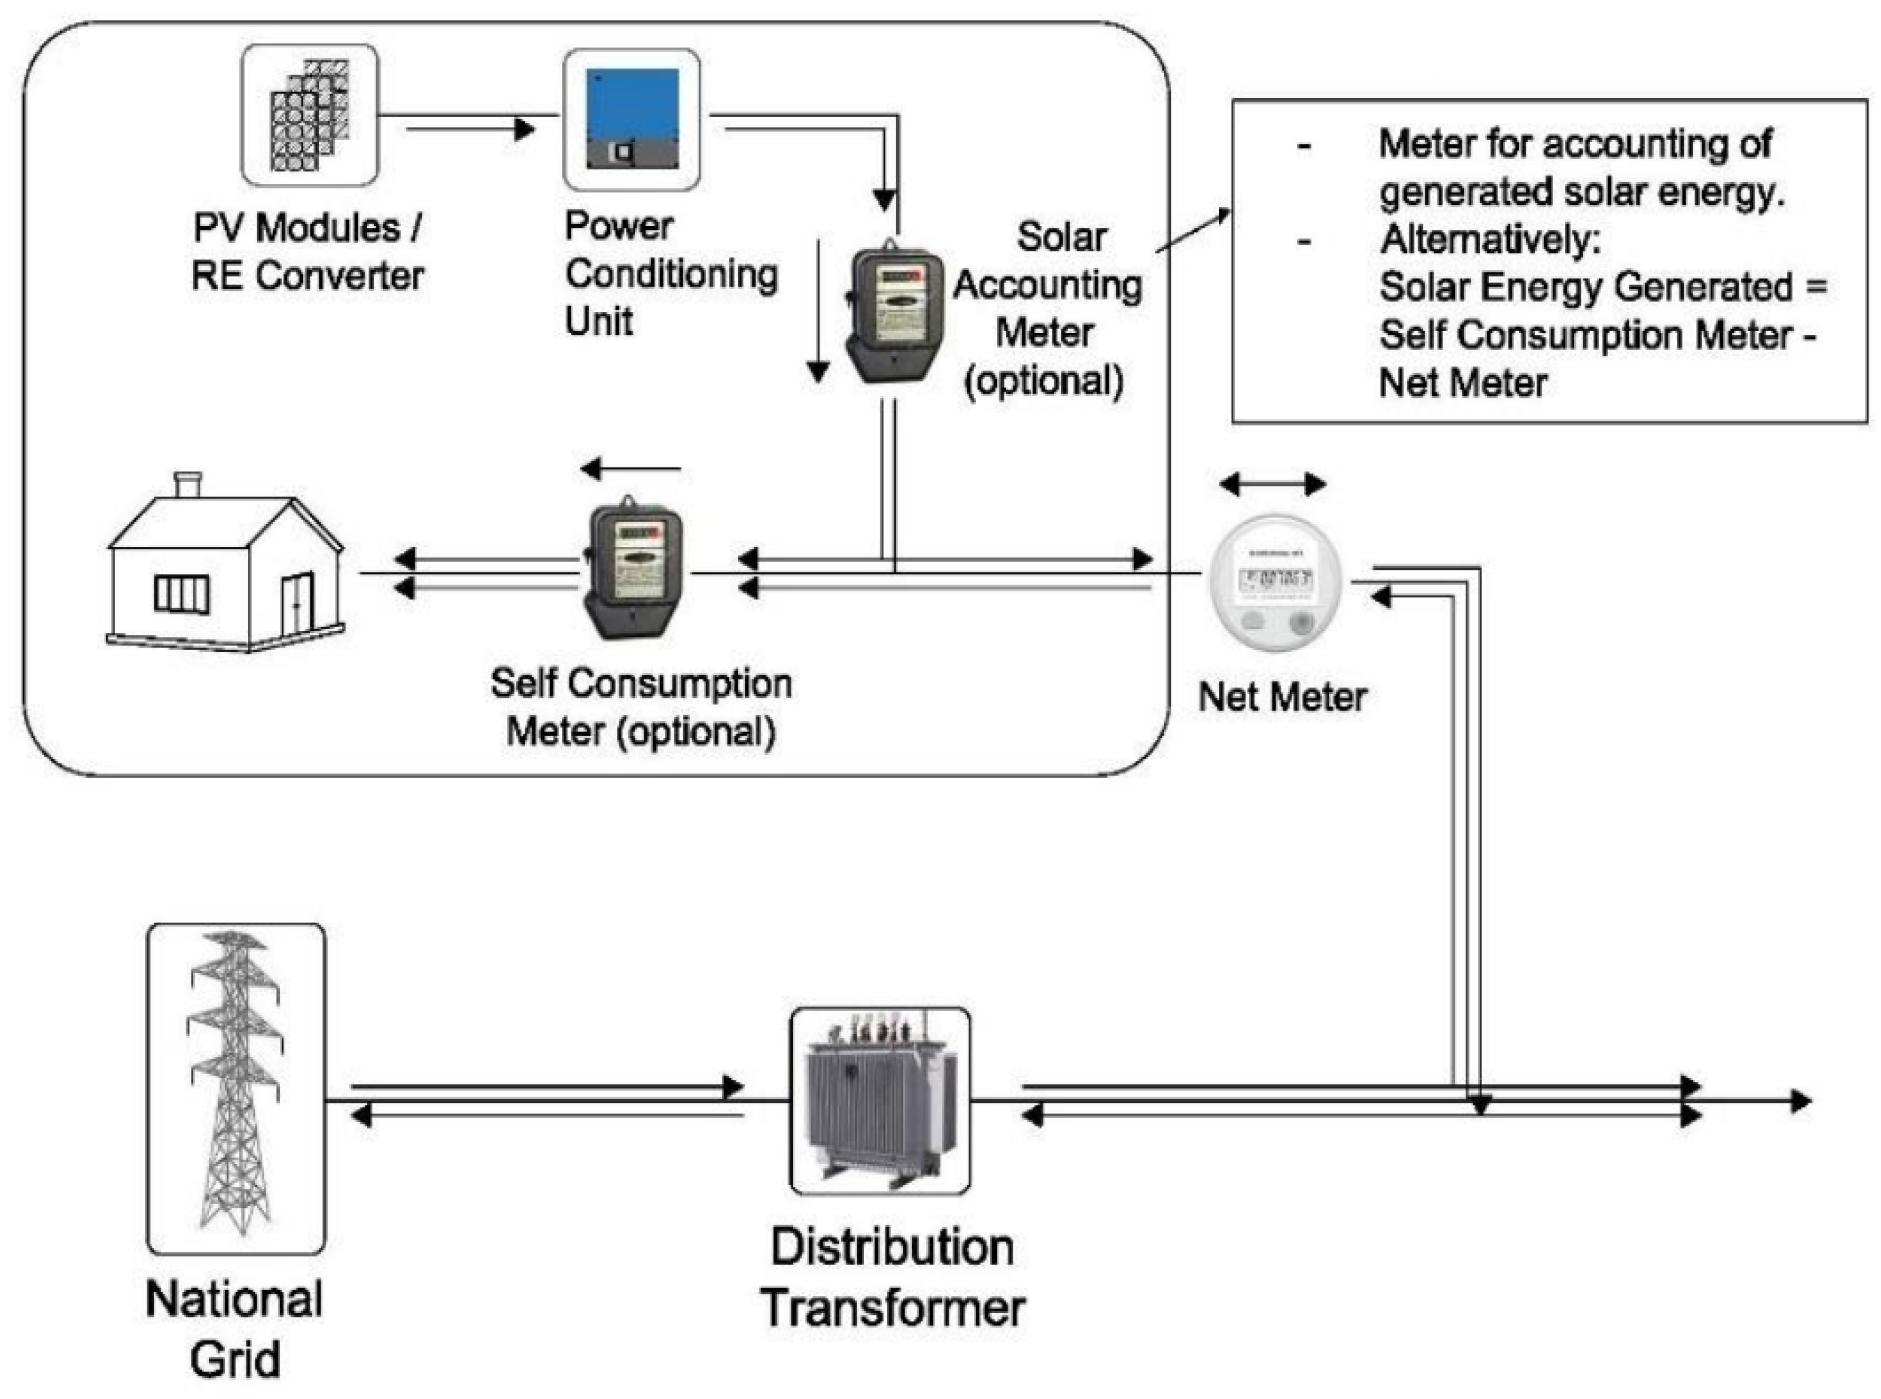
2.4. Net Energy Metering in Bangladesh

Net energy metering (NEM) is popularly known as net metering, and it refers to a techno-policy mechanism that allows customers to connect their renewable energy systems to the distribution utility. Under this scheme, any excess electricity after self-consumption is transmitted to the distribution grid. In return, the prosumer either imports an equal amount of electricity from the grid during other times or receives a price of the net amount of exported electricity at the end of the settlement period (Figure 5). Accordingly, the prosumers’ electricity bill will be produced as per the meter’s net energy recorded. The generated electricity can flow in both directions under the NEM system. Many experts have stated that net metering could be a viable option for Bangladesh to initiate the green transition in the power sector [21].
Net metering is gaining popularity all over the world, which offers many significant benefits. At an adjusted and incentivised tariff rate, this method will reduce the dependency on grid power due to self-generated electricity, result in lowered electricity bills, and lessen fossil fuel import and carbon emissions, ensuring environmental sustainability. After all, it enables the government to spend saved resources on other socioeconomic development activities [17]. Therefore, naturally, Bangladesh considered using it to exploit these benefits.
More than 70 countries worldwide have implemented NEM schemes [26]. The same source says Bangladesh is not far behind in intending to upscale its use. The government has already formulated and enacted net energy metering (NEM) guidelines in 2018, which were amended and promulgated in 2019, where the capital expenditure (Capex) of the PV systems will be supported by soft loans from banks and financial agencies under flexible conditions to reliable entrepreneurs [24]. The fund for renewable energy promotion is frequently channelled to such schemes from the loans and grants from foreign agencies like the World Bank, G.T.Z., Asian Development Bank, etc., [12]. Encouraged by this initiative, consumers are getting interested in connecting to NEM using such financing options, resulting in the increasing deployment of renewable energy (Chowdhury & Khan, 2020). By the end of 2021, 1335 net metering project proposals, with an approximate PV capacity of 1.5 GWp, have been approved by the different power generation and distribution companies in Bangladesh [22]. Among them, D.E.S.C.O. (Dhaka Electricity Supply Company Ltd., Dhaka, Bangladesh) has the highest number (253) of systems installed to date (total capacity of around 20 MWp) [27]. Initially, all three-phase consumers (domestic/residential, commercial, and industrial) were considered for the NEM system [22]. However, later only industrial prosumers were permitted for such a scheme. According to the enacted guidelines, the maximum output capacity of the installed renewable energy (RE) system on the A.C. side of the inverters can be 70% of the consumer’s sanctioned load, which cannot be more than 10 M.W. [22]. These conditions were inserted considering the existing capacity of the grid stability of the leading distribution network of Bangladesh. Key eligibility criteria of NEM in Bangladesh are the following [22].
Under the current regulations, the prosumer should be: (a) a current grid-connected customer of a concerned utility category, (b) applicants should not have outstanding arrears before applying for the NEM system and (c) generated electricity must be from RE sources and consumed at the point of generation by the prosumer, and excess electricity must be exported to the grid.
Funding availability for NEM projects is extremely limited in number to date in Bangladesh. However, the Infrastructure Development Company (I.D.C.O.L.) (Dhaka, Bangladesh), a non-banking financial institution, has provided a concessionary loan to some projects but plans to finance a total capacity of 300 MW of power by 2022. The Bangladesh Bank’s green financing program and another non-banking institution, Bangladesh Infrastructure Finance Fund Limited (B.I.F.F.L.) (Dhaka, Bangladesh), came forward to finance net metering projects. In addition, more foreign direct investors are showing interest in joining the ventures shortly [4].

3. Methodology

The study used a novel quantitative methodology to determine the amount of extractable solar photovoltaic power from the rooftop areas of several manufacturing industrial buildings in Bangladesh. It used geographic information system (G.I.S.) tools to locate such buildings, estimation of the rooftop areas, corresponding solar irradiance on the selected areas, statistical analysis for selecting a representative sample, and generalisation of the method to cover all the factories considered and the land to be displayed. The methodology used followed the following steps:
(a)
Collecting factories’ data and their geolocations
A list of medium/large sized manufacturing factories was obtained from the Ministry of Industry [28]. The geolocations (longitudes and latitudes) of these factories were searched in Google maps, which also allowed the determination of the respective irradiance level at these locations (see (d) below). It must be noted that Bangladesh is divided into eight geopolitical and administrative divisions. Most of the industrial manufacturing plants are located in the Dhaka Division, where the capital is located. The second-largest number belongs to the Chittagong Division, where the commercial and industrial capital is located. Then the selection addressed the remaining six divisions consecutively [29]. Since Dhaka and Chittagong are the major industrial areas, naturally, they have more plants than other regions in the country (Figure 6).
(b)
Selection of representative sample of factories
Since estimating the rooftop area of all 6045 large factories scattered all over Bangladesh was practically time consuming and expensive, we employed a statistical technique to arrive at a representative sample. The size of the sample is very important for getting accurate, statistically significant results. For this study, a representative sample size of 67 among the total 6045 factories was selected, based on a confidence level of 90% and error limit of 10%, using the following formula of statistical distribution [30]:
Sample   size = z 2 × p ( 1 p ) e 2 1 + ( z 2 × p ( 1 p ) e 2 N )
where, N is the population size, e is the margin of error (percentage in decimal form), p is the population proportion, and z is the z-score. Equation (1) is a standard formula in statistical science to determine a representative sample size from a larger population [30].
(c)
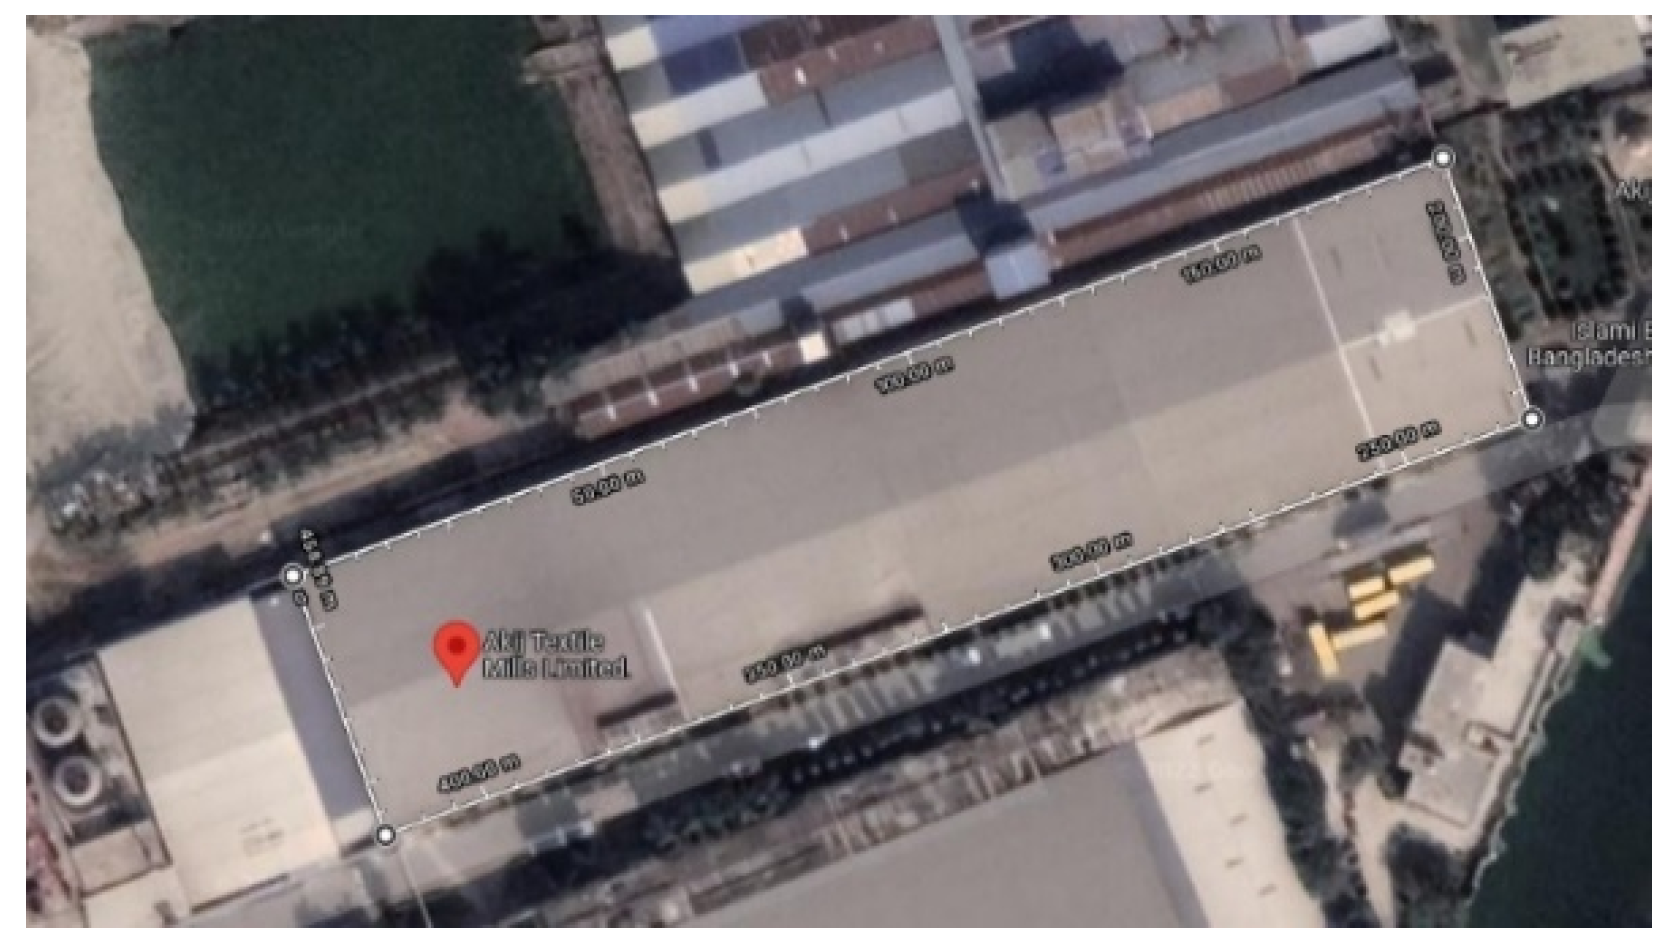
Estimating roof areas of the factories
When the address of the factory is searched using Google Maps (a), an aerial top view image of that factory building and its structure is shown. The rooftop areas of the corresponding factory buildings are determined using Google Maps area mensuration tool. That is, from the Google satellite image, enclosing the roof area with drawn lines using the Google Area Measurement tool gives the area of the rooftop. The entire rooftop space cannot be covered with solar panels in practice. Rooftop surface pattern heavily influences the usability of the space. Many such factory rooftops are not entirely flat. Some of them are gabled, some are zigzagged or slanted. Therefore, the study considered the surface pattern (collected upon contact with the factories and assumed from aerial views shown by satellites) and the obtained area was multiplied by the corresponding surface factors.
(d)
Estimating the solar resource for each roof area
Then, the extractable PV power from solar insolation on that particular plant rooftop was obtained from the Global Solar Atlas (https://globalsolaratlas.info/, accessed on 30 September 2021). Photovoltaic potential from given coordinates is available on that website.
(e)
Generalising the method to cover all factories
An estimated 67 out of 6045 factories (sufficing a 90% confidence level and 10% error limit) have been considered (across 17 clustered rooftop area distributions), and they were extrapolated and aggregated to determine the total area of the factory rooftops. The number of clusters, 17, was chosen to fit all the plants at a range interval of 2500 m2. The factories from other divisions were picked through the commensurate downsizing of the total number of plants maintaining the overall distributive ratio.
(f)
Land displacement
The equivalent rooftop area land displacement was obtained from data regarding the footprint of a ground-mounted solar farm in Bangladesh. In 2018, a 27 M.W. solar photovoltaic (PV) power plant was installed in Teknaf (Figure 2), a south-eastern sub-district of Bangladesh covering 47 hectares of land. This, on average, equates to 2.347 hectares of land per 1 MWp installed (EnergyBangla, 30 October 2019). This factor is used to estimate the land displacement for the capacity achieved for rooftop PV deployment.

4. Results and Discussions

In the study, a quantitative method based on the statistical distribution technique is developed to estimate the rooftop area of the manufacturing plants and predict solar PV power generation. The industrial plants’ identity and location lists were obtained from Bangladesh’s Ministries of Industry and Commerce [28]. The following steps were undertaken:
Since Dhaka and Chittagong are the major industrial areas, naturally, they have more plants than other places and at a higher density (Figure 6). Therefore, in our consideration, more plants were taken from Dhaka and Chittagong than other regions.
Table 1 shows some of the characteristics of a sample of the 67 factories analysed, such as, rooftop areas, solarisable sections of roof areas, roof pattern, and geolocation of the plants. Figure 7 shows the corresponding irradiance and annual yield.
Furthermore, the characteristics of the 67 factory sites modelled, including the state of the roofs and the energy per kWp received at each site (kWh/kWp), related to the solar irradiance given in Figure 7, are given in Figure A1, Appendix A. A plot of the latter is shown in Figure 8, where, on average, the variations between sites are minimal (standard deviation of 48.5 at an average of 1468 kWh/kWp) and, hence, the average 1468 kWh/kWp was used in the modelling.
Figure 9 shows an example of factory roof and how the area was estimated using the area calculation tool from Google Maps (see Section 3 (c)).
The rooftop pattern was determined from photographs and communication with the factory authorities. The effective occupation factor based on the roof surface pattern was used to determine the potential solarisable area available on the rooftop of the plants (Table 1, column 4, and Figure A1, Appendix A) [31]. For a flat roof, the PV modules would be installed using a supporting frame. This ensures the optimum angle of 25° for maximum solar insolation. In the case of a pitched roof, the modules are installed in the plane of the roof, which is typically around 20° [32].
Sixty-seven rooftop areas were distributed among 17 distribution ranges, given on the x-axis of Figure 10, where different frequencies were plotted, and in the first cluster, there are 19 plants and so on. The number of factories concerning the corresponding potential average rooftop solarisable areas (m2) for the 6045 plants were then extrapolated statistically from the distributive mean of the 67 plants for each cluster. For example, if 19 plants fall in the 104–2604 m2, then by proportion (6045 × 19/67) or 1914 plants will fall in the same strata among the 6045 plants (Figure 11). Strata ranging 104–2604 m2 were chosen as, between that range, the plants tended to show a normal distribution amassing around the central tendency of 1363 m2. The 2604–5104 m2 range had an average of 3410 m2. The average of each stratum was measured by averaging all the rooftop areas of all the buildings in that cluster.
After that, statistical aggregation is done by summing up the multiplied values of the average rooftop areas with the corresponding frequencies.
The analysis indicates that approximately 51,961,869 m2 is available and represents useable rooftop areas on the 6045 factories considered. In the literature it was highlighted that 1 kWp of monocrystalline silicon solar modules represent an area of 7 m2 [33]. This figure is currently being used in the upgrades of our solar PV mini-grid installations in Africa [34], and various contemporary manufacturers’ data confirm this figure. Hence, assuming that each kWp of monocrystalline silicon modules occupies 7 m2, the corresponding PV capacity that can be installed on the above estimated total roof area of the 6045 factories considered will be approximately 7.5 GWp.
Such an installed PV capacity will generate around 11 TWh of electricity per annum. Whereas in 2021, Bangladesh’s total electricity demand was 183 TWh. Hence, approximately 6% of the total electricity of Bangladesh can be generated from deploying PV on such buildings using the discussed net metering scheme.
If such a capacity is deployed instead of coal or gas-fired plants, the solar PV derived green power would reduce 5,720,000 metric tons of carbon emissions [35], taking into account the national grid emission factor was estimated to be in the range 530–570 tCO2/GWh over six years from 2009 to 2015.
At an installation cost of 700,000 USD/MWp [36], around US$5.25 billion will be required to install the derived 7.5 GWp net-metered PV systems over all the identified buildings. Such financing is likely to be possible through borrowing, foreign aid, grants, carbon trading, local investments, etc [37].
The possibility of such deployment is encouraging as some factories have already exploited the benefits of the net metering scheme. So far, the largest is S F textile from Araihajar in Bangladesh, which installed a plant of 1.77 MWp. The second largest is Fareast spinning Mills, with an installed capacity of 1.1 MWp, whereas its total peak demand is 2.5 MW [38]. It enabled the firms to save an amount of roughly 10,000 USD (rate of 2020) in their electricity consumption bill from the national grid, which is regarded as very impressive and encouraging by the factory owner.
Furthermore, many diesel/furnace-oil driven peaking power plants were erected a decade ago to address Bangladesh’s emergency power supply problems [39]. However, those plants are still in operation because of the system inertia they provide. The approach presented here could be utilised to displace such factories’ fossil-fuelled electricity consumption, avoiding high carbon, diesel peaking power plants throughout the middle of the day, which are operated during high demand periods in Bangladesh.
Lastly, deployment at such a scale will necessitate thorough consideration of the grid and its stability and how existing and future infrastructure will cope with this additional power. However, it must be noted that such prosumers already require high power, and most of the power to these industrial sites arises from connections linked to the primary grid using higher-capacity transformers, such as 132 KVA from a high-tension connection of 11 kV. Some of the factories are also linked to substations equipped with transformers of a high capacity of 230 and 400 kVA [40]. As per the latest proposal, some newly planned distributing substations will be provided with 765 kVA (Figure 12). In addition, all of these connections have much higher design factors of safety. The largest rooftop area found in this study was 50,000 m2, with a maximum capacity of 10 MWp, which existing transformers and distribution stations will comfortably handle [41].

5. Future Work

In future work, the sample size will be increased to enhance the significant confidence boundary and a smaller margin of error. For example: With an error margin of 5%, a 95% confident sample size would be 362 for a population size of 6045 factories.
A cost–benefit analysis for each plant will be conducted to make a decision regarding the large installations and where the most appropriate sites will be targeted. A further iteration of the work may be considered to calculate the temporal net electricity flow at the individual factory level within an appropriate G.I.S. framework. Grid stability is a primary condition for upscaling solar power generation because of its high fluctuating nature in availability since the grid is outdated and vulnerable to inconsistency.
The capacity factor/load factor, including the performance ratio, yield factor, and capacity utilisation factor, may be improved with the technical quality of the solar panels and inverters [42]. The latter components in Bangladesh often had a lower generation and conversion efficiency than those available in global markets [43]. Applicable rules and regulations may be formulated, enacted, and strictly followed to ensure minimum efficiency in this regard.
Structural stability of the roofs of industrial buildings is an important concern for launching large-scale net-metered PV solar rooftop plants. Since hundreds of PV modules will put significant additional loads on the roofs, they must have an adequate load-bearing capacity to prevent accidental collapse. Therefore, during the design of the net-metered PV plants, the structural strength of the corresponding buildings must be carefully considered.
Lastly, grid resilience and stability will form part of the future work with a detailed understanding of the available capacity surveyed before any modelling is conducted.

6. Conclusions

Bangladesh has a severe land scarcity due to its high population density and thus has limited scope for deploying large-scale renewable energy farms. This research provides a seminal study to assess the potential for how industrial buildings in Bangladesh can (i) contribute to the national target of 10% renewable electricity by 2030 and (ii) address the land scarcity challenge whilst (iii) taking advantage of the net metering regulation enacted only for industrial prosumers.
This research has focused on the exploitation of manufacturing plants with very large roof areas and identified 6045 such industrial sites with roof areas in the range of 100 m2 to 50,000 m2. Deploying solar PV systems on such areas could result in an estimated 7.4 GWp with a corresponding annual sustainable electricity generation of 11 TWh. This energy alone represents more than 6% of Bangladesh’s current electricity consumption (183 TWh in 2021). Furthermore, such a deployment could save around 13,000 acres of land for agricultural and other uses, further easing the land scarcity issue. The methodology presented offers an inexpensive processing and assessment approach of opportunities of PV power generation at scale, which is generalisable in estimating such prospects anywhere in the world.
It is further recognised that the proposed high penetration of solar PV systems into the grid will necessitate an understanding of the implications on grid stability and how existing and future infrastructure can cope with this additional power. It was highlighted that the electrical infrastructure at such intervention sites is likely to be more resilient than other sites in the country. Such prosumers’ sites already have requirements for high power, and most of the power to these industrial sites arises from connections linked to the primary grid using higher-capacity transformers and high-tension connectivity to the national grid. In our study, the largest rooftop area was found to be 50,000 m2, with a maximum capacity of 10 MWp, which existing transformers and distribution stations will comfortably handle. However, future work will aim to address such issues, especially as the government has declared a plan to make the distribution and transmission grid smart by 2030.
Due to the land scarcity consideration, it will be challenging for Bangladesh to achieve the required 10% target from renewables by 2030’s in an appropriate time frame. This research addressed the complex relationships in transitioning Bangladesh to low carbon pathways, where the population and energy demands are rapidly rising and, as mentioned, available land is scarce. The evidence presented indicates that deploying PV on the roofs of industrial buildings without a new requirement for land can achieve at least 6%, or more than half of the 2030 renewables target.
In addition, in such a deployment, the electrical infrastructure is available, and the regulated net meter prospects will provide an incentive for deployment at scale. Furthermore, and to our knowledge, this study represents the first consideration of utilising large industrial roofs concurrently for PV system deployment, using the case of Bangladesh. The outcome of such a large power generation potential is significant for a land-deprived country. It is also more than likely to deliver on Bangladesh’s aspirations to transit to low carbon energy technologies.

Author Contributions

Conceptualisation and formal analysis, M.T., A.S.B. and P.J.; Funding acquisition, A.S.B.; Investigation, M.T.; A.S.B.; Supervision, A.S.B. and P.J.; Visualization and methodology, M.T. and A.S.B.; Writing—original draft, M.T.; Review & editing, A.S.B. and P.J. All authors have read and agreed to the published version of the manuscript.

Funding

The research is partly funded by the Government of Bangladesh to support M.T. PhD programme. The A.P.C. was funded by the Energy and Climate Change Division at the University of Southampton, U.K.

Acknowledgments

This work is part of the activities of the Energy and Climate Change Division and the Sustainable Energy Research Group (www.energy.soton.ac.uk) (accessed on 10 February 2022), in the Faculty of Engineering and Applied Sciences at the University of Southampton, U.K. The research is also part of a PhD programme sponsored by the Government of Bangladesh.

Conflicts of Interest

Authors have no conflict of interest.

Appendix A

Figure A1. Characteristics of the 67 factories analysed, (standard deviation of 48.5 at an average of 1468 kWh/kWp).
Energies 15 04037 g00a1

References

  1. Dey, S.R.; Tareque, M. Electricity consumption and G.D.P. nexus in Bangladesh: A time series investigation. J. Asian Bus. Econ. Stud. 2019, 27, 35–48. [Google Scholar] [CrossRef]
  2. Taheruzzaman, M.; Janik, P. Electric energy access in Bangladesh. Trans. Environ. Electr. Eng. 2016, 1, 6–17. [Google Scholar] [CrossRef] [Green Version]
  3. U.N. Achieving Sustainable Energy Targets in Bangladesh. 2020. Available online: https://www.un.org/en/chronicle/article/achieving-sustainable-energy-targets-bangladesh (accessed on 5 November 2021).
  4. Islam, S. Bangladesh Outlines Plan for up to 40 G.W. of Renewables in 2041. PV Magazine. 20 October 2020. Available online: https://www.pv-magazine.com/2020/10/20/bangladesh-outlines-plan-for-up-to-40-gw-of-renewables-in-2041/ (accessed on 10 November 2021).
  5. Halder, P.K.; Paul, N.; Joardder, M.U.H.; Sarker, M. Energy scarcity and potential of renewable energy in Bangladesh. Renew. Sustain. Energy Rev. 2015, 51, 1636–1649. [Google Scholar] [CrossRef]
  6. KhareSaxena, A.; Saxena, S.; Sudhakar, K. Energy performance and loss analysis of 100 kWp grid-connected rooftop solar photovoltaic system. Build. Serv. Eng. Res. Technol. 2021, 42, 485–500. [Google Scholar] [CrossRef]
  7. Sustainable and Renewable Energy Development Authority (S.R.E.D.A.). Net Metering Guidelines 2018; Sustainable and Renewable Energy Development Authority (S.R.E.D.A.), Power Division, The Government of the People’s Republic of Bangladesh: Dhaka, Bangladesh, 2018; Amended in 2019.
  8. Nikita, K.N.; Islam, S.N.; Islam, M.S.; Saha, M.; Khan, M.F. Prospect of Solar PV Based Power Generation in the Marshy Lands of Bangladesh: An Analysis through RETScreen Software. In Proceedings of the 2016 4th International Conference on the development in the in Renewable Energy Technology (I.C.D.R.E.T.), Dhaka, Bangladesh, 7–9 January 2016. [Google Scholar]
  9. Vuković, D. How Much Land Do You Need to Be Self-Sufficient? Primalsurvivor. 7 October 2019. Available online: https://www.primalsurvivor.net/much-land-need-self-sufficient/ (accessed on 13 November 2021).
  10. Haque, M.N.; Ali, M.H.; Masum, S.M. Climate Change Impacts on Rice Production in Bangladesh; LAP Lambert Academic Publishing: Saarbrücken, Germany, 2016. [Google Scholar]
  11. Ali, M.A. Settlement of Land Disputes in Bangladesh: Legal Issues and Challenges. Southeast Univ. J. Law 2020, 3, 2020. [Google Scholar]
  12. World Bank (W.B.). Arable Land (Hectares per Person)—Bangladesh. 2021. Available online: https://data.worldbank.org/indicator/AG.LND.ARBL.HA.PC?locations=BD (accessed on 12 November 2021).
  13. Bangladesh Bureau of Statistics (B.B.S.). 2021. Available online: http://www.bbs.gov.bd/site/page/47856ad0-7e1c-4aab-bd78-892733bc06eb/Population-&-Housing (accessed on 10 November 2021).
  14. Energy Bangla. Largest Solar Power Plant Starts Operation in Teknaf. 2018. Available online: https://www.energybangla.com/largest-solar-power-plant-starts-operation-in-teknaf/ (accessed on 10 November 2021).
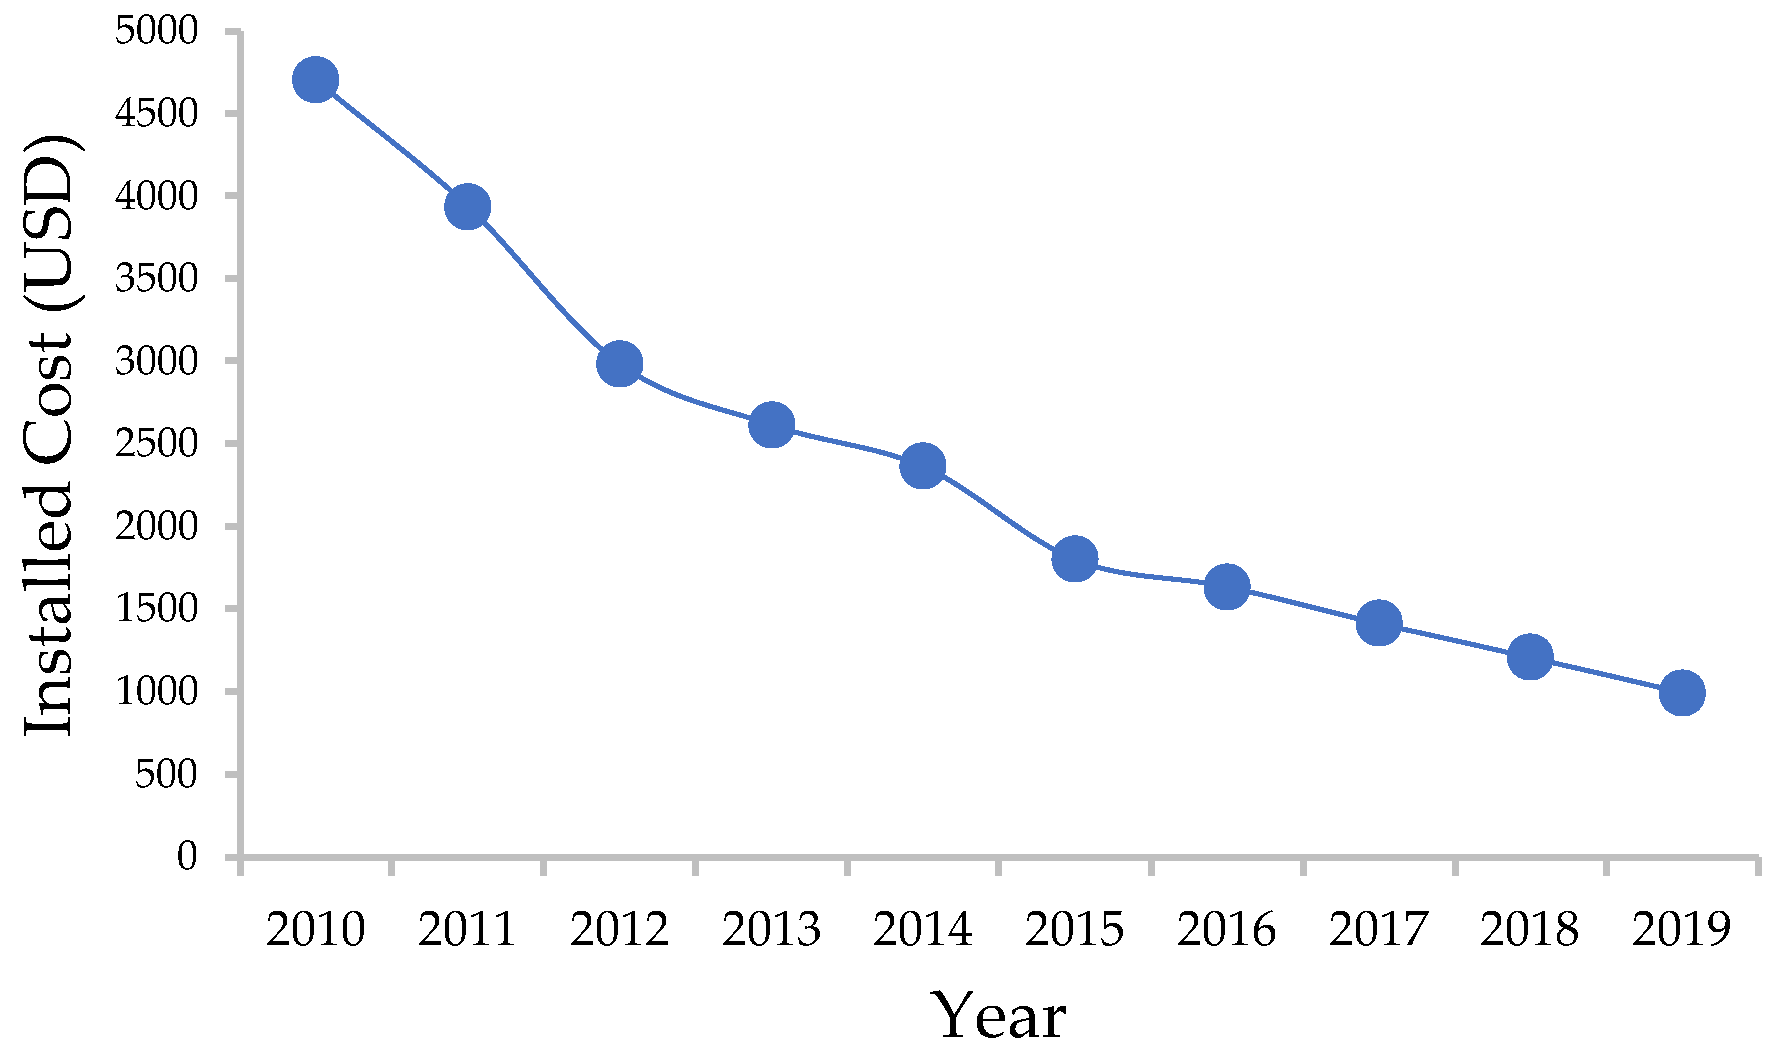
  15. I.R.E.N.A. 2021. Available online: https://www.irena.org/costs/Power-Generation-Costs/Solar-Power (accessed on 14 November 2021).
  16. Rahman, M.M.; Ahmed, A.U.; Dey, P.; Habib, A.; Reza, C.M.F.S.; Aziz, F.; Mamoon, A. Solar Energy Potential in Bangladesh. In Proceedings of the International Conference on Mechanical Engineering and Renewable Energy, Chittagong, Bangladesh, 24–27 December 2013. [Google Scholar]
  17. Karim, M.E.; Karim, R.; Islam, M.T.; Muhammad-Sukki, F.; Bani, N.A.; Muhtazaruddin, M.N. Renewable Energy for Sustainable Growth and Development: An Evaluation of Law and Policy of Bangladesh. Sustainability 2019, 11, 5774. [Google Scholar] [CrossRef] [Green Version]
  18. Samad, H.A.; Khandker, S.R.; Asaduzzaman, M.; Yunus, M. The Benefits of Solar Home Systems: An Analysis from Bangladesh (6724); World Bank Group: Washington, DC, USA, 2013. [Google Scholar]
  19. BanglaPedia. 2021. Available online: https://en.banglapedia.org/index.php/Haors_and_Wetlands (accessed on 3 November 2021).
  20. Herrera, A. Access to Khas Land in Bangladesh: Discussion on the Opportunities and Challenges for Landless People, and Recommendations for Development Practitioners; NADEL-Center for Development and Cooperation of Master of Advanced Studies Essays: Zurich, Switzerland, 2016. [Google Scholar]
  21. Sustainable and Renewable Energy Development Authority (S.R.E.D.A.). National Solar Energy Roadmap, 2021–2041 (Draft); Sustainable and Renewable Energy Development Authority (S.R.E.D.A.), Power Division, Ministry of Power, Energy and Mineral Resources, the Government of the People’s Republic of Bangladesh: Dhaka, Bangladesh, 2020. Available online: http://sreda.gov.bd/site/notices/2ee87680-e210-481e-bf40-126ac67949a2/DRAFT---National-Solar-Energy-Roadmap-2021---2041 (accessed on 11 October 2021).
  22. Sustainable and Renewable Energy Development Authority (S.R.E.D.A.). Statistics of Installed Net Energy Metering System; Sustainable and Renewable Energy Development Authority (S.R.E.D.A.), Power Division, The Government of the People’s Republic of Bangladesh: Dhaka, Bangladesh, 2021. Available online: https://solar.sreda.gov.bd/nem/nemstatistics.php (accessed on 13 November 2021).
  23. Timmer, J. China’s Solar Power Has Reached Price Parity with Coal, Adding Storage Could Allow Solar to Produce Nearly Half of China’s Electricity. 2021. Available online: https://arstechnica.com/science/2021/10/the-shifting-economics-of-solar-power-in-china/ (accessed on 2 November 2021).
  24. Chowdhury, S.A.; Khan, M.Z.R. The Net Metering Guideline of Bangladesh-Potential and Way Forward. In Proceedings of the 11th International Conference on Electrical and Computer Engineering (I.C.E.C.E.), Dhaka, Bangladesh, 17–19 December 2020. [Google Scholar]
  25. Gajduk, A.; Todorovski, M.; Kocarev, L. Stability of power grids: An overview. Eur. Phys. J. Spec. Top. 2014, 223, 2387–2409. [Google Scholar] [CrossRef]
  26. Lawson, A.J. Net Metering: In Brief. 2019. Available online: https://www.everycrsreport.com/files/20191114_R46010_058b35011000a3009a1ff07a76ca504f00258c98.pdf (accessed on 13 November 2021).
  27. Dhaka Electric Supply Company Limited (D.E.S.C.O.). 2021. Available online: https://www.desco.org.bd/bangla/descoataglance_e.php (accessed on 13 November 2021).
  28. Ministtry of Industries. List of Manufacturing Plants; Ministtry of Industries (MoI), The Government of the People’s Republic of Bangladesh: Dhaka, Bangladesh, 2020. Available online: https://moind.gov.bd/ (accessed on 11 October 2021).
  29. Department of Inspection for Factories and Establishments. D.I.F.E. to Assess Every Industry in Bangladesh; Department of Inspection for Factories and Establishments (D.I.F.E.), Ministry of Labour and Employment: Dhaka, Bangladesh, 2021. Available online: http://dife.gov.bd/site/news/d50e2584-5019-422b-994b (accessed on 10 November 2021).
  30. Survey Monkey. Survey Monkey Sample Size Calculator. 2021. Available online: https://www.surveymonkey.co.uk/mp/sample-size-calculator/ (accessed on 13 November 2021).
  31. López, F.; Inmaculada LGonzález-Aguilera, D. Large Scale Automatic Analysis and Classification of Roof Surfaces for the Installation of Solar Panels Using a Multi-Sensor Aerial Platform. Remote Sens. 2015, 7, 1226. [Google Scholar] [CrossRef] [Green Version]
  32. Nazmul, R.B. Calculating Optimum Angle for Solar Panels of Dhaka, Bangladesh for Capturing Maximum Irradiation. In Proceedings of the 2017 IEEE International W.I.E. Conference on Electrical and Computer Engineering (WIECON-ECE), W.I.T., Dehradun, India, 18–19 December 2017. [Google Scholar]
  33. Niranjan, S.B.; Nikhil, C. Performance comparison of mono and polycrystalline silicon solar photovoltaic modules under tropical wet and dry climatic conditions in east-central India. Clean Energy 2022, 6, 929–941. [Google Scholar] [CrossRef]
  34. University of Southampton (UoS). Energy Access. 2020. Available online: https://energy.soton.ac.uk/energy-access/ (accessed on 20 April 2022).
  35. Rensmart. Carbon Emissions Calculator. 2021. Available online: https://www.rensmart.com/Calculators/KWH-to-CO2 (accessed on 15 January 2022).
  36. S.R.E.D.A. 2022. Available online: https://solar.sreda.gov.bd/doc/Brochure%20on%20Net%20Metering%20Rooftop%20Solar.pdf (accessed on 15 January 2022).
  37. World Bank. Lighting Up Rural Communities in Bangladesh: The Second Rural Electrification and Renewable Energy Development Project. 2021. Available online: https://documents.worldbank.org/pt/publication/documents-reports/documentdetail/767471568288649844/bangladesh-second-rural-electrification-and-renewable-energy-development-project-lighting-up-rural-communities (accessed on 21 November 2021).
  38. Ekushe. Mehdi Hasan Albakar. 2020. Available online: https://www.ekushey-tv.com/%E0%A6%AC%E0%A6%BE%E0%A7%9C%E0%A6%9B%E0%A7%87-%E0%A6%A8%E0%A7%87%E0%A6%9F-%E0%A6%AE%E0%A6%BF%E0%A6%9F%E0%A6%BE%E0%A6%B0%E0%A6%BF%E0%A6%82-%E0%A6%B0%E0%A7%81%E0%A6%AB%E0%A6%9F%E0%A6%AA-%E0%A6%B8%E0%A7%8B%E0%A6%B2%E0%A6%BE%E0%A6%B0-%E0%A6%8F%E0%A6%A8%E0%A6%BE%E0%A6%B0%E0%A7%8D%E0%A6%9C%E0%A6%BF-%E0%A6%AC%E0%A7%8D%E0%A6%AF%E0%A6%AC%E0%A6%B9%E0%A6%BE%E0%A6%B0%E0%A6%95%E0%A6%BE%E0%A6%B0%E0%A7%80/94778 (accessed on 10 November 2021).
  39. Amin, S.; Jamasb, T.; Llorca MMarsiliani, L. The role of captive power plants in the bangladesh electricity sector. In A.D.B.I. Working Paper Series; Asian Development Bank Institute (A.D.B.I.): Tokyo, Japan, 2021. [Google Scholar]
  40. Power Grid Company of Bangladesh. Transmission Infrastructure Information; Power Grid Company of Bangladesh (P.G.C.B.), Bangladesh Power Development Board (B.P.D.B.), Power Division, Bangladesh: Dhaka, Bangladesh, 2021. Available online: http://pgcb.gov.bd/site/page/05a258ae-2288-44d5-95c1-4e30b35eb7ec/- (accessed on 21 November 2021).
  41. Ruiz, I.R.M.; Guajardo, L.A.T.; Alfaro, L.H.R.; Salinas, F.S.; Maldonado, J.R.; Vázquez, M.A.G. Design Implication of a Distribution Transformer in Solar Power Plants Based on Its Harmonic Profile. Energies 2021, 14, 1362. [Google Scholar] [CrossRef]
  42. Dahmoun, M.; Bekkouche, B.; KSudhakar Guezgouz, M.; Chenafi AChaouch, A. Performance evaluation and analysis of grid-tied large scale PV plant in Algeria. Energy Sustain. Dev. 2021, 61, 181–195. [Google Scholar] [CrossRef]
  43. Al-Rasheedi, M.; Gueymard, C.A.; Al-Khayat, M.; Ismail, A.; Lee, J.A.; Al-Duaj, H. Performance evaluation of a utility-scale dual-technology photovoltaic power plant at the Shagaya Renewable Energy Park in Kuwait. Renew. Sustain. Energy Rev. 2020, 133, 110139. [Google Scholar] [CrossRef]
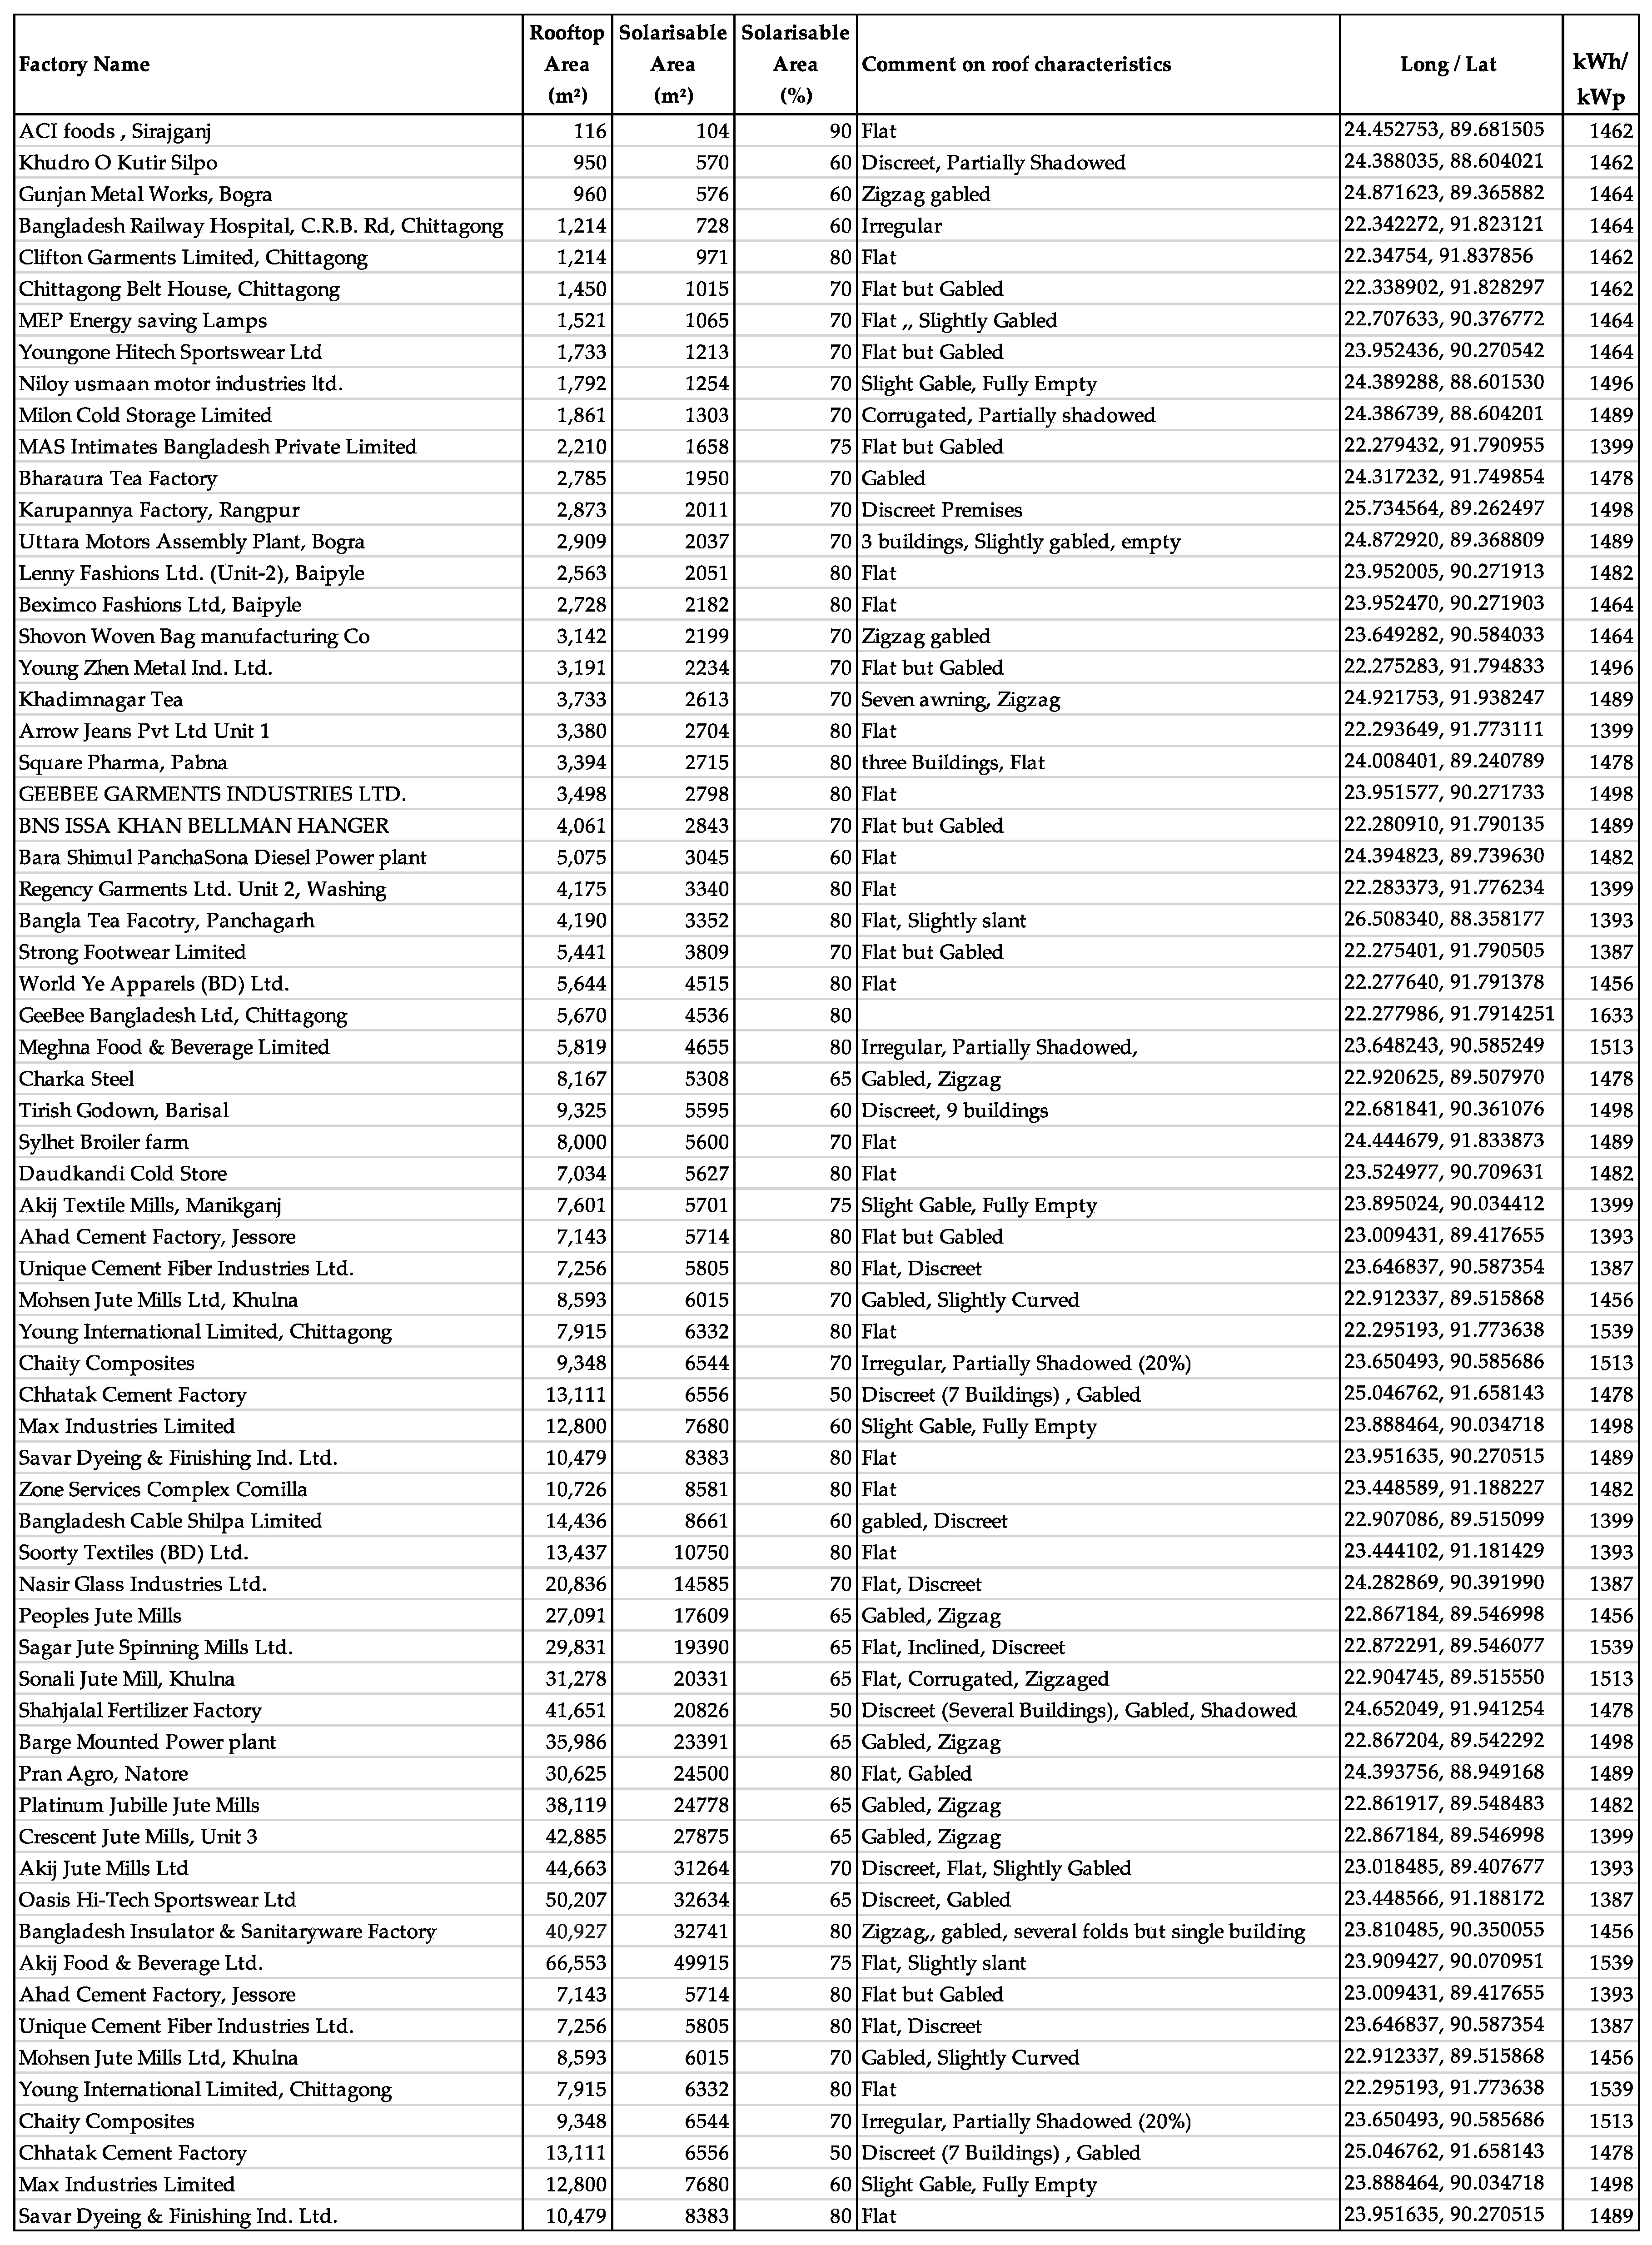
Figure 1. Declining per person arable land, Bangladesh [12].
Energies 15 04037 g001
Figure 2. Population density of Bangladesh according to districts; yellow shade at the bottom denotes the coastal belt with increasing salinity, blue circle shows Teknaf grid-tied 27 MWp plant [13].
Energies 15 04037 g002
Figure 3. Trend in Total Installed Cost of PV systems. Source: (S.R.E.D.A., 2020).
Energies 15 04037 g003
Figure 4. Past and projected future of global Levelized Cost of Electricity (LCoE) from different sources [20].
Energies 15 04037 g004
Figure 5. A connection diagram for a typical net metering scheme (adapted from S.R.E.D.A., 2018 (Amended in 2019)).
Energies 15 04037 g005
Figure 6. Location of 67 factories for PV roof assessment (Google Maps) (ʘ = location).
Energies 15 04037 g006
Figure 7. PV output from Global Solar Atlas using the G.P.S., in Bangladesh. The locations of the 67 factories are also shown.
Energies 15 04037 g007
Figure 8. The spatial variation of PV outputs from site-to-site appears quite small in the plot above.
Energies 15 04037 g008
Figure 9. Bangladesh textile factory rooftop area mensuration for assessing the extractable solar electricity using Google Maps measurement tools. (A building of Akij Textile Mills Limited, Location: 23.89° N, 90.03° E, Total area: 7915.47 m2).
Energies 15 04037 g009
Figure 10. Distribution of factories concerning rooftop potential solarisable areas (m2).
Energies 15 04037 g010
Figure 11. The number of plants vs. average rooftop potential solarisable areas (m2) for 6045 plants using statistical distributive means of the 67 plants.
Energies 15 04037 g011
Figure 12. Grid map showing connection load capacities of Bangladesh with the prospective prosumers [40]. Green boxes show the location of the factories.
Energies 15 04037 g012
Table 1. Some factories (D.I.E.F., 2021), corresponding rooftop areas solarisable sections of roof areas, and G.I.S. coordinates (partial details, full details are in Figure A1 in Appendix A).
Factory NameRooftop Area
(m2)
Percentage of Solarisable Areas Solarisable Area(m2)TypeLong–Lat
ACI Foods, Sirajganj, Bangladesh 11590104Flat24.45, 89.68
Gunjan Metal Works, Bogra, Bangladesh96060576Zigzag gabled24.87, 89.36
MEP Energy Saving Lamps, Barisal, Bangladesh1521701065Flat, slightly gabled22.70, 90.37
Youngone Hitech Sportswear Ltd., Baipayl, Bangladesh1733701213Flat but gabled23.96, 90.27
Publisher’s Note: MDPI stays neutral with regard to jurisdictional claims in published maps and institutional affiliations.

