1. Introduction
With the new European and extra-European policies aimed at protecting the environment, the picture is clear: one of the main challenges of the 21st century is to reduce the environmental impact in the transportation field.
In this panorama, electric propulsion system is one of the most promising technologies, with clear improvements on several fronts, first of all in the optimization of vehicle performance, a greater efficiency in energy consumption and a reduction in emissions of pollutants. However, the limitations of the autonomy of battery packs and the long refueling times mean that the technology of hybrid vehicles is particularly interesting in the medium term [
1,
2].
The development of new technologies in every field of application is always accompanied by an attempt to enhance their performance to the limits of what is possible. Proof of this are supercars and hypercars with hybrid propulsion systems, born not with a view of exploiting this technology for environmental purposes but to achieve superior performance. This work focuses on the propulsion system of a plug-in hybrid hypercar prototype. In particular, the goal was to analyze the dynamic performance of the hybrid powertrain and design the battery pack. At the same time, the problem of the thermal behavior of the battery pack itself and the sizing of the related cooling system were considered and analyzed, which is particularly crucial in a high-power application such as the one described here.
2. HEV-PHEV: State of The Art
The term hybrid vehicle identifies any vehicle with a powertrain that uses two or more sources of energy and/or two or more sources of power on board. Typical sources of energy and power can be fossil fuels, batteries, supercapacitors, and fuel cells [
1]. This definition is almost generic and not very distinctive. In fact, a large variety of vehicles with different operating principles are covered, including vehicles powered by petrol and electricity stored in batteries, diesel and batteries, batteries and capacitors, batteries and flywheels, etc. [
2]. Usually, a vehicle is commonly classified as a hybrid if it is powered by an i.c. engine and one or more electric motors. This is the reason why even specialists prefer to use the term Hybrid Electric Vehicle (HEV) only and exclusively for those vehicles that use fossil fuels and batteries as a combined energy source [
2].
Hybrid powertrains are created with the aim of optimizing fuel consumption and reducing polluting emissions. The different operating philosophies of hybrid engines are always focused on appointing to the electric drive the load necessary for the speed variations of the vehicle, and on the other hand leaving the thermal engine with the function of supplying of the average energy necessary for motion. One of the advantages deriving from this operating mode is, for example, the elimination of the inefficiencies of the heat engine when starting from standstill, thanks to the favorable characteristics of the electric motors, which should be equipped with a starting torque that is suitable to allow for the transfer of load even from zero speed.
For the classification of the HEVs and for the correct choice of sizing strategies, the relationship between the power delivered by the electrical system and the total power transmitted to the wheels, which takes the name of Hybridization Factor (HF), is very interesting:
where
Pem indicates the power delivered by the electric motor and with
Pice the power delivered by the i.c. engine.
In the case of traditional vehicles, the Hybridization Factor is zero. For Electric Vehicles (EVs), in which the energy comes only from electric storage system, the Hybridization Factor is one. Between these two limit values lives the ensemble of HEV hybrid propulsion systems. Based on the degree of hybridization, the levels of hybridization that are now common on the market are defined:
- -
micro-hybridization or minimal hybrid. Despite being defined as hybrids, micro-hybrid cars are not true hybrid vehicles, as they do not have an electric motor that actively contributes to providing traction to the car. They are, in fact, conventional cars equipped with a Start and Stop system (stop the engine when vehicle is stationery) and an electronically managed alternator that is able to amplify the current during slowdowns to store more energy in the battery. For these systems, the degree of hybridization does not exceed 0.1, HF < 0.1;
- -
light or mild hybridization. The i.c. engine is supported in traction by an electric motor for short intervals of time. A small unit connected to the i.c. engine takes the place of the alternator and the starter motor. When the vehicle slows down, the unit recharges the battery; in the subsequent acceleration phases, the energy flow reverses and the electric motor supports the thermal one. These systems have a degree of hybridization between 0.1 and 0.25, 0.1 < HF < 0.25;
- -
full hybridization or full hybrid. This is synonymous with the ability of the electric propulsion system to independently and autonomously guarantee the traction necessary to move the vehicle forward, within certain operating ranges. Full hybridization is accompanied by a high degree of hybridization, generally between 0.25 and 0.75, 0.25 < HF < 0.75.
As a reference, the values of the hybridization factor for various hybrid vehicles are shown in
Table 1.
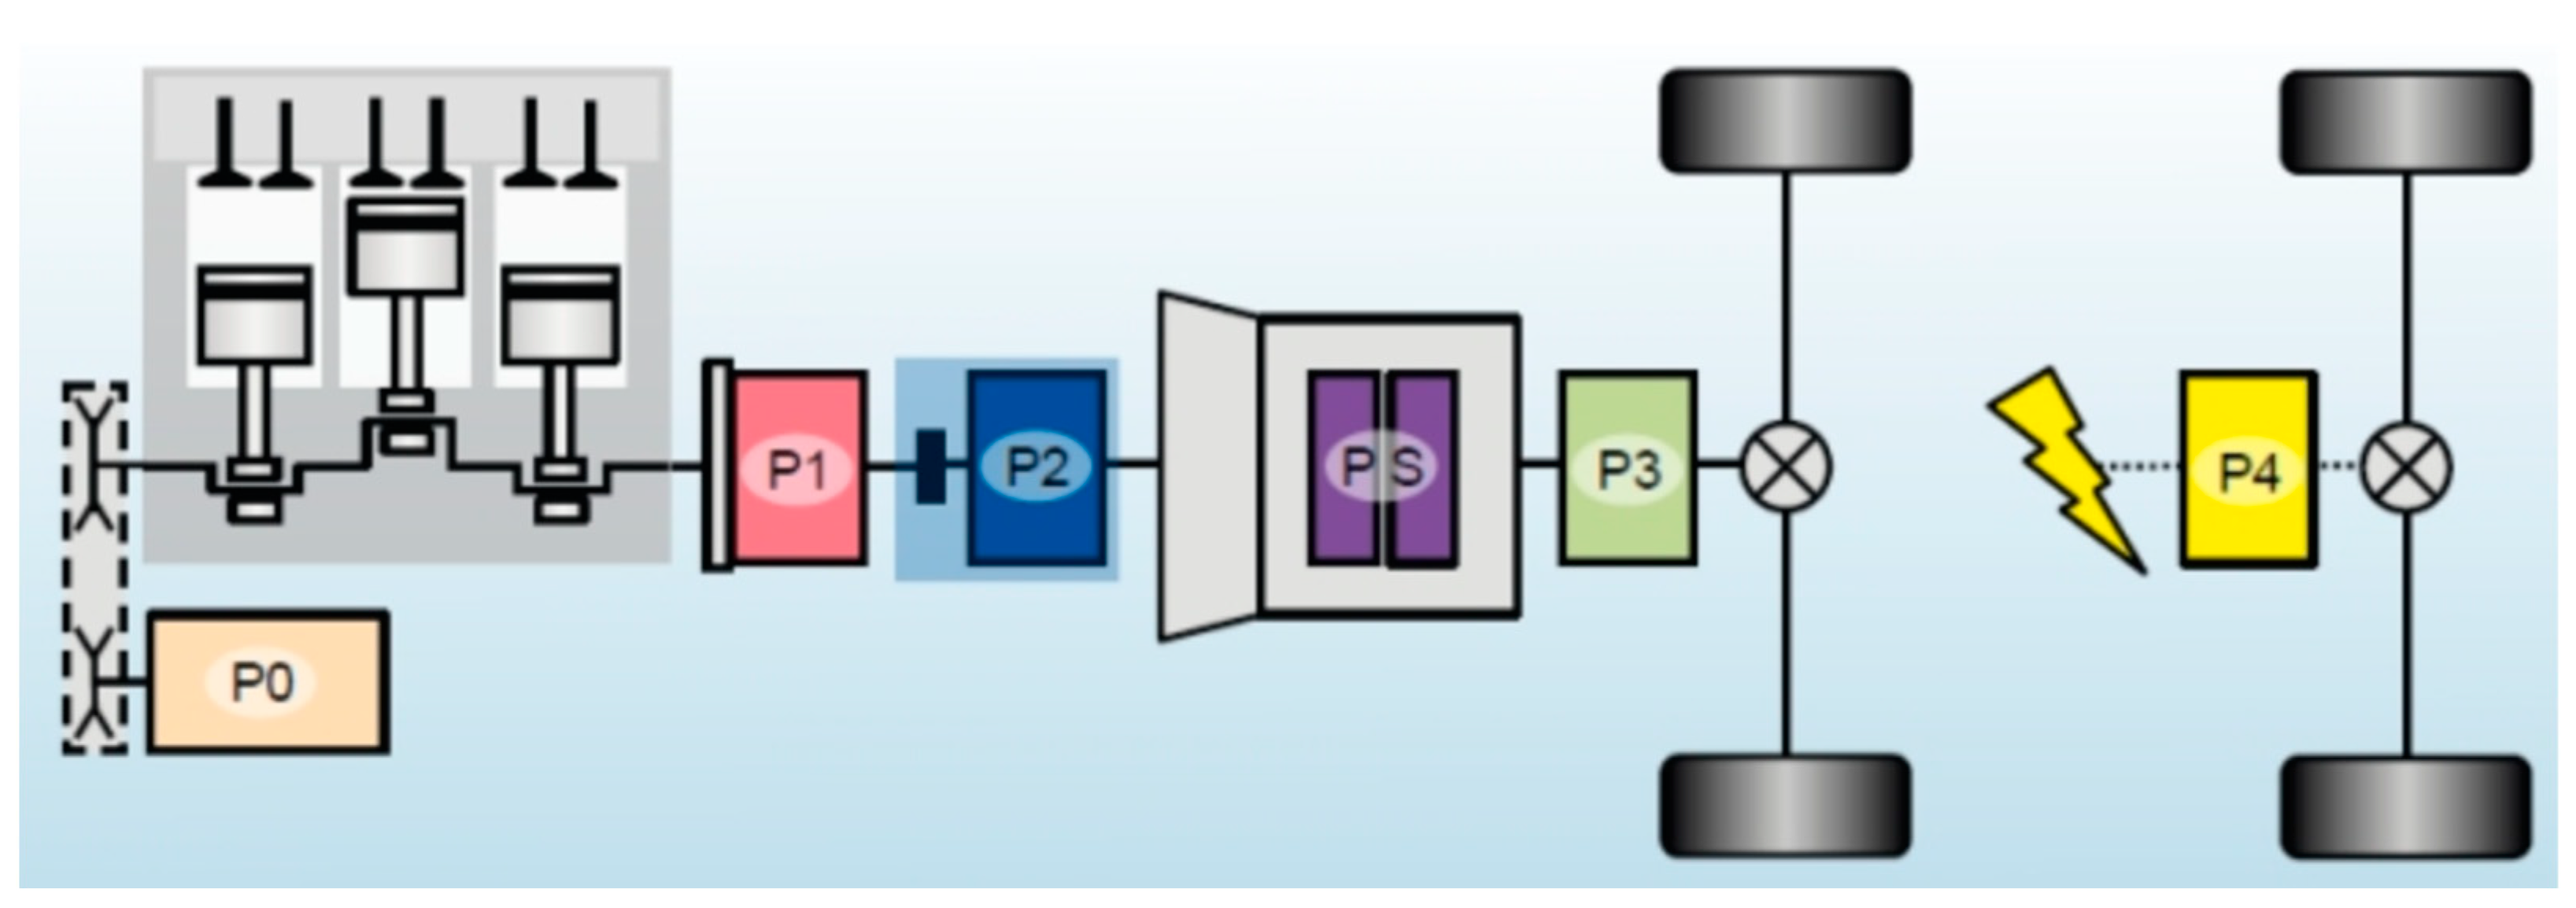
Hybrid architectures are classified (see
Figure 1) considering the position of electric drives and driving wheels according to the identification codes: P0, P1 and PS, P2, P3, P4, and P5. The abbreviation expresses the conceptual distance between these two elements within the propulsion unit: the abbreviations P0 and P1 indicate that there are different transmission elements between the electric machines and the wheels; P5 hybrid powertrains, on the other hand, require electric motors to be installed directly on the driving wheels. The main characteristics of each type are listed below [
2].
The P0 hybrid layout is equivalent to traditional traction systems, without electric traction motors. In this configuration the electric motor replaces the alternator and is mechanically connected to the i.c. engine with a belt drive or similar. This layout is also called a Belt-driven Starter Generator and performs the roles of both the starter motor and generator. The power of these electric machines is generally less than 15 kW, and they participate to a limited extent in traction, exclusively during the starting and energy recovery phases during braking.
The configuration identified with the abbreviation P1 provides that the electric motor is connected to the motor shaft directly: the motor shafts of i.c. engine and of the electric motor are integral and therefore rotate at the same angular speed; this is the case already described of series hybrid architecture.
P2 hybrid powertrains feature electric machines mounted after the clutch but before the multi-stage transmission. The peculiar characteristic of this configuration, and of the following ones, is given by the possibility of providing traction in complete electrical autonomy without the need to overcome the inertia to the rotation of the i.c. engine, which can be switched off during some phases of motion and disconnected from the transmission line through the clutch.
The P3 and P4 hybrid powertrains adopt a configuration with the electric motors placed after the transmission. The substantial distinction between the two abbreviations is that in the first case the electric motor is located on the same transmission line as the i.c. engine; in the second case, the electric machines act on the axis of the wheels that are not driven by the i.c. engine, thus ensuring four-wheel drive.
Finally, the abbreviation P5 identifies hybrid powertrains that have electric motors directly connected to the wheels: a solution that reduces most of the energy losses due to friction phenomena that occur within the transmission chain.
A further category of hybrid vehicles is that of plug-ins, or PHEVs, which differ from common HEVs by their possibility of recharging the battery pack directly from an external electrical source, therefore from the electric grid. The powertrain architectures are equivalent to those previously described, but the PHEVs’ characteristic of being able to recharge the battery pack means that their operating and control principle is radically different from other hybrid systems in terms of energy management. In fact, in the case of hybrid vehicles without an autonomous charging system, the supply of electricity comes exclusively from the heat engine and the energy recovered during braking. This means that the state of charge of the battery pack is kept constantly close to an average value, with oscillations depending on the load required for traction. In the case of a plug-in hybrid system, on the other hand, it is possible to recharge the battery pack up to the maximum limit allowed by technological constraints and allow it to be completely discharged.
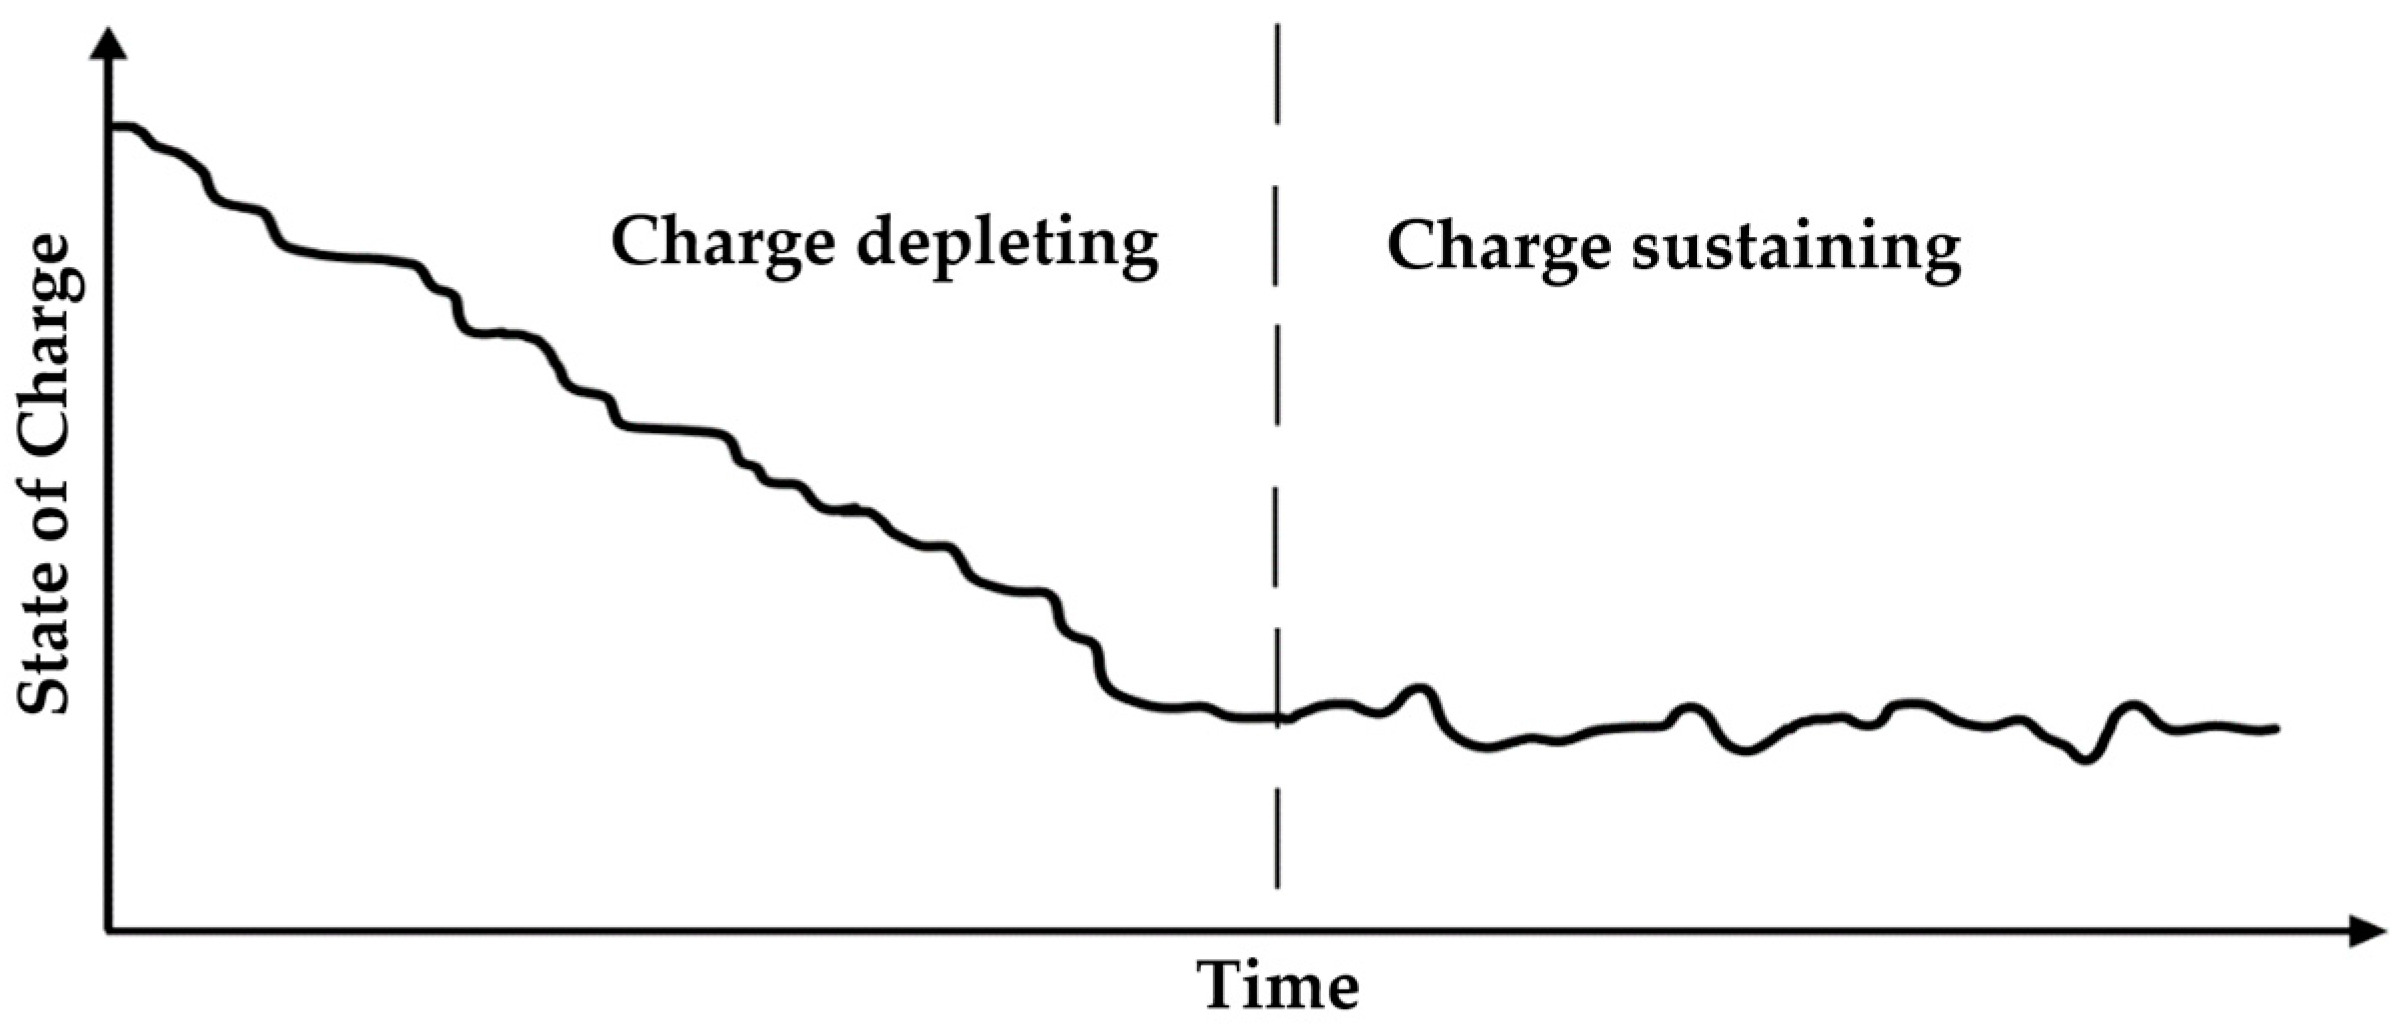
In general, two types of energy release modes of the battery pack can be distinguished: gradual release or charge-depleting mode, and conservative release or charge-sustaining mode. In the case of a gradual release operation, the battery pack works mainly as an energy supplier, thus supporting the thermal engine in traction more or less continuously. The only recharging phases correspond to the time intervals in which energy is recovered during braking. The i.c. engine, therefore, never directly supplies energy to the electric machine to recharge the package. In the conservative operating mode, the state of charge of the battery pack is kept around a predetermined average reference value. In this case, the i.c. engine can supply the battery pack with energy, for example when the state of charge falls below a critical value.
Hybrid cars that do not have an autonomous charging system are designed in such a way that the battery pack runs constantly in the conservative release mode; PHEVs, on the other hand, are designed to allow the pack to initially release as much electricity as possible according to the gradual release operating mechanism and then enter a second conservative phase in which the state of charge is kept approximately constant, such as for standard HEVs (see
Figure 2).
A particular market niche is that of high-performance hybrid propulsion cars, both HEV and PHEV, in which, as mentioned in the introduction, the goals of hybrid propulsion are not only aimed at reducing consumption and emissions, but also at dynamic performance increase. Some important examples in the market belong to this category of cars, such as the Ferrari SF90, the Porsche 918 Spyder, the Lamborghini Siam, and the McLaren Artura. This market niche, although being small in terms of number of vehicles produced, is particularly interesting, especially for the Italian automotive engineer sector.
The preliminary study proposed in this article fits precisely in this context, and the project of the propulsion system of a high performance PHEV is presented, in which particular attention was paid to the problem of thermal management of the battery pack. This is in fact a central issue for this type of application, in which the ratio between the maximum power that the battery pack must deliver, and the energy contained in it is decidedly high and considerably amplifies the problem of proper cooling of the lithium cells. Therefore, a solution with direct liquid cooling with dielectric fluid will be proposed and described here.
3. High Performance PHEV: Description and Specifications
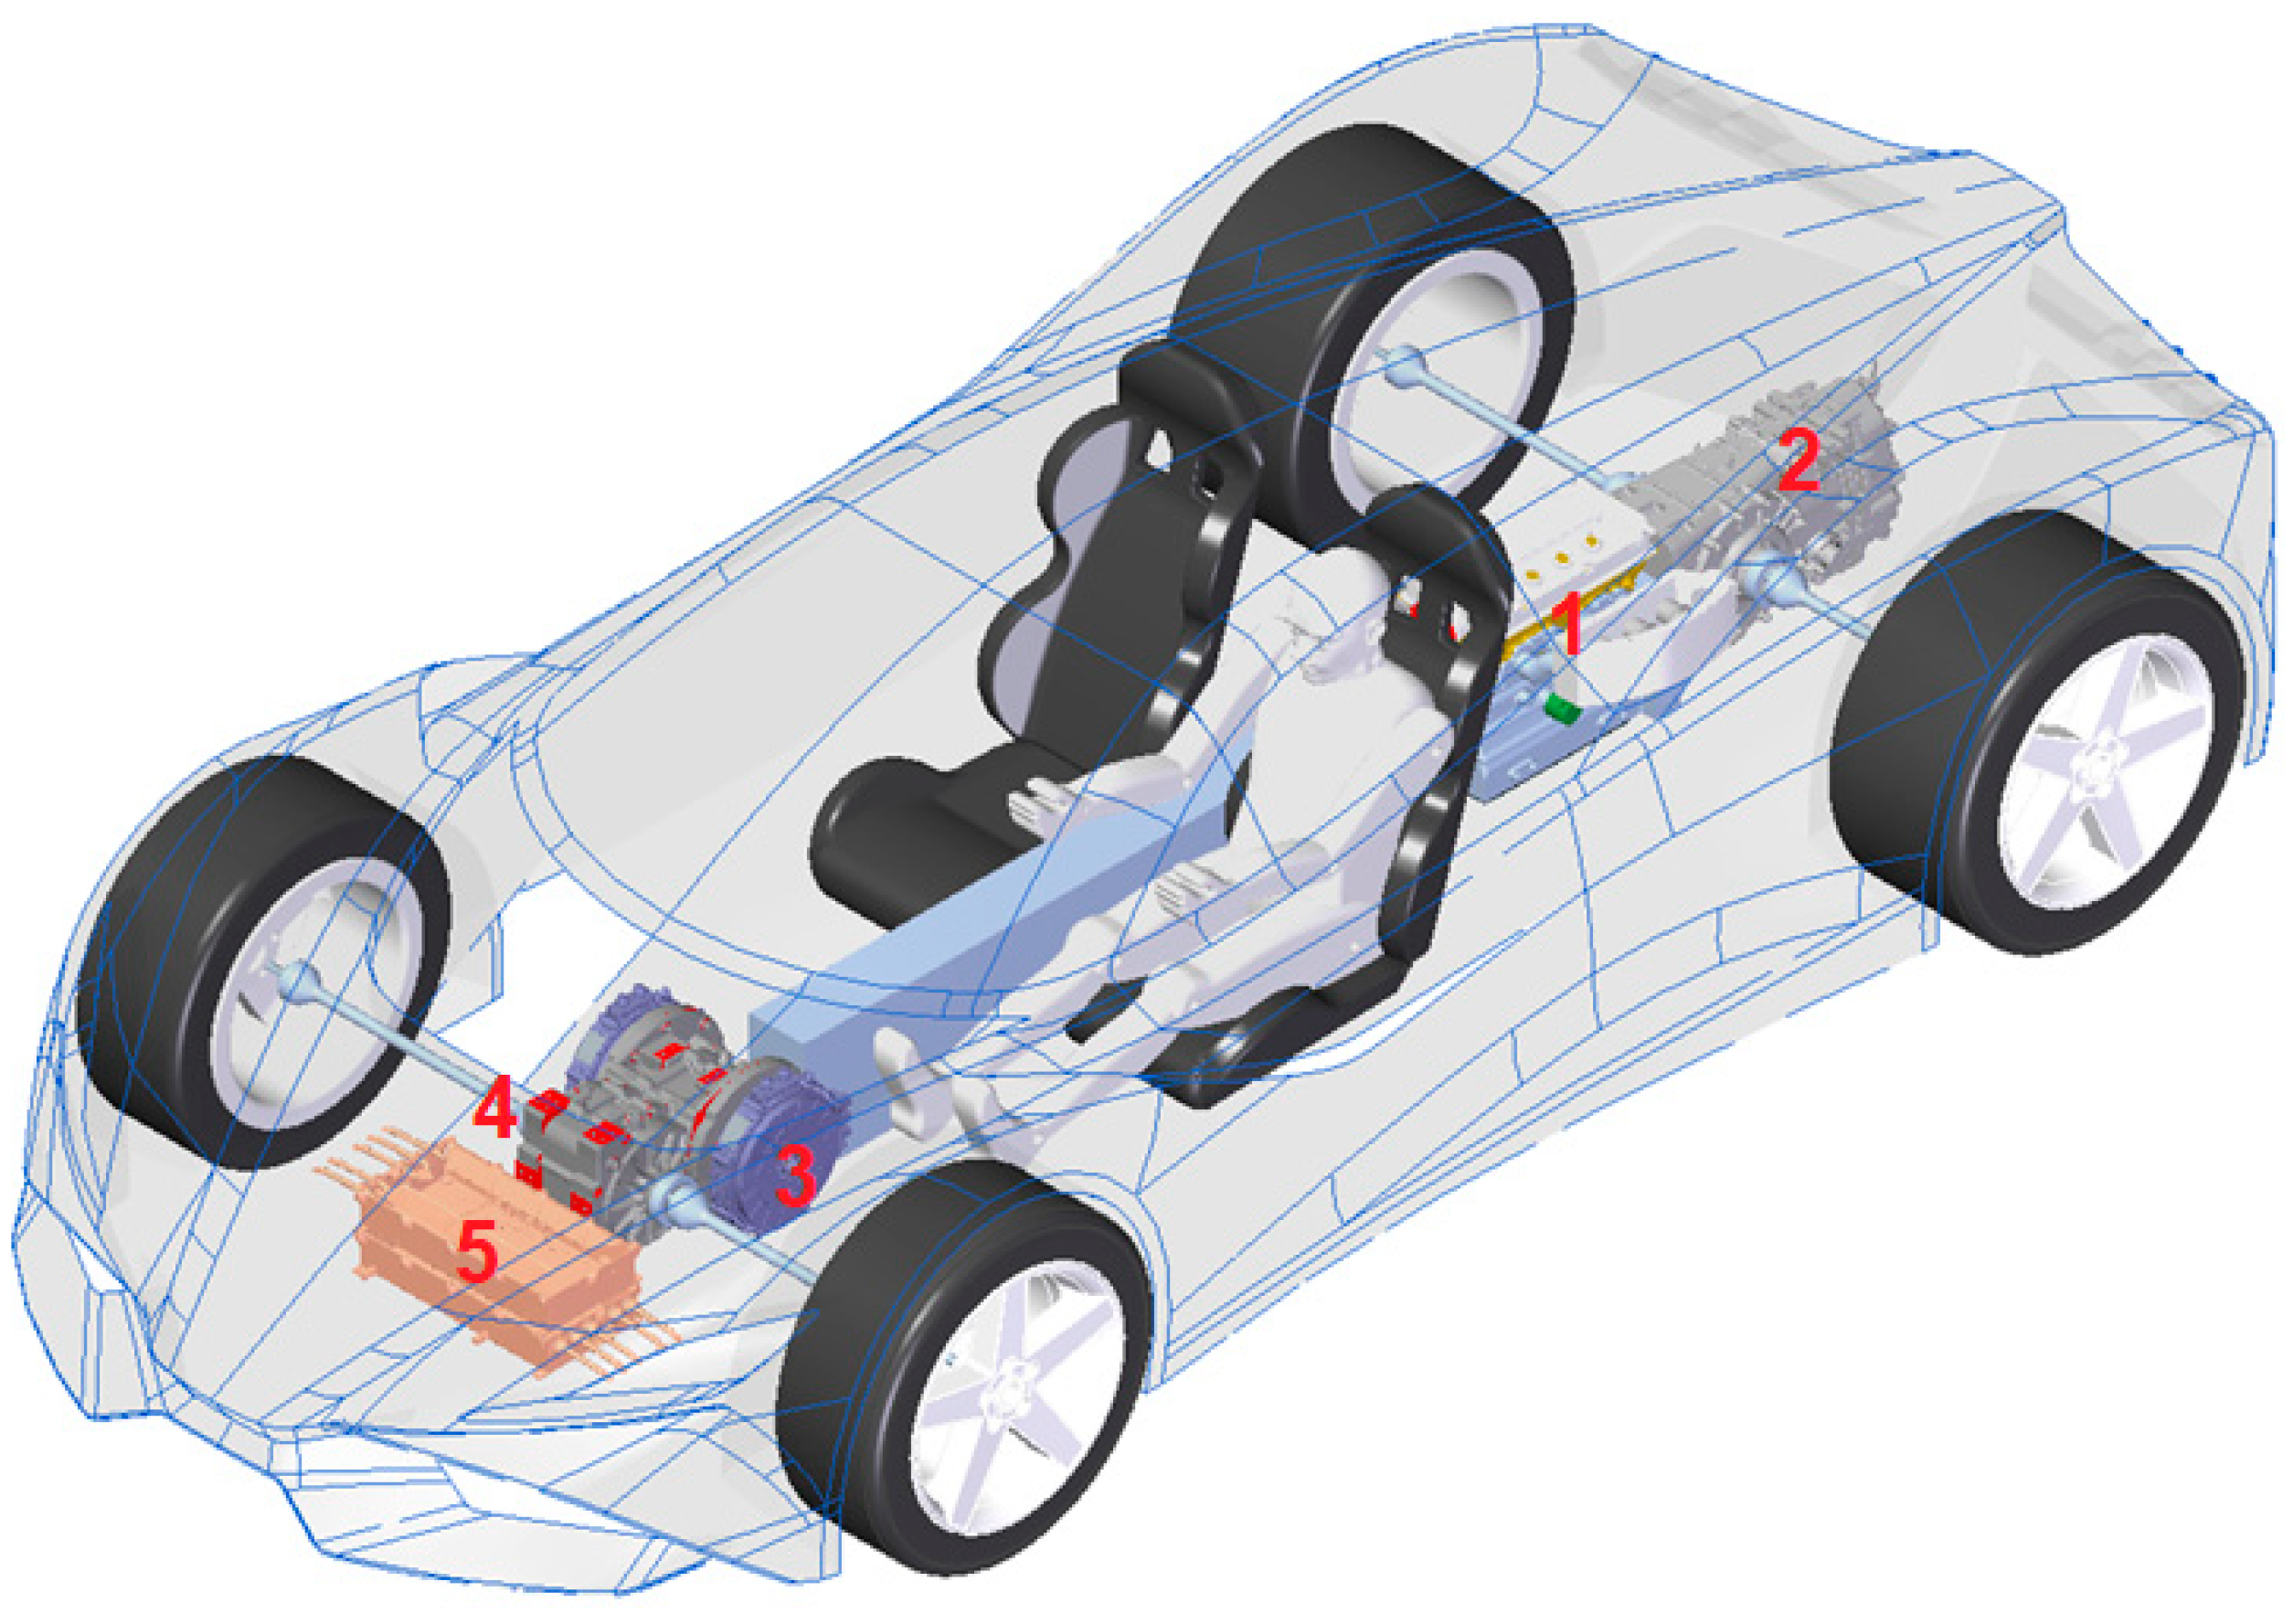
This paragraph presents the prototype under study and whose battery pack is to be sized and the related cooling system designed. It is a PHEV hyper car of the parallel category P4. With reference to
Figure 3, the powertrain architecture provides:
- -
an i.c. engine four-cylinder turbocharged with 2000 cm3 of displacement, mounted on the rear axle of the car in central position;
- -
a Hewland LWS-200 transaxle transmission connecting the i.c. engine to the rear wheels.
- -
a couple of YASA P400 R series electric motors that provide traction to the front axle;
- -
a Hewland GEVT-200 transmission between wheels and electric motors. Each motor is connected to its wheel with an independent gear train;
- -
two Sevcon Gen4 Size 10 inverters that regulate the voltage of the electric motors, one for each motor;
The battery pack, whose nominal characteristics must be defined, is in a central position between the two seats.
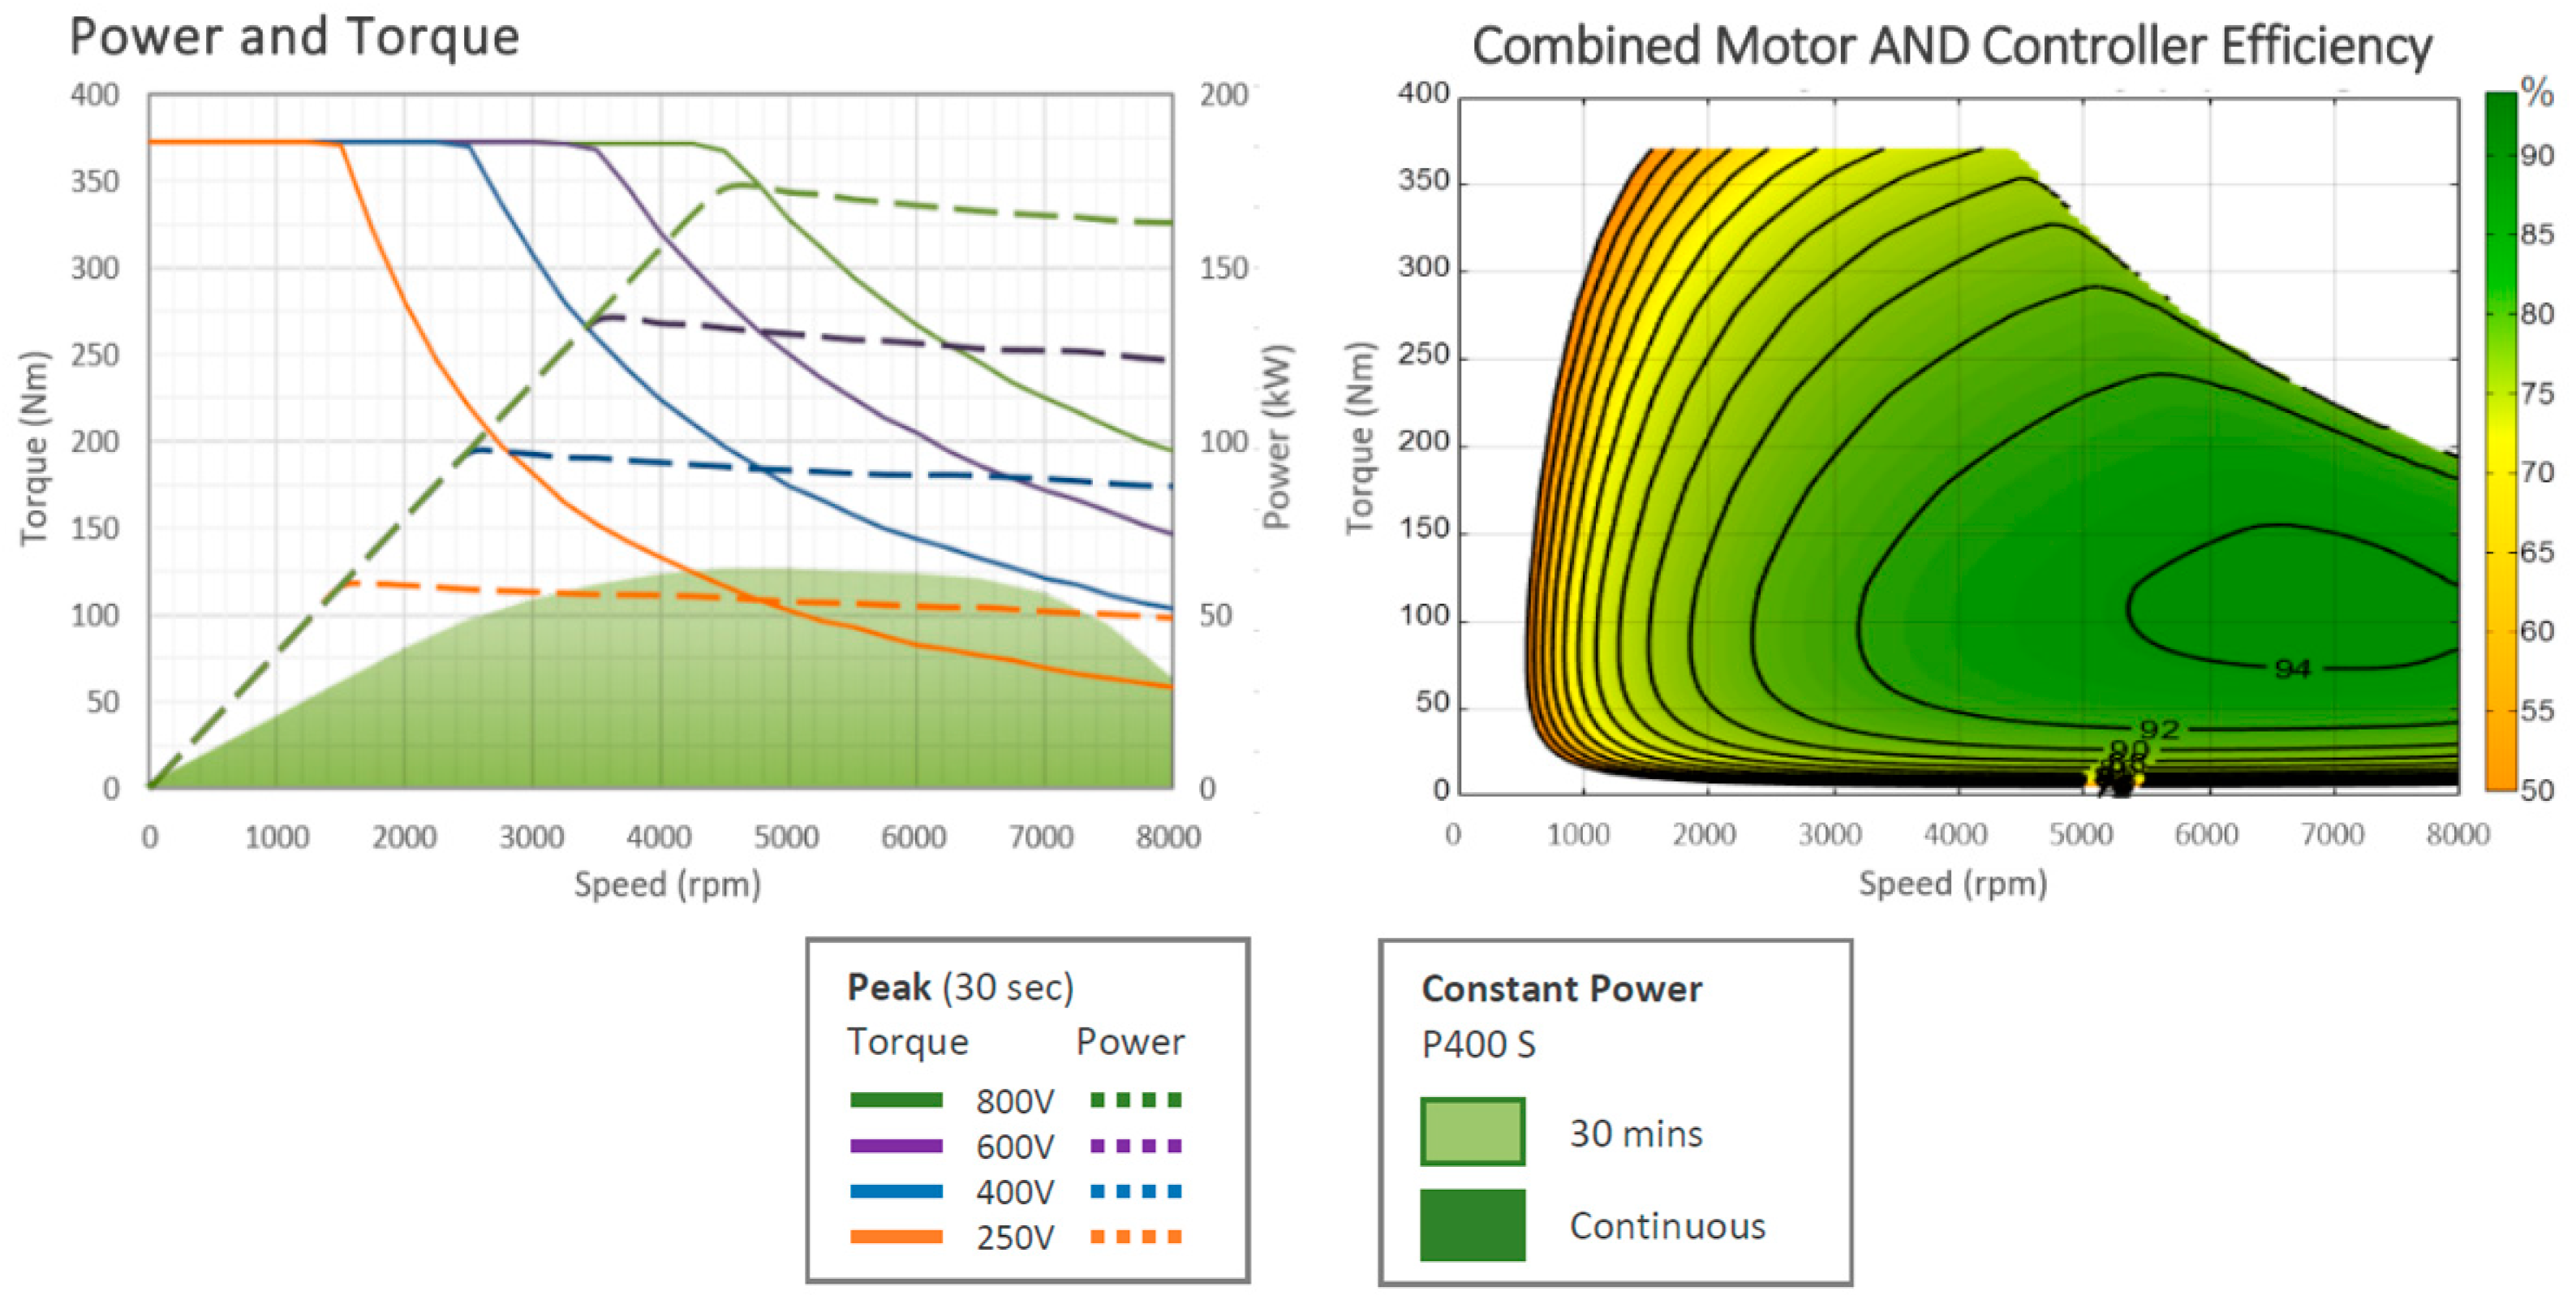
YASA P400 R series motors belong to the class of permanent magnet axial flux and light rotor electric machines. The peak power that these motors can deliver 160 kW, with revolutions ranging from 4500 to 8000 rpm. The motor torque expressed has a maximum value of 370 Nm, which is constant from 0 to 8000 rpm. The maximum rotation speed, from the catalog, is 8000 rpm; the maximum efficiency is 96%. The DC bus voltage that powers the inverters has a nominal value of 700 V and a maximum value of 800 V. In
Figure 4 the torque and power curves are reported, together with the combined efficiency map of motor + controller.
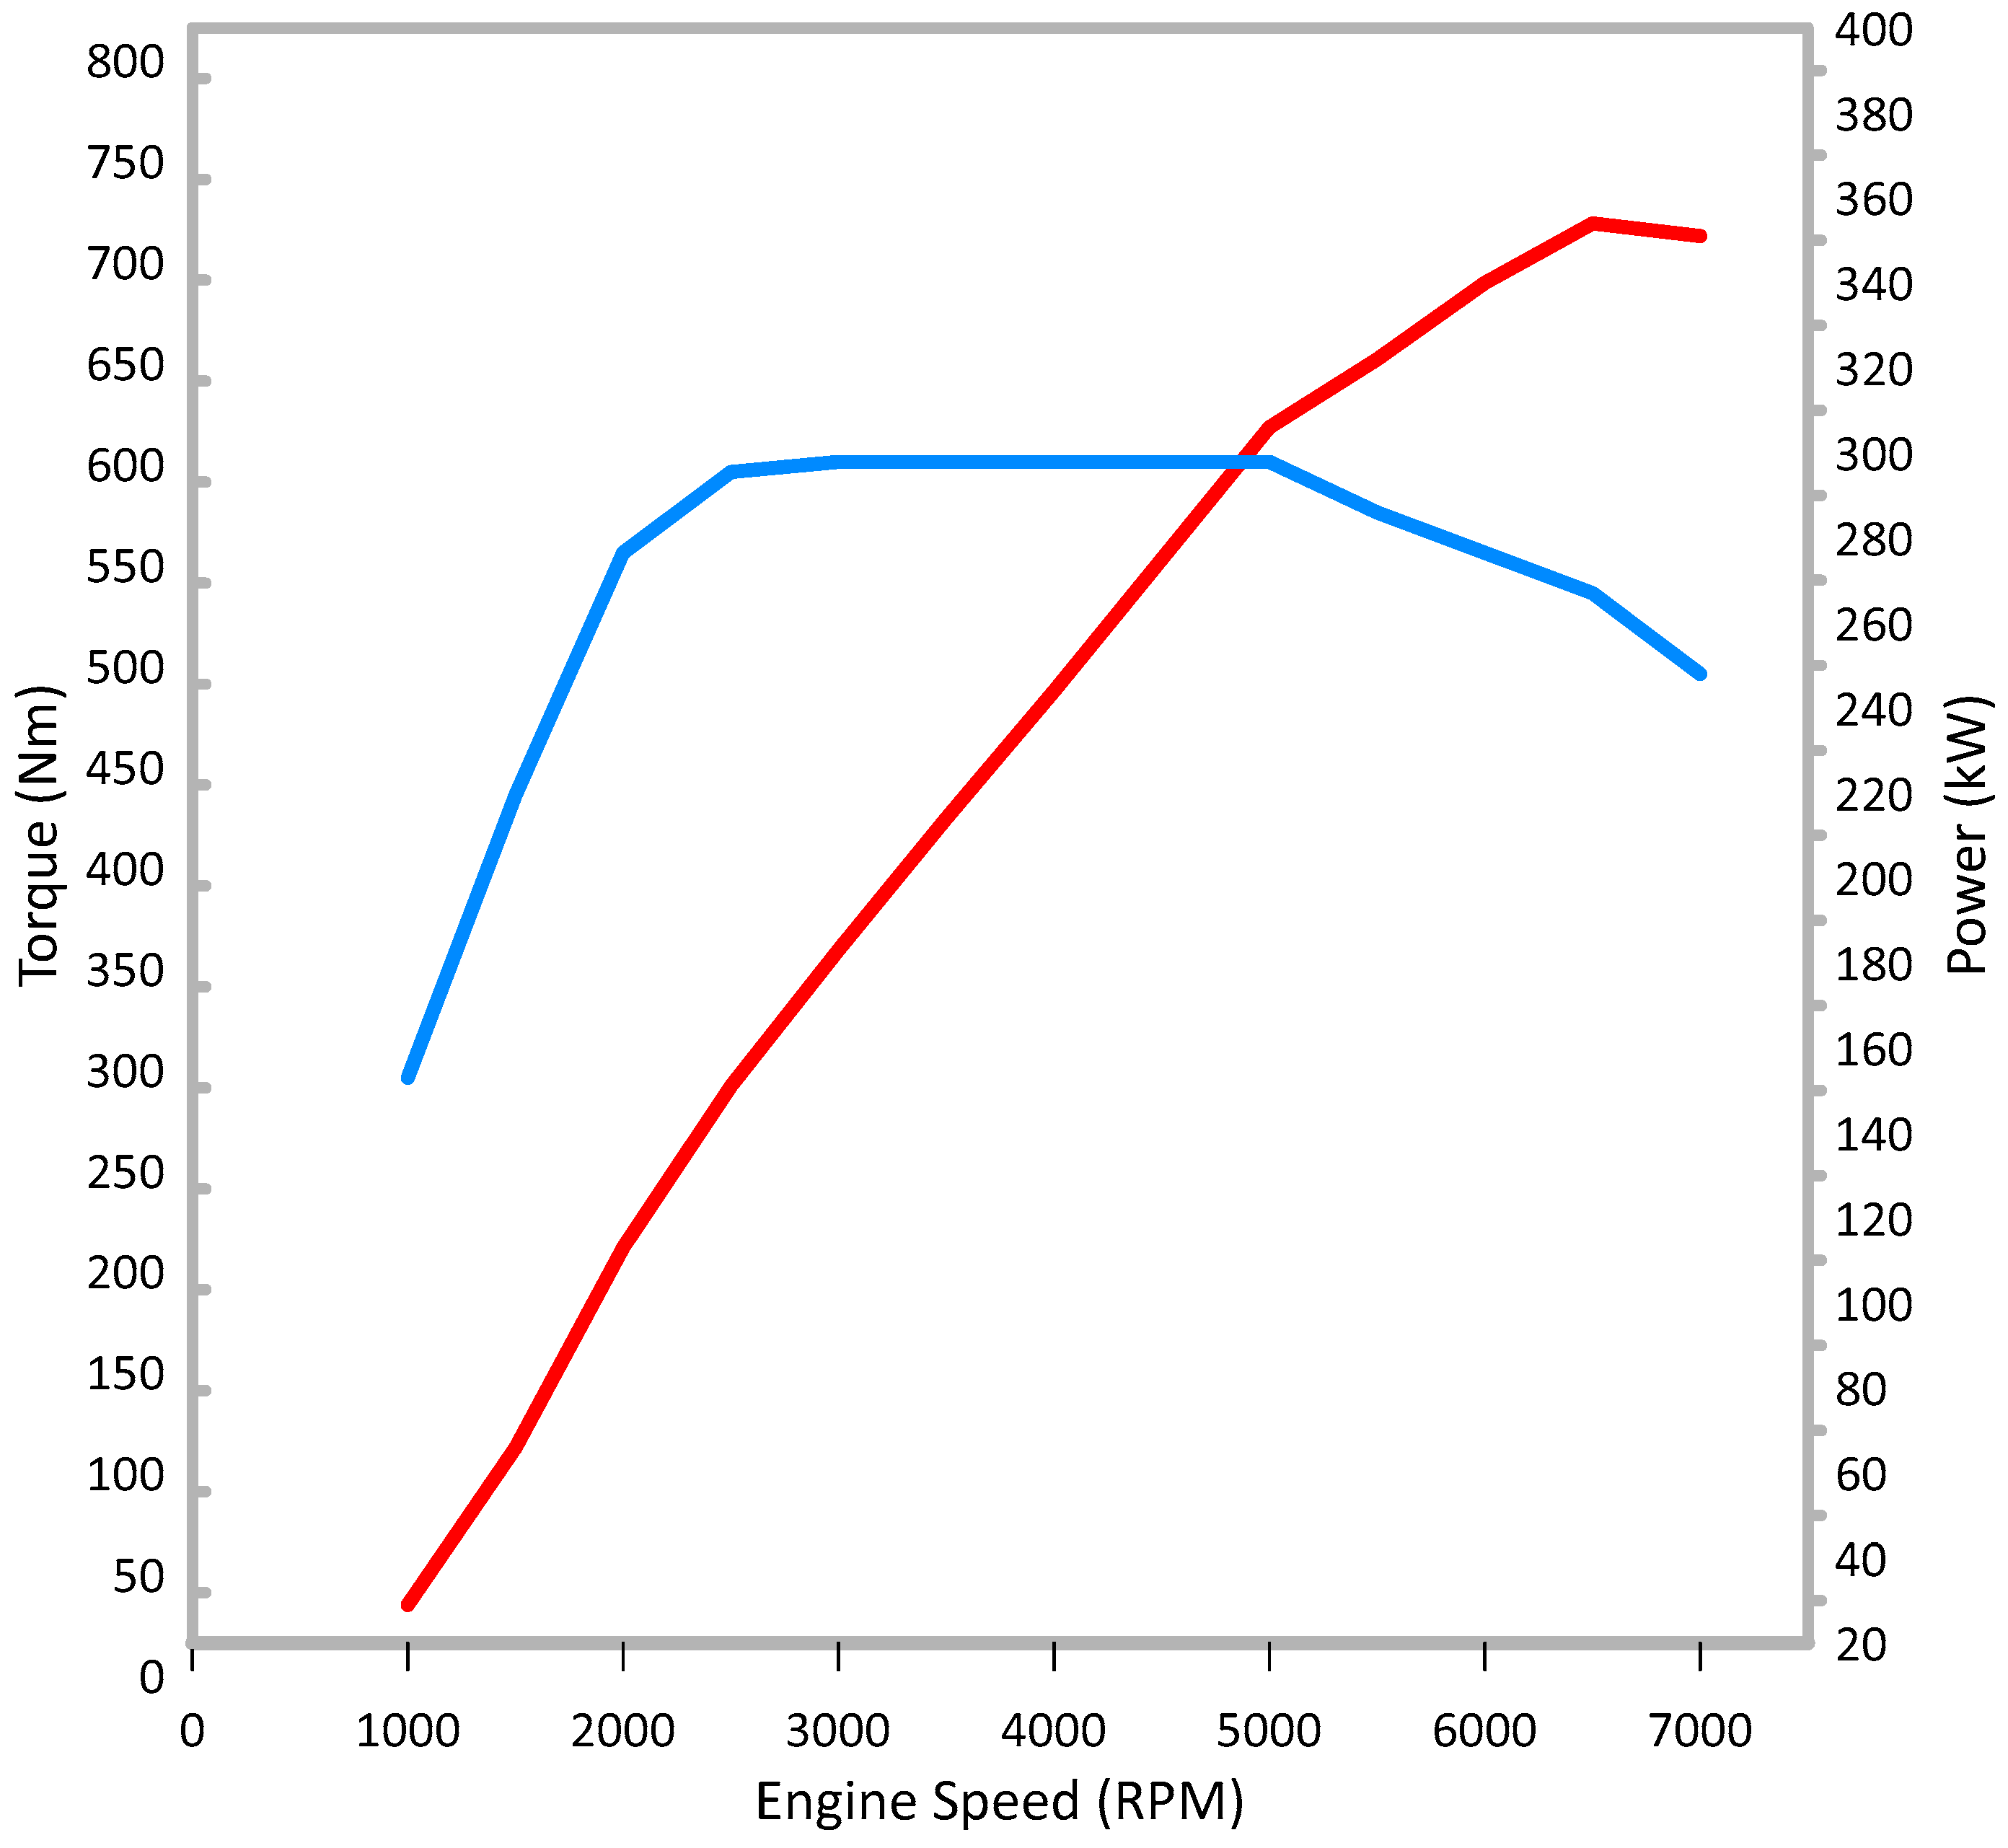
The i.c. engine mounted on board the car is a four-stroke petrol-powered in-line four-cylinder engine with a displacement of 2000 cm
3, with turbocharging. The engine has an almost constant torque curve in the range of rotation speed of 2500 ÷ 5000 rpm to the maximum value of 600 Nm. The maximum power that the motor can express is equal to 355 kW at 6500 rpm. The power and torque characteristic curves of the i.c. engine are shown in
Figure 5. The curves shown here were measured on the engine test bench.
4. Simulation Model and Control Strategies
For the purpose of identifying the current profiles delivered by the battery pack, a simulation model was created based on the specifications of the various propulsion system devices described above and having defined the characteristics of the target vehicle of this project. The current profiles delivered by the battery pack obtained from the simulations are necessary for evaluating the generation of heat due to the Joule effect in the lithium cells, and thus for defining the conditions under which the battery pack cooling system must operate. The main specifications of the vehicle are summarized in
Table 2.
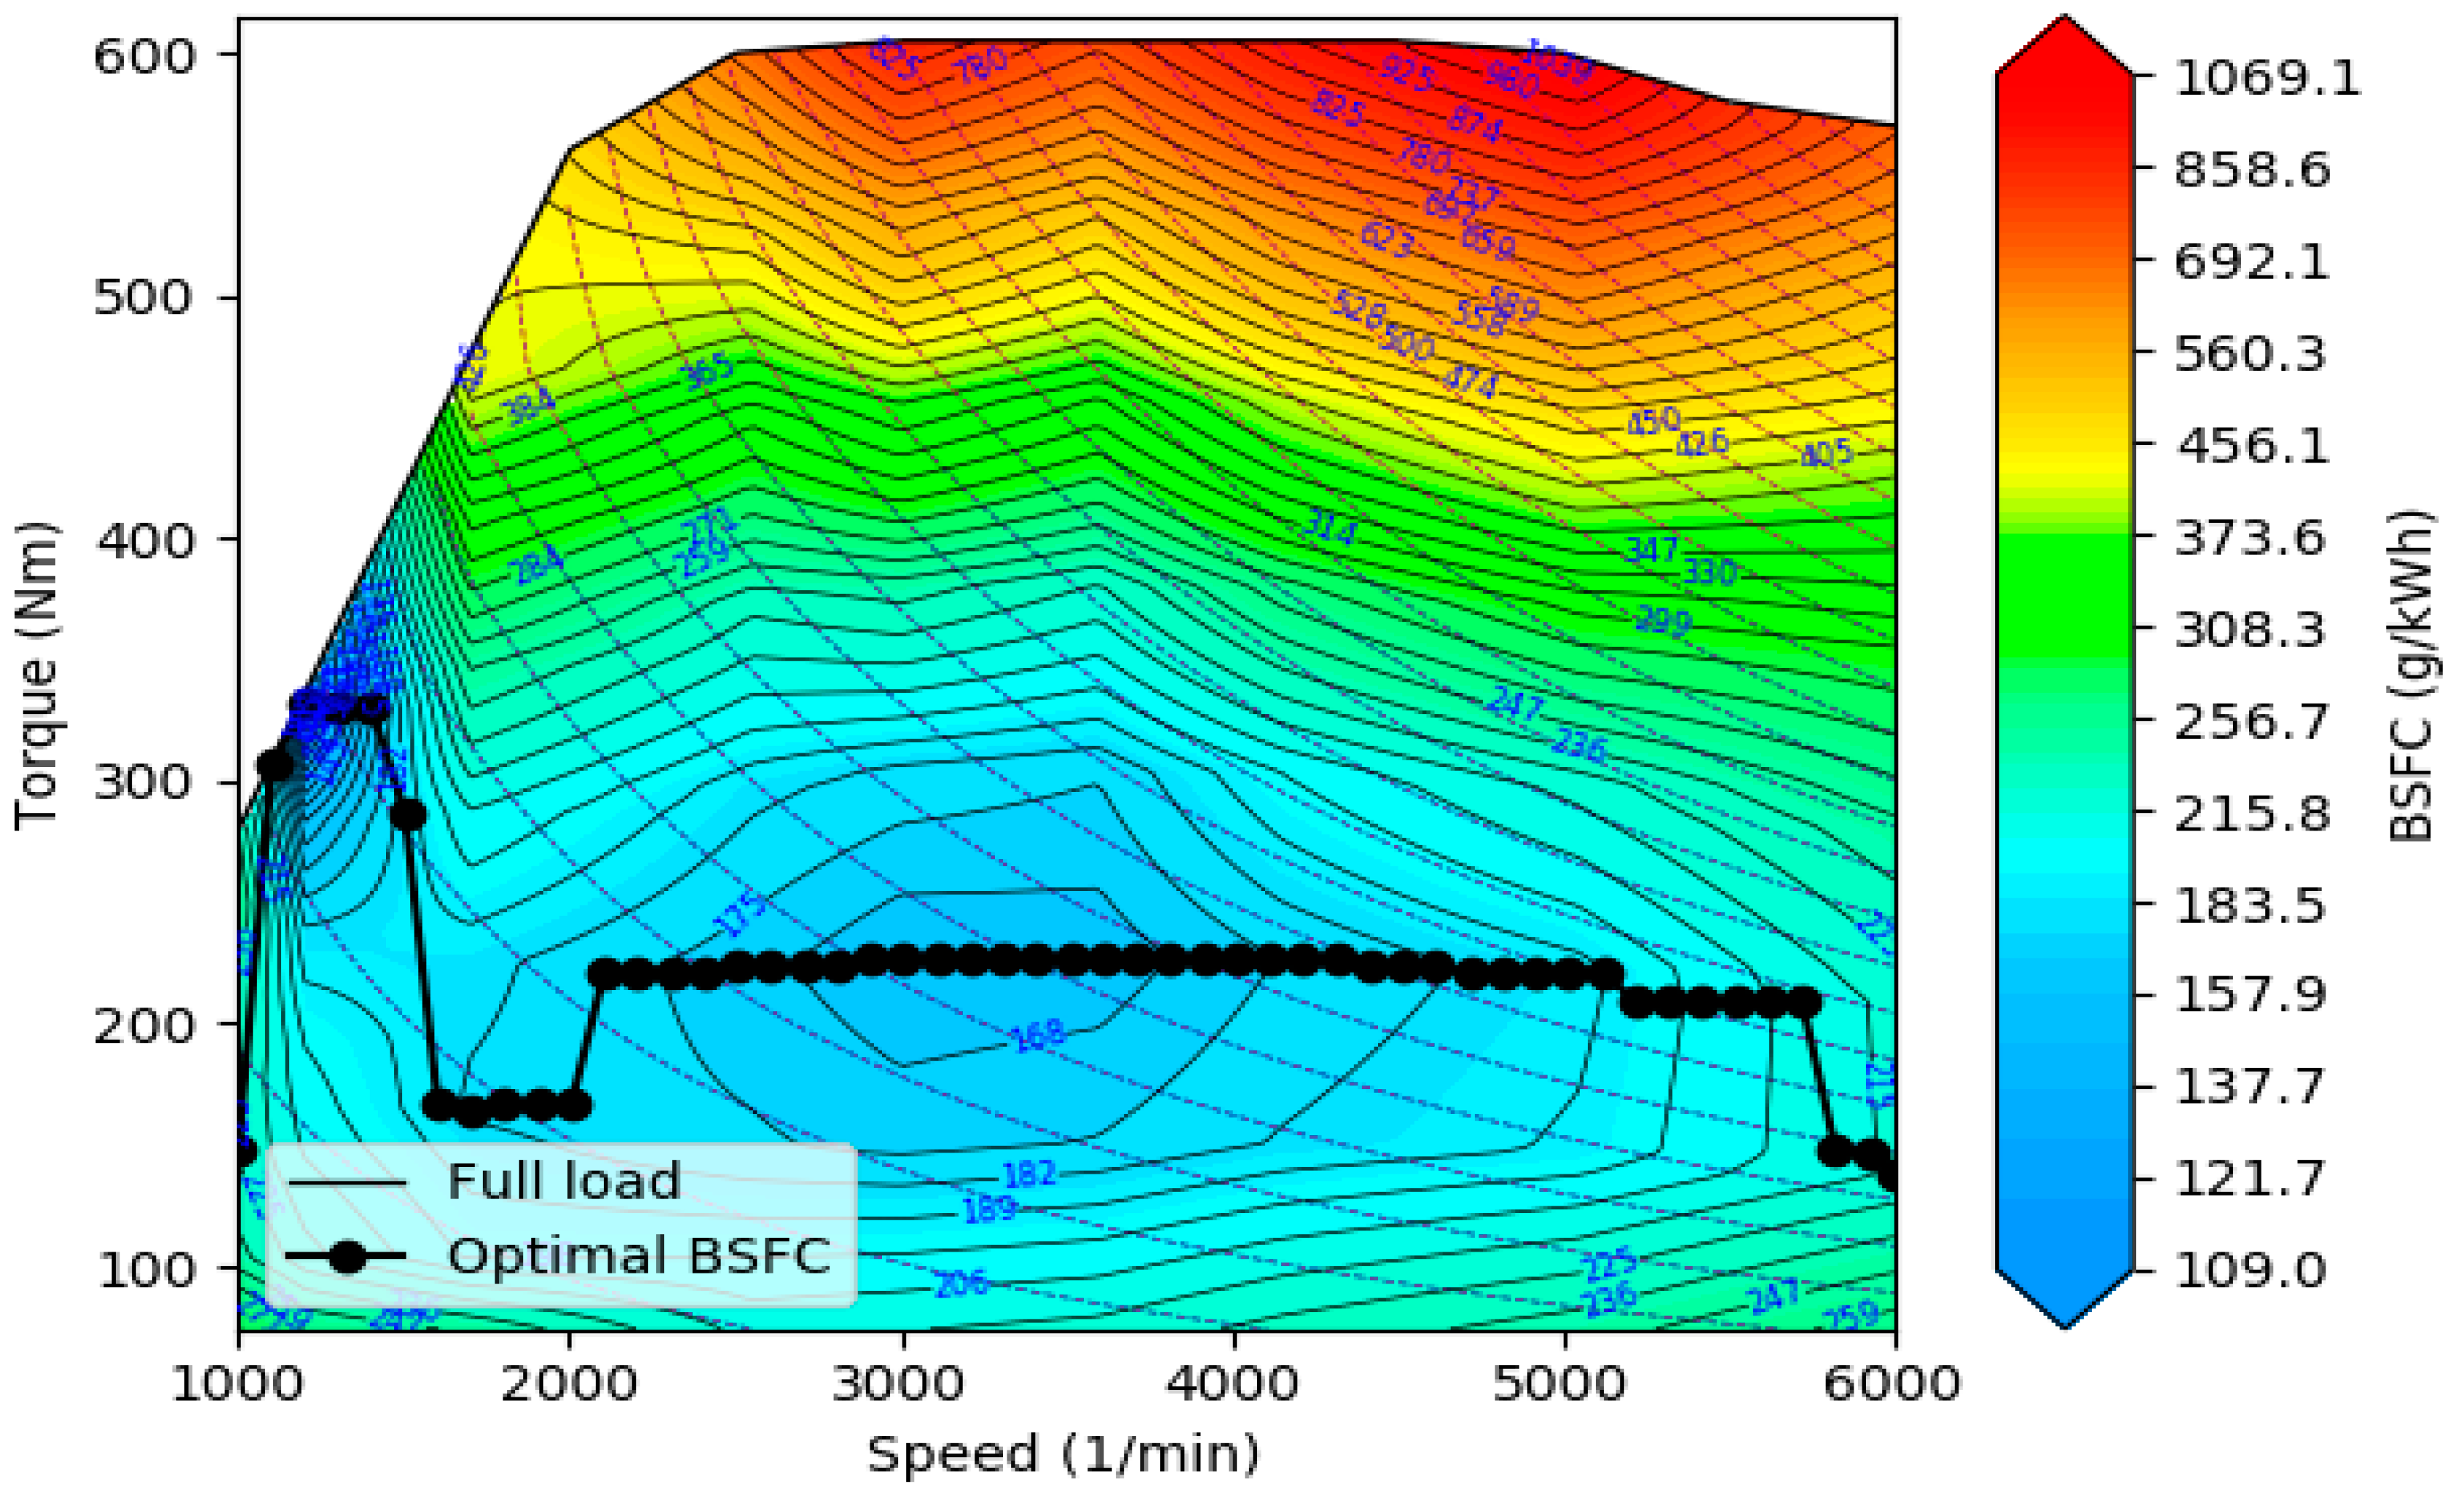
The software used to conduct the dynamic study was AVL Cruise M, a simulation platform for vehicle. The simulation model is made up by the rear part of the powertrain equipped with the i.c. engine, connected to the wheels by clutch, six-speed gearbox, final drive, and differential. The i.c. engine was modeled based on characteristic maps of full load torque versus engine revolution per minutes (
Figure 6). The map of the efficiency of the internal combustion engine was measured on the test bench in stationary conditions; the use, in the simulation, of the specific consumption map measured in this way involves a small error due to not being able to consider the transient efficiency losses.
The hybrid powertrain is completed by the electric drives on the front axle, consisting of two electric motors mechanically connected to the front wheels with a dual motor torque vectoring single-stage transmission, so there is no mechanical differential. The electric drives are powered by a single battery pack. For the rough sizing of the battery pack to be installed on board, a reference value of 25 kWh has been considered.
An additional element that is essential for the correct operation of the simulation model of the hybrid powertrain is the HCU system; the HCU control unit has the function of evaluating the vehicle’s motion conditions and selecting the most suitable drive mode at any time. These types of control are based on the principle of minimization of a cost function, which can be the equivalent consumption of fuel and electricity or other parameters depending on the objective to be pursued. In general, the cost function considered in the hybrid traction optimization process is the equivalent cost consumption of fuel. According to B. Nguyen et al. [
3], it is possible to simplify the optimization problem by replacing the cost function with the function that defines the deviation of the torque delivered by the i.c. engine from the torque corresponding to the BSFC at each instant. In this way, it is ensured that the i.c. engine operates as closely as possible within the maximum fuel efficiency limits.
The mode selector adopted for the simulations conducted in this study is able to analyze the state of the system at any moment and to evaluate which driving mode is the most suitable for moving the vehicle forward. The driving modes offered by this HCU are as follows:
eDrive mode,
cDrive mode,
hAssist mode,
eGenerator mode,
eBrake mode. The choice of the most suitable mode in the instant considered depends on the following status parameters, received as input: vehicle speed, acceleration, torque required from the wheels, battery charge status, or state of charge (SOC), optimal torque of the i.c. engine to BSFC, and pressure of the brake activation system. The HCU module outputs the values of: torque required to the i.c. engine and electric motors, brake system pressure and brake pedal load signal [
4,
5].
The eDrive driving mode provides that the traction power is fully guaranteed under electrical conditions. This driving mode has been designed to come into operation when the required forward speed is less than or equal to a threshold value; it is an arbitrarily defined value that can be actively manipulated in software. The rest of the conditions on the state parameters according to which the selector selects this mode are: the brake system pressure must be zero, the torque required to the wheels must be less than or equal to the maximum torque deliverable by the electric motors, and the state of charge of the battery pack must be greater than a predetermined minimum SOC value. This last condition is dictated by the need to ensure that the discharge cycles of the battery pack are such as not to alter its physical–chemical properties.
When the selected driving mode corresponds to
cDrive, the traction is provided only by the i.c. engine. A first case in which this mode is activated is in the moments in which, despite the requested speed being lower than the threshold value of the
eDrive guide, the state of charge of the battery is lower than the lower limit allowed, and further use of the electric motors would compromise the life of the battery pack. The other conditions under which the traditional drive mode is active are the following: the torque required from the wheels is less than or equal to the optimum torque value of the engine [
6].
With the
hAssist driving mode, the electric motors and i.c. engine are activated simultaneously to meet the demand for traction. It is activated in all those cases in which conventional traction alone would require the engine to provide a torque higher than the optimal one in the engine speed considered, thus reducing fuel consumption and entrusting the electrified line with the task of supplying the necessary surplus of energy. when the goal is reached. However, in cases where the required torque exceeds the sum of the maximum torque that can be delivered by the electric motors and the optimal torque of the i.c. engine,
hAssist mode can exceed the optimal value and provide the required traction, regardless of the resulting consumption. This driving mode is selected if the torque request is greater than the optimal torque delivered by the i.c. engine and the state of charge of the battery pack is higher than the minimum SOC allowed [
7,
8].
The eBrake driving mode is the mode that allows the vehicle to recover electrical energy from braking phase. The i.c. engine is disconnected from the transmission line through the clutch mechanism and the electrical machines take on the role of generators, acting as a brake and transforming the kinetic energy of recovery into electrical energy to be stored in the battery pack. If the demand for braking power is greater than the maximum resistant power offered by the generators, the disc brakes that support the generators in braking are activated. The parameters that manage this mode are the pressure required from the braking system and the state of charge of the batteries, which must be lower than the maximum SOC allowed. In the cases where the second condition is not met, the VCU brings the braking torque required for the electric motors to zero, and the braking is entirely devolved to the mechanical braking system.
Finally, the system was equipped with a battery pack recharging mode, called eGenerator mode, that is activated only if the state of charge falls below the threshold value established by the minimum SOC. This function is active if the torque request is less than a predetermined percentage of the optimal torque of the i.c. engine, and it delivers the optimal torque; the surplus, with respect to the traction required, is absorbed by the electric machines. It is only after having reached the minimum limit imposed on the state of charge, therefore, that the battery pack can be recharged, in certain phases of traction, by the i.c. engine according to the charge-sustaining mode.
5. Simulation Results
The simulations carried out, as mentioned above, were aimed at calculating the outgoing and incoming current trend from the simulated battery pack during a particularly heavy test cycle from a performance point of view; the purpose was in fact to use this high-performance current profile to verify the ability of the battery pack cooling system to keep the temperature of the lithium cells below the maximum permitted temperature of 60 °C. The current profile obtained with the simulation model was used to design the cooling system and verify its performance by calculation; subsequently, the same current profile was be used to experimentally validate the cooling system on a single module of the battery pack in a climatic chamber. The available testing facilities do not allow us to experimentally verify the entire battery pack, which consists of 16 modules arranged electrically in series, but hydraulically in parallel.
The simulation model has been utilized to calculate the best dynamic performance of the vehicle in acceleration at maximum power. To compare the performance of the two systems, the time intervals necessary to reach speeds of 100, 200, and 300 km/h from steady state conditions have been calculated as following:
0–100 km/h acceleration is performed in 4.4 s in i.c. engine-only traction and in 2.9 s in hybrid traction;
0–200 km/h acceleration is performed in 13.0 s in i.c. engine-only traction and in 8.2 s in hybrid traction;
0–300 km/h acceleration is performed in 38.4 s in i.c. engine-only traction and in 17.6 s in hybrid traction.
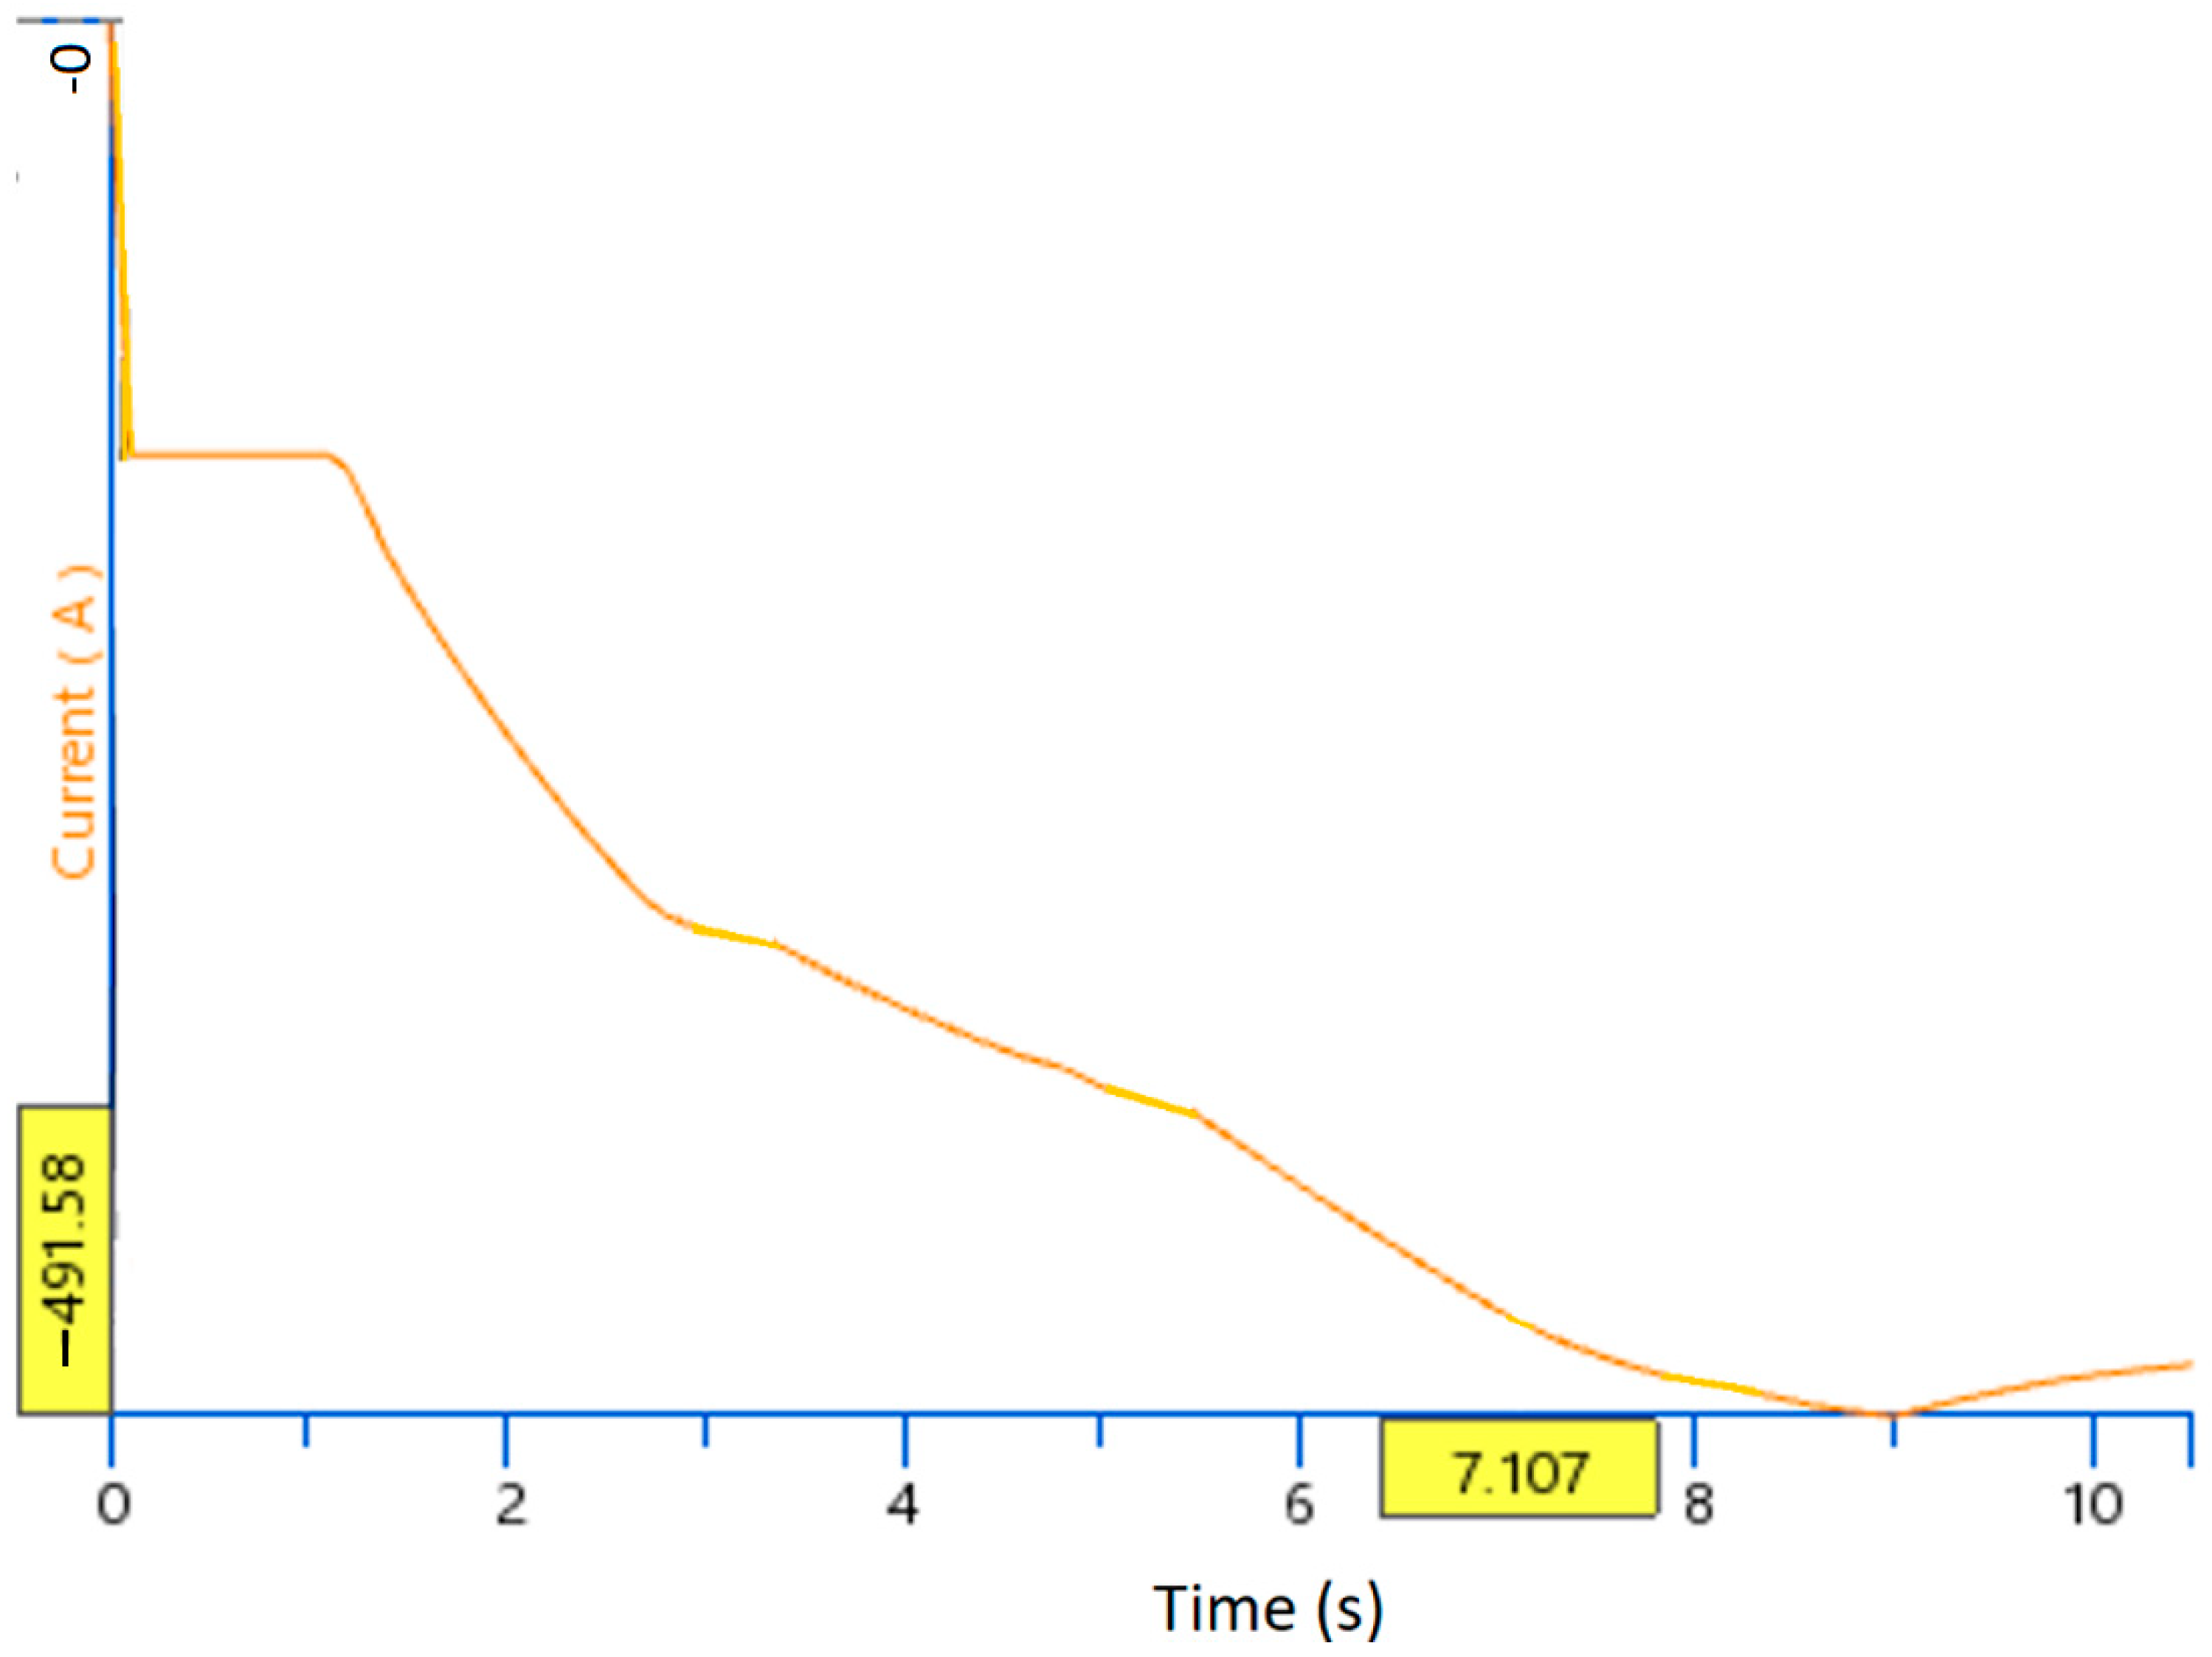
The improvement in performance due to the support of the electric traction motors is evident. At this point, the analysis has been focused on the 0–200 km/h acceleration in hybrid mode, in order to evaluate an intensive use of battery pack energy. In
Figure 7, the output current flow is reported during the 0–200 km/h acceleration in hybrid mode, with the electric drives being able to supply the maximum power during the acceleration, without limitations. In this way, this acceleration represents the most demanding case in term of discharge current from the battery pack. The discharge current values as a function of time are shown in
Table 3 for better readability.
This discharge current profile was chosen as a reference trend to verify, later on, both by calculation and experimentally, the ability to effectively contain the overheating of the lithium cells by the cooling system. In particular, it will be determined how many consecutive acceleration tests the system is capable of performing before the lithium cells reach the limit temperature of 60 °C.
6. Storage System Layout
Once the design parameters of the battery pack in terms of accumulated energy (25 kWh) and peak power required (160 kW) have been previously fixed, it is possible to fix the number of cells required and their electrical arrangement. In this way, the number of cells to be arranged in series and in parallel, the total number of cells, the total energy, the maximum deliverable power, the preliminary weight, and the volume of the pack are defined. Moreover, it is possible to study the better i-ion cell for this application, and its thermodynamic behavior can be analyzed. The number of cells to be arranged in series was linked to the maximum voltage of the single cell and the maximum power supply voltage of the inverters (800 V); the number of cells in parallel was calculated based on the maximum discharge current requested by the inverters at maximum power (500 A) and the previously calculated total nominal energy of the battery pack (25 kWh).
Table 4 shows the comparison between the characteristics of the battery pack in the case of the use of the different power cells, cylindrical or pouch. The discriminating parameters for the choice of the optimal solution are the preliminary total volume and weight, the total stored energy, and the total number of cells required. The cells presented in the comparison are cells for power applications suitable for the case analyzed here, with a high power density, a good energy density and with high continuous maximum discharge currents. The result is that the cell that proves to be the most suitable to make up the prototype battery pack is Molicel INR 21700 P42A, thanks also to its lower price and the larger amount of experimental data released by the manufacturer.
From the preliminary electrical sizing it was found that to guarantee the rated voltage of 700 V and to respect the maximum continuous discharge current of 45 A of the selected cell, 2145 cells arranged in series of 195 units and connected in parallel in groups of 11 are required. However, a more detailed study was conducted to attempt to reduce the number of cells as much as possible and thus simplify and scale the geometry of the battery pack. Indeed, following a more in-depth exchange of information with the cell manufacturer, it was agreed to be able to bring the maximum peak discharge current to 63 A, by virtue of the cooling mode that was chosen to be used, and which will be described later. Using this data in the calculation of the number of cells to be arranged in parallel, this can be reduced from 11 units to 8 units. In this way, the total number of cells necessary to comply with the design parameters becomes 1.560, with a reduction in the number of cells to be used equal to approximately 30%, and the electrical configuration becomes 195s8p.
Having chosen to use a battery management system equipped with a slave PCB capable of controlling a string of 12 cells, it was considered acceptable to reduce the number of cells arranged in series from 195 to 192, with a slight total voltage decrease. In summary, the battery pack has been divided into 16 modules consisting of 12 groups of cells connected in series and each made up of eight cells arranged in parallel, according to the configuration identified with the code 12S8P. At this stage of the design, the spatial arrangement of the various cells of the various modules has not been established, since this choice determines the degree of efficiency of the cooling system, the design of which is referred to in the following paragraph. In
Table 5 the final battery pack specifications are summarized.
7. Cooling System Design
The cooling system is based on the use of a dielectric liquid in direct contact with the electrical conducting elements of the single cells; the system is integrated into the car’s HVAC system. This thermal management system is much more efficient than air cooling systems, since it involves dielectric fluids, which show heat removal capacities that are estimated to be higher than air capability. In addition to greater thermal efficiency, direct contact liquid cooling systems have the advantage of requiring few physical components; in this way the weight of the whole pack is significantly reduced.
In the specific case under examination, the refrigerant fluid flows in contact with the busbars connected to the cells. The busbars are sheets of electrically conductive material, generally made of copper, which act as electrical connection nodes between the cells. The shape and size of the busbars have been chosen according to the intended application. Due to the constraints imposed by this design solution, it was necessary to operate using fluids with strong electrical insulation characteristics (see
Table 6 for characteristic data of one of the dielectric fluids analyzed), as dielectric oils for transformers. The use of fluids such as water, in fact, would cause short circuits between the busbars and therefore between the cells of the battery pack. As regards the transfer of heat acquired through the cells outside the refrigeration circuit, it was decided to integrate the cooling system with the heating and ventilation system, named the Heating Ventilation and Air Conditioning (HVAC), of the prototype by means of a plate heat exchanger in which the coolant of the HVAC system plays the role of a heat sink for the cooling system.
Concerning the heat release mechanisms involving lithium-ion batteries, they can be divided into two distinct categories: reversible processes and irreversible processes [
8]. Reversible processes, also known as entropic variations of heat, are those that involve reversible electrochemical reactions, with a net entropy balance of zero in a discharge and recharge cycle. The irreversible processes, on the other hand, are accompanied by an entropic release of heat, according to the second law of thermodynamics. The irreversible processes include: the release of heat due to the Joule effect, the polarization processes, and the transfer of heat due to the partial mixing of the compounds that make up the cell, which generates variations in the enthalpy content of the materials themselves. Among the mechanisms mentioned above, the terms that play a main role in the release of heat are the Joule effect and the polarization process [
9]. The heat released by the Joule effect is proportional to the square of the current delivered by the single cell and to its internal resistance. The polarization is the result of the excess of electric potential between the operating electric potential and the open circuit electric potential of the cell: this causes an increase in the resistance to charge transfer at the interface between electrodes and the electrolyte. It is possible to state that:
where
Qr indicates the heat released due to the isentropic chemical reactions, with
Qp being the heat due to polarization effects,
QJ being the heat released due to the Joule effect, and
Qh being the heat due to enthalpy variations.
Q is the total heat released by the cell in operation. By neglecting the terms of entropy production and enthalpy variation for the reasons stated, the volumetric power generated due to the thermo–electro–chemical effects of a lithium ion cell is expressed by the relation:
where
q is the thermal power released per unit of volume,
Vb the volume of the cell,
I the intensity of current flowing in the cell,
Ri the internal resistance of the cell,
U0 the open circuit voltage, and
U the operating voltage. Studies conducted by G. Liu et al. [
10] show that although for the C-rate in the range of 1 ÷ 2 the polarization and Joule effects have an equivalent weight in the heat generation mechanism, at higher discharge rates Joule effect assumes an increasingly marked role in defining the heat released, in proportion to the rate of discharge itself. Having established that the nominal discharge rate of the battery pack in this project is equal to a C-rate of four or more, in accordance with the previous observation and with the studies conducted by A. Chu et al. [
11], it was decided to model the heat generated by the cells of the battery pack considering only the release of heat due to the Joule effect, in which however the maximum internal resistance of a discharge in direct current is taken into consideration as the internal resistance.
The variables that establish the degree of efficiency of the cooling system of the battery pack are many and depend on the process by which the heat exchange takes place. The process of heat transfer between the fluid and the cells, mediated by the busbars, occurs mainly by forced convection. To determine the thermo-fluid dynamic field that develops inside the cooling system ducts, it is necessary to solve the equations that describe the dynamic and thermal behavior of the system. The equations that allow us to carry out this study are the conservation differential equations of mass, moment of momentum or Navier–Stokes, and the energy applied to a generic control volume. However, in most cases, they do not allow to obtain an exact solution of the problem due to the non-linearity of the Navier–Stokes equations. For this reason, in order to carry out the design study of the cooling system, it was necessary to use approximate numerical methods to determine its behavior. Among the various models available in the literature, namely Direct Numerical Simulation (DNS), Large Eddy Simulation (LES), and Reynolds Averaged Navier–Stokes Simulation (RANS), the latter approach was chosen. Menter et al. [
12,
13] proposed the k–ω SST turbulence model, able to combine the k–ε and k–ω models in such a way as to prefer the first in flow regions far from solid edges and the second instead in proximity of these. The conversion is done by means of a multiplicative conversion factor, or blending factor, which is present within the formulation of the transport equations of the terms k and ω. In the simulations conducted during the design of the cooling system of the battery pack, it was therefore chosen to use the k–ω SST model for the reasons set out above, since these are internal flows and therefore those in which solid edges play an important role. The resolution of the model is performed numerically by means of finite element analysis, Finite Elements Method (FEM), by ANSYS Fluent software, with which the evaluation of the pressure drops in the cooling ducts of the entire module has been fulfilled, in order to carry out a correct check of the sizing of the recirculation pump of the refrigerant fluid.
The hydraulic project layout concerning the cooling circuit of the battery pack foresees that the modules are connected hydraulically in parallel to minimize pressure drops. In this way it is also possible to study the thermo-fluidic behavior of a single module independently and to extend the results obtained to the rest of the modules that make up the battery pack. Three different geometries of the refrigeration ducts of the single module were experimented numerically, shown in
Figure 8. Geometry 1 and 2 provide that the electrical layout 12s8p is realized through a geometric arrangement of the 12 × 8 cells, while geometry 3 uses a 16 × 6 geometric configuration of the arrangement of the cells, therefore with a different shape of the busbars.
To perform the analytical studies of the geometries considered for the battery pack cooling system, it was necessary to perform the independent grid stability study of each case. The studied geometries result in great dimensions, for which with the subdivision of the entire system in several elements the mesh appears coarse and with little reliability: it has been necessary to model some inner phenomena to the system in order to eliminate from the calculation some portions of the same one and therefore to fulfil the study of stability. The assumptions used to conduct the study are: stationarity of the problem, heat release from the cells only by the Joule effect, and the uniform temperature field of the same. Under these assumptions, it was possible to replace the presence of the cells in the geometry by a specific heat flux imposed on the contact surfaces between the busbar and cells. This specific heat flux must respect the equality relation:
Ac indicates the total area of the busbars in contact with the cells,
qs is the specific heat flux imposed on the same surfaces. In this way the geometries studied are greatly simplified and allow the use of more detailed and refined meshes.
As an example, the meshes used for the independent grid stability study for Geometry 1 are shown. The first mesh was created using the default settings of ANSYS Meshing software, a program that supports Fluent in finite element decomposition. The resulting result is a coarse mesh, composed of elements that are very different in shape and size from each other. This characteristic affects the results of the simulations. The second mesh, similar to the successive ones, has been realized through the imposition of a structured grid and of a prearranged dimension of the elements; this makes it so that the resulting elements are all of a similar shape, are mainly cubic, and that the dimensions of the elements are comparable. The advantage of having a structured grid is that it makes it easy to define the vectors normal to each face of each element. This is essential to have a correct description of the fluid dynamic phenomena near the solid edges. The third mesh was obtained as an improvement of the second one by decreasing the size of the elements, combined with the introduction of a thickening of the grid near the solid edges. In this way, it is possible to better describe the phenomena involving the development of the boundary layer. The next and final mesh was created by further reducing the size of the finite elements and maintaining the same grid-thickening settings as the third mesh. In
Table 7, the grid stability analysis is reported.
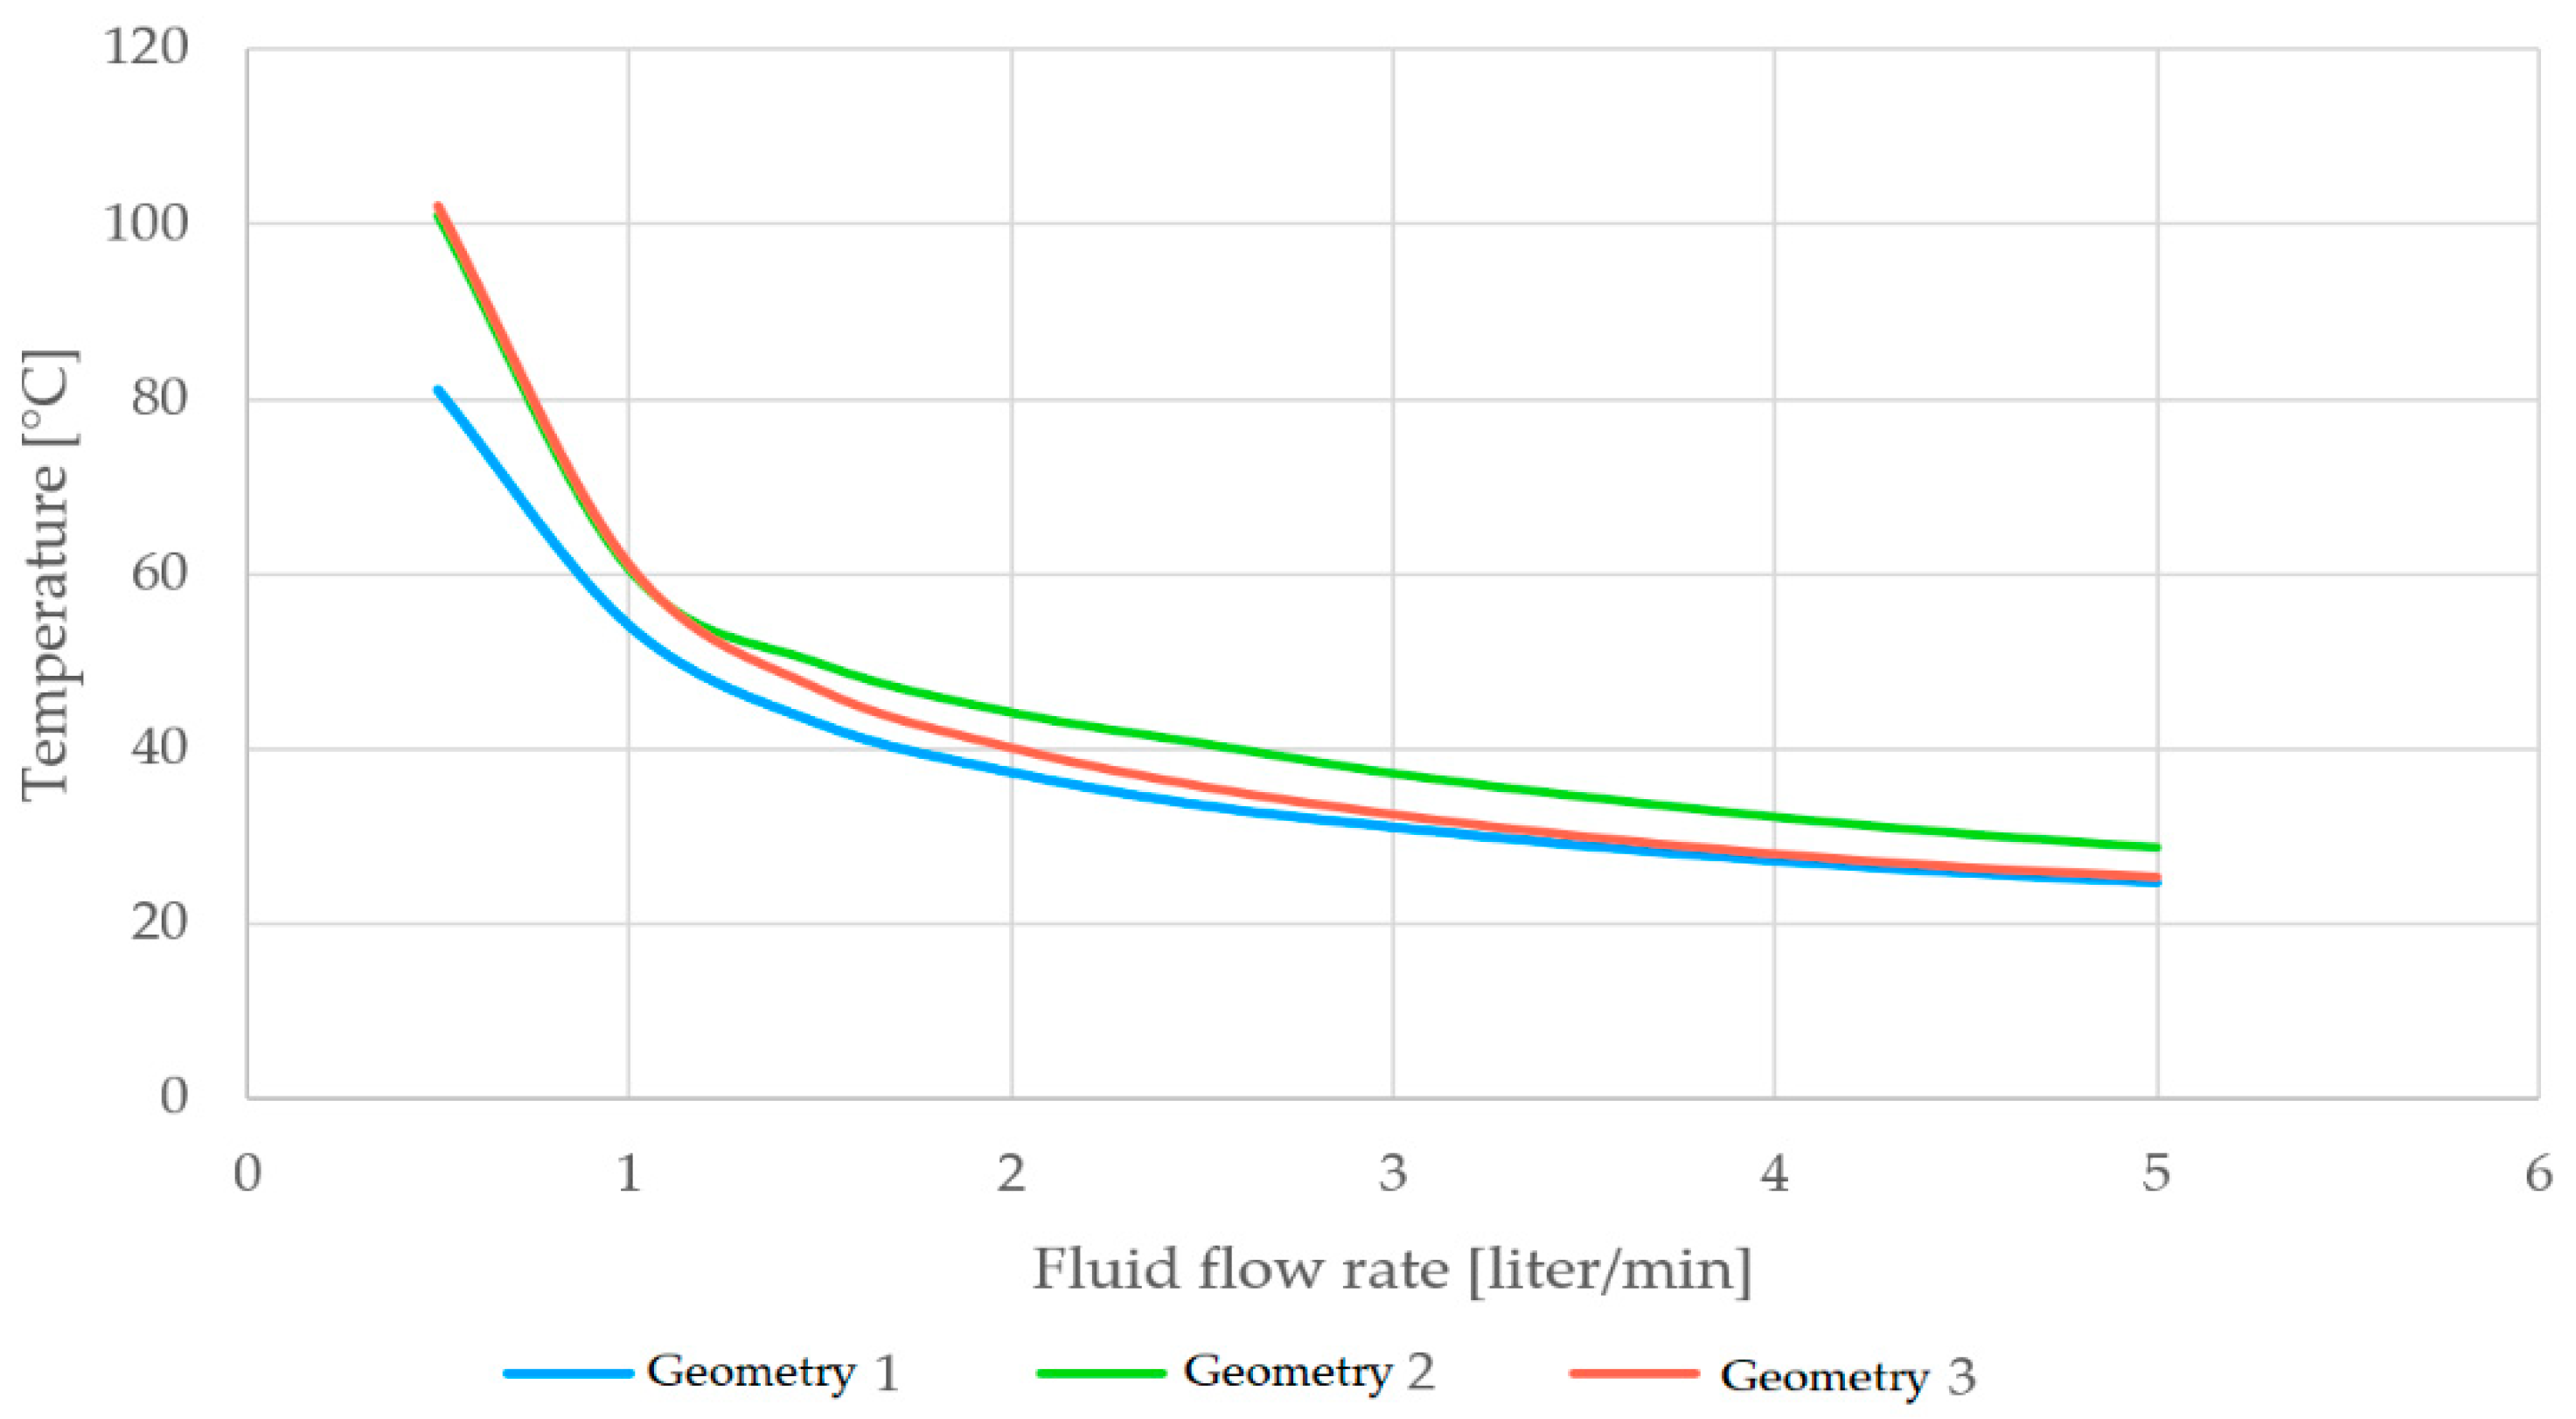
The simulations were conducted with the aim of ensuring that the operating temperature of the busbars did not exceed the maximum value of 60 °C in the discharge regime at C–rate = 4. The inlet temperature to the oil module was set at 10 °C for each geometry. For flow rates greater than or equal to 1 liter/min, the condition of maximum temperature below 60 °C is satisfied. By interpolating the pressure drop values as a function of the flow rate, these take on a parabolic trend, in accordance with the theory of head losses, which is proportional to the square of the average speed of the fluid in the duct. The maximum temperature of the busbars and of the fluid, on the other hand, takes on a decreasing profile as a function of the flow rate. Once the solutions for the various geometries were obtained as a function of the circulating flow rate, they were compared to determine which is the most efficient solution. In
Figure 9 and
Figure 10, the curves expressing the pressure drops and the maximum temperature of the busbars as a function of the capacity of the module are compared. In regards to the pressure drops, it is noted that Geometry 3 shows the lower values among the alternatives proposed. When compared to Geometry 1, this is because it has half the number of connection joints, a characteristic that significantly reduces the contribution of concentrated head losses. When compared to Geometry 2, with which it shares the number of concentrated pressures drops, the difference is that the passage section in the first case is greater than the variable section geometry, with thicknesses of 5 and 3 mm, respectively. Geometry 2 shows head losses in the duct that are also greater than Geometry 1 for the same reason, and is linked to the average flow rate of the fluid inside the duct.
In thermal terms, it is noted that the duct that allows the lowest possible operating temperatures to be reached is that of Geometry 1. The reasons for the best heat exchange between the fluid and busbar derive from the same causes that generate the pressure drops in the ducts, that is, flow separation and turbulence generation. These turbulent phenomena cause concentrated hydraulic pressure losses, a negative effect for the sizing of the hydraulic circuit; on the other hand, they allow for the mixing of the fluid particles, improving their heat exchange.
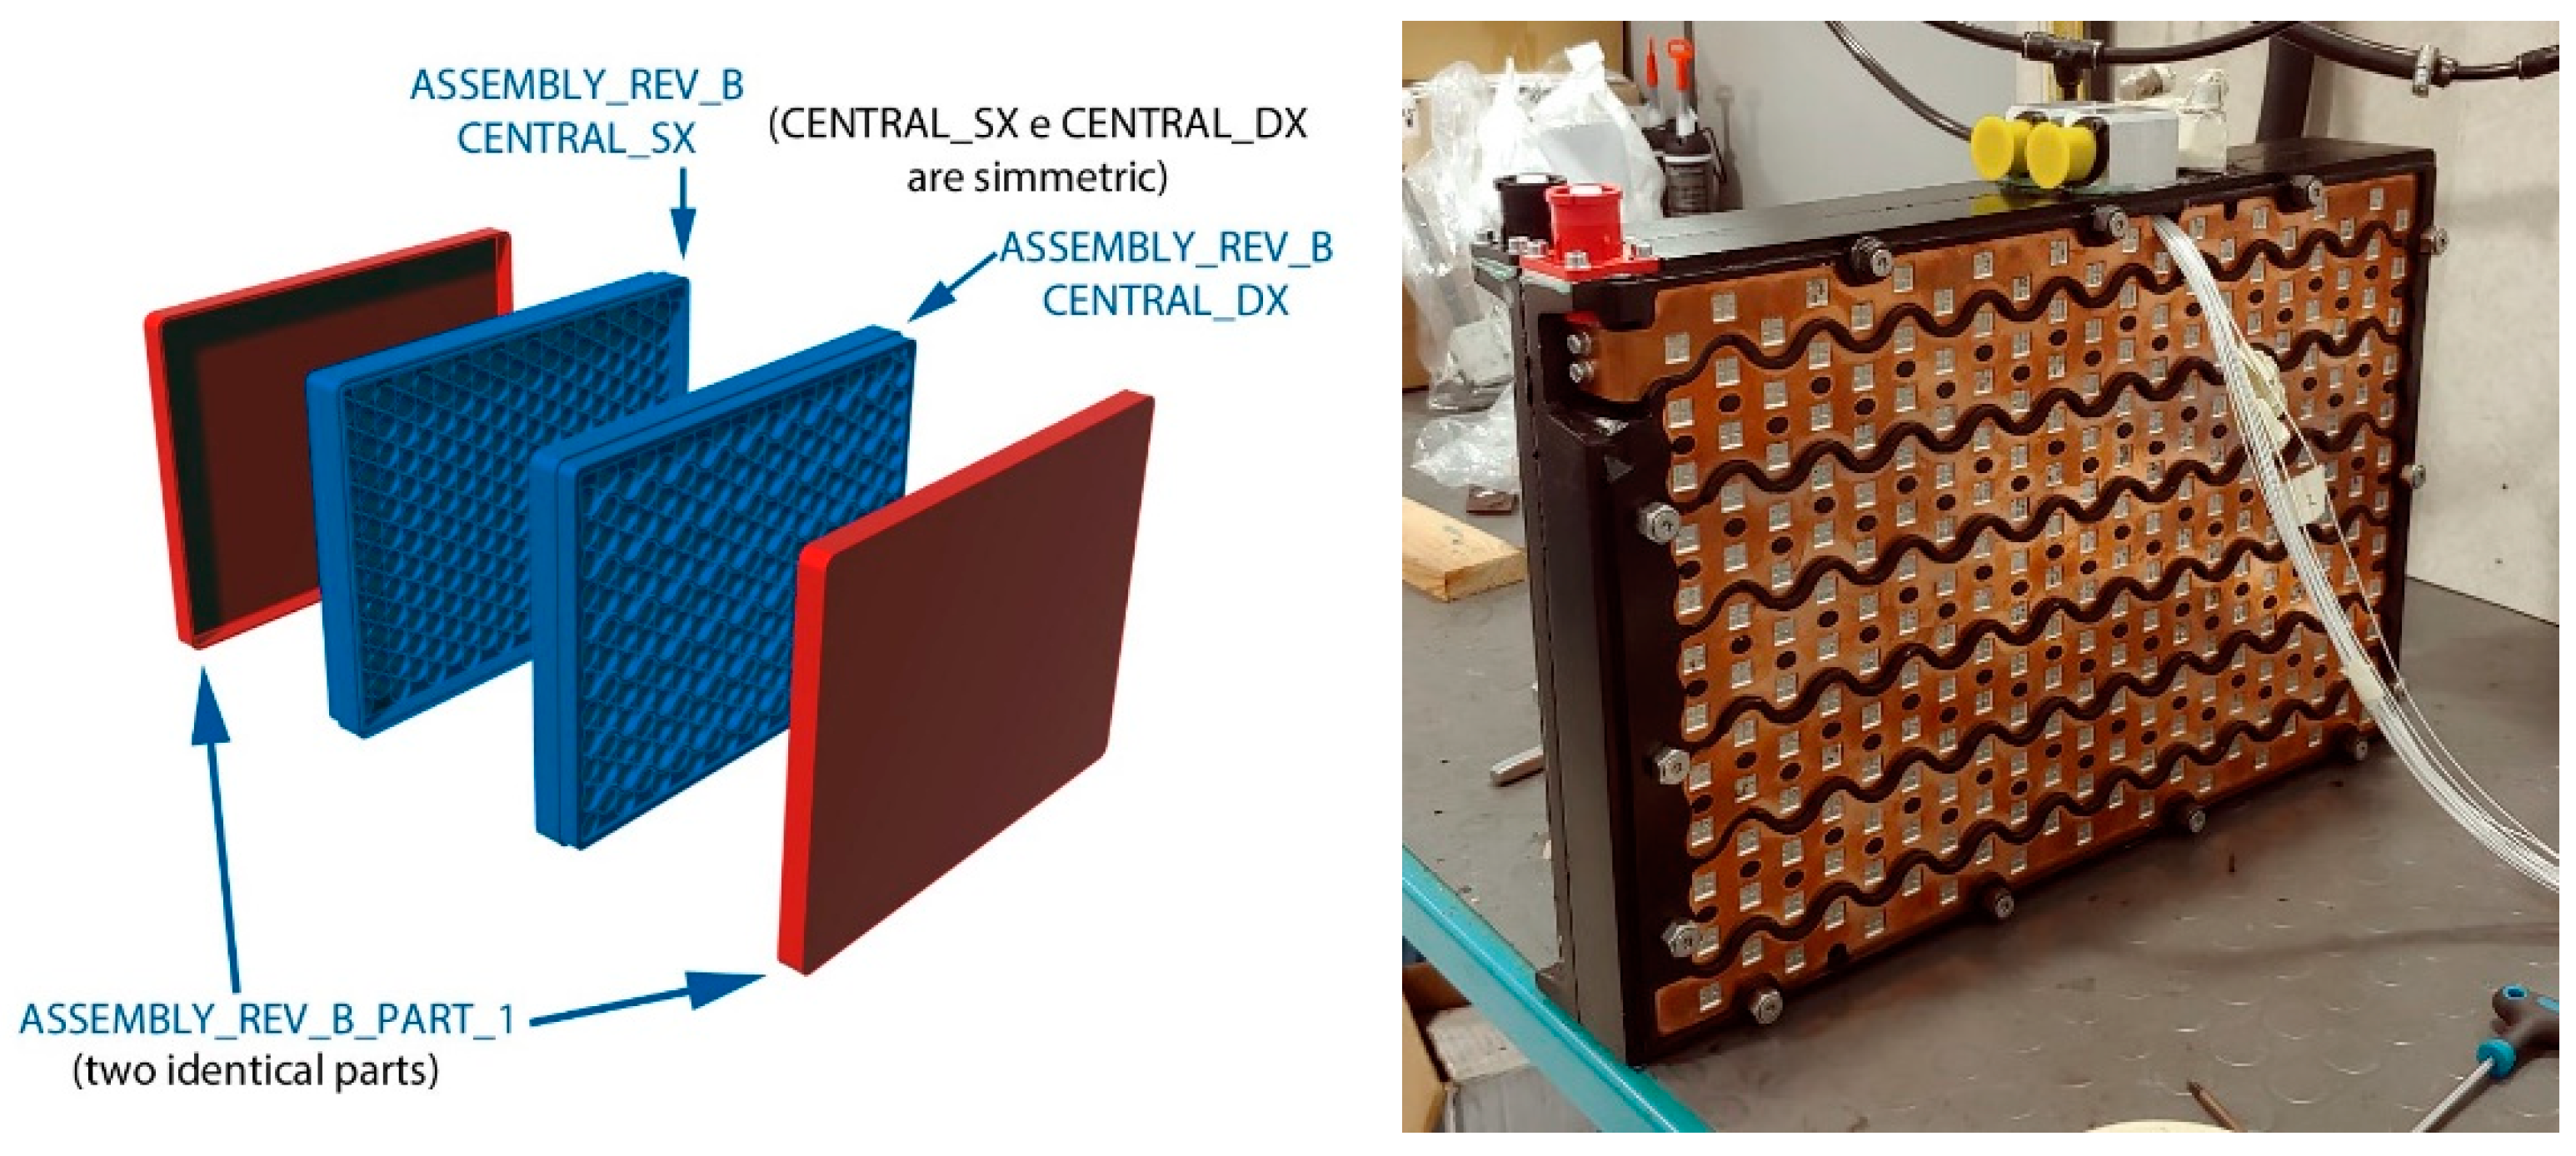
The first objective of sizing the battery pack was to reduce the operating temperature of the cells as much as possible to extend their life; the geometry that was chosen as the most performing is Geometry 1. In
Figure 11, the 3D CAD design and the first prototype of the battery module are reported.
8. Simulation and Experimental Validation of Single Module Cooling System
In conclusion of this study, it is interesting to calculate and verify the dynamic response of the cooling system as a function of the behavior of the hybrid powertrain. As mentioned in previous paragraphs, it was decided to subject the system to a very demanding test from a performance and thermal point of view; the chosen testing cycle consists of use of the discharge current profile, which was calculated by the vehicle simulation model during the 0–200 km/h test in hybrid mode. With this current profile, a test made up by a repeated series of 0–200 km/h accelerations in hybrid mode followed by 200–0 km/h deceleration without regenerative braking has been constructed. The discharge current profile so calculated, with a series of accelerations and decelerations carried out at maximum power, was stopped when the cell temperature reaches 60 °C. The objective was to determine the maximum number of acceleration cycles the vehicle is able to sustain before the cells reach the maximum permissible temperature. The study was conducted as follows. The vehicle simulation model has been used to determine the current-release profile of the battery pack during acceleration from 0 to 200 km/h in order to establish its thermal power release (see
Figure 7 and
Table 3). Then, the thermo-fluid-dynamic model of the single battery module was used to calculate the rising of cell temperature with a fixed fluid flow rate. Finally, the same test has been performed experimentally on a single module with an electronic load. With the chosen current profile and the cells’ thermodynamic data, it is possible to evaluate the heat production in terms of the Joule effect. The total energy released by the module during acceleration 0 ÷ 200 km/h is about 18.5 kJ in 8 s, as reported in
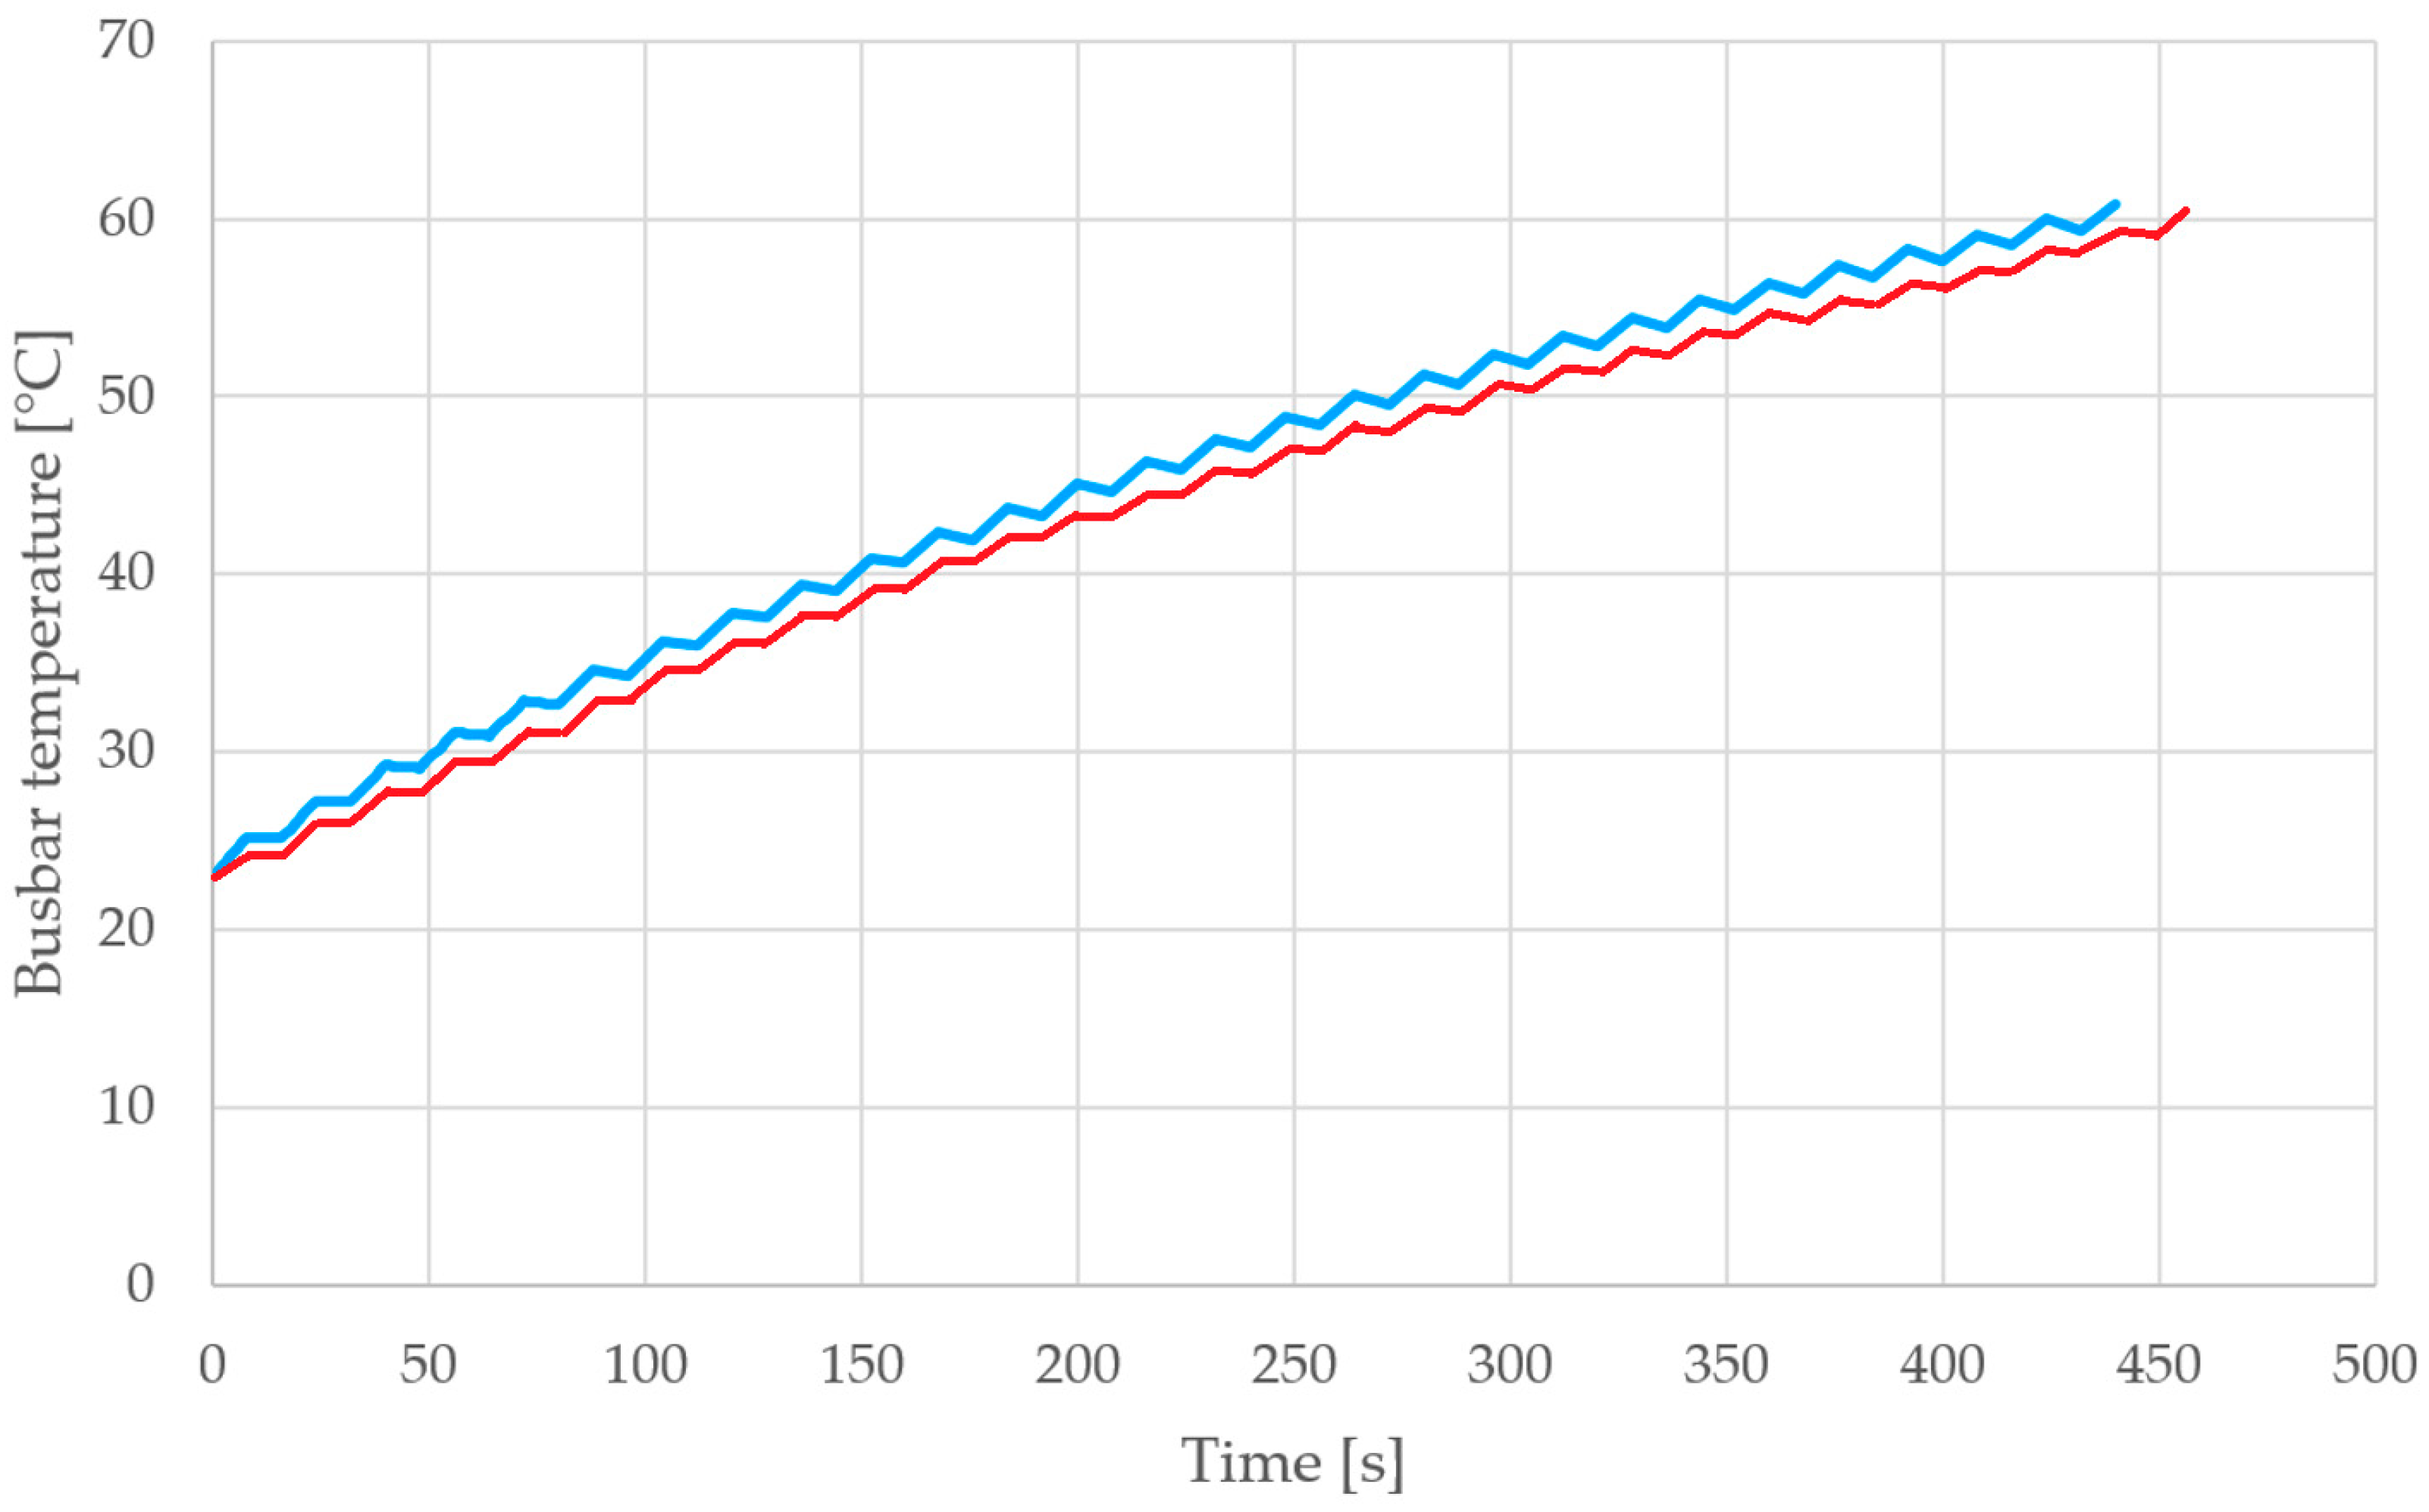
Table 8. Indicatively, this is equivalent to an average heat output of 2.3 kW. This average power corresponds to an equivalent average discharge current of 40.1 A for each cell. With these data it is possible to evaluate the behavior of the battery pack using the ANSYS Fluent CFD model of the single module 12s8p. In this specific simulation, it was not possible to use the operating condition in steady state; in this case, a mesh was used with the cells in the form of a solid parallelepiped, in which a volumetric heat source capable of carrying out the power of 2.3 kW was provided. The simulations were conducted by imposing the presence of the volumetric source by means of a square wave function with a period of 16 s, eight being used for the acceleration phase, and therefore with the presence of heat release, and eight being used for the deceleration phase up to zero speed. The fluid enters the cooling ducts at a temperature of 10 °C and a flow rate of 3 liter/min, the maximum flow rate allowed by the supply hydraulic system. The battery pack was able to withstand 27 acceleration/deceleration cycles 0 ÷ 200 ÷ 0 km/h before exceeding, in the 28th cycle, the maximum accepted operating temperature of 60 °C.
This CFD simulation has been validated experimentally with the single module of
Figure 11 using an electronic load with low voltage (maximum 80 V) and high current (maximum 500 A) capabilities. The measurement chain was equipped with a BMS capable of measuring the voltage and temperature of each parallel (for a total of 12 cell parallels), and a cooling system with a recirculation pump, which was capable of extracting up to 2.5 kW of thermal power and circulating the cooling fluid with a flow rate of up to 0.5 liters/s. In this way, it was possible to reproduce the case studied in the CFD simulation, with the circulation velocities in the module’s ducts being equal to 3 m/s and repeated discharge currents obtained from
Table 8.
Figure 12 shows, superimposed, the results of the CFD simulation, in blue color, and the bench experiment, in red color. The CFD simulation, due to the under-estimation of the terminal inertia of the cells and the module material (ABS UL94-V0), reports a slightly faster heating, whereas in the experimentation the process is slightly slower.
9. Conclusions
The aim of the study presented here was to define an initial dimensioning and experimental verification of an innovative direct liquid cooling system for lithium cells in automotive battery pack modules.
In order to arrive at the testing of the system, a simulation model of the entire vehicle for which the innovative system is intended, a high-performance car with a four-wheel-drive plug-in parallel hybrid propulsion system, was first realized. The vehicle simulation model was used to calculate a very demanding battery pack discharge current profile to be used for subsequent analysis and experimental testing. The case taken to derive this discharge current profile was a 0–200 km/h acceleration test at maximum power in hybrid mode repeated in succession.
We then went on to define how heat is released from the lithium cells that make up the battery pack and the equations that allow for the calculation of the thermal power produced by the cells during the charge and discharge phases.
Subsequently, the outline design of the battery pack was defined, with 25 kWh of energy at nominal voltage and 700 V nominal voltage; the pack, with a 12s8p electrical layout, is composed of parallels of 8 Molicel P42A cylindrical cells, size 2100; each module consists of 12 parallels arranged in series, and the complete pack has 16 modules in series.
Once the general characteristics of the battery pack had been defined, we proceeded to define the liquid cooling mode, analyzing from both a hydraulic and thermal point of view, three different possible configurations of the cooling ducts in the individual module. The general cooling system involves the parallel arrangement of the hydraulic circuits of each module. In this way, each individual module benefits from the same thermodynamic conditions of the cooling liquid and, ultimately, the simulation and testing of the thermal behavior of an individual module is thus representative of the behavior of the entire battery pack. Thus, the design study of the cooling system of each individual module was carried out, in order to guarantee the correct operating conditions in terms of the operating temperature. The theoretical model used to carry out the study was described and the results of different construction solutions, obtained using the ANSYS Fluent software, were compared. Once the best performing geometry was chosen, the performance of the system was compared in terms of the maximum temperature reached by the cells and pressure losses within the circuit itself. The thermo-fluid dynamics simulations performed using the ANSYS Fluent software led to results in line with the theoretical evaluation of the same.
In order to validate the simulations performed, both the CFD simulation model and a single prototype module were subjected to the same discharge current profile; the highly demanding discharge current profile obtained with the simulation model of the entire vehicle and battery pack was then used. The single module, being the 16 modules electrically arranged in series, supplies the current of the entire battery pack, and it is therefore possible to use this current profile to simulate and experimentally determine the behavior of the module and of the cooling system.
The final results, shown in
Figure 12, demonstrate the reliability of the simulation model created and the results obtained for the innovative cooling system are promising. The system, based on the direct liquid cooling of the battery poles, has shown excellent performance and it is therefore possible to proceed with further optimizations of other possible geometries of the cooling channels. The possibility of experimenting with liquids with different characteristics is also very interesting.
In conclusion, a reliable design process is now available, and the first results of considerable interest have been obtained about the potential of the proposed system.


