Article

Development of Design Method for River Water Source Heat Pump System Using an Optimization Algorithm

Department of Architectural Engineering, Pusan National University, 2 Busandaehak-ro 63, Geomjeong-gu, Busan 46241, Korea
*
Author to whom correspondence should be addressed.
Energies 2022, 15(11), 4019; https://doi.org/10.3390/en15114019
Submission received: 22 April 2022 / Revised: 21 May 2022 / Accepted: 27 May 2022 / Published: 30 May 2022

Abstract

:
River water source heat pump (RWSHP) systems are being proposed to reduce the energy consumption and carbon emissions of buildings. The RWSHP system is actively applied to large-scale buildings due to its stable performance. The application of RWSHP in large-scale facilities requires an accurate capacity design with considerations of building load, heat source, and environment conditions. However, most RWSHP systems are over-designed based on peak load of buildings. These design methods, based on peak loads, are economically and environmentally disadvantageous. Therefore, this paper aims to development an optimal design method, both economically and environmentally, for the RWSHP system. To develop this optimal design method, a simulation model was created with an optimization algorithm. The economics of the RWSHP system were calculated bases on present worth of annuity factor. Moreover, CO2 emissions were estimated using the life cycle climate performance proposed by the International Institute of Refrigeration. The total cost of the proposed RWSHP system that apply the optimum design method decreased by 24% compared to conventional RWSHP systems. Moreover, CO2 emissions of the proposed RWSHP system reduced by 4% compared to conventional RWSHP systems.

1. Introduction

According to the International Energy Agency (IEA) report of 2019, energy consumption in the building sector accounts for approximately 35% of the total energy consumption [1]. Carbon dioxide emissions in the construction sector accounts for 38% of the total carbon dioxide emissions [1]. Furthermore, electricity consumption in building operations accounts for approximately 55% of the global electricity consumption [1]. Therefore, reducing the energy consumption and carbon dioxide emissions in the construction sector is of vital importance. Renewable energy can be used to address this issue since they can lead to a reduction in fossil fuel usage, energy consumption generated from fossil fuels, and greenhouse gas (GHG) emissions. However, stable power generation from renewable energy sources cannot be guaranteed and are greatly affected by the climate. Therefore, to resolve this challenge technology is required that increases the power generation efficiency of renewable energy or ensures its stability. As of 2019, energy production from waste, biomass, and solar energy accounts for more than 80% of renewable energy production in South Korea. This implies that there is a low production of geothermal, hydrothermal, and solar heat using temperature differential energy [2]. Therefore, it is necessary to investigate the performance and efficiency of temperature differential energy systems.
A natural water source heat pump (NWSHP) system uses river, sea, pond, and other water sources for renewable energy systems, is a technology that performs heating and cooling using temperature difference energy. NWSHP offers excellent performance and efficiency due to its abundant heat source, compared to the ambient temperature, which uses low and high-temperature heat sources during the cooling and heating seasons, respectively. However, a NWSHP system requires the additional installation of an intake facility and water pipe installations that can result in increased total installation costs. In addition, substantial initial investment costs may be required for large-capacity building that are based on the existing maximum load design method and incorporating the RWSHP system due to overcapacity.
NWSHP systems have been actively researched, alongside the expansion in their application, with a particular focus on system demonstration and performance prediction. Cho and Yun [3] investigated the heating and cooling performance of a heat pump (HP) using the heat energy of raw water supplied to a water treatment facility. In this study, the system performance was confirmed to decrease due to the load reductions resulting from seasonal changes. Zheng et al. [4] investigated the system efficiency of seawater source heat pump systems in areas experiencing severely cold winters. The results of the study indicated that the beach well infiltration intake systems for the seawater source heat pump system had the highest thermal performance during the entire heating season in areas of severely cold winters. Wang et al. [5] proposed a new type of groundwater-source system with a fresh air pre-conditioner. This system ensures low-grade energy stored in ground water is maximally used to reduce the energy consumption of the entire HP system and buildings. Jung et al. [6] comprehensively analyzed the NWSHP system feasibility by evaluating its performance after estimating the thermal energy of river water. The potential was measured by calculating the thermal energy of river water after measuring the water temperature and flow rate. Jung et al. [7] analyzed the NWSHP system performance, environmental impact, and economic feasibility in consideration of the following three variables: building type, water source, and intake distance. Oh et al. [8] reported on a raw-water source heat pump for a thermal storage tank in a vertical water treatment building that was dynamically simulated by TRNSYS. The condensing temperature of the HP, and heating and cooling load changes, according to the heat storage tank (HST) size, confirmed that an optimal size for the heat storage tank existed.
However, most of research focused on the HP and system performances rather than building loads and design conditions. Few studies have investigated the optimum design of an RWSHP system with real-world building applications. Therefore, the building conditions, loading, and system capacity calculation method are required when designing the system. Generally, the system capacity is determined by the building peak load with consideration to climate and standard building design conditions. This causes inefficient performance during seasonal changes and partial load conditions. In addition, conventional design methods result in system overdesign and energy overconsumption, which increases the total investment cost and CO2 emissions. Therefore, the need for strategies to reduce both total investment costs and emissions, while actively reducing energy demands in the built environment have been emphasized. High-efficiency equipment must be used to save energy and reduce total investment costs and greenhouse gas emissions. However, the maximum energy saving effects cannot be solely achieved by using high-efficiency equipment. Therefore, an optimized design for a system considering energy production, economic, and environmental impacts is required.
Furthermore, several studies have been conducted on system optimization to prevent excessive energy consumption and reduce CO2 emissions through optimization factors such as system design and operation. Du et al. [9] performed an area optimization for solar collectors in a combined solar heating system to minimize the unit cost of adsorption desalination. They investigated the influence of the auxiliary energy source prices, adsorption desalination performance ratios, and heat loss of solar heating on the optimization results. Mi et al. [10] performed a study on the optimization of a hot water supply system for public baths using a multi-heat source system combined with solar heat and a NWSHP. Comprehensive energy efficiency and economic evaluations were conducted on the model to reduce the total cost. Furthermore, Moon et al. [11] conducted a study on the optimal design method of ground source heat pump (GSHP) using an optimization method. Life cycle cost (LCC) analysis was performed on the initial and operating investment costs for 10 and 20 years, assuming that the optimal system design elements were HP, ground heat exchanger, and HST. Based on these analysis results, the three algorithms were confirmed to reduce the GSHP system costs in comparison with the existing design. Guo et al. [12] presented a method for designing a HST for a heating system using a NWSHP that incorporated solar heat as the auxiliary heat source. The analysis results confirmed that the HST volume could increase the energy saving rate of the system by 34.39%, and the optimum design for the HST volume was required to improve the system performance. Liu et al. [13] proposed an optimization model that could simultaneously optimize the system configuration, equipment capacity, and operating parameters for a multi-source complementary heating system. The results indicated that the LCC of the optimal mentary heating system based on air source heat pump could be reduced by 26.8%, whereas the seasonal coefficient of performance (COP) could be increased by 398.8%, compared to coal-fired boiler heating system. In addition, zero CO2 emissions could be achieved during the operation of mentary heating system based on air source heat pump. Table 1 shows the previous studies regarding optimization of energy system.
The previous studies investigating optimization focused on improving performance and economic efficiency by optimizing system variables. Recent studies have been conducted on measures to reduce CO2 emissions or GHG, whereas studies on the reduction of these factors by optimization or the optimization of new and renewable energy systems with regards to building loads are lacking. Therefore, changes in performance, economic feasibility, and CO2 emissions must be analyzed by optimizing the system capacity in consideration of building loads.
In this study, a design method using an optimum algorithm was developed to suitably design an HP system with river water as the heat source. The capacity of the RWSHP system applied to a large-scale building was calculated using the Hooke–Jeeves algorithm for efficient capacity design with regards to LCC. Furthermore, the environmental impact was evaluated and compared to the developed and conventional methods. For economic evaluation, the present worth of annuity factor (PWAF) analysis method was used and CO2 emissions were calculated using the life cycle climate performance (LCCP) analysis method proposed by the International Institute of Refrigeration (IIR) [14]. The results of this study could be a fundamental source for the suitable design of NWSHP systems. Moreover, this study makes a novel contribution to literature on low-cost and low-emission technology of NWSHP systems for large-scale buildings.

2. Materials and Methods

2.1. Natural Water Source Heat Pump System

Figure 1 shows a schematic of the NWSHP system. The NWSHP system uses heat sources such as river, sea, and pond water, and raw-water pipes. The system executes a heat exchanger using a water heat source that is more efficient than ambient temperature to heat and cool buildings. Heat exchange was performed by the heat exchanger using the water heat source from the intake pipe to conduct the heating/cooling throughout the building by an HP with a fan coil unit (FCU), radiant panel, and other equipment.
The investigation results of international cases of NWSHP are as follows:
  • The Lotte World Tower in South Korea uses raw-water pipes for heating and cooling; approximately 10–20% of the heating and cooling energy is managed by the 3000-RT NWSHP system that saves approximately 700 million in energy cost annually [15].
  • Cooling and heating are conducted to office buildings and 100 houses of approximately 278,000 m2 in a district located in Hakozaki, Japan using river water. The river water originates from the Sumida River, which is characterized by average temperatures of approximately 25 and 8 °C in summer and winter, respectively [15].
  • Cornell University in the USA developed and utilized a 20000-RT cooling and heating system using pond water with a temperature range of 5–13 °C at a depth of 76 m that reduces the energy consumption by approximately 80% [16].
These international cases confirmed that buildings have been designed to respond to the peak load or that a certain amount of heating and cooling energy can be supplied by NWSHP systems. In other words, the optimum capacity design corresponding to the building load was not achieved.

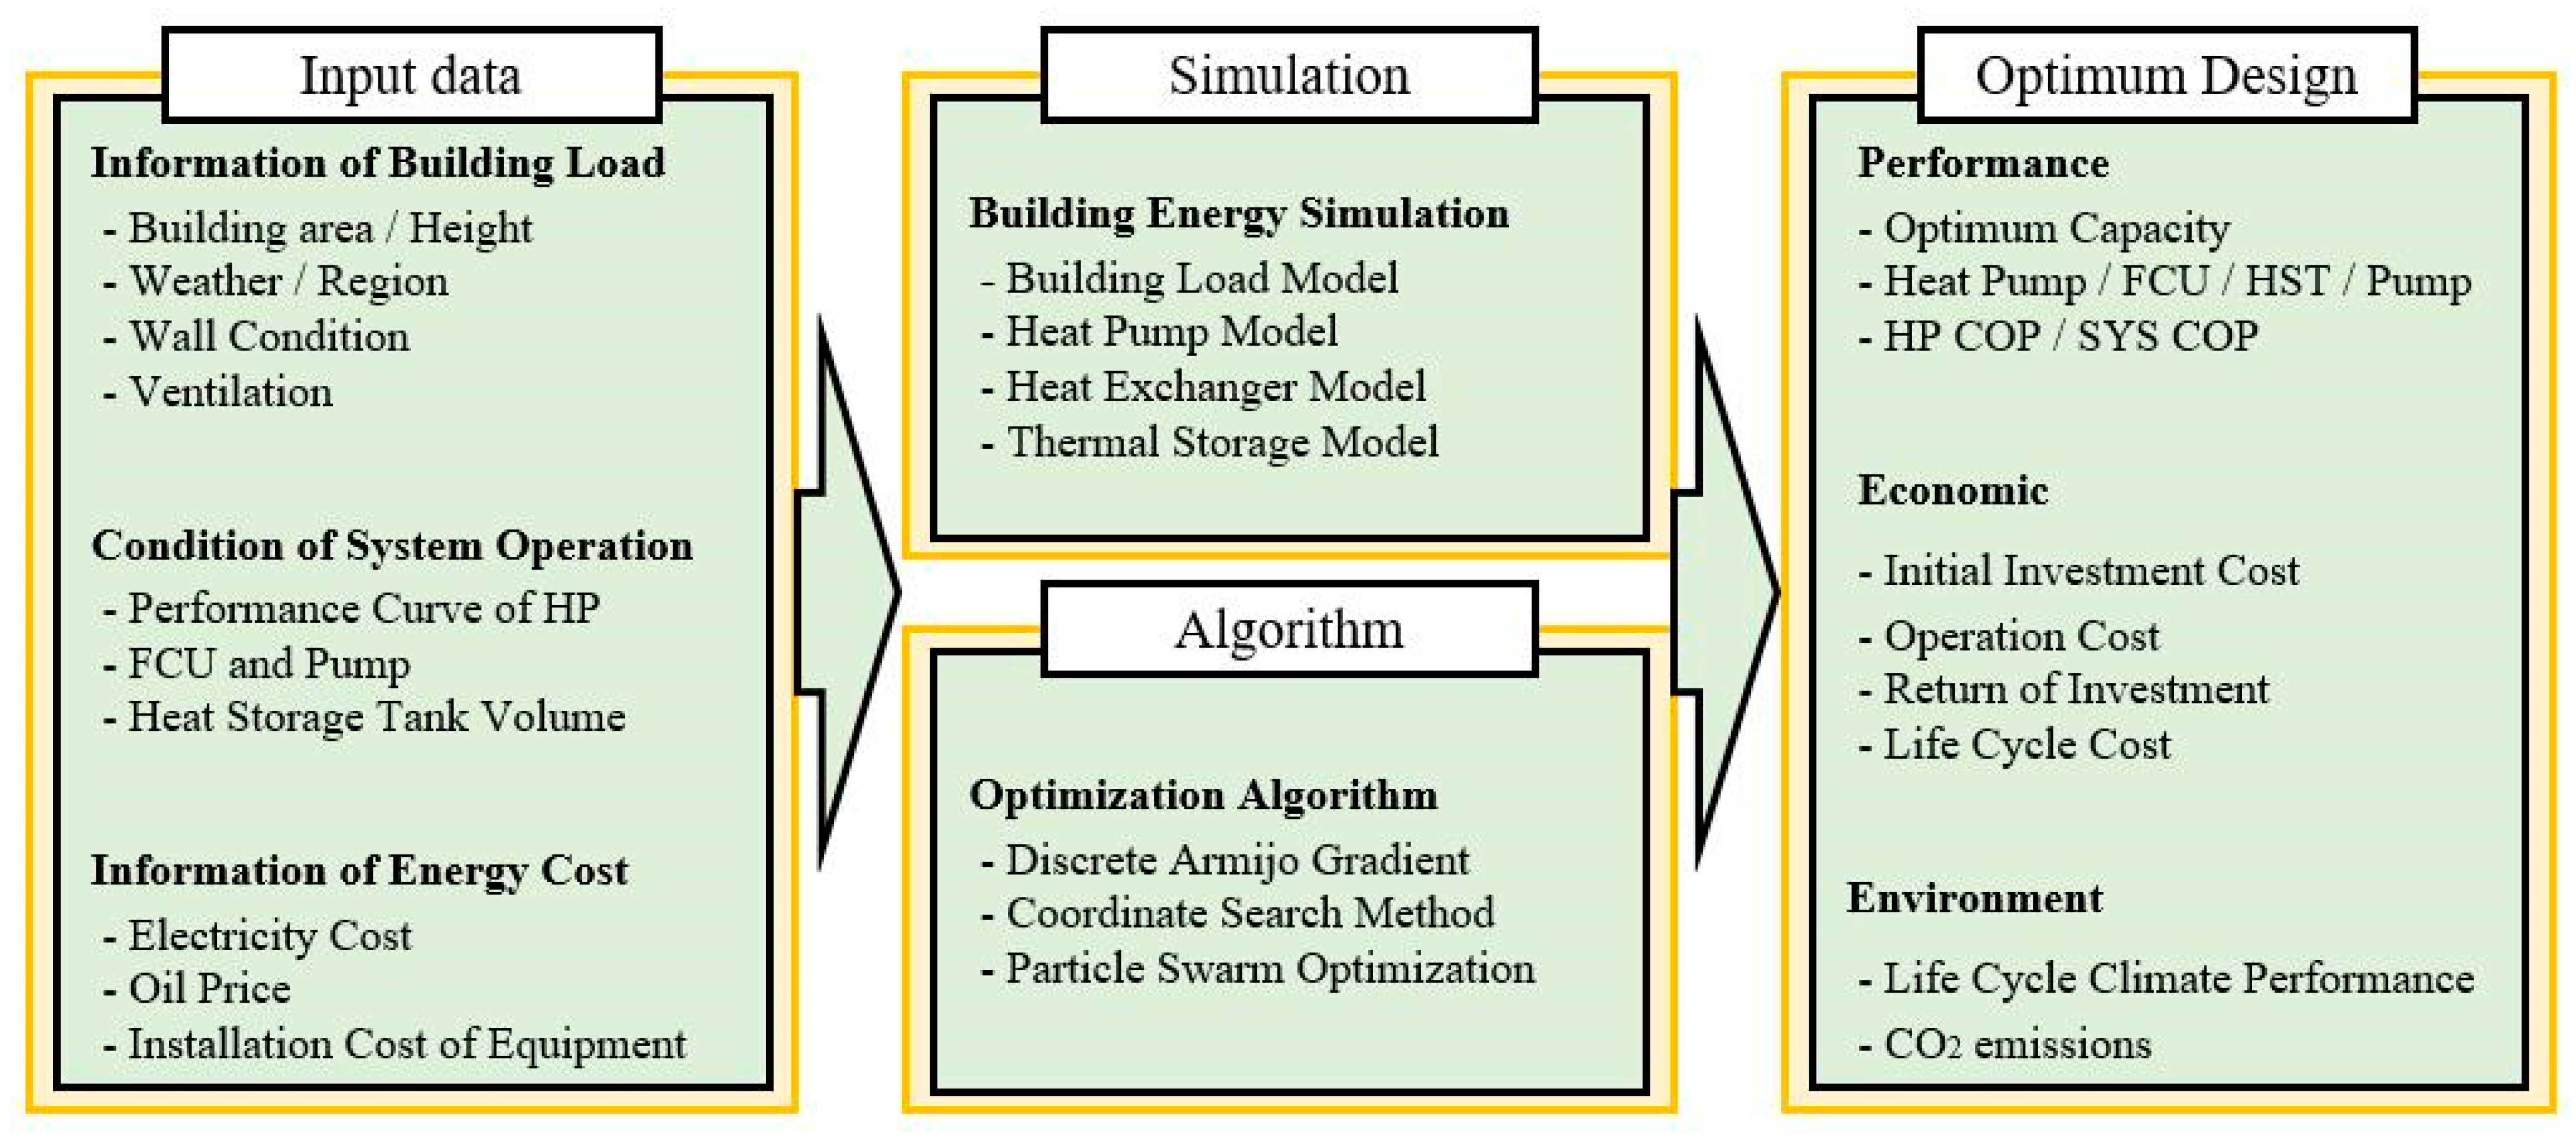
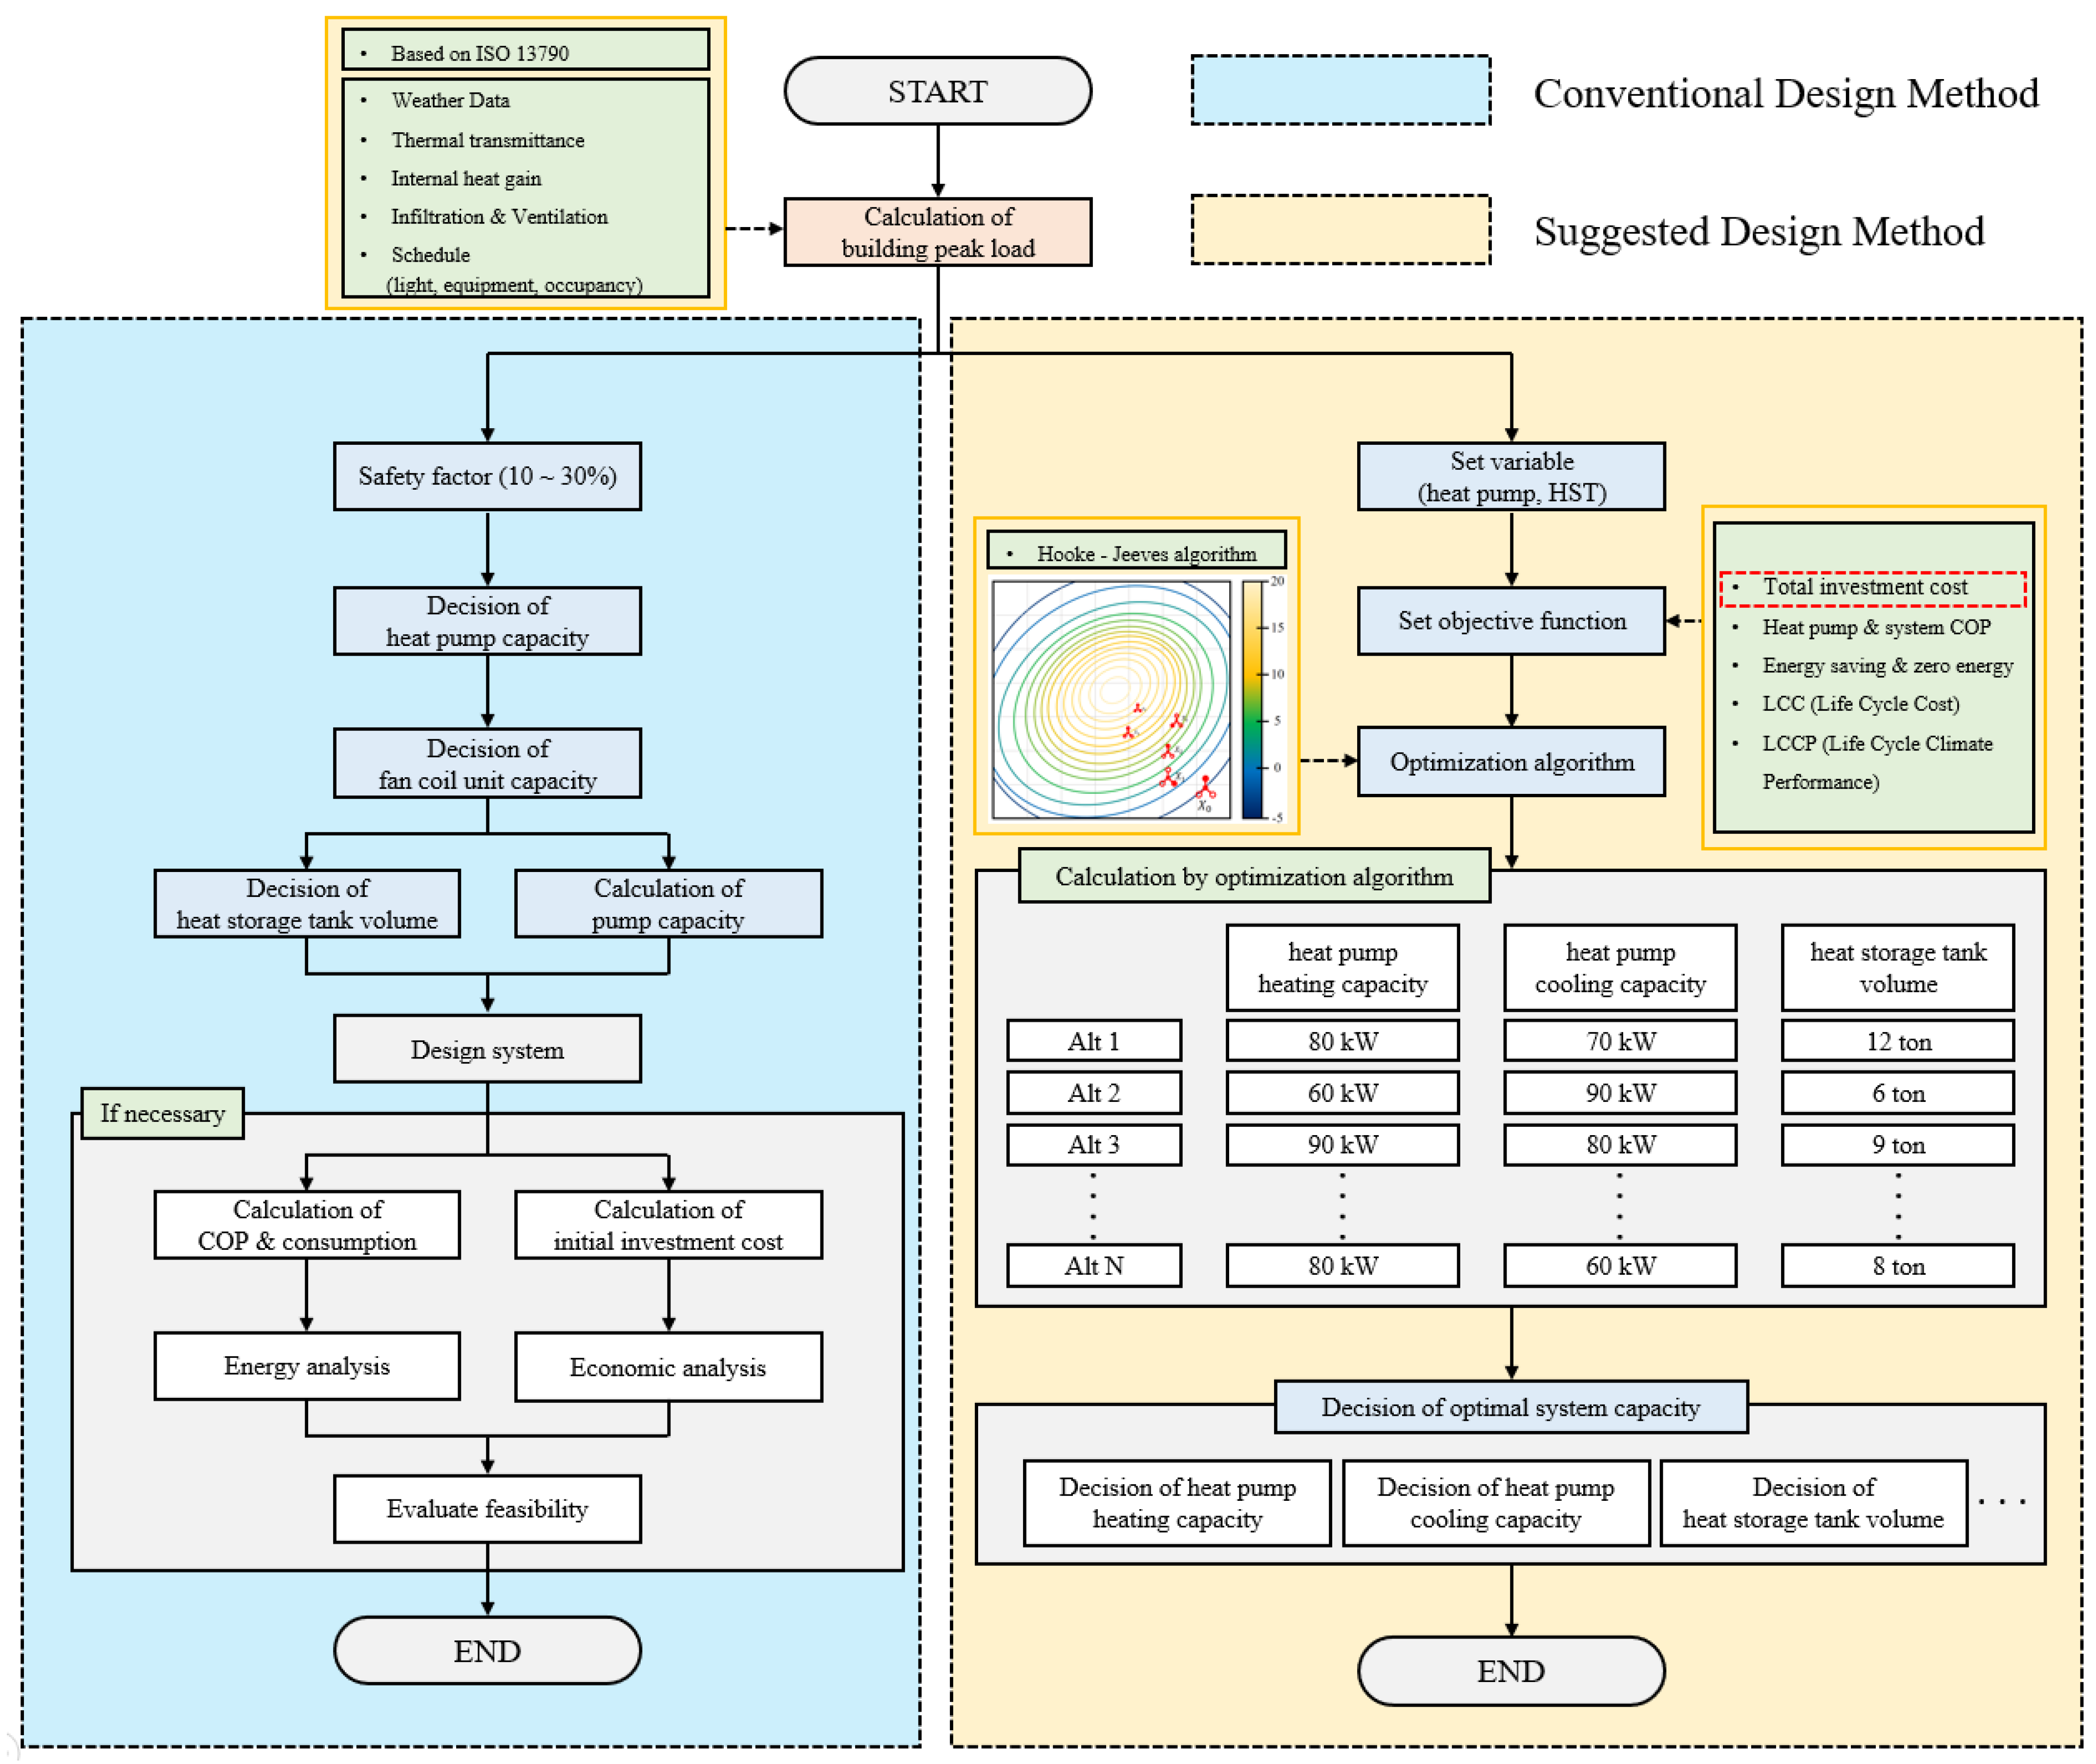
2.2. Research Method

In this study, an optimum capacity design method was proposed for the introduction of an RWSHP system. A comparative analysis was performed using existing design methodology. For comparison, an RWSHP system was built using a dynamic simulation and an optimal design was performed using an algorithm. Figure 2 shows the proposed design method simultaneously using energy simulation and the optimization algorithm. The input data included building and system operating conditions, and cost information. These were used to calculate the peak load and initial investment cost of the building according to the existing design method. The RWSHP system was created using a dynamic energy simulation, and thereafter an objective function was designated according to the designer’s purpose by an algorithm to optimize the system performance, economic feasibility, and environmental impact. The calculated results indicated the optimized capacity of system components, system performance, economics, and CO2 emissions; the optimal system capacity could be altered according to the objective function.
Figure 3 shows the flow chart of the existing and proposed design methods. The existing design method determined the capacity of the equipment required for the system by considering the safety factor after analyzing the building peak loads. If necessary, the feasibility analysis was then performed using performance or economic analyses. The existing design method was intended to respond to the building peak loads. However, this can result in excessive energy consumption and GHG emission increase, and has an added disadvantage of high initial investment costs since a system with excessive capacity operates with season changes and partial loads.
The design method proposed in this study analyzes the building peak loads similarly to the existing design method, and thereafter determines the equipment capacity required by the system by considering the safety factors. The reduction in total investment cost, increase in system performance, or reduction in CO2 emissions were then designated as objective functions. The design was performed by calculating the optimal HP and HST capacities for the objective function by applying a suitable algorithm to the objective function.
As a result, the proposed optimal design method employed an appropriate system capacity to respond to the designer’s objectives by specifying an objective function design, rather than considering the maximum load and safety factor. That is, the proposed method offsets the challenges associated with the existing design method that considers the safety factor to improve the total investment cost and CO2 reduction.

3. Simulation Model

3.1. Building Load Model

In this study, large offices in Busan, South Korea, were selected as target buildings for the RWSHP system, assuming that the entire building would be heated and cooled by the RWSHP system. The building load model was established based on the large-scale office model provided by the Pacific Northwest National Laboratory (PNNL) [17]. Figure 4 shows the shape and size of the large-scale office building.
The specifications of the building load model are listed in Table 2. Busan, South Korea, was assumed to be the geographical region and the associated weather data were input. The indoor setpoint temperatures for the heating and cooling periods were set to 21 and 24 °C, respectively. Infiltration was set according to the infiltration calculation method of the American Society of Heating, Refrigeration and Air-conditioning Engineers (ASHRAE) 90.1 [18].
The heating season was set at eight months from January to May and October to December, and the cooling season was set at four months from June to September. The lighting, equipment, and occupancy schedules were divided into weekdays, Saturdays, and Sundays [19].
The internal heat gains of lighting and equipment were calculated based on ASHRAE 90.1-2004. The quantity of heat generated by lighting and the device were set at 11.84 and 8.07 W/m2, respectively [19]. Furthermore, the internal heat gains of the human body were calculated based on the quantity of heat generated by the occupants while typing lightly [20]; the total number of occupants was presumed to be 192, calculated as one person per 18.5 m2 [21].
The thermal conductivities of the walls, roofs, windows, and floors were based on energy-saving design standards for buildings in South Korea [22].
Figure 5 shows the set-point temperature boundary, ambient temperature, and monthly building loads in Busan, South Korea. The load analysis was conducted on the first floor, which had the largest heating and cooling loads. The load analysis results indicated that the heating load was dominant in comparison with the cooling load. The heating and cooling peak loads of the building were calculated as 45 and 35 kW, respectively.

3.2. Dynamic Energy Simulation

Figure 6 shows a schematic of the RWSHP system designed in this study. The input and output elements, and values calculated by the simulation are indicated. The system configuration was based on the schematic. The system components consisted of a heat exchanger, water-to-water HP, HST, FCU, pump, and large-scale office building; the capacity of each system device was designed by considering the peak load and performance curve of the building. The components and values of the constructed RWSHP system are listed in Table 3.
The HP capacity was obtained by adding a safety factor of 20% to the building peak load. The HP power consumption was set by referring to the water-to-water HP of the climate master [23]. The hot water supply load was not considered for HST, and the FCU was set by adding a safety factor of 20% to the HP capacity. The volumetric air flow rate and power consumption of the FCU were set by referring to Carrier’s ceiling-type FCU [24]. The pump was set within the appropriate flow rate range specified by ASHRAE [25]. The validity of the numerical analysis model was confirmed in previous study by comparing the simulation and experimental results [26].

3.3. System Operation Method

Figure 7 shows the operational logic of the simulation. During the heating season, the operation was stopped when the temperature of the water intake was 2 °C or less, and when the temperature of the drain river water was 0 °C or less, the freezing of the heat exchanger due to the heat source was considered. Thereafter, the HP was set to operate to maintain the set point temperature (50 °C) of the HST that sent circulating water to the FCU for heating. In contrast, during the cooling season, the effect of the heat source was not considered. Therefore, the HP was set to operate to maintain the set point temperature (12 °C) of the HST that sent circulating water to the FCU to perform cooling.

3.4. Optimization Algorithm

In this study, optimization was performed using Hooke–Jeeves algorithms; these are frequently used for facility design due to the optimum capacity design, ability to incorporate multiple variables, and fast calculation time. Figure 8 shows the calculation method of the Hooke–Jeeves algorithms and the actual optimization process according to the objective function.
The objective function of optimization is a function of the total investment cost. The HP cooling and heating capacities and HST volume, which significantly affect the initial investment and annual operation costs, were set as the optimization variables for the function formula. The total investment cost was calculated from the initial investment cost that consisted of the HP and HST equipment, and operational costs over 20 years. The function is expressed as:
Objective   function ,   f ( x ) = Initial   investment   cost + 20   years   of   operational   costs
The Hooke–Jeeves algorithm is a pattern search method that solves the nonlinear optimization problem. As shown in the optimization process, this method determines the optimal value by finding the point that best fits the objective function among neighboring points from the initial value. This is repeated until a point is found to fit the objective function [11,27].

3.5. Optimization Conditions

The minimum, maximum, and step values of the optimization variables used in the algorithm are listed in Table 4. The maximum and minimum values of the HP heating and cooling capacity were presumed to be 50% and 200%, respectively, calculated by the existing design method. In the case of HST, 10% and 200% of the volume calculated by the existing design method were presumed. The parameter values (power consumption of the pump, flow rate, etc.) changed according to the change in capacity of HP and HST, which were altered by linear/nonlinear equations.
For the optimization constraint during the heating/cooling season, an error was set to occur when it deviated significantly from the normal leaving water temperature (LWT) range of HP. In addition, an error was set to occur when 300 h was exceeded, based on the unmet load hour of ASHRAE 90.1-2004 [19].

3.6. Economic Analysis

The initial investment and operation costs over 20 years were calculated for the economic analysis. Table 5 lists the prices used to calculate the initial investment and annual operational costs of HP and HST. The equipment costs of HP and HST, which correspond to the initial investment cost, were set according to the Korean online e-procurement system [28]. The annual operational cost was calculated by multiplying the electricity consumption by the electricity rate per kW, and the operational cost over 20 years was calculated using the PWAF method. The cost of electricity was determined from the electricity rate data obtained from the Korea Electric Power Corporation [29]. However, the costs for the secondary load and facility construction, which were the same as those of the existing design method, were excluded.
Based on the price information above, the calculation was performed using the following formula:
C HP = C HP Price   per   kW   ×   Heat   pump   capacity
C HST   = C HST Price   per   cubic   meter   ×   Heat   storage   tank   volume
C Year Operation = i = 1 12 C Month Operation ( i )
C HP = C HP Price   per   kW   ×   Heat   pump   capacity
P W A F n = ( 1 + i ) n 1 i ( 1 + i ) n
C 20   years Operation   Cos t = C 0   Year Operation + C 1   Year Operation × P W A F 1 + C 2   Years Operation × P W A F 2 + + C 20   Years Operation × P W A F 20
Total   Cos t ,   f ( x ) = C HP + C HST + C 20   Years Operation   cos t

3.7. Life Cycle Climate Performance

In this study, an LCCP analysis was performed for the RWSHP system, which aspires for economy and low CO2 emissions. The HP CO2 emissions calculated by the existing design method and HP calculated by the optimum design method were compared using the actual HP model of the climate master [23]. The LCCP analysis method was classified into direct and indirect emissions, as provided by IIR. The direct emissions calculated the CO2 emissions based on the annual refrigerant leakage, refrigerant leakage during disposal, and equipment lifespan. The indirect emissions were calculated based on CO2 emissions during equipment manufacturing from the annual energy consumption, and from the refrigerant [14].
Life   Cycle   Climate   Performance = Direct   Emissions + Indirect   Emissions  
Direct   Emissions = C   ×   ( L × ALR + EOL ) × ( GWP + Adp . GWP )
Indirect   Emissions = L × AEC × EM + ( m × MM ) + ( mr × RM ) + C × ( 1 + L × ALR ) × RFM + C × ( 1 EOL ) × RFD  

4. Results and Discussion

4.1. Result of Optimization

Table 6 lists the optimization results obtained in this study. Figure 9 shows a comparison of the results. The comparison between the HP capacity and the existing design method is as follow. In the optimization design method, the cooling and heating capacities decreased by 25% and 22%, respectively. Further, the volume of HST decreased by 72% compared to the existing design method. The HP capacity decreased to an appropriate capacity rather that that corresponding to the peak building load. Moreover, the calculated capacity was suitable for performing the role of a buffer tank since the HST capacity did not consider the hot water supply load.
Figure 9 shows that the appropriate HP and HST capacities were calculated by the RWSHP system optimization using an algorithm; the unmet load hour was set at less than 300 h, and the feasibility of the results were verified. However, the change in climatic conditions were not considered, and thus the unmet load hour may exceed 300 h depending on the simulated climate. In addition, the simulation was conducted by assuming two constraints; however, the need to consider other variables, such as resident dissatisfaction and equipment overload, was confirmed.

4.2. Result of Energy Performance

Figure 10 shows the comparative analysis results between the energy performance of the system employing the existing and optimum capacity design methods. Since the HP and HST capacities were calculated to correspond to the peak loads in the existing design method, the existing method was confirmed to have a higher performance than the optimal capacity design method.
Based on the energy performance analysis results, the HP and system COP exhibited an average decrease of 3% and 5%, respectively, compared to the existing design method. Although the optimum method had a similar COP value for the performances of HP and system during the heating season, the HP and system COP of the conventional design method were the higher during the cooling season.
H P C O P = Q ˙ H P P ˙ H P
S y s t e m C O P = Q ˙ S y s t e m P ˙ S y s t e m  
The HP and system COP decrease when the equipment capacity is calculated using the optimal capacity design method. This decrease occurs since the maximum load design method reduces the operating time and frequency of operation as a result of the large equipment capacity, regardless of the system’s ability to accurately respond to the building loads. Although the optimal capacity design method is designed with an appropriate device capacity, the operation time and operation frequency must be increased compared to the existing design method to cope with the same load. In addition, when separated by heating and cooling periods, there is little difference in the performance during the heating period; however, there is a difference in performance during the cooling period. This is explained by the 20 or 5 °C differences between the heat source temperature and indoor set temperature during the heating or cooling periods, respectively. In the case of a large-capacity system during the cooling period, the power consumption reduces due to the low operation frequency, and thus the performance was excellent.

4.3. Result of Economic Analysis

The economic effects of the optimum capacity design method were analyzed. The results indicated that the existing design method had the most investment in both the initial investment and operation costs over a 20-year period. The total investment costs for the original and optimization cases are shown in Figure 11.
Table 7 shows the objective function of the initial and total investment costs, and the annual operation cost factors after optimization. Compared to the existing design method, the optimization case had an initial investment cost decrease of 59%, operational cost over 20 years decrease of 11%, and total cost decrease of 24%. Due to the reduction in the heating and cooling capacities of HP and HST volumes, the reduction effect of both the initial investment and operational costs over 20 years was confirmed.
In terms of initial investment cost, the heat storage tank had the highest price according to unit capacity. Since HST was used as a buffer tank and not for heat storage, the optimization of the HST volume was clearly observed. The volume optimization was a large influencing factor, whereas the decrease in the other factors was small. In terms of operating cost over 20 years, the system capacity and power consumption were large despite the low operating frequency of the existing design method. Although the operating cost over 20 years was considered, the operating cost of the optimal capacity design method could be lower for a period shorter than 20 years. However, the result has a limitation in that an economic evaluation was not conducted for all system components; an economic evaluation was only performed on the major factors of total investment costs.

4.4. Result of Life Cycle Climate Performance

An LCCP analysis of the optimum capacity design method was performed. The LCCP analysis was conducted by specifying the existing design method and HP of optimization case. The product was analyzed based on the water-to-water HP model of the climate master [23].
Table 8 lists the values used for LCCP. These were prepared by referring to the values in the IIR LCCP report [14]. The CO2 emission coefficient provided by the Korea Power Exchange was used for the CO2 emissions caused by electricity usage [29].
Figure 12 shows the LCCP analysis results. Based on the CO2 emission analysis, the existing and optimum design methods exhibited CO2 emissions of approximately 105,259,800 and 101,956,900 kg CO2e, respectively. Consequently, an approximately 4% CO2 emission reduction can be achieved by the optimal capacity design method. The optimal capacity design produced the greatest reduction in CO2 emissions from energy use. In addition, the CO2 emissions generated during equipment production decreased. Although all of the CO2 emissions produced by the system could not be considered, CO2 emissions were reduced by applying the optimal capacity design method.

5. Conclusions

In this study, a design method was developed to assess the system capacity using an optimum algorithm and considering LCC and LCCP. The comparison analysis was conducted between the existing and developed design methods for an RWSHP system. The validity of the optimal capacity design was verified by comparing annual simulation results. The study results are summarized as follows:
  • The initial investment and annual operation costs were reduced by 59% and 11%, respectively, by applying the optimization design method to the RWSHP system. The optimization design method decreased the total cost by 24% compared to the existing design method.
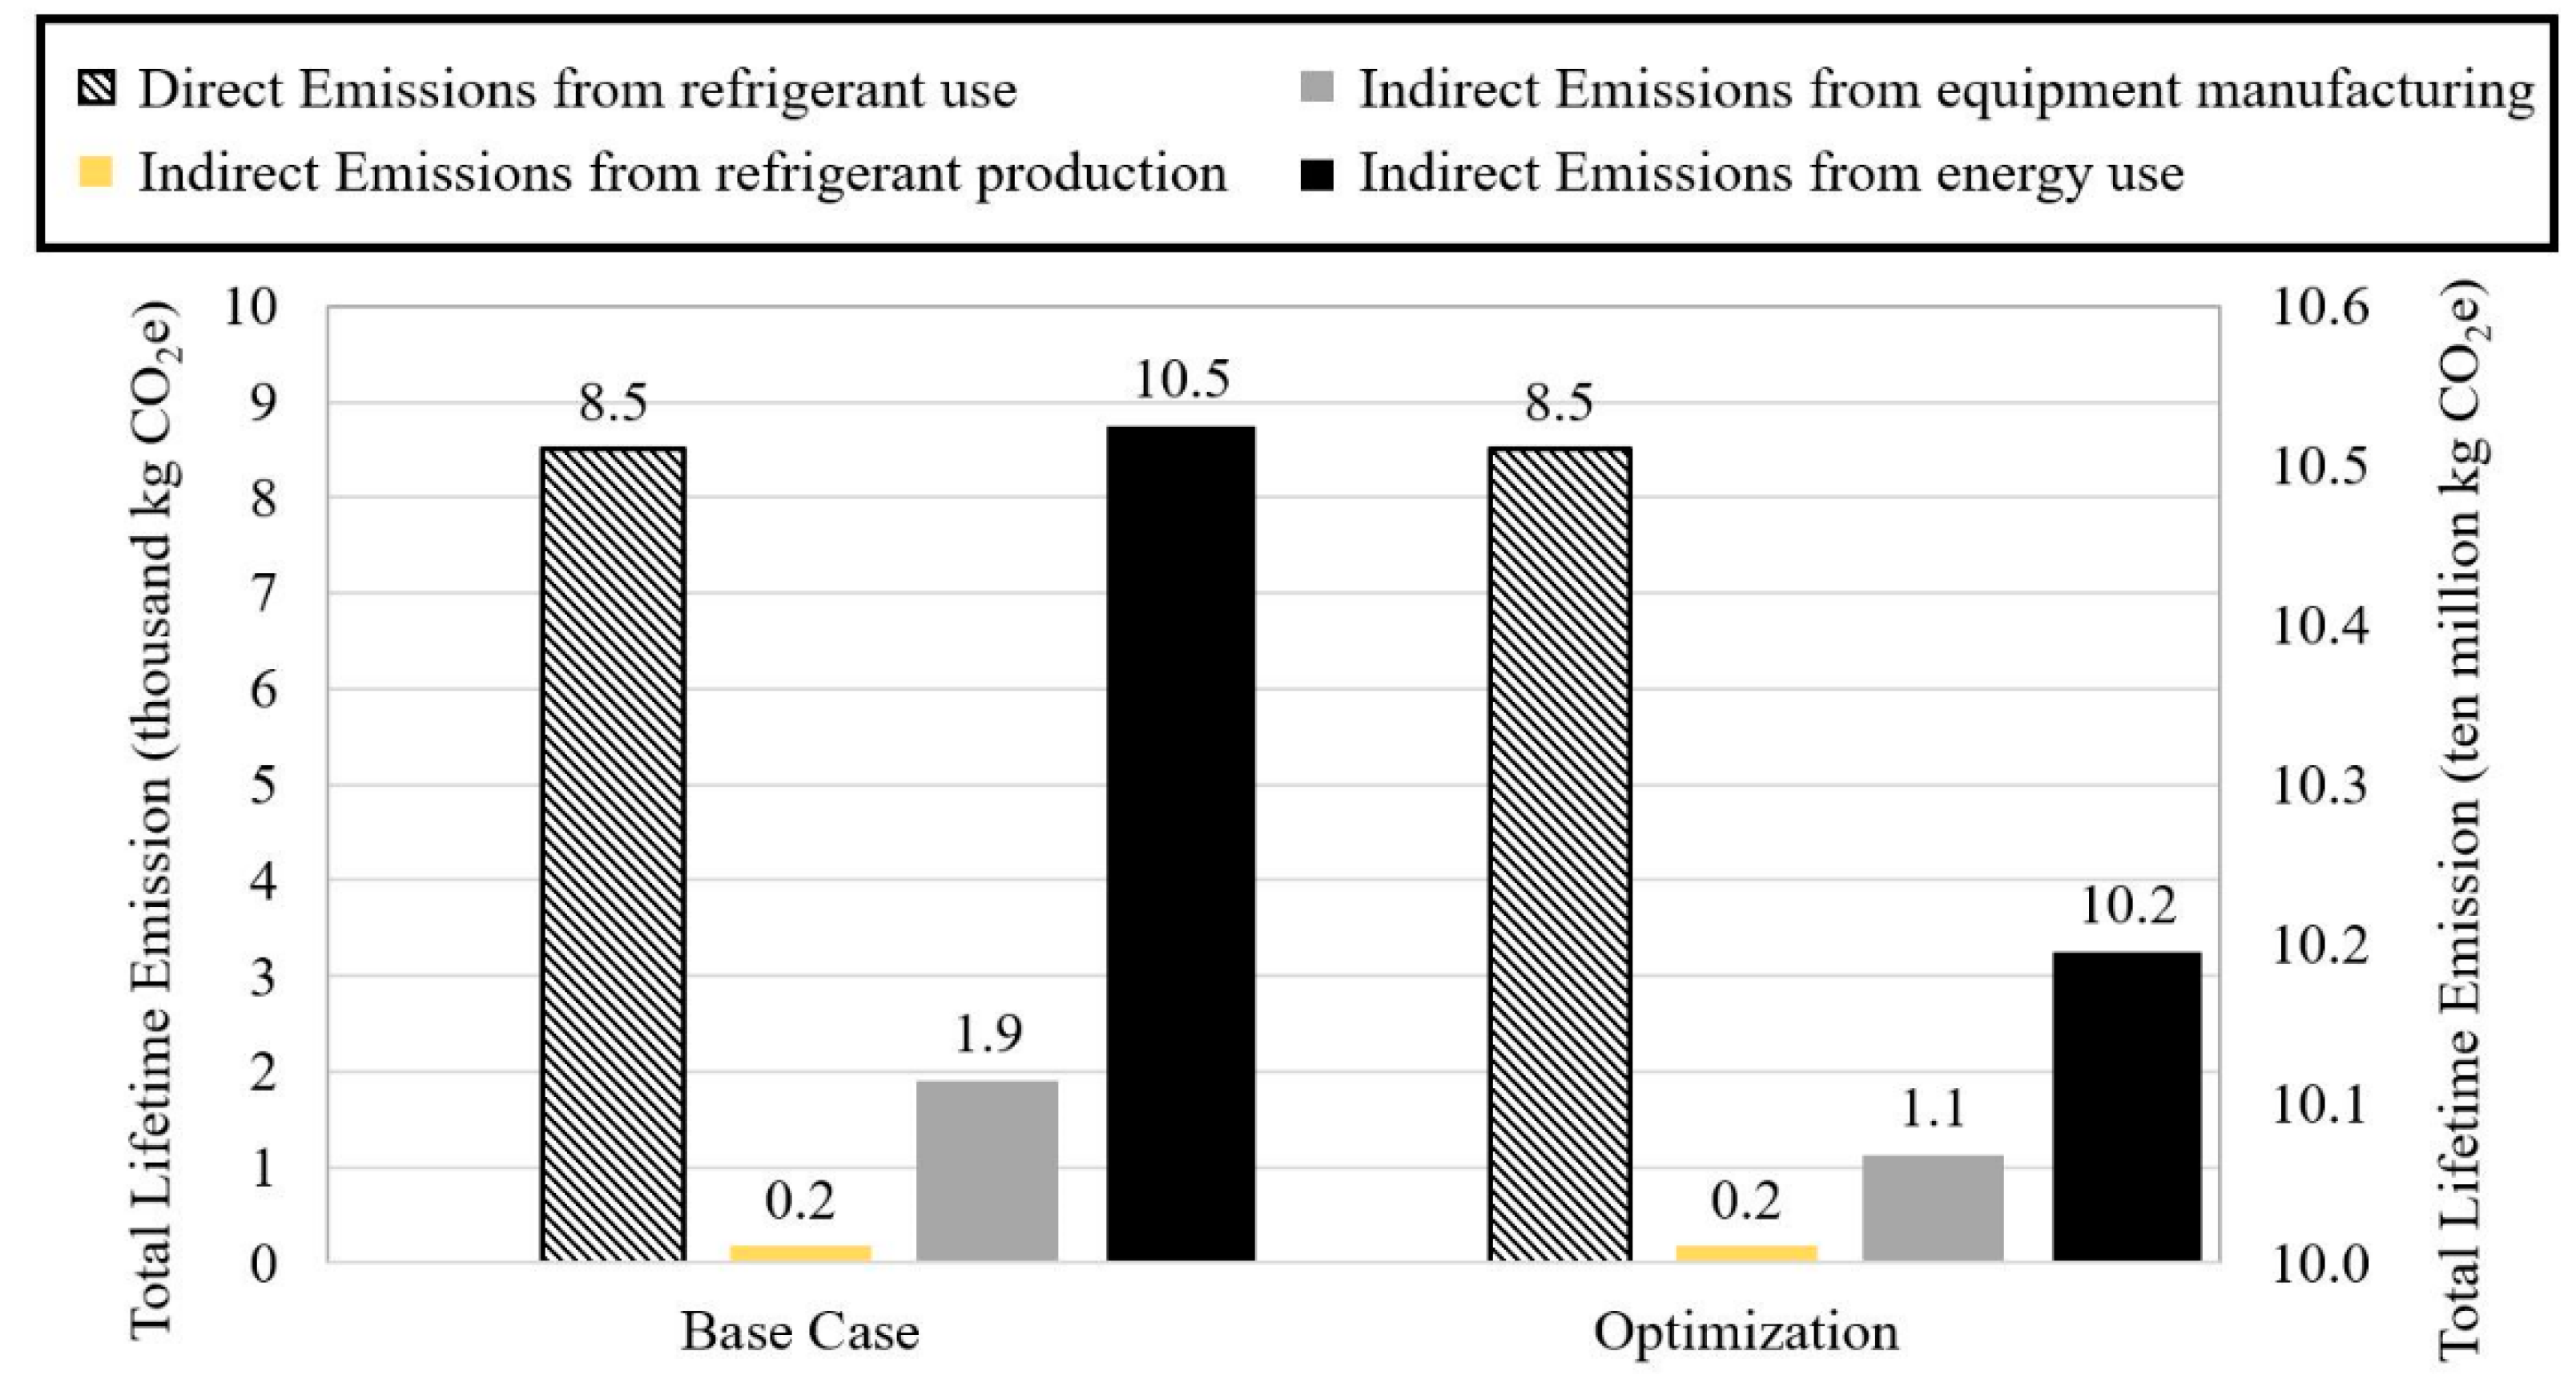
  • The optimization design method decreased the CO2 emission by approximately 4% compared to the existing design method for the RWSHP system. The LCCP analysis was only evaluated for HP. However, should all system components be included in the LCCP analysis, the difference in CO2 emission is estimated to further increase.
  • The performance of the RWSHP system was similar for both the optimization and existing design methods. However, the optimization design method could significantly improve the economics and reduce CO2 emissions.
The economic and LCCP impacts of the RWSHP system on all components will be further investigated for implementation in real-world applications. Therefore, we plan to analyze the total cost, including material, installation, and maintenance costs, and evaluated CO2 emission generated by the entire process for all components of the RWSHP system under real-world application conditions in a future study.

Author Contributions

Writing—original draft, Y.K.; software, Y.K.; data curation, S.B.; writing—review and editing, Y.N.; supervision, Y.N. All authors have read and agreed to the published version of the manuscript.

Funding

This work was supported by the Korea Environment Industry & Technology Institute (KEITI) through the Development of Life Cycle CO2 and Economic Feasibility Evaluation Tool for Hydrothermal Energy Project, funded by the Korea Ministry of Environment (MOE) (No.2020003150001), and supported by the National Research Foundation of Korea (NRF) grant funded by the Korea government (MSIT). (No.2021R1A2C2014259).

Institutional Review Board Statement

Not applicable.

Informed Consent Statement

Not applicable.

Data Availability Statement

Not applicable.

Conflicts of Interest

The authors declare no conflict of interest.
Nomenclature
A d p . G W P GWP of atmospheric reaction product of the refrigerant [kg CO2e/kg]
C H P Cost of heat pump [KRW]
C H P P r i c e   p e r   k W Cost of heat pump per kW [KRW/kW]
C H S T Cost of heat storage tank [KRW]
C H S T P r i c e   p e r   c u b i c   m e t e r Cost of heat storage tank per cubic meter [KRW/m3]
C M o n t h O p e r a t i o n Energy cost per year [KRW/year]
C Y e a r O p e r a t i o n Energy cost per month [KRW/month]
C 20   y e a r s O p e r a t i o n   c o s t Energy cost for 20 years [KRW]
P W A F n Present worth of annuity factor during n years
H P C O P COP of heat pump
Q ˙ H P Heat transfer rate of heat pump [kJ/h]
P ˙ H P Power of heat pump [kJ/h]
S y s t e m C O P COP of system
Q ˙ S y s t e m Heat transfer rate of system [kJ/h]
P ˙ S y s t e m Power of system [kJ/h]
C Refrigerant charge [kg]
L Average lifetime of equipment [years]
A L R Annual leakage rate [per year]
E O L End of life refrigerant leakage
G W P Global warming potential [kg CO2/kg]
A d p .   G W P GWP of atmospheric degradation product of the refrigerant [kg CO2/kg]
A E C Annual energy consumption [kWh]
E M CO2 produced/kWh [kg CO2/kg]
m Mass of unit [kg]
M M CO2e produced/material [kg CO2/kg]
m r Mass of recycled material [kg]
R M CO2e produced/recycled material [kg CO2/kg]
R F M Refrigerant manufacturing emissions [kg CO2/kg]
R F D Refrigerant disposal emissions [kg CO2/kg]
Acronyms and Abbreviations
IEAInternational Energy Agency
PWAFPresent worth of annuity factor
PNNLPacific Northwest National Laboratory
ASHRAEAmerican Society of Heating, Refrigeration and Air-conditioning Engineers
RWSHPRiver—water source heat pump
NWSHPNatural water source heat pump
LCCLife cycle cost
HPheat pump
HSTHeat storage tank
FCUFan coil unit
LCCPLife cycle climate performance
GHGGreenhouse gas
LWTLeaving water temperature
COPCoefficient of performance
GWPGlobal Warming Potential
IIRInternational institute of refrigeration

References

  1. International Energy Agency (IEA). World Energy Outlook; International Energy Agency (IEA): Paris, France, 2019. [Google Scholar]
  2. Korea Energy Agency. Summary of the Results of New and Renewable Energy Dissemination Statistics; Korea Energy Agency: Yongin, Korea, 2019. [Google Scholar]
  3. Cho, Y.; Yun, R. A raw water source heat pump air-conditioning system. Energy Build. 2011, 43, 3068–3073. [Google Scholar] [CrossRef]
  4. Zheng, W.; Ye, T.; You, S.; Zhang, H. The thermal performance of seawater-source heat pump systems in areas of severe cold during winter. Energy Convers. Manag. 2015, 90, 166–174. [Google Scholar] [CrossRef]
  5. Wang, Z.; Wang, L.; Ma, A.; Liang, K.; Song, Z.; Feng, L. Performance evaluation of ground water-source heat pump system with a fresh air pre-conditioner using ground water. Energy Convers. Manag. 2019, 188, 250–261. [Google Scholar] [CrossRef]
  6. Jung, Y.; Kim, J.; Kim, H.; Yun, R.; Park, C.; Nam, Y.; Cho, H.; Lee, H. Comprehensive feasibility investigation of river source heat pump systems in terms of life cycle. Appl. Therm. Eng. 2021, 188, 116655. [Google Scholar] [CrossRef]
  7. Jung, Y.; Kim, J.; Kim, H.; Nam, Y.; Cho, H.; Lee, H. Comprehensive multi-criteria evaluation of water source heat pump systems in terms of building type, water source, and water intake distance. Energy Build. 2021, 236, 110765. [Google Scholar] [CrossRef]
  8. Oh, S.; Cho, Y.; Yun, R. Raw-water source heat pump for a vertical water treatment building. Energy Build. 2014, 68, 321–328. [Google Scholar] [CrossRef]
  9. Du, B.; Gao, J.; Zeng, L.; Su, X.; Zhang, X.; Yu, S.; Ma, H. Area optimization of solar collectors for adsorption desalination. Sol. Energy 2017, 157, 298–308. [Google Scholar] [CrossRef]
  10. Mi, P.; Ma, L.; Zhang, J. Integrated optimization study of hot water supply system with multi-heat-source for the public bath based on PVT heat pump and water source heat pump. Appl. Therm. Eng. 2020, 176, 115146. [Google Scholar] [CrossRef]
  11. Moon, H.; Kim, H.; Nam, Y. Study on the Optimum Design of a Ground Heat Pump System Using Optimization Algorithms. Energies 2019, 12, 4033. [Google Scholar] [CrossRef] [Green Version]
  12. Guo, X.; Shu, H.; Gao, J.; Xu, F.; Cheng, C.; Sun, Z.; Xu, D. Volume design of the heat storage tank of solar assisted water-source heat pump space heating system. Procedia Eng. 2017, 205, 2691–2697. [Google Scholar] [CrossRef]
  13. Liu, Y.; Zhou, W.; Luo, X.; Wang, D.; Hu, X.; Hu, L. Design and operation optimization of multi-source complementary heating system based on air source heat pump in Tibetan area of Western Sichuan, China. Energy Build. 2021, 242, 110979. [Google Scholar] [CrossRef]
  14. International Institute of Refrigeration. Guideline for Life Cycle Climate Performance; International Institute of Refrigeration: Paris, France, 2016. [Google Scholar]
  15. Jung, J.-W.; Nam, J.-S.; Kim, H.-S. Cases of Water Source Energy Utilization of Sewage and River water in Korea. Water Future 2017, 50, 50–58. [Google Scholar]
  16. Jung, J.; Nam, J.; Jung, S.; Kim, J.; Kim, H.S. Feasibility Study on the Use of River Water Hydrothermal Energy in Korea: (1) Estimation of the Permitted Standard Discharge and Determination of the Potential Water Intake Area. New Renew. Energy 2018, 14, 27–37. [Google Scholar] [CrossRef]
  17. Office of Energy Efficiency & Renewable Energy. Available online: http://www.energy.gov/eere/office-energy-efficiency-renewable-energy (accessed on 18 October 2018).
  18. ASHRAE 90.1; Energy Standard for Buildings Except Low-Rise Residential Buildings. ASHRAE: Atlanta, GA, USA, 2013.
  19. ASHRAE 90.1; Energy Standard for Buildings Except Low-Rise Residential Buildings. ASHRAE: Atlanta, GA, USA, 2004.
  20. ASHRAE Standard 55; Thermal Environment Conditions for Human Occupancy. ASHRAE: Atlanta, GA, USA, 2004.
  21. ASHRAE Standard 62.1; Ventilation for Acceptable Indoor Air Quality. ASHRAE: Atlanta, GA, USA, 2010.
  22. Ministry of Land, Infrastructure and Transport in Korea. Green Buildings Construction Support Act. 2020. Available online: https://elaw.klri.re.kr/ (accessed on 26 May 2022).
  23. Climate Master. Available online: https://www.climatemaster.com/ (accessed on 26 May 2022).
  24. Carrier. Available online: http://www.carrier.co.kr/index.asp (accessed on 26 May 2022).
  25. Kavanaugh, S.; Rafferty, K. Geothermal Heating and Cooling—Design of Ground-Source Heat Pump Systems; ASHRAE: Atlanta, GA, USA, 2016. [Google Scholar]
  26. Oh, S.-H.; Yun, R.; Cho, Y. Cooling and Heating Operation Characteristics of Raw-water Source Heat Pump and Air Source Heat Pump in Water Treatment Facility. Korean J. Air-Cond. Refrig. Eng. 2013, 25, 386–391. [Google Scholar]
  27. Si, B.; Tian, Z.; Jin, X.; Zhou, X.; Shi, X. Ineffectiveness of optimization algorithms in building energy optimization and possible causes. Renew. Energy 2019, 134, 1295–1306. [Google Scholar] [CrossRef]
  28. Korean on-Line E-Procurement System. Available online: http://shopping.g2b.go.kr (accessed on 26 May 2022).
  29. Korea Electric Power Corporation. Available online: https://home.kepco.co.kr/kepco/main.do (accessed on 26 May 2022).
Figure 1. Schematic of natural water source heat pump system.
Energies 15 04019 g001
Figure 2. Proposed optimum design method.
Energies 15 04019 g002
Figure 3. Flow charts of the conventional and proposed optimum design methods.
Energies 15 04019 g003
Figure 4. Large-scale office building model.
Energies 15 04019 g004
Figure 5. Ambient air temperature and monthly building loads in a large office building; (a) ambient air temperature in Busan, South Korea and setpoint temperature boundary of large office building, (b) monthly heating and cooling loads in a large office building in Busan, South Korea.
Energies 15 04019 g005
Figure 6. Schematic of the simulation.
Energies 15 04019 g006
Figure 7. Operational logic of the RWSHP system.
Energies 15 04019 g007
Figure 8. Hooke-Jeeves algorithm calculation method and actual optimization process; (a) calculation method of the Hooke–Jeeves algorithms, (b) actual optimization process according to the objective function.
Energies 15 04019 g008
Figure 9. Comparison of optimization results; (a) comparison result between the existing design method and the optimized design method for the heating and cooling capacity of heat pumps, (b) comparison result between the existing design method and the optimized design method for the volume of the heat storage tank.
Energies 15 04019 g009
Figure 10. Results of HP and system performance; (a) HP COP of the system built with the existing and optimal capacity design methods, and (b) system COP.
Energies 15 04019 g010
Figure 11. Result of economic analysis; (a) comparison of economic feasibility between the existing design method and the optimized design method for initial investment cost, energy cost, and total cost. (b) LCC comparison analysis result between the existing design method and the optimized design method.
Energies 15 04019 g011
Figure 12. CO2 emission results.
Energies 15 04019 g012
Table 1. Previous studies regarding optimization of energy system.
AuthorOptimization FactorPerformance
Analysis
Economic
Analysis
CO2 Emission
Analysis
Du et al. [9]Solar collector areaOOX
Mi et al. [10]Number of photovoltaic solar thermal, heat pump, and operation timeOOX
Moon et al. [11]Ground heat exchanger,
heat pump, and
heat storage tank volume
OOX
Guo et al. [12]Heat storage tank
volume
OXX
Liu et al. [13]Heat sink arrangementOOO
Table 2. Specifications of building load model.
LocationBusan, South KoreaReference
Building ModelLarge-scale officePNNL
Set Temperature (°C)Heating Season: 21ASHRAE 90.1-2004
Cooling Season: 24
Floor Area (m2)3567PNNL
Infiltration (1/h)0.0002ASHRAE 90.1-2004
Operation SeasonHeating: January–April
& November–December
Cooling: May–October
Internal Heat Gain (W/m2)People: 70ASHRAE 55-2004
Lights: 11.84ASHRAE 90.1-2004
Equipment: 8.07
U-Value (W/m2·K)Ground Floor: 0.250Energy Saving Design Standards for Buildings in Korea
External Walls: 0.32
Roof: 0.18
Internal Roof: 0.35
Windows: 1.8
Table 3. Specifications of simulation components.
ComponentParameterValue
Heat PumpTypeWater to Water Heat Pump
Heating Capacity54 kW
Power Consumption
(Heating)
13.5 kW
Cooling Capacity42 kW
Power Consumption
(Cooling)
10.5 kW
Source/Load Specific Heat4.19 kJ/ (kg · K)
Heat Storage TankTank Volume10 m3
Fan Coil UnitHeating Capacity65 kW
Cooling Capacity50.4 kW
Volumetric Air Flow Rate2475 L/s
Power Consumption3 kW
PumpMaximum Flow Rate9000 kg/h
Power Consumption1 kW
Table 4. Specification of optimization.
ComponentParameterInitial ValueMinimum ValueMaximum ValueStep Value
Heat PumpCooling
Capacity
42 kW21 kW84 kW1 kW
Heating
Capacity
54 kW27 kW108 kW
Heat Storage TankVolume10 m30.1 m320 m31 m3
Table 5. Specifications of economic analysis.
ComponentParameterCost/Value
Initial
Investment Cost
Heat PumpCooling Capacity198,434 won/kW
Heating Capacity
Heat Storage TankVolume2,500,000 won/m3
Annual
Operation Cost
Heat Pump
FCU
Pump
Power Consumption100 won/kW
Total CostInitial Investment Cost + 20 years of Operational Costs
Table 6. Optimization results of capacity and volume.
Heat Pump
Cooling Capacity
Heat Pump
Heating Capacity
Heat Storage Tank Volume
Original42 kW54 kW10 m3
Optimization
(Hooke–Jeeves Algorithm)
31.3 kW42.3 kW2.75 m3
Table 7. Optimization results of costs.
Initial Investment Cost
(won)
Annual Operation Cost
(20 Years)
(won)
Total Cost
(won)
Original34,504,00095,651,840130,155,840
Optimization
(Hooke–Jeeves Algorithm)
14,157,68885,148,14699,305,834
Table 8. Specifications of life cycle climate performance.
CategoryNotationBase CaseOptimizationUnit
Refrigerant HFC-410a-
Refrigerant ChargeC6.82.49kg
Average Lifetime of EquipmentL10Years
Annual Leakage RateALR5%Per year
End of Life Refrigerant LeakageEOL15%-
Global Warming PotentialGWP1924kg CO2/kg
Annual Energy ConsumptionAEC35,12830,811kWh
CO2 Produced/kWhEM0.46kg CO2e
Mass of UnitMSteel: 164.7
Aluminum: 43.0
Copper: 68.0
Plastics: 82.3
Steel: 151.3
Aluminum: 39.5
Copper: 62.5
Plastics: 75.7
kg
Refrigerant Manufacturing EmissionsRFM0.46kg CO2/kg
Refrigerant Disposal EmissionsRFD-kg CO2/kg
Publisher’s Note: MDPI stays neutral with regard to jurisdictional claims in published maps and institutional affiliations.

