
Directions of Modification of the Model of Perception of the Thermal Environment by Patients of Selected Hospital Wards

Abstract
:1. Introduction
2. Materials and Methods
- Immediately upon entering the patients’ room, an on-site visit was made, followed by an initial interview with the patients. Patients’ clothing, activity, mobility, and type of bedding and covering were determined, among other things.
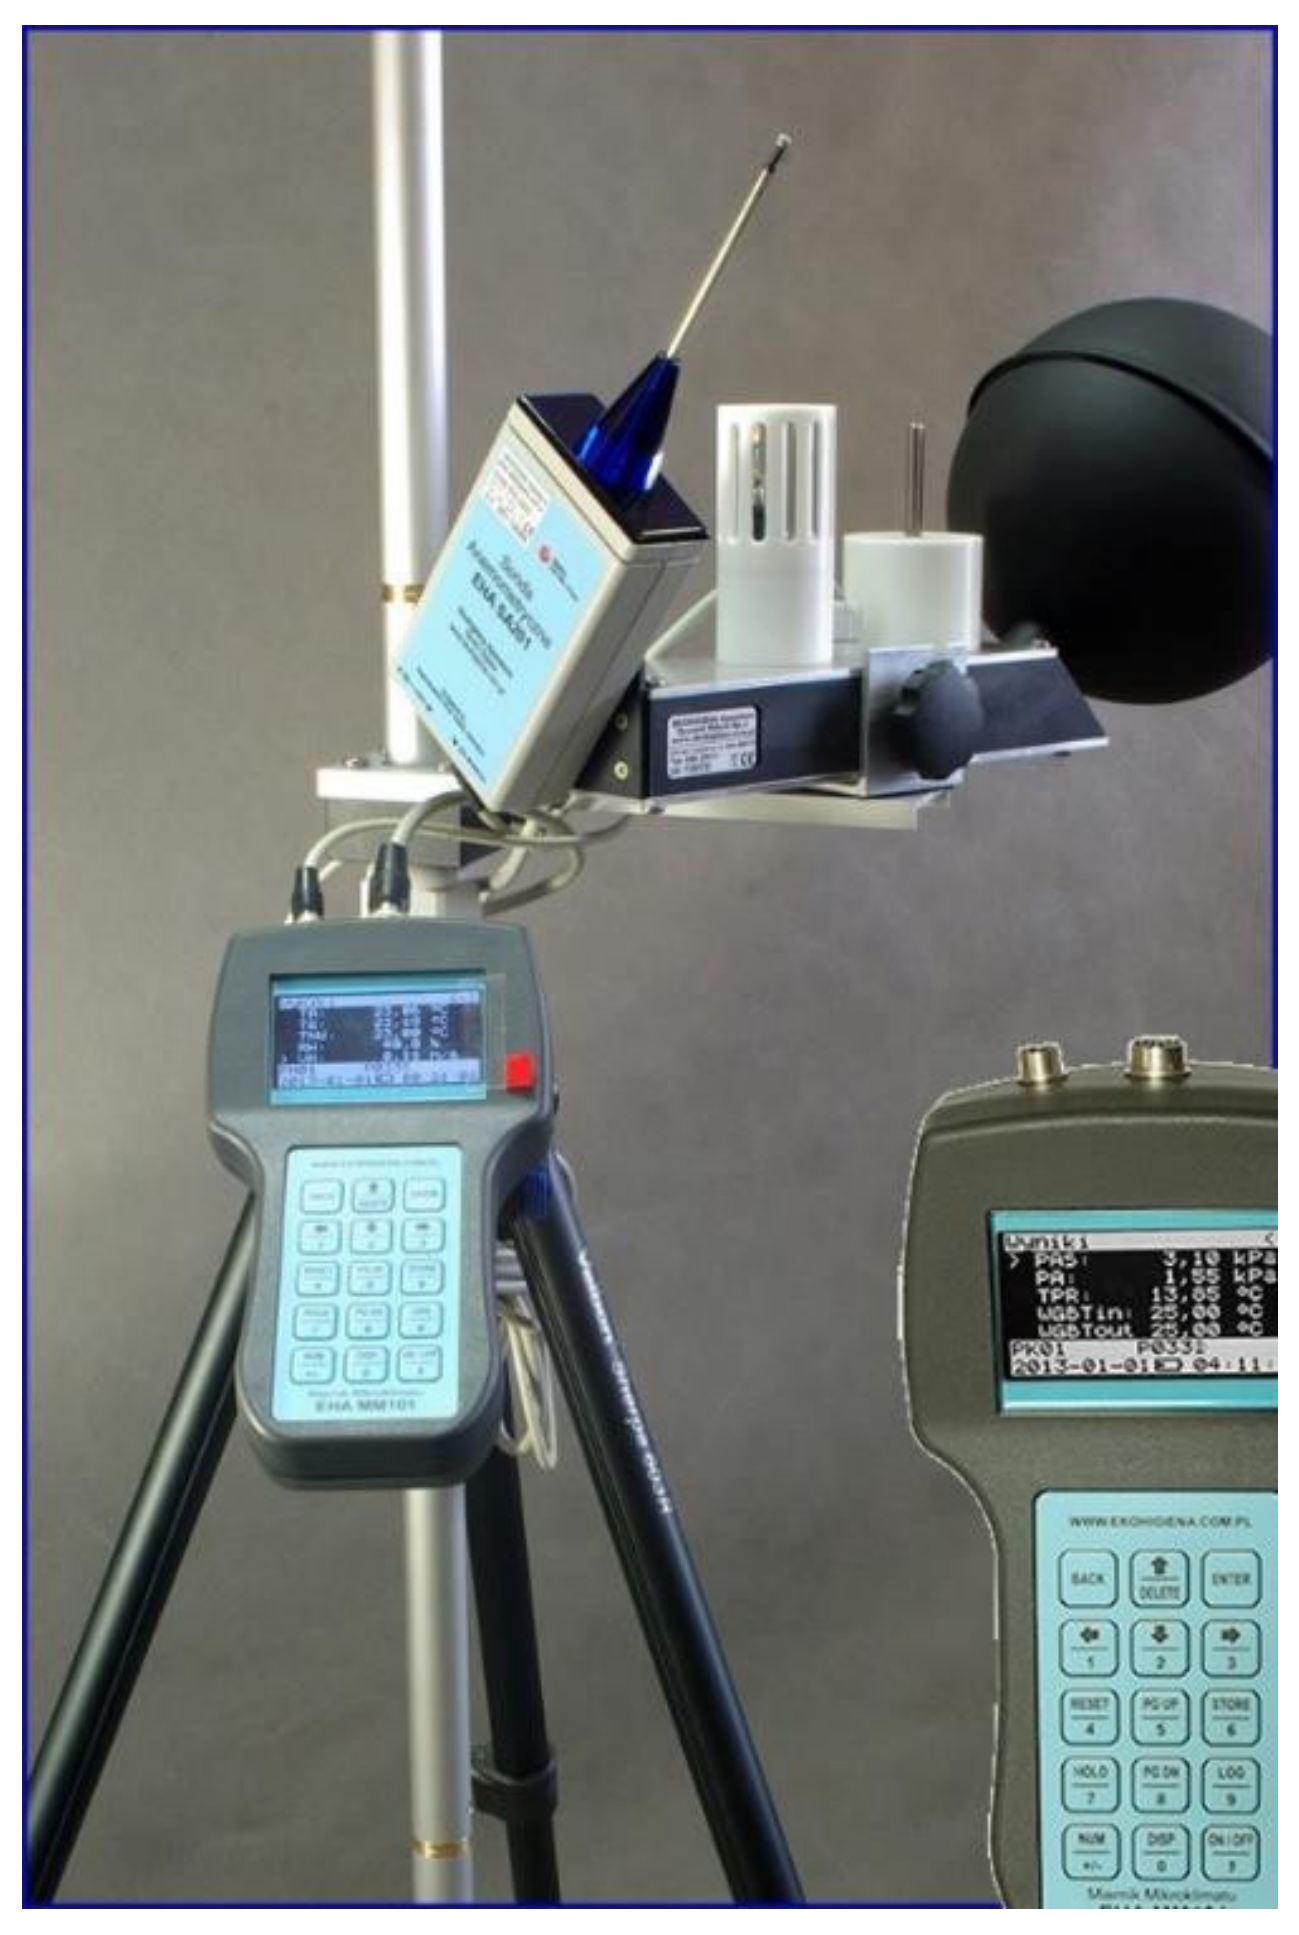
- Acclimatisation of the meter and measurement of thermal environment parameters. Recording of thermal environment parameters required to calculate PMV, i.e., air temperature, air velocity, and relative humidity, as well as the temperature of the black ball (the microclimate meter recorded values of the temperature of the black ball, which was then converted in the meter to the corresponding value of the radiation temperature) was carried out using microclimate meters (Ekohigiena, model EHA MM101, and Sensor-Electronic, model SensoData 5500 MK; Figure 1). This was carried out in parallel with the questionnaire study to maintain the correspondence between the conditions recorded by the meter and the conditions felt by the patients (measurements were carried out under the provisions of EN ISO 28802 [24]). Measurement and acclimatisation of the meter at the first measurement point in a given patient room took about 30 min, and at subsequent measurement points, about 15 min.
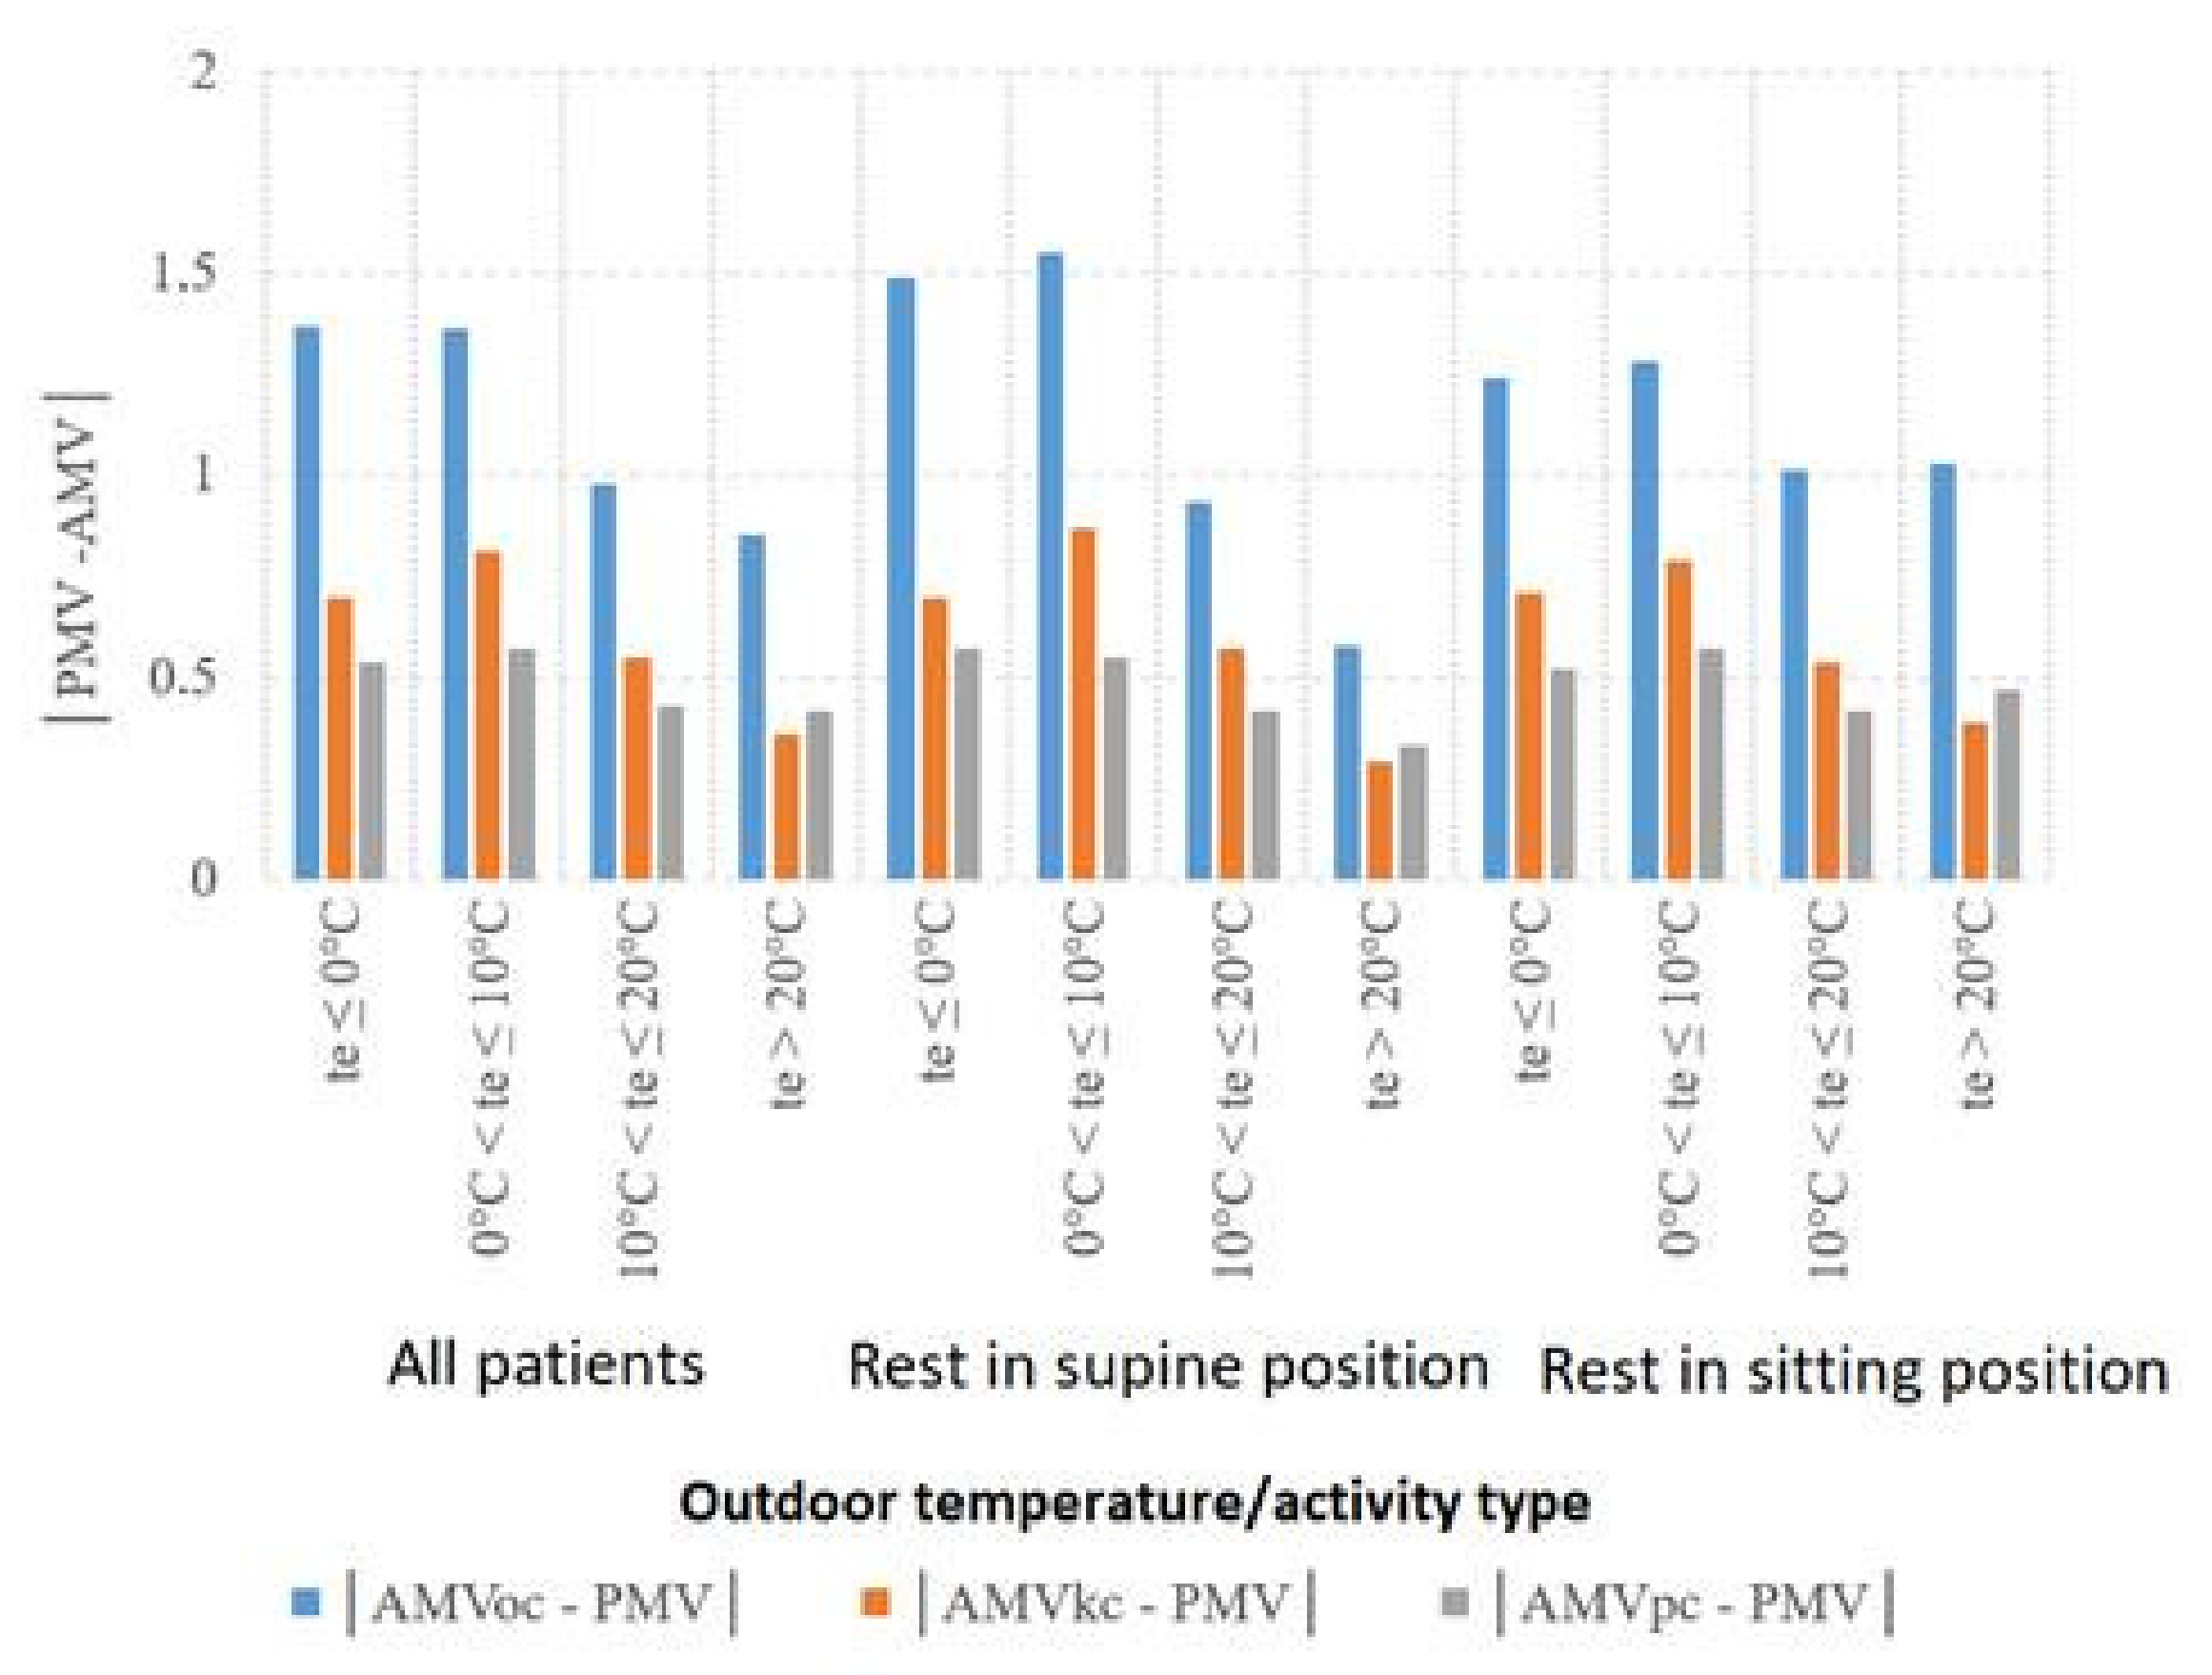
- average rating based on the analysis of thermal sensations (AMVoc): −3—cold, −2—cool, −1—slightly cool, 0—neutral, 1—slightly warm, 2—warm, 3—hot;
- actual average rating based on the analysis of feelings of thermal comfort (AMVkc): 0—comfortable, 1—slightly uncomfortable, 2—uncomfortable, 3—very uncomfortable;
- real average rating based on thermal preference analysis (AMVpc): −3—much warmer, −2—warmer, −1—slightly warmer, 0—no change, 1—slightly cooler, 2—cooler, 3—much cooler;
- prediction by the PMV model of mean evaluation (PMV) and prediction by the adaptive model of mean evaluation (PMV*): −3—cold, −2—cool, −1—slightly cool, 0—neutral, 1—slightly warm, 2—warm, 3—hot.
3. Results
3.1. PMV Model
3.2. Adaptive Model
4. Directions for Modifying Thermal Comfort Models
5. Discussion
6. Conclusions
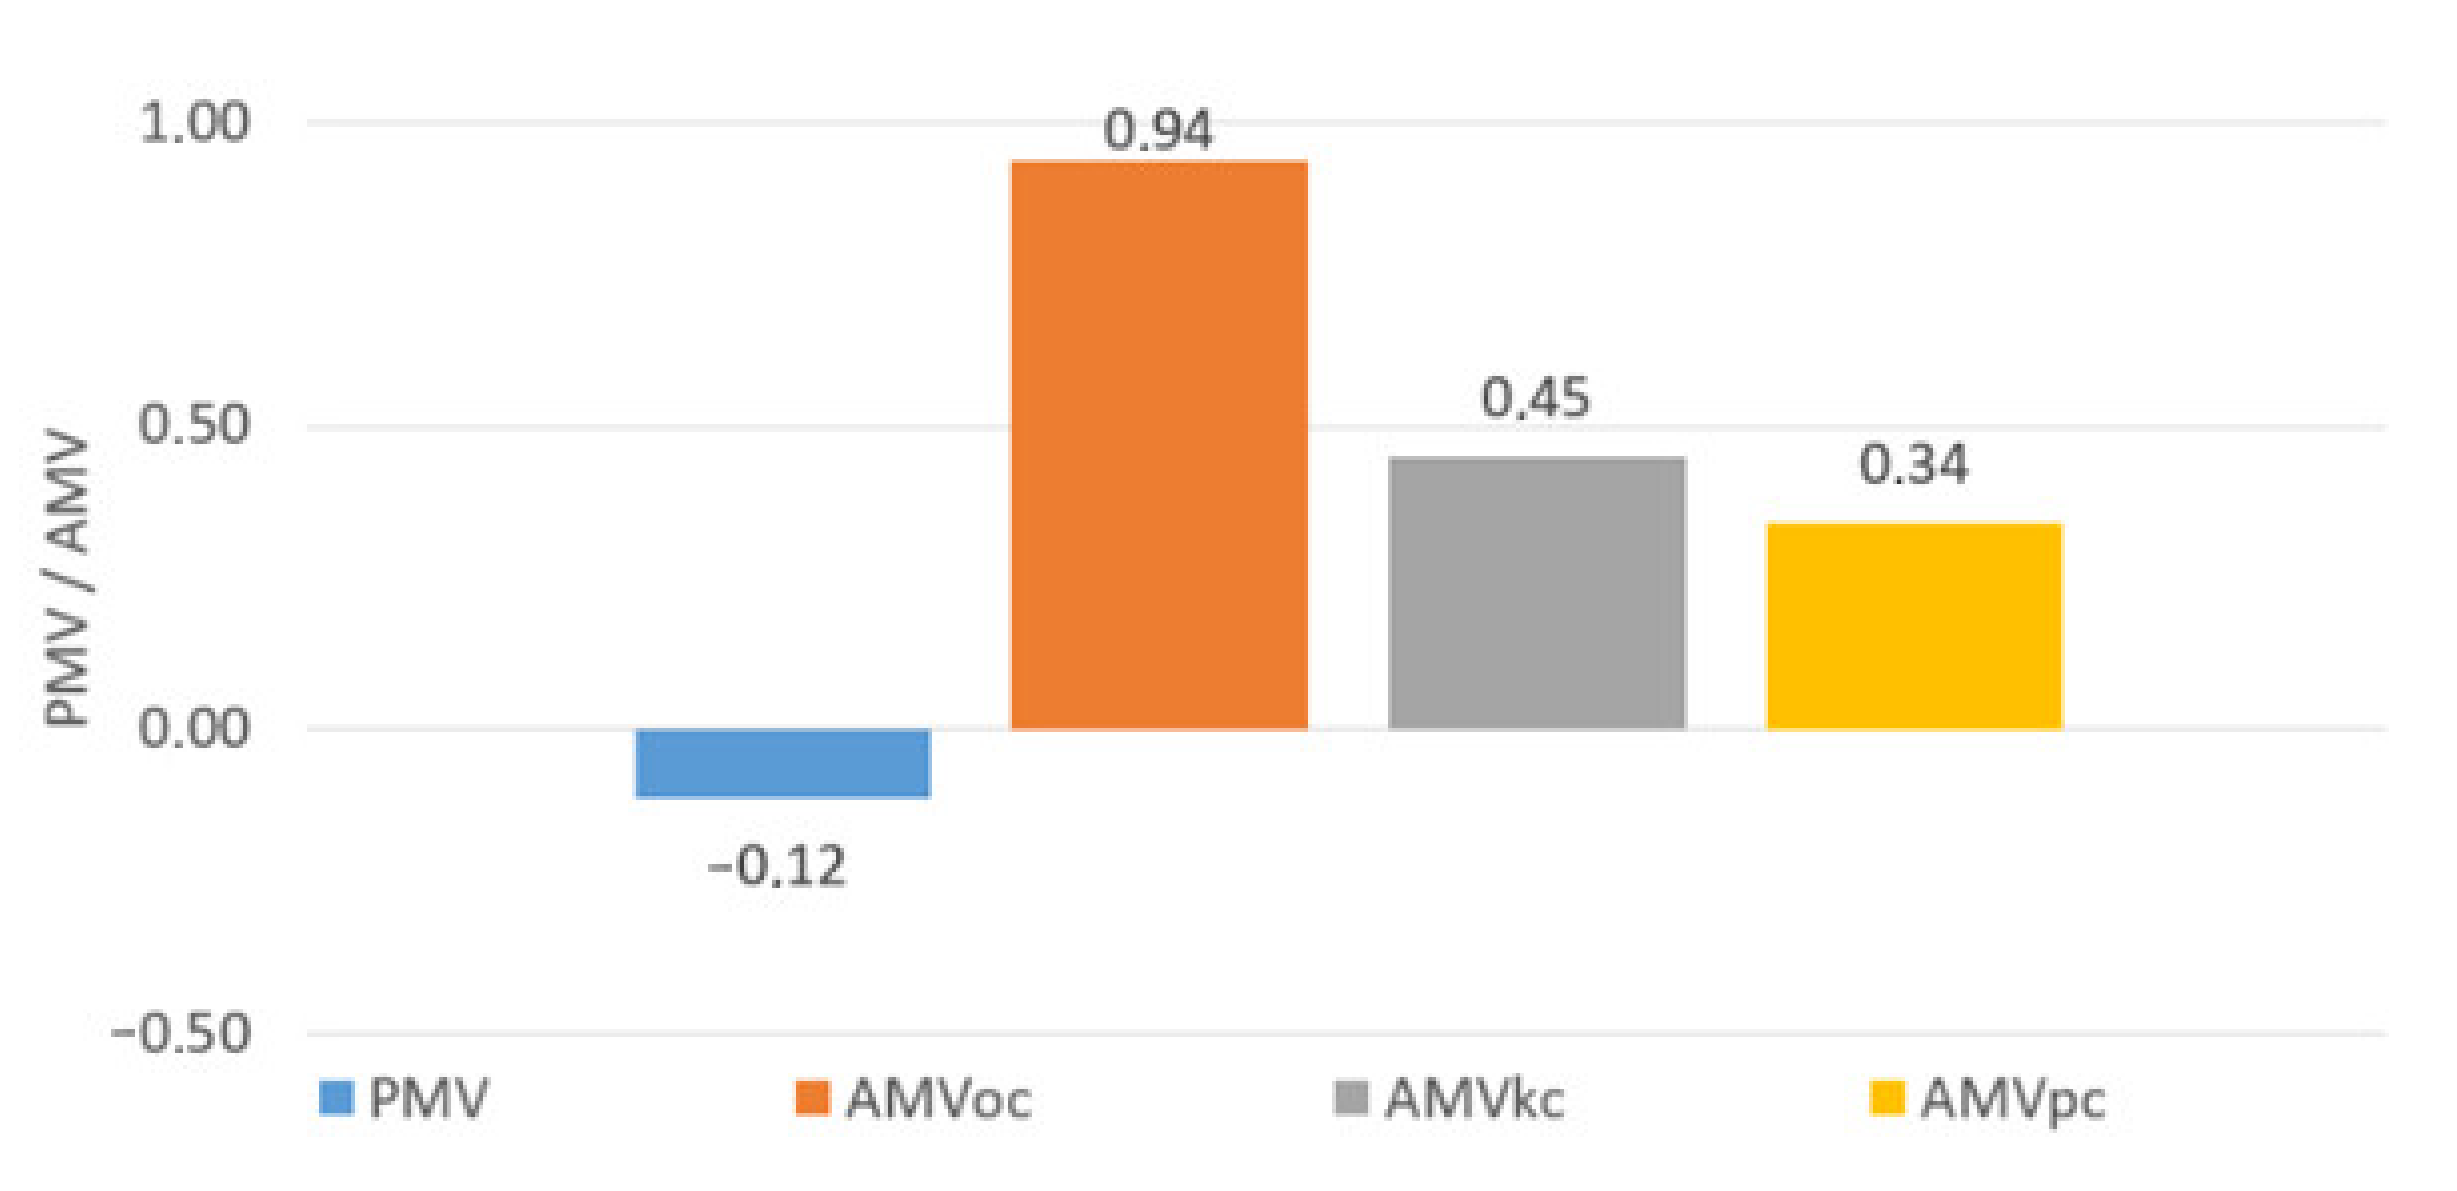
- The analyses showed that the thermal comfort model [7] did not achieve satisfactory performance in predicting the mean rating of thermal conditions in patients’ rooms. We can see the reasons for this in the following issues: patients are a far more diverse group in terms of their perception of the thermal environment than the office workers or students whose responses formed the basis for the PMV model; moreover, patients seemed to answer the questionnaire by marking ‘warm’ with the feeling characterised as ‘neutral’. In addition, the PMV value is strongly influenced by the accurate determination of individual parameters, i.e., the type of activity and the set of clothing and bedding used. Although we determined the metabolic rate and the thermal clothing insulation using the best knowledge, normative data, and recent publications, we believe that for people who are ill, elderly, or have impaired mobility, the metabolic rate is not yet determined accurately enough, as well as the thermal insulation of clothing sets and bedding is not sufficiently recognised in the literature.
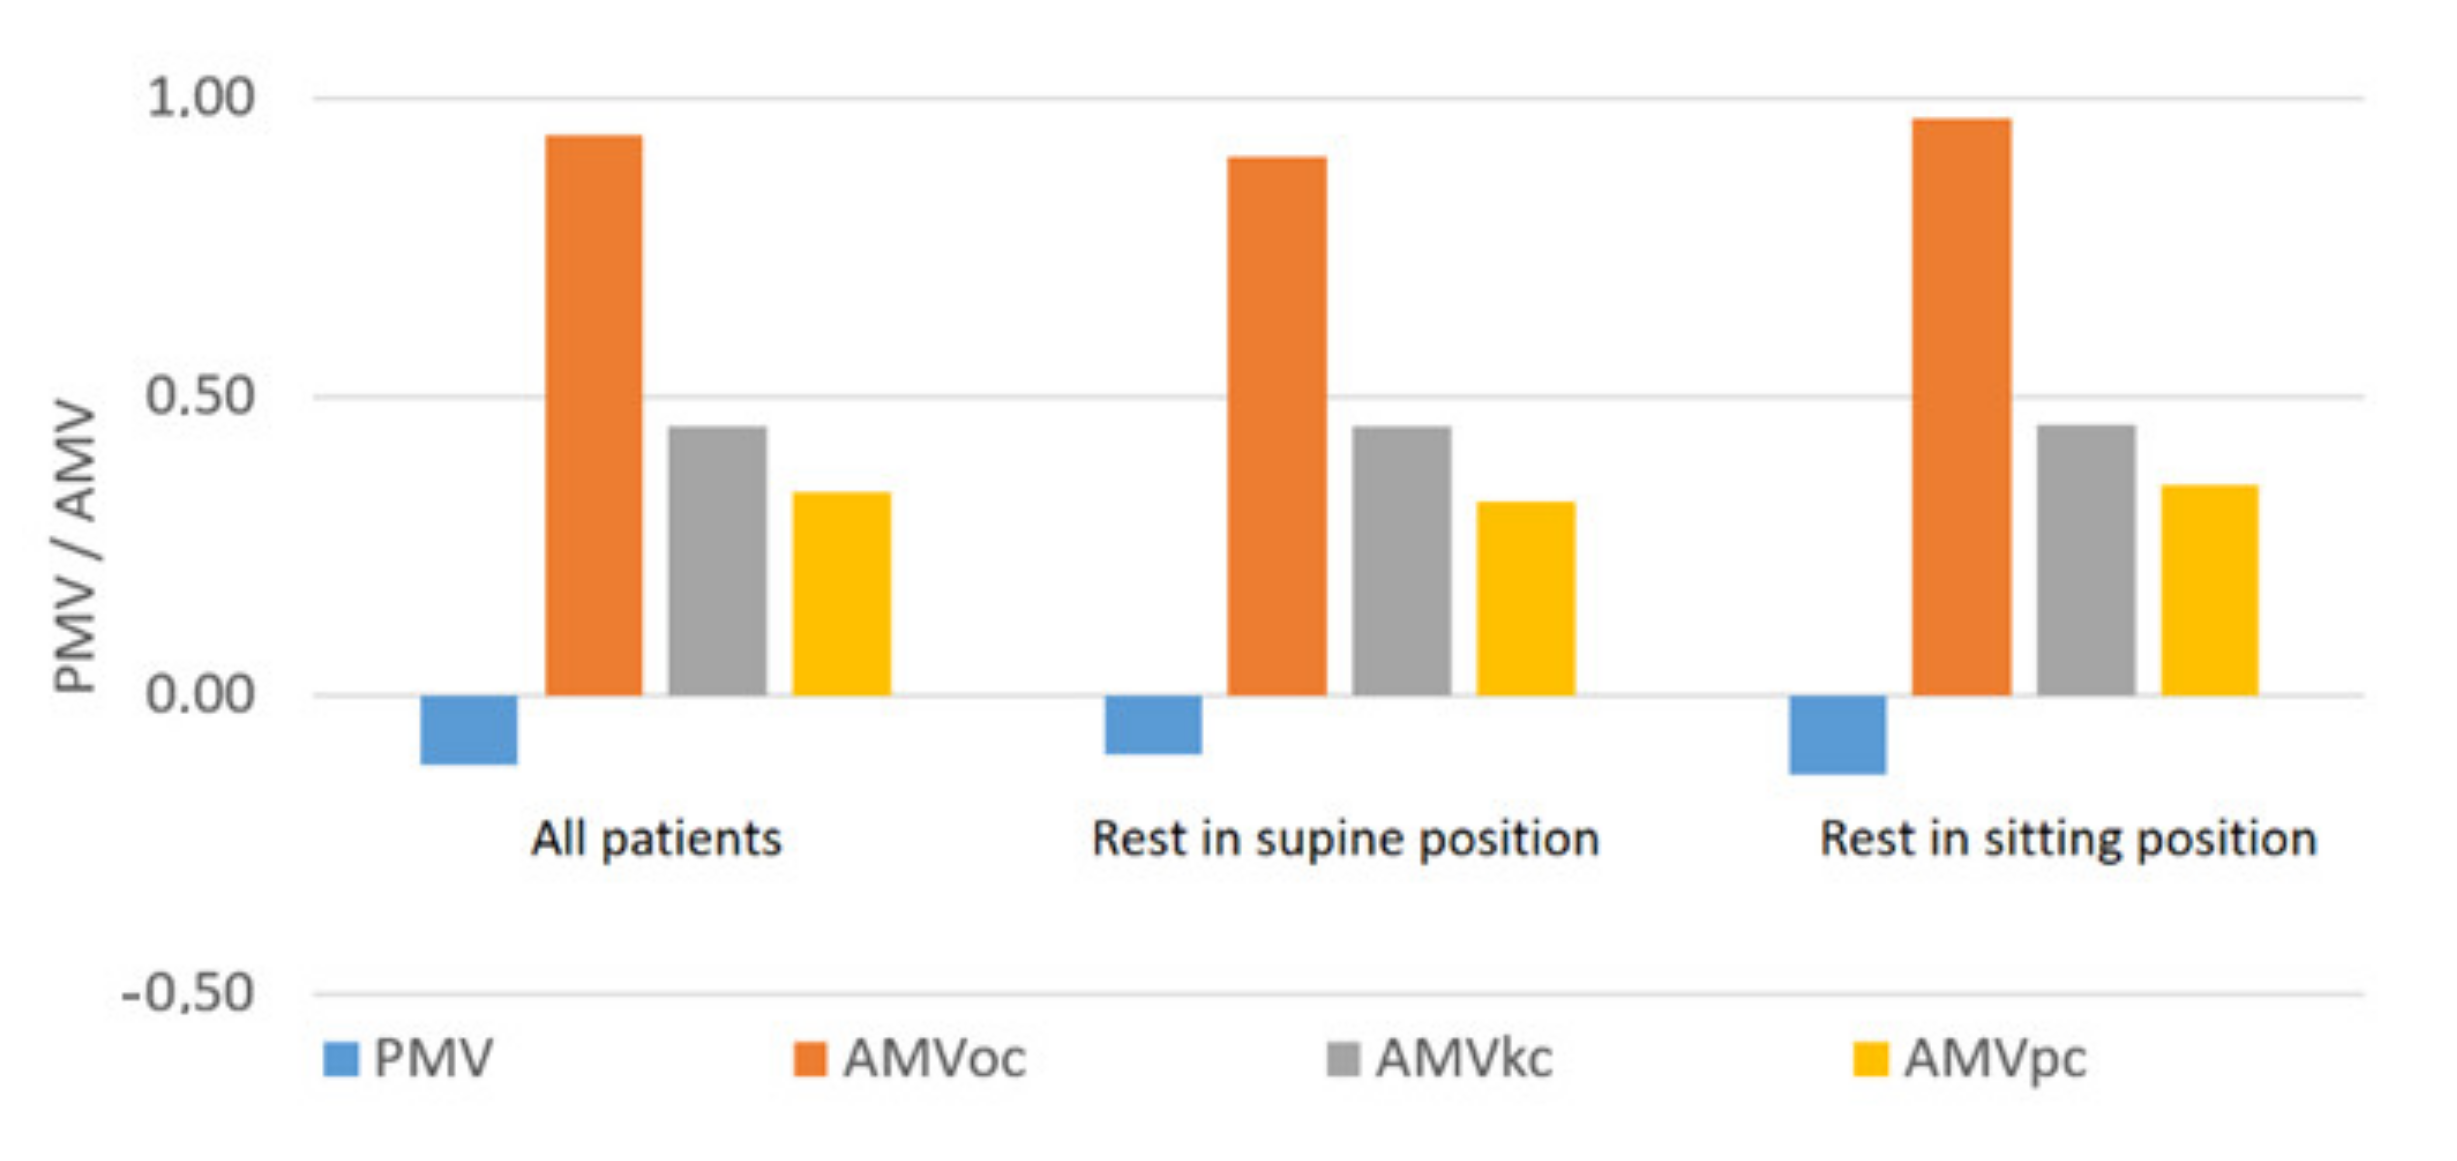
- The adaptive model provides higher forecasting reliability for thermal environment assessment than the PMV model. However, the results of the analyses indicate that patients are more diverse in terms of thermal expectations than students and office workers, on whom the normative models are based, and expect slightly cooler conditions than predicted.
- The study patients adapted to the thermal conditions. At the same time, the distribution of results was different from that predicted by the adaptation model, indicating that the patients may have shown lower acceptability of adverse thermal conditions or the adaptation process itself may have occurred differently, i.e., the study patients may have adapted to the thermal conditions to a different extent than predicted by the adaptation model, or this may have been due to an unwarranted or overly strong consideration of adaptation for some patients.
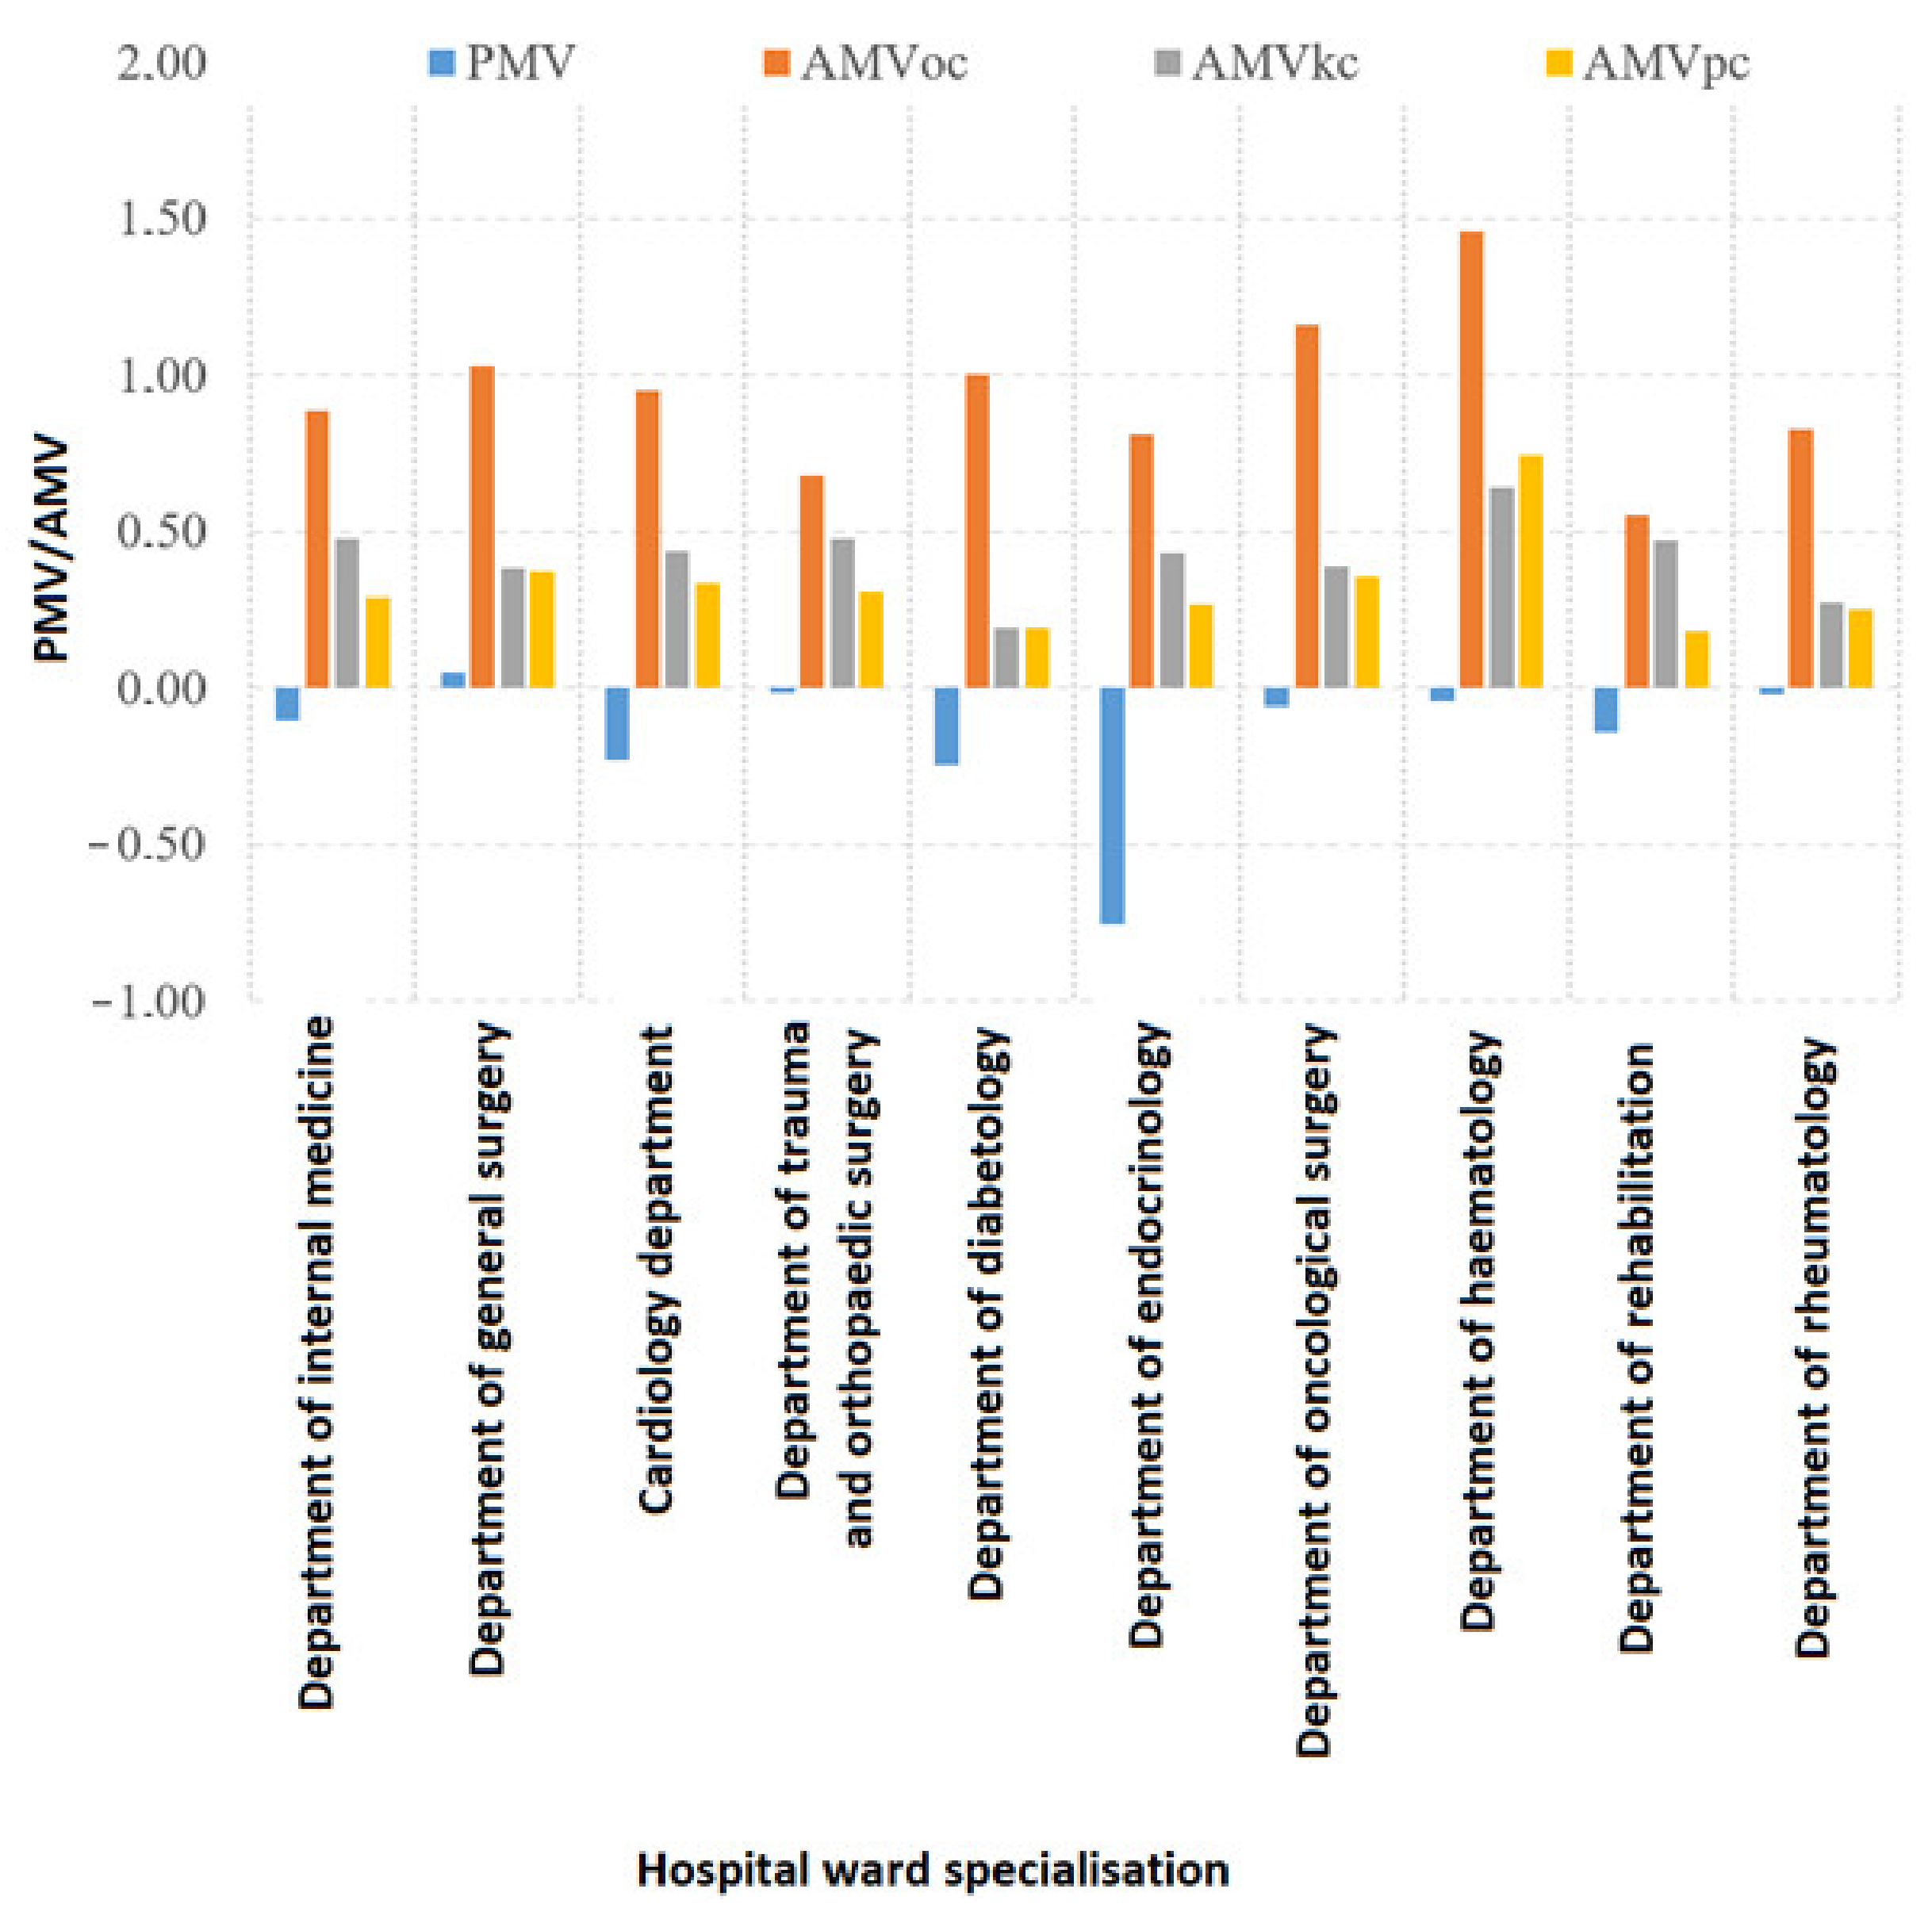
- The specialisation of the hospital wards in which patients were housed differentiated in their thermal expectations, with the adaptive model proving more reliable in predicting thermal environment ratings for patients housed on individual wards. The results of the individual ward studies showed that there are still factors that differentiate patients’ perceptions of the thermal environment, including medical issues that have not yet been identified as having an impact on perceptions of the thermal environment, such as the phase of the treatment process, patients’ well-being, health status, or details of ailments and conditions.
- The results of the study were the furthest from the predicted ones in the case of the survey of thermal sensations, closer to the predicted ones in the case of the survey of thermal comfort sensations, and in the case of the survey of thermal preferences, they were the closest to the predicted ones; however, Refs. [14,21,28] have shown that the scales of thermal preferences and thermal sensations are not equivalent, and the scale of thermal sensations is most similar to the scale of thermal comfort. On this basis, it was concluded that the surveyed patients most reliably assessed thermal conditions in patients’ rooms by determining the degree of thermal comfort.
Author Contributions
Funding
Institutional Review Board Statement
Informed Consent Statement
Data Availability Statement
Conflicts of Interest
References
- Wargocki, P. Indoor Climate and Productivity in Offices: How to Integrate Productivity in Life-Cycle Cost Analysis of Building Services; REHVA Guidebook No. 6; REHVA: Ixelles, Belgium, 2006. [Google Scholar]
- Mujan, I.; Anđelković, A.S.; Munćan, V.; Kljajić, M.; Ružić, D. Influence of indoor environmental quality on human health and productivity—A review. J. Clean. Prod. 2019, 217, 646–657. [Google Scholar] [CrossRef]
- Roelofsen, P. The impact of office environments on employee performance: The design of the workplace as a strategy for productivity enhancement. J. Facil. Manag. 2002, 1, 247–264. [Google Scholar] [CrossRef]
- Akimoto, T.; Tanabe, S.; Yanai, T.; Sasaki, M. Thermal comfort and productivity—Evaluation of workplace environment in a task conditioned office. Build. Environ. 2010, 45, 45–50. [Google Scholar] [CrossRef]
- Kim, J.; Bauman, F.; Raftery, P.; Arens, E.; Zhang, H.; Fierro, G.; Andersen, M.; Culler, D. Occupant comfort and behavior: High-resolution data from a 6-month field study of personal comfort systems with 37 real office workers. Build. Environ. 2019, 148, 348–360. [Google Scholar] [CrossRef]
- Kwon, M.; Remøy, H.; van den Dobbelsteen, A.A.J.F.; Knaack, U. Personal control and environmental user satisfaction in office buildings: Results of case studies in the Netherlands. Build. Environ. 2019, 149, 428–435. [Google Scholar] [CrossRef]
- ISO 7730:2005; Ergonomics of the Thermal Environment—Analytical Determination and Interpretation of Thermal Comfort Using Calculation of the PMV and PPD Indices and Local Thermal Comfort Criteria. ISO: Geneva, Switzerland, 2005.
- de Dear, R.; Brager, G.S. Developing an adaptive model of thermal comfort and preference. ASHRAE Trans. 1998, 104 Pt 1, 1–18. [Google Scholar]
- EN 16798-1:2019; Energy Performance of Buildings—Ventilation for Buildings—Part 1: Indoor Environmental Input Parameters for Design and Assessment of Energy Performance of Buildings Addressing Indoor Air Quality, Thermal Environment, Lighting and Acoustics—Module M1-6. European Committee for Standardization: Brussels, Belgium, 2019.
- ASHRAE 55-2013: ANSI/ASHRAE 55:2013; Thermal Environmental Conditions for Human Occupancy. ASHRAE: Atlanta, GA, USA, 2013; p. 30.
- Breslin, R. Gender Differences and Thermal Comfort Requirements; Final Year Undergrade Report; Department of Human Science, Loughborough University: Loughborough, UK, 1995. [Google Scholar]
- Costa, I.T.; Wollmann, C.A.; Gobo, J.P.A.; Ikefuti, P.V.; Shooshtarian, S.; Matzarakis, A. Extreme Weather Conditions and Cardiovascular Hospitalizations in Southern Brazil. Sustainability 2021, 13, 12194. [Google Scholar] [CrossRef]
- Webb, L.; Parsons, K. Thermal comfort requirements for people with physical disabilities. Proc. Hum. Factors Ergon. Soc. Annu. Meet. 2000, 44, 114–121. [Google Scholar]
- Hwang, R.-L.; Lin, T.-P.; Cheng, M.-J.; Chien, J.-H. Patient thermal comfort requirement for hospital environments in Taiwan. Build. Environ. 2007, 42, 2980–2987. [Google Scholar] [CrossRef]
- Peel, M.C.; Finlayson, B.L.; McMahon, T.A. Updated world map of the Köppen-Geiger climate classification. Hydrol. Earth Syst. Sci. 2007, 11, 1633–1644. [Google Scholar] [CrossRef] [Green Version]
- de Giuli, V.; Zecchin, R.; Salmaso, L.; Corain, L.; De Carlia, M. Measured and perceived indoor environmental quality: Padua Hospital case study. Build. Environ. 2013, 59, 211–226. [Google Scholar] [CrossRef]
- Khodakarami, J.; Knight, I. Required and current thermal conditions for occupants in iranian hospitals. HVAC&R Res. 2008, 14, 175–193. [Google Scholar]
- Nematchoua, M.K.; Ricciardi, P.; Reiter, S.; Asadi, S.; Demers, C.M.H. Thermal comfort and comparison of some parameters coming from hospitals and shopping centers under natural ventilation: The case of Madagascar Island. J. Build. Eng. 2017, 13, 196–206. [Google Scholar] [CrossRef] [Green Version]
- Nematchoua, M.K.; Ricciardia, P.; Burattic, C. Statistical analysis of indoor parameters an subjective responses of building occupants in a hot region of Indian ocean; a case of Madagascar island. Appl. Energy 2017, 208, 1562–1575. [Google Scholar] [CrossRef] [Green Version]
- Pourshaghaghy, A.; Omidvari, M. Examination of thermal comfort in a hospital using PMV-PPD model. Appl. Ergon. 2012, 43, 1089–1095. [Google Scholar] [CrossRef] [PubMed]
- Verheyen, J.; Theys, N.; Allonsius, L.; Descamps, F. Thermal comfort of patients: Objective and subjective measurements in patient rooms of a Belgian healthcare facility. Build. Environ. 2011, 46, 1195–1204. [Google Scholar] [CrossRef]
- Hashiguchi, N.; Hirakawa, M.; Tochihara, Y.; Kaji, Y.; Karaki, C. Effects of setting up of humidifiers on thermal conditions and subjective responses of patients and staff in a hospital during winter. Appl. Ergon. 2008, 39, 158–165. [Google Scholar] [CrossRef]
- Hashiguchi, N.; Hirakawa, M.; Tochihara, Y.; Kaji, Y.; Karaki, C. Thermal Environment and Subjective Responses of Patients and Staff in a Hospital during Winter. J. Physiol. Anthr. Appl. Hum. Sci. 2005, 24, 111–115. [Google Scholar] [CrossRef] [Green Version]
- ISO 28802:2012; Ergonomics of the Physical Environment—Assessment of Environments by Means of An Environmental Survey Involving Physical Measurements of the Environment and Subjective Responses of People. ISO: Geneva, Switzerland, 2012.
- ISO 10551:2019; Ergonomics of the Physical Environment—Subjective Judgement Scales for Assessing Physical Environments. ISO: Geneva, Switzerland, 2019.
- Available online: https://www.ekohigiena.com.pl/miernik-mikroklimatu-eha-mm-101 (accessed on 16 March 2022).
- Lin, Z.; Deng, S. A study on the thermal comfort in sleeping environments in the subtropics—Developing a thermal comfort model for sleeping environments. Build. Environ. 2008, 43, 70–81. [Google Scholar] [CrossRef]
- Gagge, A.P.; Fobelets, A.P.; Berglund, L.G. A standard predictive index of human response to the thermal environment. ASHRAE Trans. 1986, 92, 709–731. [Google Scholar]
- de Dear, R.; Brager, G.S. Developing an Adaptive Model of Thermal Comfort and Preference-Final Report (ASHRAE RP-884); ASHRAE: Atlanta, GA, USA, 1997. [Google Scholar]
- ISO 28803:2012; Ergonomics of the Physical Environment—Application of International Standards to People with Special Requirements. International Organization for Standardization: Geneva, Switzerland, 2012.
- Lin, Z.; Deng, S. A study on the thermal comfort in sleeping environments in the subtropics—Measuring the total insulation values for the bedding systems commonly used in the. Build. Environ. 2008, 43, 905–916. [Google Scholar] [CrossRef]
- ISO 9920:2007; Ergonomics of the Thermal Environment—Estimation of Thermal Insulation and Water Vapour Resistance of a Clothing Ensemble. ISO: Geneva, Switzerland, 2007.
- Hasan, M.H.; Alsaleem, F.; Rafaie, M. Sensitivity study for the PMV thermal comfort model and the use of wearable devices biometric data for metabolic rate estimation. Build. Environ. 2016, 110, 173–183. [Google Scholar] [CrossRef]
- Skoog, J.; Fransson, N.; Jagemar, L. Thermal environment in Swedish hospitals: Summer and winter measurements. Energy Build. 2005, 37, 872–877. [Google Scholar] [CrossRef]
- Sattayakorn, S.; Ichinose, M.; Sasaki, R. Clarifying thermal comfort of healthcare occupants in tropical region: A case of indoor environment in Thai hospitals. Energy Build. 2017, 149, 45–57. [Google Scholar] [CrossRef]
- Uścinowicz, P.; Chludzinska, M.; Bogdan, A. Thermal environment conditions in Polish operating rooms. Build. Environ. 2015, 94, 296–304. [Google Scholar] [CrossRef]


| Reference | Number of Patients in General Studies | Number of Patients in the Analyses of the Components of Thermal Comfort |
|---|---|---|
| de Giuli et al. [16] | 35 | 15 |
| Hwang et al. [14] | 927 | 345 |
| Khodakarmi et al. [17] | 56 | - |
| Nematchoua et al. [18,19] | 198 | - |
| Webb et al. [13] | 32 | 16 |
| Pourshaghaghy et al. [20] | 84 | 37 |
| Verheyen et al. [21] | 99 | 14 |
| Hashiguchi et al. [22,23] | 36 | 14 |
Publisher’s Note: MDPI stays neutral with regard to jurisdictional claims in published maps and institutional affiliations. |
© 2022 by the authors. Licensee MDPI, Basel, Switzerland. This article is an open access article distributed under the terms and conditions of the Creative Commons Attribution (CC BY) license (https://creativecommons.org/licenses/by/4.0/).
Share and Cite
Uścinowicz, P.; Bogdan, A. Directions of Modification of the Model of Perception of the Thermal Environment by Patients of Selected Hospital Wards. Energies 2022, 15, 3965. https://doi.org/10.3390/en15113965
Uścinowicz P, Bogdan A. Directions of Modification of the Model of Perception of the Thermal Environment by Patients of Selected Hospital Wards. Energies. 2022; 15(11):3965. https://doi.org/10.3390/en15113965
Chicago/Turabian StyleUścinowicz, Piotr, and Anna Bogdan. 2022. "Directions of Modification of the Model of Perception of the Thermal Environment by Patients of Selected Hospital Wards" Energies 15, no. 11: 3965. https://doi.org/10.3390/en15113965
APA StyleUścinowicz, P., & Bogdan, A. (2022). Directions of Modification of the Model of Perception of the Thermal Environment by Patients of Selected Hospital Wards. Energies, 15(11), 3965. https://doi.org/10.3390/en15113965