
The Required Amount of Ventilation Air for the Classroom and the Possibility of Air Infiltration through the Windows


Abstract
:1. Introduction
- functional characteristics of buildings related to ensuring appropriate lighting conditions;
- seasonal heat consumption for the purpose of heating the classroom, due to the fact that the thermal insulation of windows is usually much worse than that of exterior walls;
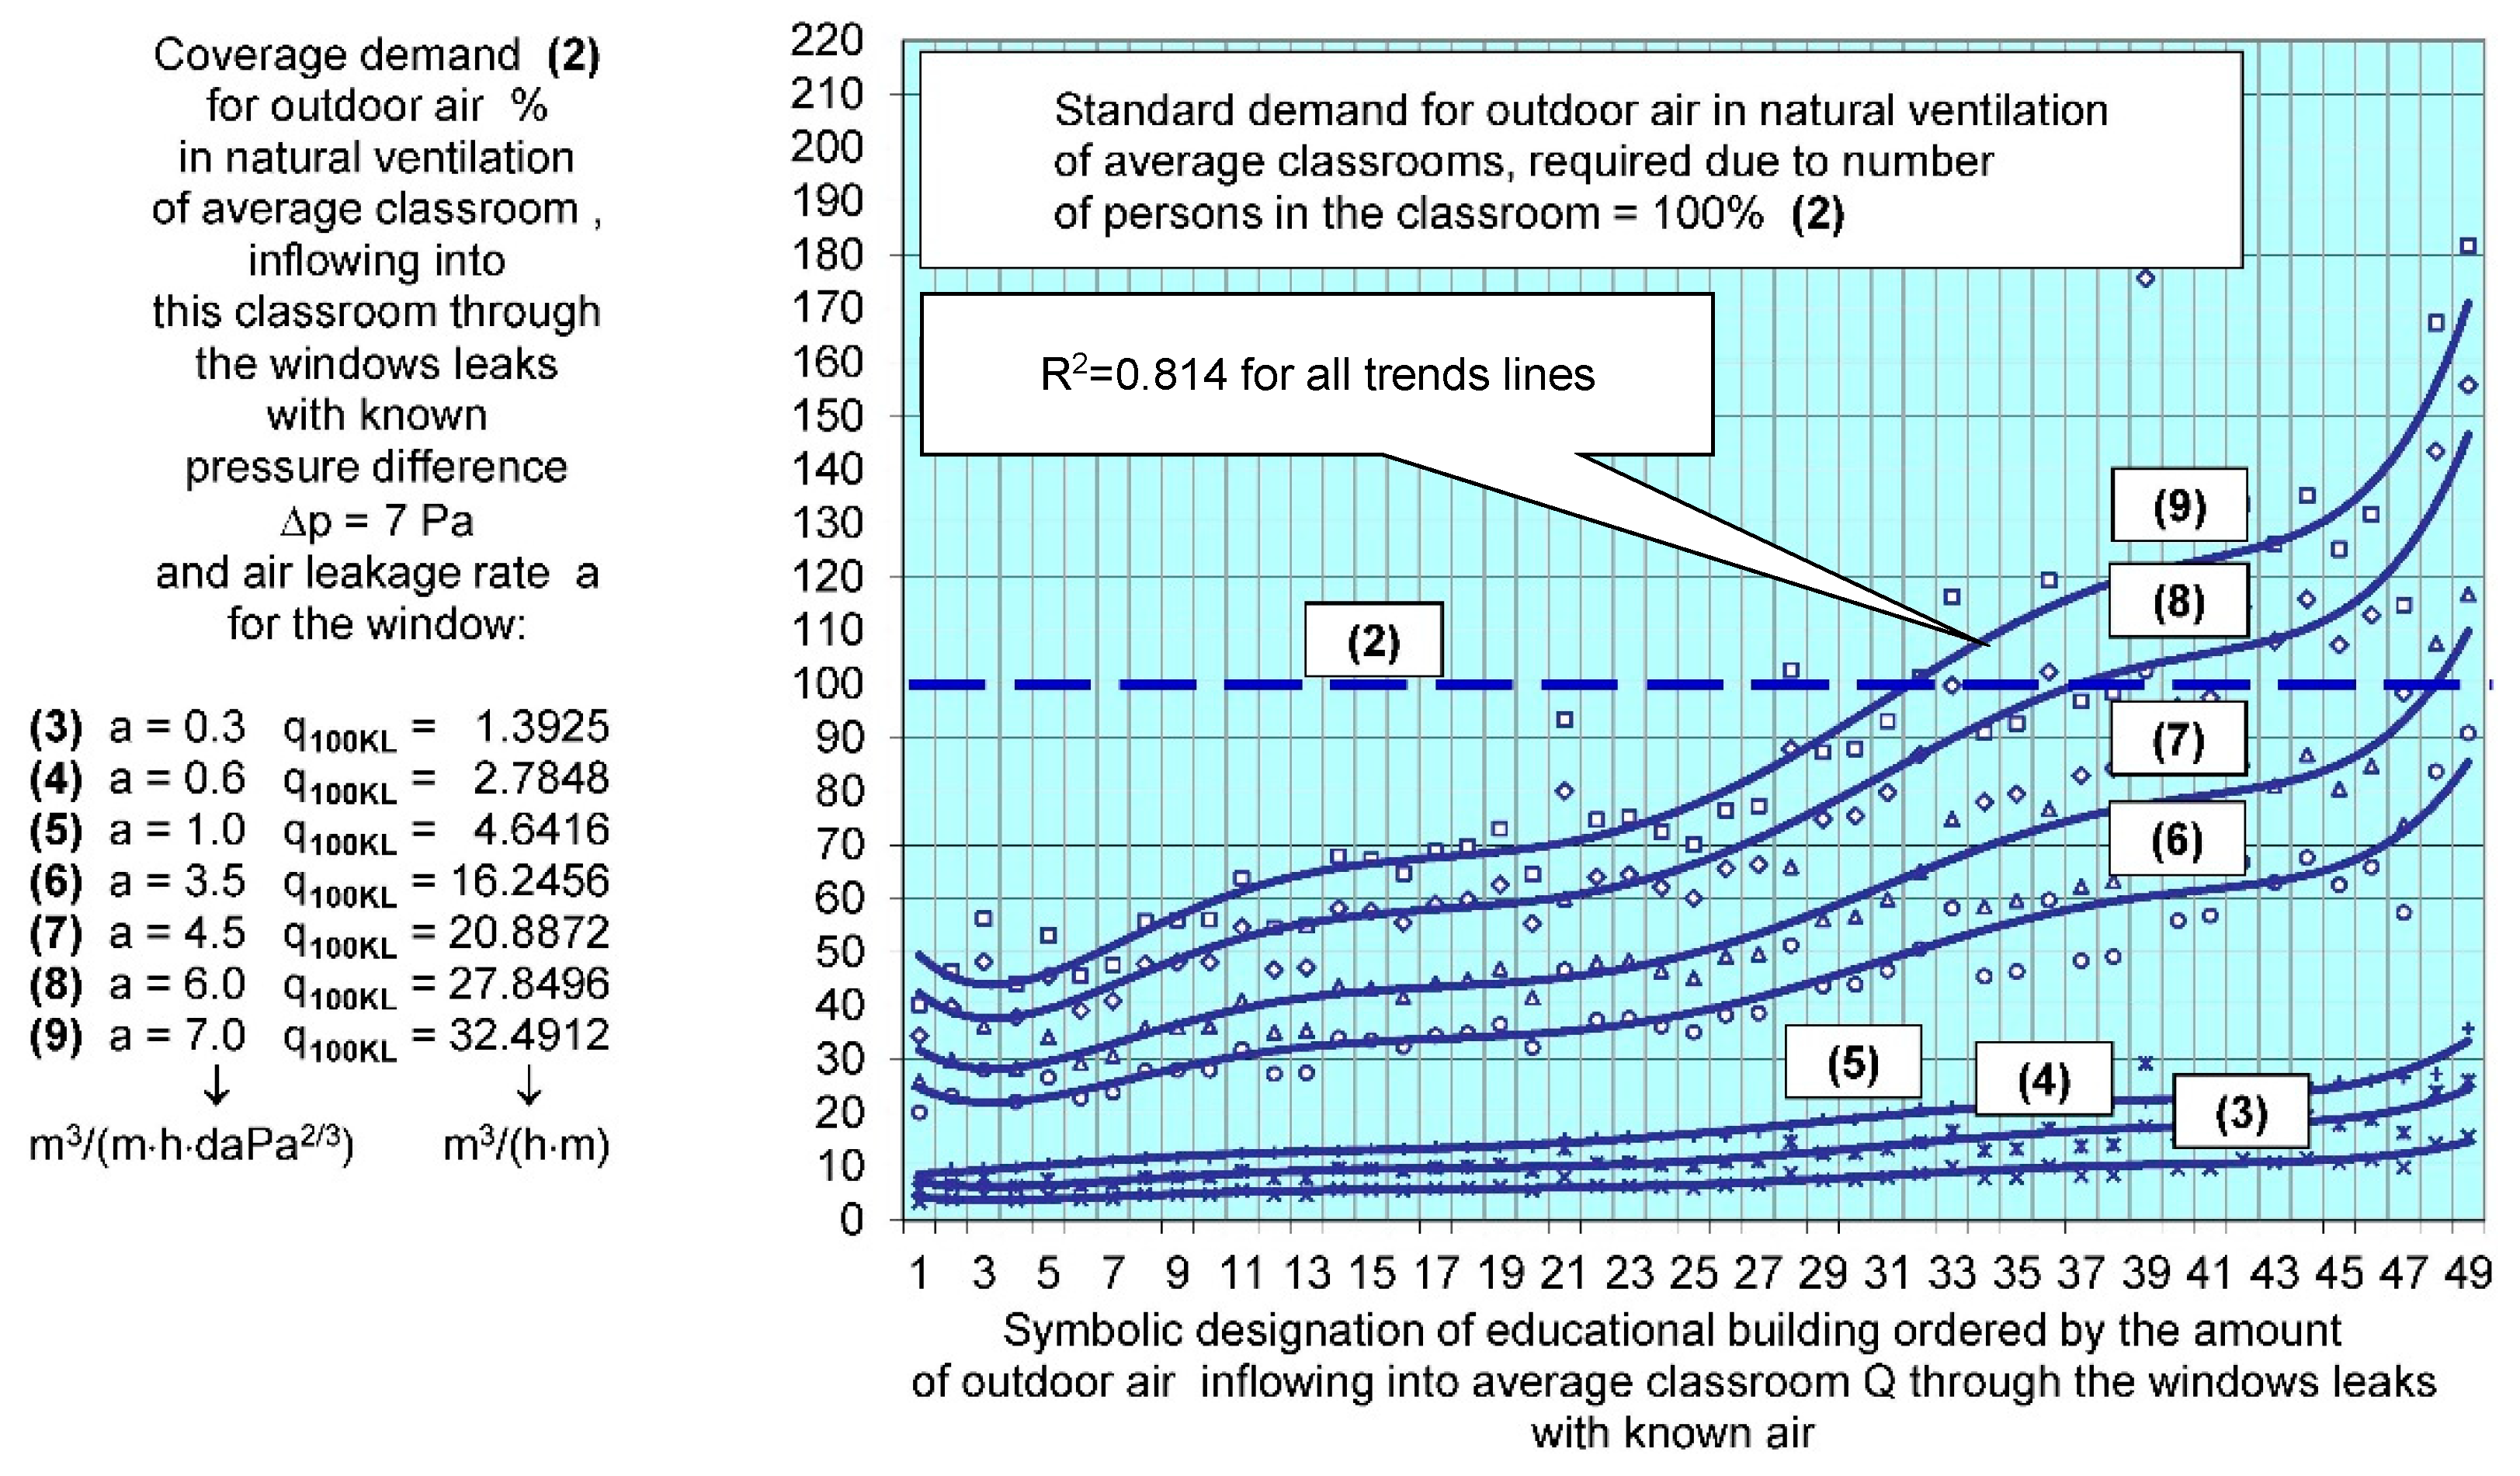
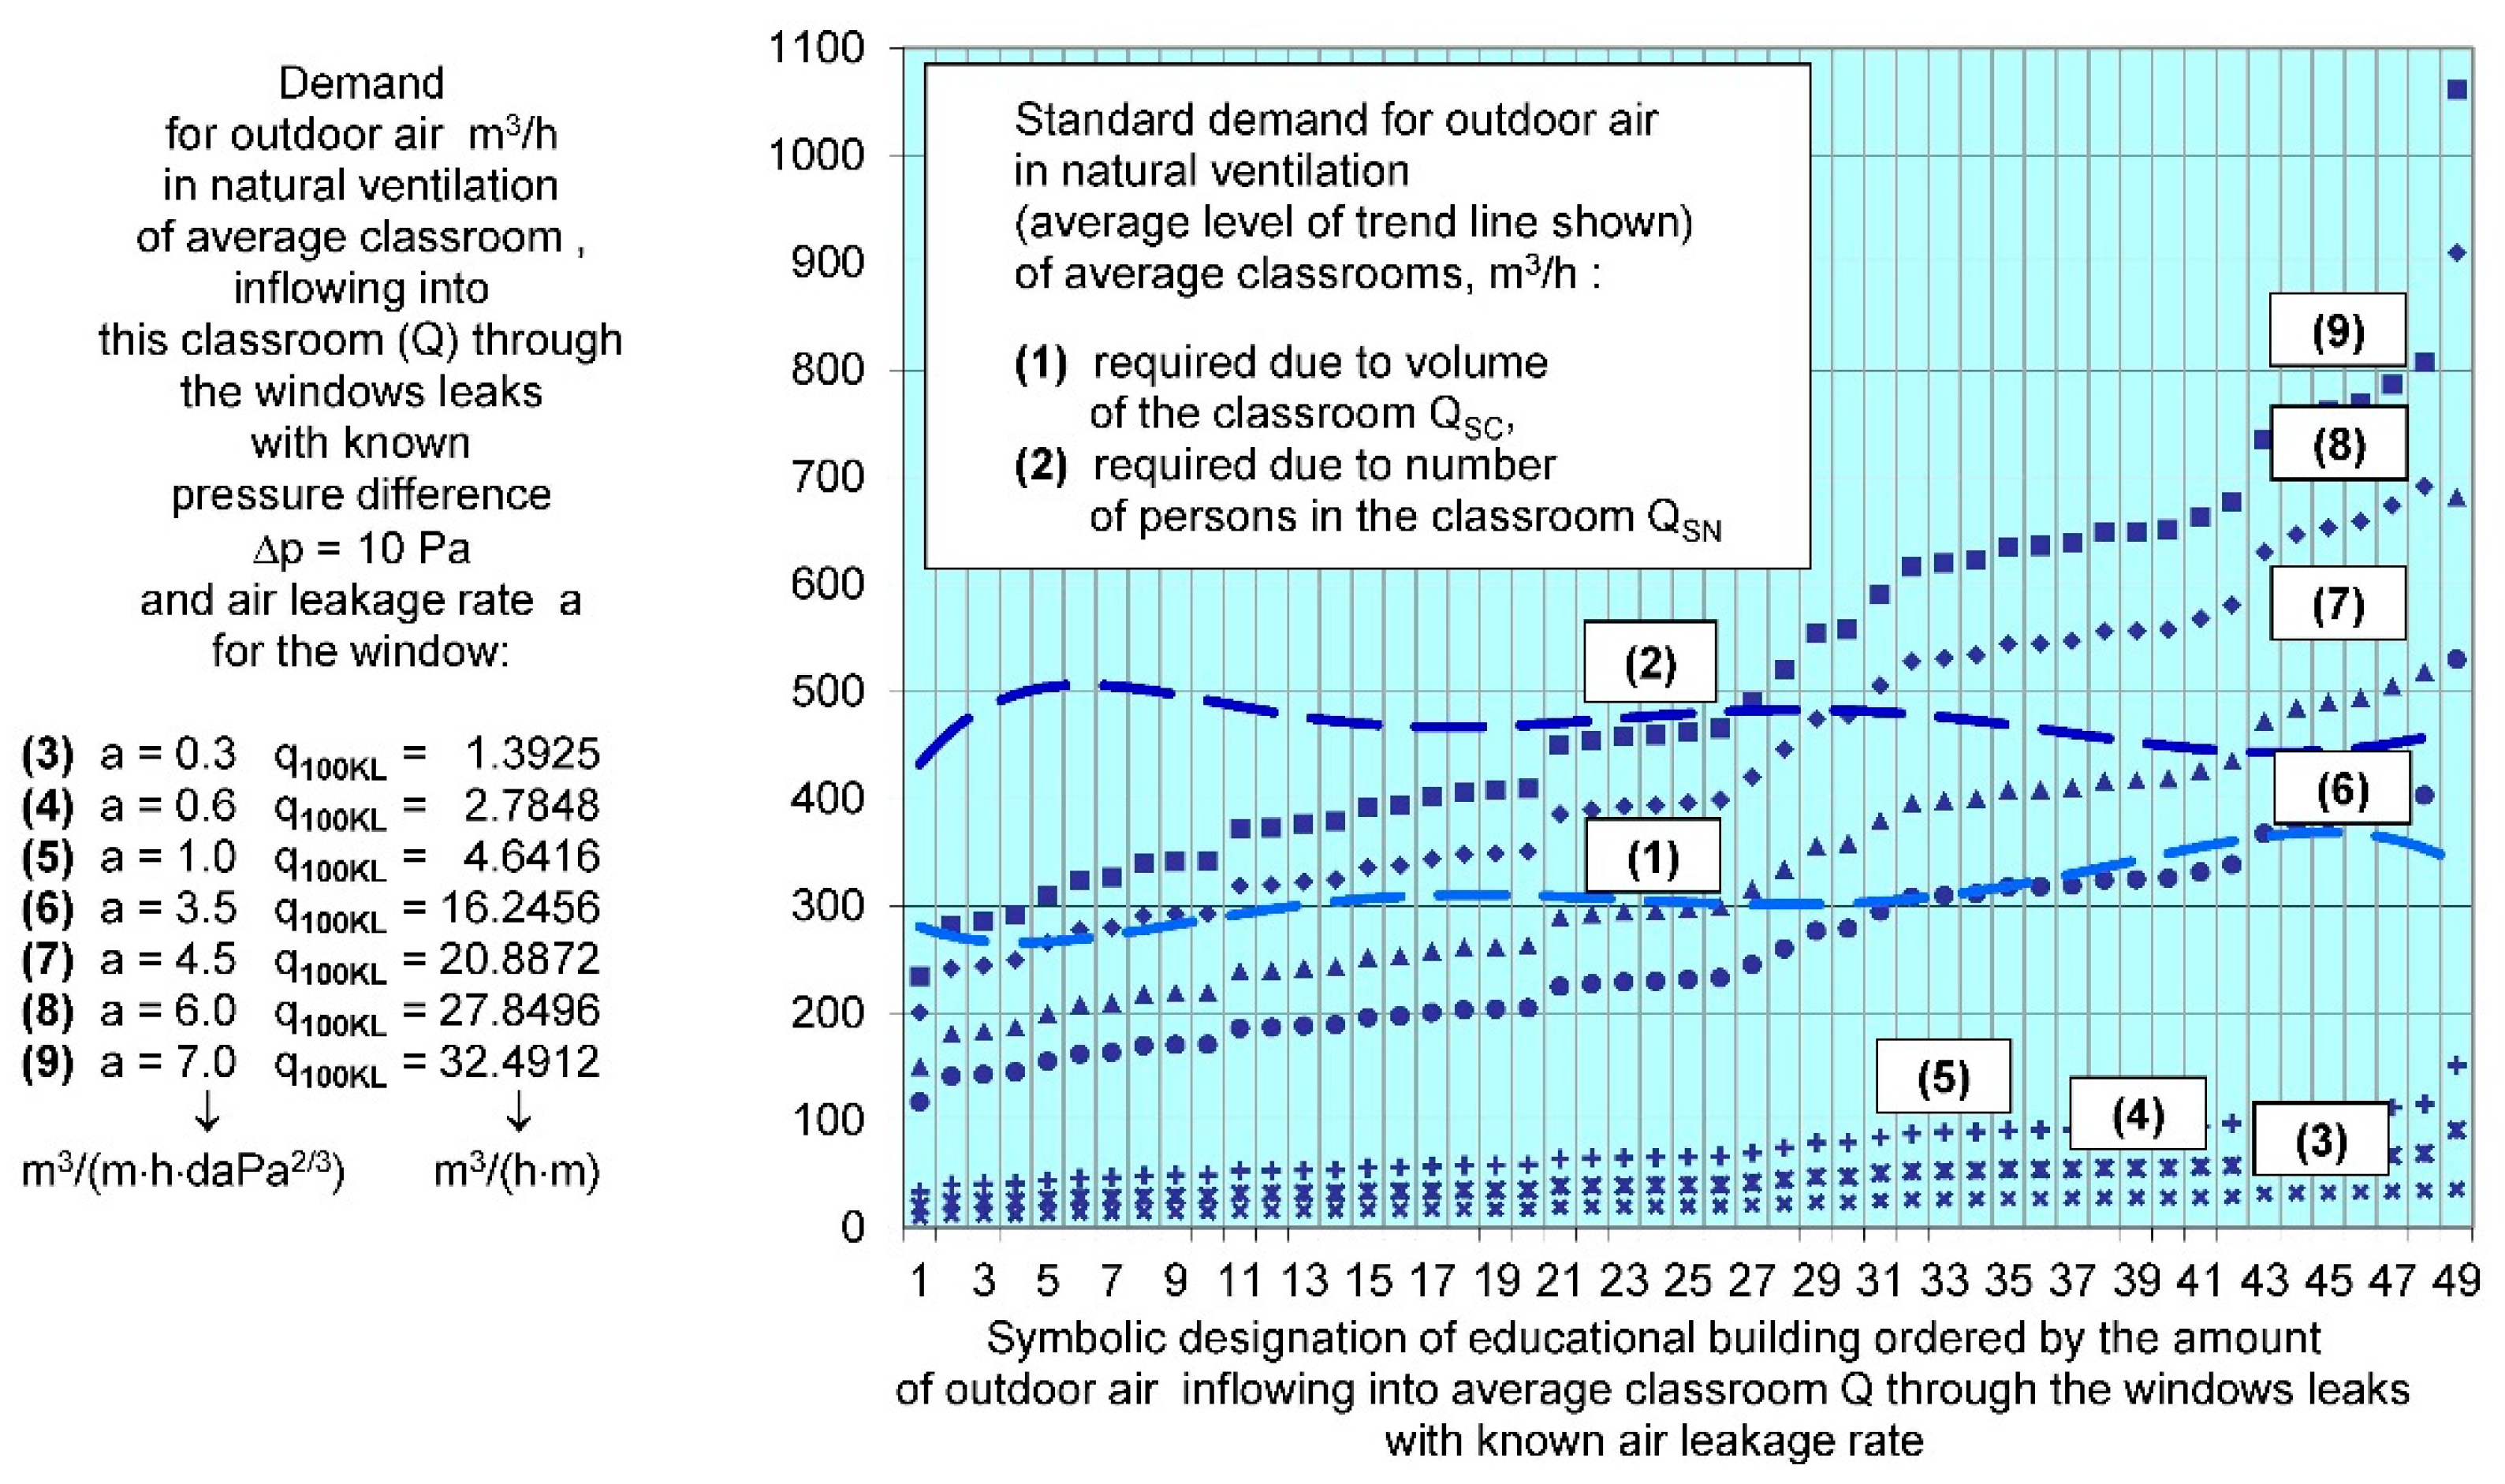
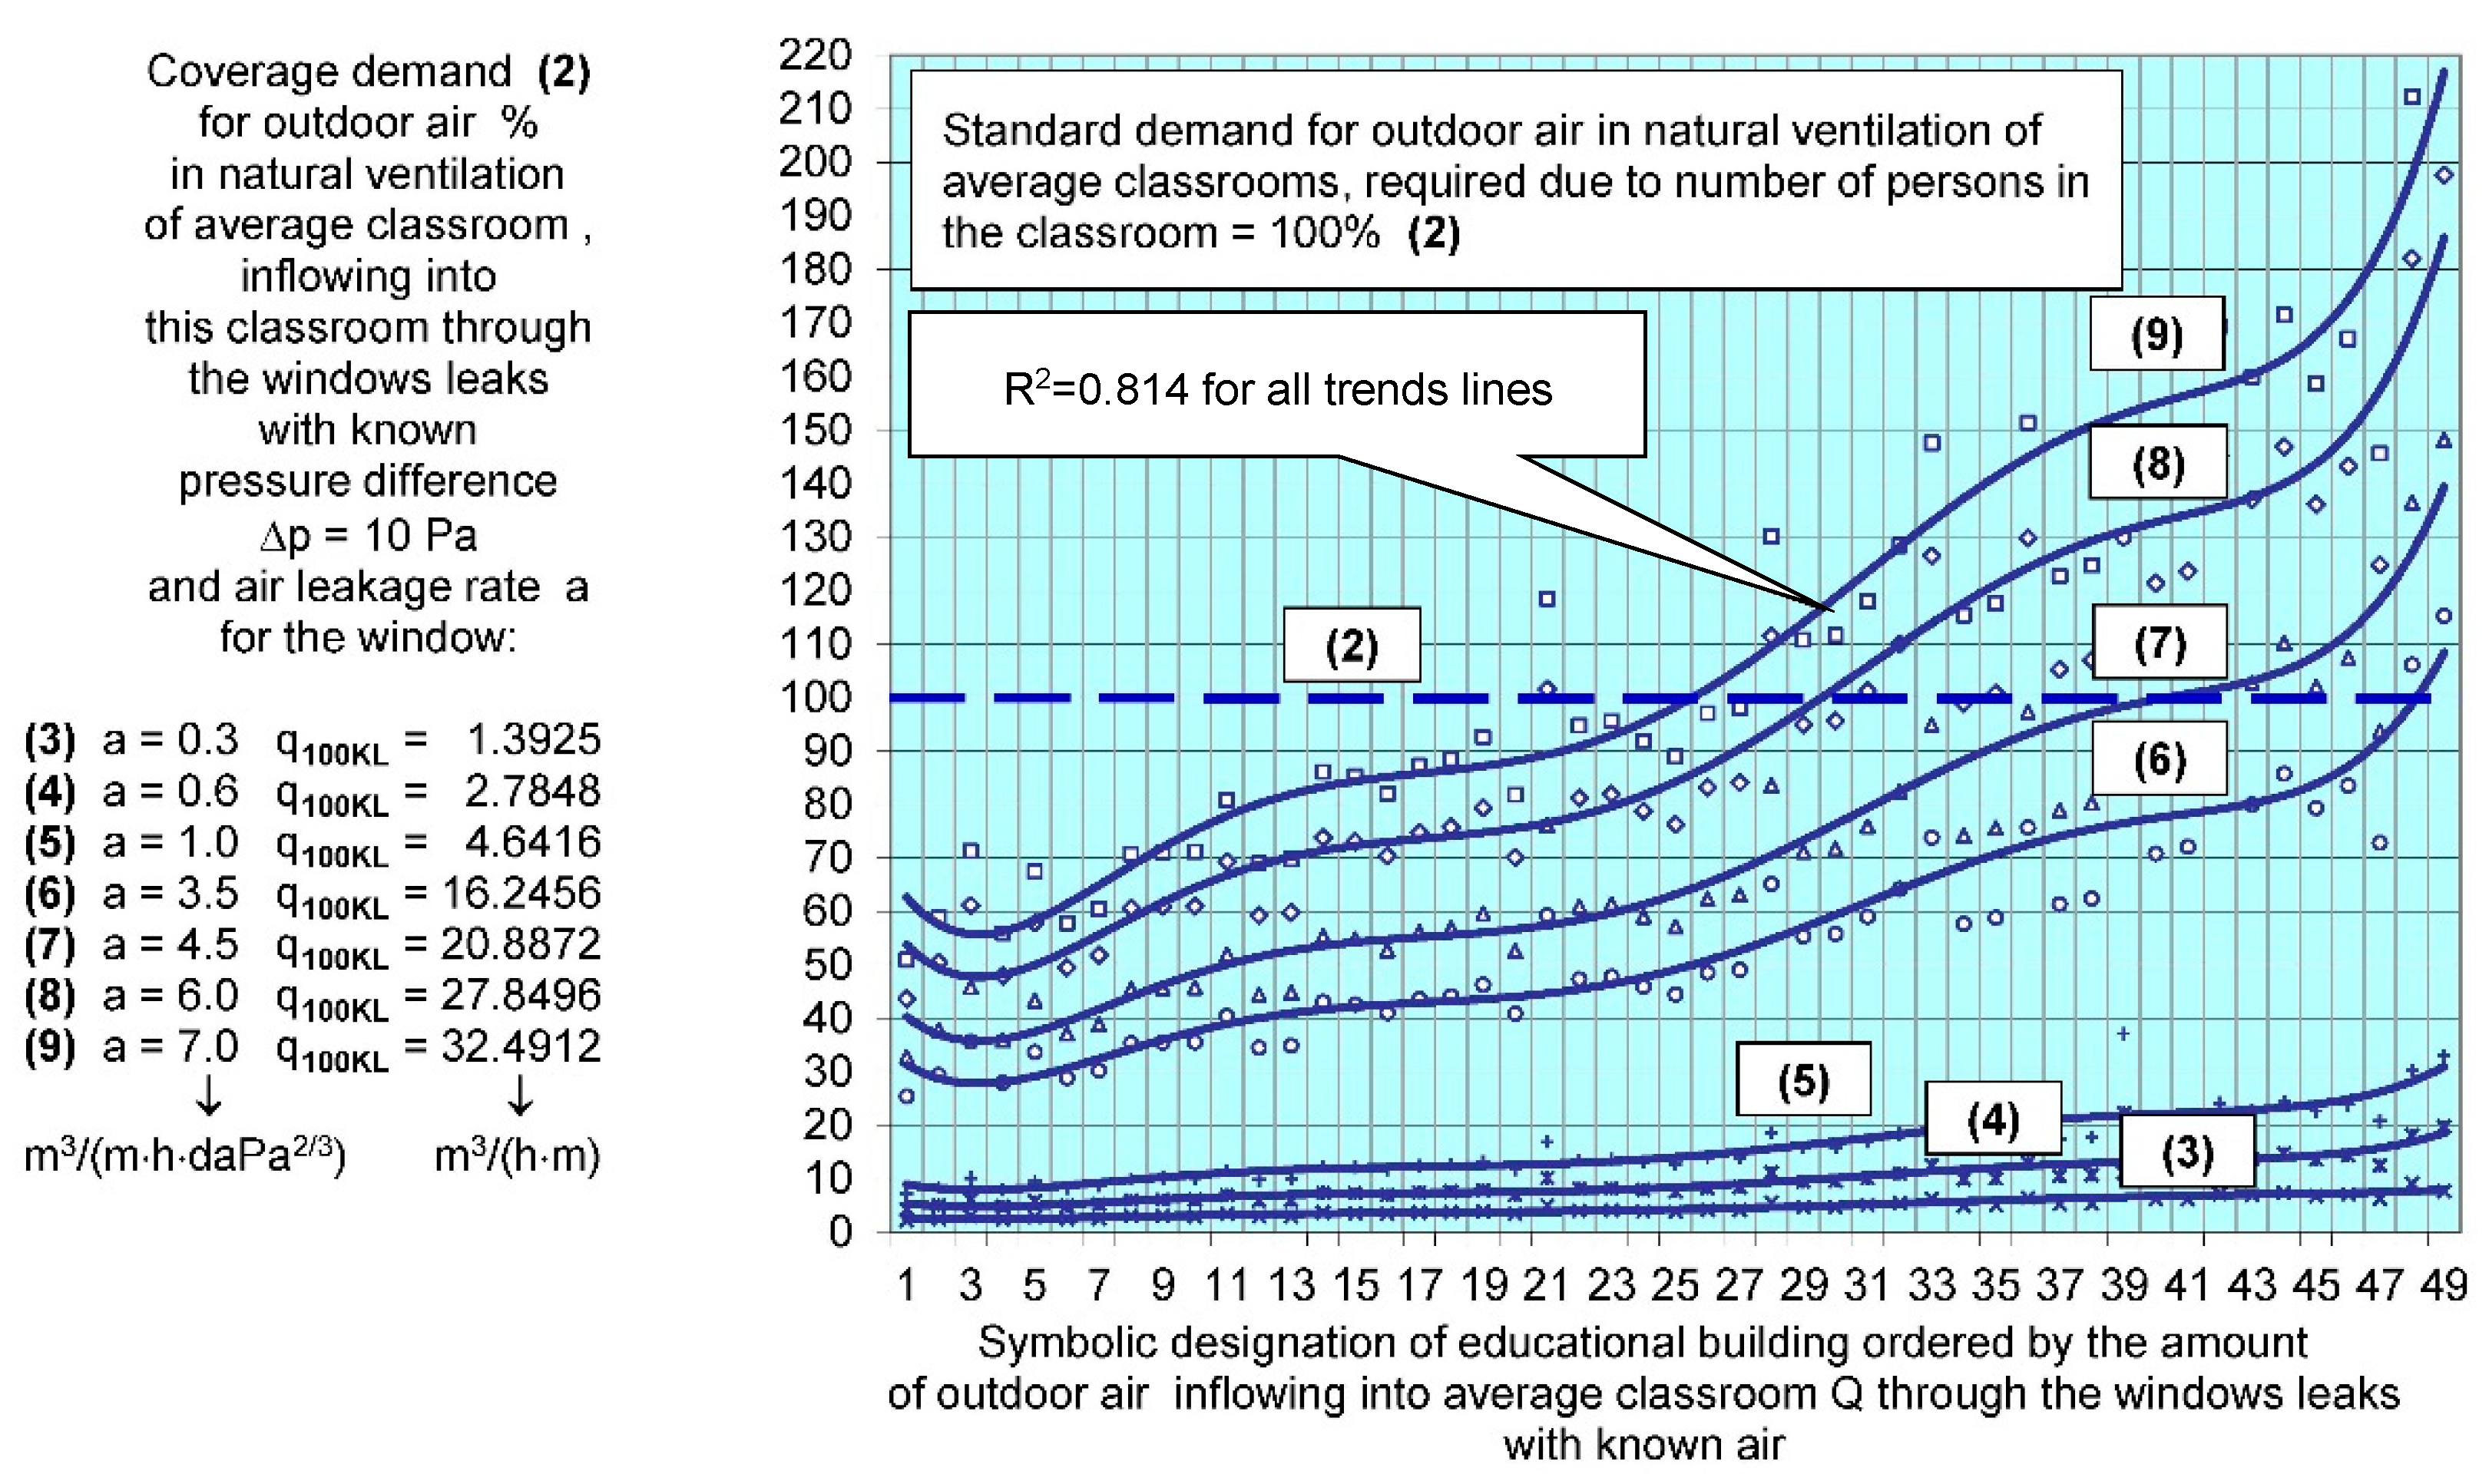
- natural (gravity) ventilation of rooms where fresh air flows in through the windows with a specific air leakage coefficient a (in Poland), expressed in m3/(h m daPa2/3) or q100KL expressed in m3/(h m) and which ensures or does not ensure inflow of the required amounts of fresh air into the room, even when the windows are closed.
- Is it theoretically possible to supply enough air to satisfy the ventilation requirements? What is the tightness of the windows to make this possible?
- What are the consequences of the analysis results for the functioning of the gravity ventilation system?
- What are the consequences of the results of the conducted analysis for the modernization and thermo-modernization of school buildings?
2. Research
- calculation of the cubature of an average classroom in a given object;
- establishment of the number of people staying in an average classroom in a given object;
- calculation of a normative quantity of fresh air with respect to the classroom cubature;
- calculation of a normative quantity of fresh air with respect to the number of students staying in the classroom;
- comparison of calculated values and establishment of which one of them is higher;
- establishment of the number and location of windows in the school, including the windows considered to be typical for a given object;
- establishment of the number of typical windows per average classroom;
- establishment of the perimeter of windows and opening sashes per classroom;
- establishment of the length and dimensions of leaks in typical windows, found in an average (for a given building) classroom;
- calculation of the probable quantity of outdoor air flowing into the classroom with respect to the local climate and technical conditions;
- refinement of the comparison of the requirements concerning ventilation of analysed rooms with the probable existing situation in this respect;
- drawing conclusions.
2.1. Methodology
2.2. Educational Buildings and Classrooms
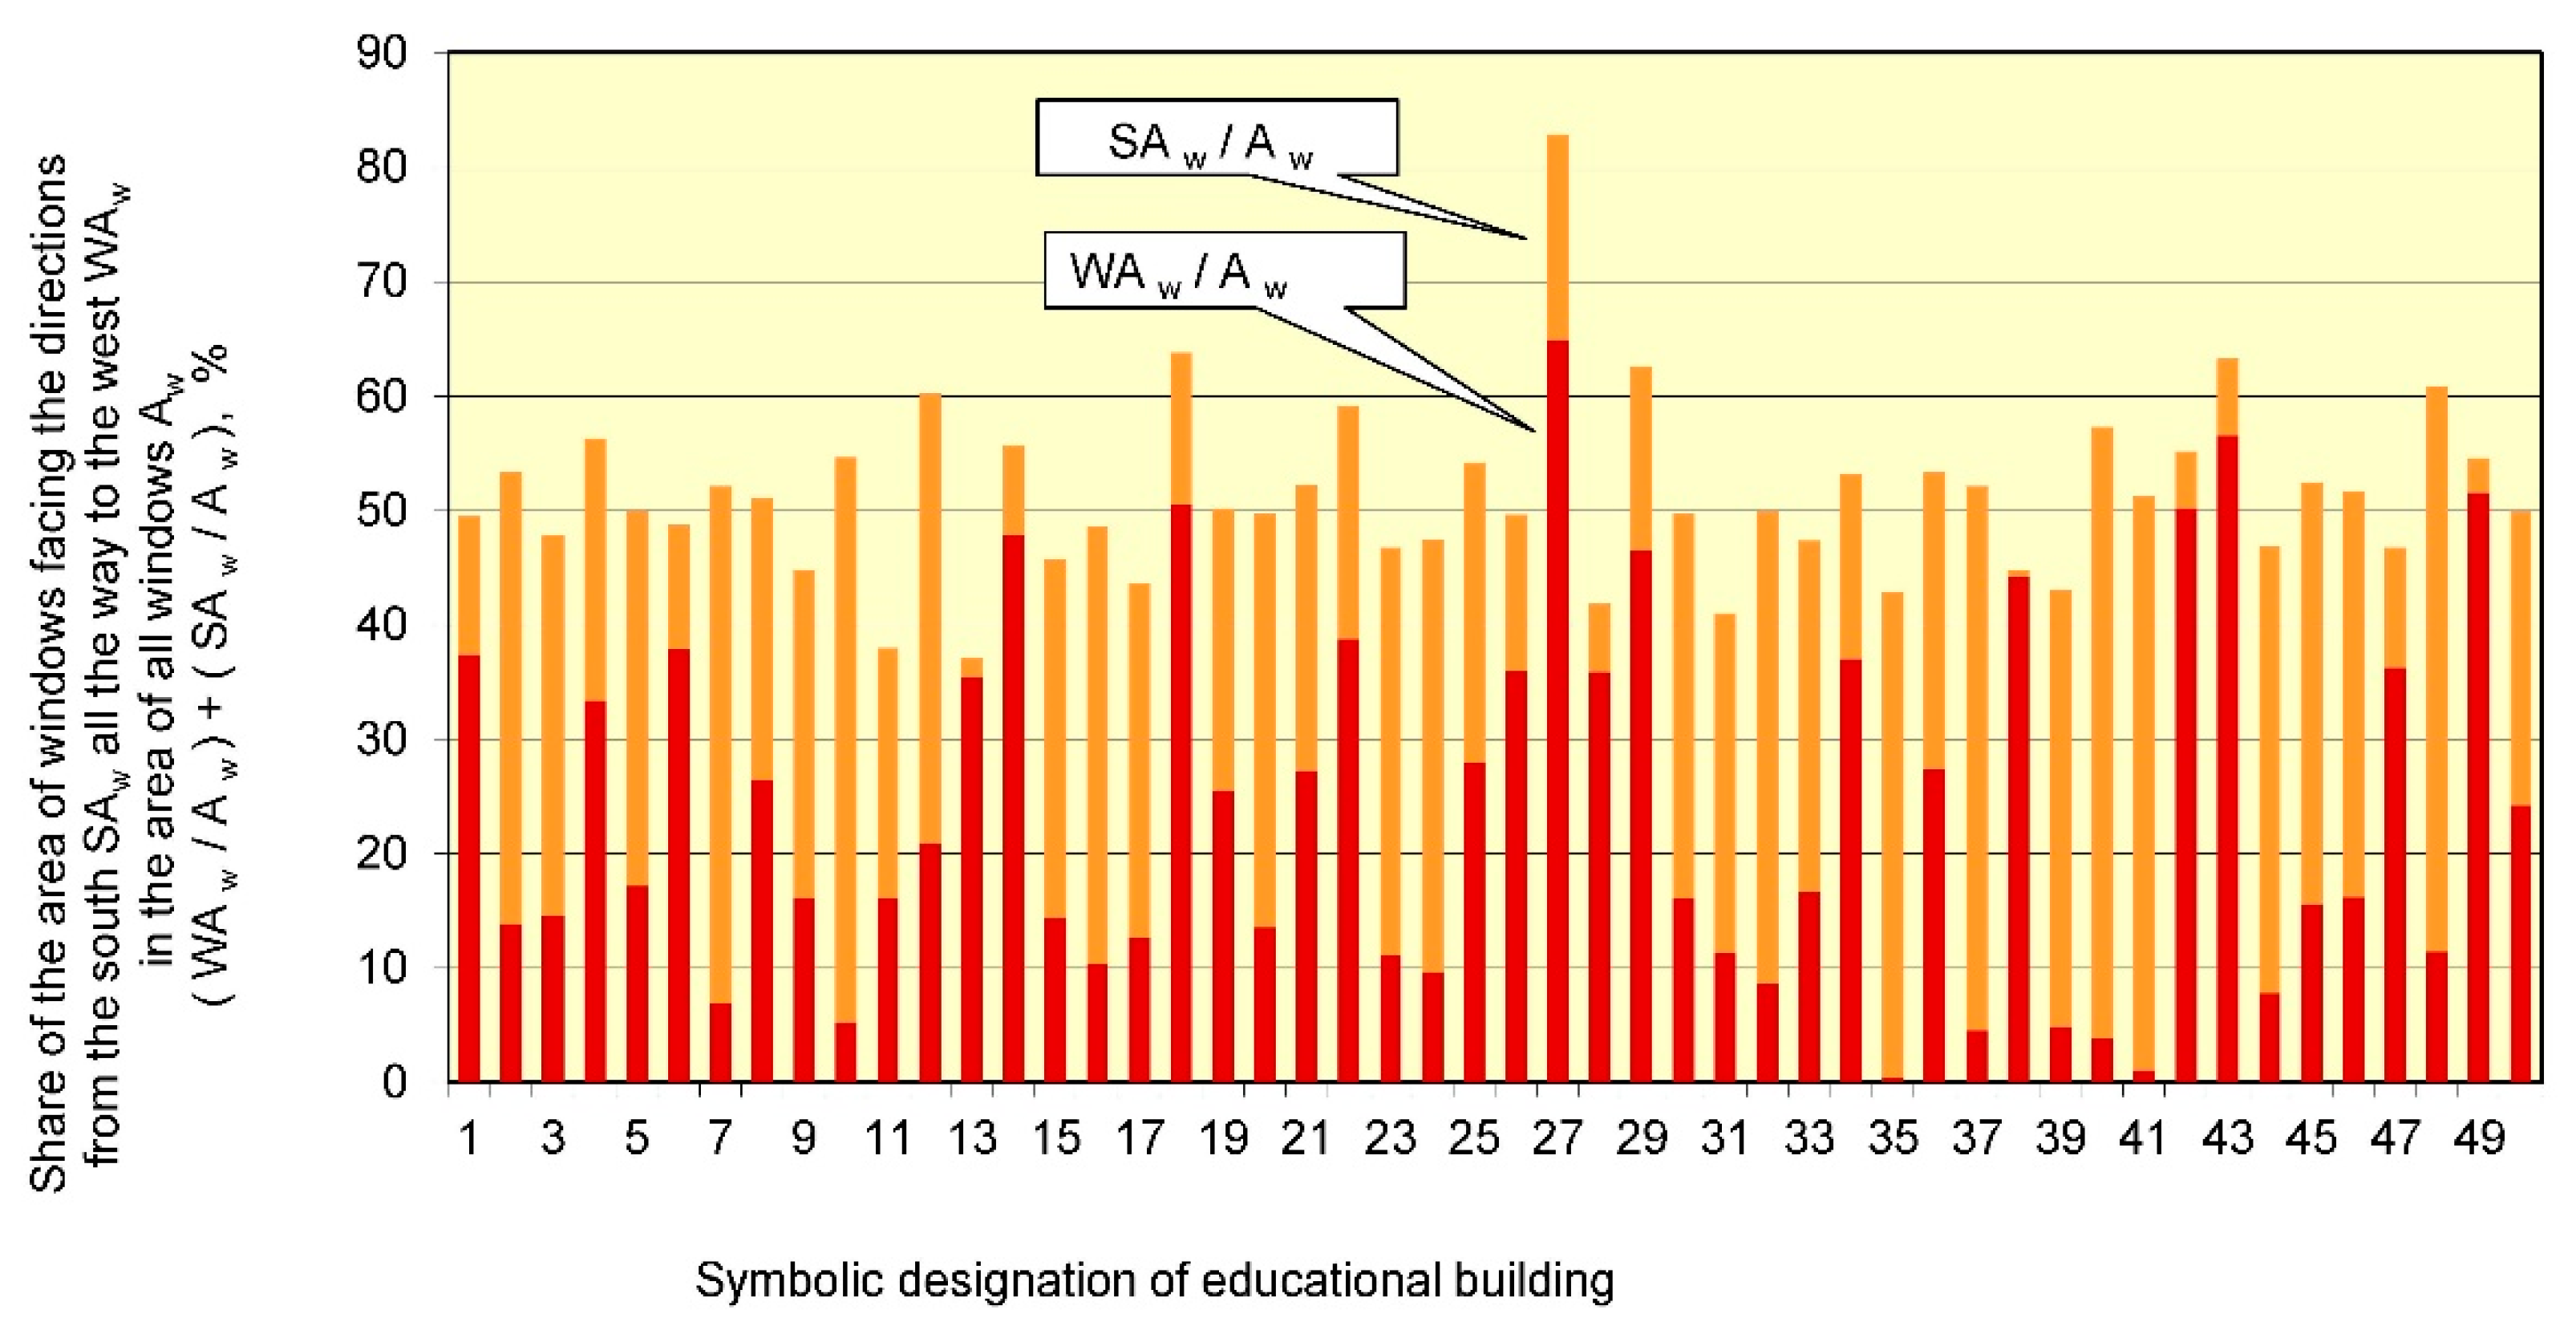
2.3. Windows in Classrooms
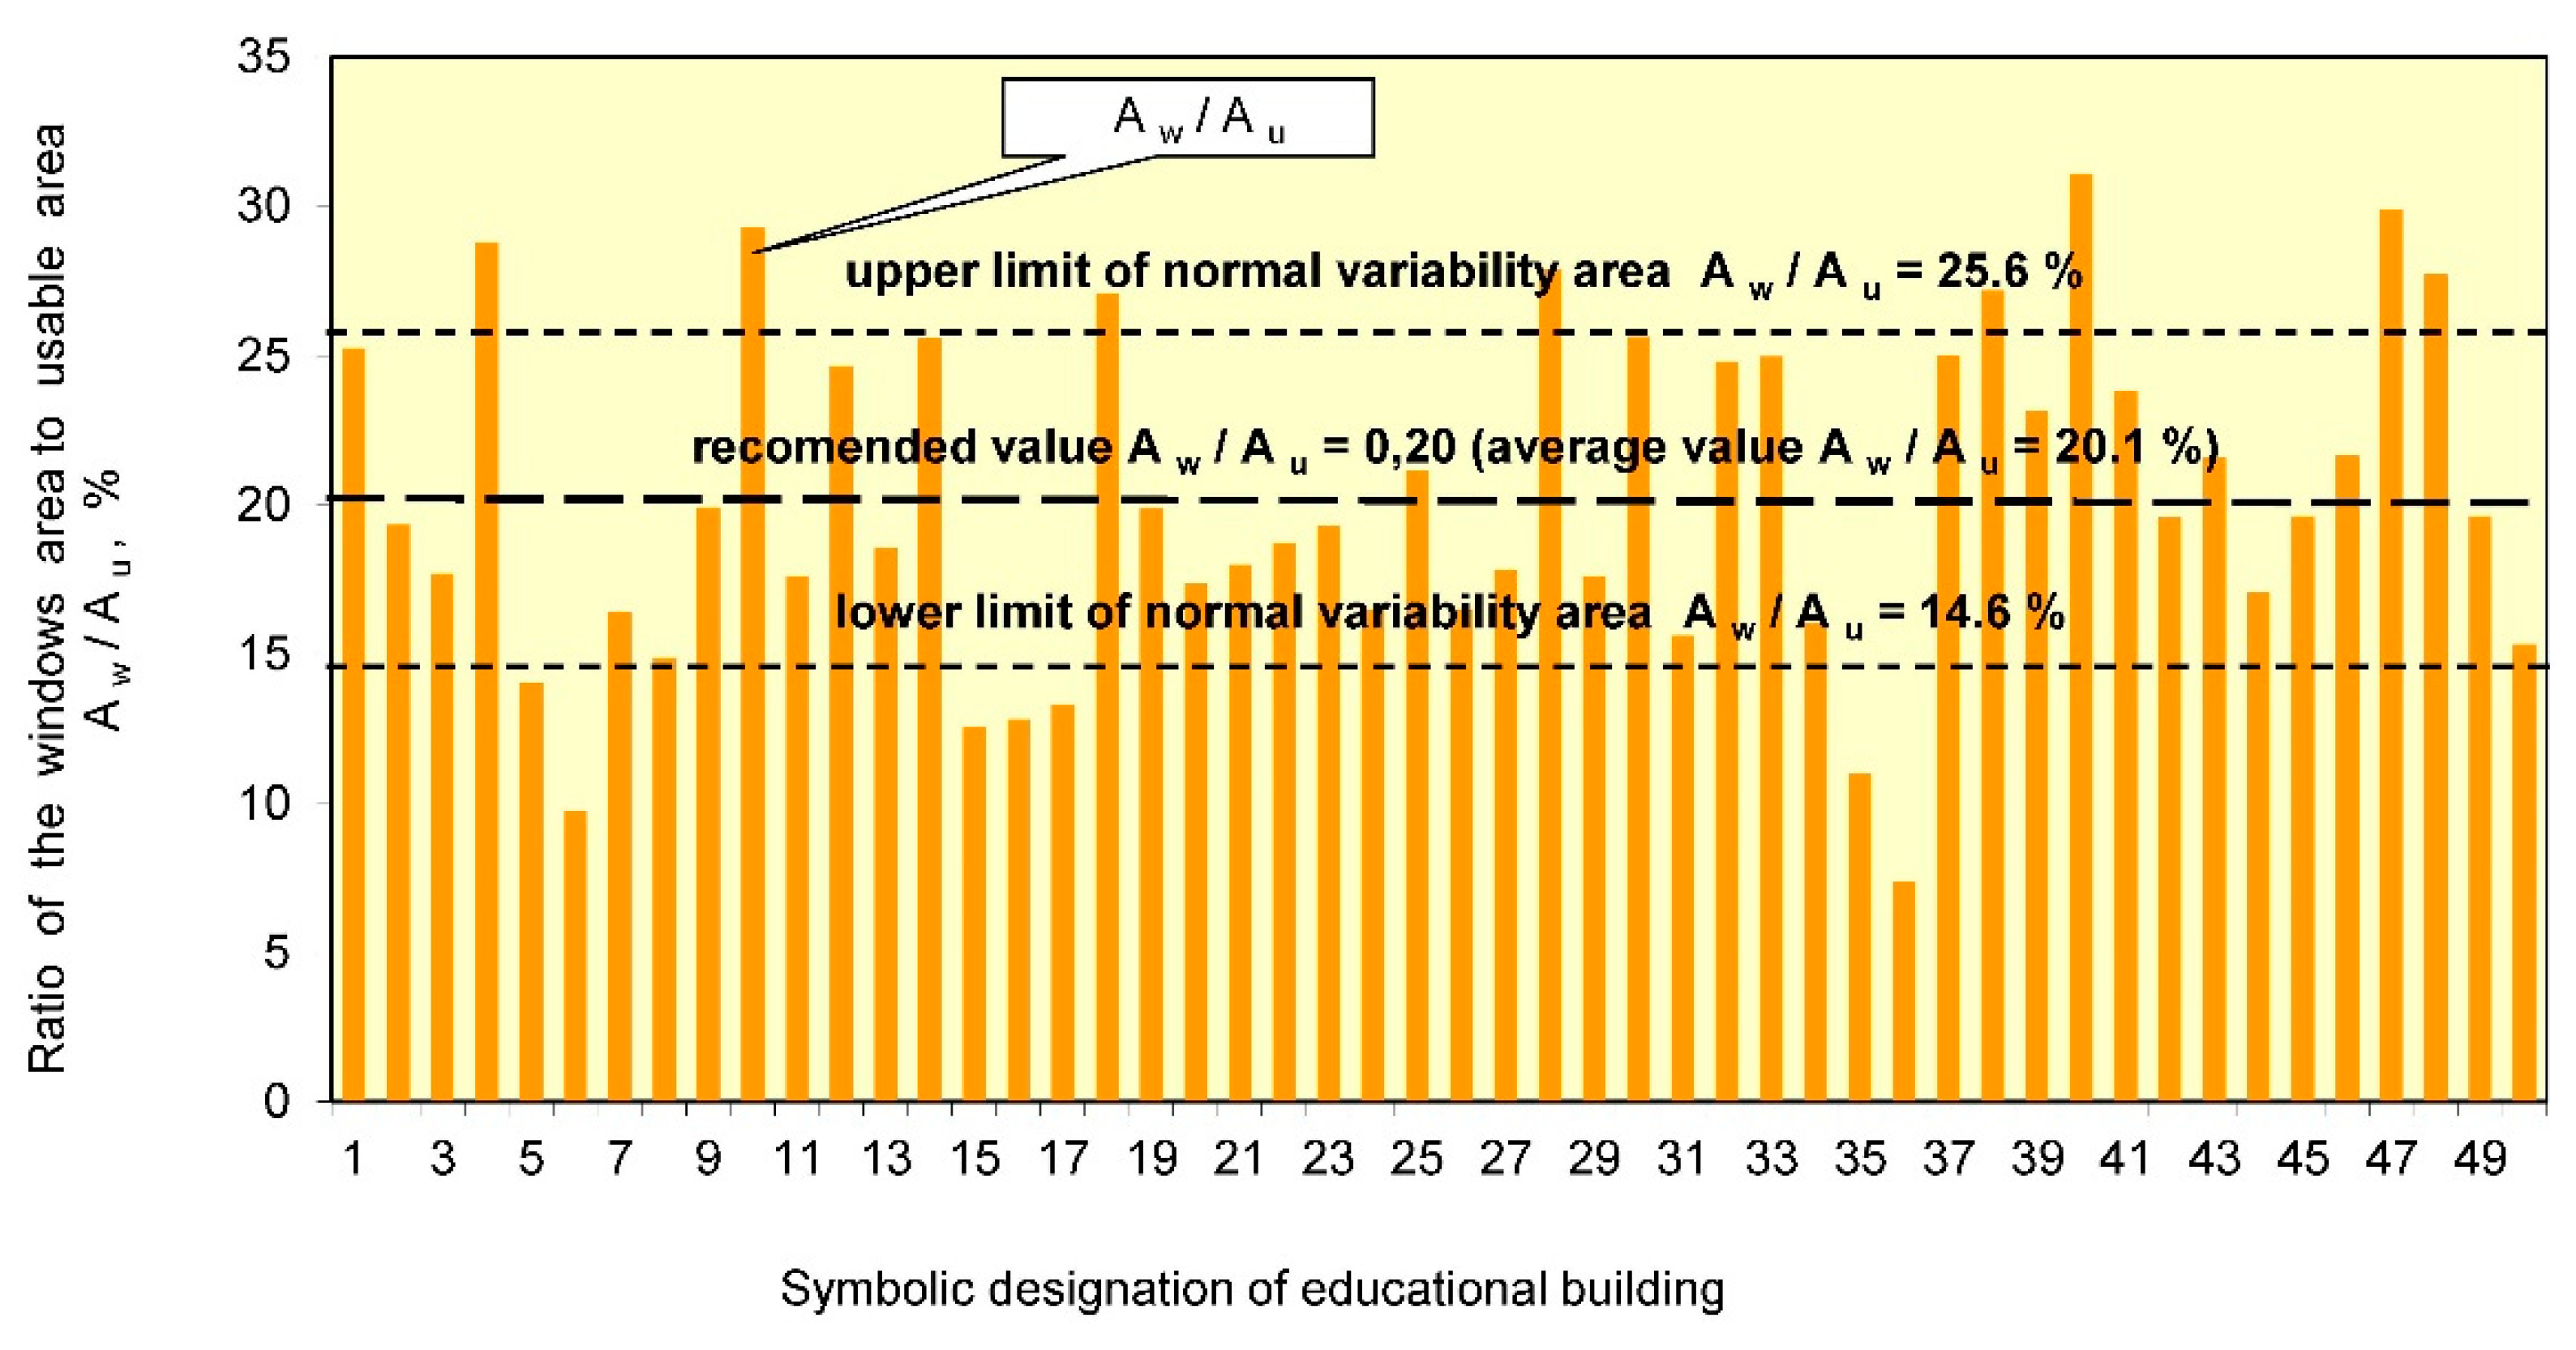
- simplified daylight illuminance indicator, defined as a ratio of windows area Aw to the usable area Au, and designated as Aw/Au;
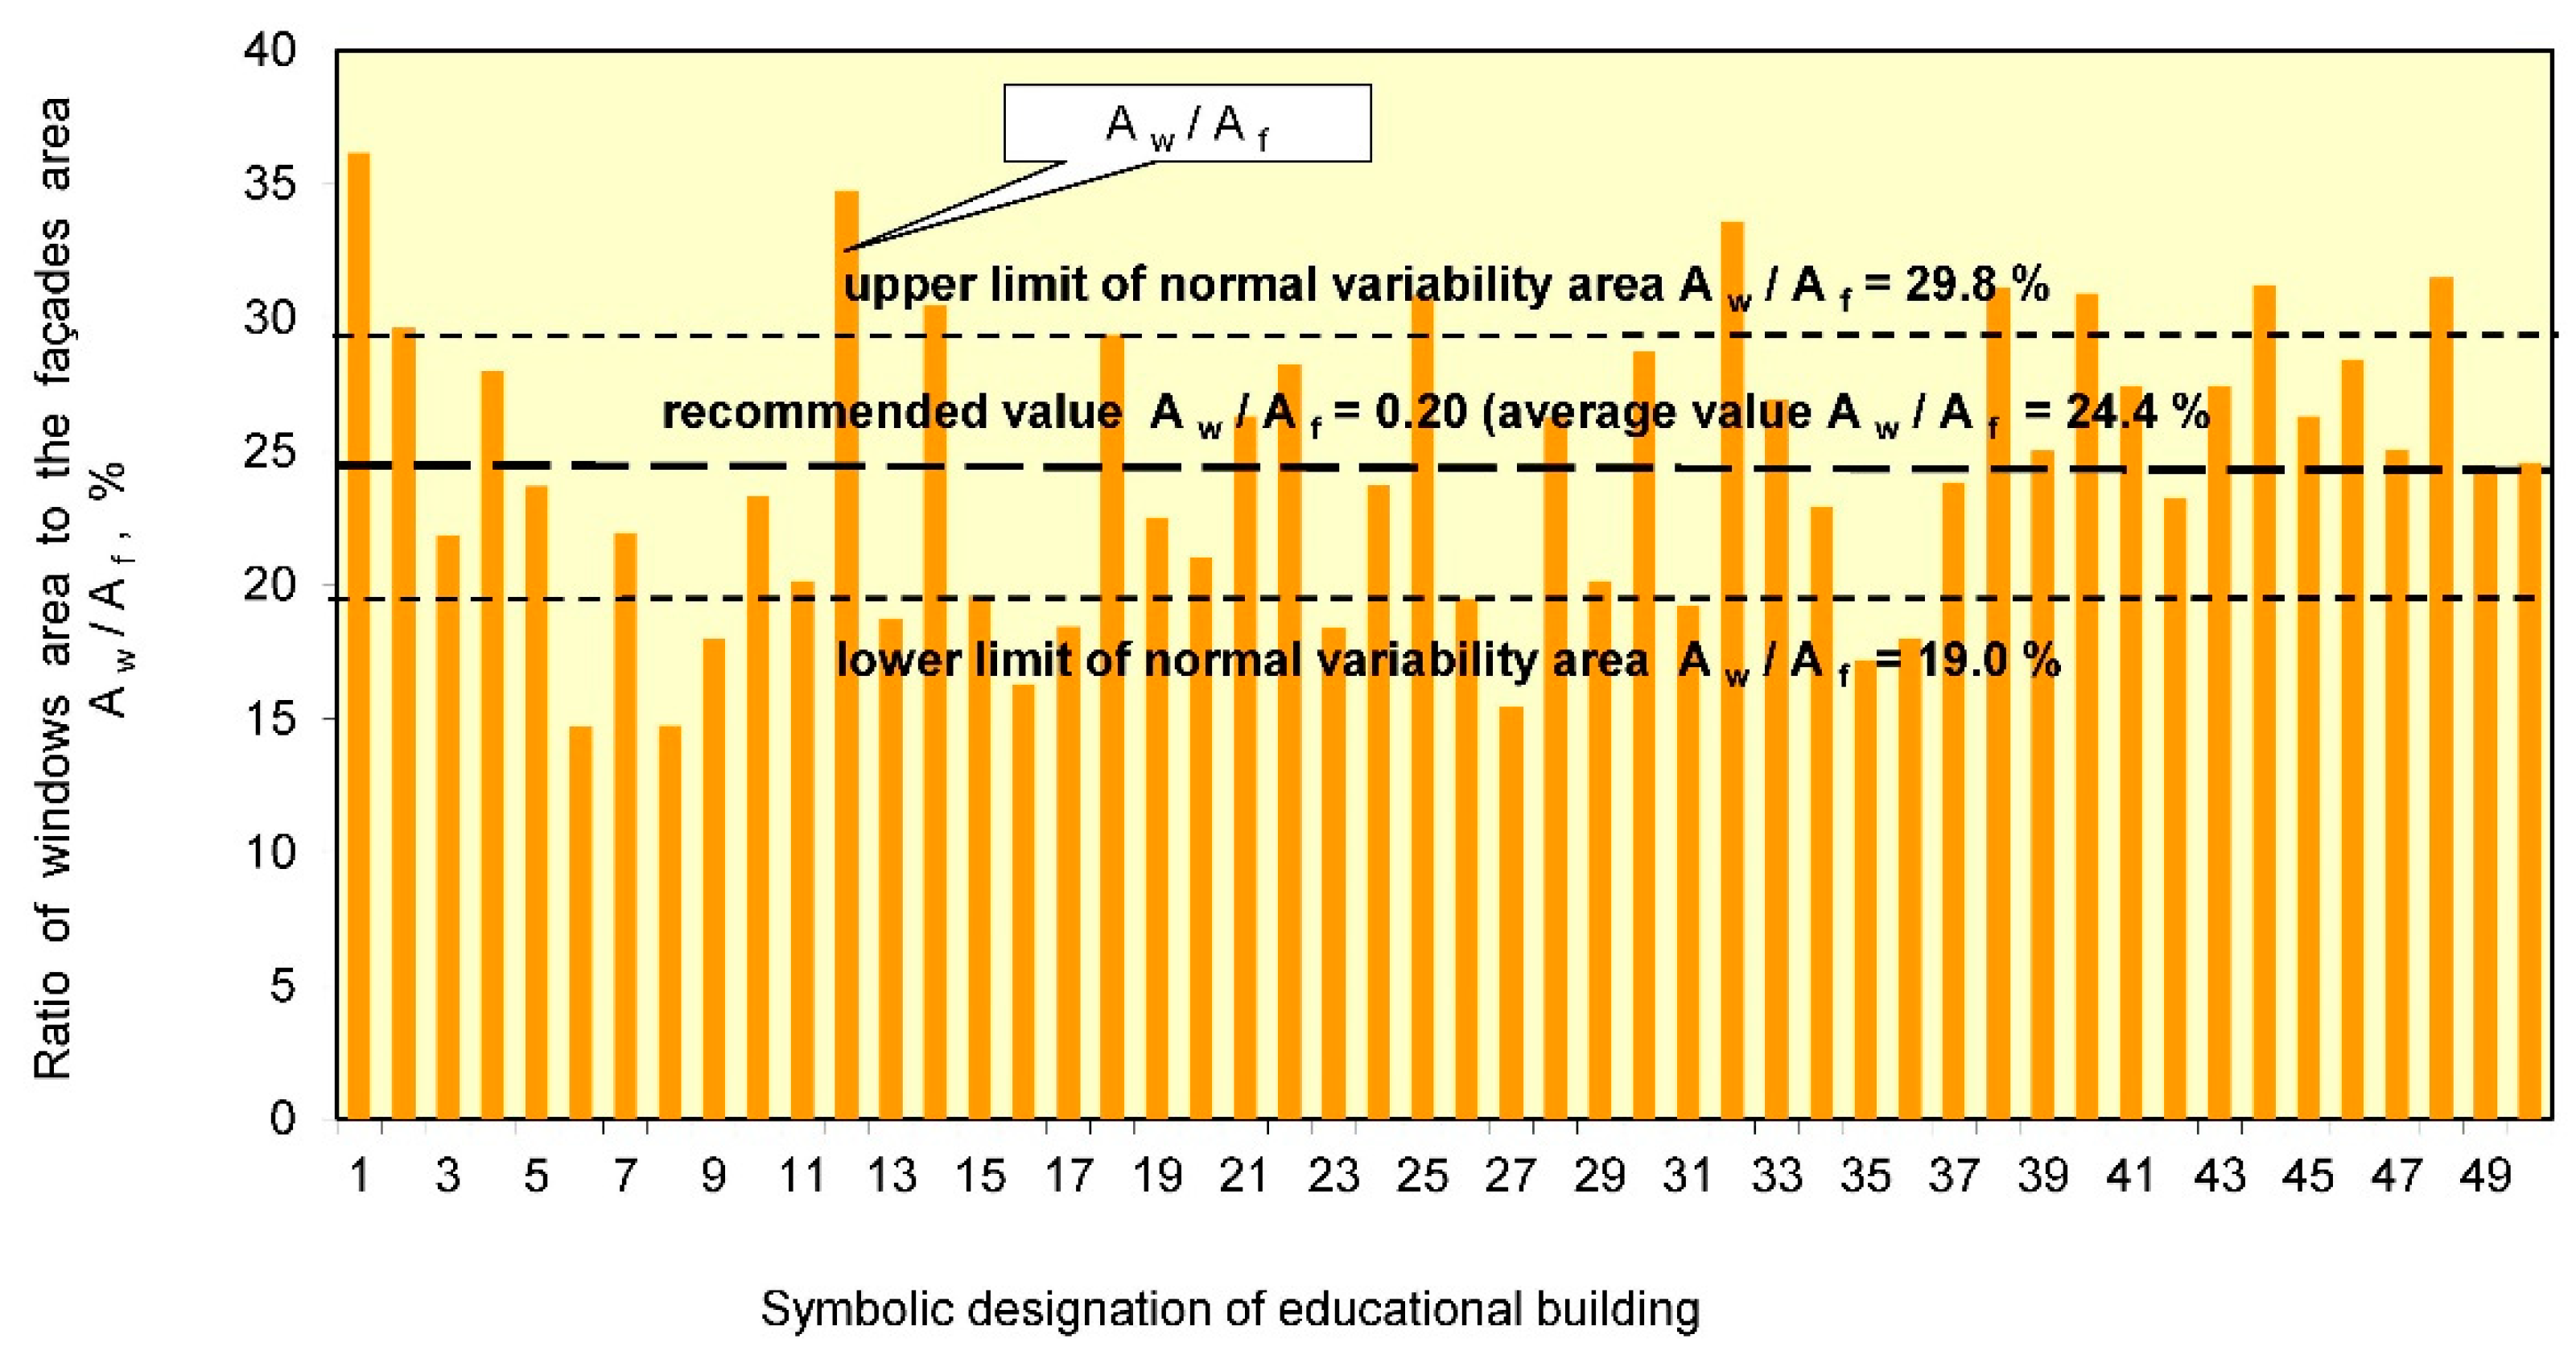
- façade glazing indicator, defined as a ratio of windows area Aw to the area of exterior walls together with windows (the façades area) Af, designated as Aw/Af.
2.4. The Fresh Air Requirements
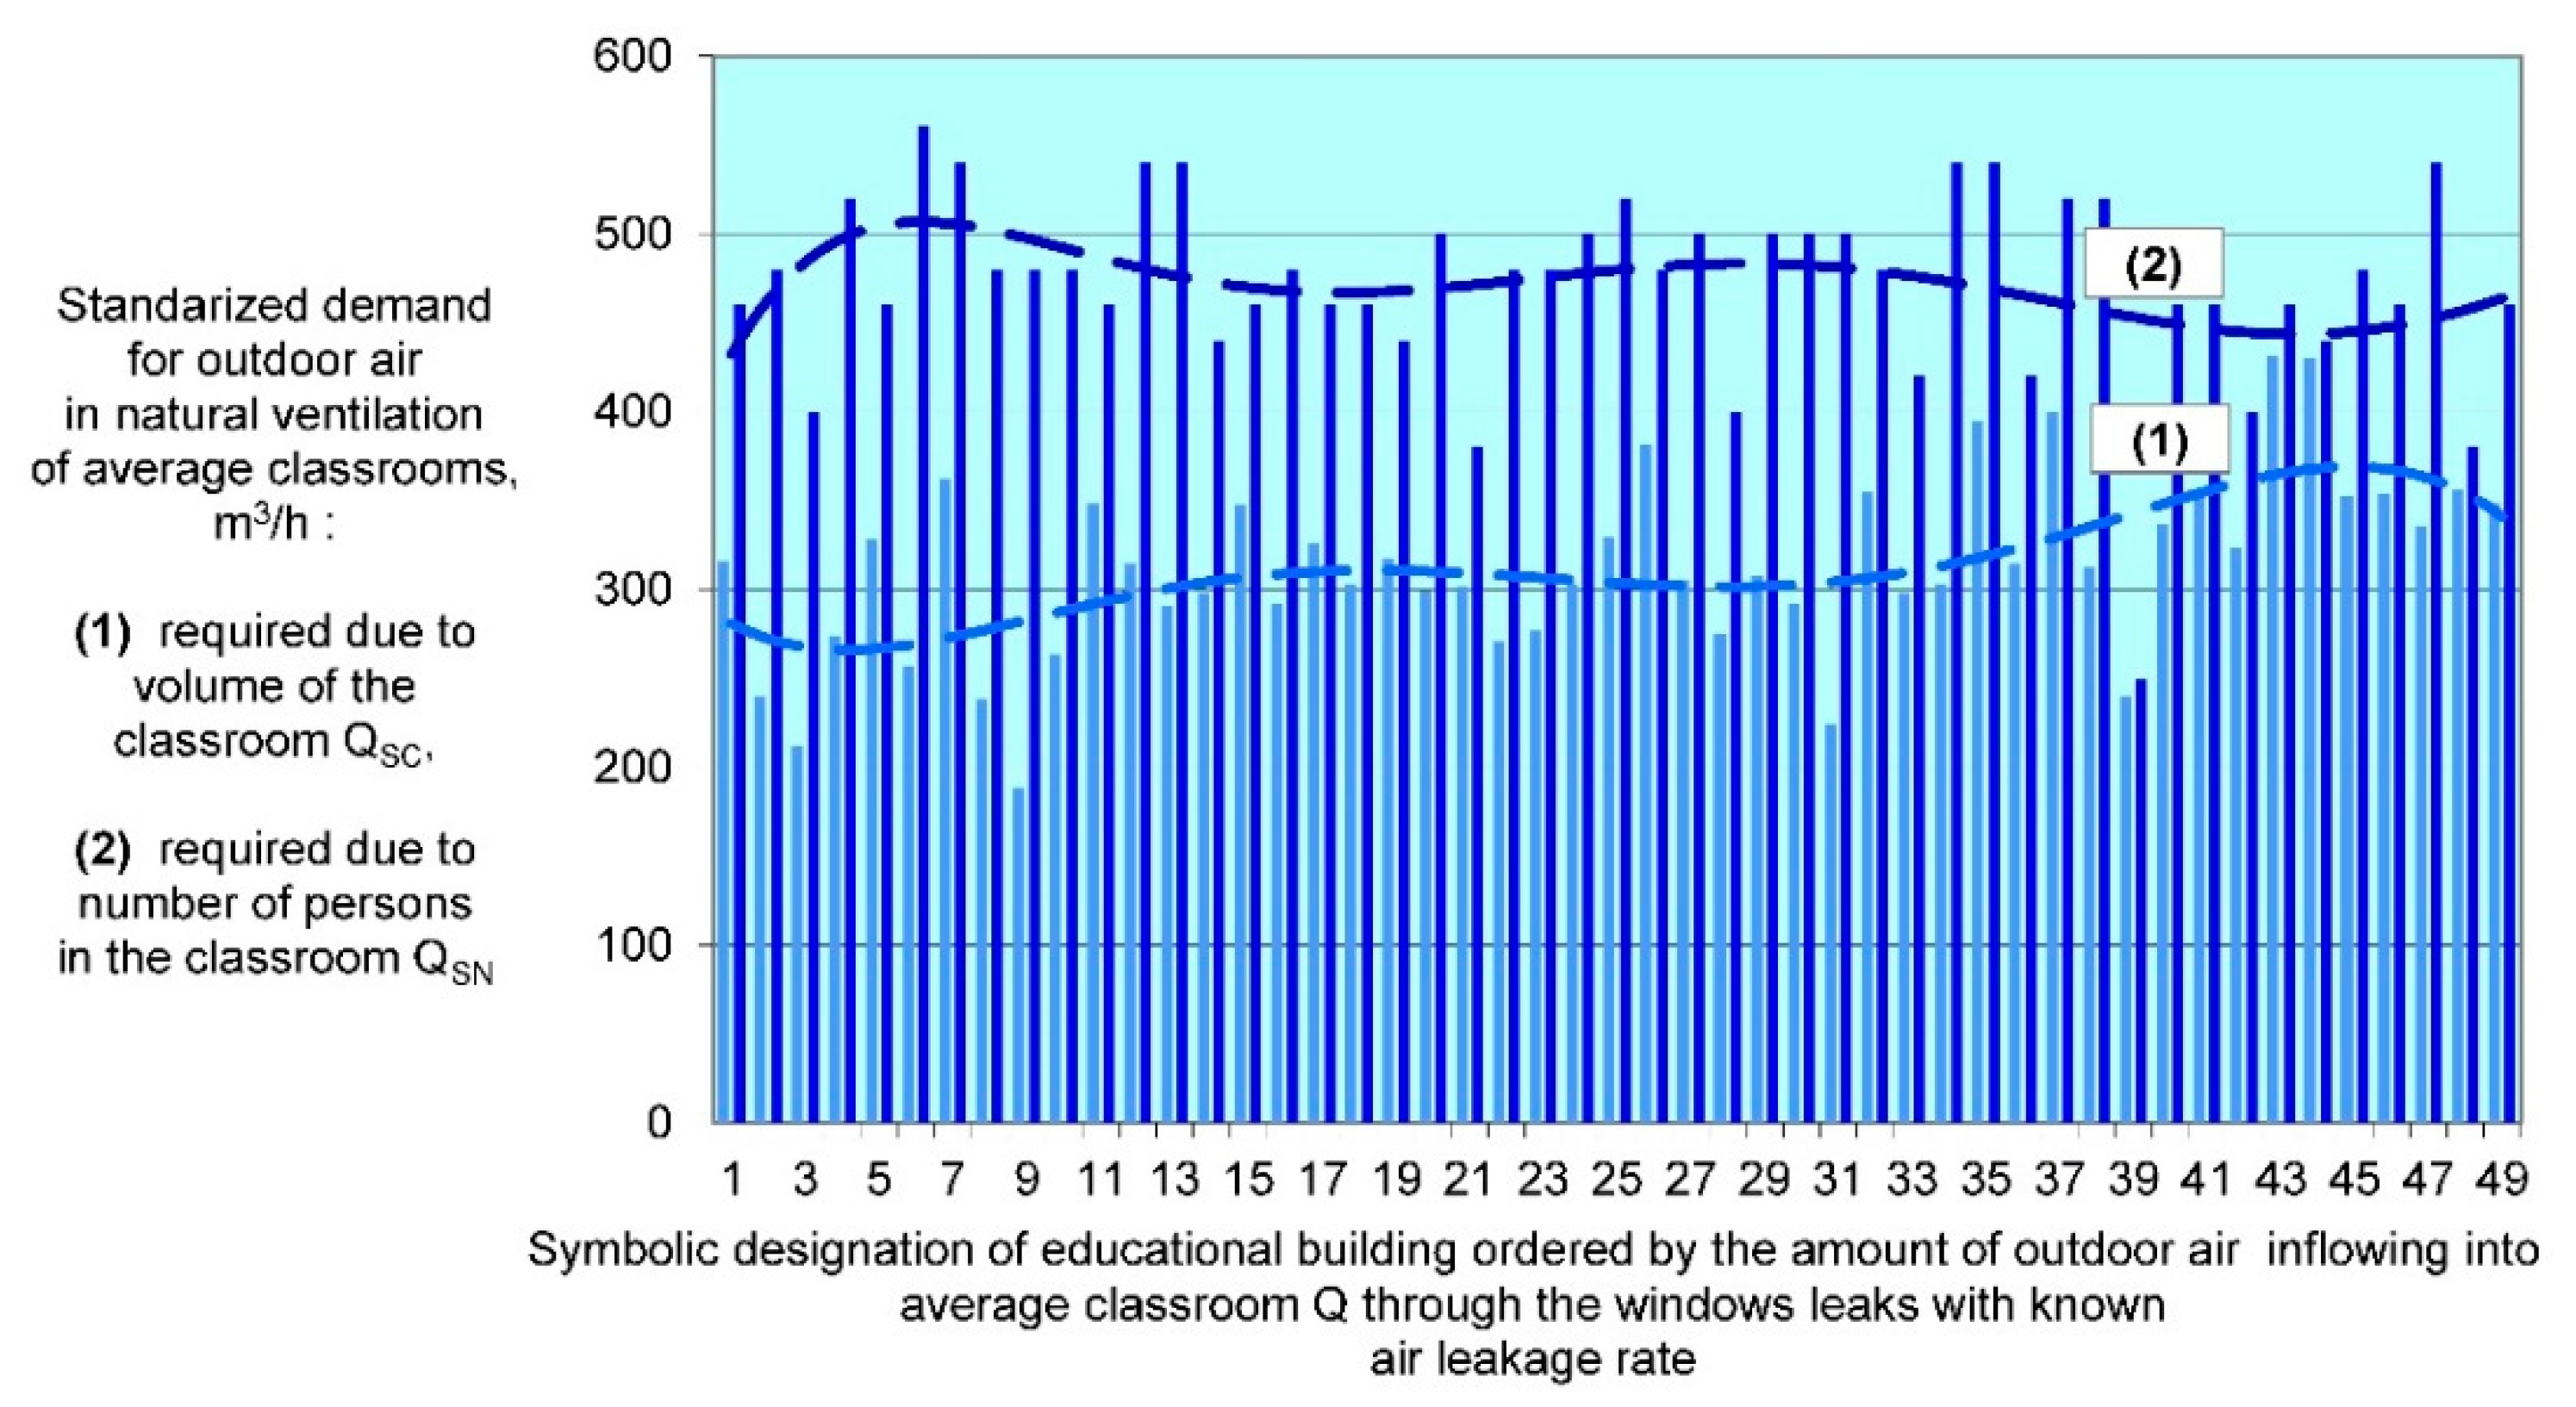
- Qsc
- outdoor air rate requirements for natural ventilation due to the cubature of a classroom [m3/h];
- n
- air changes per hour in the classroom [ac/h];(people outdoor air rate n = 1.5 ac/h taking into account the Polish requirements);
- Vc
- volume of the classroom [m3].
- QSN
- outdoor air rate requirements due to the number of persons in a classroom [m3/h];
- qp
- people outdoor air rate per 1 student in the classroom [m3/(students·h)];(adopted for the calculation qp = 20 m3/(students·h)-this corresponds to qp = 5.55 L/(students·h). This is the minimum outdoor air rate that is required in Poland);
- Nsc
- number of students in the classroom [students/classroom].
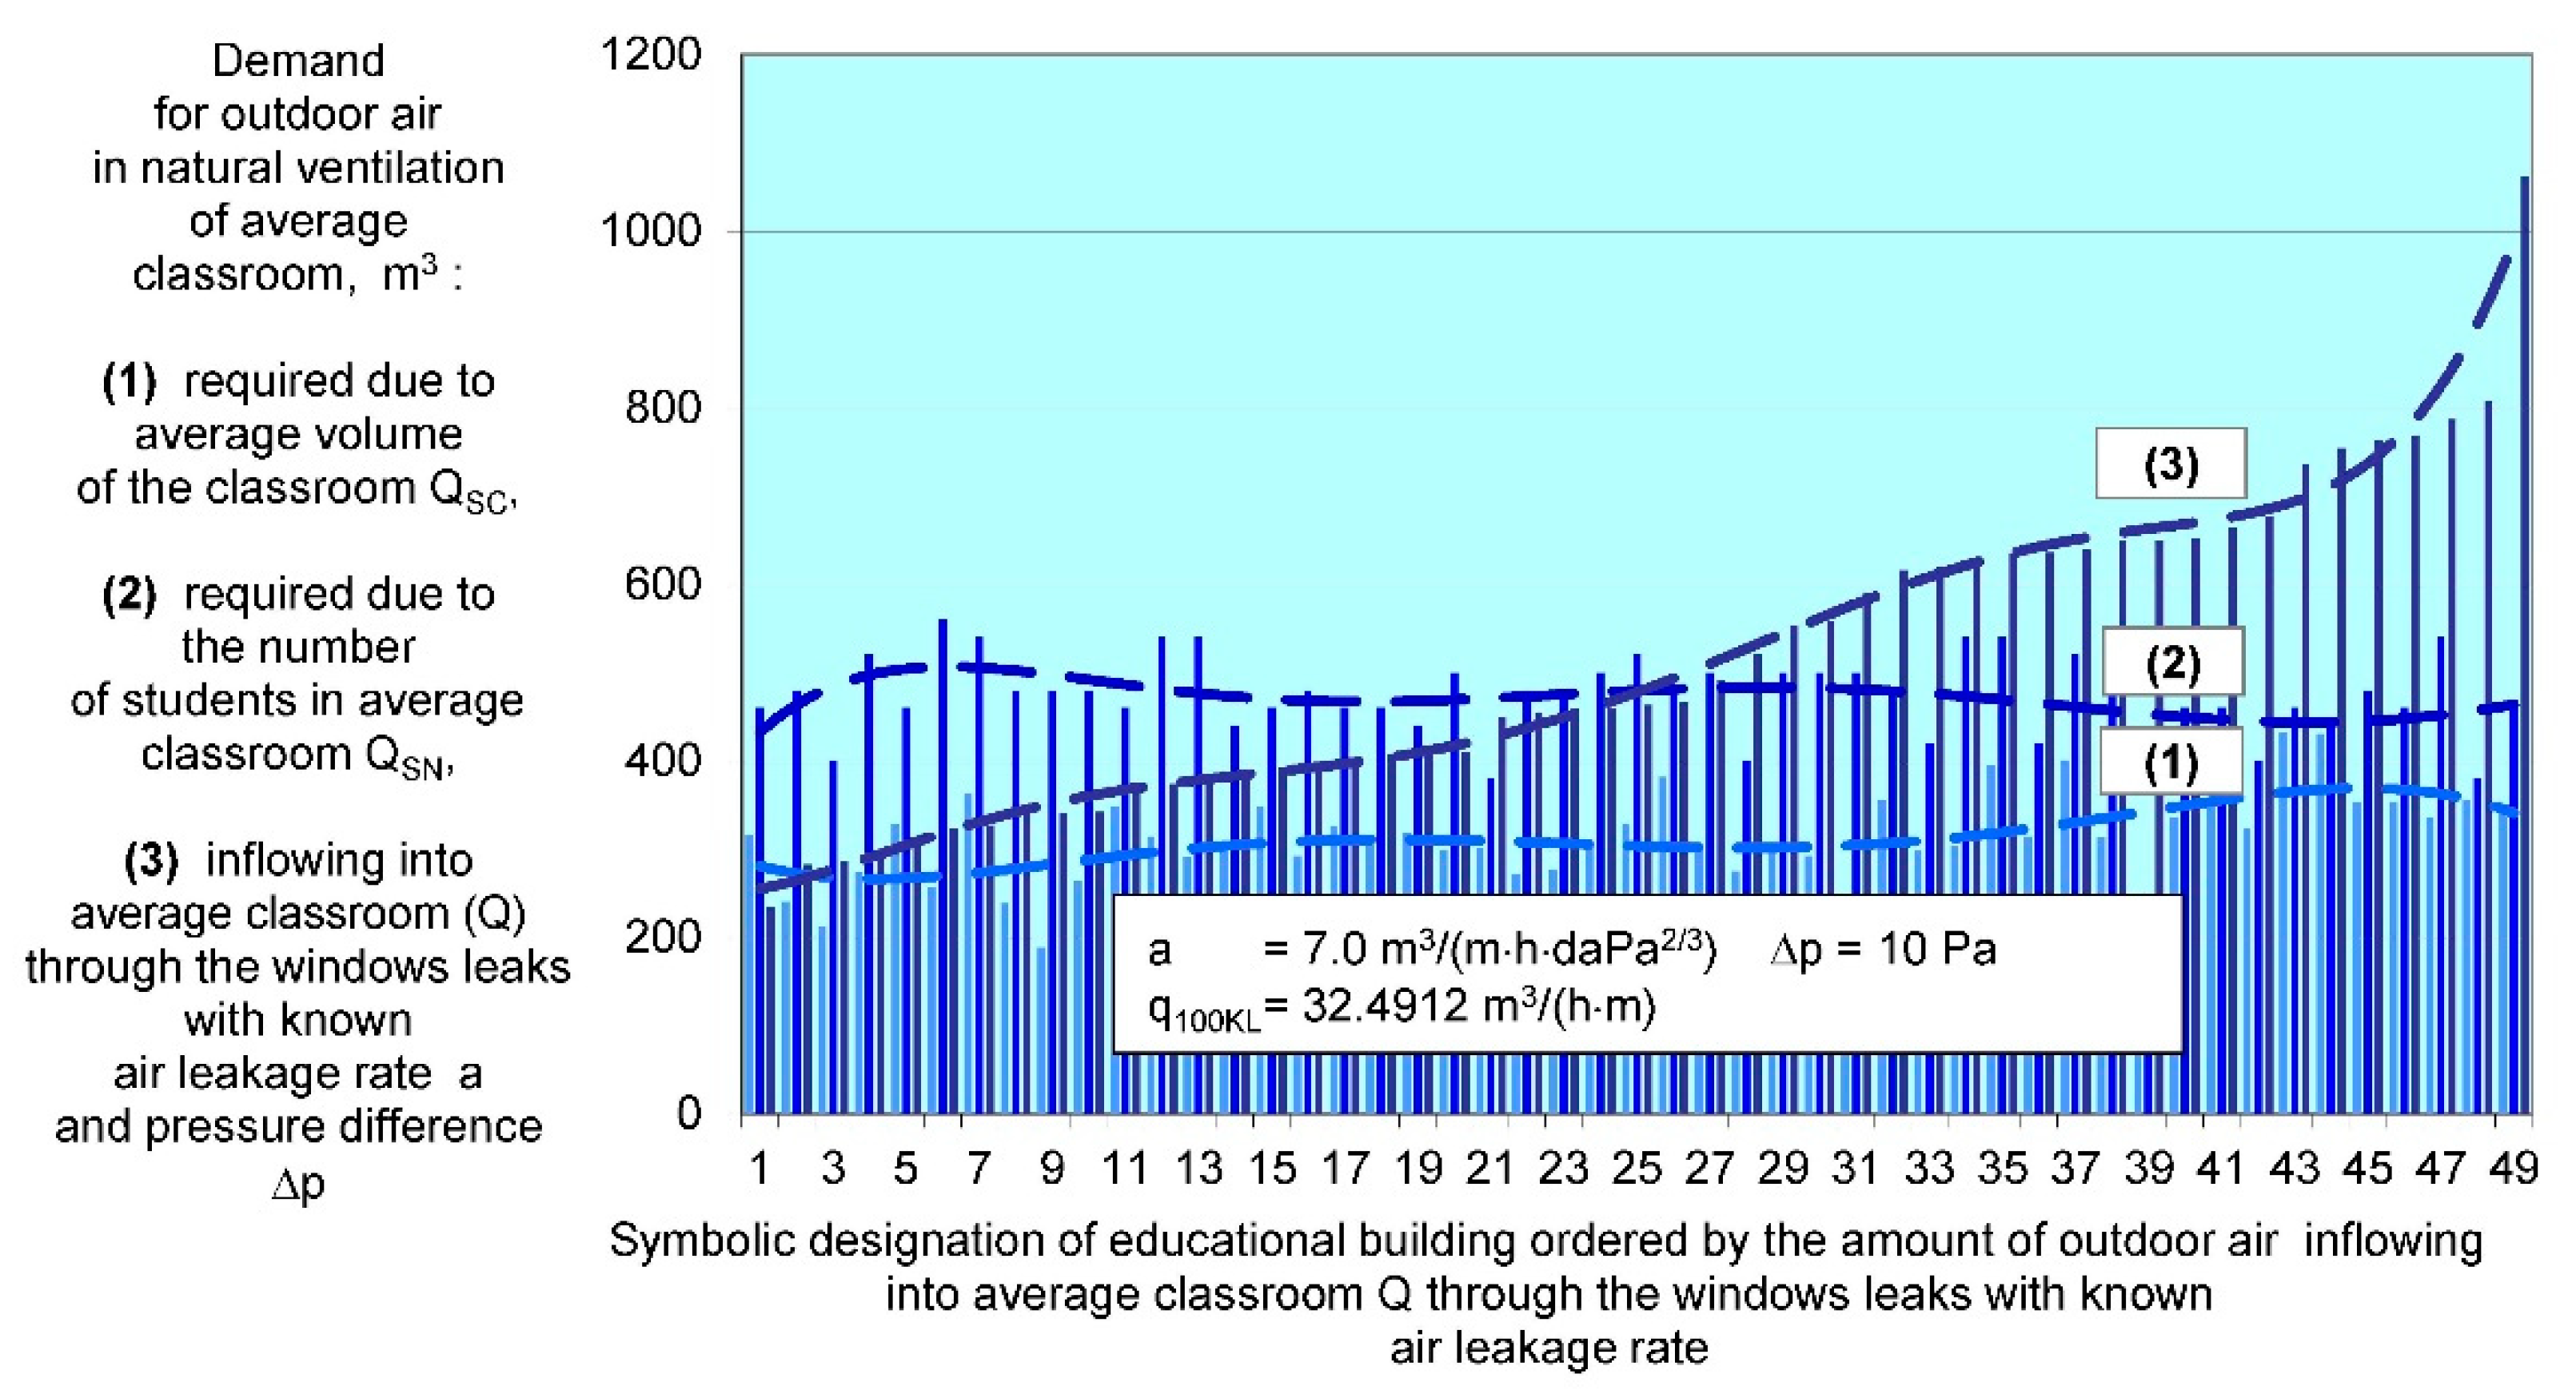
2.5. Quantity of Fresh Air That Could Flow into the Classrooms
- a
- calculated air leakage coefficient [m3/(h·m·daPa2/3)];
- Q
- quantity of infiltrating air through leaks in windows [m3/h];
- ∑l
- total length of all edges of opening sashes or door sashes of the window or door frame opening, together with the frame perimeter [m];
- Δpa
- vdifference of the pressure on both sides of the analysed barrier caused by the wind blowing with certain speed [Pa].
- for the calculations of a standard demand for outdoor air in classrooms with gravity ventilation (Equations (1) and (2), the following was assumed for two analysed requirements: n = 1.5 air changes per hour (n = 1.5 ac/h) per average volume of the classroom, 20 m3 of outdoor air per person staying in the analysed room;
- for the purpose of calculating the air leakage coefficient a, for the established results of inspection of the poor technical condition of the majority of windows, we assumed a value of 4.5 m3/(m·h·daPa2/3) (~20.8872 m3/(h·m)) (which is consistent with the information presented in Table 2);
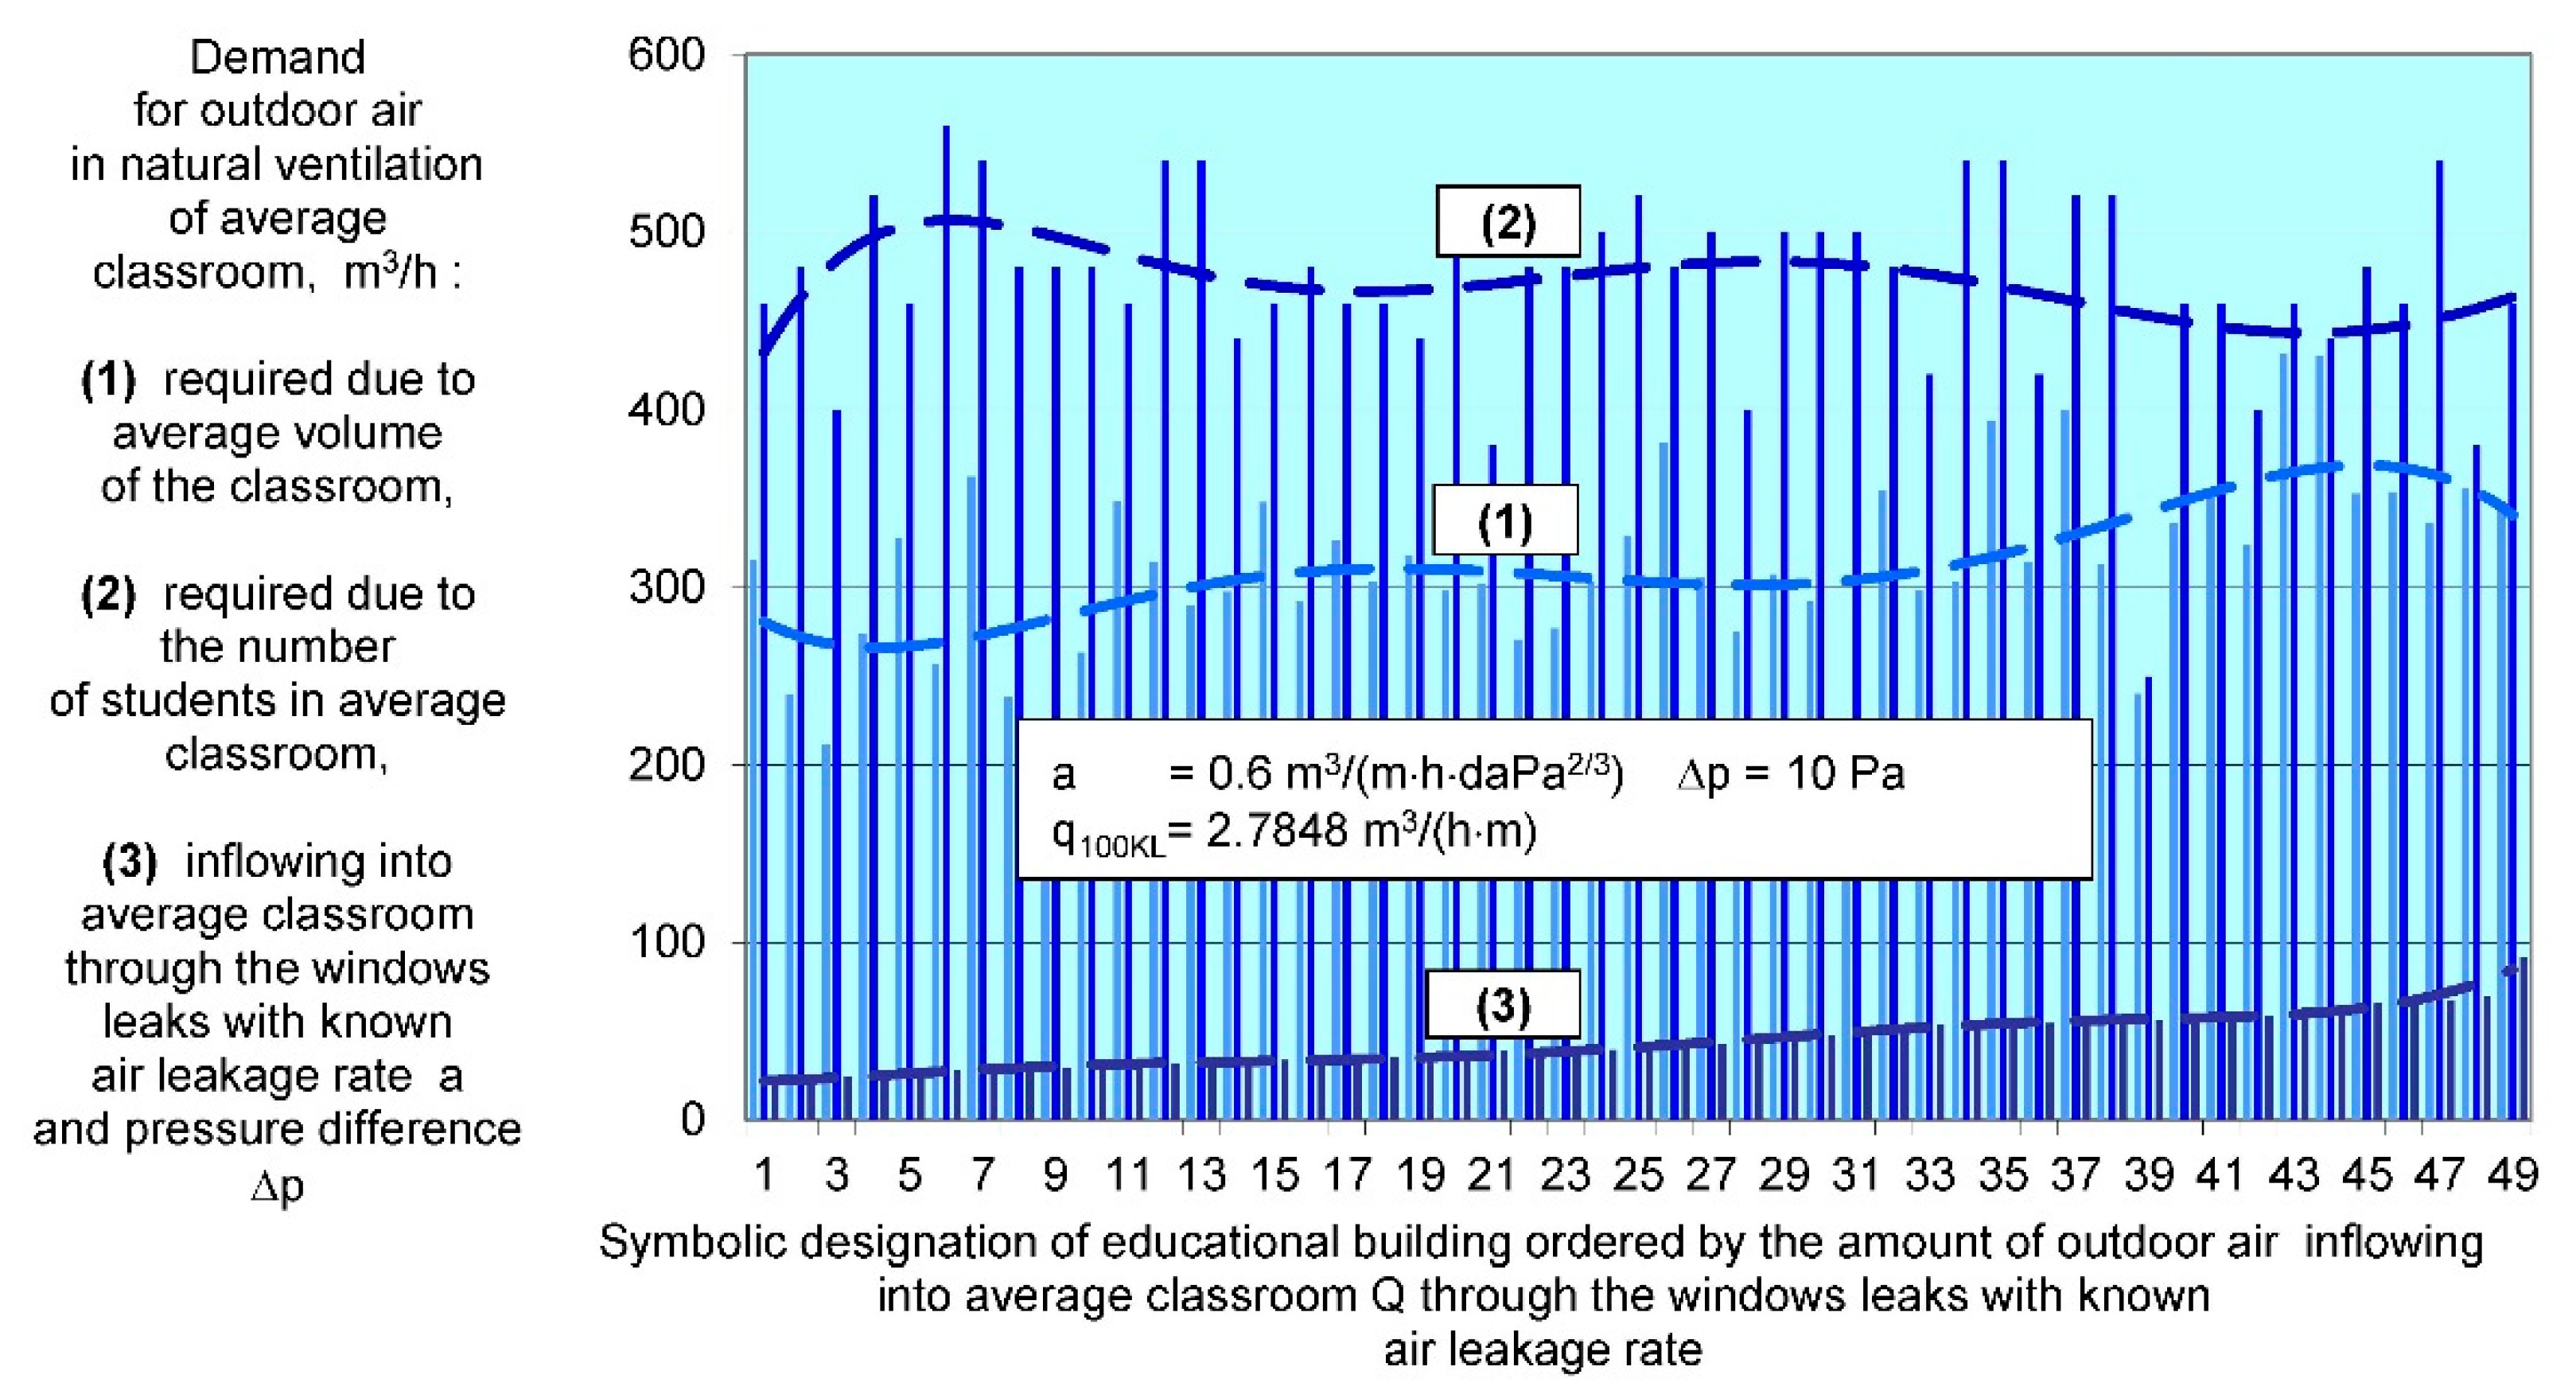
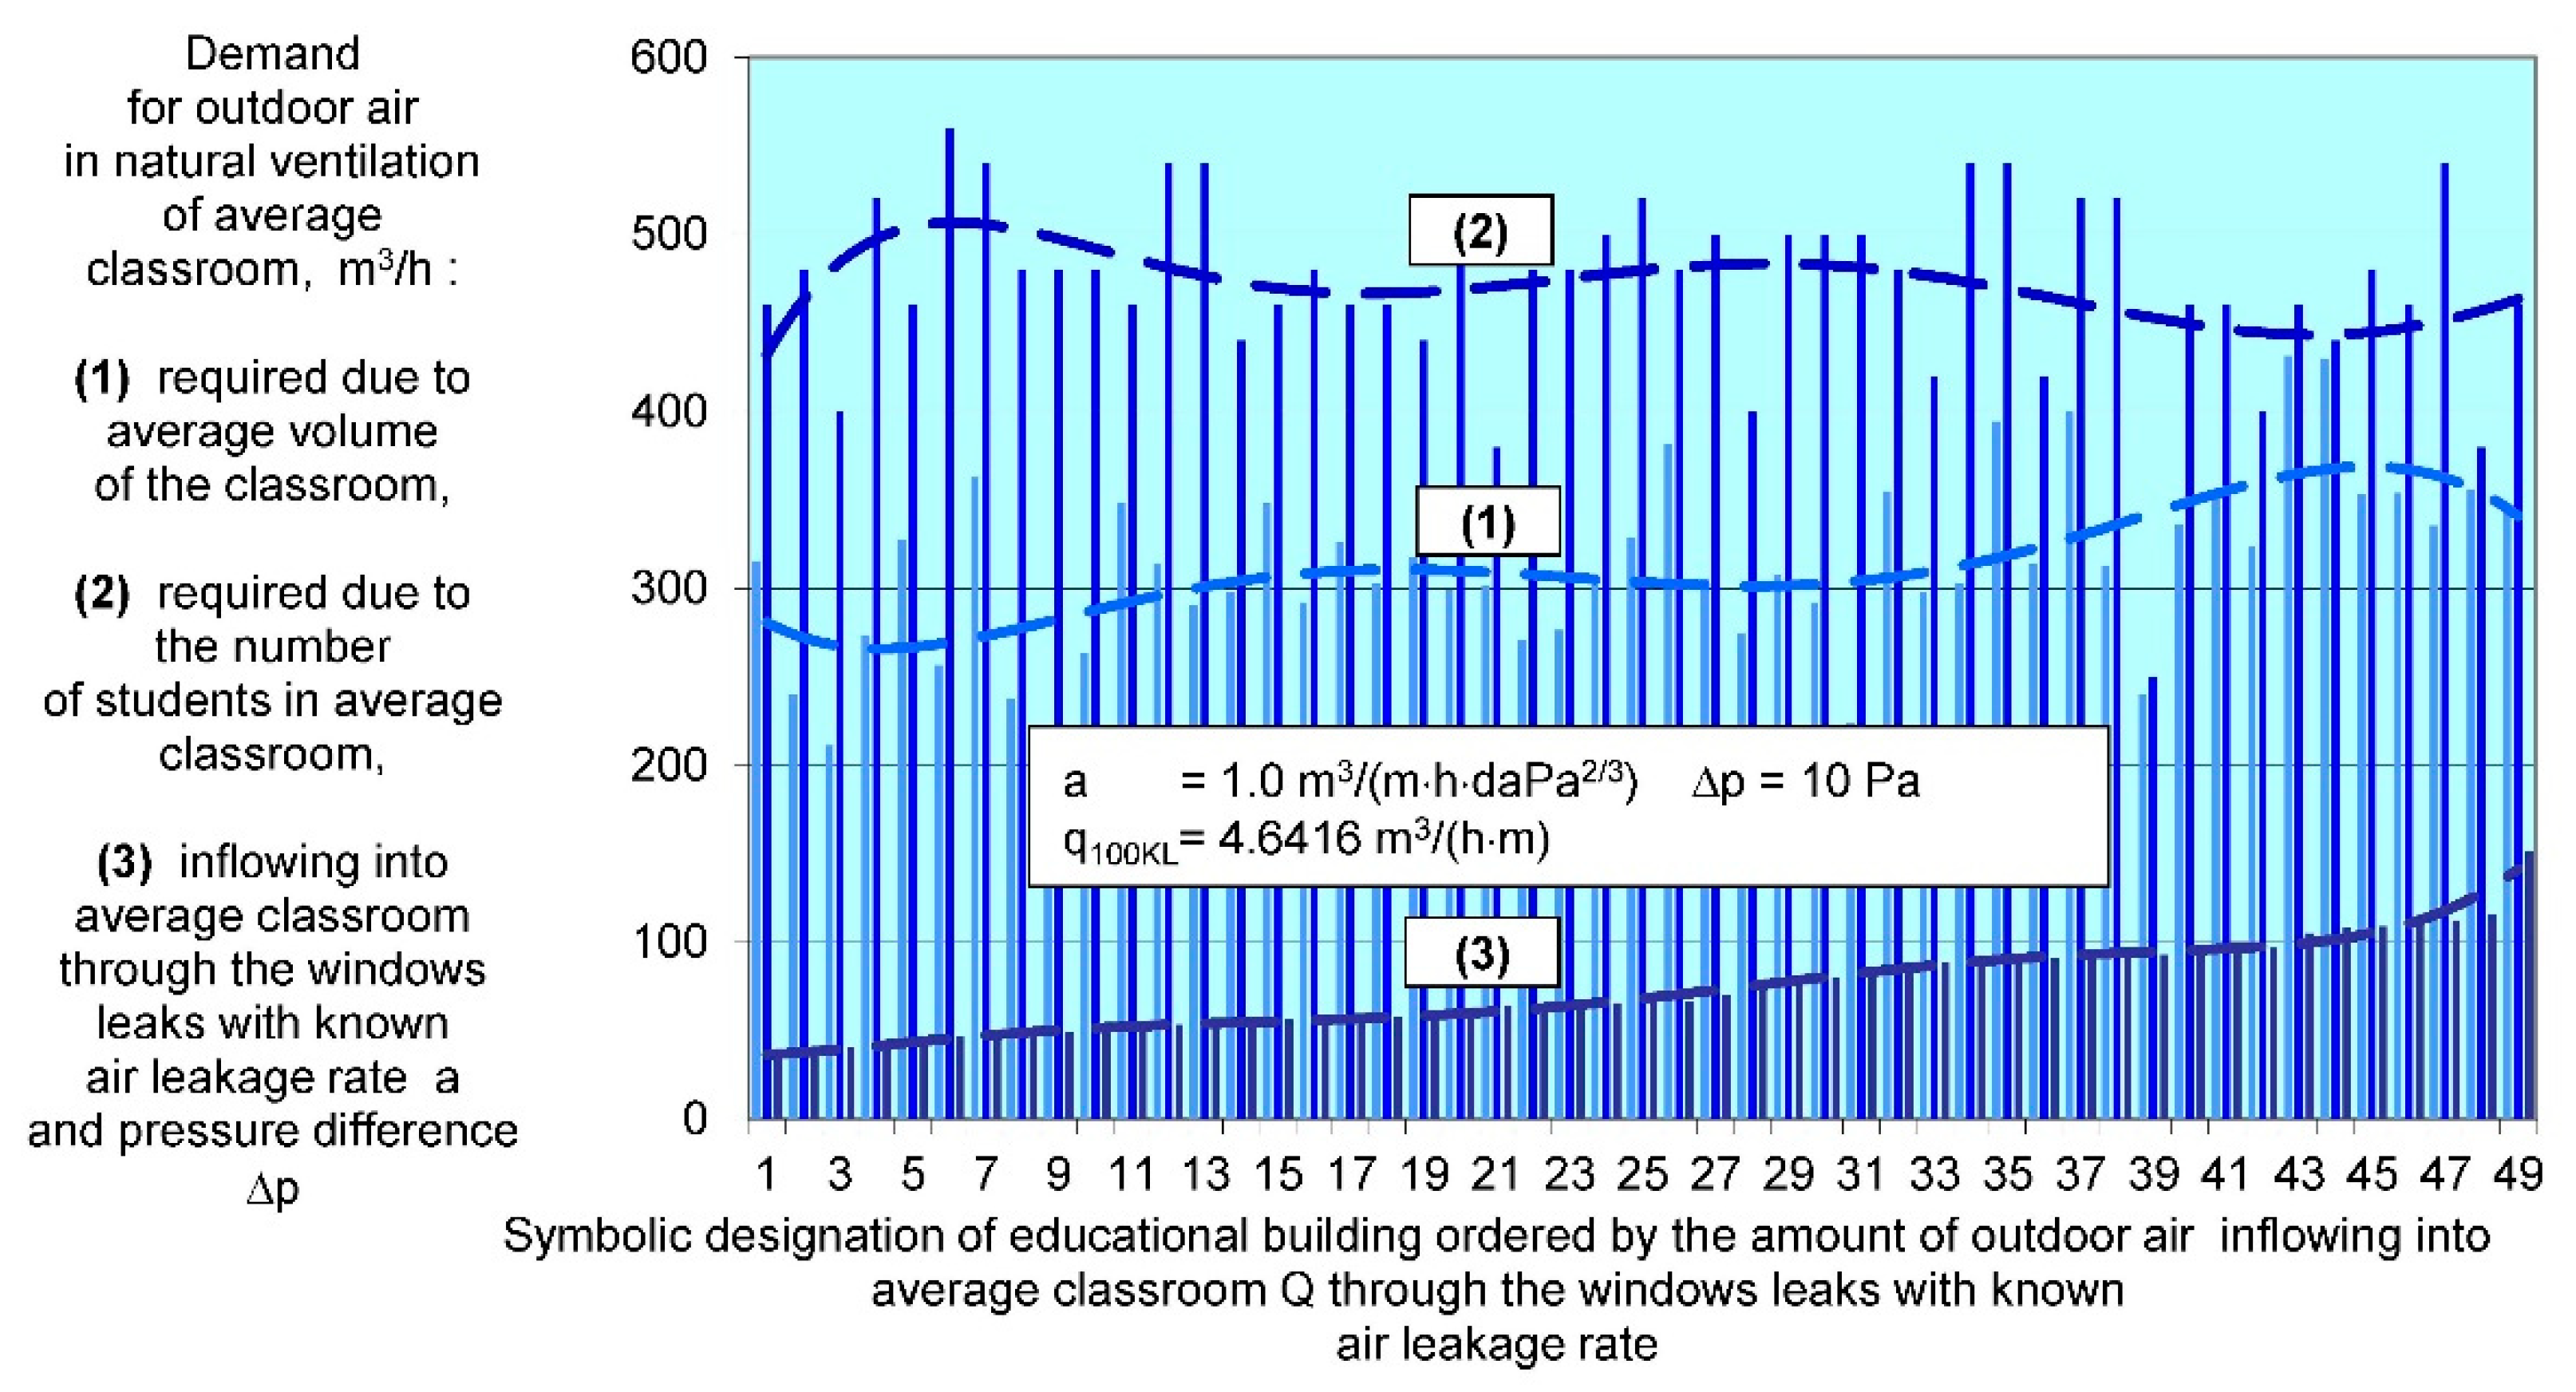
- quantity of infiltrating air Q through leaks in windows was calculated on the basis of the Equation (5). One can also use Equation (7).
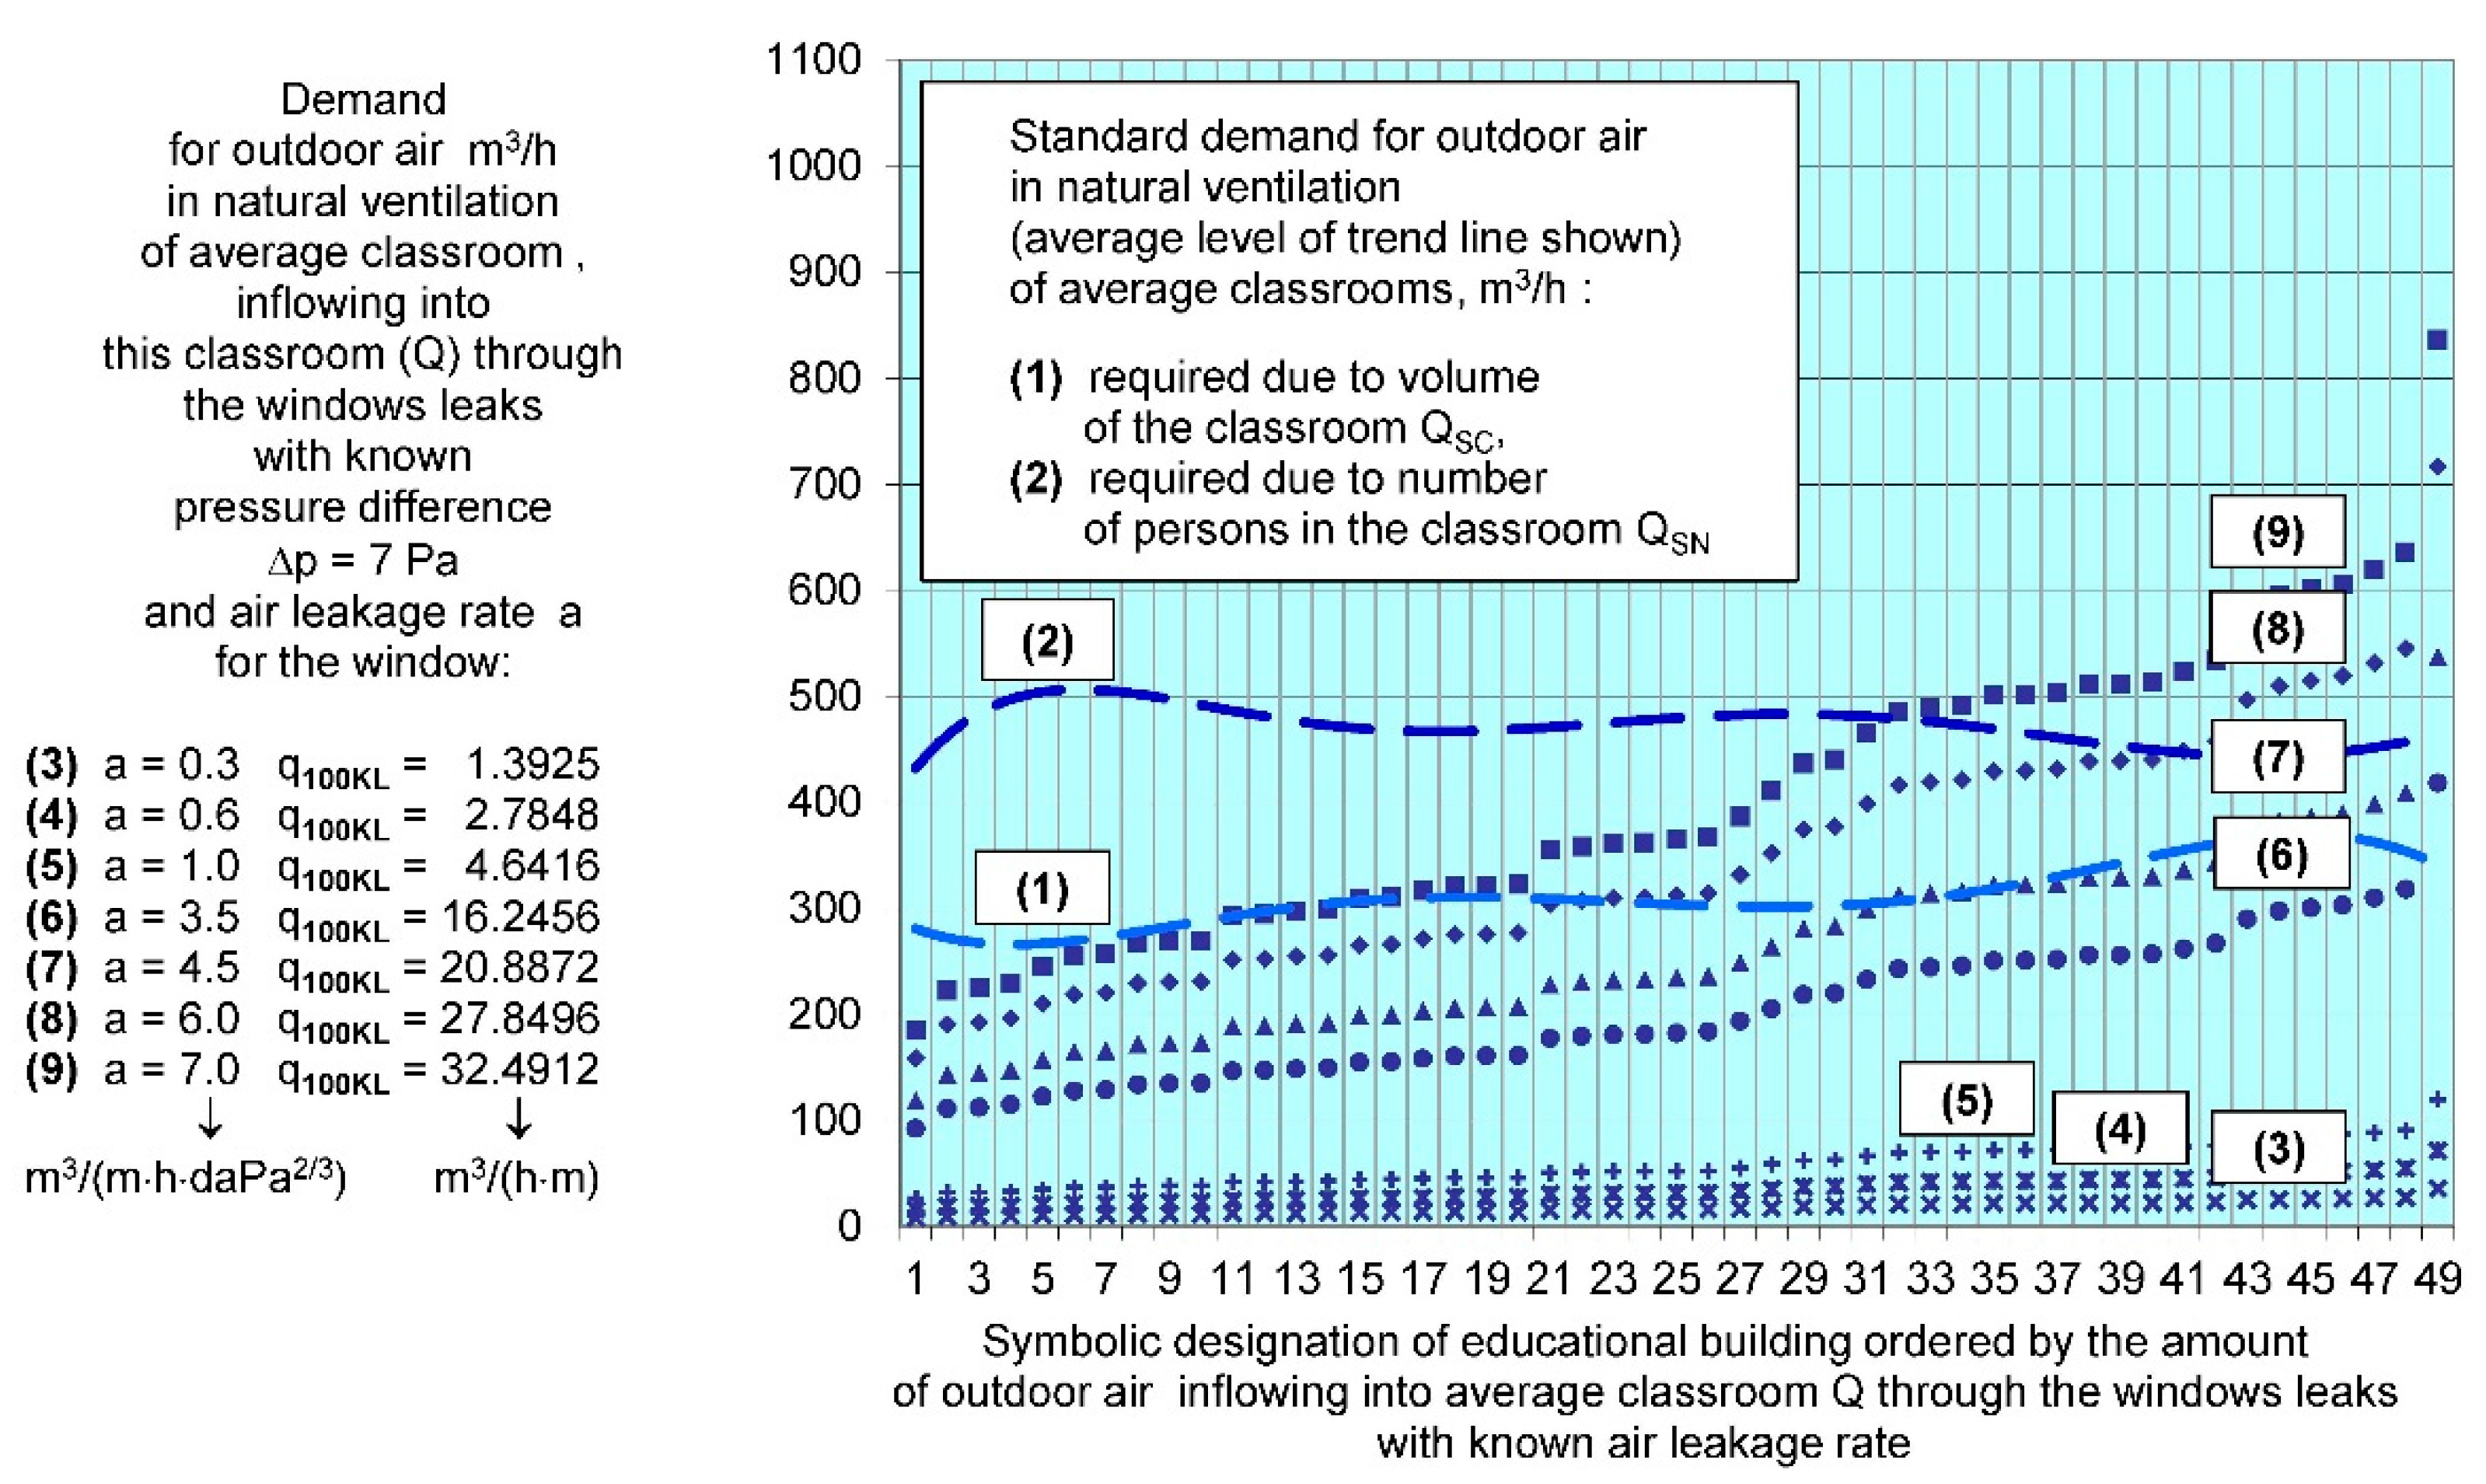
- a ≤ 0.3 m3/(h·m·daPa2/3) (q100KL ≤ 1.3925 m3/(h·m)), if the fresh air gets inside through air inlet vents;
- 0.5 < a ≤ 1.0 m3/(h·m·daPa2/3) (2.3208 < q100KL ≤ 4.6416 m3/(h·m)), in other instances.
3. Main Research Results and Discussion
3.1. Standardized Quantity of Fresh Air for Proper Ventilation in the Classroom
3.2. Quantity of Fresh Air Flowing into the Classroom
- -
- -
4. Conclusions
- Is it theoretically possible to supply enough air to satisfy the ventilation requirements? What is the tightness of the windows required to make this possible?
- What are the consequences of the analysis results for the functioning of the gravity ventilation system?
- What are the consequences of the results of the conducted analysis for the modernization and thermo-modernization of school buildings?
Author Contributions
Funding
Informed Consent Statement
Data Availability Statement
Conflicts of Interest
References
- EN 14351-1:2006+A2:2016. Windows and Doors—Product Standard, Performance Characteristics—Part 1: Windows and External Pedestrian Doorsets; European Committee for Standardization: Brussels, Belgium, 2016. [Google Scholar]
- EN 12207:2016. Windows and Doors—Air Permeability—Classification; European Committee for Standardization: Brussels, Belgium, 2016. [Google Scholar]
- Clements-Croome, D.J.; Awbi, H.B.; Bako-Biro, Z.; Kochhar, N.; Williams, M. Ventilation rates in schools. Build. Environ. 2008, 43, 362–367. [Google Scholar] [CrossRef] [Green Version]
- Haverinen-Shaughnessy, U.; Shaughnessy, R.J.; Cole, E.C.; Toyinbo, O.; Moschandreas, D.J. An assessment of indoor environmental quality in schools and its association with health and performance. Build. Environ. 2015, 9, 35–40. [Google Scholar] [CrossRef]
- Al Horr, Y.; Arif, M.; Katafygiotou, M.; Mazroei, A.; Kaushik, A.; Elsarrag, E. Impact of indoor environmental quality on occupant well-being and comfort: A review of the literature. Int. J. Sustain. Built. Environ. 2016, 5, 1–11. [Google Scholar] [CrossRef]
- Fisk, W.J. The ventilation problem in schools: Literature review. Indoor Air 2017, 27, 1039–1051. [Google Scholar] [CrossRef] [Green Version]
- Kapalo, P.; Voznyak, O.; Klymenko, H.; Zhelykh, V.; Adamski, M. Perception of air quality in the selected classroom. BoZPE 2019, 8, 77–84. [Google Scholar] [CrossRef]
- Sarkhosh, M.; Najafpoor, A.A.; Alidadi, H.; Shamsara, J.; Amiri, H.; Andrea, T.; Kariminejad, F. Indoor Air Quality associations with sick building syndrome: An application of decision tree technology. Build. Environ. 2021, 188, 107446. [Google Scholar] [CrossRef]
- Sundell, J.; Levin, H.; Nazaroff, W.W.; Cain, W.S.; Fisk, W.J.; Grimsrud, D.T.; Gyntelberg, F.; Li, Y.; Persily, A.K.; Pickering, A.C.; et al. Ventilation rates and health: Multidisciplinary review of the scientific literature. Indoor Air 2011, 21, 191–204. [Google Scholar] [CrossRef]
- Maddalena, R.; Mendell, M.J.; Eliseeva, K.; Chan, W.R.; Sullivan, D.P.; Russell, M.; Satish, U.; Fisk, W.J. Effects of ventilation rate per person and per floor area on perceived air quality, sick building syndrome symptoms, and decision-making. Indoor Air 2015, 25, 362–370. [Google Scholar] [CrossRef]
- Wilson, S. Sick buildings. Archit. J. 1993, 6, 37–40. [Google Scholar]
- Jafari, M.J.; Khajevandi, A.A.; Najarkola, S.A.M.; Yekaninejad, M.S.; Pourhoseingholi, M.A.; Omidi, L.; Kalantary, S. Associa-tion of sick building syndrome with indoor air parameters. Tanaffos 2015, 14, 55–62. [Google Scholar]
- Boslaugh, S.E. Sick Building Syndrome. Encyclopedia Britannica. Available online: https://www.britannica.com/science/sick-building-syndrome (accessed on 12 July 2021).
- Corgnati, S.P.; Corrado, V.; Filippi, M. A method for heating consumption assessment in existing buildings: A field survey concerning 120 Italian schools. Energy Build. 2008, 40, 801–809. [Google Scholar] [CrossRef]
- Persily, A.; de Jonge, L. Carbon dioxide generation rates for building occupants. Indoor Air 2017, 27, 868–879. [Google Scholar] [CrossRef]
- Kapalo, P.; Vilčeková, S.; Domnita, F.; Bacotiu, C.; Voznyak, O. Determining the Ventilation Rate inside an Apartment House on the Basis of Measured Carbon Dioxide Concentrations—Case Study. In Environmental Engineering, Proceedings of the 10th International Conference on Environmental Engineering, Vilnius, Lithuania, 27–28 April 2017; VGTU Press: Vilnius, Lithuania, 2017; pp. 28–33. [Google Scholar] [CrossRef]
- Jayasooriya, V.M.; Rajapaksha, R.M.D.H.; Ng, A.W.M.; Muthukumaran, S. Associations of Indoor Carbon Dioxide Concentration and Symptoms of Sick Building Syndrome in Air-Conditioned Lecture Halls. Research Square. Available online: https://www.researchsquare.com/article/rs-95698/v1 (accessed on 5 July 2021).
- Mishra, A.K.; Schiavon, S.; Wargocki, P.; Tham, K.W. Carbon dioxide and its effect on occupant cognitive performance: A literature review. In Windsor 2020. Resilien Comfort, Proceedings of the 11th Windsor Conference on Thermal Comfort: Resilien Comfort, Windsor, United Kingdom, Planned for 16–19 April 2020 (Cancelled Due to COVID-19); Roaf, S., Nicol, F., Finlayson, W., Eds.; NCEUB: Windsor, UK, 2020; pp. 440–452. [Google Scholar]
- Madureira, J.; Paciência, I.; Pereira, C.; Teixeira, J.P.; Fernandes, E.O. Indoor air quality in Portuguese schools: Levels and sources of pollutants. Indoor Air 2016, 26, 526–537. [Google Scholar] [CrossRef] [PubMed] [Green Version]
- Goyal, R.; Khare, M. Indoor–outdoor concentrations of RSPM in classroom of a naturally ventilated school building near an urban traffic roadway. Atmos. Environ. 2009, 43, 6026–6038. [Google Scholar] [CrossRef]
- Singh, D.; Kumar, A.; Singh, B.; Mina, U.; Singh, B.B.; Jain, V.K. Statistical modeling of O3, NOx, CO, PM2,5, VOCs and noise levels in commercial complex and associated health risk assessment in an academic institution. Sci. Total Environ. 2016, 572, 586–594. [Google Scholar] [CrossRef]
- Zhang, X.; Wargocki, P.; Lian, Z.; Thyregod, C. Effects of exposure to carbon dioxide and bioeffluents on perceived air quality, self-assessed acute health symptoms and cognitive performance. Indoor Air 2017, 27, 47–64. [Google Scholar] [CrossRef] [PubMed] [Green Version]
- Huttunen, K. Indoor Air Pollution. In Clinical Handbook of Air Pollution-Related Diseases, 1st ed.; Capello, F., Gaddi, A., Eds.; Springer: Cham, Switzerland, 2018; pp. 107–114. [Google Scholar] [CrossRef]
- Chanjuan, S.; Jialing, Z.; Yuchao, G.; Qingyan, F.; Wei, L.; Jun, P.; Yanmin, H.; Zhijun, Z.; Chena, H. Outdoor air pollution in relation to sick building syndrome (SBS) symptoms among residents. Energy Build. 2018, 174, 68–76. [Google Scholar] [CrossRef]
- Järvi, K.; Hyvärinen, A.; Täubel, M.; Karvonen, A.M.; Turunen, M.; Jalkanen, K.; Patovirta, R.; Syrjänen, T.; Pirinen, J.; Salonen, H.; et al. Microbial growth in building material samples and occupants’ health in severely moisture-damaged homes. Indoor Air 2018, 28, 287–297. [Google Scholar] [CrossRef]
- Mendell, M.J.; Macher, J.M.; Kumagai, K. Measured moisture in buildings and adverse health effects: A review. Indoor Air 2018, 28, 488–499. [Google Scholar] [CrossRef]
- Gaihre, S.; Semple, S.; Miller, J.; Fielding, S.; Turner, S. Classroom Carbon Dioxide Concentration, School Attendance, and Educational Attainment. J. Sch. Health 2014, 84, 569–574. [Google Scholar] [CrossRef]
- Petersen, S.; Jensen, K.L.; Pedersen, A.L.S.; Rasmussen, H.S. The effect of increased classroom ventilation rate indicated by reduced CO2 concentration on the performance of schoolwork by children. Indoor Air 2016, 26, 366–379. [Google Scholar] [CrossRef]
- Wargocki, P. Productivity and Health Effects of High Indoor Air Quality. In Encyclopedia of Environmental Health, 2nd ed.; Nriagu, J.O., Ed.; Elsevier: Amsterdam, The Netherlands, 2019; pp. 382–388. [Google Scholar] [CrossRef]
- Bogdanovica, S.; Zemitis, J.; Bogdanovics, R. The Effect of CO2 Concentration on Children’s Well-Being during the Process of Learning. Energies 2020, 13, 6099. [Google Scholar] [CrossRef]
- Wargocki, P.; Porras, J.A.; Contreras-Espinoza, S.S.; Bahnfleth, W. The relationships between classroom air quality and children’s performance in school. Build. Environ. 2020, 173, 106749. [Google Scholar] [CrossRef]
- Michalik, M.; Mizera, G.; Podbielska-Kubera, A.; Kowalski, H.; Cenian, A. Problems with microclimate in classrooms—Results of measurements and proposed solution. Eco-Energetics 2021, 4, 11–20. [Google Scholar] [CrossRef]
- Smedje, G.; Norback, D. Incidence of asthma diagnosis and self-reported allergy in relation to the school environment—A four-year follow-up study in schoolchildren. Intern. J. Tuberc. Lung Dis. 2001, 5, 1059–1066. [Google Scholar]
- Cartieaux, E.; Rzepka, M.A.; Cuny, D. Indoor air quality in schools. Arch. Pediatr. 2011, 18, 789–796. [Google Scholar] [CrossRef] [PubMed]
- Egorov, A. (Ed.) School Environment: Policies and Current Status, 1st ed.; WHO Regional Office for Europe: Copenhagen, Denmark, 2015; p. 69. [Google Scholar]
- Schools Indoor Pollution and Health Observatory Network in Europe. Executive Summary of the Final Report, 1st ed.; Publications Office of the European Union: Luxembourg, 2014; p. 22. [CrossRef]
- Vilčeková, S.; Kapalo, P.; Mečiarová, Ľ.; Krídlová Burdová, E.; Imreczeová, V. Investigation of indoor environment quality in classroom—Case Study. Procedia Eng. 2017, 190, 496–503. [Google Scholar] [CrossRef]
- Mumovic, D.; Chatzidiakou, L.; Williams, J.J.; Burman, E. Indoor Air Quality in London’s Schools, 1st ed.; University of Cambridge: Cambridge, UK, 2018; p. 59. [Google Scholar]
- Tahsildoost, M.; Zomorodian, Z.S. Indoor environment quality assessment in classrooms: An integrated approach. J. Build. Phys. 2018, 42, 336–362. [Google Scholar] [CrossRef]
- Langer, S.; Ekberg, L.; Teli, D.; Cabovska, B.; Bekö, G.; Wargocki, P. Study of the measured and perceived indoor air quality in Swedish school classrooms. IOP Conf. Ser. Earth Environ. Sci. 2020, 588, 032070. [Google Scholar] [CrossRef]
- Chatzidiakou, L.; Mumovic, D.; Summerfield, A.J. Is CO2 a good proxy for indoor air quality in classrooms? Part 1: The interrelationships between thermal conditions, CO2 levels, ventilation rates and selected indoor pollutants. Build. Serv. Eng. Res. Technol. 2015, 36, 129–161. [Google Scholar] [CrossRef]
- Wolski, L.; Kamiński, A. The quality of air in study’s accommodation based on criterion CO2. Build. Phys. Theory Pract. 2010, 5, 65–69. [Google Scholar]
- Luther, M.; Horan, P.; Atkinson, S.E. Examining CO2 levels in school classrooms. In Indoor Air 2014, Proceedings of the 13th International Conference on Indoor Air Quality and Climate, Hong Kong, China, 7–12 July 2014; Curran Associates: Red Hook, NY, USA, 2014; pp. 704–711. [Google Scholar]
- Mainka, A.; Zajusz-Zubek, E. Determination on carbon dioxide levels in school buildings: The effect of thermal efficiency improvement. Eng. Protect. Environ. Gliwice 2018, 21, 155–162. [Google Scholar] [CrossRef]
- Sowa, J. Air Quality and Ventilation Rates in Schools in Poland—Requirements, Reality and Possible Improvements. In Indoor Air, Proceedings of 9th International Conference on Indoor Air Quality and Climate, CA, USA, 30 June–5 July 2002; The Printing House: Stoughton, MA, USA, 2002; pp. 68–73. [Google Scholar]
- Hani, A.; Koiv, T.-A.; Mikola, A. Carbon Dioxide Levels in Educational Institutions. In EE’11, Proceedings of the 6th IASME/WSEAS International Conference on Energy & Environment, Cambridge, UK, 23–25 February 2011; Bojkovic, Z., Kacprzyk, J., Mastorakis, N., Mladenov, V., Revetria, R., Eds.; World Scientific and Engineering Academy and Society: Stevens Point, WI, USA, 2011; pp. 378–383. [Google Scholar]
- Ventilation for Acceptable Indoor Air Quality Standard 62.1; American Society of Heating, Refrigerating and Air-Conditioning Engineers (ASHRAE): Atlanta, GA, USA, 2007.
- Coley, D.A.; Beisteiner, A. Carbon Dioxide Levels and Ventilation Rates in Schools. Intern. J. Vent. 2002, 1, 45–52. [Google Scholar] [CrossRef]
- Kapalo, P.; Voznyak, O.; Yurkevych, Y.; Myroniuk, K.; Sukholova, I. Ensuring comfort microclimate in the classrooms under condition of the required air exchange. East.-Eur. J. Enterp. Technol. 2018, 5, 6–14. [Google Scholar] [CrossRef]
- Simanic, B.; Nordquist, B.; Bagge, H.; Johansson, D. Indoor air temperatures, CO2 concentrations and ventilation rates: Long-term measurements in newly built low-energy schools in Sweden. J. Build. Eng. 2019, 25, 100827. [Google Scholar] [CrossRef]
- Zemitis, J.; Bogdanovics, R.; Bogdanovica, S. The study of CO2 concentration in a classroom during the covid-19 safety measures. E3S Web Conf. 2021, 246, 01004. [Google Scholar] [CrossRef]
- Ortiz, M.; Itard, L.; Bluyssen, P.M. Indoor environmental quality related risk factors with energy-efficient retrofitting of housing: A literature review. Energy Build. 2020, 221, 110102. [Google Scholar] [CrossRef]
- Zuhaib, S.; Manton, R.; Griffin, C.; Hajdukiewicz, M.; Keane, M.M.; Goggins, J. An Indoor Environmental Quality (IEQ) assessment of a partially-retrofitted university building. Build. Environ. 2018, 139, 69–85. [Google Scholar] [CrossRef]
- Lis, A. Maintaining thermal comfort and air quality in buildings. ZN PCz. Budown. 2019, 25, 137–144. [Google Scholar] [CrossRef]
- Freemeteo. Available online: https://freemeteo.pl/pogoda/czestochowa/historia/codzienna-historia/?gid=3100946&station=4231&date=2014-05-08&language=polish&country=Poland (accessed on 19 March 2021).
- Sekret, R.; Wilczynski, J. The effect of variations in ambient air temperature and heating season length on the number of degree-days on the example of the city of Czestochowa. Energy Market. J. 2011, 4, 58–63. [Google Scholar]
- Ferdyn-Grygierek, J. Efektywność energetyczna ogrzewania i wentylacji modernizowanych budynków szkół. Dist. Heat. Heat. Vent. 2005, 10, 28–31. [Google Scholar]
- EN 16798-1:2019. Energy Performance of Buildings—Ventilation for Buildings—Part 1: Indoor Environmental Input Parameters for Design and Assessment of Energy Performance of Buildings Addressing Indoor Air Quality, Thermal Environment, Lighting and Acoustics—Module M1-6; European Committee for Standardization: Brussels, Belgium, 2019. [Google Scholar]
- Laskowski, L. Ochrona Cieplna i Charakterystyka Energetyczna Budynku, 2nd ed.; Publishing House of the Warsaw University of Technology: Warsaw, Poland, 2008; p. 174. [Google Scholar]
- Gratia, E.; De Herde, A. Design of low energy office buildings. Energy Build. 2003, 35, 473–491. [Google Scholar] [CrossRef]
- Krüger, E.L.; Zannin, P.H.T. Acoustic, thermal and luminous comfort in classrooms. Build. Environ. 2004, 39, 1055–1063. [Google Scholar] [CrossRef]
- Perez, Y.V.; Capeluto, I.G. Climatic considerations in school building design in the hot–humid climate for reducing energy consumption. Appl. Energy 2009, 86, 340–348. [Google Scholar] [CrossRef]
- Hernandez, P.; Burke, K.; Lewis, J.O. Development of energy performance benchmarks and building energy ratings for non-domestic buildings: An example for Irish primary schools. Energy Build. 2008, 40, 249–254. [Google Scholar] [CrossRef]
- Nantka, M.B. Relacje między szczelnością okien a realizacją zadań tradycyjnej wentylacji budynków wielorodzinnych. Dist. Heat. Heat. Vent. 2004, 1, 21–24. [Google Scholar]
- Hwang, R.-L.; Lin, T.-P.; Chen, C.-P.; Kuo, N.-J. Investigating the adaptive model of thermal comfort for naturally ventilated school buildings in Taiwan. Int. J. Biomet. Taichung Taiwan 2009, 53, 189–200. [Google Scholar] [CrossRef] [PubMed]
- Pinto, M.; Viegas, J.; de Freitas, V.P. Air permeability measurements of dwellings and building components in Portugal. Build. Environ. 2011, 46, 2480–2489. [Google Scholar] [CrossRef] [Green Version]
- Van Den Bossche, N.; Janssens, A. Airtightness and watertightness of window frames: Comparison of performance and requirements. Build. Environ. 2016, 110, 129–139. [Google Scholar] [CrossRef]
- ANSI/ASHRAE Standards 62.1-2019. Ventilation for Acceptable Indoor Air Quality; ASHRAE: Atlanta, GA, USA, 2019. [Google Scholar]
- CEN/TR 16798-2:2019. Energy Performance of Buildings—Ventilation for Buildings—Part 2: Interpretation of the Requirements in EN 16798-1—Indoor Environmental Input Parameters for Design and Assessment of Energy Performance of Buildings Addressing Indoor Air Quality, Thermal Environment, Lighting and Acoustics (Module M1-6); European Committee for Standardization: Brussels, Belgium, 2019. [Google Scholar]
- EN 1026:2016. Windows and Doors—Air Permeability—Test Method; European Committee for Standardization: Brussels, Belgium, 2016. [Google Scholar]


| Value (x) | Selected Measures of Statistical Description | ||||
|---|---|---|---|---|---|
| Average Value | Standard Deviation | Limits of Typicality | Coefficient of Variation | Skewness | |
| xav | s(x) | xtyp | Vk(x) [%] | S(x) | |
| Volume of the building, V [m3] | 14,682.37 | 9674.55 | 5007.82–24,356.92 | 65.89 | 1.53 |
| Usable area of a building, Pu [m2] | 3194.09 | 2161.41 | 1032.67–5355.50 | 67.67 | 1.54 |
| Number of classrooms, Nc | 21 | 12 | 9–33 | 58.48 | 1.68 |
| Ratio of the area of external envelope to cubic capacity, Aep/V [m1] | 0.40 | 0.09 | 0.31–0.50 | 23.43 | 1.13 |
| Thermal power, q [kW] | 323.38 | 235.15 | 88.23–558.54 | 72.72 | 1.71 |
| q/V indicator, [W/(m3y)] | 21.93 | 5.11 | 16.81–27.04 | 23.32 | −0.11 |
| Heat consumption, Q [GJ/y] | 1996.52 | 1266.14 | 730.38–3262.66 | 63.42 | 1.07 |
| Q/V indicator, [GJ/(m3y)] | 138.36 | 39.26 | 99.10–177.62 | 28.37 | 1.34 |
| Value (x) | Selected Measures of Statistical Description | ||||
|---|---|---|---|---|---|
| Average Value | Standard Deviation | Limits of Typicality | Coefficient of Variation | Skewness | |
| xav | s(x) | xtyp | Vk(x) [%] | S(x) | |
| Volume of the building, V [m3] | 14,682.37 | 9674.55 | 5007.82–24,356.92 | 65.89 | 1.53 |
| Usable area of building, Pu [m2] | 3194.09 | 2161.41 | 1032.67–5355.50 | 67.67 | 1.54 |
| Number of classrooms, Nc | 21 | 12 | 9–33 | 58.48 | 1.68 |
| Usable area of classroom, Ac [m2] | 50.44 | 8.12 | 42.32–58.56 | 16.10 | 0.02 |
| Number of students in classroom, Nsc | 29 | 9 | 22–40 | 29.62 | 2.02 |
| Usable area of classroom per student, Acs = (Ac/Nsc) [m2] | 1.58 | 0.41 | 1.28–2.11 | 24.38 | 0.21 |
| Value (x) | Selected Measures of Statistical Description | ||||
|---|---|---|---|---|---|
| Average Value | Standard Deviation | Limits of Typicality | Coefficient of Variation | Skewness | |
| xav | s(x) | xtyp | Vk(x) [%] | S(x) | |
| Ratio of the windows area to the façades area, Aw/Af | 0.24 | 0.05 | 0.19–0.30 | 21.73 | −0.11 |
| Ratio of the windows area to usable area, Aw/Au | 0.20 | 0.06 | 0.15–0.26 | 27.43 | 0.07 |
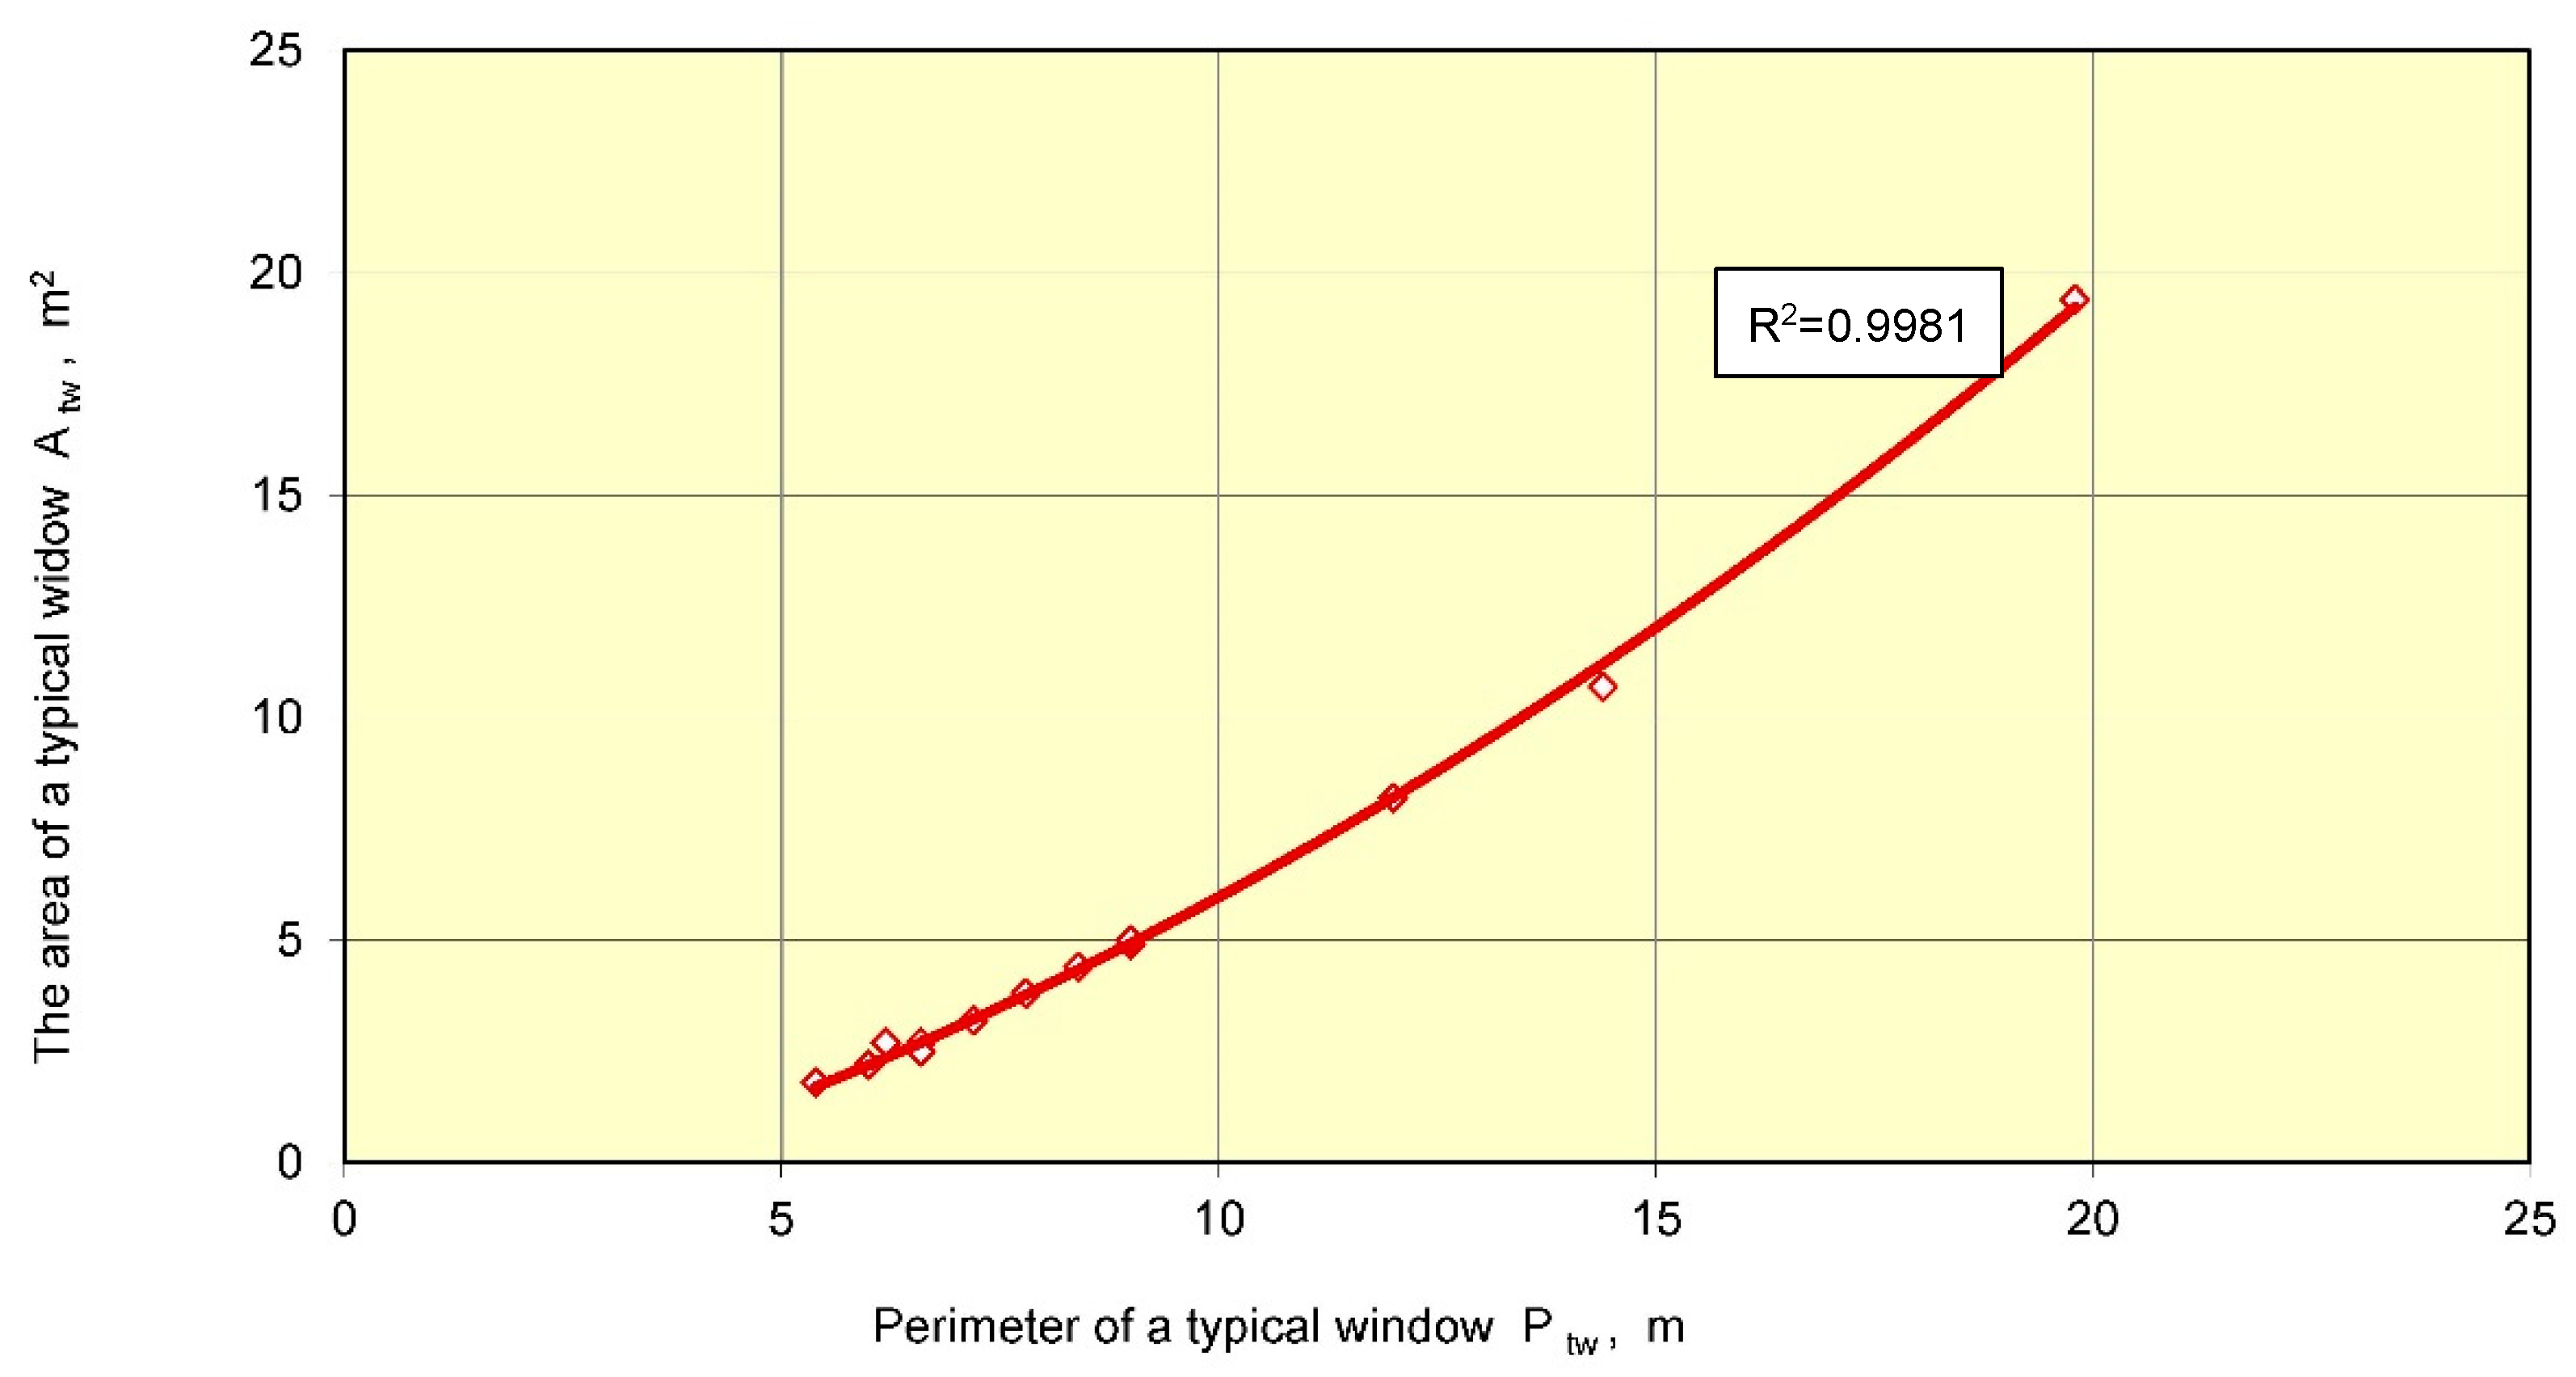
| Area of a typical window, Atw [m2] | 4.49 | 2.73 | 3.84–5.28 | 68.88 | 4.12 |
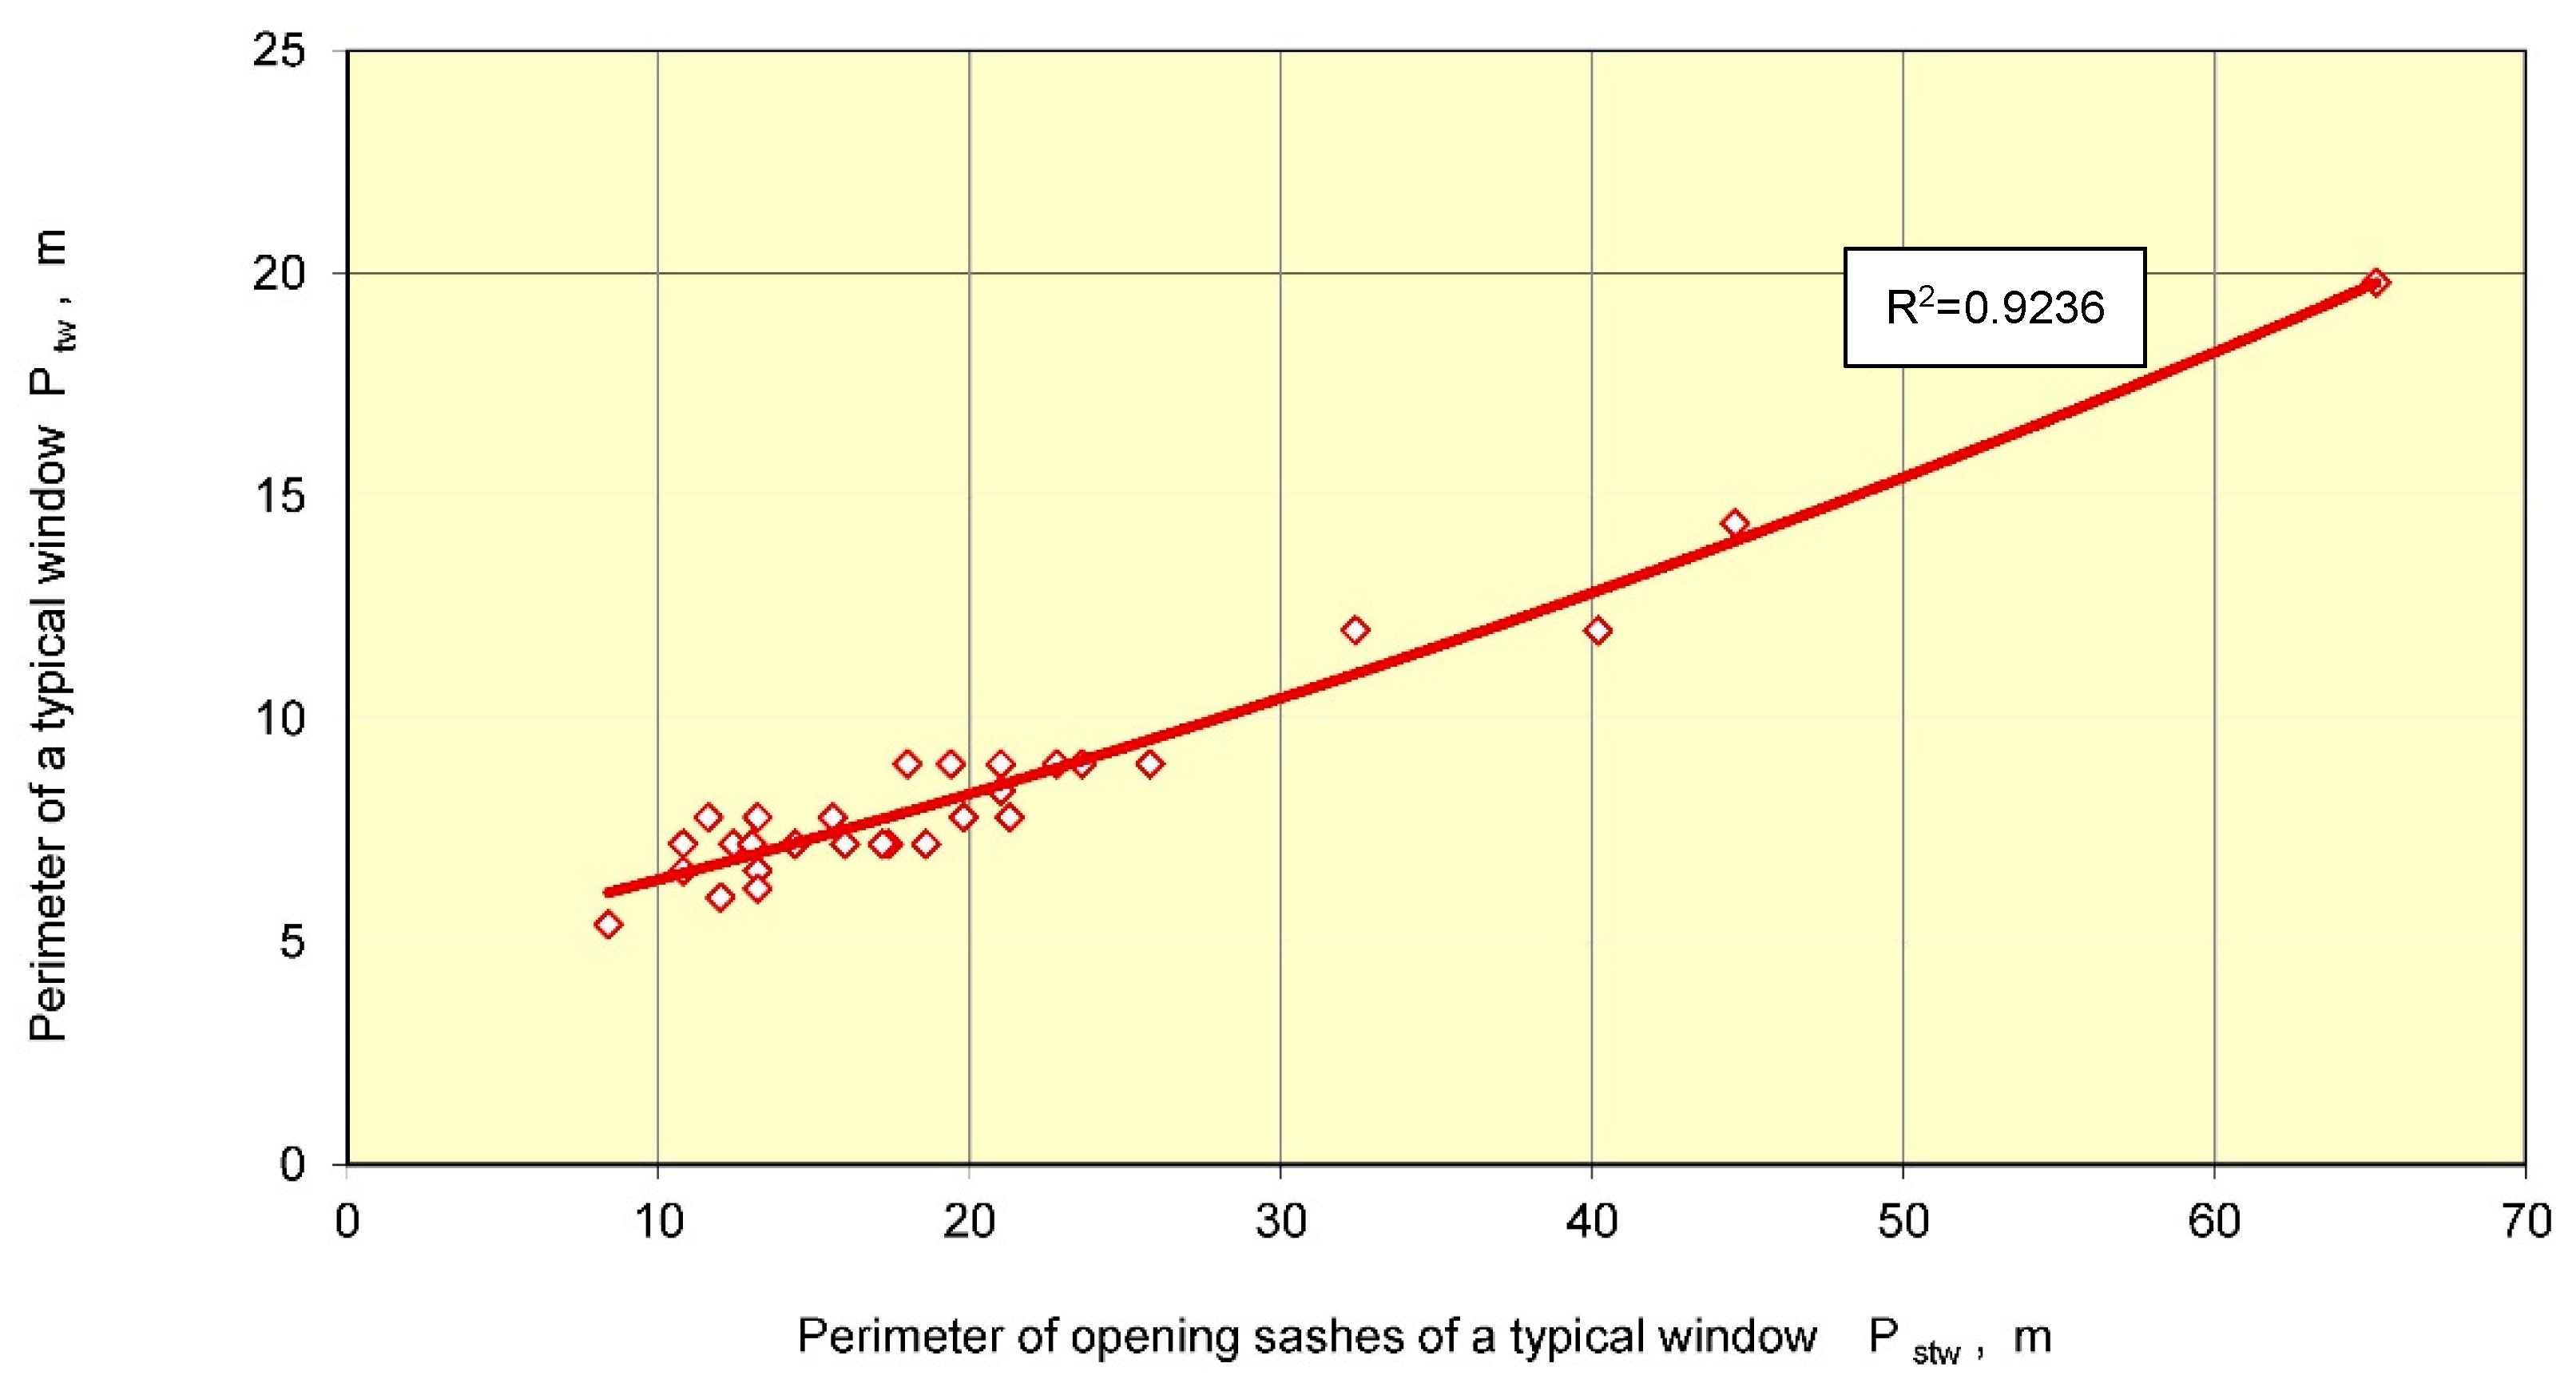
| Perimeter of a typical window, Ptw [m] | 8.38 | 2.34 | 6.04–10.72 | 27.98 | 3.16 |
| Perimeter of a opening sashes in a typical window, Pstw [m] | 19.74 | 9.76 | 9.98–29.51 | 49.46 | 2.88 |
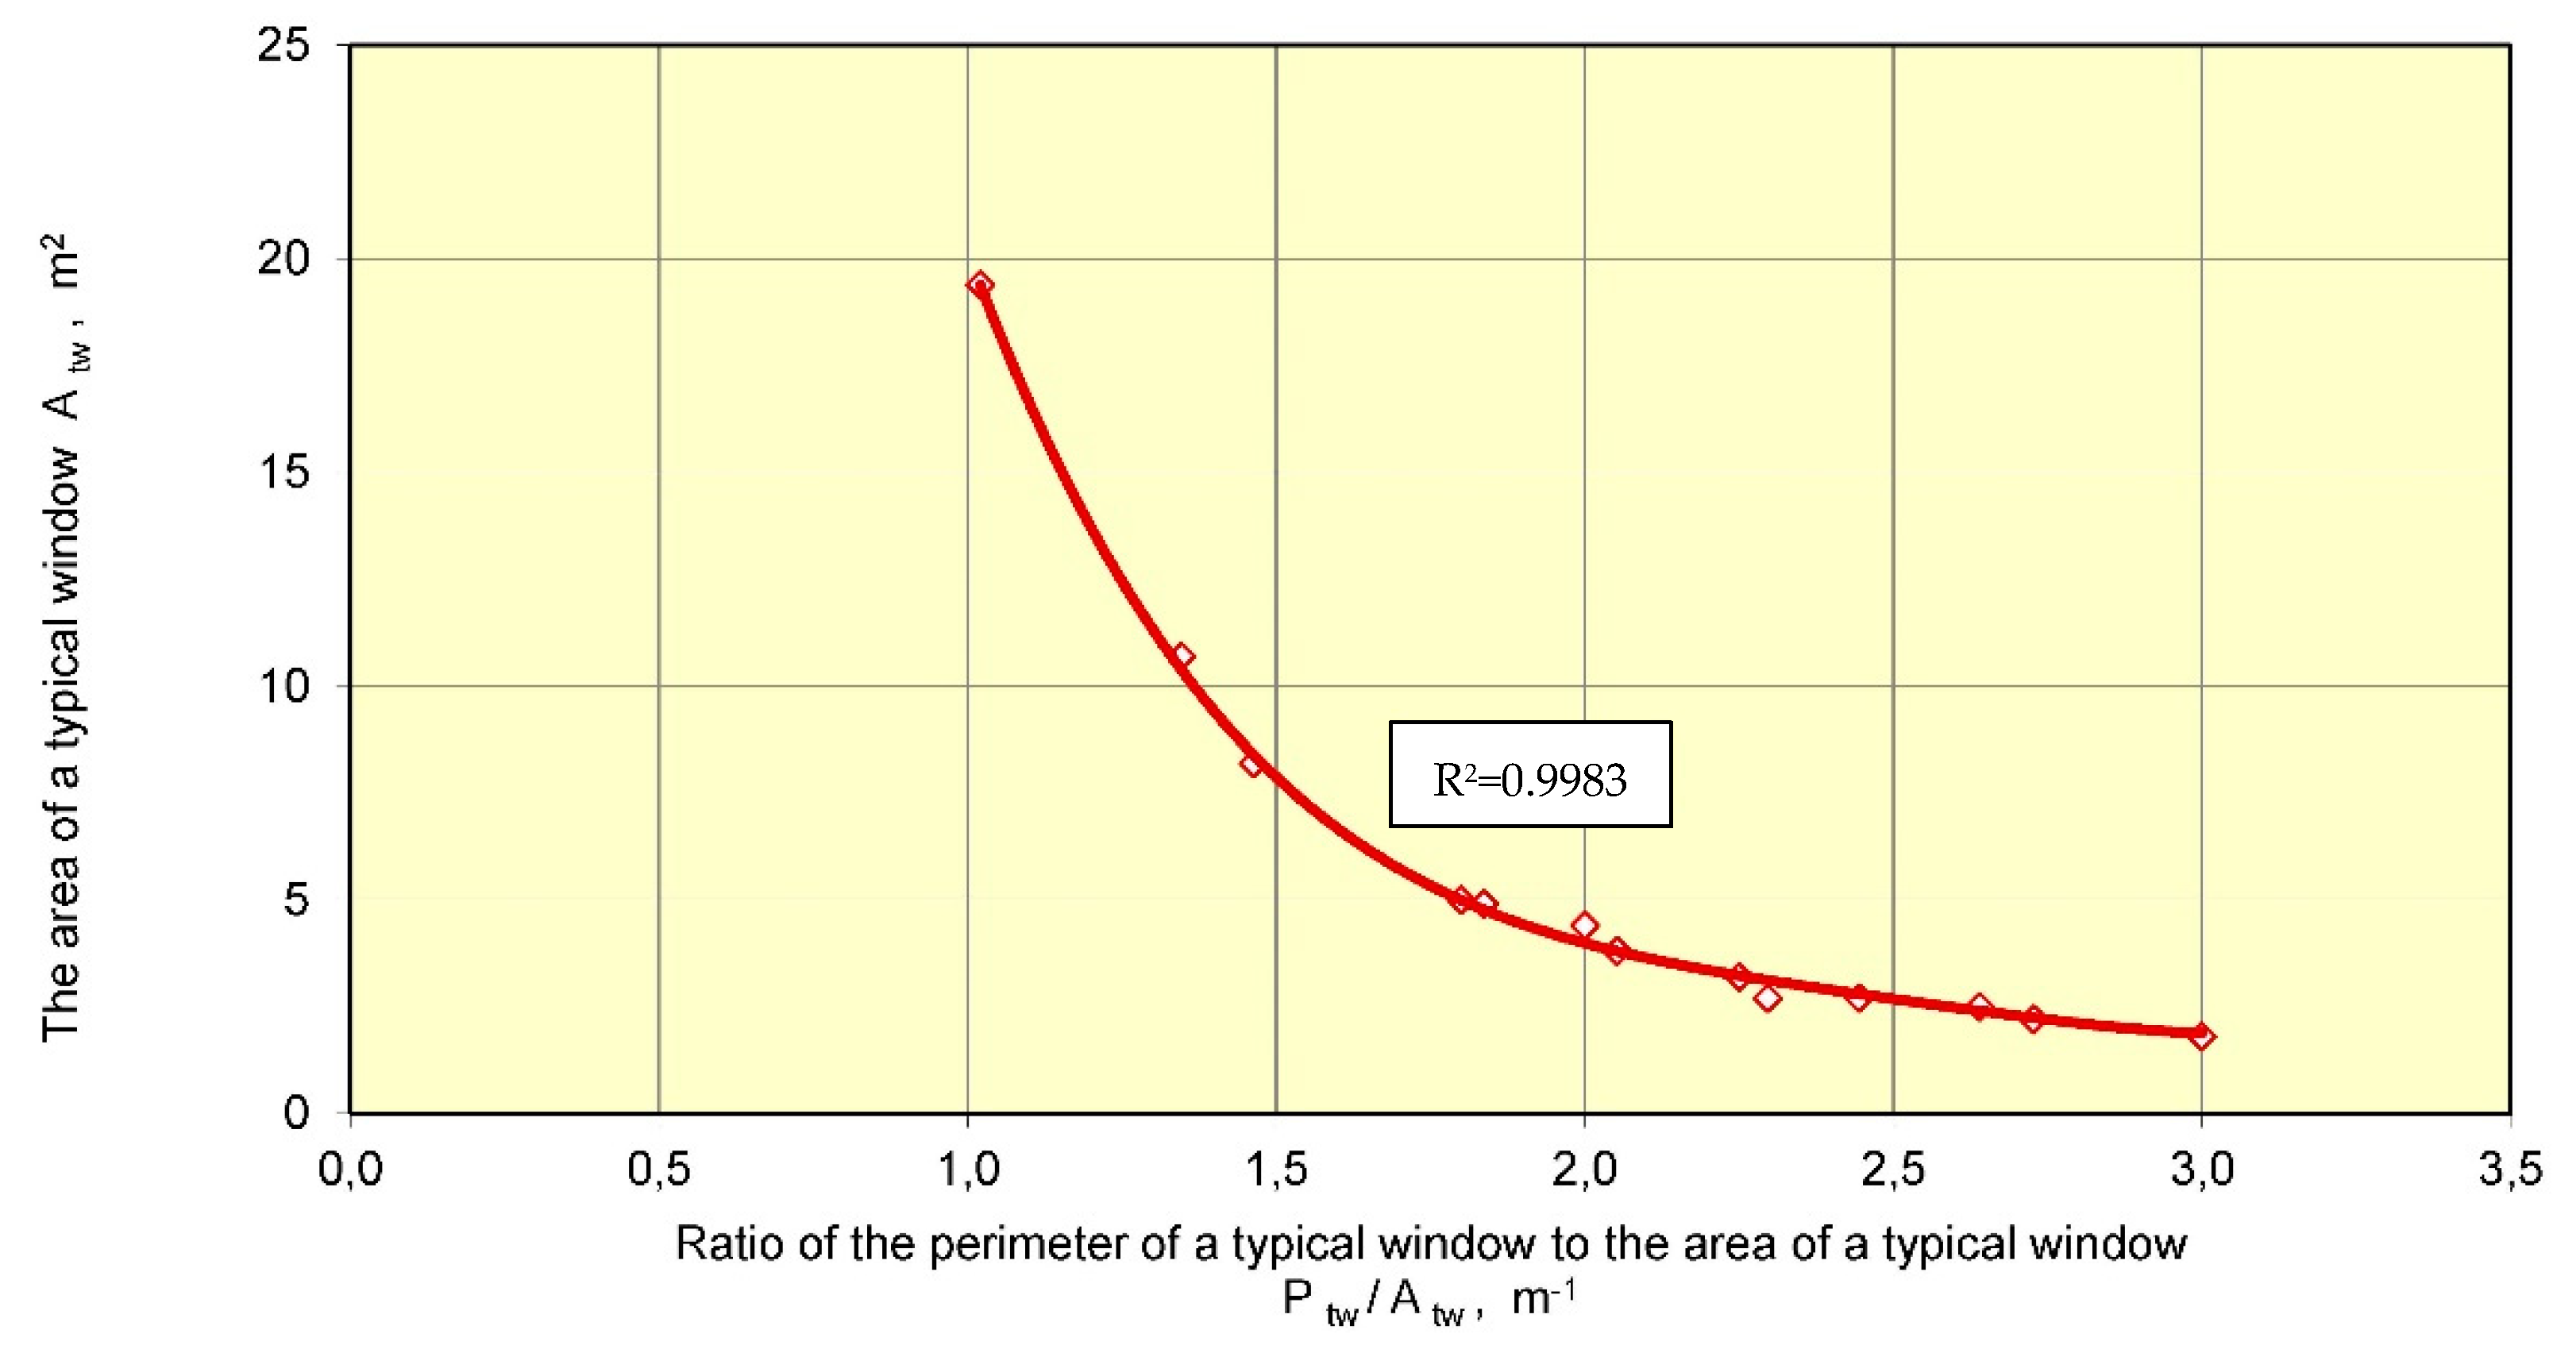
| Ratio of the perimeter of a typical window Ptw to the area of a typical window, Atw Ptw/Atw [m−1] | 2.06 | 0.40 | 1.67–2.46 | 19.18 | 0.04 |
| Ratio of the perimeter of a opening sashes of a typical window to the area of a typical window, Pstw/Atw [m−1] | 4.56 | 0.72 | 3.84–5.28 | 15.80 | −0.32 |
| Construction Element | Type of Sealing, Level of Wear | Leakage Rate a [m3/(m·h·daPa2/3)] | Air Permeability Rate q100KL [m3/(m·h)] |
|---|---|---|---|
| Windows, glazed balcony door or entrance door | Slide, sealed | 0.2–0.3 | 0.9283–1.3925 |
| Frequently opened, sealed | 0.3–0.6 | 1.3925–2.7848 | |
| With minimum sealing, damaged, no sealing | above 1.1–3.5 | above 5.1058–16.2456 |
Publisher’s Note: MDPI stays neutral with regard to jurisdictional claims in published maps and institutional affiliations. |
© 2021 by the authors. Licensee MDPI, Basel, Switzerland. This article is an open access article distributed under the terms and conditions of the Creative Commons Attribution (CC BY) license (https://creativecommons.org/licenses/by/4.0/).
Share and Cite
Lis, P.; Lis, A. The Required Amount of Ventilation Air for the Classroom and the Possibility of Air Infiltration through the Windows. Energies 2021, 14, 7537. https://doi.org/10.3390/en14227537
Lis P, Lis A. The Required Amount of Ventilation Air for the Classroom and the Possibility of Air Infiltration through the Windows. Energies. 2021; 14(22):7537. https://doi.org/10.3390/en14227537
Chicago/Turabian StyleLis, Piotr, and Anna Lis. 2021. "The Required Amount of Ventilation Air for the Classroom and the Possibility of Air Infiltration through the Windows" Energies 14, no. 22: 7537. https://doi.org/10.3390/en14227537
APA StyleLis, P., & Lis, A. (2021). The Required Amount of Ventilation Air for the Classroom and the Possibility of Air Infiltration through the Windows. Energies, 14(22), 7537. https://doi.org/10.3390/en14227537