Article

Obstacle Identification and Analysis to the Commercialization of CCUS Technology in China under the Carbon Neutrality Target

1
School of Economics and Management, North China Electric Power University, Beijing 102206, China
2
Beijing Key Laboratory of New Energy and Low-Carbon Development, North China Electric Power University, Beijing 102206, China
*
Author to whom correspondence should be addressed.
Energies 2022, 15(11), 3964; https://doi.org/10.3390/en15113964
Submission received: 20 April 2022 / Revised: 22 May 2022 / Accepted: 24 May 2022 / Published: 27 May 2022

Abstract

:
As the largest emitter of carbon dioxide all over the world, China requires a rapid breakthrough and large-scale commercial application of carbon capture, utilization and sequestration (CCUS) technology to achieve the 2060 carbon neutrality target. However, the process of CCUS technology commercialization in China is quite slow. Firstly, an obstacle system with 15 factors is established based on a literature review and expert consultation, namely on economic, technical, political, market, and social obstacles. Secondly, taking into account the uncertainty and randomness inherent in subjective judgment, Vague set is introduced for the first time to improve the DEMATEL-ANP (DANP) method in order to analyze comprehensive importance and causal relationship of obstacles. According to the study, in advancing CCUS’s commercialization in China, economic obstacles are simply the tip of the iceberg, with the deeper reasons rooted in political obstacles. Specifically, seven critical obstacles are lack of standards and regulations, inadequate legal and regulatory framework, insufficient incentive policies, limited carbon dioxide conversion efficiency, high energy consumption, low rate of return on investments and low investment enthusiasm of enterprise. We conclude with a series of recommendations to address these obstacles, and these findings can be used as a guide for government regulation and business practice.

1. Introduction

With global warming receiving a lot of attention, the International Energy Agency (IEA) stated in the Energy Technology Perspectives Report 2017 that the climate goal of keeping warming to 2 °C by the end of the century should be achieved [1]. In response to climate change, all countries have proposed emission reduction measures and targets, and China has also committed to reducing emissions. In September 2020, President Xi Jinping announced at the 75th General Debate of the United Nations General Assembly that China aims to reach the CO2 emission peak by 2030 and work towards achieving carbon neutrality by 2060 [2].
As a large-scale greenhouse gas reduction technology, carbon capture, utilization and sequestration (CCUS) technology provides a green transition approach for high carbon emitting industries, which is the only choice for the cleaner use of fossil energy. Moreover, CCUS technology coupled with new energy sources for negative emissions is also a bottom-up technology to offset the inability to cut carbon emissions and achieve carbon neutrality targets [3]. The Intergovernmental Panel on Climate Change (IPCC) specifically highlighted the importance of achieving net-zero CO2 emissions by mid-century in its Special Report on Global Warming to 1.5 °C, suggesting that decarbonization is necessary to achieve net-zero emissions and to compensate for the net negative emissions required to exceed 1.5 °C [4]. Therefore, CCUS has a pivotal role in mitigating global warming [3,5]. However, due to a variety of factors, CCUS technology is not currently commercially available worldwide.
China is the largest emitter of carbon dioxide all over the world, accounting for nearly 30% of global emissions. At current carbon emission levels, 17.5 to 31.5 billion tons of CO2 would need to be reduced with CCUS technology to achieve the carbon neutrality target. However, the current capture capacity of most CCUS projects in China is between 10,000 tons and 100,000 tons, and there is a huge gap between abatement demand and capture capacity. Meanwhile, according to the China Carbon Dioxide Capture, Utilisation and Storage (CCUS) Report (2019) [6], as of August 2019, a total of nine pure capture demonstration projects and 12 geological utilization and storage projects, including 10 full process demonstration projects, have been carried out in China. The situation is similar in other countries: the majority of CCUS projects are still research demonstration projects, with only a few CCUS commercialization projects. It is calculated that if the commercialization of CCUS technology is not accelerated as soon as possible, resulting in a lag in large-scale technology rollout, low-cost development opportunities will be missed and China will pay an additional USD 100–300 billion [7]. As a result, more than any other country in the world, China requires a rapid breakthrough and large-scale commercial application of CCUS technology to achieve the 2060 carbon neutrality target while ensuring national energy security and stable economic and social development [8], and the analysis of the obstacle system to the promotion of CCUS technology in China is both realistic and urgent.
Currently, researchers have explained why CCUS technology is difficult to commercialize from various perspectives. Most researchers believe that high cost, including the investment cost and operation and maintenance cost (O&M costs), is the mainly obstacle of commercialization [9,10,11,12]. According to statistics, due to the huge cost pressure, enterprises can only maintain a yield of 2% or even below, which seriously affects their motivation to build CCUS projects. Meanwhile, there is also a section of researchers who believe that technical factors are the major obstacle to the commercialization of CCUS projects. The cost of operation and maintenance was increased due to high energy consumption of carbon capture equipment. It requires continuous capital investment, which puts enormous financial pressure on the enterprises. In addition, policy (e.g., lack of policy incentives) and social obstacles (e.g., poor infrastructure) were also cited as important barriers to the commercialization of CCUS technology [13,14,15]. Nonetheless, it is rarely emphasized in prior studies that the failure to commercialize CCUS technology is the result of numerous obstacles interacting, instead of a single obstacle [16]. Therefore, the study of the obstacle system of CCUS technology commercial application should focus on the interactions between the obstacles.
The research questions of this study are: What are the obstacles that hinder the commercialization of CCUS technology in China? How do these obstacles interact with each other?
Compared with the existing studies, this paper makes several innovations and contributions as follows: (1) A comprehensive obstacle system is formulated. This study identifies the obstacles that hinder the commercialization of CCUS technology in China based on existing literature and research findings. After expert discussion, an obstacles system is formulated that includes five dimensions: economic; technical; social; political; and market. Notably, the system includes common indicators that can be utilized to create an obstacle system for the commercial deployment of CCUS technology in different countries; (2) Critical obstacles were identified and detailed enhancement recommendations were made. Specifically, based on analysis of the importance of each type of obstacle (economic, technical, social, political and market), this study further identifies seven critical obstacles to the commercialization of CCUS in China under each type of obstacle and proposes five corresponding detailed recommendations to address them. This finding can be used as a reference for relevant authorities to develop more effective CCUS’s commercialization promotion strategies; (3) Propose Vague-DANP method, the combination of Vague fuzzy sets, the Decision-making Trial and Evaluation Laboratory (DEMATEL) and the Analytical Network Process (ANP), for obstacle analysis. This study introduces the Vague set to improve the DEMATEL-ANP (DANP) method in order to provide a more comprehensive view of the evaluation results. The Vague-DANP method accounts for both fuzziness in expert judgment and correlation between indicators, and it can also be used for factor analysis in other research fields with good evaluation results.
We have organized our paper as follows. A literature review is presented in Section 2. In Section 3, an obstacle system of China’s CCUS technology commercial application is formulated. In Section 4, we provide the introduction of the Vague-DANP method used in this paper. In Section 5, we discuss the results. In Section 6, we show our research conclusion and suggestions for the commercial development of CCUS technology in China.

2. Literature Review

This section briefly reviews theoretical and empirical studies analyzing the obstacles that hinder the commercialization of CCUS technology, namely related work of carbon capture, utilization and sequestration projects and obstacle system analysis.

2.1. Carbon Capture, Utilization and Sequestration Projects

Researchers studied various issues related to the construction and operational phases of CCUS projects in order to promote the commercialization of CCUS technology.
As for the construction phase of the CCUS project, the study focused on construction cost optimization, calculating the optimal investment schedule and developing an investment strategy. Researchers working on construction cost optimization, such as Richard S., developed a scalable infrastructure model for CCS (simCCS) that generates a fully integrated, cost-effective CCS system. SimCCS determines how much CO2 is captured and where it is stored, as well as where pipelines of various sizes are built and connected, in order to minimize the combined, integrated cost of sequestering a given amount of CO2 [17]. Cui ranked all coal plants in China based on three dimensions (technical attributes, profitability, and environmental impact) and created a decommissioning algorithm for China’s CCUS project deployment in coal-fired power plants [18]. Fan calculated the timing of Chinese thermal power plant technological transformation from the perspective of avoiding technology lock-in [19]. Aliabadi developed a mixed integer nonlinear programming model (MINLP) that takes endogenous technological learning (ETL) into account and determines the optimal capacity and deployment time of post-combustion carbon capture devices, as well as the optimal source-sink match in the CO2 supply chain, while accounting for techno-economic constraints and regulations [20]. Rohlfs and Guo created a carbon capture and storage (CCS) investment decision model with the goal of maximizing benefits by providing a decision method for enterprises to carry out CCS renovation and determining time points [21,22].
As for the project’s operational phase, scholars produced more research results, with an emphasis on the examination of government subsidy schemes, research on project business models, and risk analysis. Manaf explores the potential of the Emission Reduction Fund (ERF) project for black coal power generation in Australia in promoting the commercial deployment of post-combustion CO2 capture (PCC) technology [23]. Yang compared the influence among several subsidy schemes on the investment efficiency of carbon capture, utilization, and storage (CCUS) facilities in China at high, medium, and low coal prices, including initial investment subsidies, electricity price subsidies, and carbon dioxide utilization subsidies [24]. Fan developed a trinomial tree model based on delayed real options to assess the impact of the 45Q tax credit on investment in CCS retrofits for coal-fired power plants [25]. Chen considered the combined effect of carbon markets and policy subsidies and developed a real options model to analyze the impact of subsidy intensity and subsidy approach on CCS investment decisions [26]. Yao constructed four business models based on the different stakeholders involved in the CCUS project, and found that the vertically integrated model was the most suitable option for China to deploy CCUS in the early demonstration phase due to its lower interest rates and transaction costs. Based on current CCUS cost levels, storage should be subsidized in the early phases, whereas a realistic and stable carbon pricing policy (e.g., carbon tax) would support large-scale deployment of CCUS in the long run [27]. Muslemani discusses the key factors for the success of the CCUS business model in industries other than electricity and concludes that the revenue model is the most important aspect in developing a successful CCUS business model [28]. Zhu used scenario analysis to assess the impact of policy on CCS investment in China and discovered that investment risk in CCS is currently high, with climate policy having the greatest impact on CCS development [29]. Wang investigated the elements that stymie CCUS technology commercialization by analyzing the experiences of unsuccessful CCUS projects around the world, and discovered that the main reason for stymieing commercialization is the imbalance between project risks and rewards [9]. Sara discovered that the barriers to CCUS technology commercialization are intertwined, with ‘CO2 pricing’ and ‘financial incentives’ being the most crucial barriers that need to be addressed [16].

2.2. Obstacle System Analysis

The research on obstacle systems is mainly applied to analyze the influencing factors in the process of promoting new technologies and to provide a basis for managers to formulate relevant policies to promote new technologies. In terms of methods for obstacle system analysis, the Decision-making Trial and Evaluation Laboratory (the DEMATEL) method is a highly advantageous approach that has been adopted in many studies [30]. Hu applied the DEMATEL method to analyze the causal relationships between factors that hinder the lifecycle management of end-of-life tires [31]. Xu used the DEMATEL methodology to analyze the key barriers to the development of hydrogen refueling stations in China [32]. Kouhizadeh et al. conducted a barrier analysis of the application of blockchain technology in supply chain management based on the DEMATEL approach [33]. Wu et al. proposed a fuzzy DEMATEL method to discuss barrier systems for decentralized wind power generation [34]. Sara combined the AHP (Analytic Hierarchy Process) and DEMATEL method to assess the main barriers to the deployment of the ROAD project in the Netherlands [16]. In recent years, the ANP-DEMATEL method has also received scholarly attention. Karuppiah uses the fuzzy ANP-DEMATEL approach to identify, analyze, and assess faulty behavior risks (FBRs) that contribute to workplace injuries and accidents [35]. The fuzzy ANP-DEMATEL method has also been used by researchers such as Wu to analyze the barriers to decentralized wind power development [36].
However, experts found it challenging to represent preference information in precise real values due to the intricacy of barrier system analysis. As a result, researchers used fuzzy analysis methods to improve multi-attribute decision making by accounting for the fuzziness of subjective expert judgment. Fuzzy Comprehensive Evaluation can not only consider a variety of influencing factors, but also unify and quantify people’s subjective and uncertain evaluations, based on the introduction of the fuzzy transformation principle and the maximum subordination criterion, to obtain comprehensive evaluation results through reasoning and calculation. Wu et al. introduced Pythagorean fuzzy numbers to analyze the barrier system of decentralized wind power [36]. Xu proposed a fuzzy DEMATEL approach to identify the key barriers to hydrogen refueling station development [37]. Jiang et al. identified key performance indicators for healthcare management by using Z-fuzzy numbers combined with the DEMATEL method. Afterwards, Dinçer et al. applied interval type II fuzzy DEMATEL for the assessment of financial services [38]. In addition to fuzzy numbers, Vague sets have been used in a number of areas of research [39,40]. As a generalization of Fuzzy Set Theory, the Vague set provide a more comprehensive representation of information and is able to portray both fuzzy and uncertainty properties, providing information on support membership degree, opposition membership degree and unknowns at the same time. Zulkifli developed a new interval-valued intuitionistic fuzzy vague sets (IVIFVS) linguistic variable with five linguistic scales applied to the Vague fuzzy set for better solving multi-criteria decision issues [41]. Elzarka proposed a Vague fuzzy set multi-attribute group decision model to select the most appropriate renewable energy technology (RET) for institutional owners [42].
According to the literature review, the following conclusions can be drawn.
(1) Selection of research subjects. The majority of CCUS project research has concentrated on projects that are already in operation, with the goal of lowering project operating costs and examining the investment strategy and subsidy policy’s strength. However, most of the projects in operation are demonstration projects, which have financial, locational or policy advantages in project construction. As these models are hardly replicable, there is a certain research bias in using these projects as research objects. Indeed, to promote CCUS technology commercialization, it is important to take stock of the successes of the CCUS project, but the factors that hindered the project should not be ignored.
(2) Research method. DEMATEL is an effective method for identifying causal relationships between factors in a complex system [43]. The ANP method is a practical decision-making method based on AHP that takes into account the interplay between elements or neighboring levels. Vague set membership degree has the advantage of being able to address uncertainty problems dynamically in terms of both support and opposition, which solves the problem of information loss caused by non-additivity of membership degree in conventional fuzzy theory. Thus, the Vague-DANP method is a more effective solution to the problem of decision analysis in complex networks with the interaction of various factors [44,45].
In conclusion, this study analyzes the obstacle system of CCUS technology commercialization in China. The obstacle system formulated in this paper includes a number of qualitative indicators that interact with each other, thus, this paper used the Vague-DANP method, which can better reflect the relationship between indicators and the degree of importance and is more suitable for the analysis of the relationship between factors in a complex system.

3. Obstacles to China’s CCUS Promotion

This section extracts the obstacles that hinder CCUS technology commercialization in China by literature review and expert consultation. Initially, through literature review and interviews with relevant practitioners, potential obstacles to the CCUS technology commercialization were screened out. Secondly, we separate potential obstacles into five categories: economic; technical; policy; market; and social. Simultaneously, a questionnaire is created and distributed to experts. Experts make the appropriate adjustments on indicators based on their knowledge of the present state of CCUS technology application in China. A total of 53 experts were interviewed, including practitioners, managers and scholars in related fields, and 48 valid questionnaires were recovered. According to the sorting out of the questionnaires, the obstacles of CCUS technology commercialization were preliminarily determined (Appendix A). Finally, six experts were invited to attend an expert seminar, including a research institution manager, two CCUS technical experts and three professors. Appendix B contains information about the experts’ backgrounds. The expert seminar was organized online through Tencent Meeting. By evaluating the survey interview records and questionnaire findings, experts conducted three rounds of discussions and revision of the indicators, eventually determining the primary obstacle system affecting the CCUS technology commercialization (Figure 1).

3.1. Economic Obstacles

High investment cost (h11): The investment cost of the CCUS project takes up the highest proportion of the total project cost. Depending on the carbon capture capacity, the investment amount ranges from tens of millions to hundreds of millions, and the investment payback period is more than 10 years. At present, the cost of investment is absorbed by the company due to the lack of a subsidies policy. However, not every carbon-emitting enterprise has enough financial resources to invest in CCUS projects.
High operation and maintenance cost (h12): As a result of additional operation and maintenance costs being generated by carbon capture devices, the development of the CCUS project requires continuous and stable investment from enterprises. The cost of capturing CO2 at the current technological level is between 22 and 95 USD per ton. For example, at the Huaneng Group’s Shanghai Shidongkou Power Plant, an increase in operation and maintenance costs has resulted in a nearly half-price increase in power generation costs, from 0.041 USD/kWh to 0.079 USD/kWh [46], which is in line with the price of new energy power generation. On the one hand, high operation and maintenance costs increase the financial strain of enterprises. On the other hand, it considerably reduces thermal power’s pricing advantage.
Low rate of return on investments (h13): According to statistics, the overall risk rate for the CCUS project is around 44%, and this percentage could reach a 77% increase with projects scale. While the rate of return on investments of CCUS projects in China can only be maintained around 2%. The imbalance between risk and reward is a major roadblock to CCUS project commercialization.

3.2. Technical Obstacles

High energy consumption (h21): The installation of a carbon capture device increased energy consumption significantly, ranging from 10% to 20%, resulting in an increase in operation and maintenance costs [46]. Notably, the energy consumption of power plants installing desulphurization units was below 5% or even close to zero, implying that carbon capture device consumption used four times the energy of desulphurization units.
Limited carbon dioxide conversion efficiency (h22): Due to the chemical inertness and thermal stability of CO2, the catalysts used at present must continuously invest large amounts of energy to effectively convert and utilize CO2 which limits the resource utilization of CO2 and further increases the operation and maintenance costs of CCUS projects.
Insufficient geological information (h23): To ensure the safety of the storage of CO2, companies need detailed geological information about the storage site to assess the feasibility of geological use and storage. Due to the lack of geological survey technology, companies lack detailed geological information before the project is carried out and therefore cannot accurately predict the risks of the project, which seriously reduces the incentive for companies to retrofit carbon capture equipment and hinders the promotion of CCUS technology.

3.3. Political Obstacles

Inadequate legal and regulatory framework (h31): Since 2006, China has issued more than 20 national policies related to CCUS technology, establishing the importance of CCUS technology in addressing climate change. But these policies have not yet formed a system. The inadequate legal and regulatory framework means that there is no legal protection for companies to carry out CCUS projects, which may increase the risk of carrying out CCUS projects.
Lack of standards and regulations (h32): CCUS project construction involves multiple components, namely site selection, devices installation, geological condition assessment, environmental risk assessment and carbon emissions accounting. However, these components are not currently regulated to a uniform standard. For example, due to the lack of regulatory standards, the first case of carbon emission data falsification occurred in China in July 2021 (carbon emission data falsification in Inner Mongolia Erdos High-Tech Materials Co., Ltd., Erdos, Inner Mongolia Autonomous Region), and since then carbon emission data falsification has been found across China. Data falsification affects the fairness of the carbon market, which leads to companies voting with their feet and hinders the process of carbon reduction in China.
Insufficient incentive policies (h33): In China, the majority of CCUS projects are funded through direct capital investment, with funds primarily coming from national science and technology programs, self-funding from central enterprises, and international cooperation project funds, showing the characteristics of limited funding sources, small total amounts, and narrow channels. Notably, the kind of the way in which CCUS projects are built is not replicable. In the long term, CCUS technology commercialization requires policy support, which is exactly what is needed at present.

3.4. Market Obstacles

Inadequate market pulling power (h41): The purpose of installing carbon capture devices is to capture CO2 for market trading, which can generate profits for the enterprises. However, the trading price of Chinese Emission Allowances (CEA) is too low and inflexible, fluctuating between 6.3–9.4 USD; much lower than the cost to reduce emissions through CCUS projects. Hence, enterprises are unable to achieve profitability through CEA trading. To put it another way, the market’s pulling power is extremely limited.
Poor connection of the industrial chain (h42): The CCUS industry chain involves nearly all parts of energy production and consumption, such as the power, steel, cement, petroleum, chemical and other industries. Currently, cross-industry and cross-sector collaboration models for CCUS projects need to be established in China, which can improve the connection between upstream and downstream and increase CO2 consumed after capture.
Low carbon dioxide demand (h43): Due to limited technology, there are only a few methods of CO2 utilization, but the cost is rather high. The price of carbon dioxide is much lower than the price of purchasing CO2 from carbon capture companies. Meanwhile, the demand of CO2 is fixed due to the limited technology level, so it is hard to further expand the size of the market demand at present. This means that the enterprise cannot profit from CO2 trading, which becomes an obstacle to the commercialization of CCUS technology.

3.5. Social Obstacles

Lack of public support (h51): Currently, the main environmental risk of the CCUS project comes from the geological storage and use of CO2. Due to complex unpredictable and uncontrollable geological movements (e.g., earthquakes) and the corrosive effect of CO2, CO2 may leak and escape to the surface on the ground, resulting in catastrophic choking areas and an increase in the greenhouse effect. It may also produce a slew of environmental issues in the soil, groundwater, and atmosphere near the leakage site, posing a deadly threat to flora, fauna, and human health. These effects have influenced public perception and acceptance of CCUS, resulting in negative opinions against the project [47]. The Barendrecht project in the Netherlands, for example, was canceled as a result of public opposition.
Low investment enthusiasm of enterprise (h53): CCUS projects require sustained and substantial financial investment to operate. However, due to the high abatement costs of CCUS and the high risk of failure, the investment enthusiasm of enterprise is every low. Furthermore, China’s carbon emissions trading market is still in its infancy, with no large-scale market for CO2 demand and an ambiguous carbon tax policy, making economic compensation for this component of the emission reduction capacity unfeasible. These factors have created a shaky foundation for the commercial development of CCUS projects in China, deterring many enterprises and potential investors from doing so.
Inadequate infrastructure (h52): According to related research, China needs to start infrastructure building now if it is to try to achieve the commercial inflection point for CCUS by 2030. The CCUS project’s infrastructure mainly refers to the development of a CO2 transportation pipeline. Land transportation, ship transportation, and pipeline transportation are the three main modes of CO2 transportation currently available. Pipeline transport is the most widely used mode of transportation in China at the present since it is safe, continuous, has cheap transportation costs after completion, and is suited for long-distance transfer. However, at the moment, enterprises lay their own transport pipelines, and CO2 is only transported between two points, rather than forming a pipeline network to achieve multi-point CO2 transport.

4. Methodology

4.1. DEMATEL-ANP Indicator Assignment

The DANP method, which combines DEMATEL and ANP methods, was used to assign weights to the indicators in this study. Firstly, the DEMATEL method was used to clarify the interactions between the first-level indicators and the degree of influence (step 1–4). Secondly, the ANP method was used to clarify the relative weights of the second-level indicators (step 5–11). The Super Decision software is used in this section, and the calculation procedure is as follows.
Step 1: Direct-relation matrix constructed. In order to specify the degree of direct influence of the first-level indicators U i on U j , the following matrix of direct relationships needs to be constructed:
X = [ x i j ] n × n
x i j indicates the degree of influence of the primary indicator U i on U j , 1 i n ,   1 j n . Number 0–5 indicates six levels from no impact to strong impact.
Step 2: Direct impact matrix calculation. The formula is as follow:
B = 1 max 1 i n j = 1 n a i j X
Step 3: Derive the combined impact matrix. The combined impact matrix reflects the causality of the indicators at the system. It is calculated using matrix B.
T = [ t i j ] n × n = lim k + ( B + B 2 + B 3 + + B k ) = B ( I B ) 1
where I is unit matrix.
Step 4: Centrality ( D + R ) and causality ( D R ) solving. D i refers to the degree of influence of indicator i on other indicators and is the sum of row i in T . R j refers to the degree of influence of indicator j on other indicators and is the sum of column j in T
D = j = 1 n t i j , R = i = 1 n t i j
D + R refers to centrality, the value reflects the indicator’s importance in the system. D R refers to causality, if D R > 0 , then the indicator refers to a causal indicator, indicating that it has a high degree of influence on other indicators; conversely, it is an outcome indicator.
After the interactions between the first-level indicators were determined, the ANP method was used to clarify the relative weights of the secondary indicators (step 5–11).
Step 5: Constructing network structure diagram. The ANP network structure is made up of two layers: the control layer and the network layer. The target layer and criterion layer are part of the control layer. The control layer dominates the network layer, which is made up of element sets (primary indicators) and elements (secondary indicators). Each element set is not self-contained, and the indicators influence each other. As a result, the first step is to draw a network structure diagram to figure out the relationships between the indicators.
Step 6: Construct judgment matrix. Establish a pair-wise comparison matrix: For the pair-wise comparisons of second-level indicators, the nine-point priority measurement scale by Saaty is used [48]. This scale from 1–9 represents pairs of equal importance (one), up to extreme inequality in importance (nine).
A = [ a 11 a 1 j a i 1 a i j ]
where a i j indicates the relative importance of the   i   element with respect to the j   element.
Step 7: Calculate the eigenvalues and eigenvectors of the judgment matrix. Assuming that, the control level element S s s = 1 , 2 , , m is a criterion and A is the judgment matrix. We used the row vector average method to normalize the results, which introduced by Saaty [48]. The approximate weight W i can be calculated by Formula (6) as follows:
W i = j = 1 n ( a i j i = 1 n ( a i j ) ) n   , i , j = 1 , 2 , , n
The following Formula (7) can be applied to obtain the approximate value of the largest eigenvalue λ m a x [49].
A W = λ W λ m a x = 1 n i = 1 n ( A W ) i w i
Step 8: Consistency test. The consistency index (C.I) and consistency ratio (C.R) are calculated to test the consistency of the matrix. The C.I and C.R values are calculated by the following formulas.
C . I = λ m a x n n 1
C . R = C . I R . I
Pair-wise comparisons are acceptable if C.R is less than 0.1; otherwise, they are not. R.I is the average index for weights generated at random. R.I is 0.58; 0.90; 1.12; 1.24; 1.32; 1.41 when the number of levels in the hierarchy is n = 3,..., 8 [48].
Step 9: Calculating the hypermatrix of ANP. The normalized eigenvector w i 1 ( j k ) , w i 2 ( j k ) , ,   w i n ( j k ) is calculated by the eigenvalue method, which is called the sort vector of network elements. The outcome is depicted in the matrix below:
W i j = [ w i 1 ( j 1 ) w i 1 ( j n j ) w i n i ( j 1 ) w i n i ( j n j ) ]
where the column vector of W i j refers to the ranked vector of the degree of influence of all elements in U i on the element u j k in U j . If the element u i p in U i has no effect on u j k , then w i p ( j k ) = 0 . For each U i and U j , the above steps are repeated to be able to obtain the hypermatrix under the S s criterion. There are m hypermatrix in total, and the general form is as follows.
W ( s ) = [ W 11 ( s ) W 1 n ( s ) W n 1 ( s ) W n n ( s ) ]
Step 10: Calculating the weighted hypermatrix for ANP.
B ( s ) = ( B 1 ( s ) , B 2 ( s ) , , B n ( s ) ) T = [ b 11 ( s ) b 1 n ( s ) b n 1 ( s ) b n n ( s ) ]
The weighted supermatrix is obtained by normalizing each column of W. In the weighted supermatrix, the sum of each column element is one. The following weighted hypermatrix is obtained using the normalization technique W ( s ) .
W ( B s ) = ( W i j ( B s ) ) n × n , W i j ( B s ) = b i j ( s ) × W i j ( s )
Step 11: Find the limiting hypermatrix.
W ( s ) * = lim k + W ( s ) k
If the calculation of the above limits converges and is unique, the values of the rows of the original matrix can be assumed to be the stable weights of the indicators.

4.2. Fuzzy Integrated Evaluation Based on Vague Set

In this study, vague set is used to evaluate the extent to which each type of obstacle in the obstacle system affects the commercialization of CCUS technology in China. Assuming that x is any element in space Z , then the membership degree functions t A and f A can be used to refer to a Vague set in Z . t A ( x ) is the true membership degree function, which refers to the degree of support for x . f A ( x ) is the false membership degree function, which refers to the degree of against for x . 1 t A ( x ) f A ( x ) refers to the degree of hesitation about x . In this study, we denote t A ( x ) as t x and f A ( x ) as f x . And t x [ 0 , 1 ] , 1 f x [ 0 , 1 ] , t x + f x 1 . If t x = 1 f x , then the Vague set will become a fuzzy set; if t x = 1 f x = 0 or t x = 1 f x = 1 , then the Vague set will degenerate to an ordinary set. The steps are as follows.
Step 1: Set a collection of evaluation levels. The influence degree between pairs is divided into seven levels, where the set of reviews V = ( V E L , V V L , V L , V M , V H , V V H , V E H ) = (extremely low, very low, low, medium, high, very high, extremely high).
Step 2: Constructing the Vague set evaluation matrix. More than five experts were asked to evaluate the indicators. U i represent any of indicators, and the commentary set is V j = ( 1 , 2 , 3 , 4 , 5 , 6 , 7 ) . The Vague set evaluation matrix R can be constructed as follow.
R = [ r 11 r 12 r 17 r 21 r 22 r 27 r n 1 r n 2 r n 7 ]
r i j refers to the Vague value reviews corresponding to the indicator U i and the reviews level V j , which r i j = [ t A , 1 f A ] . Experts are invited to provide their evaluation results for each indicator based on the set of reviews, with the option to abstain from voting to show their level of hesitancy. For example, the indicator of high energy consumption was evaluated by 20 specialists, with one choosing very low, two choosing low, one choosing medium, seven choosing high, six choosing very high, two choosing extremely high, and one abstaining from the evaluation. Then the r i j = ( r i 1 , r i 2 , r i 3 , r i 4 , r i 5 , r i 6 , r i 7 ) = ([0.00, 0.05], [0.05, 0.10], [0.10, 0.15], [0.05, 0.10], [0.35, 0.40], [0.30, 0.35], [0.10, 0.15]). The Vague value for all indicators can be calculated on this basis, and the Vague set evaluation matrix can be constructed for the entire indicator system.
Step 3: Based on the weights W and the matrix R , a comprehensive evaluation is performed. To begin with, two fundamental operational formulas for Vague set are presented: multiplication and finite operation.
Assuming that l represents a real number in the interval [0, 1], P and Q are elements in the Vague set. P = [ t P , 1 f P ] and Q = [ t Q , 1 f Q ] . Then the formulas are as follows.
l P = [ l t P , l ( 1 f P ) ]
P Q = [ min { 1 , t P + t Q } , min { 1 ,   ( 1 f P ) + ( 1 f Q ) } ]
In the formulas, ⊗ is the operation symbol of multiplication of vague set matrices, and is the finite operation symbol of the vague set. The comprehensive evaluation results based on the Vague set are denoted by F . The Vague value review corresponding to the indicator in V j is denoted by F j .
F = W R = ( F 1 , F 2 , F 3 , F 4 , F 5 )
F j = ( w 1 r 1 j ) ( w 2 r 2 j ) ( w n r n j ) , j = ( 1 , 2 , 3 , 4 , 5 )
Step 4: The maximum membership degree criterion is employed to determine the final evaluation results. In this step, the relative scoring function can be utilized as the ranking criteria for the membership degree of the vague set as the vague value is an interval number. The formula is as follow.
J ( x ) = t x t x + f x
Without taking abstentions into account, the above equation indicates that the greater the proportion of cases, in which the indicator to be evaluated belongs to a specific evaluation level ( t x ) to all cases ( t x + f x ) , the greater the probability that the object to be evaluated belongs to that evaluation level. If the abstention component is considered, the above equation represents an infinite subdivision of the abstention component in the ratio t x : f x : ( 1 t x f x ) until the influence of the uncertainty on the judgement of the membership degree of the evaluation level of the object to be evaluated is zero.

4.3. Study Framework

The study framework is shown as Figure 2. Firstly, obstacles affecting the commercialization of CCUS technology in China were selected based on a summary of the CCUS projects in China and relevant literature. These obstacles were subjected to expert discussion and filtering, and five categories were finally identified, including economic, technical, policy, market, and social obstacles. Secondly, the Vague-DANP method is used to analyze the interaction among obstacles. Finally, according to the findings of the analysis, general recommendations and policy implications for promoting CCUS technology are provided.

5. Obstacles Analysis

5.1. Results and Discussion

The DEMATEL method was used to determine the relationships between first-level indicators. In this study, the direct-relation matrix A was constructed based on expert judgement.
A = [ 0 0 2 0 3 5 0 1 2 2 4 3 0 3 2 3 2 2 0 1 1 1 0 4 0 ]
The combined impact matrix T is calculated through Equation (3).
T = [ 0.22342368 0.13048201 0.25078607 0.21343897 0.38724312 0.73545686 0.18270869 0.29204882 0.42552517 0.46546731 0.79934591 0.45646207 0.26674659 0.57107465 0.53501152 0.59202571 0.32437396 0.33604283 0.25899099 0.36279228 0.35973165 0.21701136 0.15695756 0.47227802 0.19158479 ]
The centrality (D + R) and causality (DR) of first level indicators are shown in Table 1.
Table 1 shows us the following conclusions: According to the results of the centrality (D + R) calculation, the five first-level indicators are ranked in order of importance, political ( H 3 , 3.93122260) > economic ( H 1 , 3.91535766) > market ( H 4 , 3.81553357) > technical ( H 2 , 3.41224494) > social ( H 5 , 3.33966240), with political obstacle being the most significant obstacle to the commercialization of CCUS technology in China. According to the results of the causality (DR) calculation, technical and political have a positive causality (DR), indicating that they are causative indicators. Economic, market, and social causality (DR) are all negative, indicating that they are result indicators. That is, technological and political obstacles have an impact on economic, market, and social barriers. Furthermore, causality (D
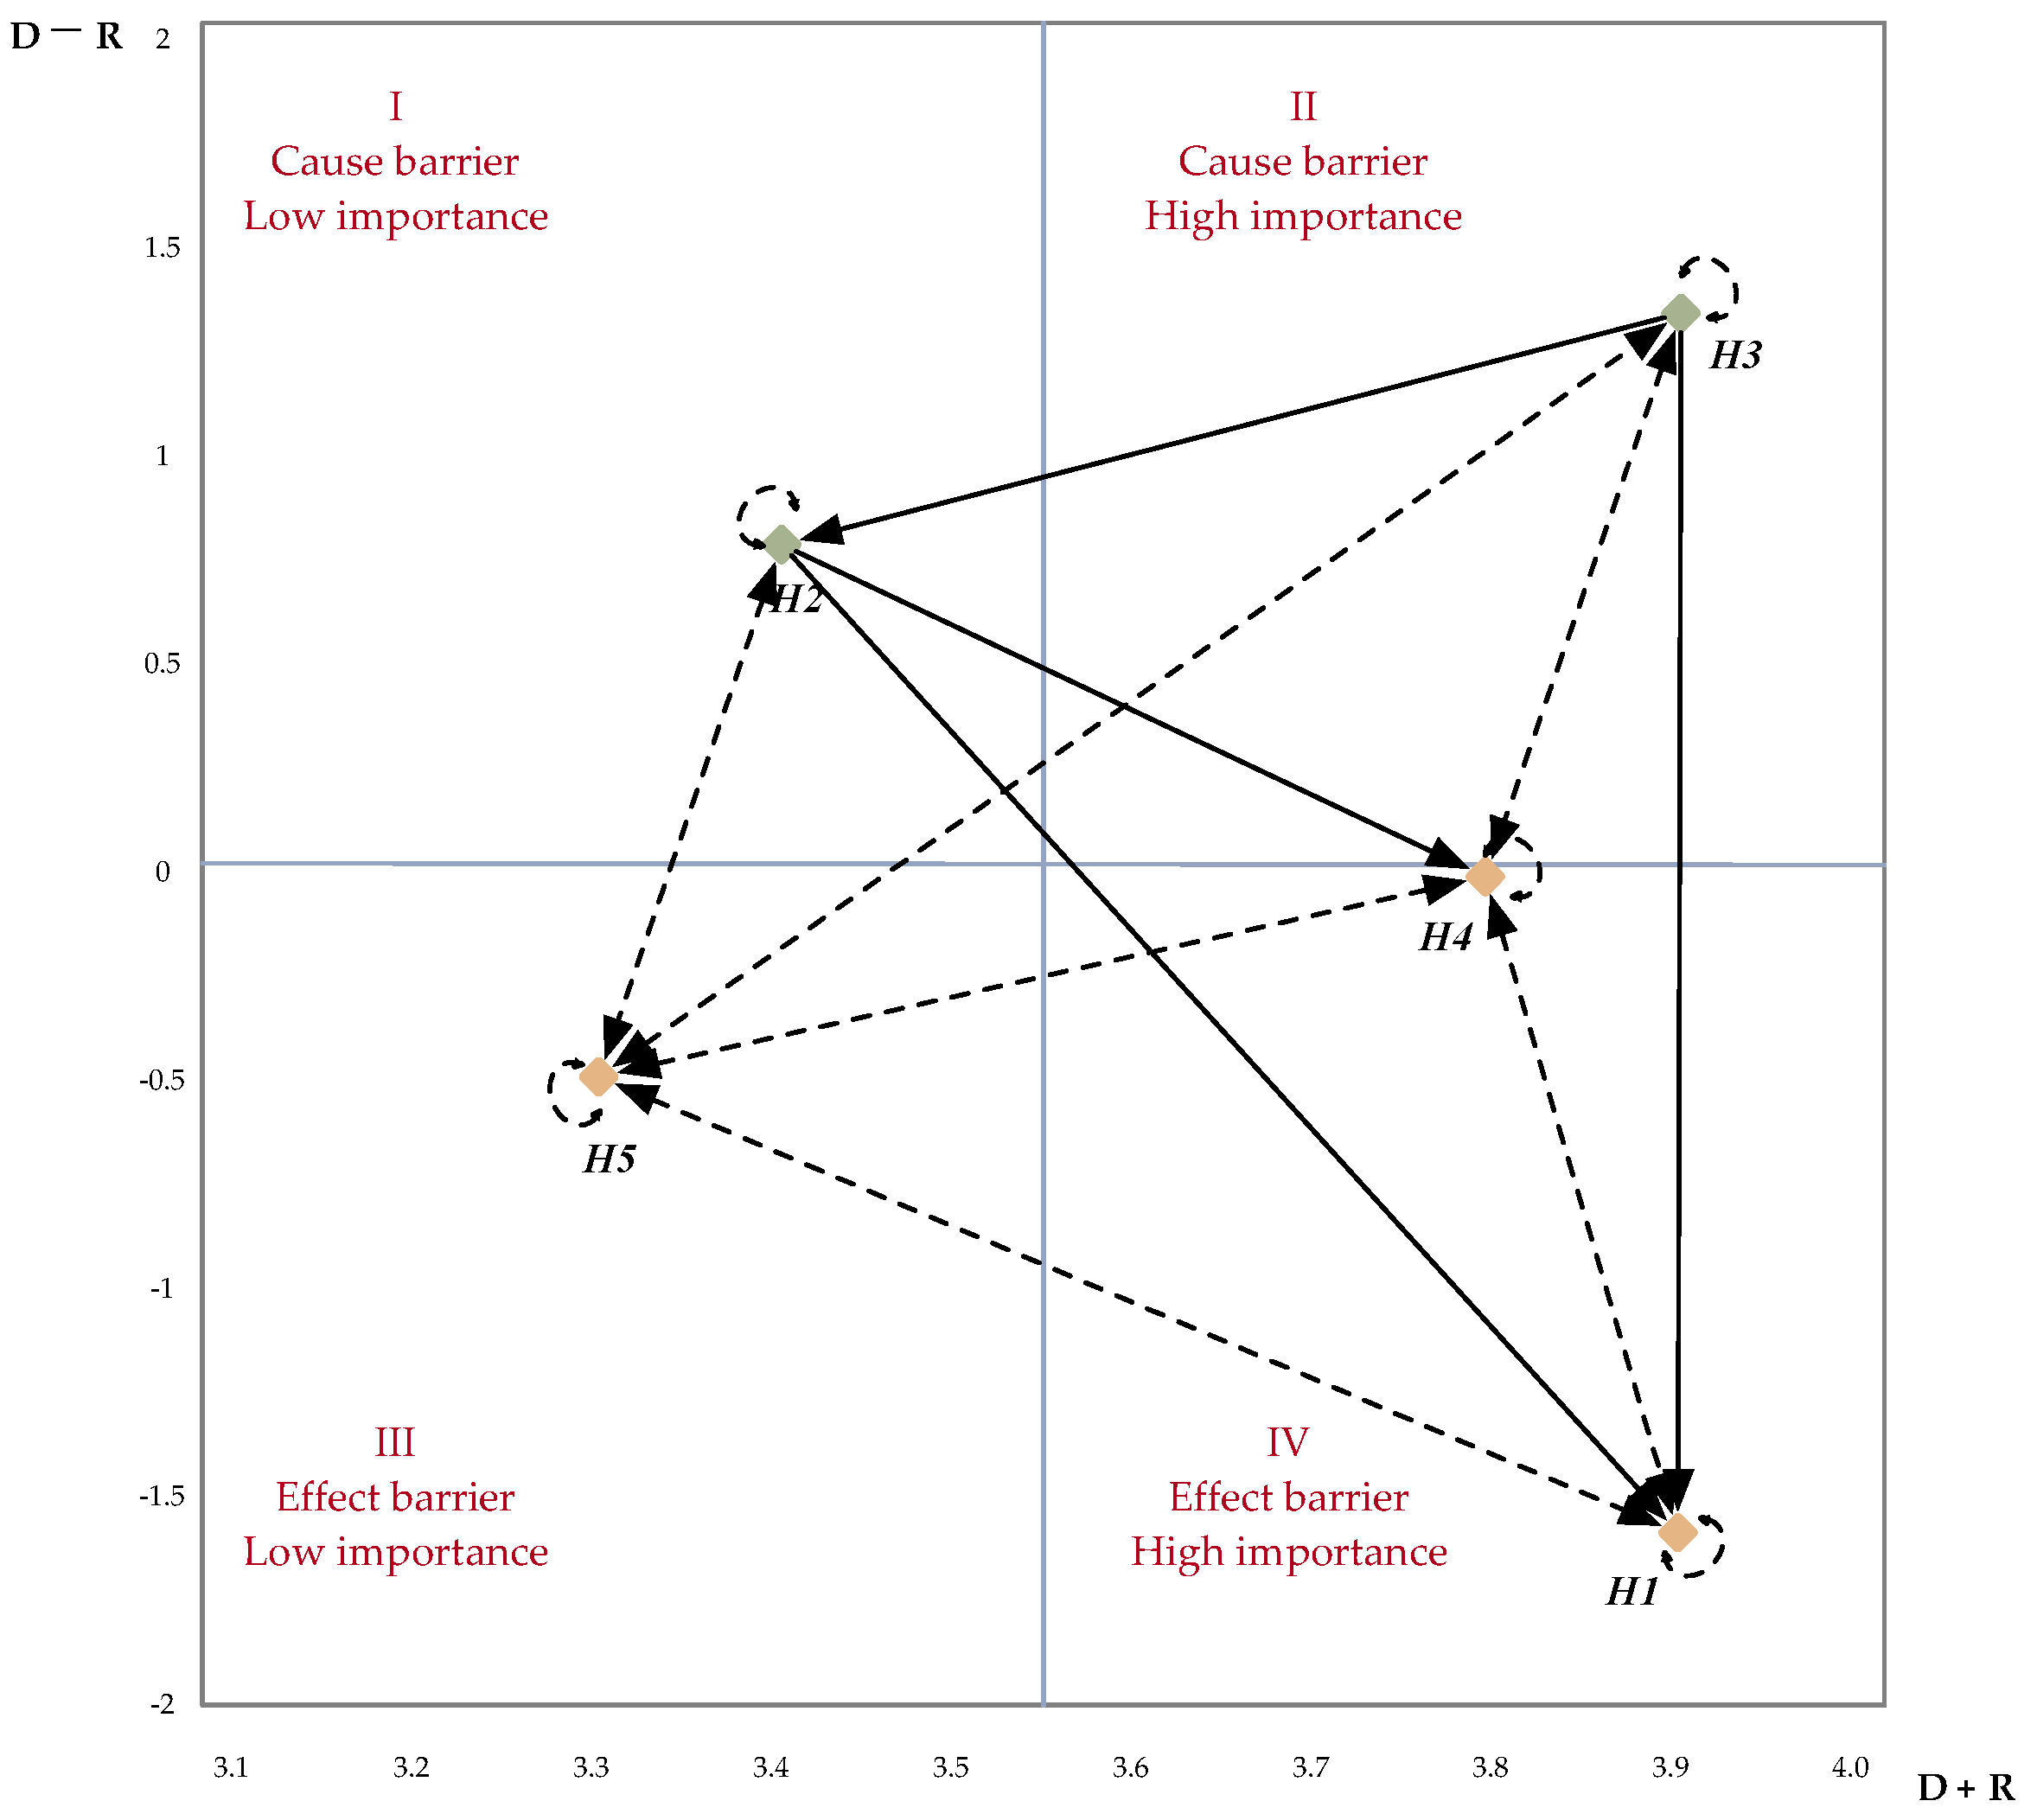
R) values show that policy is the most important causative indicator (1.32605887) and economic is the most obvious result indicator (1.32605887). The five first-level indicators interact with each other and their interactions are shown in Figure 3 below.
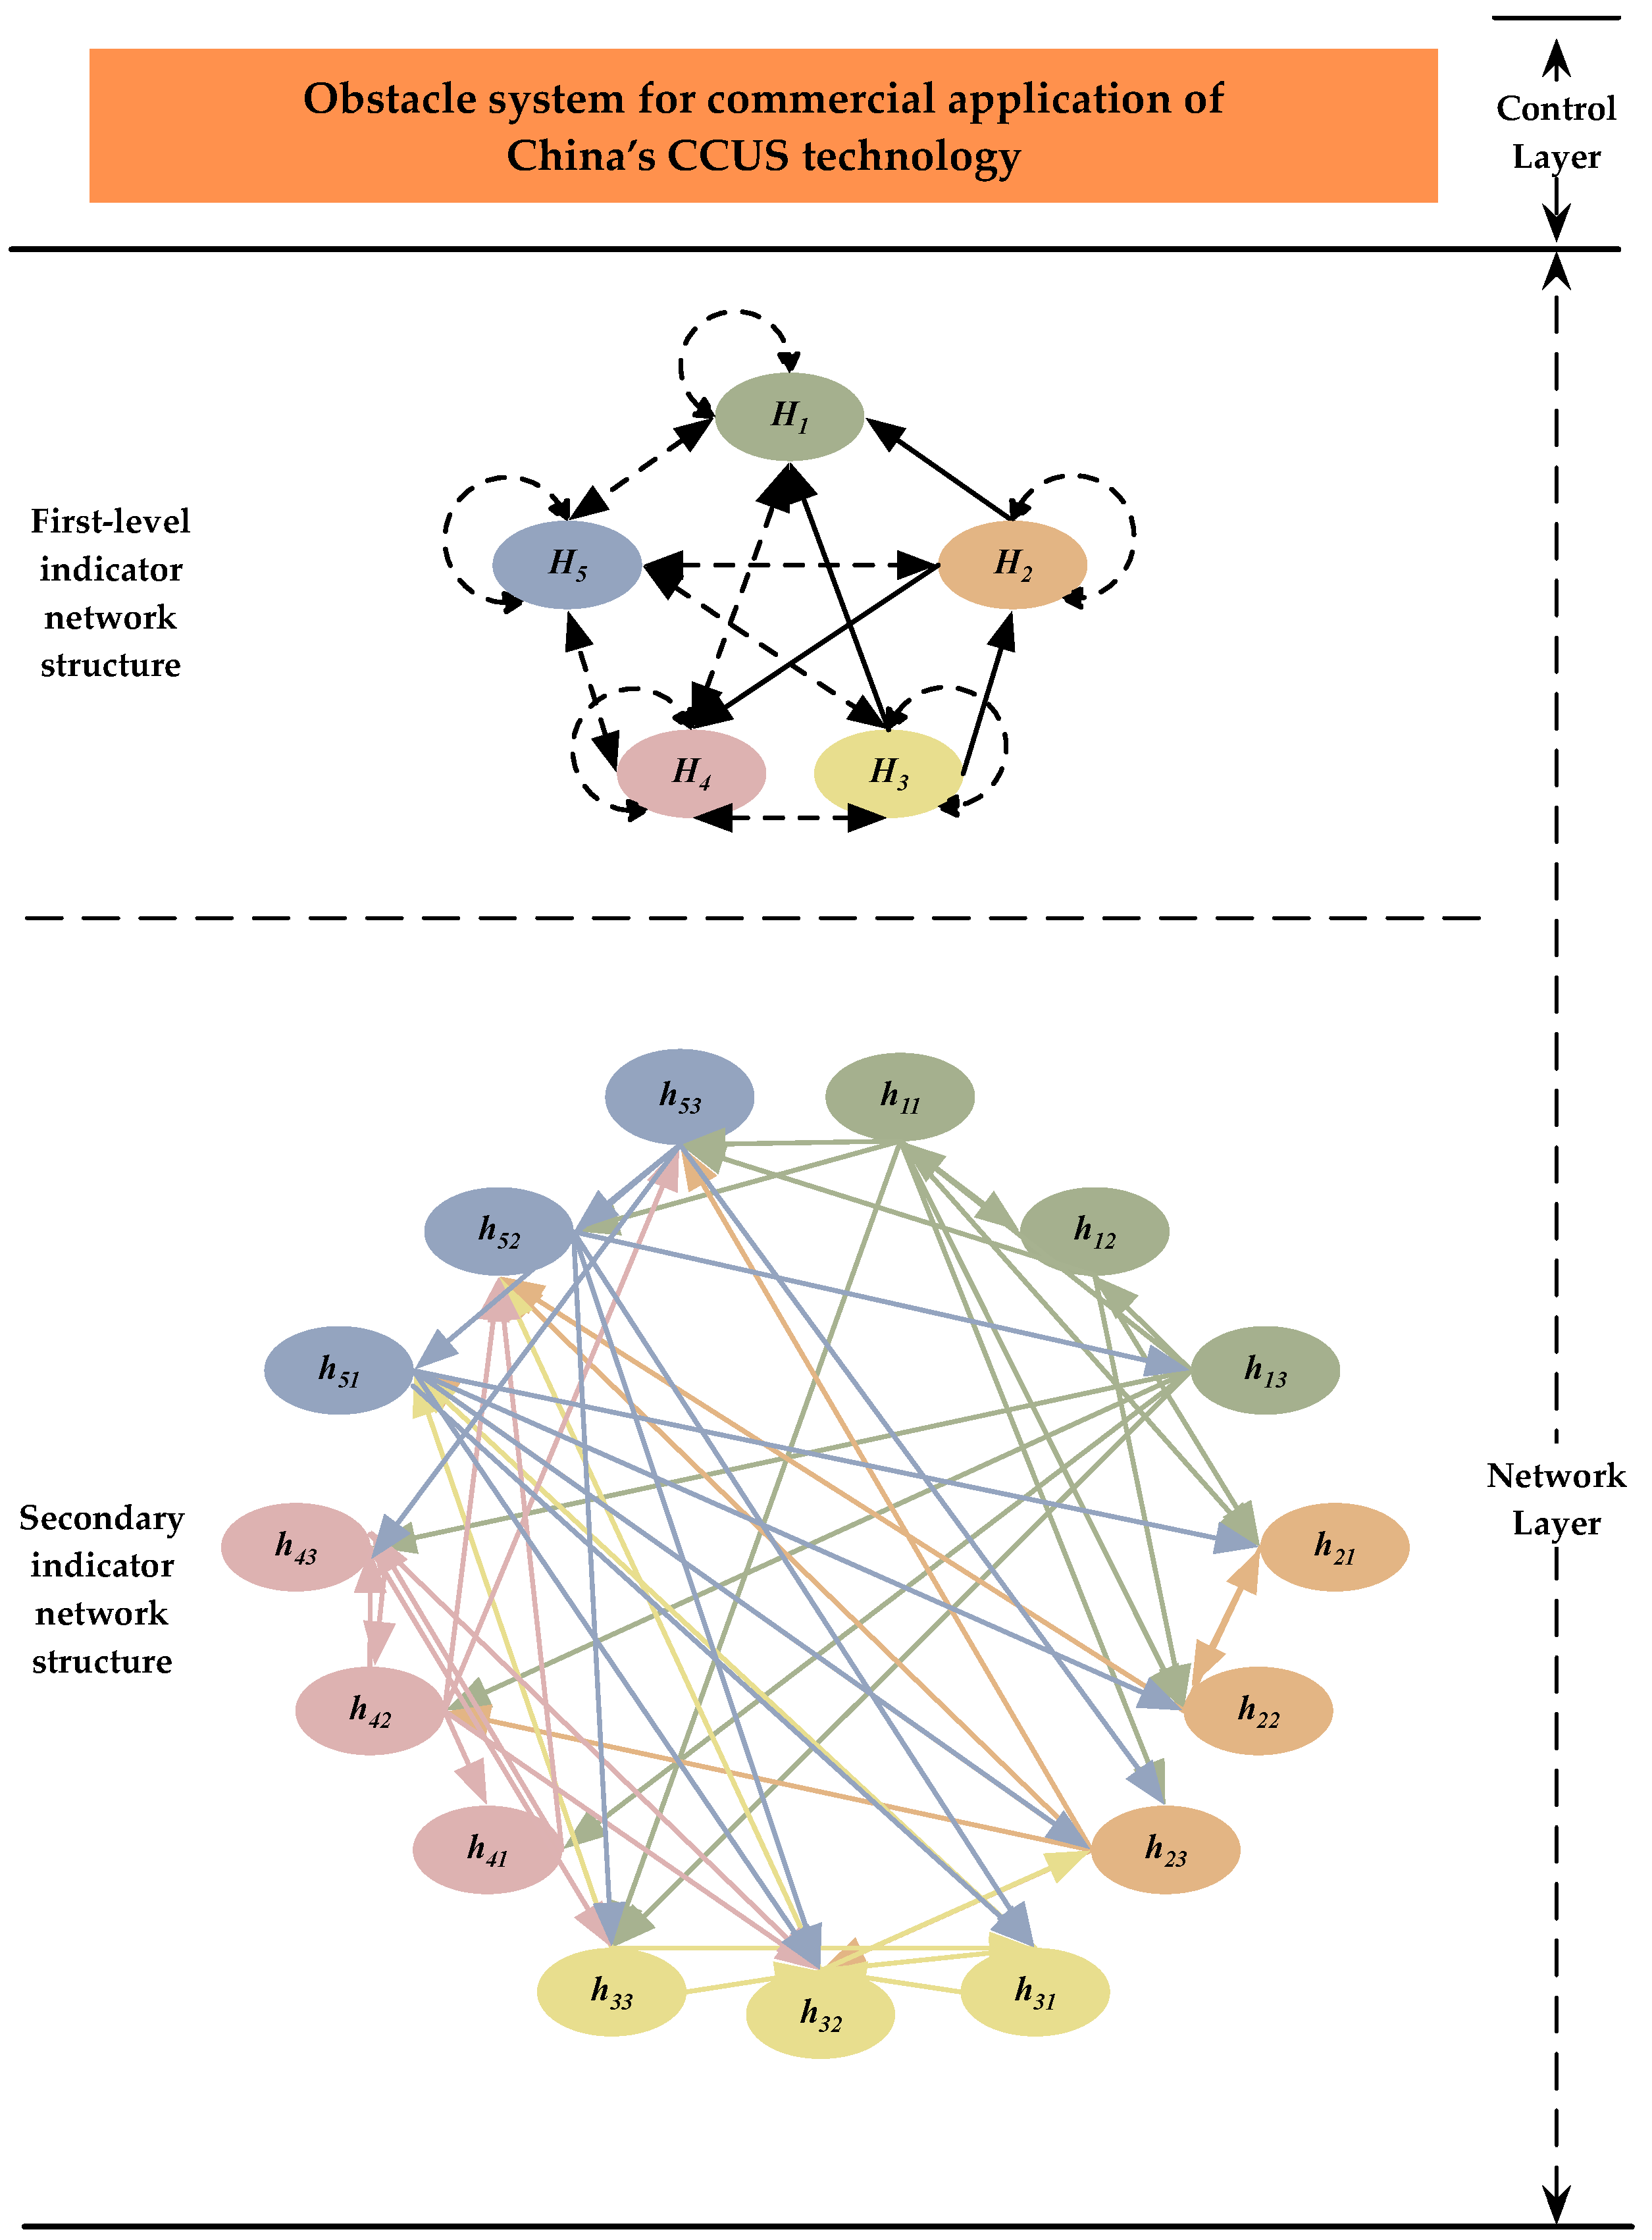
Afterwards, on the basis of the identified inter-influence relationships of the first-level indicators (Figure 3), this study analyses the second-level indicators and their interactions. The ANP network hierarchy of the obstacle system was drawn by collating the expert opinions (as shown in Figure 4 and the interaction among indicators is specified in Table 2). After that, according to the relationship between the indicators in Figure 3 and Figure 4, the weight coefficients of the second-level indicators, h i j , were calculated using Super Decision software and the results are shown in Table 3.
The degree of influence of the 15 second-level indicators on the commercialization of CCUS technology in China is ranked as follows based on the weighting calculation results: h 22 > h 21 > h 13 = h 52 > h 32 > h 23 > h 31 > h 12 > h 42 > h 51 > h 33 > h 43 > h 53 > h 11 > h 41 . There are four indicators with a weight coefficient greater than 0.1, including limited carbon dioxide conversion, high energy consumption, low rate of return on investments and low investment enthusiasm of enterprise.
To further determine the specific degree of influence of each dimension on the commercialization of CCUS technology in China, this study classifies the degree of influence into seven levels, including extremely low ( V E L ), very low ( V V L ), low ( V L ), medium ( V M ), high ( V H ), very high ( V V H ), extremely high ( V E H ). Following that, we invited relevant scholars and experts to complete a questionnaire to assess the degree of impact of each indicator. Based on the comprehensive consideration of the expert evaluation results, this paper constructed the Vague value for each indicator, and then established the Vague set evaluation matrix of the evaluation index system, as shown in Table 4.
Next, according to Equations (16)–(20), the membership degree of five categories of obstacles can be calculated and the results are shown in Table 5 and Table 6.
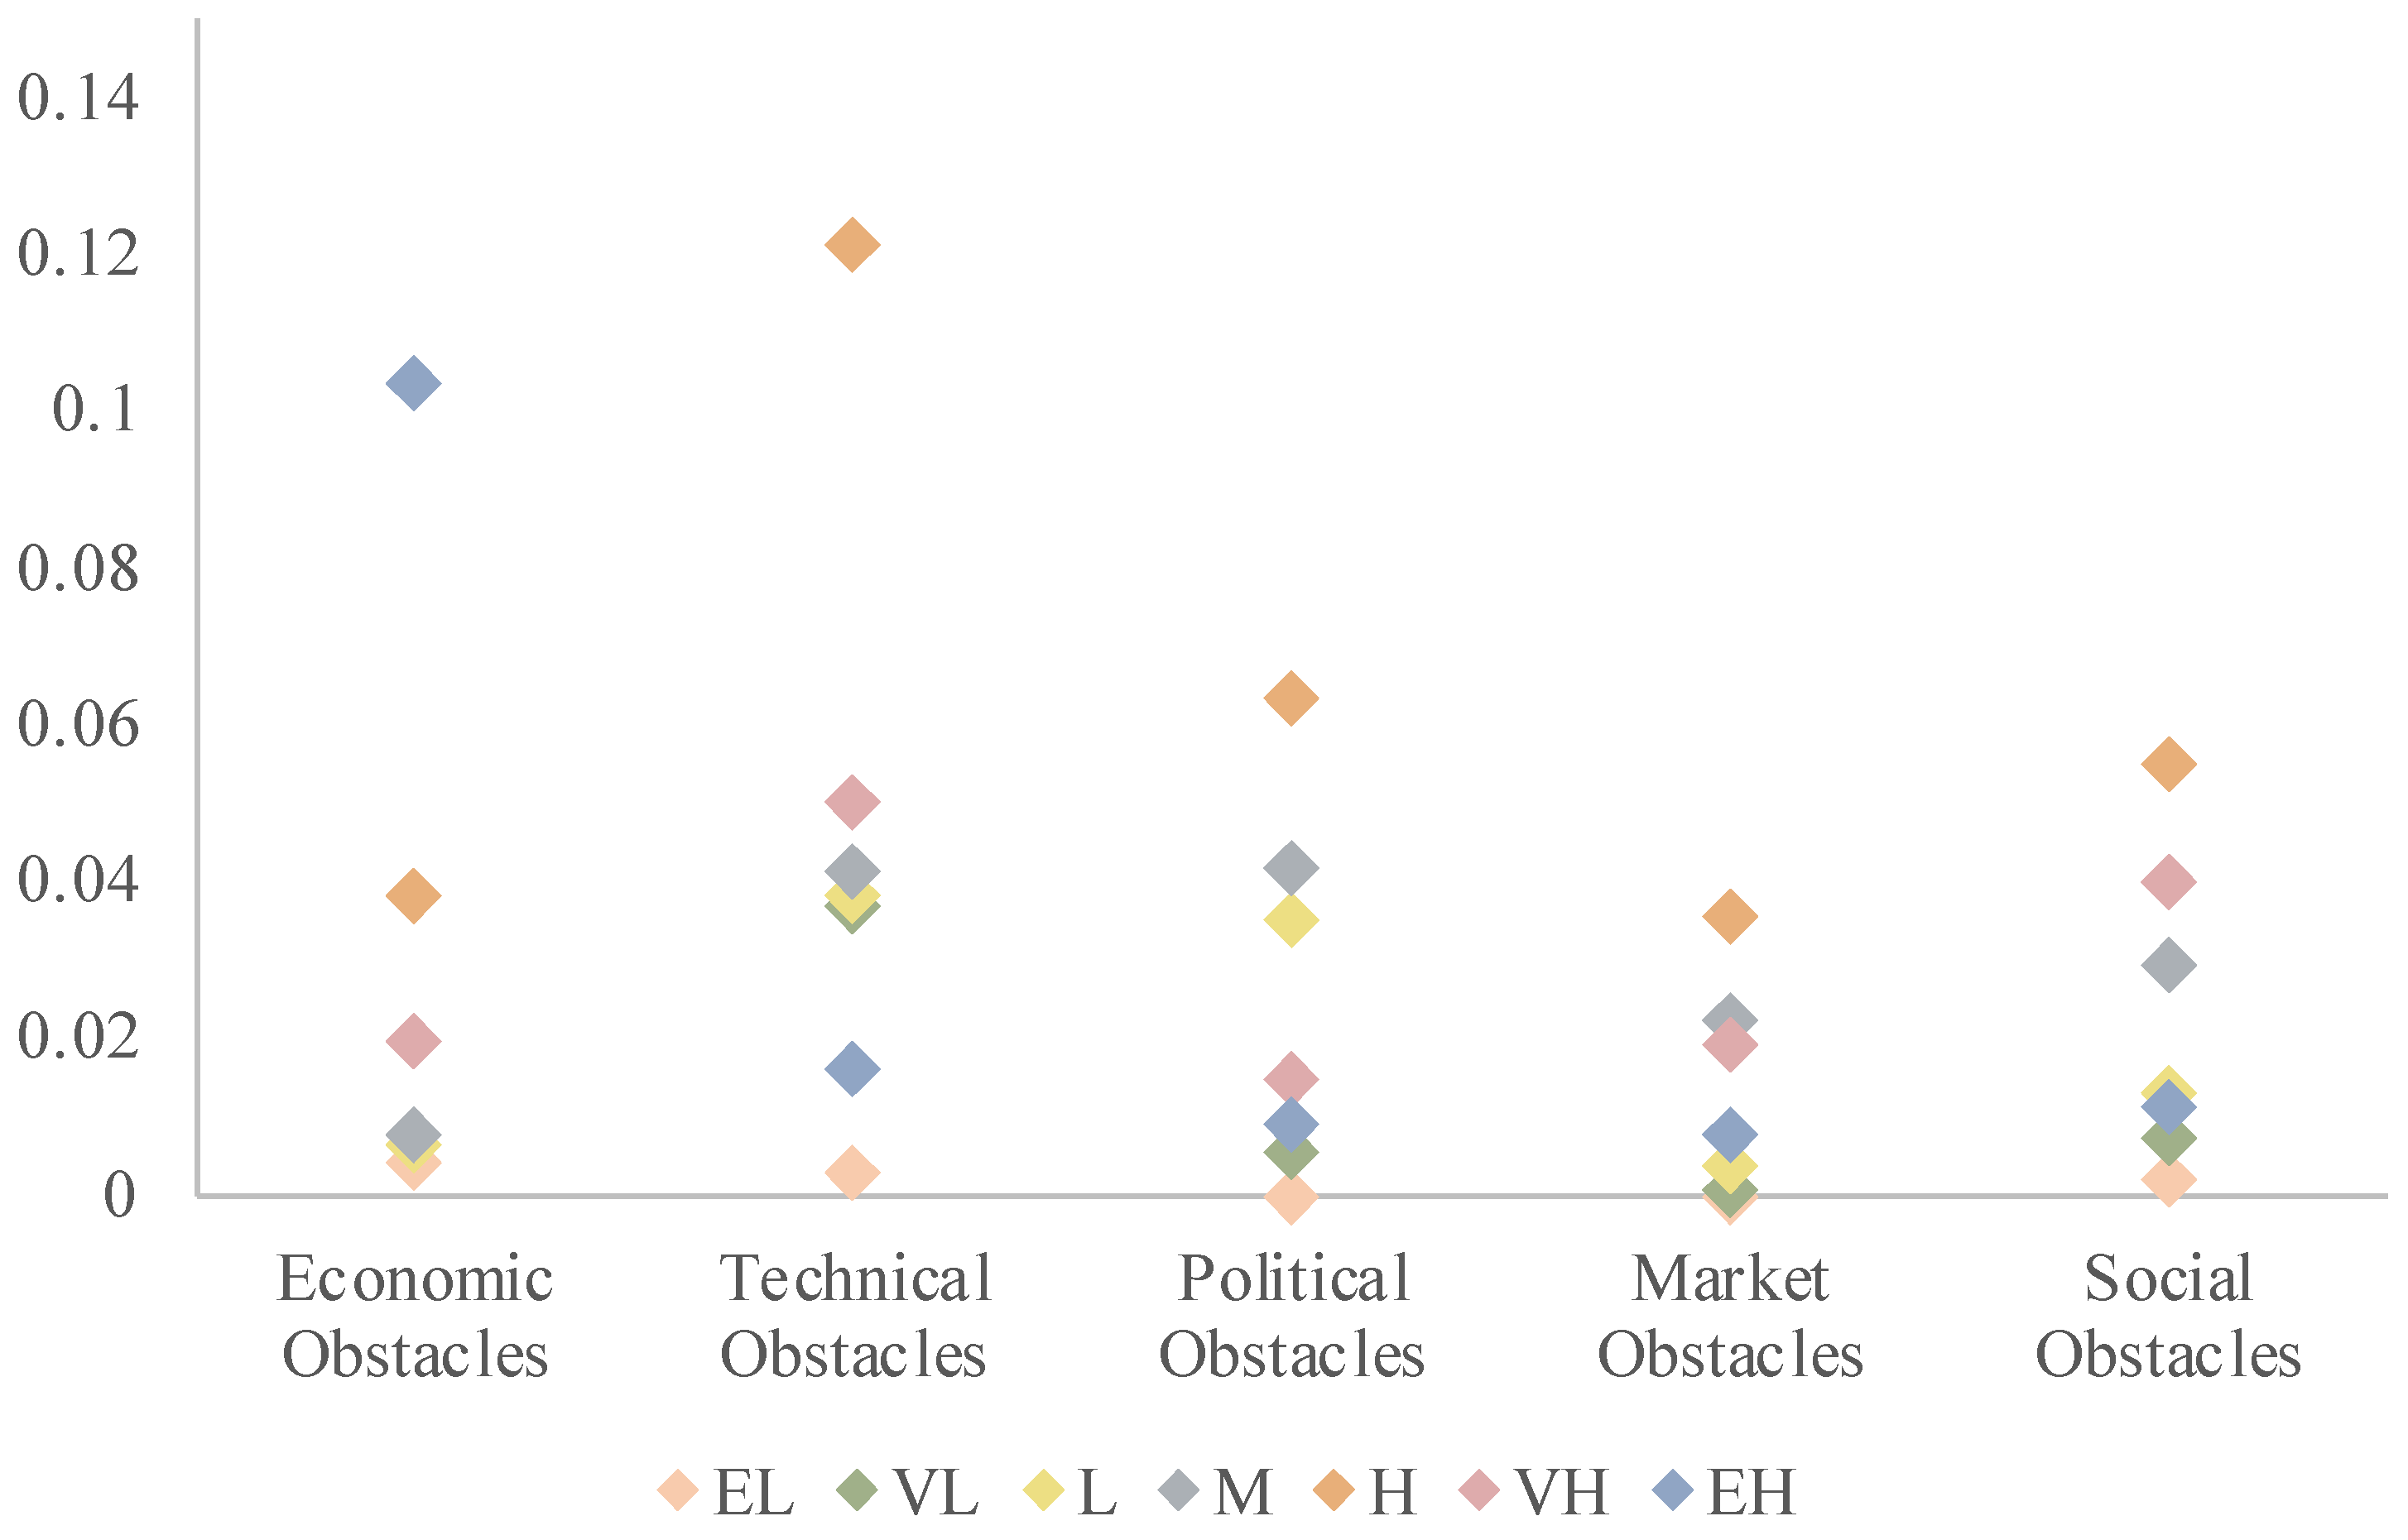
The order of the total membership degree on CCUS technology commercialization is J V H > J V E H > J V V H > J V M > J V L > J V V L > J V E L . This result indicates that China is facing massive challenges in promoting CCUS technology. Economic obstacle has an extremely high effect on the CCUS promotion process. Subsequently, we examined the distribution of membership degree and found that the difference in membership degree of economic and technical obstacles is substantial. In combination with the results of the expert evaluations, there was low hesitancy degree in the assessment of both economic and technical obstacles. That is to say, it is a consensus that economic and technological are the mainly obstacles limiting the commercialization of CCUS technology in China (as shown in Figure 5).
To sum up, according to the results, the following points can be drawn from the study.
1. Overall, economic obstacle is the mainly obstacle of CCUS technology commercialization in China, which is consistent with the findings of previous studies. However, the underlying cause that hinders the CCUS technology from being commercialized is not the economic obstacle, it is the political obstacle. According to the results, the political obstacle has the highest centrality (D + R) and causality (DR) values, which are 3.93122260 and 1.32605887, respectively, indicating that the political obstacle is the primary reason why CCUS technology cannot be commercialized in China, and as a cause indicator, it also has a significant impact on other indicators. Thus, describing the problems of commercializing CCUS technology as primarily economic (high investment costs, high O&M costs and low returns) is misleading. Hence, CCUS technology commercialization cannot be prompted just by financial support for project construction. The political obstacle has proven to be tougher than anticipated for CCUSs’ commercialization. This explains why a number of the CCUS projects failed despite adequate funding support.
2. In terms of priority, the second-level indicators are ranked as: h 22 > h 21 > h 13 = h 52 > h 32 > h 23 > h 31 > h 12 > h 42 > h 51 > h 33 > h 43 > h 53 > h 11 > h 41 . The weights of the second-level indicators show that the factors with the greatest impact on the commercialization of CCUS projects in China belong to technical rather than economic obstacles. This finding further illustrates that the economic obstacle is only the tip of the iceberg. Simultaneously, combined with the results of the DEMATEL analysis, seven critical obstacles must be highlighted: three political obstacles and four obstacles with weights greater than 0.1. They are lack of standards and regulations ( h 32 ), inadequate legal and regulatory framework ( h 31 ), insufficient incentive policies ( h 33 ), limited carbon dioxide conversion efficiency ( h 22 ), high energy consumption ( h 21 ), low rate of return on investments (   h 13 ) and low investment enthusiasm of enterprise ( h 52 ). Among them, despite the fact that the indicator weights of h 31 and h 33 are less than 0.1, they should be considered as critical obstacles since they belong to political obstacles and have a significant impact on other barriers.
3. In promoting the commercialization of CCUS technology, China is caught in a negative feedback loop, where solving the economic and technical problems does not really lead to the CCUSs’ commercial application. To break this cycle, China needs to introduce more incentives and build a sound legal and regulatory system, which will result in a shift in interests (and economics) as well as accelerated development of the technology. Unlike nuclear power, there are no significant opponents to CCUS commercialization, but neither are there many strong supporters. Instead, there are many in the midst who are hesitant. Therefore, in the absence of a rapid technological breakthrough, the commercialization of CCUS technology in China requires a strong push from the government to instill confidence in the public, investors and other stakeholders through policy incentives and to promote a positive cycle (e.g., creating an enabling policy environment for CCUS projects, accelerating investment, improving technical performance, etc.).

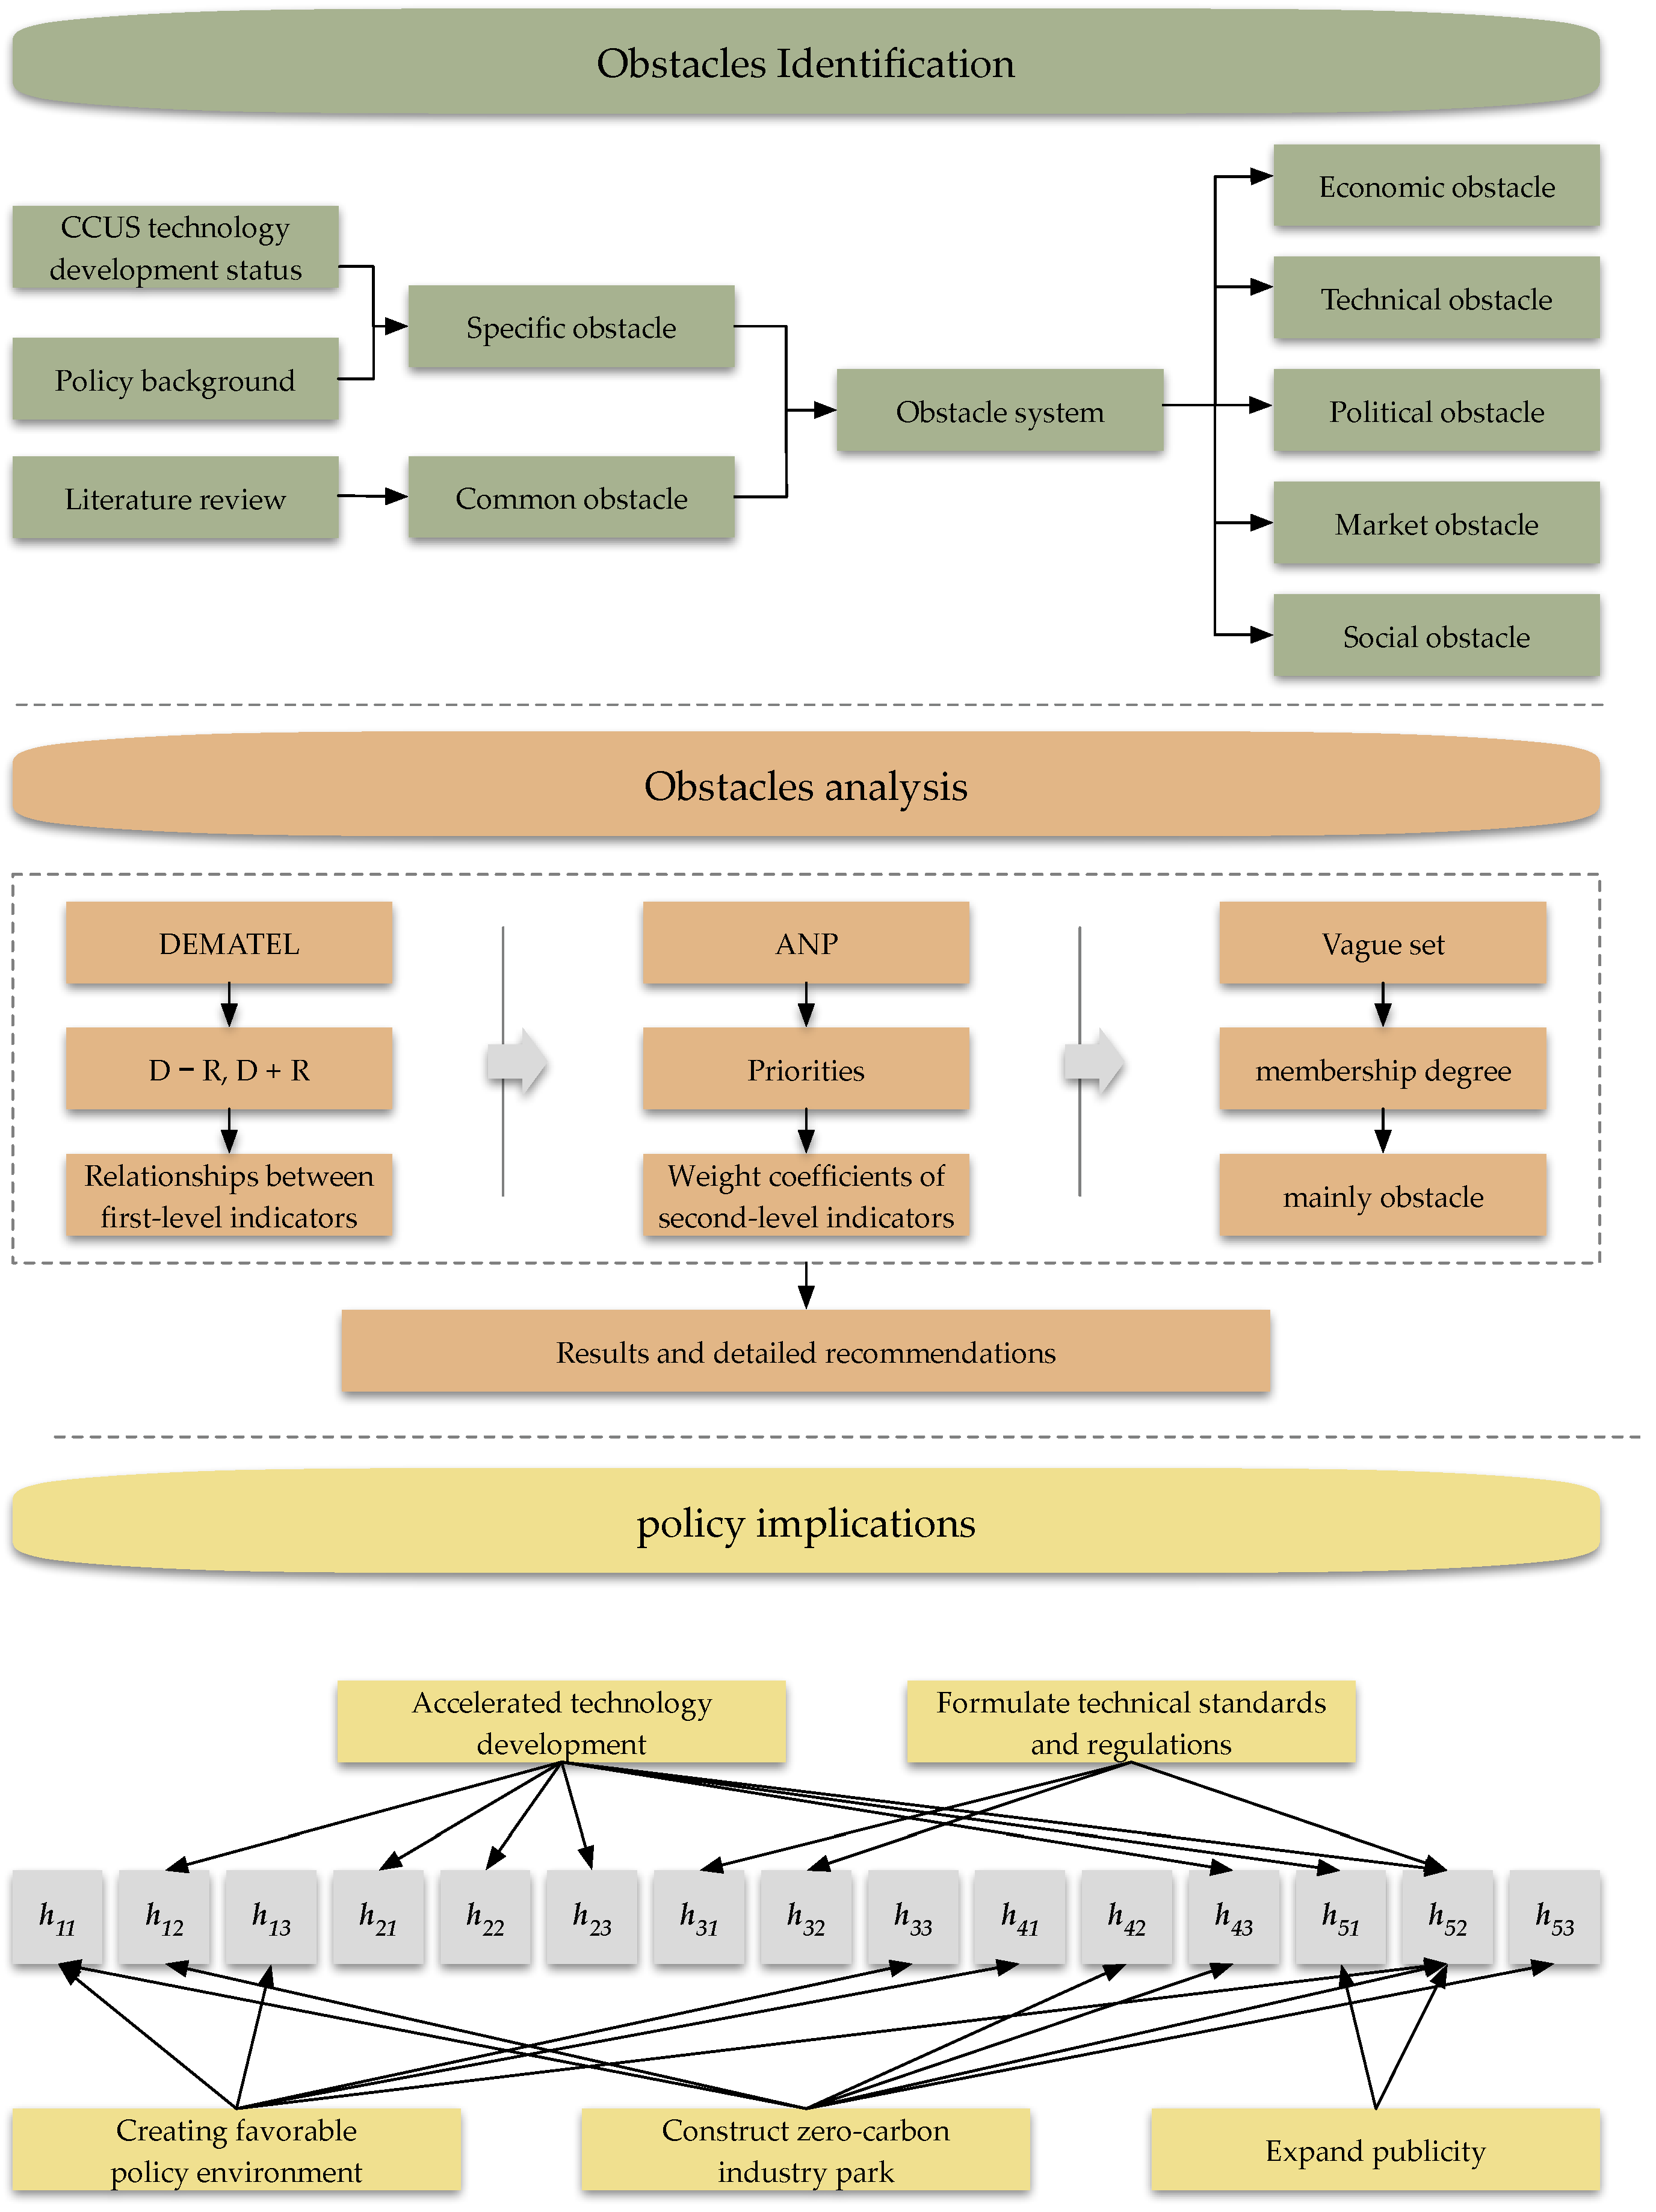
5.2. Development Proposals for CCUS Commercialization

From the above analysis, overcoming the problem of enterprise project capital investment will not allow China to break out of its negative cycle. According to expert review, political and technical obstacles, which are causal obstacles that must be overcome first, followed by economic, market, and social obstacles in order to develop the commercialization of CCUS technology in China. Detailed recommendations are as follows.
1. Political obstacle. According to the results of the calculation, the political obstacle has the highest centrality (D + R) and causality (DR) values, which are 3.93122260 and 1.32605887, respectively, indicating that the political obstacles are the most important and have the greatest influence on the other level indicators. The three second-level indicators under political obstacle are, in order of importance, the lack of standards and regulations (0.0960), inadequate legal and regulatory framework (0.0565) and insufficient incentive policies (0.0364). As a result, removing the political obstacle requires, first, the development of a set of standards applicable to CCUS technology and carbon accounting to serve as a regulatory foundation, second, the enhancement of the existing legal and regulatory system, and third, the promotion of CCUS technology commercialization through incentives.
2. Technical obstacle. The centrality (D + R) and causality (DR) values for technical obstacle were 3.41224494 and 0.79016880, respectively, where the three second-level indicators were in order of importance: limited carbon dioxide conversion efficiency (0.1551), high energy consumption (0.1241) and insufficient geological information (0.0595). Despite the low importance, technical obstacles should be addressed as they influences other indicators as a causative indicator and have a high secondary indicator weighting. Based on the results, two types of technology are in desperate need of a breakthrough. One is carbon capture technology. In the carbon capture stage, reducing energy consumption and improving conversion efficiency through technological breakthroughs is the key to reducing the O&M costs of carbon capture equipment. Another is geological exploration and assessment. Through technological enhancement, more detailed geological information will be available, providing a valid basis for determining the safety of sequestered CO2.
3. Economic obstacle. The centrality (D + R) and causality (DR) values for technical obstacle were 3.91535766 and −1.50460996, respectively, where the three second-level indicators were in order of importance: low rate of return on investments (0.1100), high operation and maintenance cost (0.0507) and high investment cost (0.0330). Although economic obstacles are influenced by other types of barriers and cannot be completely eliminated, the rate of return of CCUS projects can be increased by designing CCUS business models (including investment and financing models and benefit sharing mechanisms, for example, Public–Private Partnership (PPP) model), which will support in the commercialization of CCUS.
4. Market obstacle. Market obstacle has a centrality (D + R) score of 3.81553357, second only to economic obstacle, and the causality (DR) value is of close to zero at −0.06708203, indicating that market obstacle is important and less influenced by other factors. The three second-level indicators were in order of importance: poor connection of the industrial chain (0.0466), low carbon dioxide demand (0.0338) and inadequate market pulling power (0.0151). Therefore, to remove market obstacle, the first step is to strengthen the link between upstream and downstream enterprises in the industry chain, and resolving this issue would also promote a CO2 supply–demand balance.
5. Social obstacle. In terms of the centrality (D + R) and causality (DR) value for social obstacle, it is not a significant barrier factor. However, it is worth noting that the weight of low investment enthusiasm of enterprise exceeds 0.1 for the three second-level indicators, which is the same as the low rate of return on investments in economic difficulty and significantly higher than the other two secondary indicators (lack of public support 0.0397 and inadequate infrastructure 0.0335). As a result, while the social obstacle is not the most important, the increased willingness of companies to invest requires special attention.

6. Conclusions and Policy Implications

Since China’s coal-based energy supply cannot be modified in the short-term, promoting CCUS technology in the energy sector is an unavoidable decision for China in order to achieve the 2060 carbon neutrality target. This study analyses the obstacle system of CCUSs’ commercialization in China. Firstly, the obstacles were divided into five categories and the second-level indicators under each category were filtered out with expert opinion, identifying a total of 15 indicators. Secondly, the DANP method was used to analyze the interrelationship between the five categories of obstacles and to calculate the weights of the second-level indicators. According to the results of DEMATEL, the five obstacles are ranked in order of importance, political ( H 3 , 3.93122260) > economic ( H 1 , 3.91535766) > market ( H 4 , 3.81553357)> technical ( H 2 , 3.41224494) > social ( H 5 , 3.33966240), where economic, market and social are outcome indicators and are influenced by technical and political obstacles. The political obstacle is the most important cause indicator and the economic obstacle is the most obvious outcome indicator. In terms of priority, the second-level indicators are ranked as: h 22 > h 21 > h 13 = h 52 > h 32 > h 23 > h 31 > h 12 > h 42 > h 51 > h 33 > h 43 > h 53 > h 11 > h 41 . Finally, the Vague set was used to assess the difficulty of commercializing CCUS technology in China.
Furthermore, according to the analysis of the DEMATEL and ANP, seven critical obstacles were identified. They are the following: h 32 , h 31 , h 33 , h 22 ,   h 21 ,     h 13 and h 52 . Some of these barriers are very important in themselves, while some have a strong influence on others, and others are a combination of the two. As a result, strategies must be designed to specifically address these obstacles.
This section makes macro-level recommendations based on the above results for the commercial roll-out of CCUS commercialization in China, with each recommendation addressing the critical barriers described above (Figure 2 shows the relationship between the recommendations and the barriers). Specific and detailed policy implications are as follows, which are ranked by importance. The higher the ranking, the more important the policy.
1. Formulate technical standards and regulations. The improvement of technical specifications and regulations can provide a basis for assessing the carbon reduction effect of enterprises and provide guidance for technology development. However, China currently lacks CCUS technical specifications as well as a comprehensive system of regulations, which makes commercialization tough. Therefore, an industry development expert committee should be established with the participation of government departments, energy industry companies, CCUS technology research institutes, and industry experts. This committee can help develop technical specifications for the entire process from carbon capture to carbon accounting, including carbon emission reduction accounting standards, characterization and key performance parameters of carbon dioxide absorption solutions, and provide a reference for enterprises and academic research institutions conducting research and development in the production of carbon capture and absorption materials.
2. Creating a favorable policy environment to enhance the rate of return on investments of CCUS technology adoption by enterprises and make more enterprises willing to adopt CCUS technology. This includes incentive and regulatory policies. (1) Incentive policies are designed to increase the willingness of companies to participate and can be divided into two categories: short-term and long-term. In the short term, direct financial subsidies, such as tariff subsidies for power, or giving them a corresponding tax credit based on the reduction in carbon emissions, or setting a decarburization tariff along with a guaranteed minimum number of acquisition hours to protect the profitability of corporate CCUS projects can be utilized to relieve financial pressure of enterprises. In the long run, a platform to connect financial institutions and enterprises should be established, and financial institutions should be encouraged and guided to boost their support for CCUS technology. In addition, financial pressure should be eased and competitiveness improved by supporting the listing of relevant enterprises. (2) The purpose of regulatory policy is promoting openness and fairness in the market. With China’s current carbon price floating around 9 USD per ton, a company with 10 million tons of annual carbon emissions that can reduce emissions by 10–30% by manipulating the figures could save 7.8–23.5 USD million in the year. This is a huge temptation. Hence, establishing a regulatory system for carbon emitters could clarify the legal responsibilities and punishment for illegal acts to safeguard market order and protect the rights and interests of companies using carbon capture technologies, which can prevent enterprises from voting with their feet.
3. Accelerate technology development to reduce energy consumption of CCUS technology and improve carbon dioxide conversion efficiency, thus reducing operation and maintenance costs. A multi-level, diverse, industry–academia–research collaborative innovation CCUS industrial system should be established with the participation of enterprises and research institutions. “Bottleneck” technologies and breakthroughs in core technologies in crucial fields, including two directions, should be given special attention. (1) A breakthrough in carbon capture technology. In particular, the post-combustion chemical absorption technology, which currently has the greatest potential for CO2 capture, is already commercially available in other countries, but China is still in the industrial demonstration stage. (2) A breakthrough in carbon utilization technology. The expansion of carbon utilization technologies can increase CO2 consumption and promote the development of a large-scale CO2 demand market. However, as CO2 is chemically inert and thermally stable, it requires more energy to convert and consume it effectively, limiting CO2 resource consumption and demanding the search for a suitable catalyst system.
4. Establish a zero-carbon industrial park to reduce costs for companies, enabling collaborative development in carbon capture between upstream and downstream companies. A zero-carbon industrial park is an industrial park that uses a variety of emission reduction measures to achieve near zero emissions within the industrial park. Within the park, companies are able to share infrastructure and information resources, thus reducing operational and communication costs. There are two ways to build a zero-carbon industrial park: one is to renovate existing industrial parks by introducing CCUS technology (e.g., adding CCUS equipment to the existing CCHP system [50]); the other is to establish a near-zero carbon emission industrial park consisting of enterprises upstream and downstream of the CCUS industry chain. The advantage of this is that the problem of matching supply and demand upstream and downstream of the CO2 industry chain can be solved.
5. Increase public and business confidence in CCUS technology through expanding publicity. The development of the carbon capture industry can be promoted through thematic forums, seminars, and exhibitions on CCUS technology. Carbon capture publicity activities, such as CCUS knowledge popularization and application guidance, could also boost social acceptance and enhance public confidence in the technology. Simultaneously, it is critical to develop a multi-level education system that considers the receptivity of each age group (preschoolers, primary and secondary school children, students, and adults) to knowledge and awareness-raising activities [51].
The implication of this study is to analyze the obstacle system of CCUS commercialization in China by using the fuzzy integrated evaluation method, and to identify the interrelationships between the obstacles and the underlying reasons for the difficulties in commercializing the CCUS projects. According to the results of the study, specific recommendations are given to governments, relevant managers and researchers for the CCUS technology commercialization based on the importance of each type of obstacle. Further studies could set up scientific models to give more detailed solutions, including but not limited to: (1) Increased efficiency in the carbon capture industry chain; (2) Zero carbon industry park operational optimization methodology; (3) CCUS project subsidy strategy and methodology.

Author Contributions

Data curation, C.L.; Methodology, Y.S.; Software, C.L.; Supervision, Y.L.; Writing—original draft, Y.S. and F.Z.; Writing—review & editing, F.Z. All authors have read and agreed to the published version of the manuscript.

Funding

This research was funded by Beijing Municipal Natural Science Foundation, grant number 9224037.The APC was funded by Beijing Municipal Natural Science Foundation.

Institutional Review Board Statement

Not applicable.

Informed Consent Statement

Not applicable.

Data Availability Statement

Not applicable.

Conflicts of Interest

The authors declare no conflict of interest. The funders had no role in the design of the study; in the collection, analyses, or interpretation of data; in the writing of the manuscript, or in the decision to publish the results.

Appendix A

Initial obstacle set based on literature review and expert consultation.
Possible ObstaclesStageBrief Introduction
Technical challengesRSince the cost of CCUS technology is relatively costly, tremendous efforts and creativity need be expended in order to iterate and improve CCUS technology
Limited carbon dioxide conversion efficiencyRLimited conversion efficiency is a reason for the higher cost per unit of CO2 capture
Insufficient geological informationRCO2 sequestration is hampered by a lack of geographic information
Limited carbon dioxide utilization pathwayRThe captured CO2 cannot be consumed timely due to the limited utilization way
High energy consumptionRHigh energy consumption increases the O&M costs of CCUS project
High investment costANot every company has the financial resources to invest in a CCUS project, and the high cost of entry is one of the most significant barriers for most
High risk of failureAHigh risk of project failure reduces companies’ willingness to build CCUS projects
Long payback periodAThe long payback period of CCUS projects implies that companies will not be able to profit immediately after installing the capture device
Unstable project revenueIUnstable project revenue increase risk of failure and reduce the willingness of enterprises to invest
Lack of standards and regulationsILack of carbon regulations and standards confuse the market and will lead enterprises voting with their feet
High operation and maintenance costIHigh O&M costs mean that companies must continue to invest money sustained, increasing the pressure on their operations
Insufficient incentive policiesIInsufficient incentive policies strength leads to lack of incentive for enterprises to invest.
Low emission allowances priceIEnterprises have little motivation to trade emission allowances as the price is much lower than the cost of carbon capture.
High capture costsIHigh capture costs make it difficult for businesses to make a profit by capture carbon dioxide
Low carbon dioxide demandILow carbon dioxide demand cause insufficient market pull
Weak connection between upstream and downstream of the industrial chainIDue to the weak connection between upstream and downstream of the industrial chain, there is a serious problem with matching CO2 sources and sinks.
Public acceptance of new technologiesIPublic acceptance affects the development of technology. Technologies with high public acceptance are more likely to achieve rapid development
Inadequate infrastructureIInadequate infrastructure (e.g., CO2 transport pipelines) increases the cost of investment in CCUS projects
Low investment enthusiasm of companyIEnterprises’ reluctance to invest in technology development and projects stems from their lack of willingness to undertake project construction
                 Notes: R represents research stage, A represents assessment stage, and I represents implementation stage.

Appendix B

Research FieldProfessionalWorking Years
Expert AFossil energy clean utilizationSenior engineer15 years
Expert BCarbon capture and storageTechnical specialist11 years
Expert CCarbon dioxide utilizationTechnical specialist8 years
Expert D
-
Energy and climate policy
-
Modelling and analysis of energy systems
Professor31 years
Expert E
-
Innovative and high efficiency fossil fired power generation systems
-
Renewable energy systems (thermal and concentrated solar power)
Professor27 years
Expert F
-
Carbon capture and storage
-
Renewable energy system
Professor25 years

References

  1. IEA. Energy Technology Perspectives 2017; IEA: Paris, France, 2017. [Google Scholar]
  2. Cai, B.; Li, Q.; Zhang, X. China Carbon Dioxide Capture Utilisation and Sequestration (CCUS) Report 2021; Chinese Academy of Evironmental Planning: Beijing, China, 2021. [Google Scholar]
  3. Wei, Y.-M.; Kang, J.-N.; Liu, L.-C.; Li, Q.; Wang, P.-T.; Hou, J.-J.; Liang, Q.-M.; Liao, H.; Huang, S.-F.; Yu, B. A Proposed Global Layout of Carbon Capture and Storage in Line with a 2 °C Climate Target. Nat. Clim. Chang. 2021, 11, 112–118. [Google Scholar] [CrossRef]
  4. Masson-Delmotte, V.; Zhai, P.; Pörtner, H.-O.; Roberts, D.; Skea, J.; Shukla, P.R.; Pirani, A.; Moufouma-Okia, W.; Péan, C.; Pidcock, R.; et al. 2018: Global Warming of 1.5°C. An IPCC Special Report on the Impacts of Global Warming of 1.5 °C above Pre-Industrial Levels and Related Global Greenhouse Gas Emission Pathways, in the Context of Strengthening the Global Response to the Threat of Climate Change, Sustainable Development, and Efforts to Eradicate Poverty; IPCC: Geneva, Switzerland, 2018. [Google Scholar]
  5. IPCC. Fifth Assessment Report; IPCC: Geneva, Switzerland, 2014. [Google Scholar]
  6. Cai, B.; Li, Q. China Carbon Dioxide Capture Utilisation and Sequestration (CCUS) Report 2019; Chinese Academy of Evironmental Planning: Beijing, China, 2019. [Google Scholar]
  7. Kang, J.-N.; Wei, Y.-M.; Liu, L.; Wang, J.-W. Observing Technology Reserves of Carbon Capture and Storage via Patent Data: Paving the Way for Carbon Neutral. Technol. Forecast. Soc. Change 2021, 171, 120933. [Google Scholar] [CrossRef]
  8. Sun, L.; Dou, H.; Li, Z.; Hu, Y.; Hao, X. Assessment of CO2 Storage Potential and Carbon Capture, Utilization and Storage Prospect in China. J. Energy Inst. 2018, 91, 970–977. [Google Scholar] [CrossRef]
  9. Wang, N.; Akimoto, K.; Nemet, G.F. What Went Wrong? Learning from Three Decades of Carbon Capture, Utilization and Sequestration (CCUS) Pilot and Demonstration Projects. Energy Policy 2021, 158, 112546. [Google Scholar] [CrossRef]
  10. Herzog, H. Lessons Learned from CCS Demonstration and Large Pilot Projects; MIT Press: Cambridge, MA, USA, 2016; 46p. [Google Scholar]
  11. Hasan, M.M.F.; Boukouvala, F.; First, E.L.; Floudas, C.A. Nationwide, Regional, and Statewide CO2 Capture, Utilization, and Sequestration Supply Chain Network Optimization. Ind. Eng. Chem. Res. 2014, 53, 7489–7506. [Google Scholar] [CrossRef]
  12. Roussanaly, S.; Berghout, N.; Fout, T.; Garcia, M.; Gardarsdottir, S.; Nazir, S.M.; Ramirez, A.; Rubin, E.S. Towards Improved Cost Evaluation of Carbon Capture and Storage from Industry. Int. J. Greenh. Gas Control 2021, 106, 103263. [Google Scholar] [CrossRef]
  13. Bui, M.; Adjiman, C.S.; Bardow, A.; Anthony, E.J.; Boston, A.; Brown, S.; Fennell, P.S.; Fuss, S.; Galindo, A.; Hackett, L.A.; et al. Carbon Capture and Storage (CCS): The Way Forward. Energy Environ. Sci. 2018, 11, 1062–1176. [Google Scholar] [CrossRef] [Green Version]
  14. Yang, B.; Wei, Y.-M.; Hou, Y.; Li, H.; Wang, P. Life Cycle Environmental Impact Assessment of Fuel Mix-Based Biomass Co-Firing Plants with CO2 Capture and Storage. Appl. Energy 2019, 252, 113483. [Google Scholar] [CrossRef]
  15. Kang, J.-N.; Wei, Y.-M.; Liu, L.; Yu, B.-Y.; Liao, H. A Social Learning Approach to Carbon Capture and Storage Demonstration Project Management: An Empirical Analysis. Appl. Energy 2021, 299, 117336. [Google Scholar] [CrossRef]
  16. Sara, J.; Stikkelman, R.M.; Herder, P.M. Assessing Relative Importance and Mutual Influence of Barriers for CCS Deployment of the ROAD Project Using AHP and DEMATEL Methods. Int. J. Greenh. Gas Control 2015, 41, 336–357. [Google Scholar] [CrossRef]
  17. Middleton, R.S.; Bielicki, J.M. A Scalable Infrastructure Model for Carbon Capture and Storage: SimCCS. Energy Policy 2009, 37, 1052–1060. [Google Scholar] [CrossRef]
  18. Cui, R.Y.; Hultman, N.; Cui, D.; McJeon, H.; Yu, S.; Edwards, M.R.; Sen, A.; Song, K.; Bowman, C.; Clarke, L.; et al. A Plant-by-Plant Strategy for High-Ambition Coal Power Phaseout in China. Nat. Commun 2021, 12, 1468. [Google Scholar] [CrossRef] [PubMed]
  19. Fan, J.-L.; Xu, M.; Li, F.; Yang, L.; Zhang, X. Carbon Capture and Storage (CCS) Retrofit Potential of Coal-Fired Power Plants in China: The Technology Lock-in and Cost Optimization Perspective. Appl. Energy 2018, 229, 326–334. [Google Scholar] [CrossRef]
  20. Esmaeili Aliabadi, D. Decarbonizing Existing Coal-Fired Power Stations Considering Endogenous Technology Learning: A Turkish Case Study. J. Clean. Prod. 2020, 261, 121100. [Google Scholar] [CrossRef]
  21. Rohlfs, W.; Madlener, R. Investment Decisions Under Uncertainty: CCS Competing with Green Energy Technologies. Energy Procedia 2013, 37, 7029–7038. [Google Scholar] [CrossRef] [Green Version]
  22. Guo, J.-X.; Huang, C. Feasible Roadmap for CCS Retrofit of Coal-Based Power Plants to Reduce Chinese Carbon Emissions by 2050. Appl. Energy 2020, 259, 114112. [Google Scholar] [CrossRef]
  23. Manaf, N.A.; Weiss, G.; Abbas, A. Relevancy of Emission Reduction Fund (ERF) Policy towards Large-Scale Deployment of Carbon Capture Technology in Black Coal-Fired Power Plant. J. Clean. Prod. 2019, 211, 1471–1479. [Google Scholar] [CrossRef]
  24. Yang, L.; Xu, M.; Yang, Y.; Fan, J.; Zhang, X. Comparison of Subsidy Schemes for Carbon Capture Utilization and Storage (CCUS) Investment Based on Real Option Approach: Evidence from China. Appl. Energy 2019, 255, 113828. [Google Scholar] [CrossRef]
  25. Fan, J.-L.; Xu, M.; Wei, S.-J.; Zhong, P.; Zhang, X.; Yang, Y.; Wang, H. Evaluating the Effect of a Subsidy Policy on Carbon Capture and Storage (CCS) Investment Decision-Making in China—A Perspective Based on the 45Q Tax Credit. Energy Procedia 2018, 154, 22–28. [Google Scholar] [CrossRef]
  26. Chen, H.; Wang, C.; Ye, M. An Uncertainty Analysis of Subsidy for Carbon Capture and Storage (CCS) Retrofitting Investment in China’s Coal Power Plants Using a Real-Options Approach. J. Clean. Prod. 2016, 137, 200–212. [Google Scholar] [CrossRef]
  27. Yao, X.; Zhong, P.; Zhang, X.; Zhu, L. Business Model Design for the Carbon Capture Utilization and Storage (CCUS) Project in China. Energy Policy 2018, 121, 519–533. [Google Scholar] [CrossRef]
  28. Muslemani, H.; Liang, X.; Kaesehage, K.; Kaesehage, K.; Wilson, J.; Wilson, J.; Wilson, J.; Wilson, J. Business Models for Carbon Capture, Utilization and Storage Technologies in the Steel Sector: A Qualitative Multi-Method Study. Processes 2020, 8, 576. [Google Scholar] [CrossRef]
  29. Zhu, L.; Fan, Y. A Real Options–Based CCS Investment Evaluation Model: Case Study of China’s Power Generation Sector. Appl. Energy 2011, 88, 4320–4333. [Google Scholar] [CrossRef]
  30. Wang, Z.; Wang, R.; Deng, W.; Zhao, Y. An Integrated Approach-Based FMECA for Risk Assessment: Application to Offshore Wind Turbine Pitch System. Energies 2022, 15, 1858. [Google Scholar] [CrossRef]
  31. Hu, H.; Liu, J.; Zhu, Q.; Chen, Q. An Integrated Supply Chain Management System for End-of-Life Tires in China and Its Promotion Barriers: A Stakeholder Perspective. Resour. Conserv. Recycl. 2021, 164, 105214. [Google Scholar] [CrossRef]
  32. Xu, C.; Wu, Y.; Dai, S. What Are the Critical Barriers to the Development of Hydrogen Refueling Stations in China? A Modified Fuzzy DEMATEL Approach. Energy Policy 2020, 142, 111495. [Google Scholar] [CrossRef]
  33. Kouhizadeh, M.; Saberi, S.; Sarkis, J. Blockchain Technology and the Sustainable Supply Chain: Theoretically Exploring Adoption Barriers. Int. J. Prod. Econ. 2021, 231, 107831. [Google Scholar] [CrossRef]
  34. Wu, Y.; Liu, F.; Wu, J.; He, J.; Xu, M.; Zhou, J. Barrier Identification and Analysis Framework to the Development of Offshore Wind-to-Hydrogen Projects. Energy 2022, 239, 122077. [Google Scholar] [CrossRef]
  35. Karuppiah, K.; Sankaranarayanan, B.; Ali, S.M. A Fuzzy ANP–DEMATEL Model on Faulty Behavior Risks: Implications for Improving Safety in the Workplace. Int. J. Occup. Saf. Ergon. 2020, 28, 923–940. [Google Scholar] [CrossRef]
  36. Wu, Y.; Liu, F.; Deng, Z.; He, J.; Xu, C.; Tao, Y.; Ke, Y. A Comprehensive Obstacle Analysis Framework on Dispersed Wind Power: A Case of China. J. Clean. Prod. 2021, 297, 126684. [Google Scholar] [CrossRef]
  37. Wu, Y.; Liu, F.; He, J.; Wu, M.; Ke, Y. Obstacle Identification, Analysis and Solutions of Hydrogen Fuel Cell Vehicles for Application in China under the Carbon Neutrality Target. Energy Policy 2021, 159, 112643. [Google Scholar] [CrossRef]
  38. Dincer, H.; Yuksel, S.; Martinez, L. Interval Type 2-Based Hybrid Fuzzy Evaluation of Financial Services in E7 Economies with DEMATEL-ANP and MOORA Methods. Appl. Soft. Comput. 2019, 79, 186–202. [Google Scholar] [CrossRef]
  39. Liu, J.; Chen, Y.; Chen, Z.; Zhang, Y. Multi-Attribute Decision Making Method Based on Neutrosophic Vague N-Soft Sets. Symmetry 2020, 12, 853. [Google Scholar] [CrossRef]
  40. Warrier, S.C.; Mathew, T.J.; Alcantud, J.C.R. Fuzzy Soft Matrices on Fuzzy Soft Multiset and Its Applications in Optimization Problems. IFS 2020, 38, 2311–2322. [Google Scholar] [CrossRef]
  41. Zulkifli, N.; Abdullah, L.; Garg, H. An Integrated Interval-Valued Intuitionistic Fuzzy Vague Set and Their Linguistic Variables. Int. J. Fuzzy Syst. 2021, 23, 182–193. [Google Scholar] [CrossRef]
  42. Elzarka, H.M.; Yan, H.; Chakraborty, D. A Vague Set Fuzzy Multi-Attribute Group Decision-Making Model for Selecting Onsite Renewable Energy Technologies for Institutional Owners of Constructed Facilities. Sustain. Cities Soc. 2017, 35, 430–439. [Google Scholar] [CrossRef]
  43. Si, S.-L.; You, X.-Y.; Liu, H.-C.; Zhang, P. DEMATEL Technique: A Systematic Review of the State-of-the-Art Literature on Methodologies and Applications. Math. Probl. Eng. 2018, 2018, 3696457. [Google Scholar] [CrossRef] [Green Version]
  44. Gölcük, İ.; Baykasoğlu, A. An Analysis of DEMATEL Approaches for Criteria Interaction Handling within ANP. Expert Syst. Appl. 2016, 46, 346–366. [Google Scholar] [CrossRef]
  45. Li, Y.; Zhang, F.; Li, Y.; Li, B.; Li, Z. Evaluating the Power Grid Investment Behavior in China: From the Perspective of Government Supervision. Energies 2019, 12, 4192. [Google Scholar] [CrossRef] [Green Version]
  46. Wang, J.; Gong, Y.; Song, W.; Yang, P. Development Status and Application Prospect of Carbon Capture, Utilization and Storage (CCUS) Technology; Chinesse Research Academy of Environmental Sciences: Beijing, China, 2021. [Google Scholar]
  47. Yang, D.; Zhang, L. Carbon Dioxide Leakages through Fault Zones: Potential Implications for the Long-Term Integrity of Geological Storage Sites. Aerosol Air Qual. Res. 2021, 21, 210220. [Google Scholar] [CrossRef]
  48. Saaty, R.W. The Analytic Hierarchy Process—What It Is and How It Is Used. Math. Model. 1987, 9, 161–176. [Google Scholar] [CrossRef] [Green Version]
  49. Kong, Q.; Siauw, T.; Bayen, A.M. Chapter 15—Eigenvalues and Eigenvectors. In Python Programming and Numerical Methods; Kong, Q., Siauw, T., Bayen, A.M., Eds.; Academic Press: Cambridge, MA, USA, 2021; pp. 265–277. ISBN 978-0-12-819549-9. [Google Scholar]
  50. Li, Y.; Zhang, F.; Li, Y.; Wang, Y. An Improved Two-Stage Robust Optimization Model for CCHP-P2G Microgrid System Considering Multi-Energy Operation under Wind Power Outputs Uncertainties. Energy 2021, 223, 120048. [Google Scholar] [CrossRef]
  51. Vasilev, Y.; Cherepovitsyn, A.; Tsvetkova, A.; Komendantova, N. Promoting Public Awareness of Carbon Capture and Storage Technologies in the Russian Federation: A System of Educational Activities. Energies 2021, 14, 1408. [Google Scholar] [CrossRef]
Figure 1. Obstacle system for China’s CCUS technology commercialization.
Energies 15 03964 g001
Figure 2. Study framework.
Energies 15 03964 g002
Figure 3. The interactions between five first-level indicators (Solid lines represent a one-way impact, dashed lines represent a two-way impact).
Energies 15 03964 g003
Figure 4. The ANP network hierarchy of the obstacle system (Solid lines represent a one-way impact, dashed lines represent a two-way impact).
Energies 15 03964 g004
Figure 5. The distribution of membership degree.
Energies 15 03964 g005
Table 1. Centrality and causality of first-level indicators.
First-Level Indicators D + R D R
H 1 3.91535766−1.50460996
H 2 3.412244940.79016880
H 3 3.931222601.32605887
H 4 3.81553357−0.06708203
H 5 3.33966240−0.54453564
Table 2. Influence relationship among second-level indicators.
Sec ondary   Indicator   h i j Influence Relationship
Indicators   Affected   by   h i j Indicators   Affect   h i j
h 11 h 12 ,   h 13 ,   h 21 h 12 ,   h 21 h 22 , h 23 ,   h 33 , h 52 , h 53
h 12 h 11 ,   h 13 h 11 ,   h 21 , h 22 , h 53
h 13 h 52 h 11 ,   h 12 , h 33 , h 41 , h 42 , h 43
h 21 h 11 ,   h 12 , h 22 , h 51 h 22
h 22 h 11 ,   h 12 , h 21 , h 51 h 52
h 23 h 11 ,   h 32 , h 51 , h 53 h 32 , h 42 ,   h 52 , h 53
h 31 h 33 ,   h 51 , h 52 h 32 ,   h 51
h 32 h 23 , h 31 ,   h 33 , h 42 , h 43 , h 51 , h 52 h 23 ,   h 52
h 33 h 11 ,   h 13 , h 43 , h 52 h 31 , h 32 ,   h 51
h 41 h 13 ,   h 42 h 43 , h 52
h 42 h 13 ,   h 23 , h 43 h 32 , h 41 ,   h 43 , h 52 , h 53
h 43 h 13 ,   h 41 , h 42 , h 53 h 32 ,   h 33 , h 42
h 51 h 31 ,   h 33 , h 53 h 21 ,   h 22 , h 23 , h 31 , h 32
h 52 h 11 ,   h 22 , h 23 , h 32 , h 41 , h 42 , h 53 h 13 ,   h 31 , h 32 , h 33
h 53 h 11 ,   h 12 , h 23 , h 42 h 23 ,   h 43 , h 51 , h 52
Table 3. Weight coefficients of the second-level indicators.
Second-Level IndicatorsWeightPriorities
High investment cost h 11 0.033014
High operation and maintenance cost h 12 0.05078
Low rate of return on investments h 13 0.11003
High energy consumption h 21 0.12412
Limited carbon dioxide conversion efficiency h 22 0.15511
Insufficient geological information h 23 0.05956
Inadequate legal and regulatory framework h 31 0.05657
Lack of standards and regulations h 32 0.09605
Insufficient incentive policies h 33 0.036411
Inadequate market pulling power h 41 0.015115
Poor connection of the industrial chain h 42 0.04669
Low carbon dioxide demand h 43 0.033812
Lack of public support h 51 0.039710
Low investment enthusiasm of enterprise h 52 0.11004
Inadequate infrastructure h 53 0.033513
Table 4. Expert reviews on Vague value of indicators.
First-Level IndicatorsSecond-Level IndicatorsThe Vague Set Evaluation Matrix of the Evaluation Index System
V E L   V V L   V L   V M   V H   V V H V E H
H 1 h 11 [0.05, 0.05][0.20, 0.20][0.05, 0.05][0.00, 0.00][0.05, 0.05][0.20, 0.20][0.45, 0.45]
h 12 [0.05, 0.10][0.00, 0.05][0.10, 0.15][0.15, 0.20][0.50, 0.55][0.15, 0.20][0.00, 0.05]
h 13 [0.00, 0.05][0.00, 0.05][0.00, 0.05][0.00, 0.05][0.10, 0.15][0.05, 0.10][0.80, 0.85]
H 2 h 21 [0.00, 0.05][0.05, 0.10][0.10, 0.15][0.05, 0.10][0.35, 0.40][0.30, 0.35][0.10, 0.15]
h 22 [0.00, 0.15][0.15, 0.30][0.10, 0.25][0.10, 0.25][0.45, 0.60][0.05, 0.20][0.00, 0.15]
h 23 [0.05, 0.30][0.10, 0.35][0.15, 0.40][0.30, 0.55][0.05, 0.30][0.05, 0.30][0.05, 0.30]
H 3 h 31 [0.00, 0.10][0.10, 0.20][0.10, 0.20][0.30, 0.40][0.30, 0.40][0.10, 0.20][0.00, 0.10]
h 32 [0.00, 0.15][0.00, 0.15][0.30, 0.45][0.25, 0.40][0.30, 0.45][0.00, 0.15][0.00, 0.15]
h 33 [0.00, 0.05][0.00, 0.05][0.00, 0.05][0.00, 0.05][0.45, 0.50][0.25, 0.30][0.25, 0.30]
H 4 h 41 [0.00, 0.10][0.05, 0.15][0.10, 0.20][0.35, 0.45][0.25, 0.35][0.15, 0.25][0.00, 0.10]
h 42 [0.00, 0.05][0.00, 0.05][0.05, 0.10][0.15, 0.20][0.50, 0.55][0.15, 0.20][0.10, 0.15]
h 43 [0.00, 0.05][0.00, 0.05][0.00, 0.05][0.30, 0.35][0.25, 0.30][0.30, 0.35][0.10, 0.15]
H 5 h 51 [0.05, 0.20][0.10, 0.25][0.15, 0.30][0.15, 0.30][0.25, 0.40][0.15, 0.30][0.00, 0.15]
h 52 [0.00, 0.15][0.00, 0.15][0.00, 0.15][0.10, 0.25][0.35, 0.50][0.30, 0.45][0.10, 0.25]
h 53 [0.00, 0.20][0.10, 0.30][0.20, 0.40][0.35, 0.55][0.15, 0.35][0.00, 0.20][0.00, 0.20]
Table 5. Comprehensive evaluation results of Vague value.
First-Level IndicatorsSecond-Level IndicatorsThe Vague Value of the Evaluation Index System
V E L   V V L   V L   V M   V H   V V H   V E H
U 1 U 11 [0.00165, 0.00165][0.00660, 0.00660][0.00165, 0.00165][0.00000, 0.00000][0.00165, 0.00165][0.00660, 0.00660][0.01485, 0.01485]
U 12 [0.00254, 0.00507][0.00000, 0.00254][0.00507, 0.00761][0.00761, 0.01014][0.02535, 0.02789][0.00761, 0.01014][0.00000, 0.00254]
U 13 [0.00000, 0.00550][0.00000, 0.00550][0.00000, 0.00550][0.00000, 0.00550][0.01100, 0.01650][0.00550, 0.01100][0.08800, 0.09350]
F 1 [0.00419, 0.01222][0.00660, 0.01464][0.00672, 0.01476][0.00761, 0.01564][0.03800, 0.04604][0.01971, 0.02774][0.10285, 0.11089]
U 2 U 21 [0.00000, 0.00621][0.00621, 0.01241][0.01241, 0.01862][0.00621, 0.01241][0.04344, 0.04964][0.03723, 0.04344][0.01241, 0.01862]
U 22 [0.00000, 0.02327][0.02327, 0.04653][0.01551, 0.03878][0.01551, 0.03878][0.06980, 0.09306][0.00776, 0.03102][0.00000, 0.02327]
U 23 [0.00298, 0.01785][0.00595, 0.02083][0.00893, 0.02380][0.01785, 0.03273][0.00298, 0.01785][0.00298, 0.01785][0.00298, 0.01785]
F 2 [0.00298, 0.04732][0.03542, 0.07977][0.03685, 0.08119][0.03957, 0.08391][0.11621, 0.16055][0.04796, 0.09231][0.01539, 0.05973]
U 3 U 31 [0.00000, 0.00565][0.00565, 0.01130][0.00565, 0.01130][0.01695, 0.02260][0.01695, 0.02260][0.00565, 0.01130][0.00000, 0.00565]
U 32 [0.00000, 0.01440][0.00000, 0.01440][0.02880, 0.04320][0.02400, 0.03840][0.02880, 0.04320][0.00000, 0.01440][0.00000, 0.01440]
U 33 [0.00000, 0.00182][0.00000, 0.00182][0.00000, 0.00182][0.00000, 0.00182][0.01638, 0.01820][0.00910, 0.01092][0.00910, 0.01092]
F 3 [0.00000, 0.02187][0.00565, 0.02752][0.03445, 0.05632][0.04095, 0.06282][0.06213, 0.08400][0.01475, 0.03662][0.00910, 0.03097]
U 4 U 41 [0.00000, 0.00151][0.00076, 0.00227][0.00151, 0.00302][0.00529, 0.00680][0.00378, 0.00529][0.00227, 0.00378][0.00000, 0.00151]
U 42 [0.00000, 0.00233][0.00000, 0.00233][0.00233, 0.00466][0.00699, 0.00932][0.02330, 0.02563][0.00699, 0.00932][0.00466, 0.00699]
U 43 [0.00000, 0.00169][0.00000, 0.00169][0.00000, 0.00169][0.01014, 0.01183][0.00845, 0.01014][0.01014, 0.01183][0.00338, 0.00507]
F 4 [0.00000, 0.00553][0.00076, 0.00629][0.00384, 0.00937][0.02242, 0.02795][0.03553, 0.04106][0.01940, 0.02493][0.00804, 0.01357]
U 5 U 51 [0.00199, 0.00794][0.00397, 0.00993][0.00596, 0.01191][0.00596, 0.01191][0.00993, 0.01588][0.00596, 0.01191][0.00000, 0.00596]
U 52 [0.00000, 0.01650][0.00000, 0.01650][0.00000, 0.01650][0.01100, 0.02750][0.03850, 0.05500][0.03300, 0.04950][0.01100, 0.02750]
U 53 [0.00000, 0.00670][0.00335, 0.01005][0.00670, 0.01340][0.01173, 0.01843][0.00503, 0.01173][0.00000, 0.00670][0.00000, 0.00670]
F 5 [0.00199, 0.03114][0.00732, 0.03648][0.01266, 0.04181][0.02868, 0.05784][0.05345, 0.08261][0.03896, 0.06811][0.01100, 0.04016]
F [0.00915, 0.11808][0.05575, 0.16468][0.09451, 0.20345][0.13922, 0.24815][0.30531, 0.41425][0.14077, 0.24970][0.14638, 0.25531]
Table 6. The membership degree of five categories of obstacles.
V E L V V L V L V M V H V V H V E H
EconomicobstacleJ10.0042190.0066530.0067740.0076670.0383080.0198650.103683
TechnicalobstacleJ20.0031130.0370640.0385550.0414010.1215970.0501850.016099
PoliticalobstacleJ30.0000000.0057760.0352200.0418660.0635190.0150800.009303
MarketobstacleJ40.0000000.0007590.0038610.0225400.0357230.0195030.008085
SocialobstacleJ50.0020450.0075400.0130350.0295410.0550550.0401250.011330
J0.0102630.0625600.1060640.1562340.3426350.1579740.164270
Publisher’s Note: MDPI stays neutral with regard to jurisdictional claims in published maps and institutional affiliations.

