
D-P-Transformer: A Distilling and Probsparse Self-Attention Rockburst Prediction Method


Abstract
:1. Introduction
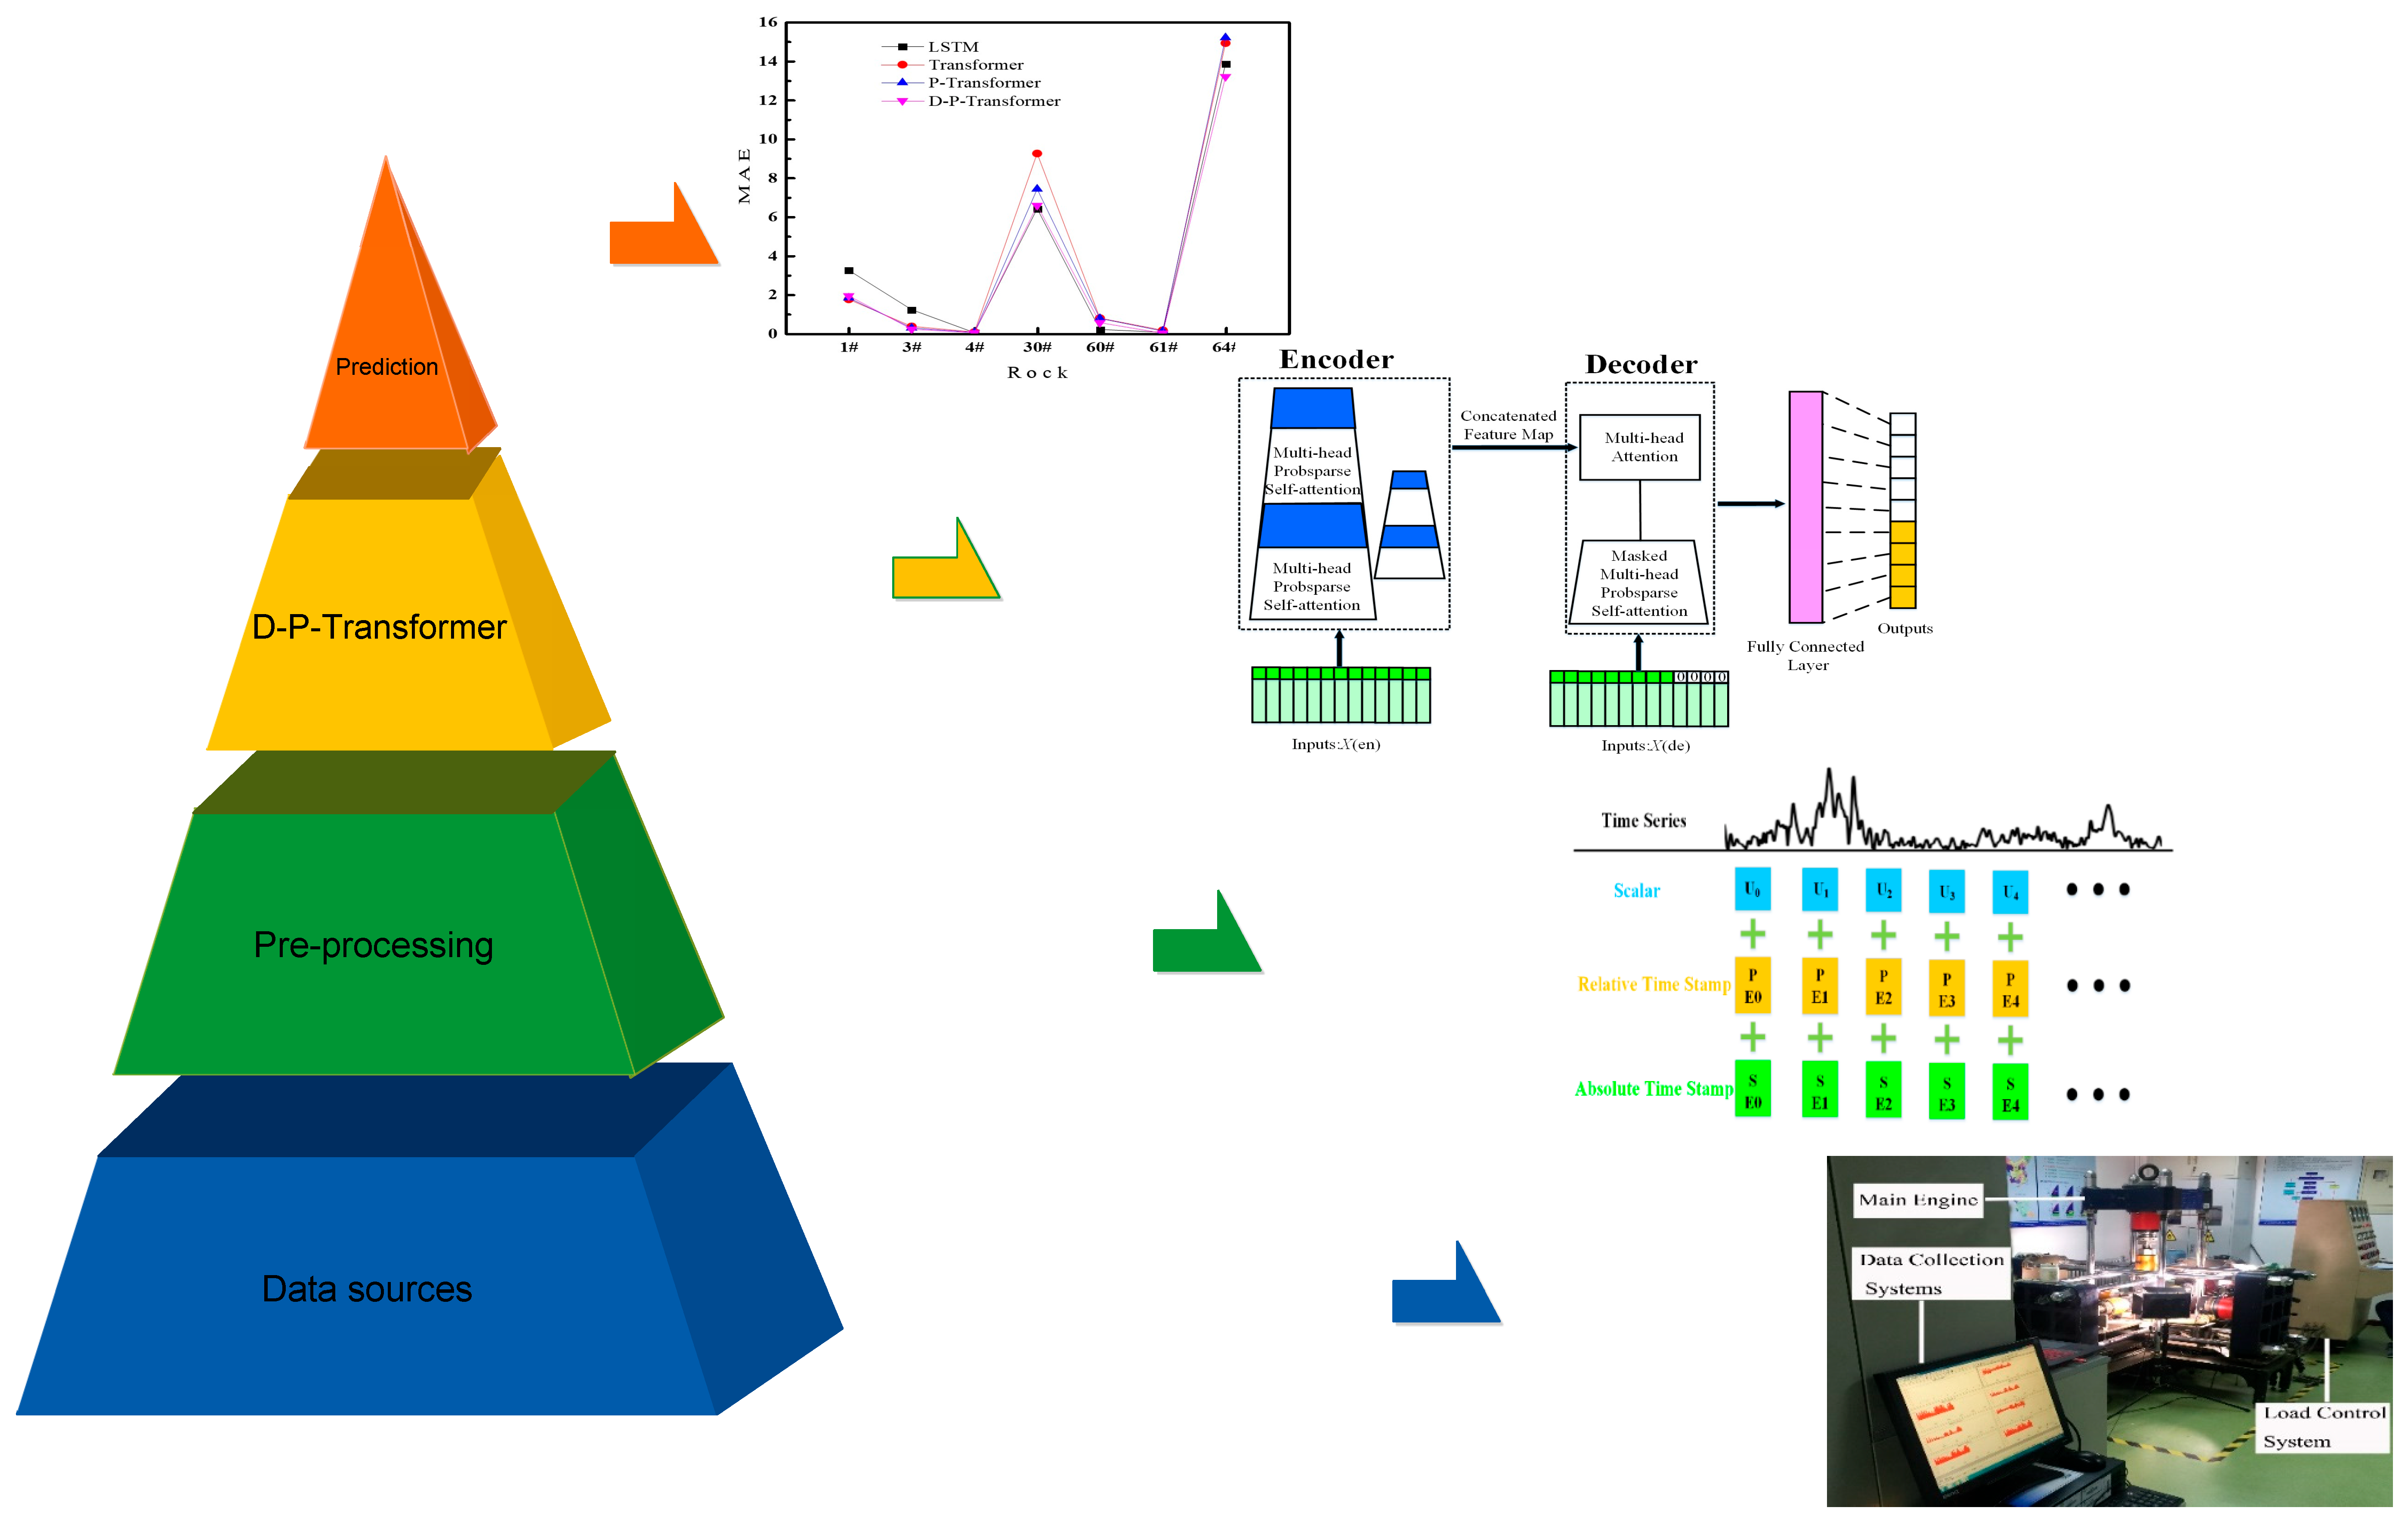
2. Methodology
- (1)
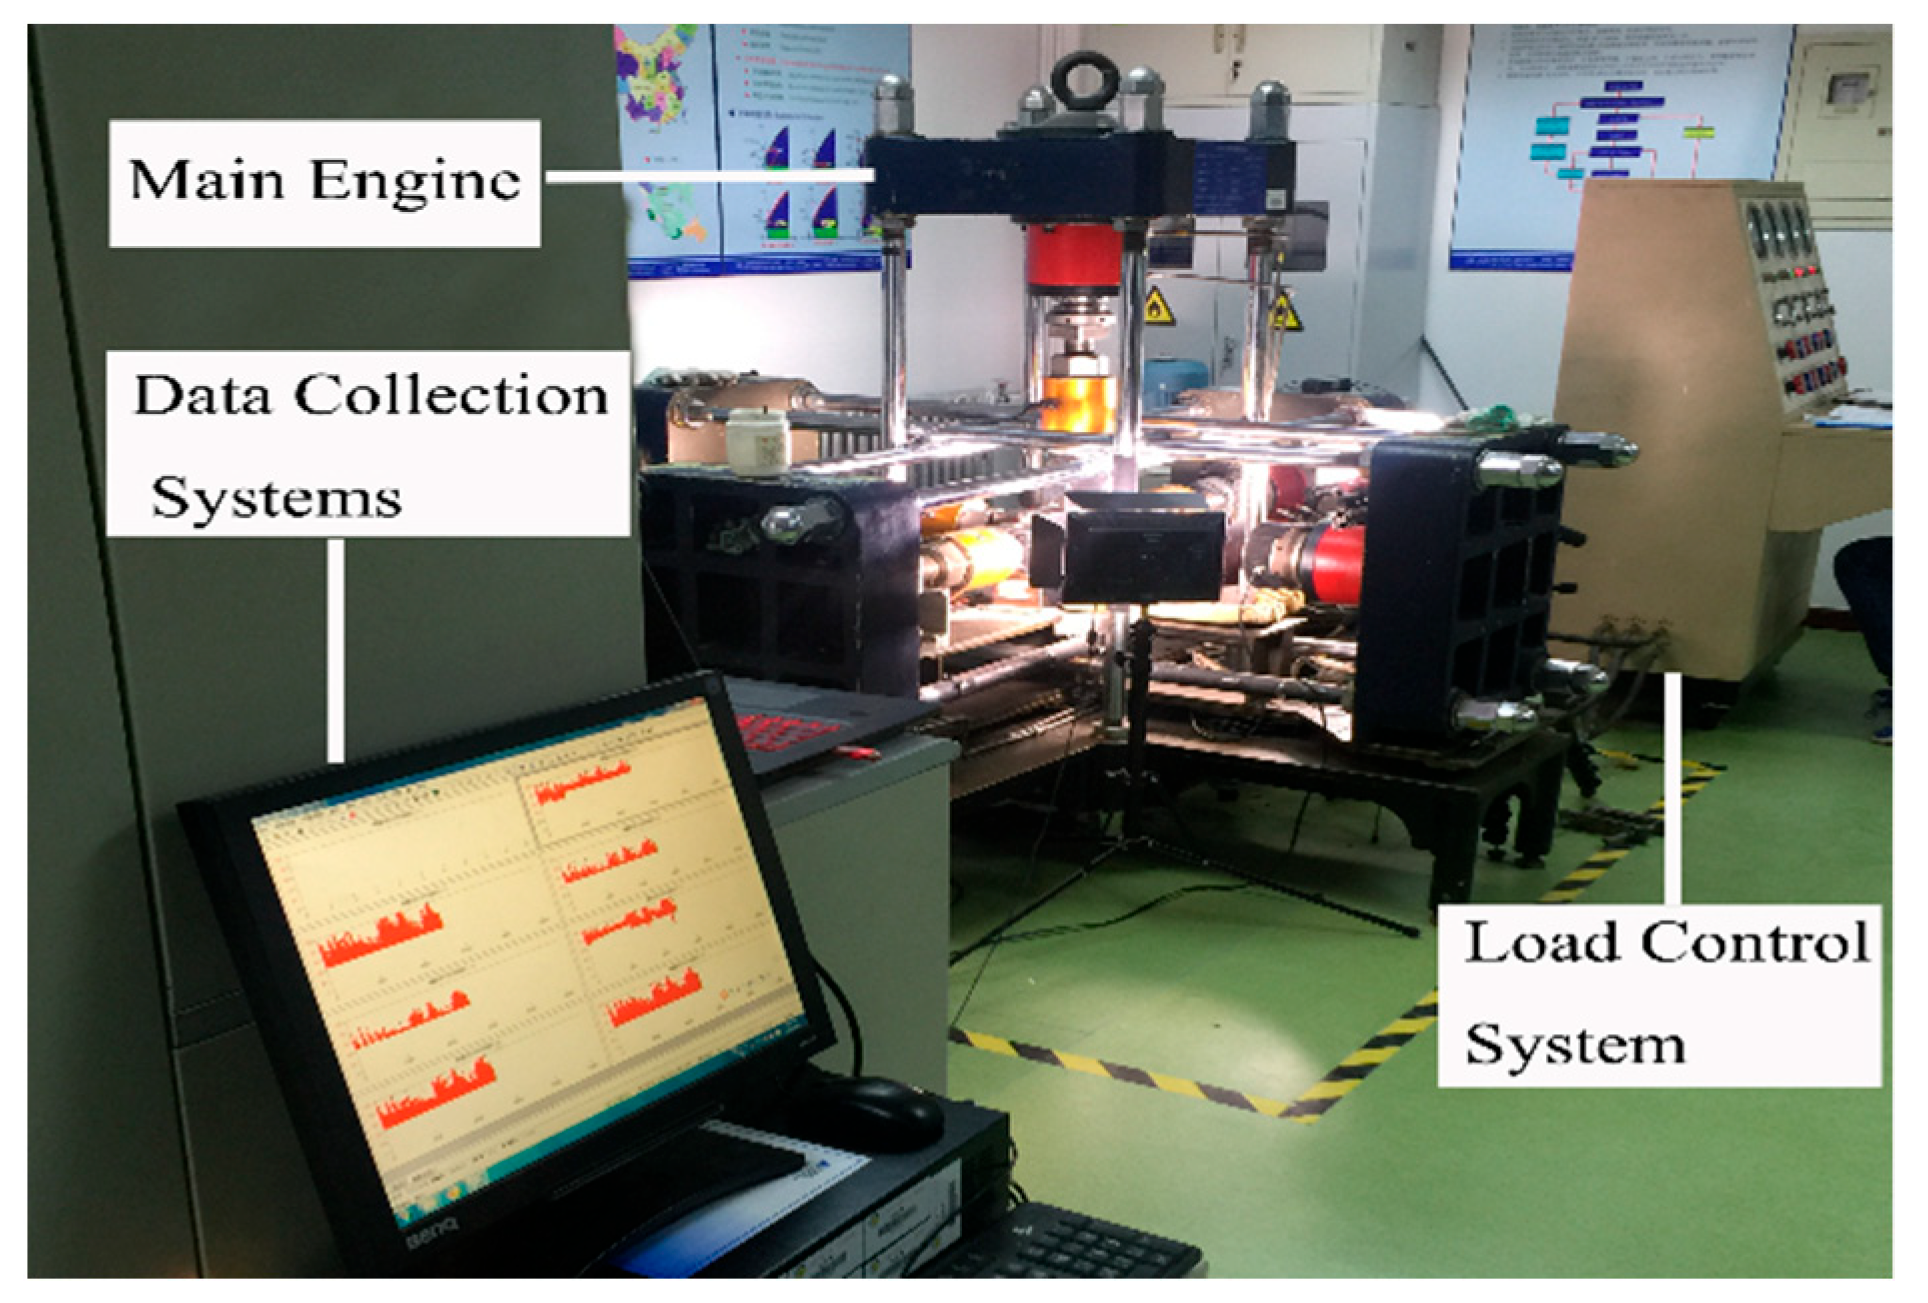
- Data sources: In this study, real-time experimental AE data were collected by using a rockburst physical simulation system;
- (2)
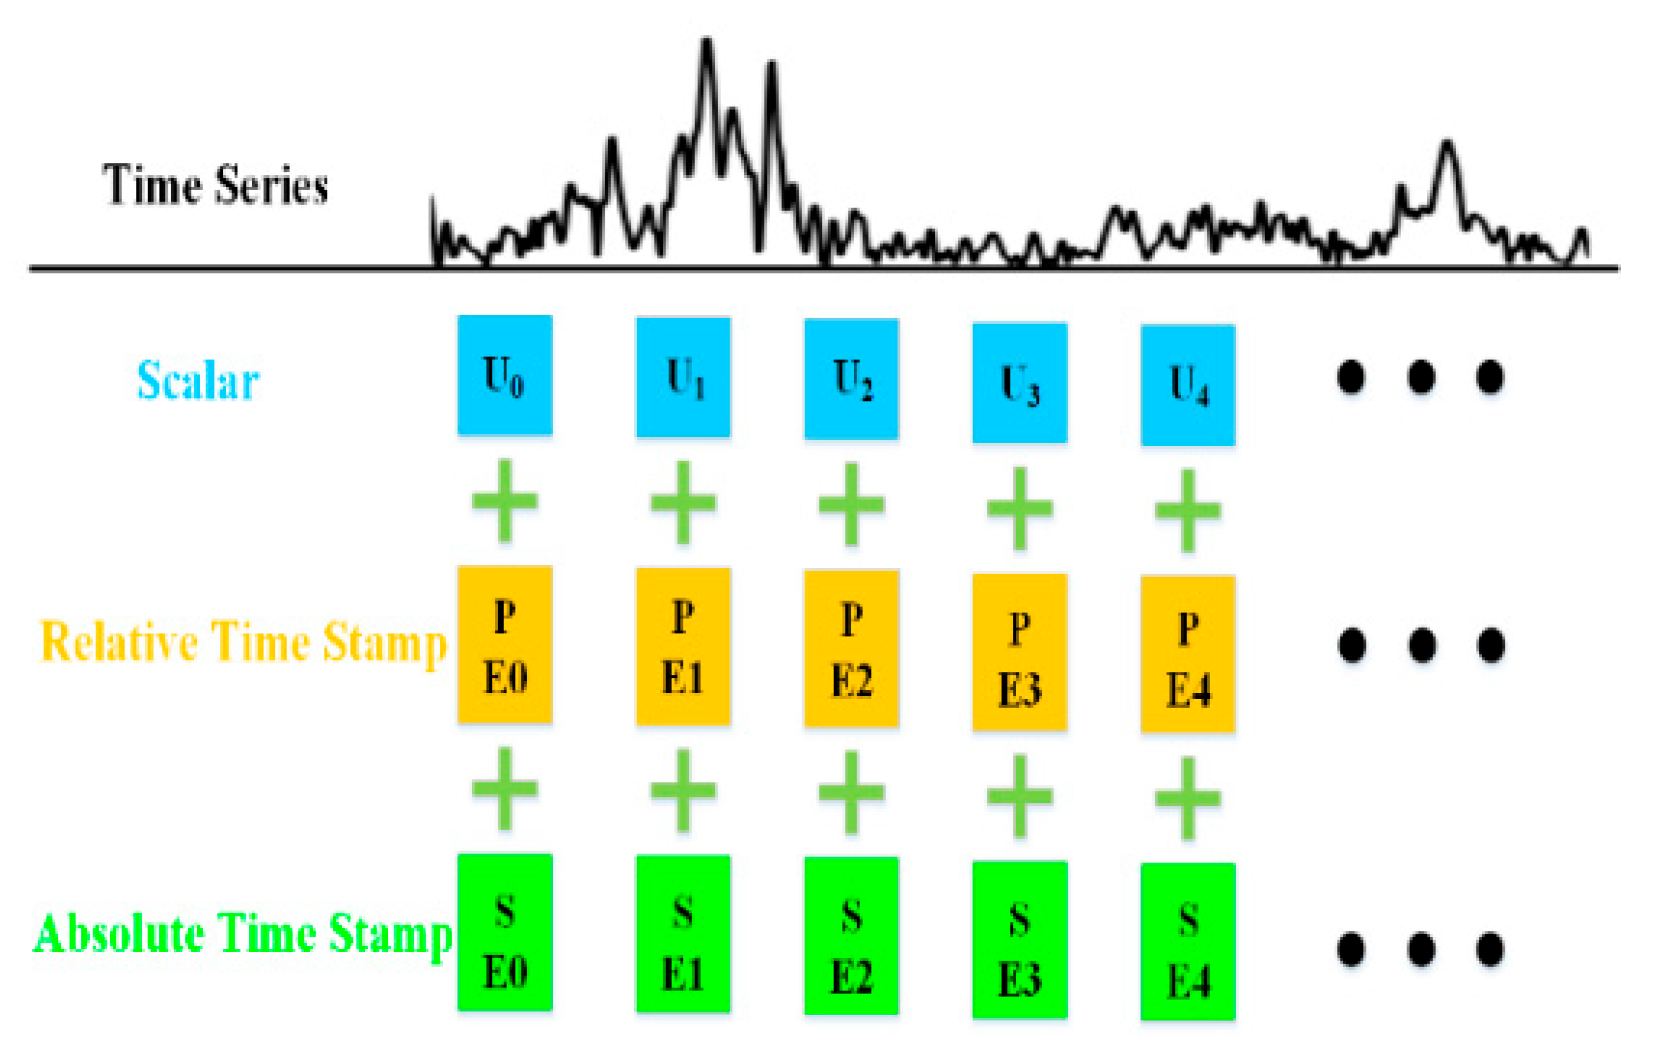
- Pre-processing: The experimental data were imported into the “Big Data AI Visualization and Analysis Platform” independently developed by the Big Data AI Lab with independent intellectual property rights for feature extraction. The data were then fed into the embedding structure of the D-P-Transformer rockburst prediction algorithm for pre-processing;
- (3)
- D-P-Transformer: The D-P-Transformer rockburst prediction algorithm model was constructed;
- (4)
- Prediction: The D-P-Transformer rockburst prediction algorithm was used to predict the absolute energy, and four evaluation metrics were used to evaluate the model.
2.1. Data Sources
2.2. Pre-Processing
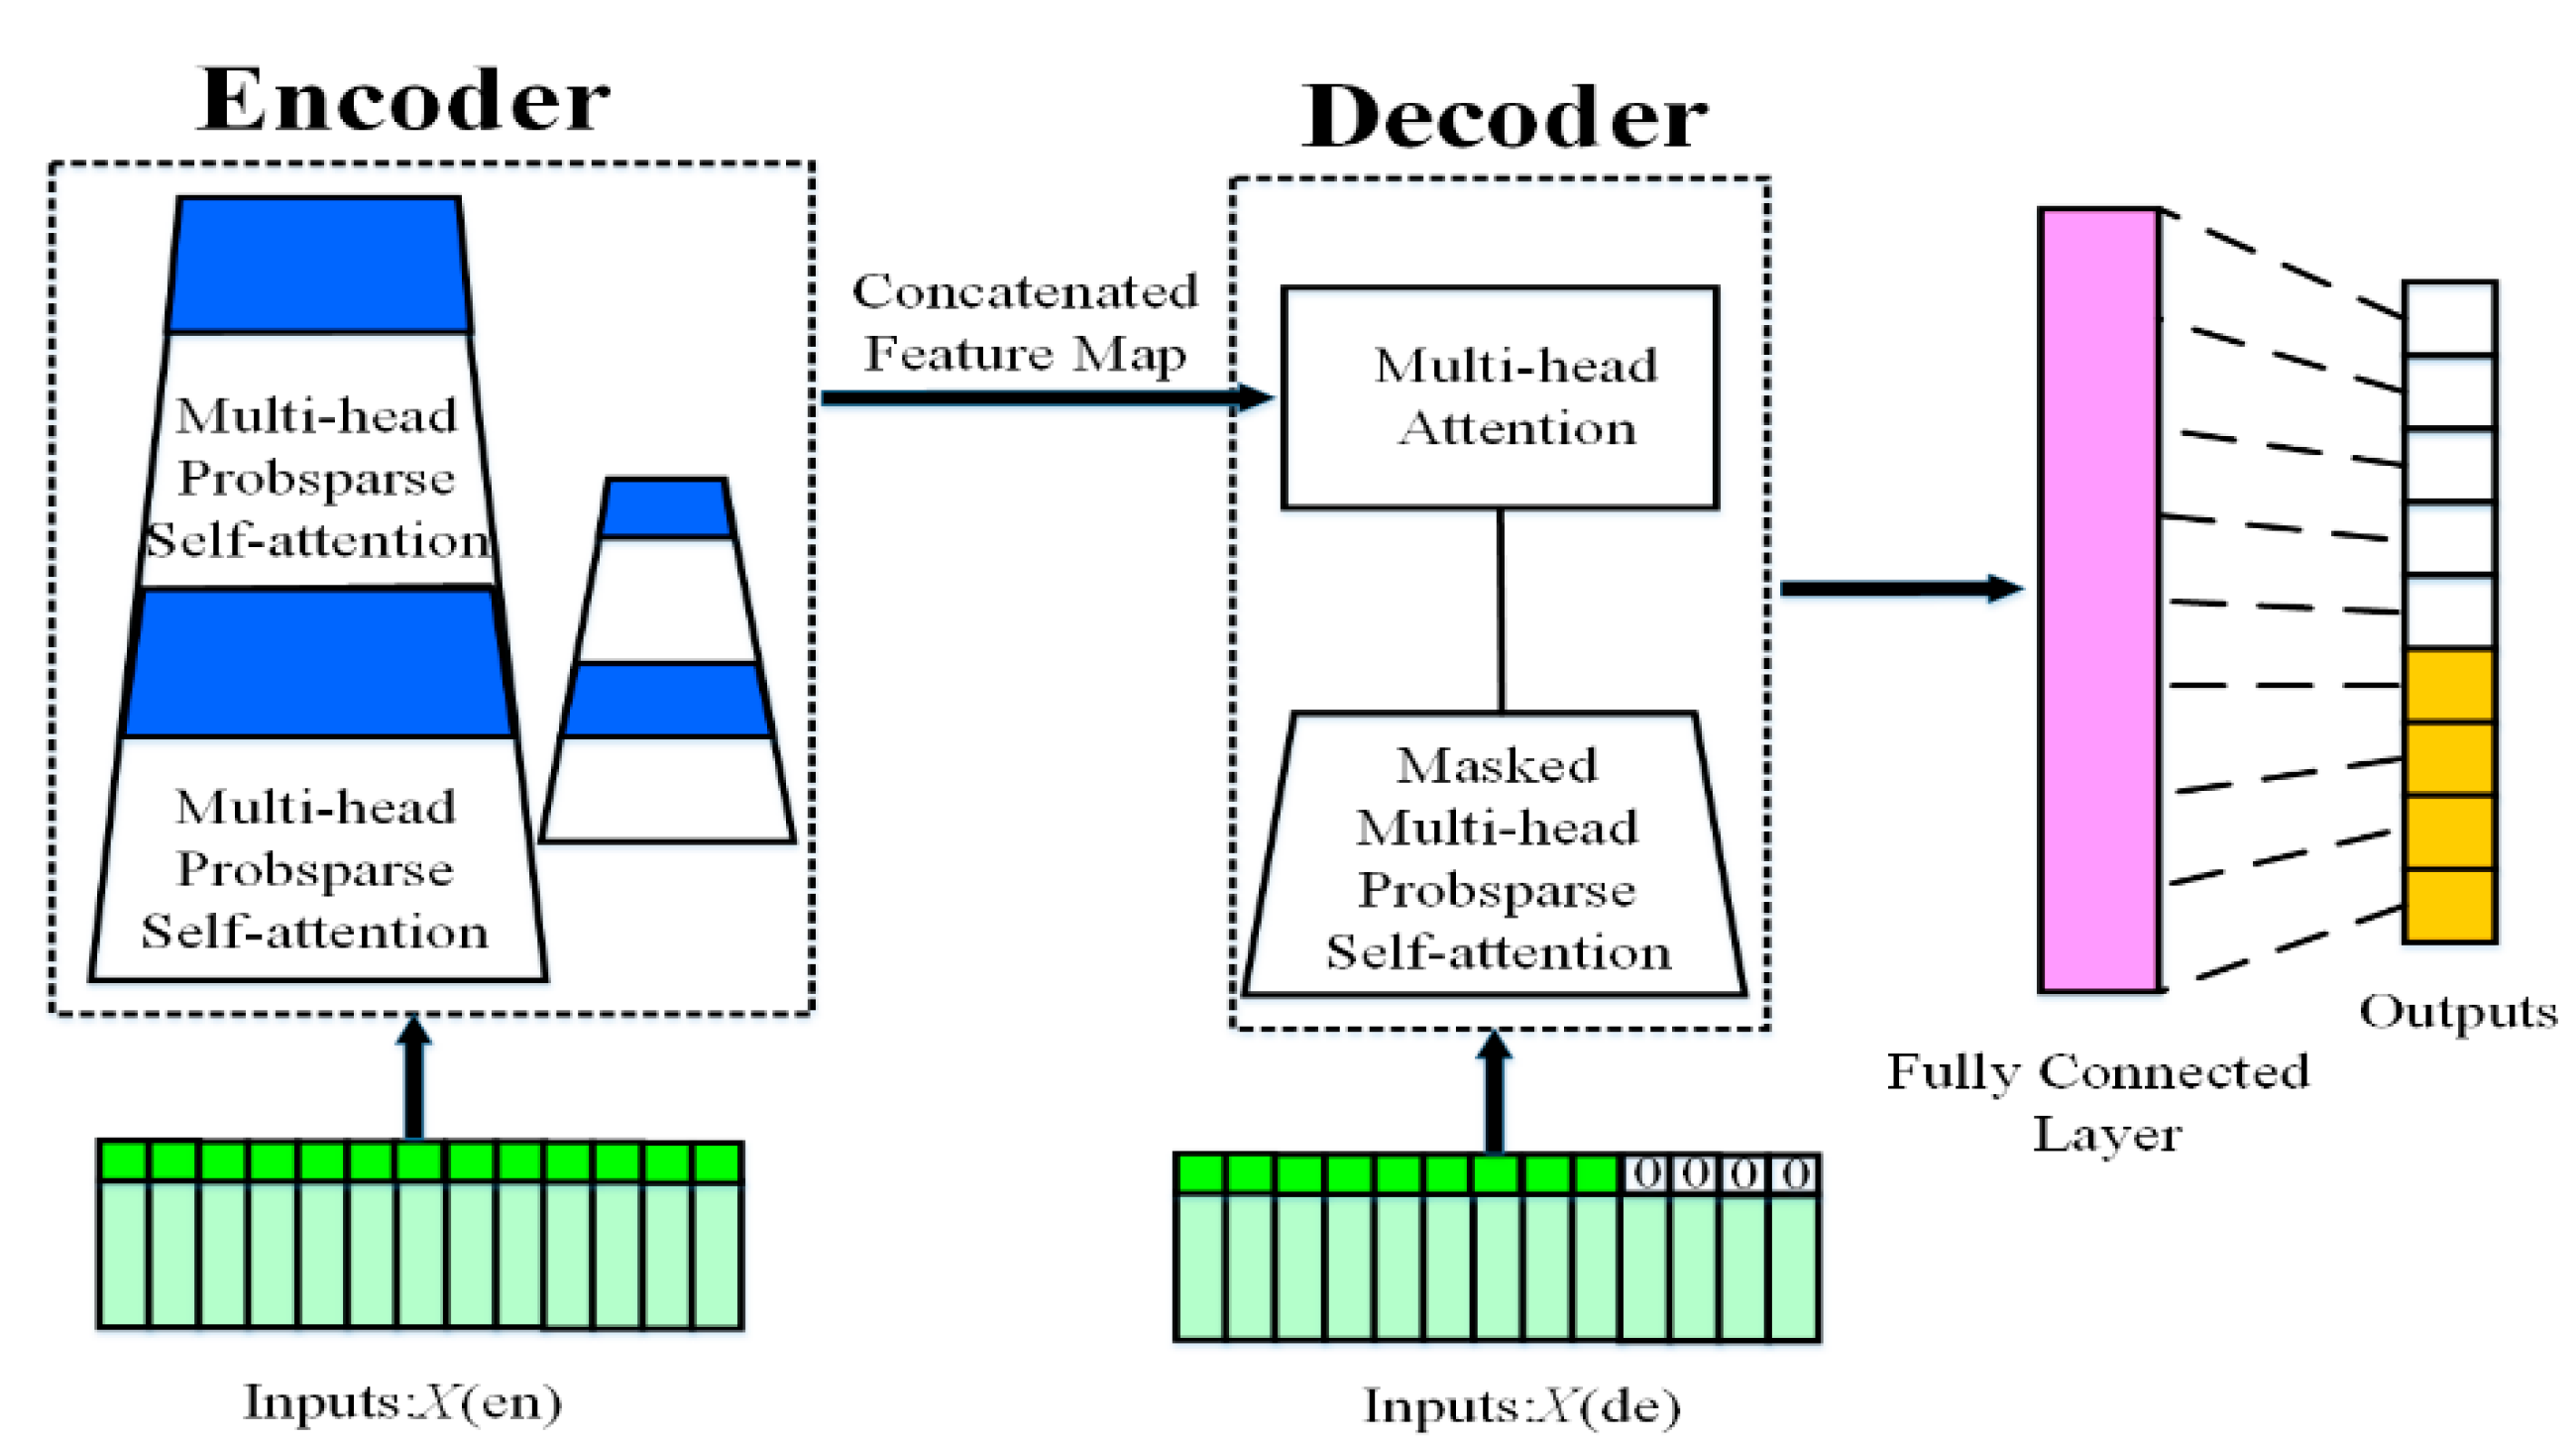
2.3. D-P-Transformer
| Algorithm 1 The P-Transformer algorithm. |
| 1:Input: Database feature map S, Tensor , , |
| 2:Output: Predicted value |
| 3:for do |
| 4:According to Equations (1)–(3), get |
| 5:end for |
| 6:randomly select dot-product pairs from K as |
| 7:compute the KL divergence |
| 8:set the sparse score |
| 9:compute the measurement by row |
| 10:set Top-u queries under as |
| 11: mean(V) |
| 12:S ← {S1, S0} |
| 13:for do |
| 14:According to Equation (5) of the Decoder, get |
| 15:end for |
| Algorithm 2 The D-P-Transformer algorithm. |
| 1:Input: Dataset feature map S, , Tensor , , |
| 2:Output: Predicted value |
| 3:for do |
| 4:According to Equations (1)–(3), get |
| 5:end for |
| 6:compute the measurement by row |
| 7:Set the Top-u queries under as |
| 8: mean(V) |
| 9:S ← {S1, S0} |
| 10:for do |
| 11:According to Equations (4) and (5) of the Encoder and multiple layer replicas, get |
| 12:end for |
2.4. Prediction
3. Results and Discussion
3.1. Evaluation Metrics
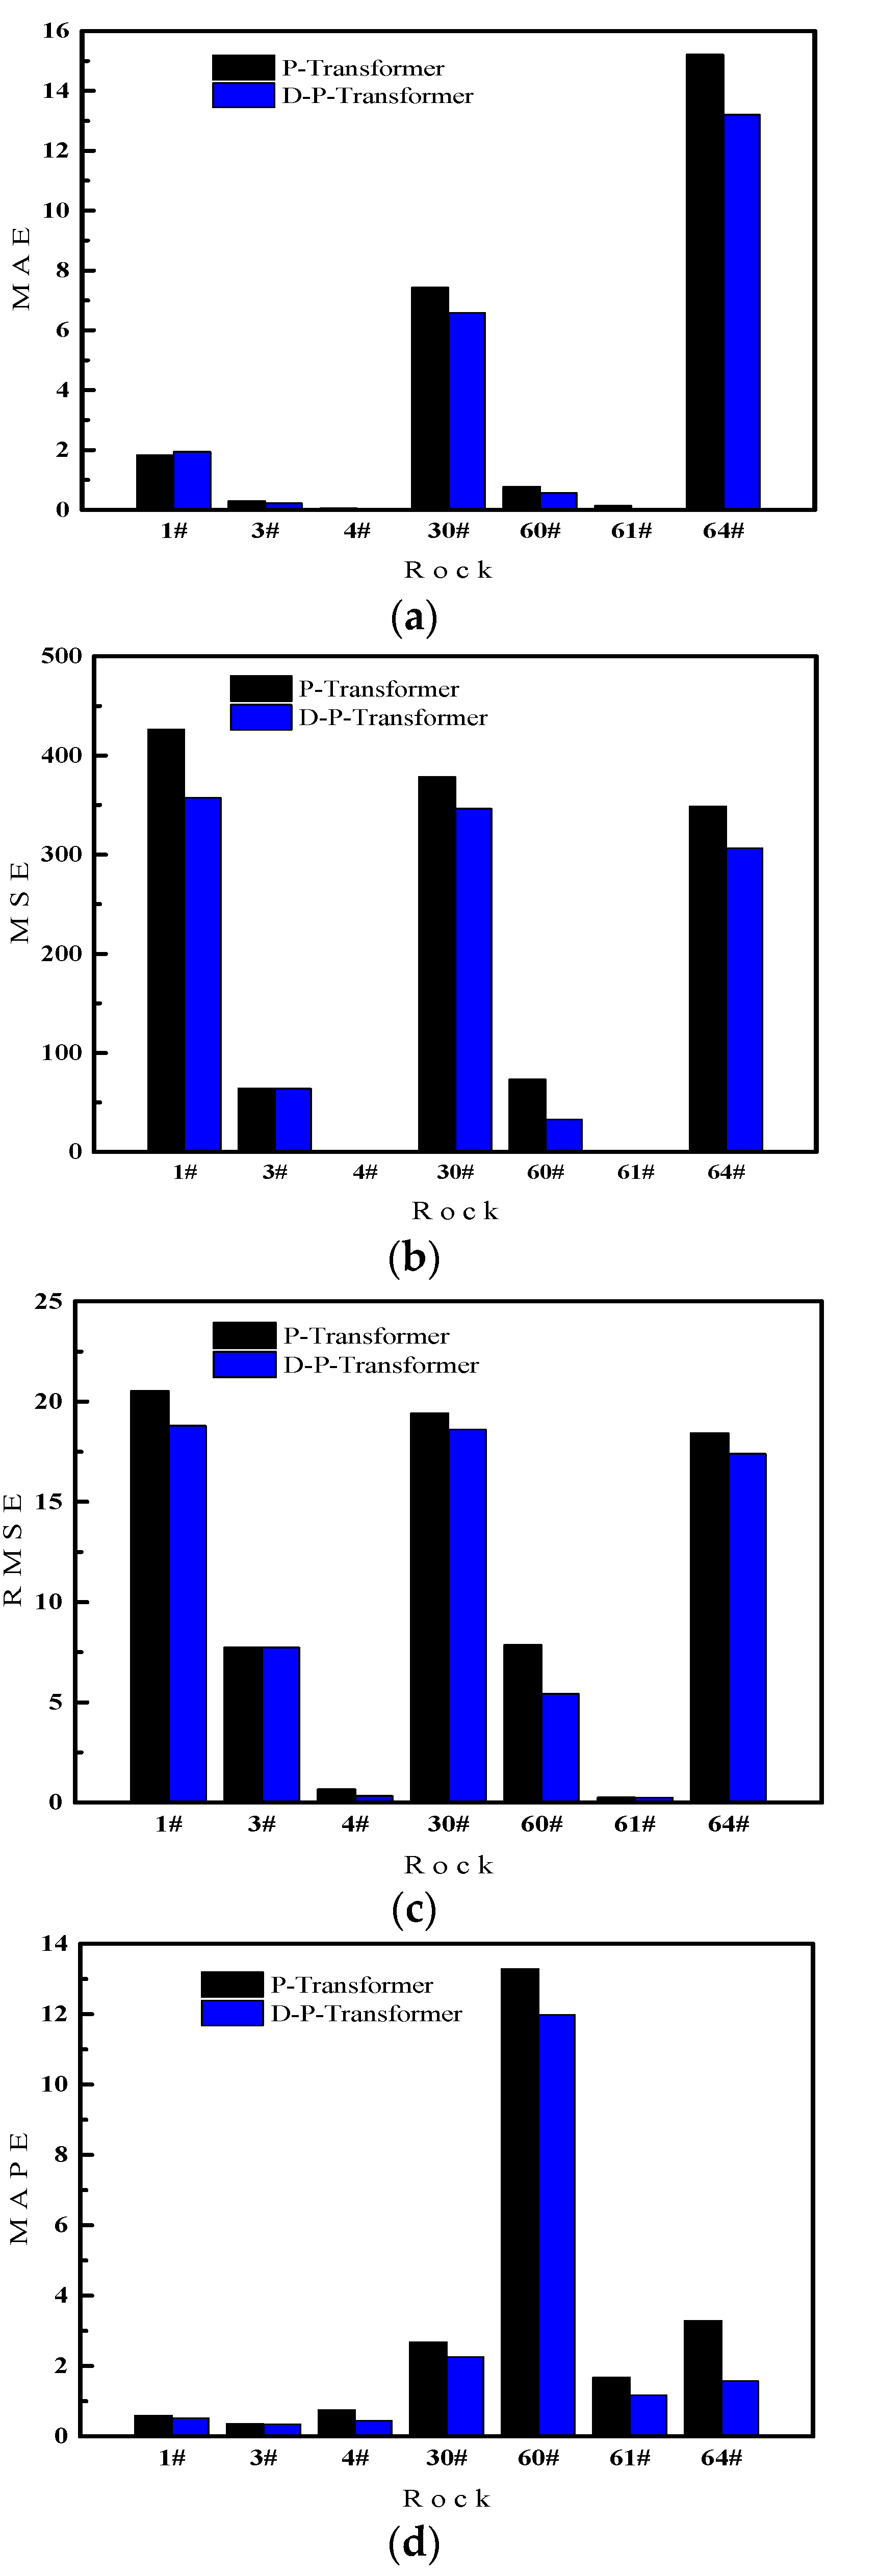
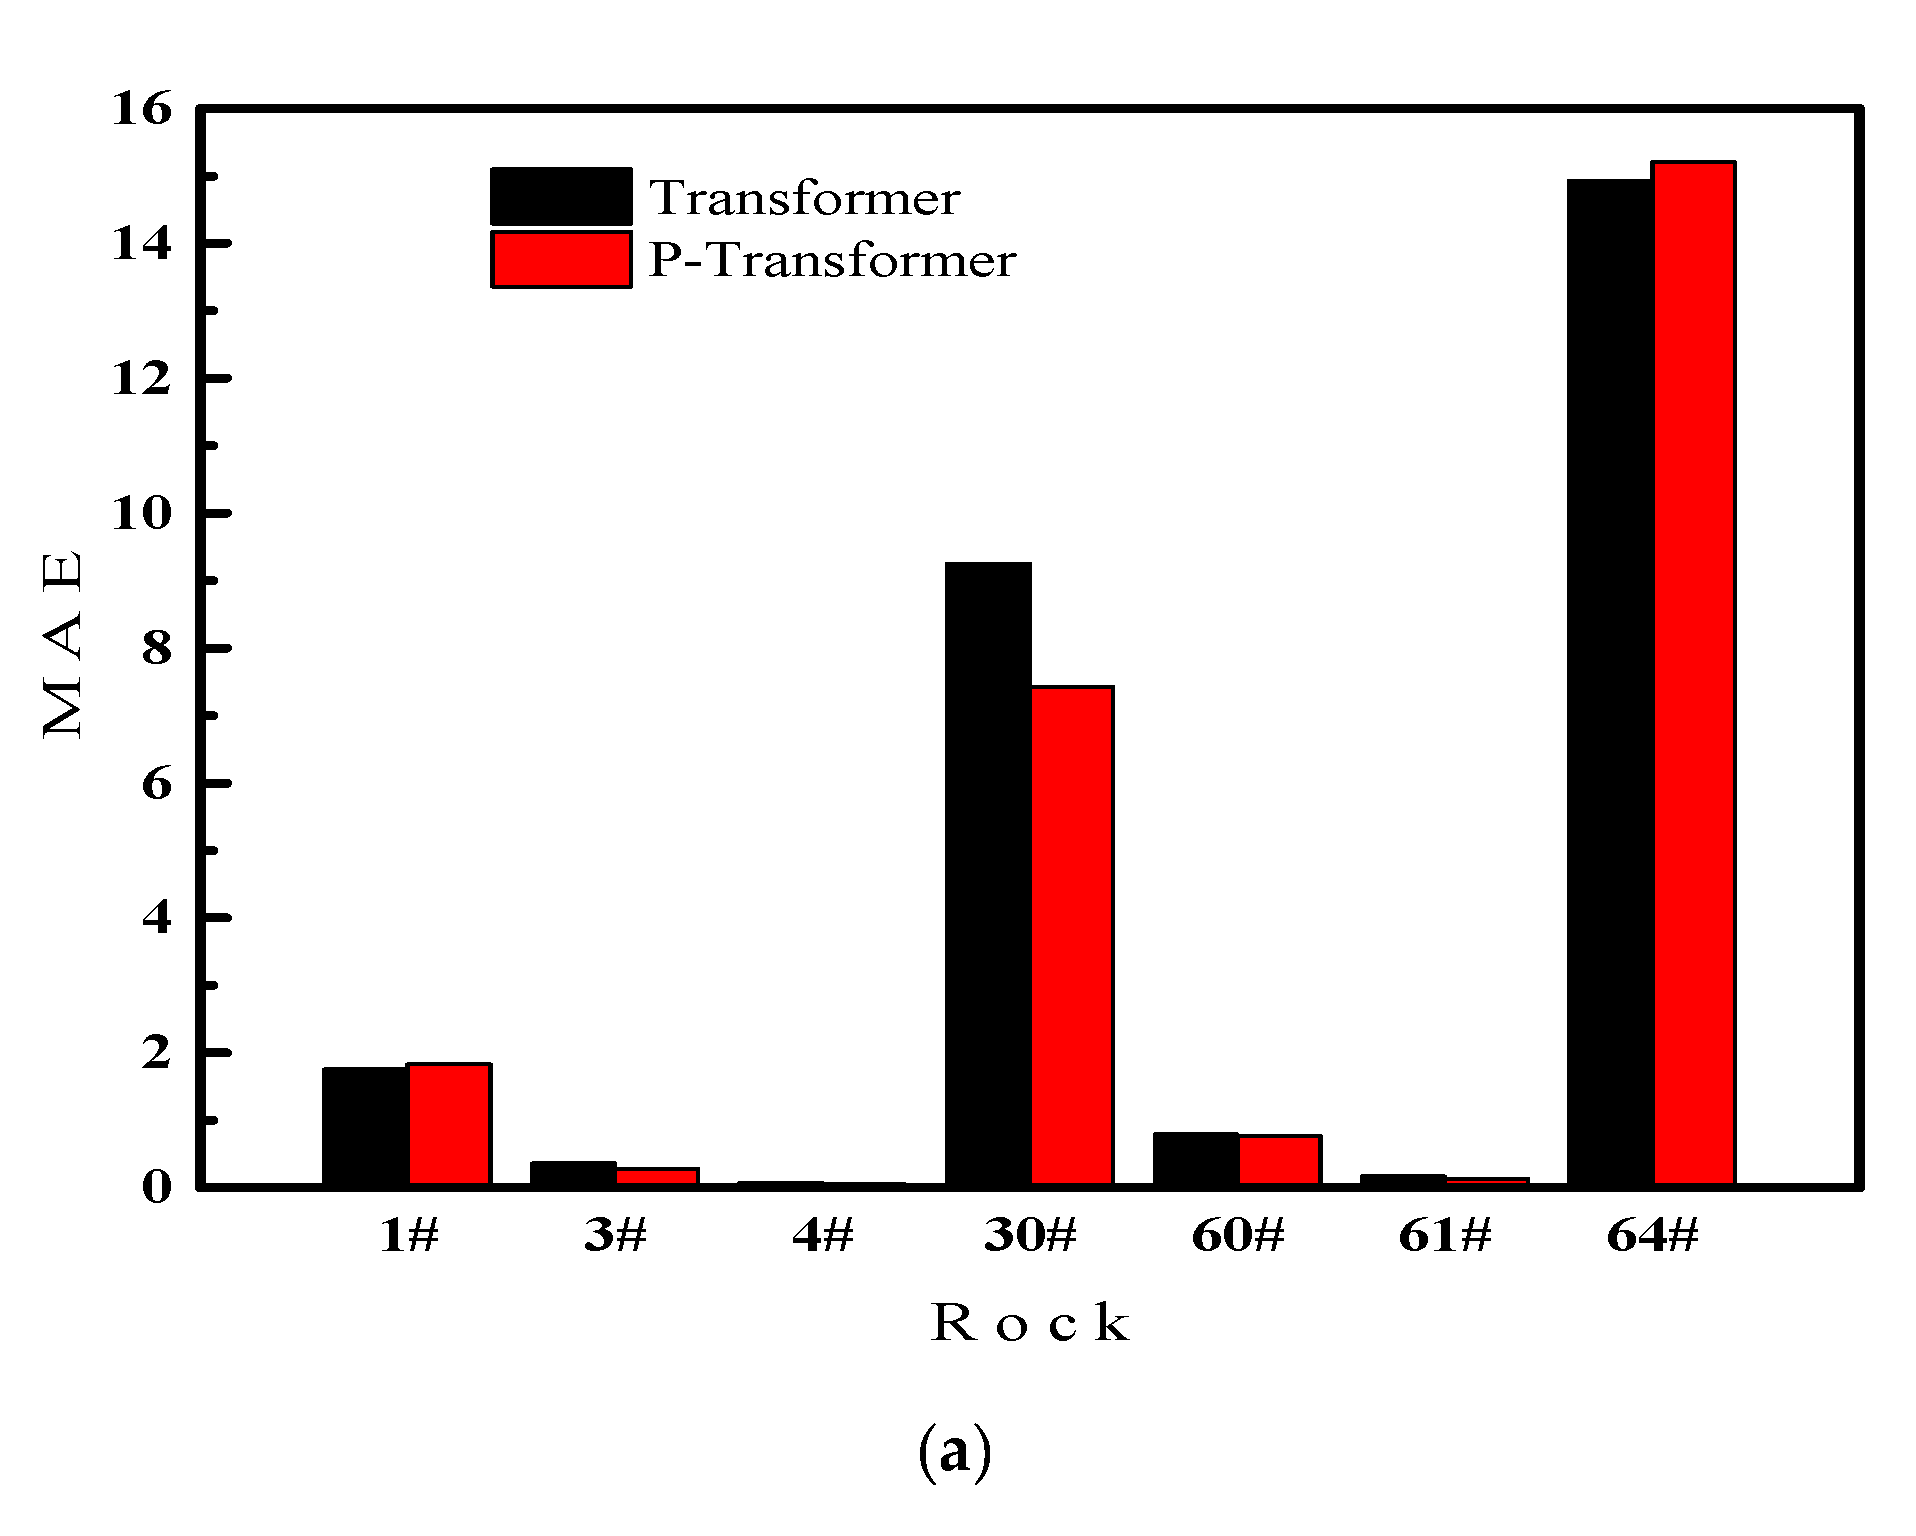
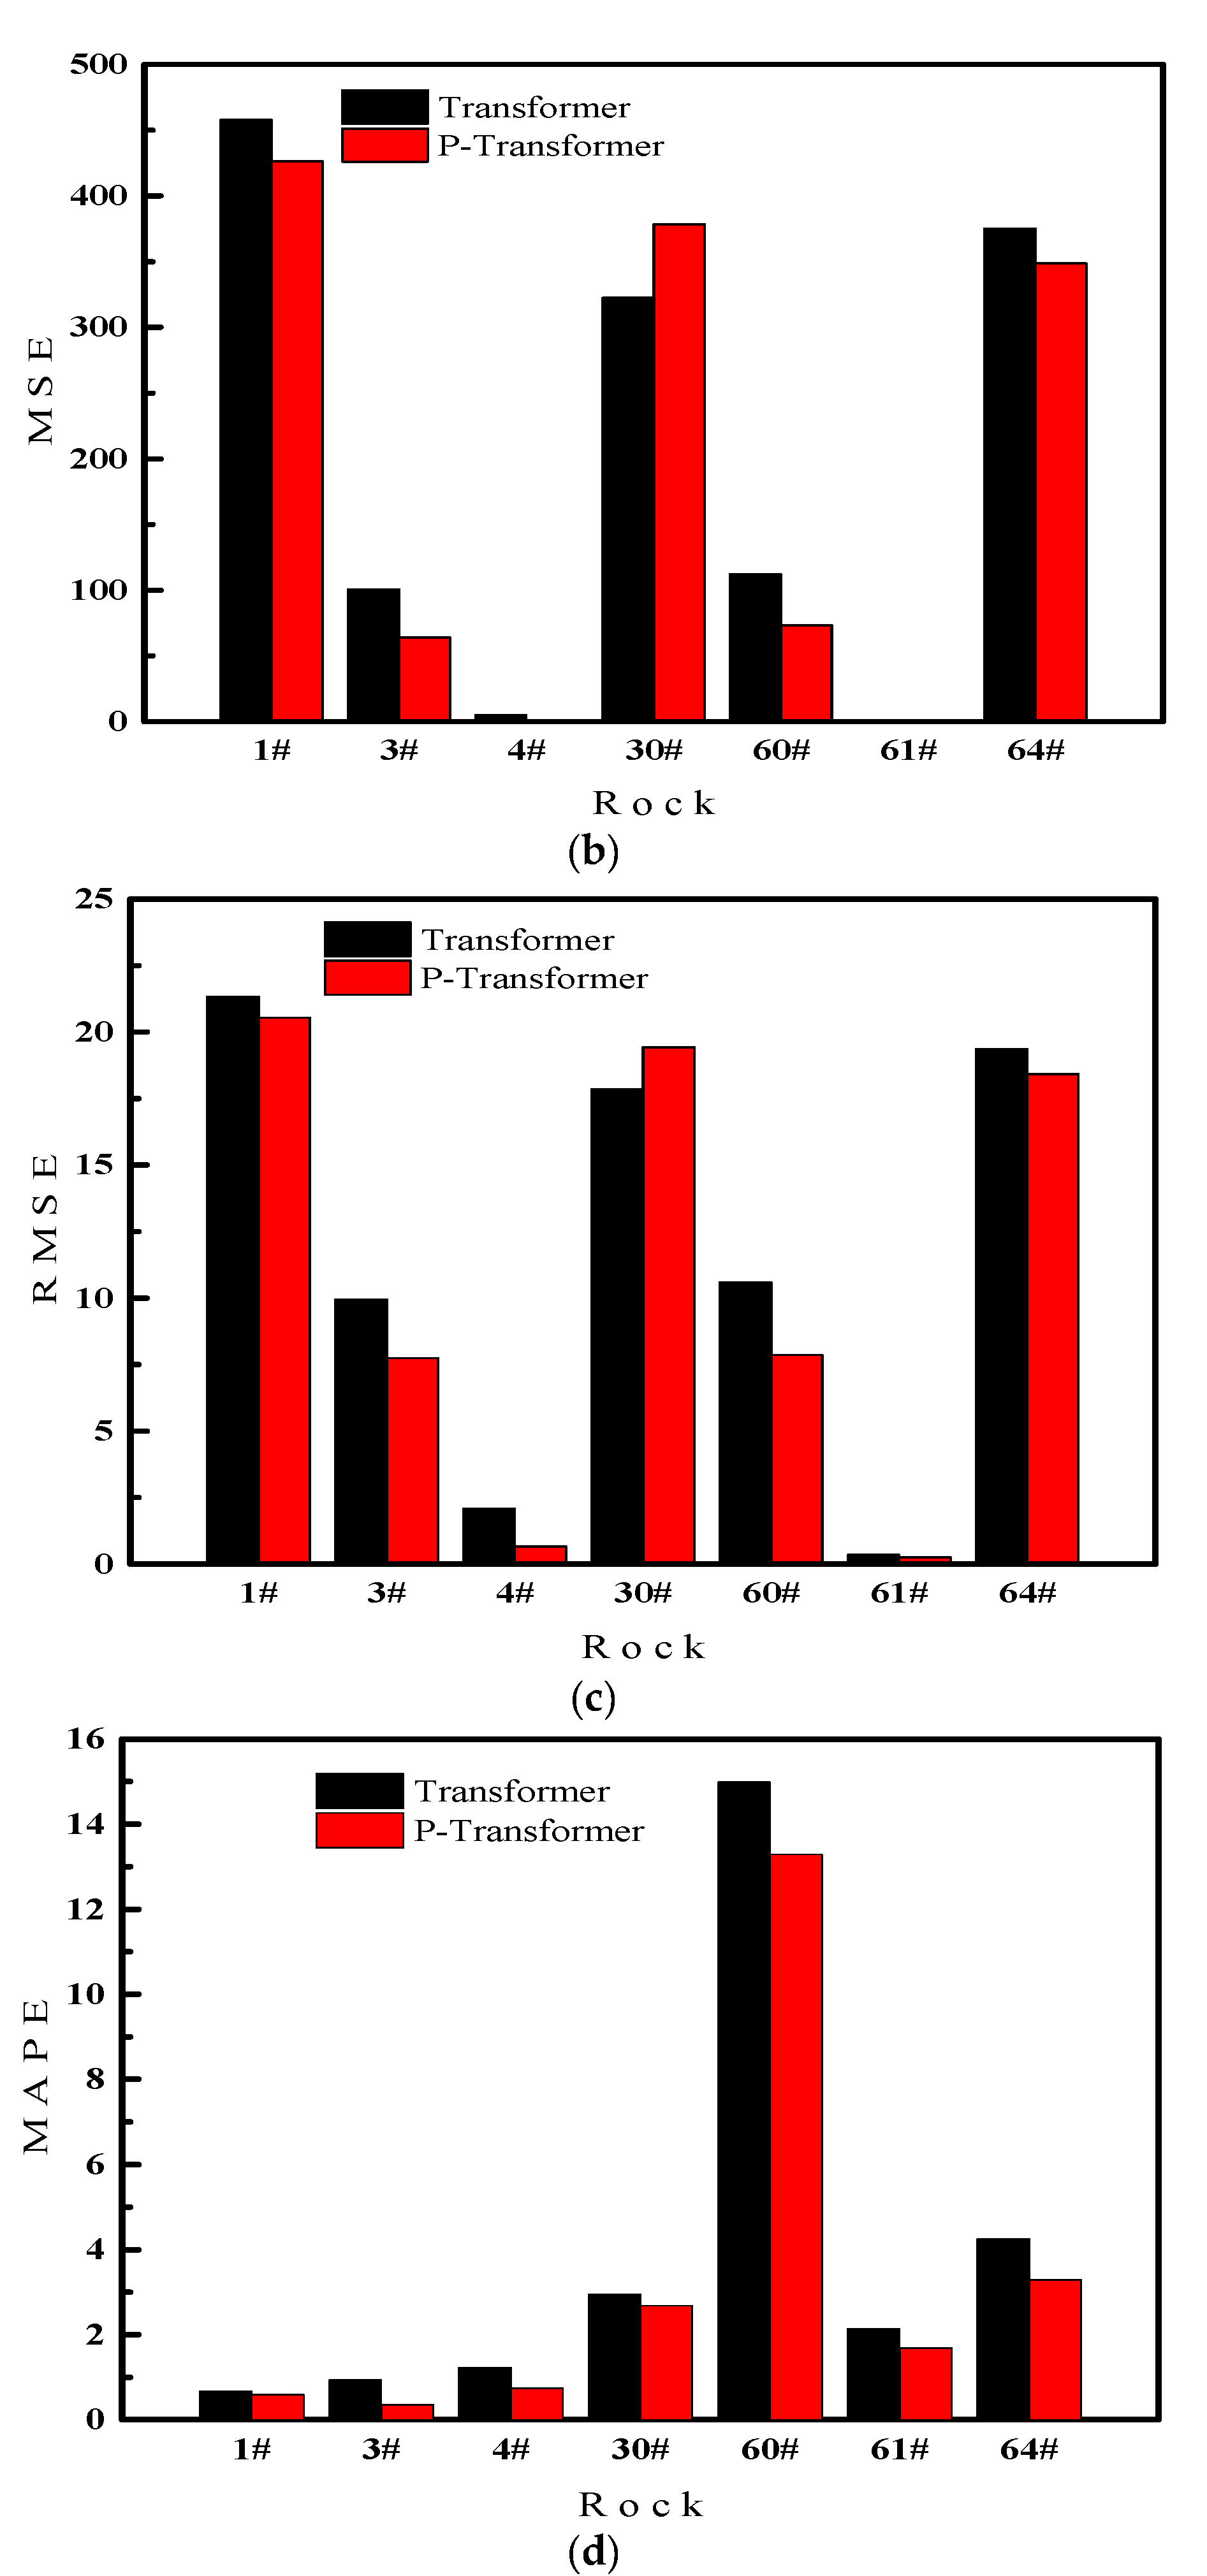
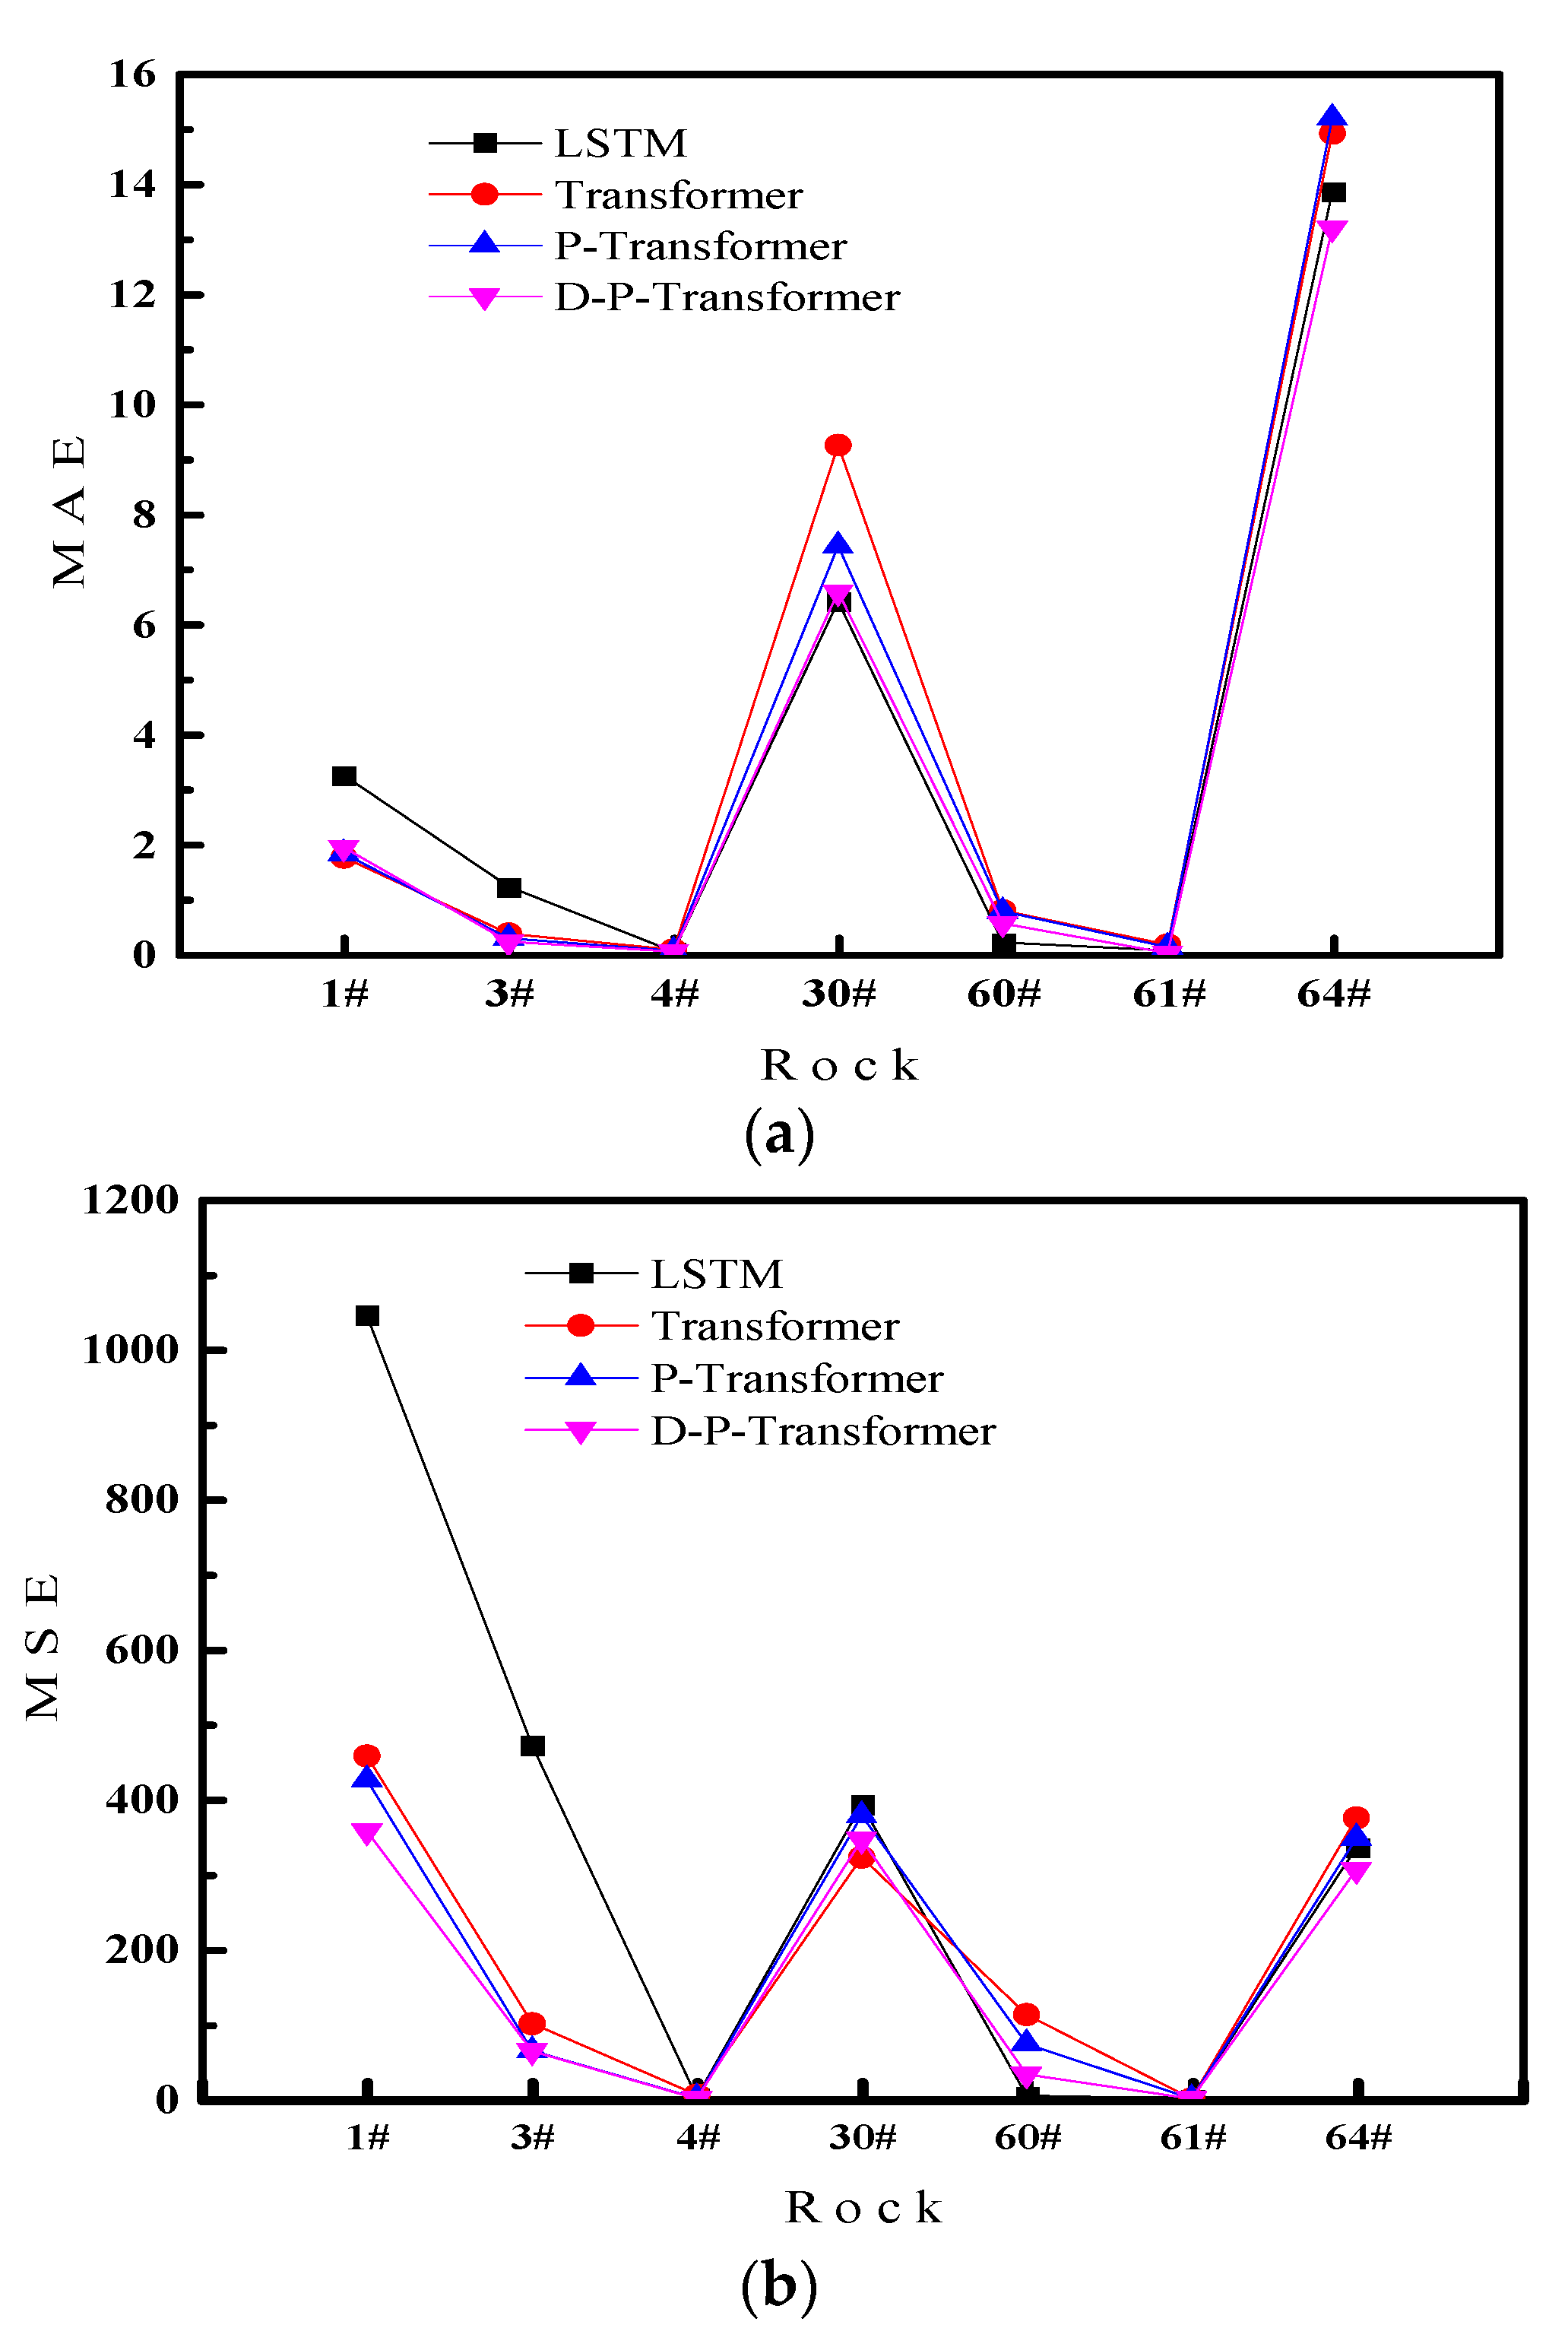
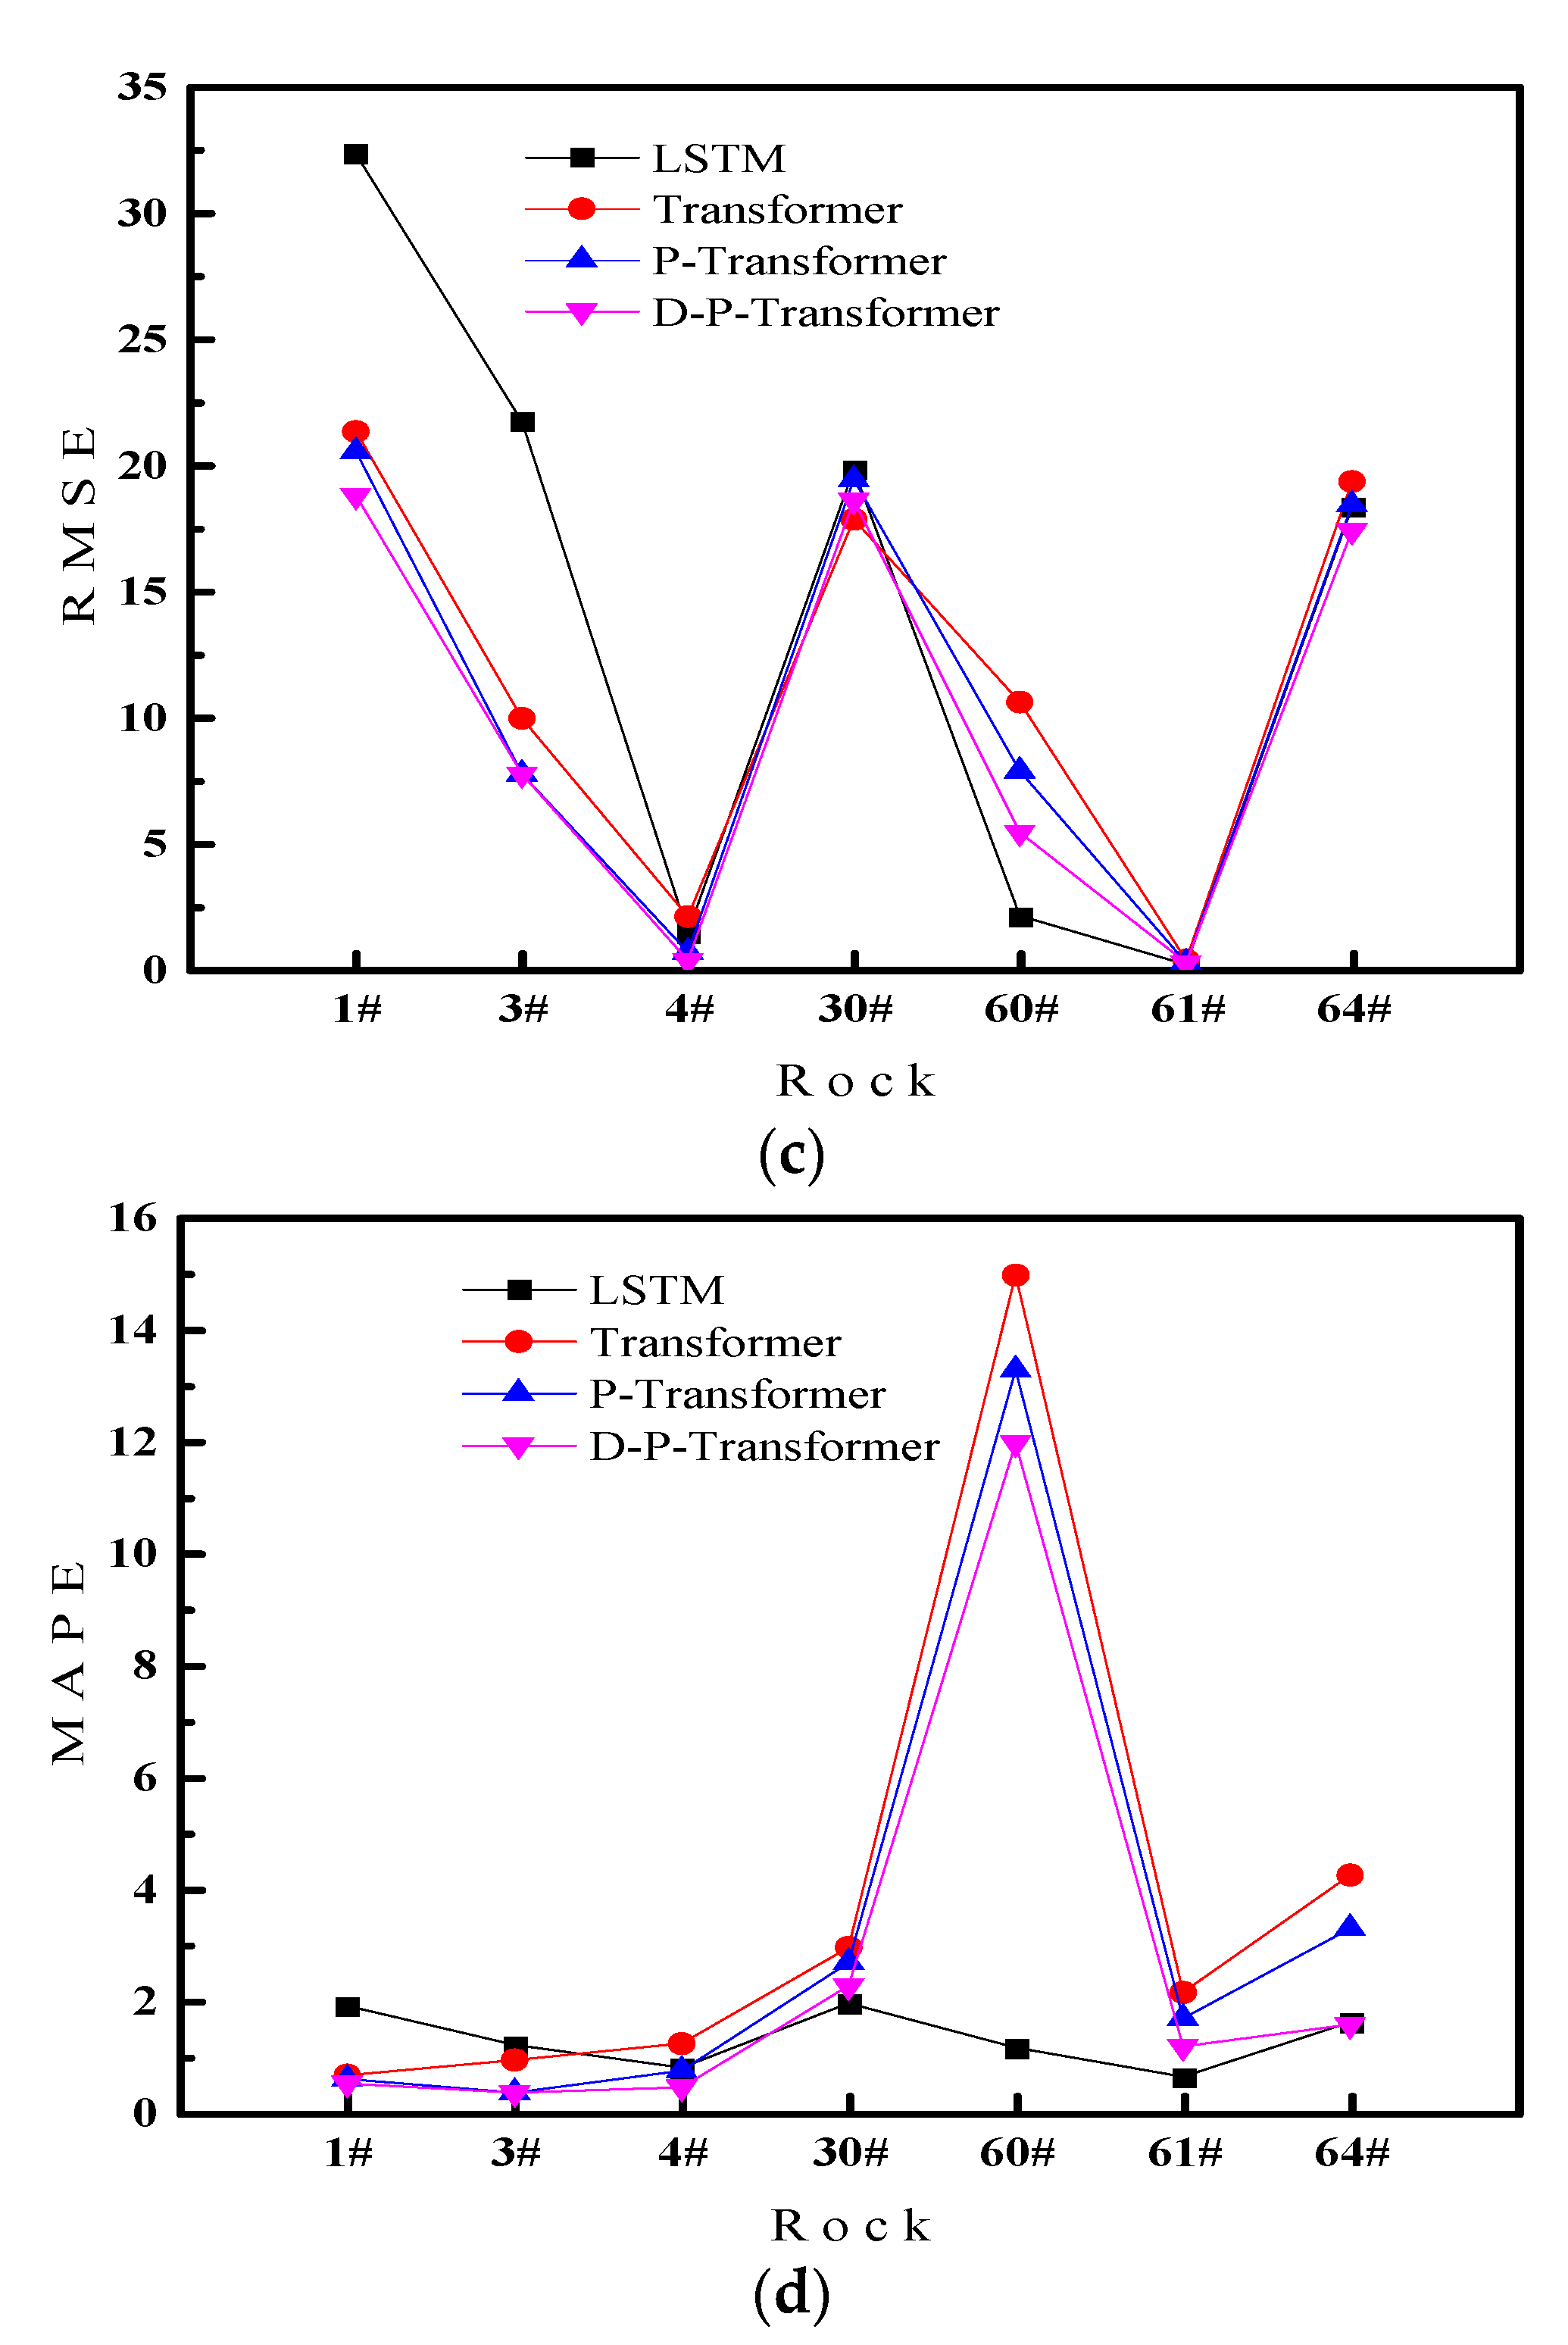
3.2. Results
3.3. Discussion
4. Conclusions
Author Contributions
Funding
Institutional Review Board Statement
Informed Consent Statement
Data Availability Statement
Acknowledgments
Conflicts of Interest
References
- He, X.-Q.; Zhou, C.; Song, D.-Z.; Li, Z.-L.; Cao, A.-Y.; He, S.-Q.; Khan, M. Mechanism and monitoring and early warning technology for rockburst in coal mines. Int. J. Miner. Met. Mater. 2021, 28, 1097–1111. [Google Scholar] [CrossRef]
- Wang, C.-L.; Chen, Z.; Liao, Z.-F.; Hou, X.-L.; Liu, J.-F.; Wang, A.-W.; Li, C.-F.; Qian, P.-F.; Li, G.-Y.; Lu, H. Experimental investigation on predicting precursory changes in entropy for dominant frequency of rockburst. J. Central South Univ. 2020, 27, 2834–2848. [Google Scholar] [CrossRef]
- Feng, G.; Lin, M.; Yu, Y.; Fu, Y. A Microseismicity-Based Method of Rockburst Intensity Warning in Deep Tunnels in the Initial Period of Microseismic Monitoring. Energies 2020, 13, 2698. [Google Scholar] [CrossRef]
- Cai, W.; Dou, L.; Si, G.; Cao, A.; He, J.; Liu, S. A principal component analysis/fuzzy comprehensive evaluation model for coal burst liability assessment. Int. J. Rock Mech. Min. Sci. 2016, 100, 62–69. [Google Scholar] [CrossRef]
- Mark, C. Coal bursts in the deep longwall mines of the United States. Int. J. Coal Sci. Technol. 2016, 3, 1–9. [Google Scholar] [CrossRef] [Green Version]
- Swolkień, J.; Szlązak, N. The Impact of the Coexistence of Methane Hazard and Rock-Bursts on the Safety of Works in Underground Hard Coal Mines. Energies 2020, 14, 128. [Google Scholar] [CrossRef]
- Zhang, Z.; Luo, C.; Zhang, H.; Gong, R. Rockburst Identification Method Based on Energy Storage Limit of Surrounding Rock. Energies 2020, 13, 343. [Google Scholar] [CrossRef] [Green Version]
- Zhang, H.; Ma, C.; Li, T. Quantitative Evaluation of the “Non-Enclosed” Microseismic Array: A Case Study in a Deeply Buried Twin-Tube Tunnel. Energies 2019, 12, 2006. [Google Scholar] [CrossRef] [Green Version]
- Cook, N.G.W. The basic mechanics of rockbursts. J. S. Afr. Inst. Min. Metall. 1963, 64, 71–81. Available online: https://hdl.handle.net/10520/AJA0038223X_3752 (accessed on 20 May 2022).
- He, M.C.; Zhao, F.; Cai, M.; Du, S. A Novel Experimental Technique to Simulate Pillar Burst in Laboratory. Rock Mech. Rock Eng. 2014, 48, 1833–1848. [Google Scholar] [CrossRef]
- Su, G.; Shi, Y.; Feng, X.; Jiang, J.; Zhang, J.; Jiang, Q. True-Triaxial Experimental Study of the Evolutionary Features of the Acoustic Emissions and Sounds of Rockburst Processes. Rock Mech. Rock Eng. 2017, 51, 375–389. [Google Scholar] [CrossRef]
- Shen, H.; Li, X.; Li, Q.; Wang, H. A method to model the effect of pre-existing cracks on P-wave velocity in rocks. J. Rock Mech. Geotech. Eng. 2019, 12, 493–506. [Google Scholar] [CrossRef]
- Sun, H.; Ma, L.; Konietzky, H.; Yuanyuan, D.; Wang, F. Characteristics and generation mechanisms of key infrared radiation signals during damage evolution in sandstone. Acta Geotech. 2021, 17, 1753–1763. [Google Scholar] [CrossRef]
- Wang, C.; Cao, C.; Liu, Y.; Li, C.; Li, G.; Lu, H. Experimental investigation on synergetic prediction of rockburst using the dominant-frequency entropy of acoustic emission. Nat. Hazards 2021, 108, 3253–3270. [Google Scholar] [CrossRef]
- Liu, X.; Wang, E. Study on characteristics of EMR signals induced from fracture of rock samples and their application in rockburst prediction in copper mine. J. Geophys. Eng. 2017, 15, 909–920. [Google Scholar] [CrossRef] [Green Version]
- Zhang, H.; Chen, L.; Chen, S.G.; Sun, J.C.; Yang, J.S. The Spatiotemporal Distribution Law of Microseismic Events and Rockburst Characteristics of the Deeply Buried Tunnel Group. Energies 2018, 11, 3257. [Google Scholar] [CrossRef] [Green Version]
- Zhang, Y.; Wu, W.; Yao, X.; Liang, P.; Sun, L.; Liu, X. Study on Spectrum Characteristics and Clustering of Acoustic Emission Signals from Rock Fracture. Circuits Syst. Signal Process. 2019, 39, 1133–1145. [Google Scholar] [CrossRef]
- Chu, Y.; Sun, H.; Zhang, D. Experimental study on evolution in the characteristics of permeability, deformation, and energy of coal containing gas under triaxial cyclic loading-unloading. Energy Sci. Eng. 2019, 7, 2112–2123. [Google Scholar] [CrossRef] [Green Version]
- Gao, L.; Gao, F.; Xing, Y.; Zhang, Z. An Energy Preservation Index for Evaluating the Rockburst Potential Based on Energy Evolution. Energies 2020, 13, 3636. [Google Scholar] [CrossRef]
- Zeng, A.; Yan, L.; Huang, Y.; Ren, E.; Liu, T.; Zhang, H. Intelligent Detection of Small Faults Using a Support Vector Machine. Energies 2021, 14, 6242. [Google Scholar] [CrossRef]
- Świątek, J.; Janoszek, T.; Cichy, T.; Stoiński, K. Computational Fluid Dynamics Simulations for Investigation of the Damage Causes in Safety Elements of Powered Roof Supports—A Case Study. Energies 2021, 14, 1027. [Google Scholar] [CrossRef]
- He, S.; Song, D.; Li, Z.; He, X.; Chen, J.; Zhong, T.; Lou, Q. Mechanism and Prevention of Rockburst in Steeply Inclined and Extremely Thick Coal Seams for Fully Mechanized Top-Coal Caving Mining and Under Gob Filling Conditions. Energies 2020, 13, 1362. [Google Scholar] [CrossRef] [Green Version]
- Chlebowski, D.; Burtan, Z. Mining-Induced Seismicity during Development Works in Coalbeds in the Context of Forecasts of Geomechanical Conditions. Energies 2021, 14, 6675. [Google Scholar] [CrossRef]
- Chen, Y.; Zhang, J.; Zhang, J.; Xu, B.; Zhang, L.; Li, W. Rockburst Precursors and the Dynamic Failure Mechanism of the Deep Tunnel: A Review. Energies 2021, 14, 7548. [Google Scholar] [CrossRef]
- Jamei, M.; Hasanipanah, M.; Karbasi, M.; Ahmadianfar, I.; Taherifar, S. Prediction of flyrock induced by mine blasting using a novel kernel-based extreme learning machine. J. Rock Mech. Geotech. Eng. 2021, 13, 1438–1451. [Google Scholar] [CrossRef]
- Xue, Y.; Bai, C.; Qiu, D.; Kong, F.; Li, Z. Predicting rockburst with database using particle swarm optimization and extreme learning machine. Tunn. Undergr. Space Technol. 2020, 98, 103287. [Google Scholar] [CrossRef]
- Wojtecki, L.; Iwaszenko, S.; Apel, D.B.; Cichy, T. An Attempt to Use Machine Learning Algorithms to Estimate the Rockburst Hazard in Underground Excavations of Hard Coal Mine. Energies 2021, 14, 6928. [Google Scholar] [CrossRef]
- Zhang, Y.; Li, J.T.; Su, Y.L.; Gao, K.L.; Liu, K.F. Big Data Analysis of Acoustic Emission Characteristics of Laizhou Granite Rockburst Experiment. Railw. Eng. 2021, 61, 84–87. Available online: https://kns-cnki-net-443.door.bucea.edu.cn/kcms/detail/detail.aspx?dbcode=CJFD&dbname=CJFDLAST2021&filename=TDJZ202108018&uniplatform=NZKPT&v=qvw_GJqepnF4lp1Idbihyftk2RD2u6lhAYyC3Uixkv0xldVZP9MXCfieSs98XuTF (accessed on 20 May 2022).
- Vaswani, A.; Shazeer, N.; Parmar, N.; Uszkoreit, J.; Jones, L.; Gomez, A.N.; Polosukhin, I. Attention is all you need. Adv. Neural Inf. Processing Syst. 2017, 30, 1–15. [Google Scholar] [CrossRef]
- Lu, W.; Gao, L.; Li, Z.; Wang, D.; Cao, H. Prediction of Long-Term Elbow Flexion Force Intervals Based on the Informer Model and Electromyography. Electronics 2021, 10, 1946. [Google Scholar] [CrossRef]
- Zhou, H.; Zhang, S.; Peng, J.; Zhang, S.; Li, J.; Xiong, H.; Zhang, W. Informer: Beyond efficient transformer for long sequence time-series forecasting. In Proceedings of the AAAI, virtually, 2–9 February 2021; p. 2. [Google Scholar] [CrossRef]
- Xie, C.; Nguyen, H.; Bui, X.-N.; Nguyen, V.-T.; Zhou, J. Predicting roof displacement of roadways in underground coal mines using adaptive neuro-fuzzy inference system optimized by various physics-based optimization algorithms. J. Rock Mech. Geotech. Eng. 2021, 13, 1452–1465. [Google Scholar] [CrossRef]


| Metric | Formula | Significance |
|---|---|---|
| Mean absolute error (MAE) | The ratio of the mean errors for all the predictions in the rockburst experiments | |
| Mean square error (MSE) | The ratio of the mean square errors for all the predictions in the rockburst experiments | |
| Root mean square error (RMSE) | The ratio of the root mean square errors for all the predictions in the rockburst experiments | |
| Mean absolute percentage error (MAPE) | The ratio of the mean percentage errors for all the predictions in the rockburst experiments |
| Method Metric | MAE | MSE | RMSE | MAPE | |||||
|---|---|---|---|---|---|---|---|---|---|
| Transformer | P-Transformer | Transformer | P-Transformer | Transformer | P-Transformer | Transformer | P-Transformer | ||
| 1# | Num.1 | 1.799 | 2.009 | 532.634 | 534.817 | 23.078 | 23.126 | 0.468 | 0.641 |
| Num.2 | 1.732 | 1.737 | 477.107 | 415.467 | 21.842 | 20.383 | 0.880 | 0.567 | |
| Num.3 | 1.736 | 1.737 | 364.028 | 328.099 | 19.080 | 18.114 | 0.652 | 0.574 | |
| 3# | Num.1 | 0.513 | 0.303 | 135.020 | 97.976 | 11.620 | 9.898 | 1.141 | 0.417 |
| Num.2 | 0.439 | 0.427 | 97.799 | 69.145 | 9.889 | 8.315 | 1.015 | 0.494 | |
| Num.3 | 0.143 | 0.132 | 69.077 | 25.009 | 8.311 | 5.001 | 0.656 | 0.153 | |
| 4# | Num.1 | 0.075 | 0.050 | 5.960 | 0.948 | 2.441 | 0.974 | 1.050 | 0.318 |
| Num.2 | 0.099 | 0.088 | 7.961 | 0.951 | 2.822 | 0.975 | 1.323 | 1.015 | |
| Num.3 | 0.063 | 0.030 | 0.950 | 0.001 | 0.975 | 0.032 | 1.321 | 0.906 | |
| 30# | Num.1 | 9.076 | 7.486 | 400.435 | 430.314 | 20.011 | 20.744 | 1.163 | 1.967 |
| Num.2 | 10.486 | 7.595 | 334.541 | 370.259 | 18.290 | 19.242 | 2.699 | 2.588 | |
| Num.3 | 8.194 | 7.194 | 232.350 | 334.541 | 15.243 | 18.290 | 5.000 | 3.486 | |
| 60# | Num.1 | 0.750 | 0.807 | 111.434 | 112.391 | 10.556 | 10.601 | 14.878 | 13.231 |
| Num.2 | 0.775 | 0.763 | 111.704 | 98.588 | 10.569 | 9.929 | 14.761 | 12.591 | |
| Num.3 | 0.849 | 0.754 | 113.671 | 9.200 | 10.662 | 3.033 | 15.326 | 14.045 | |
| 61# | Num.1 | 0.214 | 0.262 | 0.123 | 0.140 | 0.351 | 0.375 | 2.049 | 1.200 |
| Num.2 | 0.109 | 0.084 | 0.093 | 0.004 | 0.305 | 0.064 | 1.978 | 1.194 | |
| Num.3 | 0.179 | 0.041 | 0.152 | 0.098 | 0.389 | 0.314 | 2.405 | 1.136 | |
| 64# | Num.1 | 19.100 | 19.996 | 414.763 | 479.841 | 20.366 | 21.905 | 3.672 | 4.370 |
| Num.2 | 14.573 | 14.559 | 357.963 | 352.919 | 18.920 | 18.786 | 2.667 | 2.448 | |
| Num.3 | 11.114 | 11.072 | 352.790 | 212.707 | 18.783 | 14.584 | 6.403 | 3.057 | |
| Method Metric | MAE | MSE | RMSE | MAPE | |||||
|---|---|---|---|---|---|---|---|---|---|
| Transformer | D-P-Transformer | Transformer | D-P-Transformer | Transformer | D-P-Transformer | Transformer | D-P-Transformer | ||
| 1# | Num.1 | 1.799 | 2.320 | 532.634 | 435.933 | 23.078 | 20.879 | 0.468 | 0.553 |
| Num.2 | 1.732 | 1.768 | 477.107 | 377.680 | 21.842 | 19.434 | 0.880 | 0.609 | |
| Num.3 | 1.736 | 1.728 | 364.028 | 258.550 | 19.080 | 16.079 | 0.652 | 0.391 | |
| 3# | Num.1 | 0.513 | 0.222 | 135.020 | 97.774 | 11.620 | 9.888 | 1.141 | 0.352 |
| Num.2 | 0.439 | 0.305 | 97.799 | 69.014 | 9.889 | 8.307 | 1.015 | 0.457 | |
| Num.3 | 0.143 | 0.134 | 69.077 | 25.005 | 8.311 | 5.000 | 0.656 | 0.237 | |
| 4# | Num.1 | 0.075 | 0.048 | 5.960 | 0.676 | 2.441 | 0.822 | 1.050 | 0.163 |
| Num.2 | 0.099 | 0.058 | 7.961 | 0.021 | 2.822 | 0.144 | 1.323 | 0.839 | |
| Num.3 | 0.063 | 0.010 | 0.950 | 0.001 | 0.975 | 0.012 | 1.321 | 0.339 | |
| 30# | Num.1 | 9.076 | 7.234 | 400.435 | 356.908 | 20.011 | 18.892 | 1.163 | 2.515 |
| Num.2 | 10.486 | 7.255 | 334.541 | 356.908 | 18.290 | 18.892 | 2.699 | 2.167 | |
| Num.3 | 8.194 | 5.255 | 232.350 | 324.450 | 15.243 | 18.013 | 5.000 | 2.106 | |
| 60# | Num.1 | 0.750 | 0.787 | 111.434 | 53.757 | 10.556 | 7.332 | 14.878 | 15.419 |
| Num.2 | 0.775 | 0.433 | 111.704 | 35.206 | 10.569 | 5.933 | 14.761 | 11.093 | |
| Num.3 | 0.849 | 0.577 | 113.671 | 8.839 | 10.662 | 2.973 | 15.326 | 9.428 | |
| 61# | Num.1 | 0.214 | 0.006 | 0.123 | 0.101 | 0.351 | 0.317 | 2.049 | 1.200 |
| Num.2 | 0.109 | 0.004 | 0.093 | 0.005 | 0.305 | 0.069 | 1.978 | 1.194 | |
| Num.3 | 0.179 | 0.035 | 0.152 | 0.098 | 0.389 | 0.313 | 2.405 | 1.136 | |
| 64# | Num.1 | 19.100 | 15.771 | 414.763 | 353.194 | 20.366 | 18.793 | 3.672 | 1.634 |
| Num.2 | 14.573 | 14.071 | 357.963 | 212.835 | 18.920 | 14.589 | 2.667 | 1.480 | |
| Num.3 | 11.114 | 9.759 | 352.790 | 353.166 | 18.783 | 18.793 | 6.403 | 1.602 | |
| Methods/Metrics | MAE | MSE | RMSE | MAPE |
|---|---|---|---|---|
| HGSO-ANFIS | 19.975 | 1020.100 | 31.939 | 1.197 |
| LSTM | 2.233 | 160.935 | 12.686 | 1.337 |
| Transformer | 2.466 | 183.095 | 11.964 | 2.303 |
| P-Transformer | 2.089 | 143.137 | 10.820 | 1.799 |
| D-P-Transformer | 1.863 | 97.852 | 9.892 | 1.195 |
Publisher’s Note: MDPI stays neutral with regard to jurisdictional claims in published maps and institutional affiliations. |
© 2022 by the authors. Licensee MDPI, Basel, Switzerland. This article is an open access article distributed under the terms and conditions of the Creative Commons Attribution (CC BY) license (https://creativecommons.org/licenses/by/4.0/).
Share and Cite
Zhang, Y.; Li, J.; Liu, D.; Chen, G.; Dou, J. D-P-Transformer: A Distilling and Probsparse Self-Attention Rockburst Prediction Method. Energies 2022, 15, 3959. https://doi.org/10.3390/en15113959
Zhang Y, Li J, Liu D, Chen G, Dou J. D-P-Transformer: A Distilling and Probsparse Self-Attention Rockburst Prediction Method. Energies. 2022; 15(11):3959. https://doi.org/10.3390/en15113959
Chicago/Turabian StyleZhang, Yu, Jitao Li, Dongqiao Liu, Guangshu Chen, and Jiaming Dou. 2022. "D-P-Transformer: A Distilling and Probsparse Self-Attention Rockburst Prediction Method" Energies 15, no. 11: 3959. https://doi.org/10.3390/en15113959
APA StyleZhang, Y., Li, J., Liu, D., Chen, G., & Dou, J. (2022). D-P-Transformer: A Distilling and Probsparse Self-Attention Rockburst Prediction Method. Energies, 15(11), 3959. https://doi.org/10.3390/en15113959