1. Introduction
When the battery unit of the photovoltaic module is shaded by local shadow, its internal PN junction works in the reverse bias state. At this time, the reverse leakage current of the normal unit is small, because of the large shunt resistance. However, there is also a fault module. Due to the existence of crystal defects, cracks and other fault areas in some of the internal units, the conductivity of the fault point is high, which is equivalent to the existence of equivalent parallel low resistance [
1] and provides a path for the reverse leakage current. At this time, these areas will produce a serious heating phenomenon, which is called the low resistance hot-spot [
2,
3]. The low resistance hot-spot unit consumes the output power of the normal battery unit and generates a large amount of heat, which in turn generates local high-temperature areas on the surface of the photovoltaic panel and causes irreversible damage, such as aging and cracking. In recent years, with the continuous development of the photovoltaic power generation industry and the application and popularization of photovoltaic modules, more and more fault types were found and studied, including low resistance hot-spot faults. The low resistance hot-spot fault is different from the traditional hot-spot fault. The fault unit has a “low resistance” area. When it is shaded by local shadow and biased reversely, due to the strong current-passing-capacity of this area, it will produce a serious heating phenomenon. Generally, for a single photovoltaic module, the temperature difference between the central point temperature of the hot-spot and the temperature of normal units is 6–10 °C, while the temperature difference between the central point temperature of the hot-spot and the temperature of normal units can reach more than 60 °C. For the photovoltaic module string system, this temperature difference can reach more than 100 °C, which is easy to reach the maximum withstand temperature of the crystalline silicon photovoltaic module, resulting in the destruction of the structure and performance of the module. Therefore, the harm caused by low resistance hot-spot faults cannot be underestimated.
Generally, in order to improve the output efficiency of the photovoltaic system, in addition to using the DC–DC conversion circuit in the hardware to maintain a stable system output, in software, the control algorithm can be improved to realize the maximum power point tracking (MPPT) [
4]. The principle of the traditional MPPT control algorithm is simple and easy to implement, but also can fall into the local maximum power point easily. An intelligent MPPT control algorithm and a combined MPPT control algorithm can accurately track the global maximum power point and realize efficient system power output, but when the low resistance hot-spot unit is partially shaded, these algorithms cannot control the thermal power, and finally, the safety of the system will be affected. For the traditional hot-spot phenomenon, the common method is to add bypass diodes [
5]. When the reverse voltage of the shielding unit is too large, the corresponding diode turns on in time to reduce the heating of the shielding unit, but it is not applicable to the low resistance hot-spot, because there is a possibility of bypass diode failure [
6].
Therefore, many scholars have put forward more feasible control and optimization schemes. Ghanbari, T. [
3] and Poon, J. [
7] proposed hot-spot fault monitoring methods based on electrical parameters, which collect relevant parameters by building peripheral circuits, and establish a database to obtain the fault characteristics. Its implementation principle is simple, but if it is applied to large-scale photovoltaic power plants, it will require a large number of sensors and large databases, with high costs and low efficiency. Chen, J. [
8], Sha, W.L. [
9], Xi, Z.P. [
10] proposed a monitoring scheme based on infrared imaging and image processing. This scheme is intuitive, but it has a high cost and can be greatly affected by environmental conditions, such as the weather. So, it is only suitable for small photovoltaic power stations [
11]. It also puts forward high requirements for the pixels of infrared imaging, relies on a reliable computer vision algorithm to accurately identify the image information, and cannot deeply understand the causes of the hot-spot faults and the electrical characteristics of photovoltaic modules. Moreover, these schemes focus more on the detection of hot-spots, and have not mentioned how to suppress the hot-spot faults, and have not realized the faulty operation of the system. Dhimish, M. [
12] and Chaibi, Y. [
13] proposed the data calculation monitoring method, which uses the on-line monitoring data for calculation and processing. The hot-spot can be judged by finding the parameters characterizing the hot-spot. This method can be carried out without affecting the normal operation of the system, but it is difficult to form a unified standard, and the parameter threshold needs to be recalculated between power stations, due to different capacity, environment, and other conditions [
11]. Wang, Y.D. [
14] proposed a voltage type hot-spot fault diagnosis system for a single photovoltaic module, which uses a projector as the illumination light source, and each battery unit is connected with a bypass diode in parallel, which can accurately locate the hot-spot unit. However, PV modules need to be specially customized and the detection process is troublesome, and it is difficult to summarize a unified hot-spot criterion between different photovoltaic modules. So, the diagnosis system is only suitable for laboratory research.
In this paper, a simulation model of low resistance hot-spot fault module based on Simulink platform is built, and its output characteristics are studied and characteristic points are found. A low resistance hot-spot diagnosis and suppression control algorithm based on I-U characteristic analysis is proposed. The algorithm mainly focuses on low resistance hot-spot fault diagnosis, supplemented by the conductivity increment-global comparison algorithm (INC-GCA). By optimizing the working process of the hot-spot fault module, the problem that improving the output efficiency and protecting the photovoltaic module are difficult to meet at the same time is solved, so as to ensure the power generation efficiency of the photovoltaic power station and reduce the harm caused by hot-spot faults. Finally, the experiments are carried out and the feasibility of this algorithm is verified.
2. Theoretical Background
2.1. Equivalent Circuit Model
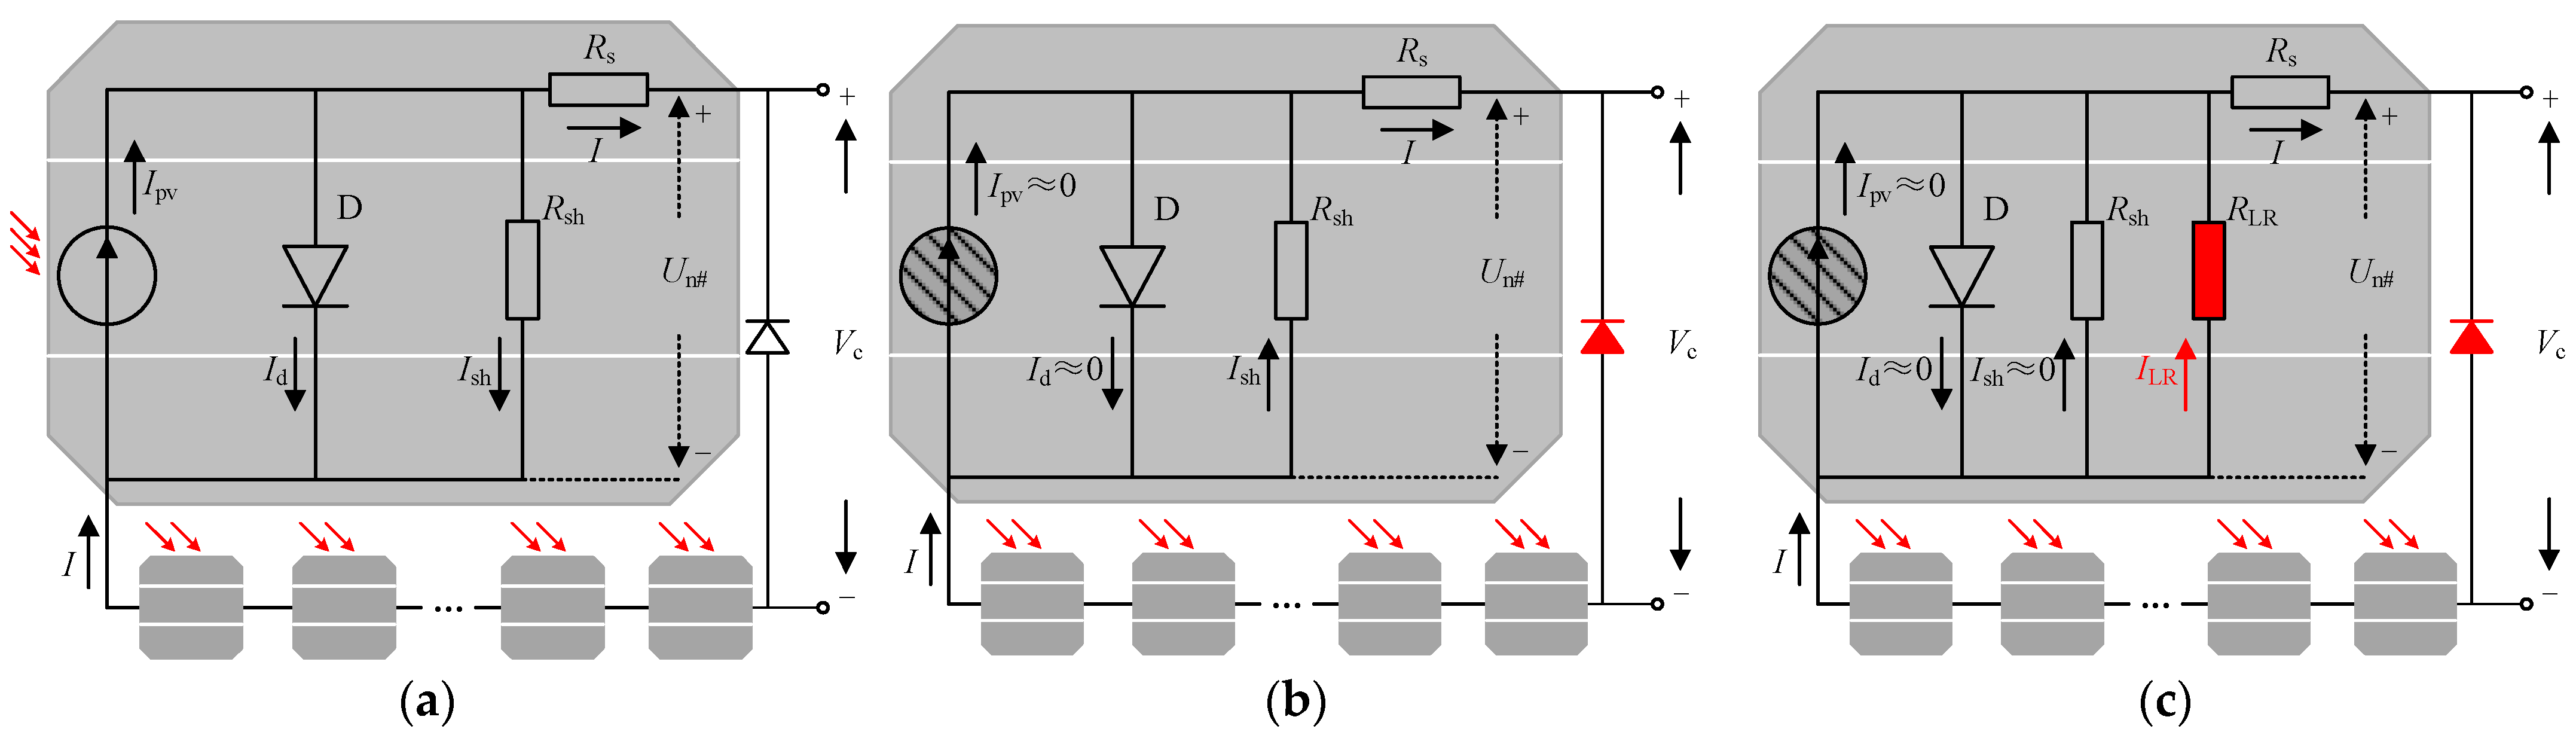
The simplified model of an unshaded hot-spot unit is shown in
Figure 1, which mainly includes five parts: constant current source
Ipv; parallel diode D; series resistance
Rs; shunt resistance
Rsh; and equivalent hot-spot low resistance
RLR. Among them, the series low resistance
Rs is approximately 0, the shunt large resistance
Rsh is thousands of ohms, and the equivalent hot-spot low resistance
RLR is usually ten to tens of ohms. The arrow direction in the figure is the reference direction of current.
According to the equivalent circuit model, the output current
I of the low resistance hot-spot battery unit can be expressed as:
When the battery unit is partially shielded, for simple calculation and analysis, ignore the current
Ish flowing through the shunt resistance
Rsh, approximate the series resistance
Rs to 0, and approximate the photo-generated current
Ipv to the short-circuit current
Isc. Finally, obtain the simplified expression of the output current of the low resistance hot-spot battery unit as:
The equivalent model of the battery unit in the low resistance hot-spot area is shown in
Figure 2. Compared with the normal battery unit, it is obvious that there is an equivalent low resistance in parallel between the P-type region and the N-type region of the low resistance hot-spot battery unit, which is caused by the multistage trap-assisted tunneling effect in the defect or change region of the internal physical structure of the low resistance hot-spot battery unit. The equivalent low resistance provides a “shortcut” for the current flow between the P-type region and the N-type region. When the current flowing through the battery unit is less than its short-circuit current, the battery unit is in normal working state, and it is forward biased. There is almost no current flowing through the low resistance. When the current flowing through the battery unit is greater than its short-circuit current, the battery unit can only accommodate its short-circuit current at most. The excess current will flow through its parallel resistance and generate a reverse voltage, so the battery unit is reverse biased. At this time, if it is a normal unit, the current is limited due to the large parallel resistance, so there will be a certain amount of heating, but the heating is less, which is the traditional hot-spot phenomenon. However, if it is a low resistance hot-spot unit at this time, due to the stronger current trafficability in the equivalent low resistance area, most of the current will pass through the equivalent low resistance, according to the current shunt formula, which confirms the conclusion that the above-mentioned equivalent low resistance provides a “shortcut” for the current flow. In this case, the photovoltaic module will produce serious heating.
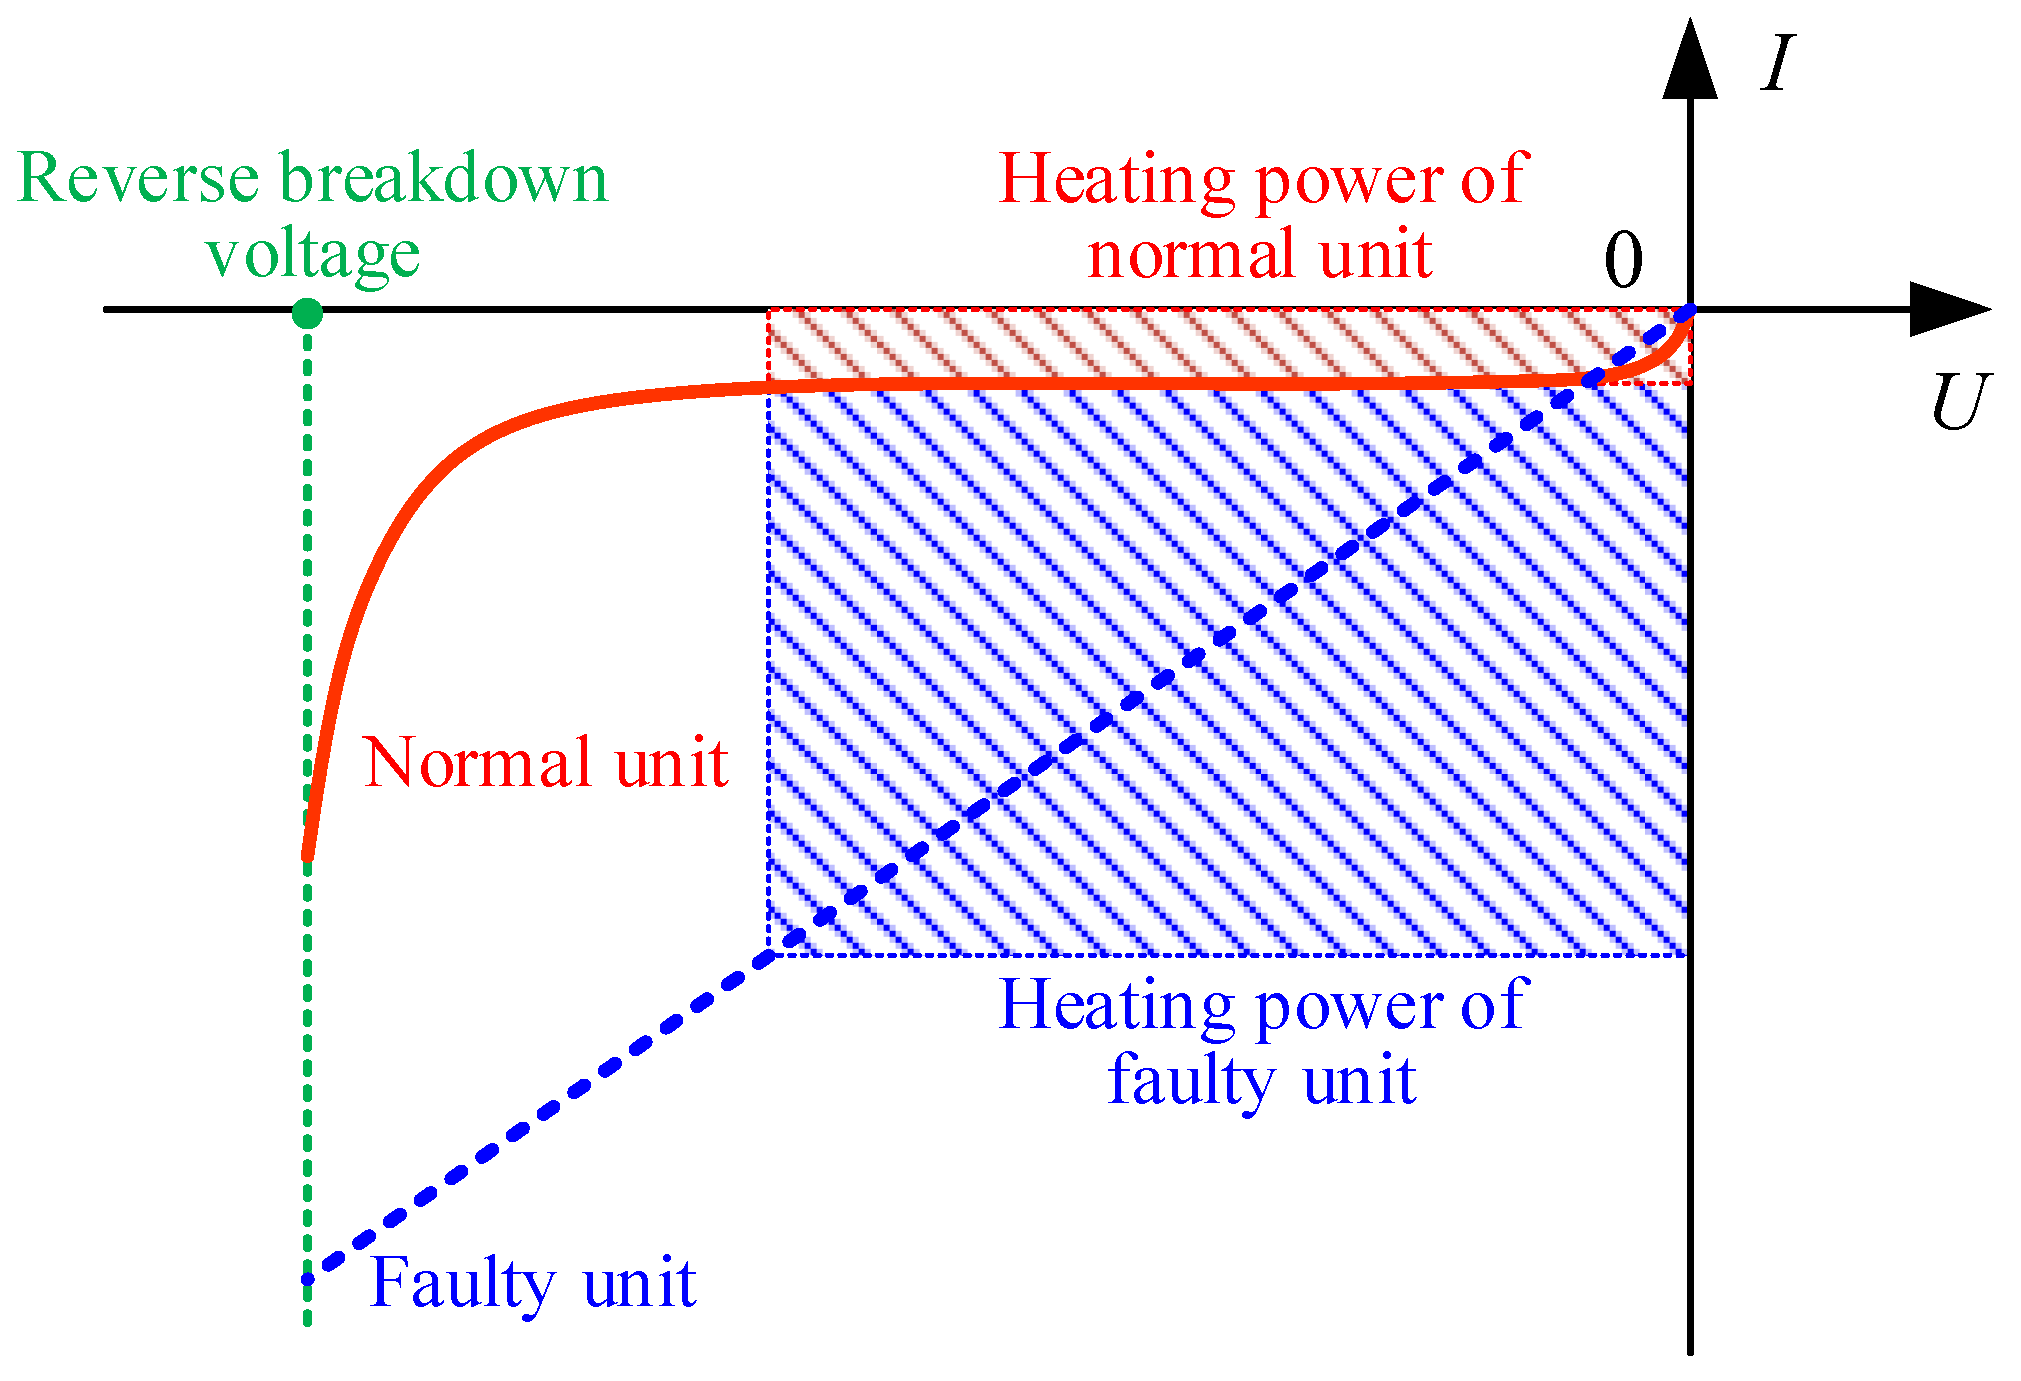
The output I-U characteristics of the battery unit in the reverse bias state are shown in
Figure 3, in which the blue dotted line represents the reverse characteristic curve of the low resistance hot-spot faulty unit, the red solid line represents the reverse characteristic curve of the normal battery unit, the grid area represents the corresponding heating power under a certain reverse voltage, and the green dotted line represents the reverse bias voltage. It can be seen from the Figure that the reverse output characteristics of normal battery units are similar to diodes. There will be a small reverse current under the action of reverse voltage, and the current basically remains unchanged within a certain voltage range, so its heating power is small. The reverse output characteristic of the low resistance hot-spot unit is similar to that of resistance, and the resistance value is small. The current is positively proportional to the reverse voltage. At this time, its heating power is large. From the area of the grid area in the figure, it is obvious that when the low resistance hot-spot fault battery unit is shaded by local shadow and reversely biased, its heating power is much higher than that of the normal module, and the high temperature generated will cause serious damage to the photovoltaic module. Therefore, it is necessary to suppress the “current loss” flowing through the low resistance hot-spot area.
Compared with the normal battery unit, the equivalent circuit model of the low resistance hot-spot battery unit has one more parallel low resistance, so the expression of the output current of the normal battery unit calculated from Equation (2) is:
According to Equation (3), the output voltage of the normal battery unit is:
Here, α is a computable constant; α = nkT/q; I0 is reverse saturation current (A); q is electronic quantity (C); n is diode factor; k is Boltzmann constant (J/K); and T is absolute temperature (K).
Take the normal photovoltaic unit shown in
Figure 4a,b as the research object, when the photovoltaic unit in
Figure 4a is under uniform light, all of its internal battery units are in normal working state. Taking the n# battery unit in the figure as an example, its output voltage equation is
Because the resistance of the series resistance is small, but the voltage generated by the photovoltaic effect is large, the value of
Un# is positive at this time. When the n# battery unit is shaded, as shown in
Figure 4b, the
Ipv drops to 0, so that the current generated by the other units flows through
Rsh. At this time, the direction of the current
Ish is reversed. Because of
Un# = −
I·
Rsh −
I·
Rs, and
I > 0, so the value of
Un# is negative. Taking the photovoltaic unit composed of 18 battery units with the parallel bypass diodes as an example, according to the order of magnitude of series resistance value and parallel resistance value, set the values of
Rs and
Rsh to 2 Ω and 1000 Ω, respectively, then when the bypass diode reaches the critical conduction state, i.e., |
Un#|−17 × 0.6 V = 0.7 V, the calculation result is
I = 10 mA, that is, when the overall output current of the photovoltaic unit is the order of magnitude of 10 mA, the reverse bias generated by the shaded battery unit can turn on the bypass diode [
15].
However, in the low resistance hot-spot unit shown in
Figure 4c, the above working process is different. Because the resistance of
RLR is very small, the trafficability of current passing through
RLR is strong. Therefore, the reverse bias voltage generated by the hot-spot battery unit is low, and the bypass diode cannot work immediately when the photovoltaic module is shaded. With the increase in the current on the
RLR, the reverse voltage gradually increases and turns on the diode. In extreme cases, because the resistance of
RLR is very low or the external light intensity is not high, the bypass diode may be unable to turn on, so the bypass diode may sometimes lose its function.
2.2. Failure Mechanism
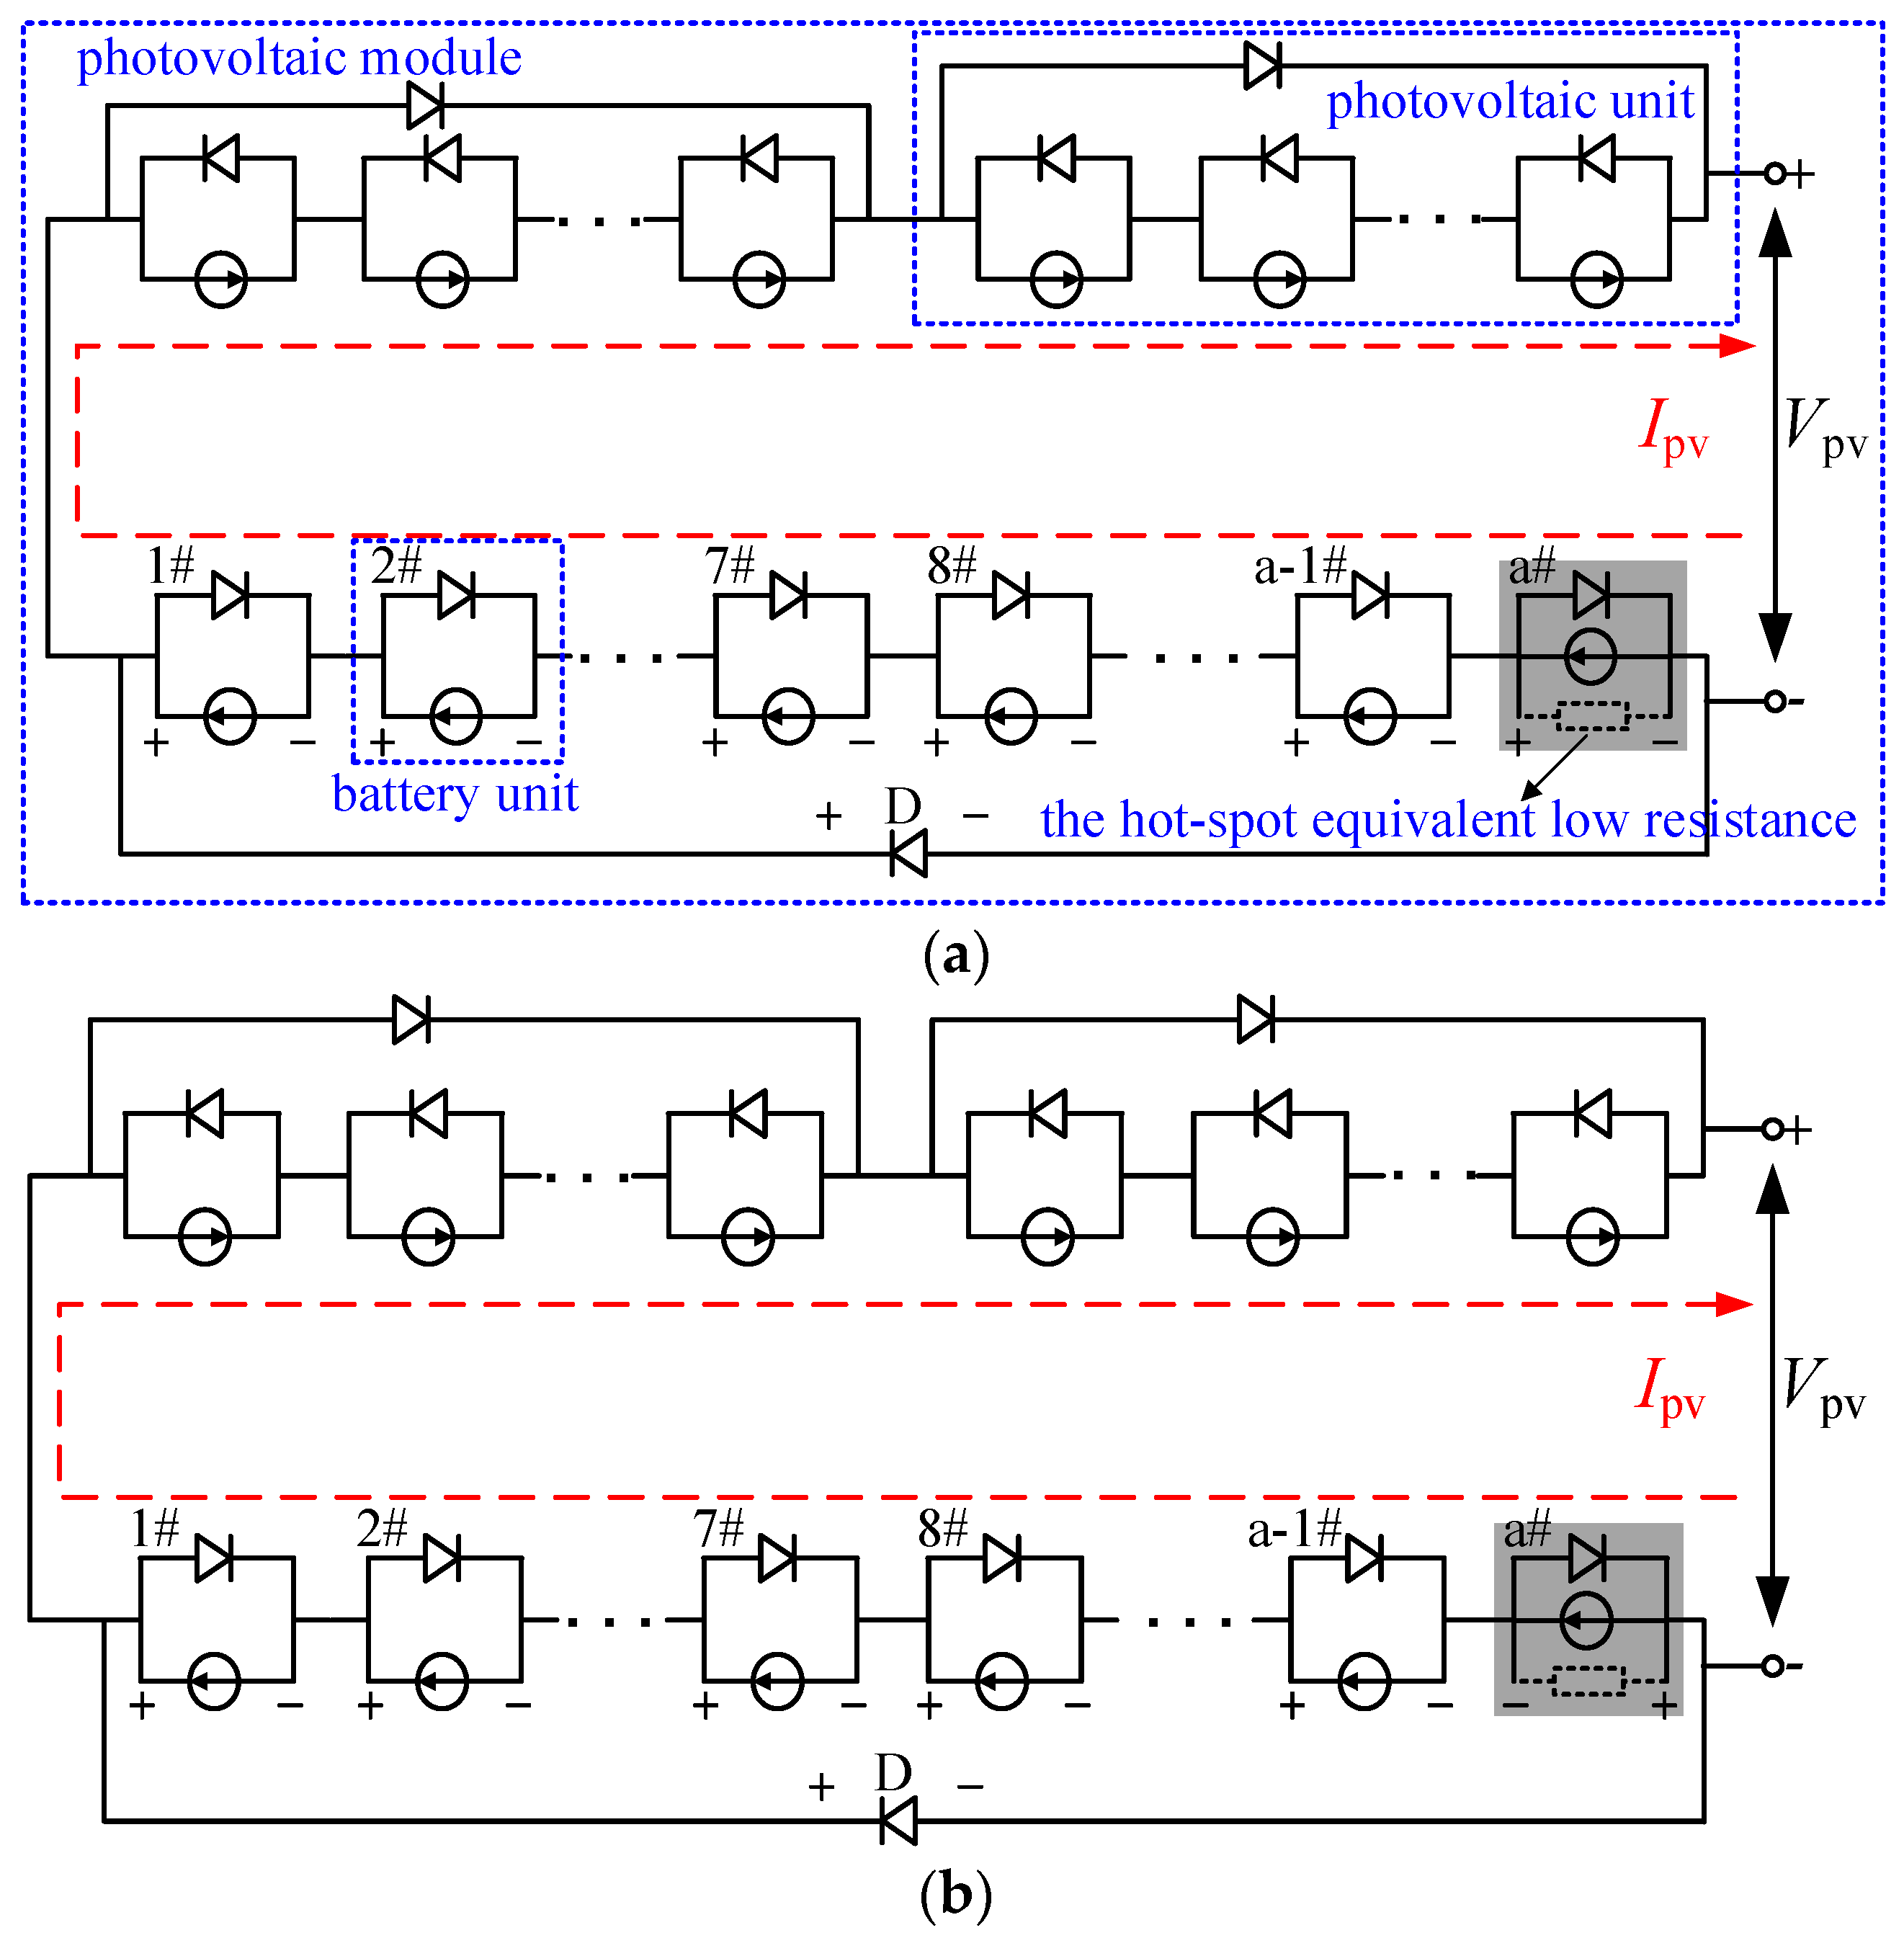
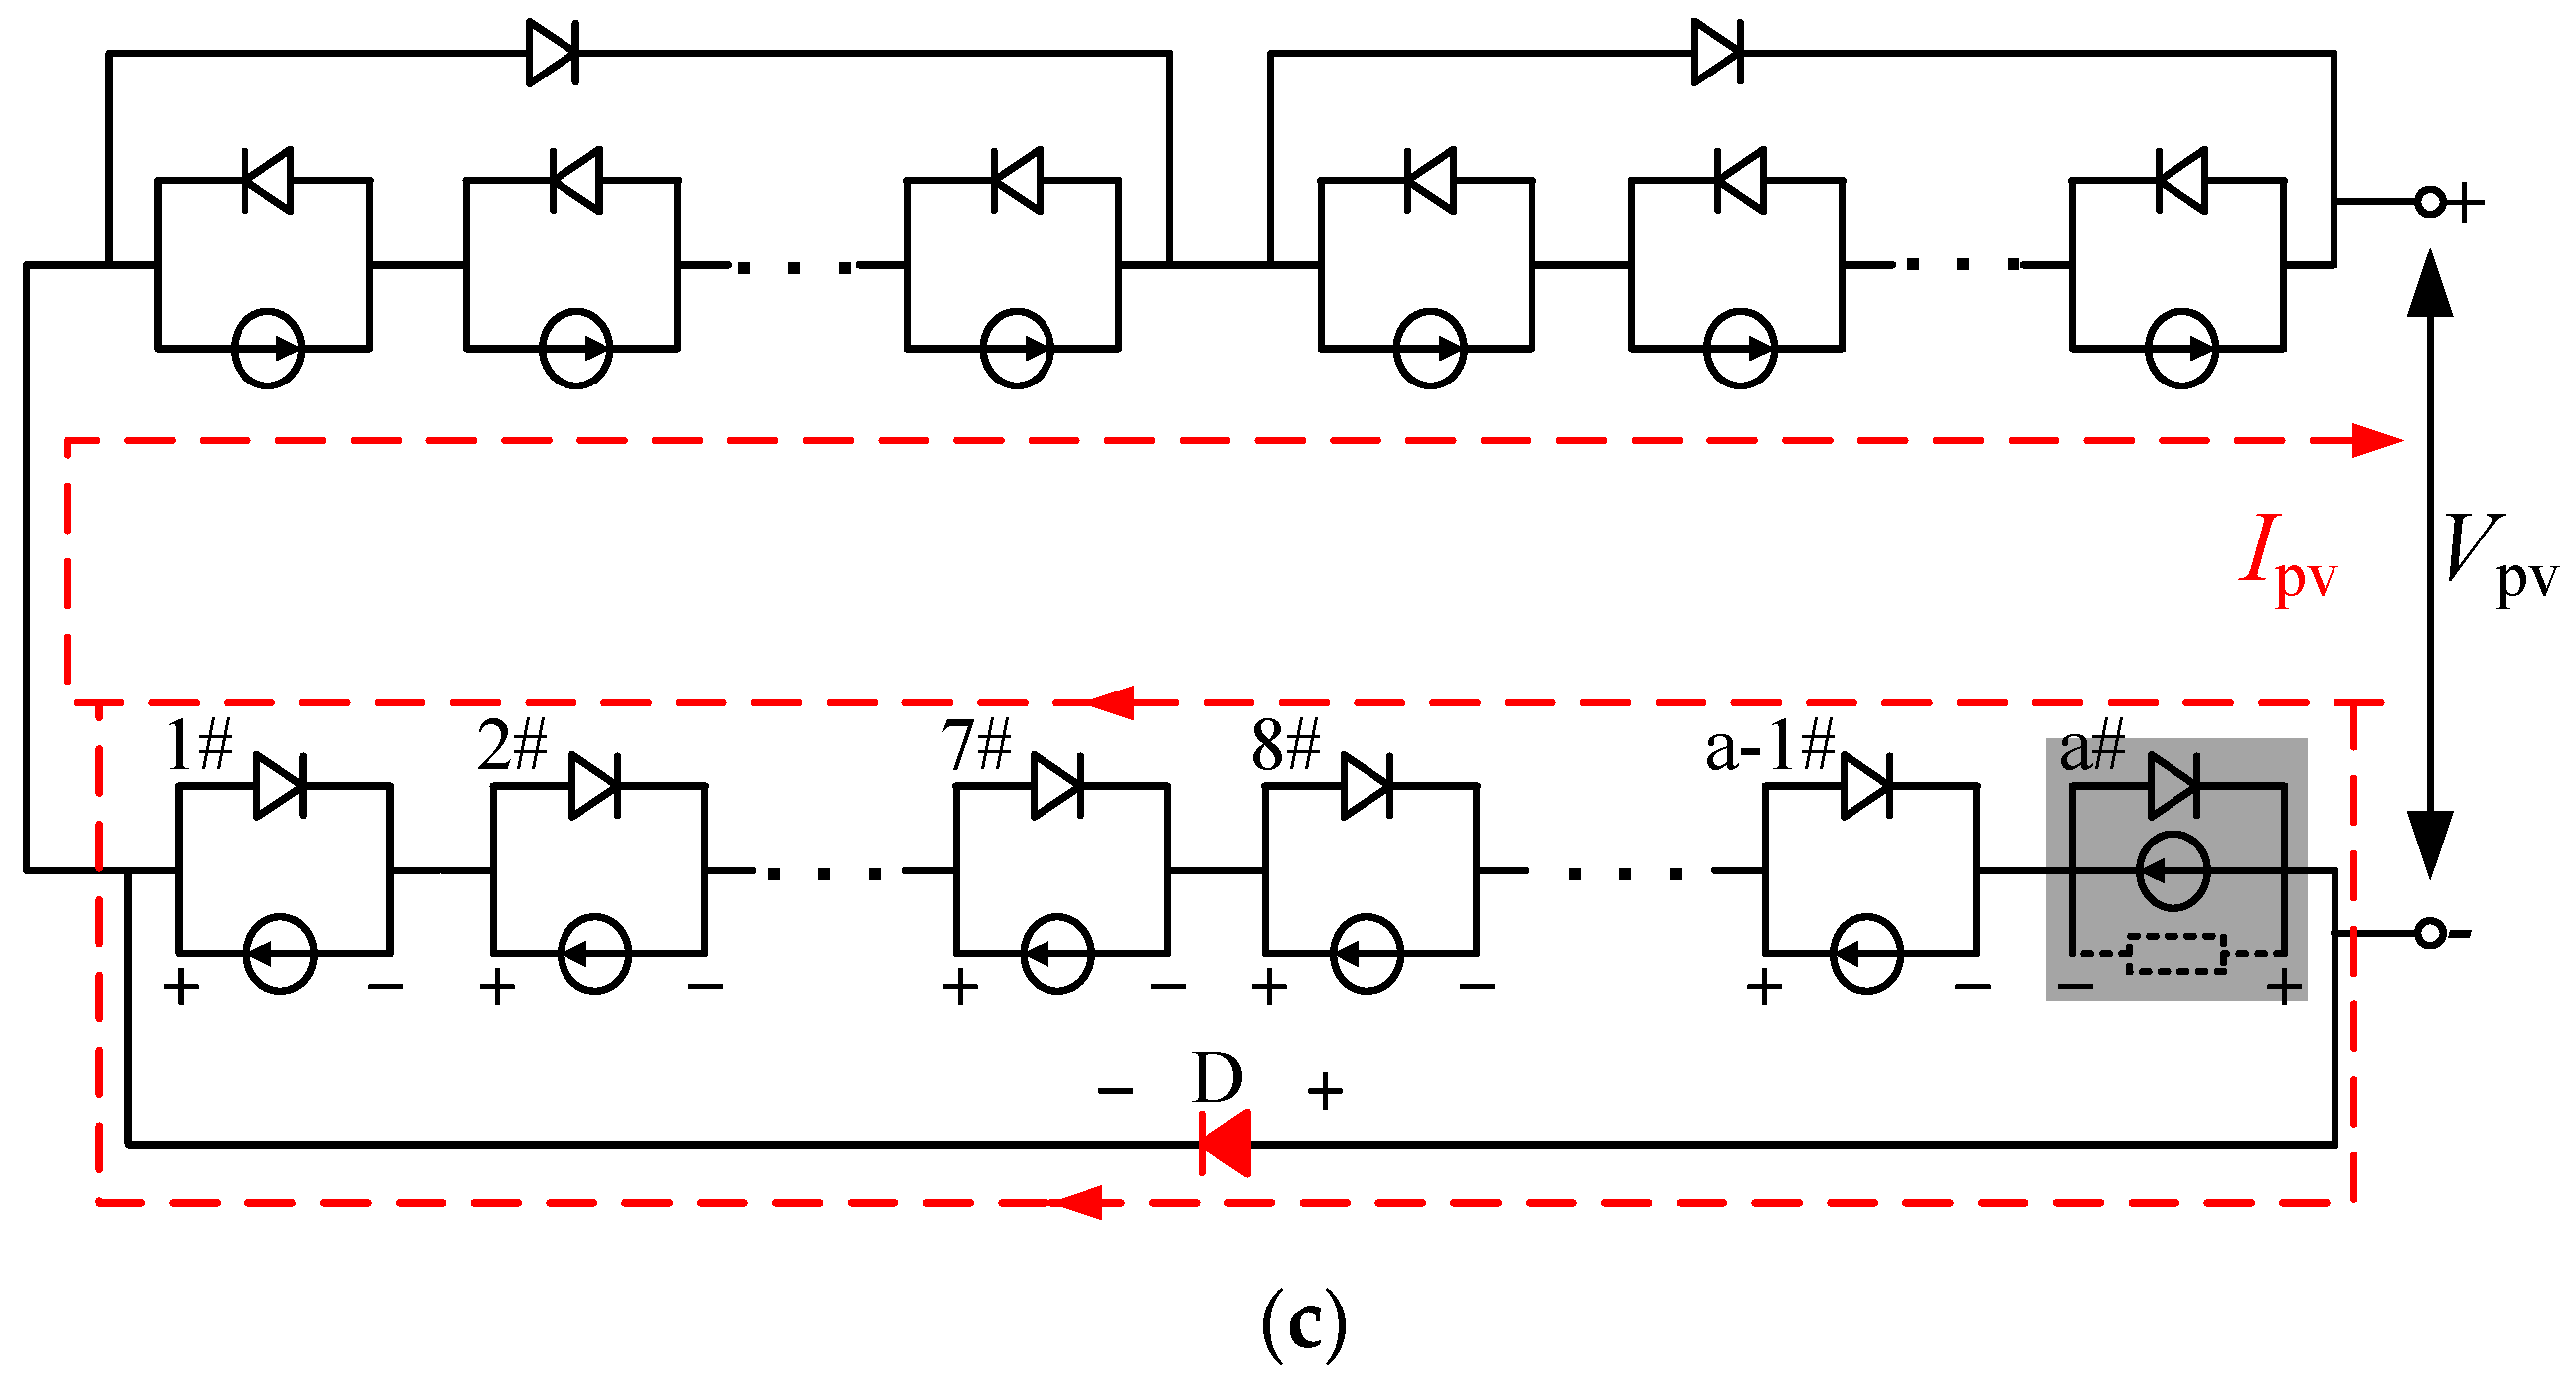
Schematic diagrams of the photovoltaic module with low resistance hot-spot fault showing three states are shown in
Figure 5. It is assumed that the photovoltaic module is composed of
m numbers of photovoltaic units in series, and each photovoltaic unit is composed of
a numbers of battery units in series and has parallel diodes. The definitions of photovoltaic module, photovoltaic unit, and battery unit are shown in
Figure 5a.
For normal battery units, the output current range is inconsistent, due to the different light intensity, and the current range is limited to the short-circuit current
Iscm under the shadow [
16]. Once the current range
Iscm of a shielding unit is less than the photo-generated current of other units in the same group, the unit will work in the reverse bias state and consume some power as a load. With the increase in the photo-generated current of other units, the reverse bias voltage will gradually increase until the bypass diode of its photovoltaic unit is conducted. For the low resistance hot-spot fault module, when the fault battery unit is shaded and works in the reverse bias state, most of the excess current flows through the equivalent low resistance, and generates heat in the low resistance hot-spot area, resulting in the aging and damage of photovoltaic module [
17].
Among them, the short-circuit current of low resistance hot-spot unit under shadow is:
In Equation (6),
S represents the actual illumination intensity, S
b represents the reference illumination intensity, and S
b is usually taken as 1000 W/m
2. The illumination ratio is defined as
, then:
For the low resistance hot-spot photovoltaic module under shadow, with the increase in the module output current, the faulty photovoltaic unit mainly experiences the following three working states.
State I: All battery units in the photovoltaic unit are forward biased
When the overall output current of the photovoltaic unit is less than the maximum short-circuit current generated by the shaded faulty battery unit, i.e.:
At this time, all battery units are forward biased and pass through the same current, so the bypass diode is not conducted, and each battery unit outputs power to the outside. The output voltage of photovoltaic modules is the sum of the output voltages of M photovoltaic units, i.e.:
At this time, there is no current flowing through the hot-spot low resistance, so its thermal power is:
State II: In the photovoltaic unit, the low resistance hot-spot unit begins to reverse bias, the other battery units are forward bias, and the bypass diode corresponding to the photovoltaic unit is off
When the overall output current of the photovoltaic unit begins to be greater than the maximum short-circuit current generated by the shaded faulty unit, but the conduction condition of the diode was not reached, that is:
At this time, the low resistance hot-spot battery unit begins to reverse bias. The current exceeding
βIsc flows through the equivalent low resistance
RLR and generates thermal power. The voltage at both ends of the battery unit is reverse. However, the other battery units in this part are forward bias, and this reverse voltage is low, so the overall output voltage of this part does not meet the conduction condition of the bypass diode, i.e.:
The diode corresponding to the photovoltaic unit is off, so the output voltage of the photovoltaic module is:
The thermal power of the hot-spot low resistance is:
State III: The low resistance hot-spot battery unit is in the maximum reverse bias state, and the bypass diode corresponding to the photovoltaic unit is conducted
When the overall output current of the photovoltaic unit continues to increase to
IpvD, the overall output voltage of the photovoltaic unit reaches the conduction condition of the bypass diode, i.e.:
At this time, the faulty battery unit is in the maximum reverse bias state, and the bypass diode corresponding to the photovoltaic unit turns on. The overall output voltage of the photovoltaic module is:
In this state, the thermal power of the low resistance hot-spot battery unit is constant, and the value is:
According to the above analysis, it can be seen that state I is a completely normal working state, which is no different from the working process of normal modules. The intersection of state I and state II represents that the shielded hot-spot battery unit starts to work in an abnormal state. The intersection of state II and state III represents the conduction freewheeling of the bypass diode. The overall output power curve and current curve of the fault module are in the form of continuous three-piecewise functions. Obviously, the low resistance characteristic of the faulty module has nothing to do with the position of the fault point, but only with the occlusion condition. As long as the faulty unit is covered by local shadow, the low resistance characteristic is displayed, according to the above piecewise function law.
The following will explore the output characteristics of low resistance hot-spot fault photovoltaic modules under different shadow occlusion through numerical simulation.
2.3. Output Characteristics
In order to study the output characteristics of low resistance hot-spot units under different shadows, the simulation is carried out by numerical simulation method. Four lighting ratios are set in the simulation, they are β1 = 0, β2 = 0.3, β3 = 0.5, and β4 = 0.8. The light intensity in the simulation is 1000 W/m2 and the temperature is 25 °C. The relevant parameters of the photovoltaic module in the simulation are set, as follows. Open circuit voltage Voc, short circuit current Isc, maximum power point voltage Vm, and maximum power point current Im are set to 22.0 V, 2.52 A, 17.3 V, and 2.31 A, respectively.
The structure of the photovoltaic module is two groups of photovoltaic units connected in series (
m = 2), and each photovoltaic unit is composed of 18 battery units in series (
a = 18). The value of the equivalent hot-spot low resistance under standard conditions is defined as 8.0 Ω. The boundary values of the three working states are obtained by calculating the transcendence Equation (16) in MATLAB, as shown in
Table 1.
According to Equations (8)–(18), the current is taken as independent variable to conduct the numerical simulations, and output characteristics of the photovoltaic module with low resistance hot-spot faults under different lighting ratios that are obtained, as shown in
Figure 6. In the case of shadow occlusion, with the increase in the output current of the photovoltaic module, the faulty module that is not completely shaded (
β ≠ 0) passes through three working states.
In work state I, the output characteristics of the faulty module are the same as those of the normal module, and the thermal power in this state is 0. In state II, because the internal resistance of the photovoltaic cells during reverse bias is very large, the excess current is difficult to pass through. Therefore, for normal modules, the current curve should be reflected as a horizontal straight line. However, for faulty modules, the existence of equivalent low resistance provides a path for the current [
18], so the I-U characteristic in
Figure 6 is reflected as an inclined straight line, and the slope value
k of the inclined line is approximately the opposite of the conductance value of the low resistance. At the same time, the thermal power in this state also increases in a quadratic function with the increase in the current flowing through the low resistance. In state III, since the bypass diode is conducted, current can flow through it, so the current flowing through the equivalent low resistance will no longer increase, and the thermal power in this state remains unchanged.
Through the analysis of the above three working states, it can be found that there are hidden dangers of hot-spots in state II and state III in the solar power generation system. Moreover, in the actual power generation process, in order to obtain sufficient and stable output power, the power generation system will carry out maximum power tracking control, which often makes the battery module work in state II or state III. At this time, the MPPT algorithm does not take into account the harm of the hot-spot fault, so it is difficult to ensure the safety of photovoltaic modules.
3. Hot-Spot Detection Method Based on I-U Characteristic Analysis
3.1. Detection Theory
The common MPPT control algorithm can achieve accurate global tracking, but it was not taking into account the harm of hot-spot fault. As shown in
Figure 6, with the aggravation of local occlusion (illumination ratio
β gradually decreasing), the “inclined straight line” characteristic of the hot-spot module in its I-U characteristic curve becomes more and more obvious. The maximum power tracked by the system decreases significantly, but the corresponding thermal power increases significantly. The damage caused by the hot-spot is cumulative [
19], so its harm cannot be ignored. In addition, considering the factors, such as labor and costs in engineering, the photovoltaic module with the low resistance hot-spot fault will not be replaced immediately and often needs to “operate with disease”. Therefore, hot-spot detection should be added into the design of the control algorithm to find and suppress the hot-spot in time and reduce the harm caused by the hot-spot.
The output characteristic curves of the photovoltaic module under different light ratio
β are shown in
Figure 7. As shown in
Figure 7a, the I-U characteristic of the hot-spot fault module under local shadow is mainly reflected in the existence of an inclined straight line in the output I-U characteristic curve, while the normal module under the same conditions is reflected in a horizontal straight line. As can be seen from the Figure, the range of the value of the slope of the downward inclined straight line under different light ratios
β changes little [
20].
Therefore, the basis of hot-spot fault diagnosis based on I-U characteristic analysis is obtained. Firstly, scan the system from the open circuit state to short circuit state. Then, judge whether there is a straight line in the output I-U characteristic curve of photovoltaic module, if yes, it indicates that there is shadow occlusion. Secondly, judge the range of the slope value of the straight line to determine whether there is a low resistance hot-spot fault. When the module has a slight low resistance hot-spot fault, in other words, its low resistance characteristic is not obvious, or the photovoltaic module has a suspected low resistance characteristic due to shielding or internal fault, the misjudgment can be reduced by reasonably setting the |
k| threshold to a certain extent. By observing
Figure 7b, the threshold of this |
k| value range can be taken as 0.07–0.12. In the actual process, although the value of |
k| is dynamic, the value is roughly the reciprocal of the conductance value of low resistance, so the dynamic change range of |
k| value is small.
3.2. Operating Procedur
In order to make the module with the slight low resistance hot-spot fault “operate with disease” and reduce the maintenance cost of the photovoltaic system, the low resistance hot-spot fault optimization control technology is introduced to reduce the thermal power of hot-spot modules, on the premise of ensuring the system output power.
Table 2 shows the PV module output data at
Umax,
U*,
Umid under different
β, where
U*—the maximum voltage value corresponding to the inclined straight line;
Umax—global maximum power point voltage obtained by scanning;
Umid—the median value of
U* and
Umax.
It can be seen from
Figure 6 and
Table 2 that, at the maximum voltage point
U* corresponding to the inclined straight line in state II, the thermal power is 0. In theory, this work point can completely suppress the heating of the low resistance hot-spots, but the output power is greatly affected at this time (especially in the case of severe shielding), so the balance between the two should be considered in practical application. As mentioned in
Section 2.3, the thermal power of photovoltaic module in state II also increases in a quadratic function with the increase in the current flowing through the low resistance. Therefore, in order to reduce the impact on the output power, a small part of the low resistance current can be retained. At this time, the thermal power is small, so the harm of the hot-spot can be ignored. As shown in
Table 2, when the working voltage is at
Umid, the hot-spot power can be reduced to less than 33% and higher output power can be retained. In particular, the more serious the shielding, the better the effect of output power retention.
Based on the above analysis, the safety voltage
Usv is taken as:
Therefore, if determining that the photovoltaic cell unit with the low resistance hot-spot fault is subject to local shadow, the working point voltage should be adjusted to the safe voltage Usv to suppress hot-spots, on the premise of minimizing output power loss.
Generally, the traditional MPPT control algorithm is difficult to give consideration to power tracking and hot-spot detection and suppression, so this paper proposes a low resistance hot-spot diagnosis and suppression control algorithm, based on the characteristics of low resistance to solve the problem. The algorithm is based on the detection of low resistance hot-spots, regularly start the global voltage and current detection, and finally calculated the slope of the curve to judge whether the inclined line with a specific slope exists [
21]. If the slope exists, then this is a low resistance hot-spot module, the working voltage should be adjusted to suppress the hot-spot, otherwise the INC-GCA MPPT algorithm should be carried out. The flow chart is shown in
Figure 8.
In a working cycle, the algorithm has the following working process:
1. System initialization. Set the I-U characteristic scanning time T1, algorithm working cycle T, and other parameters and variables of the algorithm;
2. I-U characteristic scanning. In this process, the voltage and current data are obtained through the sampling of the sensor and saved to the database. After scanning, call the database, calculate dI and dU through voltage and current data iteration, and get the slope of the output I-U curve, so as to prepare for later judgment and control;
3. Module status judgment. Through the above hot-spot diagnosis criteria, judge whether there is an inclined straight line in the I-U curve of the module, that is, whether its slope remains unchanged within a certain voltage range or changes slightly within the threshold range. If an inclined straight line exists, it is a low resistance hot-spot module, otherwise it is a normal module or a hot-spot module in normal working state;
4. Hot-spot suppression process. If it is a hot-spot module, calculate the safe working voltage through Equation (19), and adjust the working voltage of the system to near the safe voltage Usv. At this time, the thermal power of the low resistance hot-spot is greatly reduced, and the system realizes safe and efficient operation;
5. INC-GCA MPPT process. If it is not a hot-spot module, in this process, calculate the changes of current and voltage (dI and dU), and determine the disturbance direction of the voltage in the next cycle by judging the positive and negative of formula dI/dU + I/U. When dI/dU + I/U > 0, then U < Umax, reduce the duty cycle to increase the voltage, otherwise increase the duty cycle. If dI/dU + I/U = 0, it is proved that the maximum power point was tracked, and the output power at this time is the maximum power Pmax. Finally, save this working voltage and current as the reference quantities U(k − 1) and I(k − 1), and start the next cycle. Start the global comparison process every n numbers of cycles to prevent the system from falling into the local maximum power point, due to sudden illumination change.
3.3. Model Simulation Modeling and Analysis
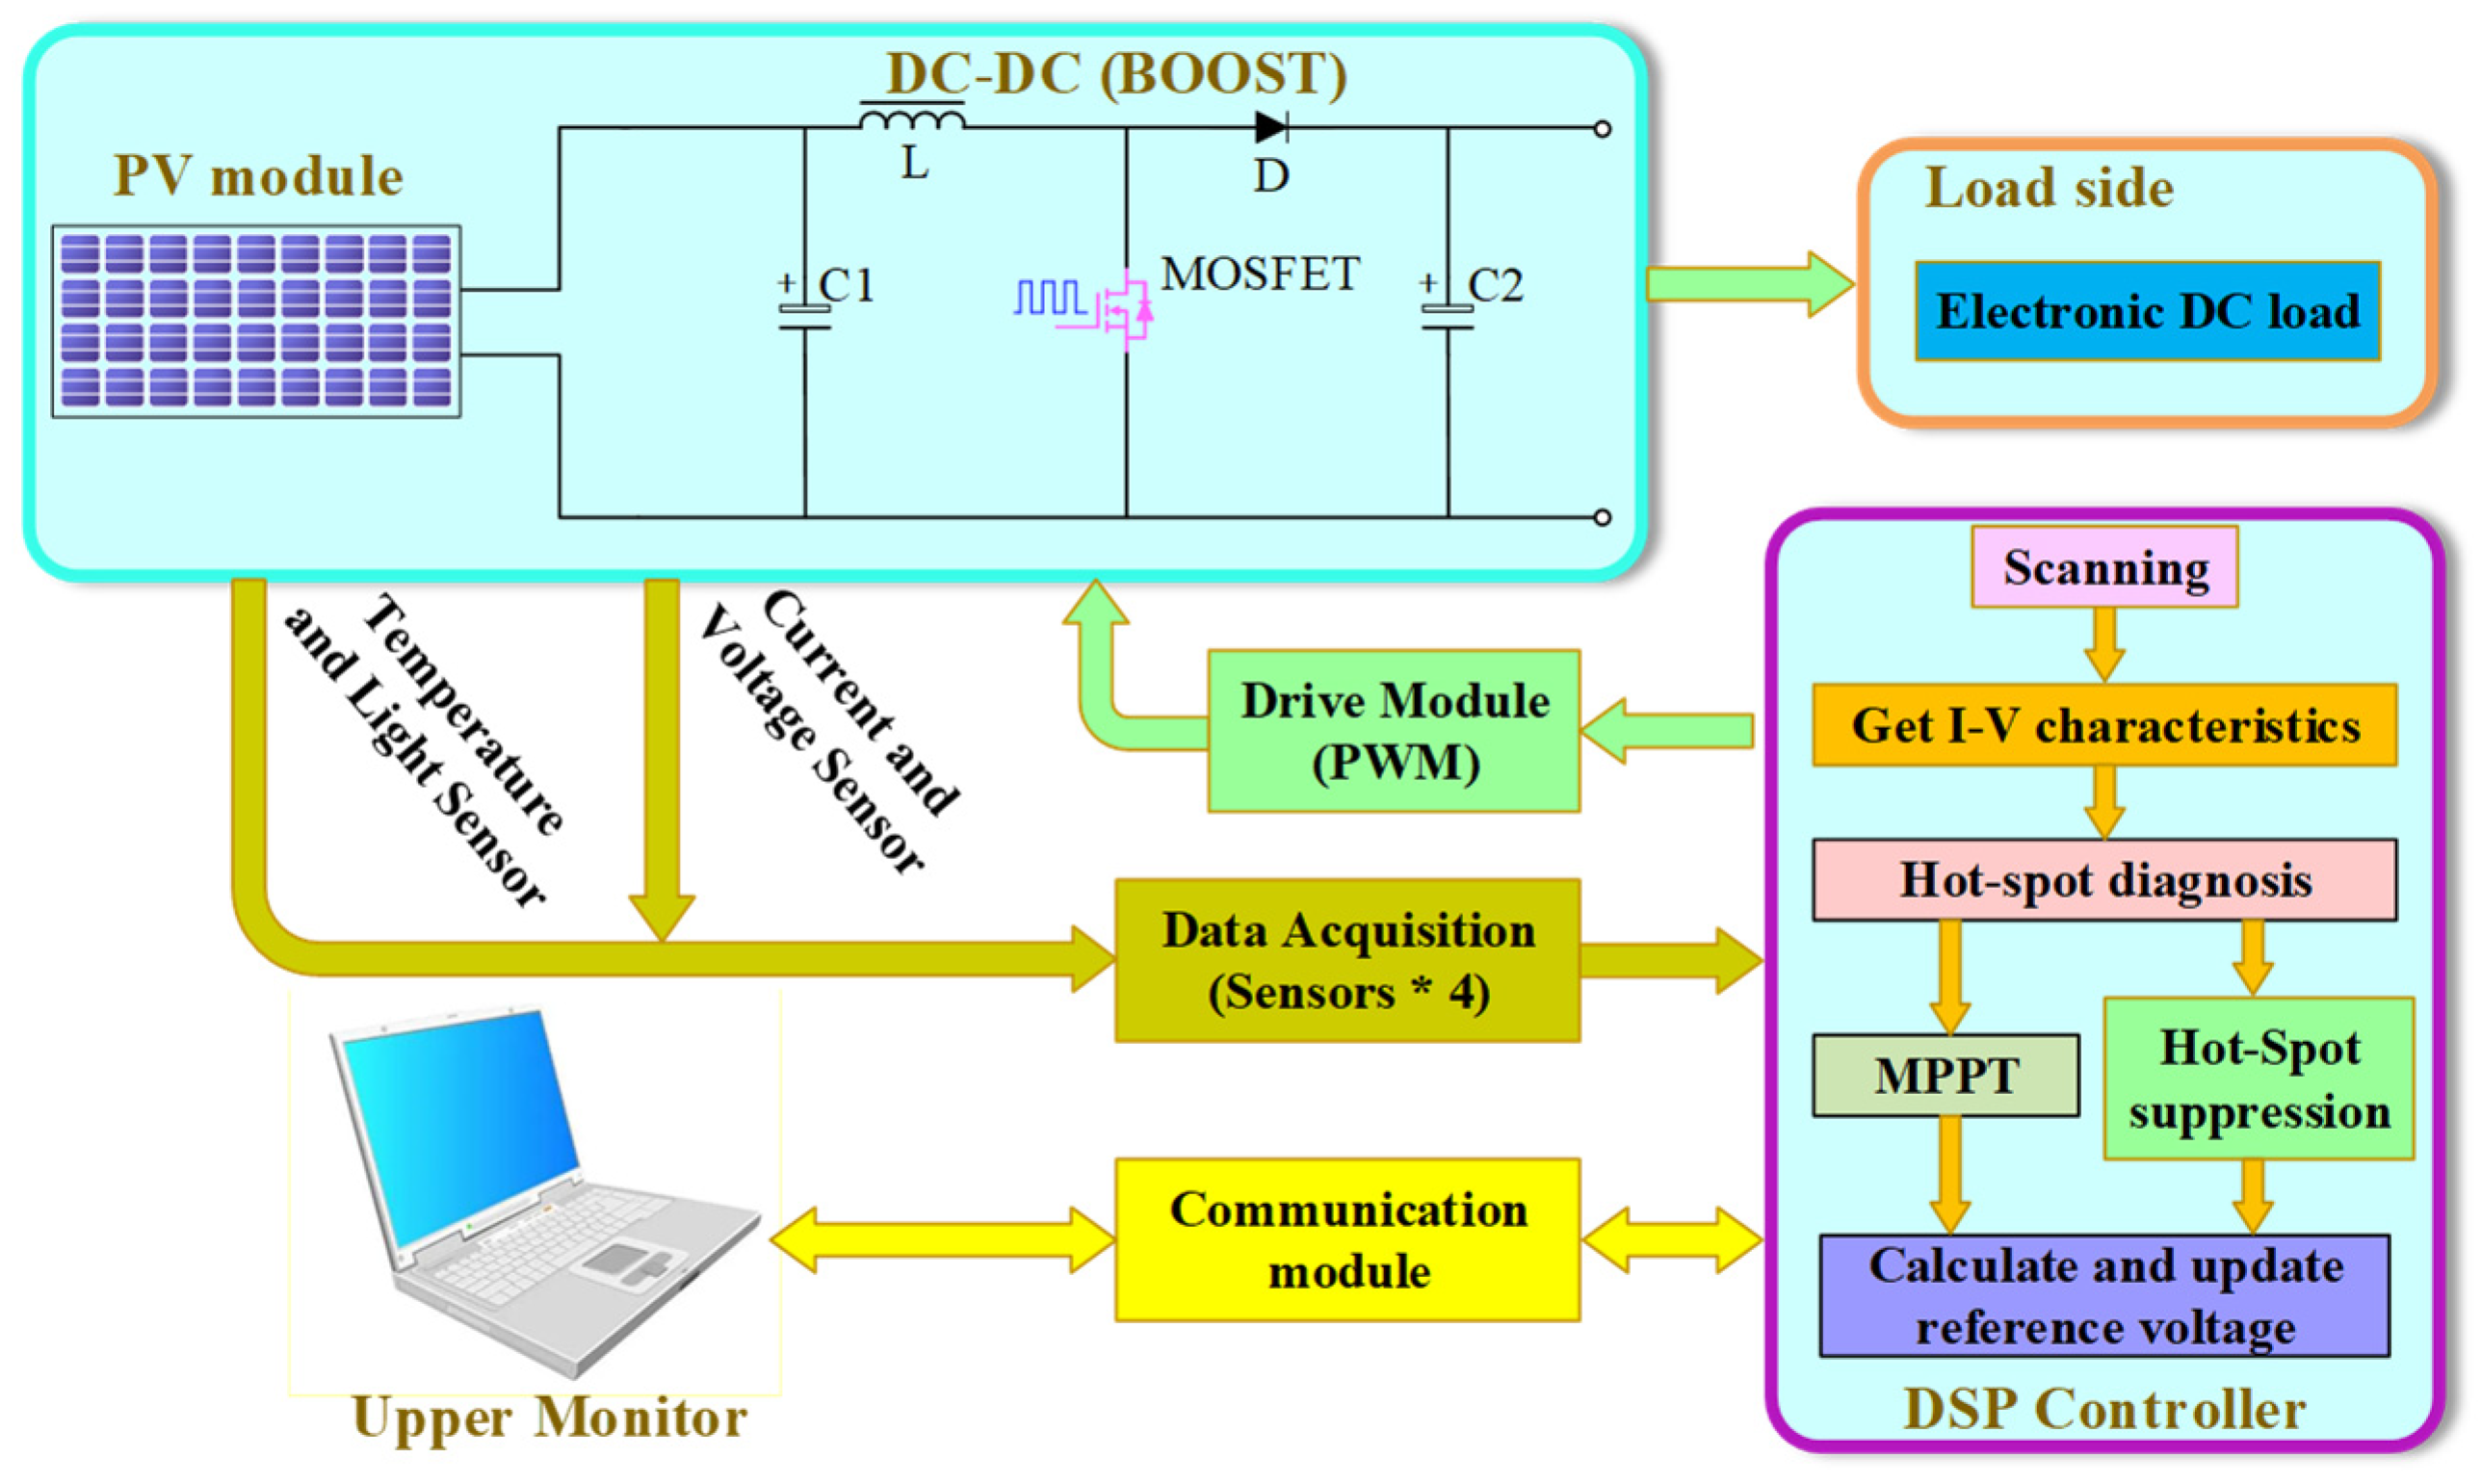
Because the Boost circuit has the characteristics of a simple structure, low cost and high output efficiency, in order to maintain the stable output of the system, it is selected as the DC–DC boost circuit to realize the process of boost and MPPT, and to stabilize the output voltage at the best working voltage. The simulation model of the photovoltaic control system, based on low resistance hot-spot fault diagnosis, is established on the Simulink platform, as shown in
Figure 9 [
22]. Among them, the model of low resistance hot-spot composed of a 1-D lookup table module is built and encapsulated, and the numerical simulation data in
Section 2 are written into it for use. The hot-spot suppression controller is built with S-function. To simulate the hot-spot suppression performance, write the program of low resistance hot-spot diagnosis and suppression control algorithm based on I-U characteristic analysis into the controller, and finally export the relevant simulation experimental data through To Workspace module. The relevant parameters of photovoltaic modules used in the simulation are the same as those in
Section 2.3.
In order to verify the effect of hot-spot fault diagnosis and suppression based on I-U characteristic analysis under different local shading conditions, and verify the universality of the algorithm on normal modules, two groups of control experiments are designed, which are the comparison of the algorithm control performance between the low resistance hot-spot unit and the normal unit under β = 0.3, and the comparison of algorithm control performance under β = 0.3 and β = 0.5.
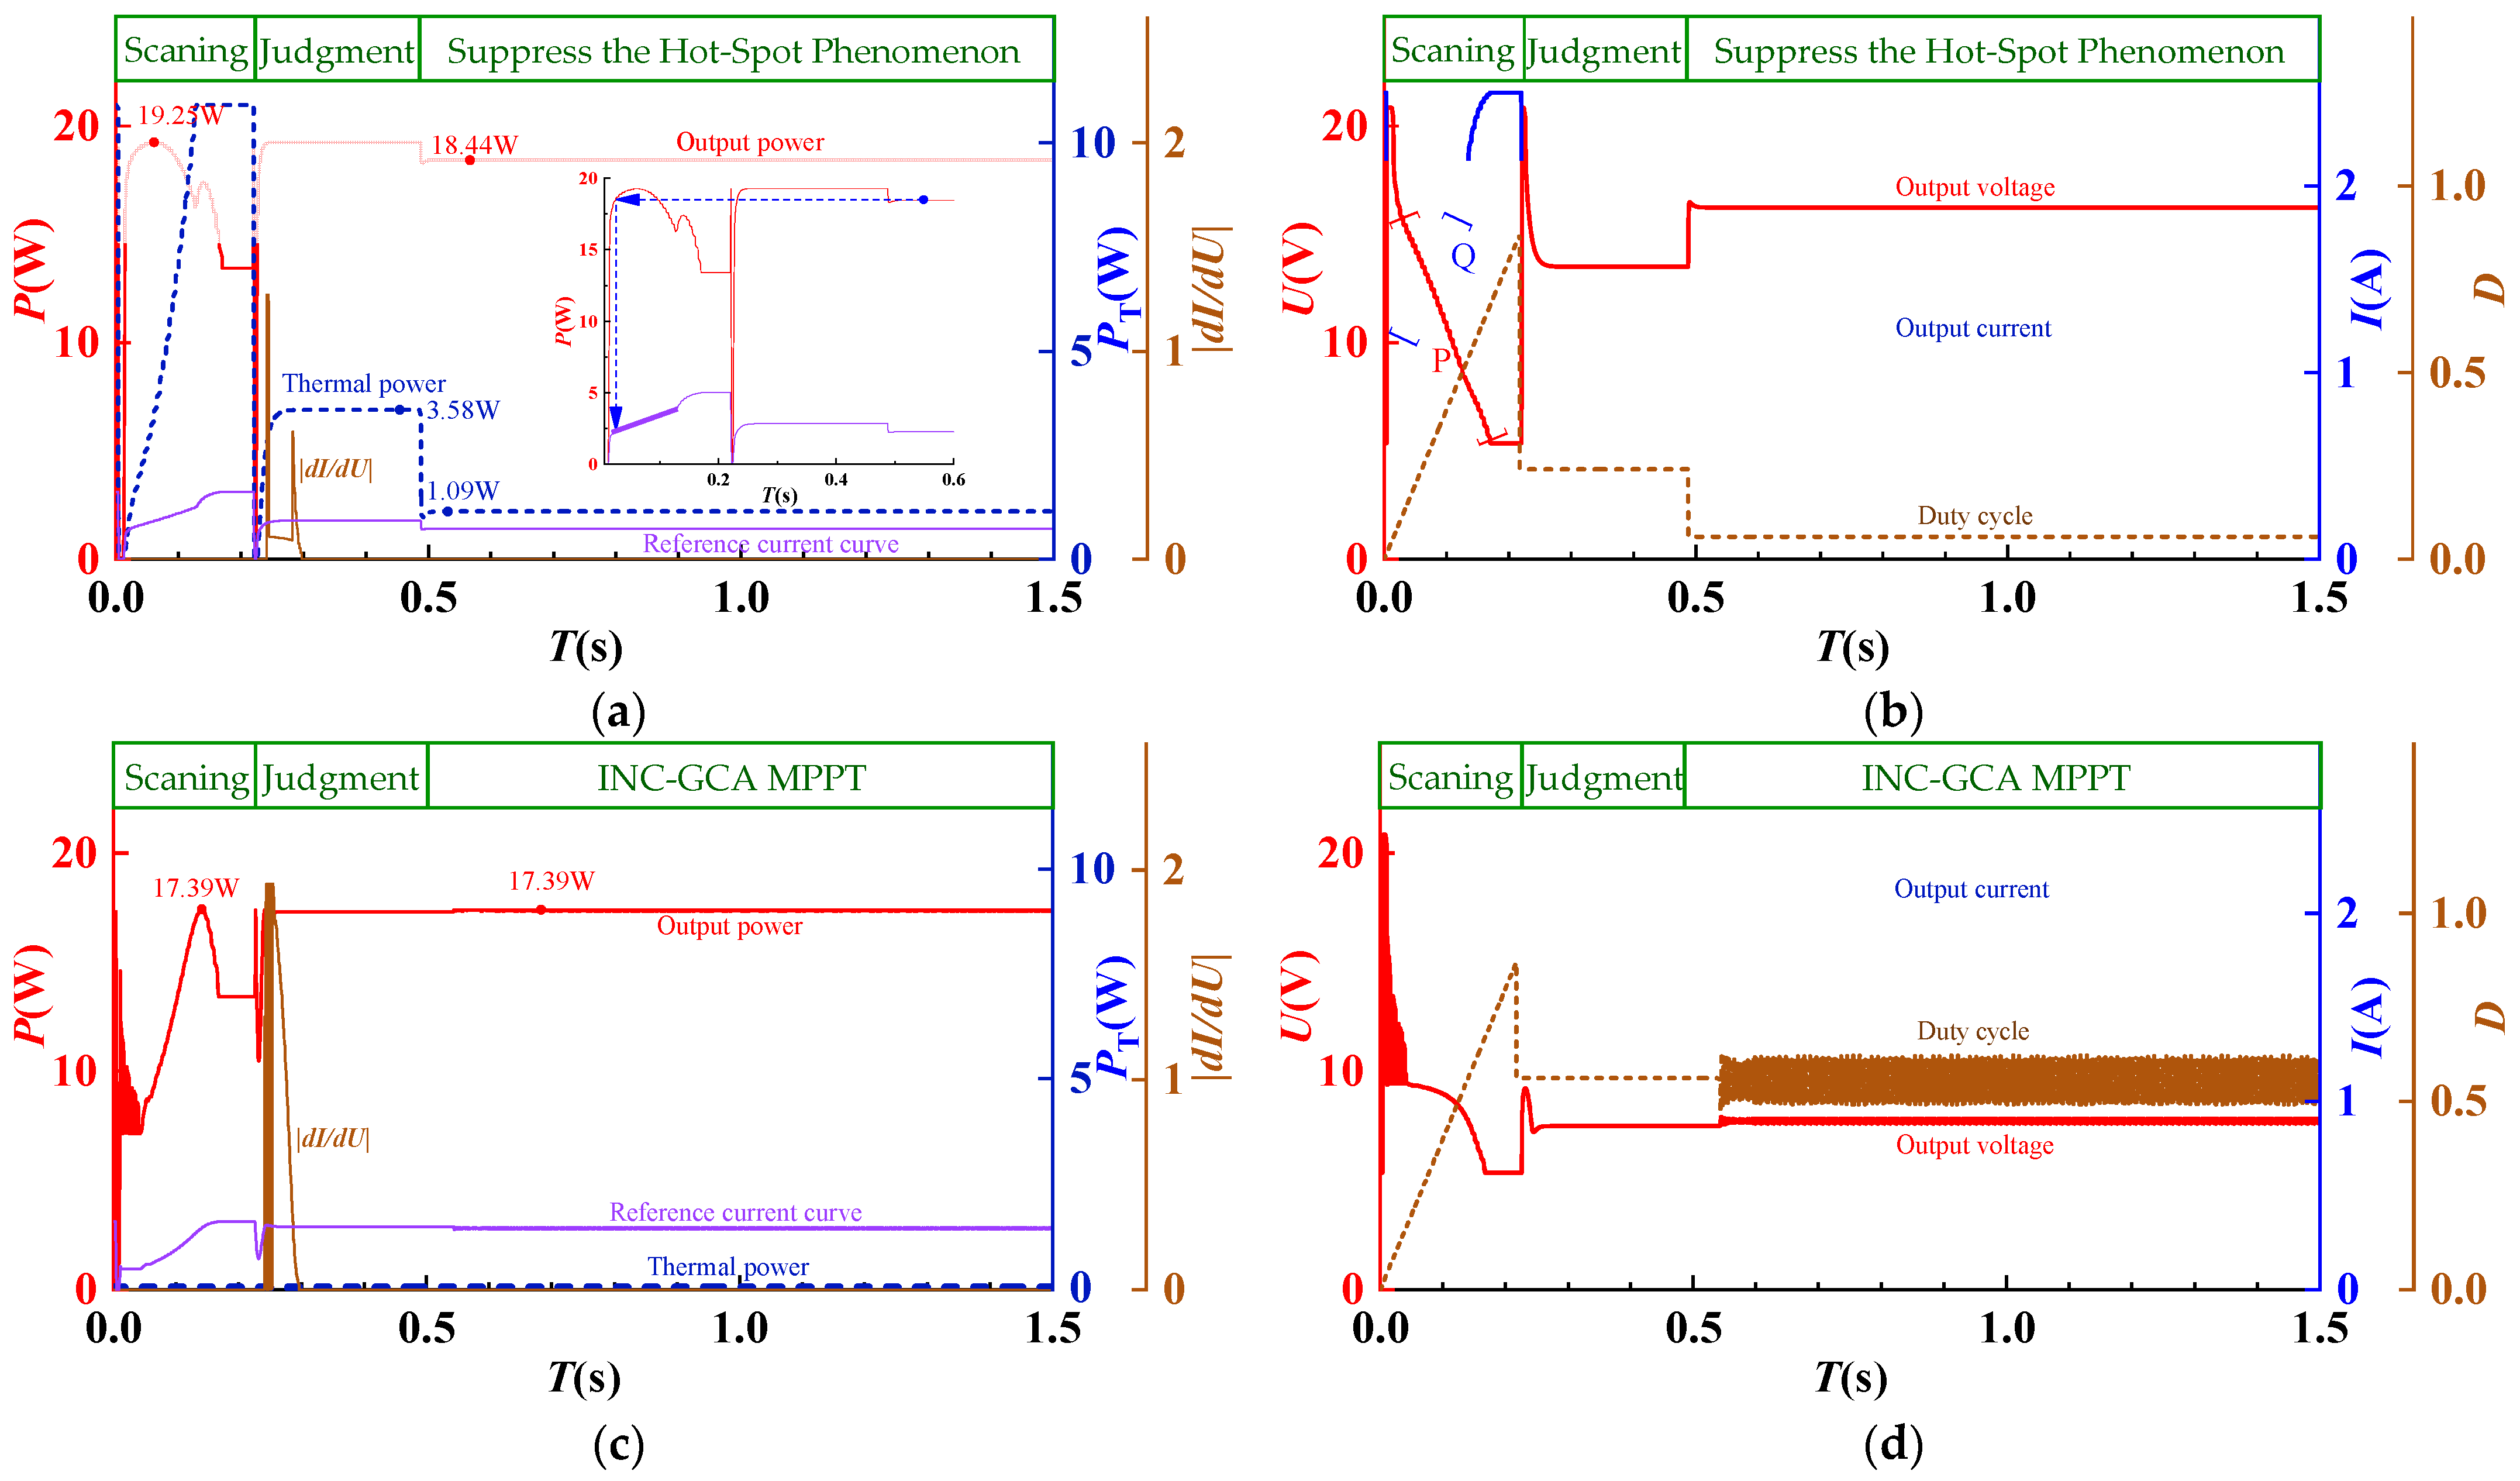
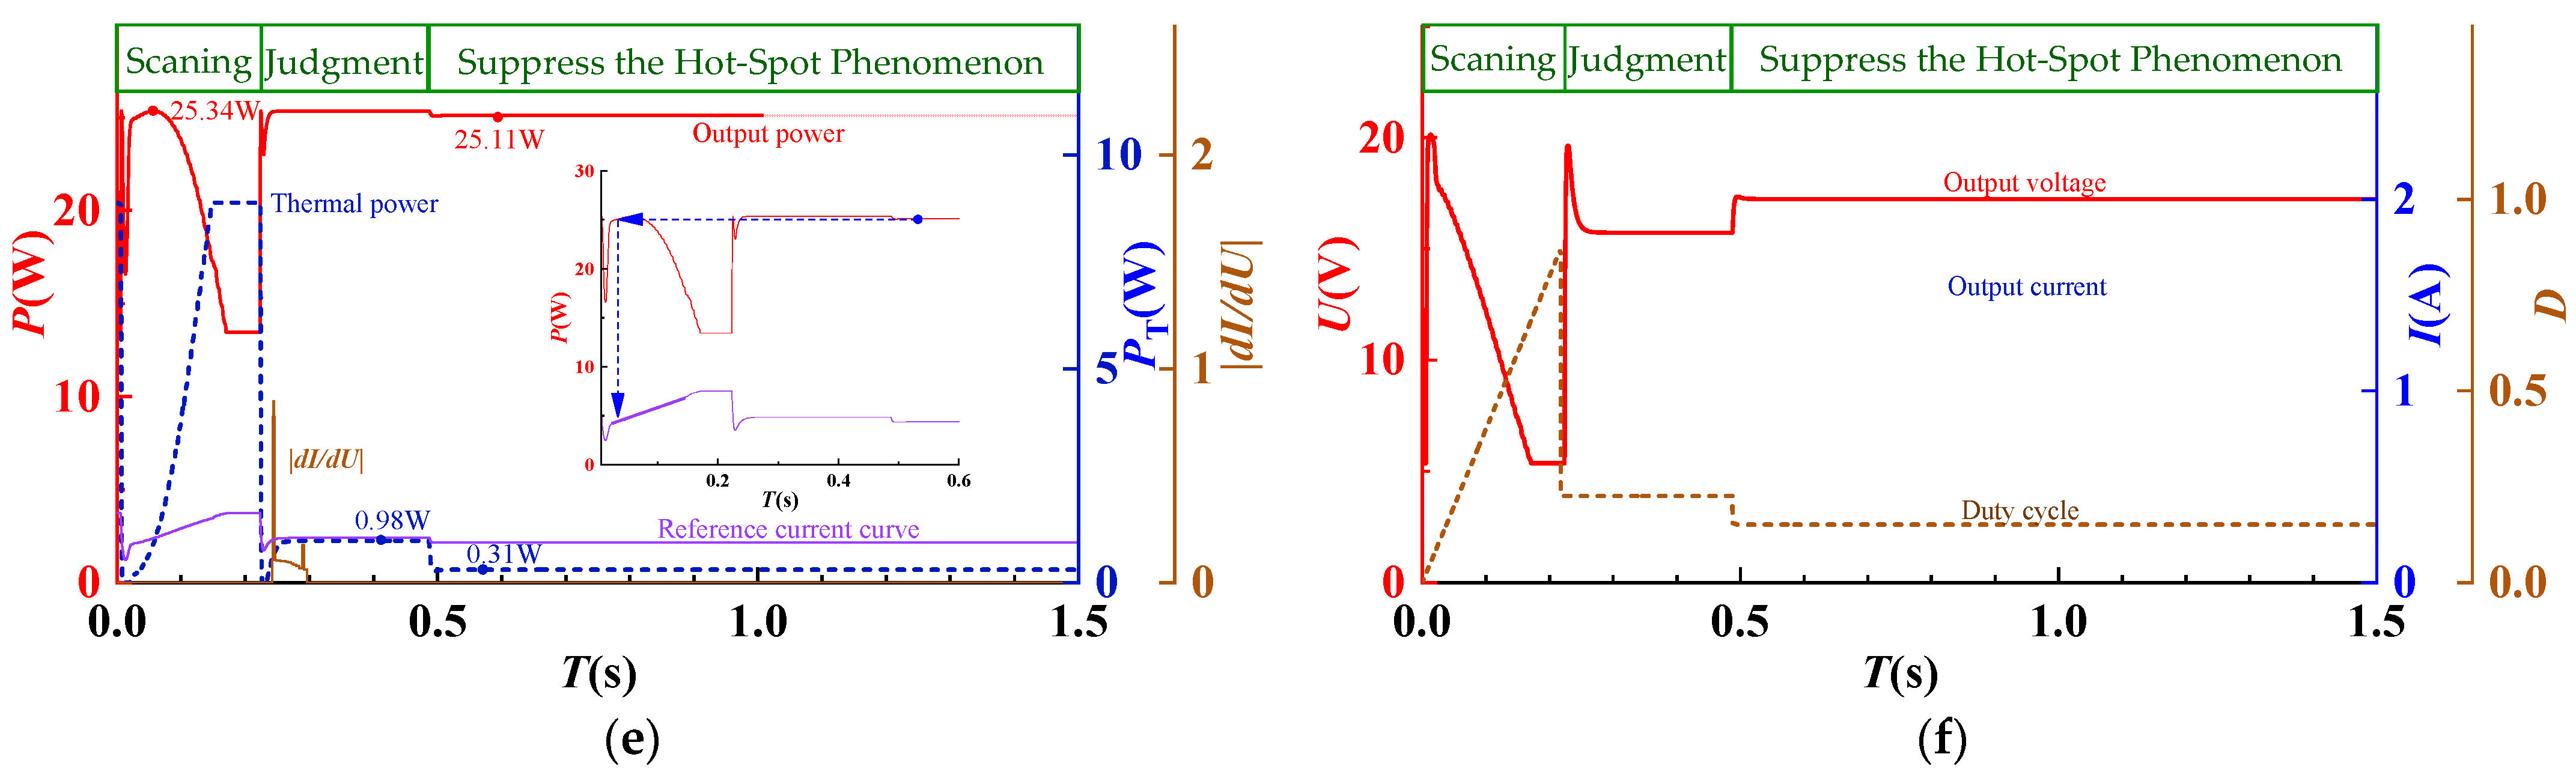
The simulation results of the algorithm based on I-U characteristic analysis on normal/faulty units under different
β are shown in
Figure 10. There are three working processes in a system working cycle: scanning, judgment, and control (MPPT or hot-spot suppression).
During the scanning process, the system obtains the current and voltage data of the whole scanning cycle of the system by changing the duty cycle D (from 0 to 1). It can be seen from
Figure 10a that there is a linear section P in the
U-T curve and a linear section Q in the
I-T curve section P. Note as Equations (20) and (21):
Coordinate transformation
So, it is proved that section Q in
Figure 10b corresponds to the linear section in the I-U characteristic curve.
In the judgment process, the system calculates the slope
dI/
dU of the I-U curve, as shown in
Figure 10. By comparing
Figure 10a,c, it is obvious that
dI/
dU of the middle part of the shaded hot-spot module is a non-zero constant value. This feature can be used to determine whether there is a low resistance hot-spot fault in the photovoltaic module. In this process, the system maintains the global maximum power output.
During the control process, if it is a low resistance hot-spot module, the system reduces the thermal power of the system and protects the photovoltaic module by adjusting the working voltage to the appropriate voltage in state II. As shown in the local enlarged figure in
Figure 10a,e, the working voltage is adjusted to the safe voltage in section Q, that is calculated from Equation (19). If it is a normal module, the system accurately tracks and maintains the global maximum power point through INC-GCA MPPT algorithm to realize the maximum power output of the system.
The simulation data of the hot-spot control algorithm under different
β are shown in
Table 3, and this result is consistent with the analysis in
Table 2. Under the same condition of
β = 0.3, the global maximum power of the hot-spot module is 1.86 W higher than that of the normal module. This is because the low resistance of the hot-spot module in state II provides a path for the current, making the current flowing through the photovoltaic module greater at the same voltage, so the global maximum power is slightly improved. However, the low resistance of the hot-spot will produce 3.58 W thermal power. Through the hot-spot suppression process, although the output power is reduced by 0.81 W, the thermal power of low resistance is reduced to 1.09 W, and the output power ratio and thermal power ratio are 95.8% and 30.4%, respectively. At
β = 0.5, through the same hot-spot suppression process, on the basis of losing 0.23 W of output power, the low resistance thermal power is reduced to 0.31 W, and the output power ratio and thermal power ratio are 99.1% and 31.6%, respectively. It can be seen that under a high light ratio, the original low resistance thermal power is small, so it can be close to 0 through hot-spot suppression. However, under a low light ratio, the low resistance thermal power is large, if it is completely suppressed to 0, the output power loss is larger. Therefore, to achieve a balance between efficiency and security, a small part of the low resistance thermal power can be retained, on the premise of ensuring the output power.
4. Experiment and Analysis
In this paper, a faulty photovoltaic module with a typical low resistance hot-spot phenomenon is selected to design a control experiment to verify the actual control effect of low resistance hot-spot diagnosis and suppression control algorithm based on I-U characteristic analysis. One battery unit in the module is a low resistance hot-spot faulty unit, and the control experiment process is to locally block the normal battery unit and the low resistance hot-spot battery unit, respectively. The light intensity in the experiment is 820 W/m
2, and the temperature is 28.2 °C. The main parameters of the photovoltaic module are the same as those in
Section 2.3.
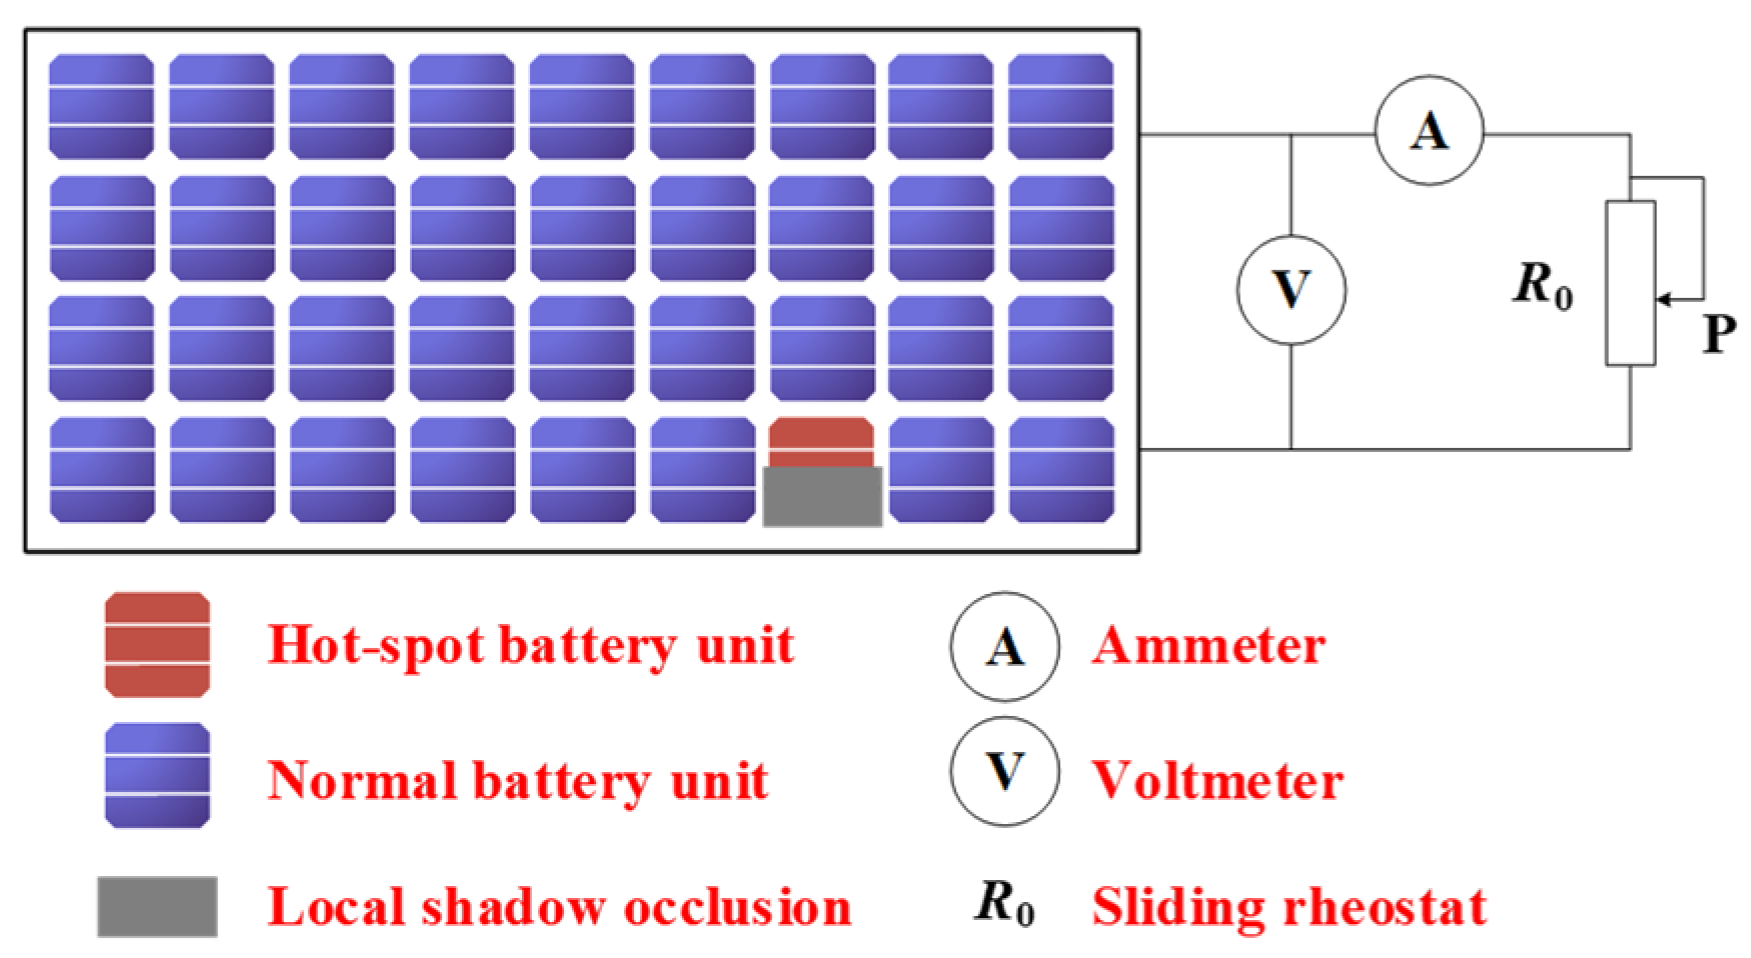
Firstly, to measure the output I-U characteristics of the normal and faulty modules, build the measurement circuit as shown in
Figure 11, including sliding rheostat
R0, ammeter and voltmeter, and measure multiple groups of original data by changing the value of
R0. During the experiment, the method of artificially adding local shadow occlusion at the hot-spot unit is shown in
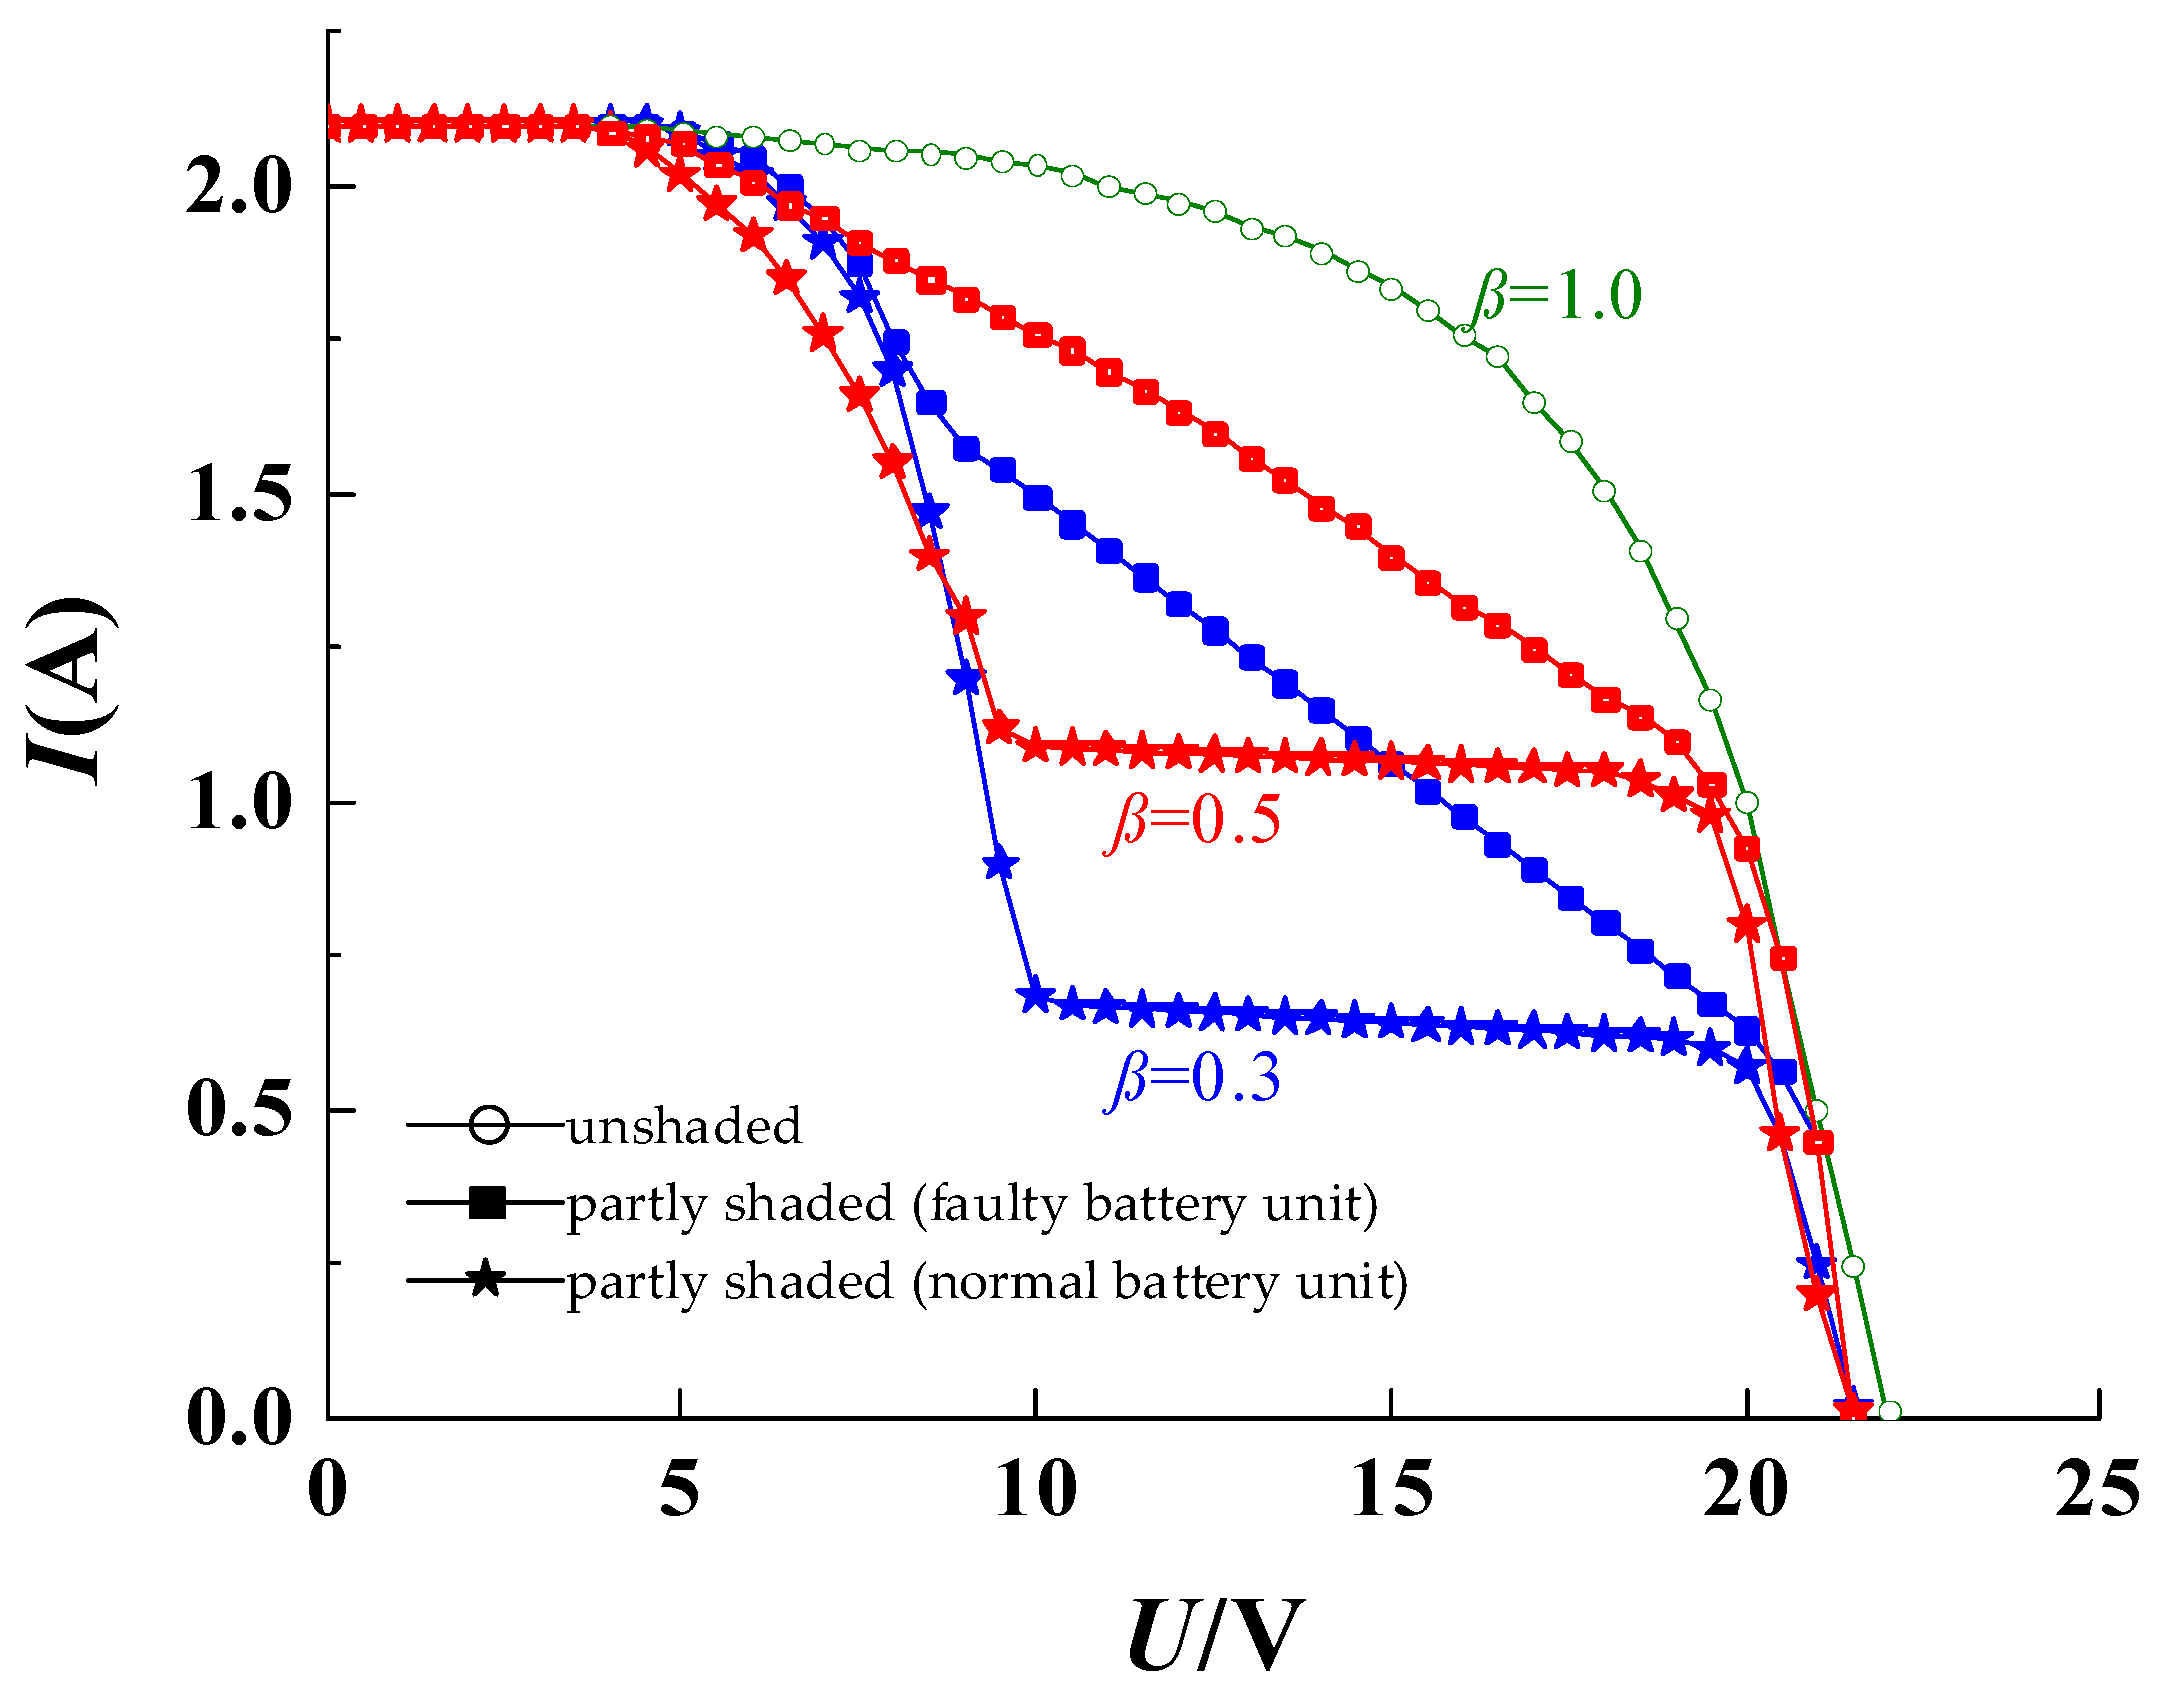
Figure 11. An opaque black rubber pad is used to cover the surface of the battery unit, so that the illumination of the shaded area is almost 0. The purpose of adding artificial local shadow is to create controllable experimental conditions for experimental comparison. In actual diagnosis, artificial local shadow is not mandatory. For a single-chip battery unit, local shielding mainly affects its output power by affecting its overall photo-generated current. This process is related to the area (or proportion) of local shielding and has nothing to do with the location, shape, and other factors of local shielding. Therefore, it is only necessary to control the area of local shielding in the experimental process. Finally, we measured the output I-U characteristic data of the normal/faulty photovoltaic module under
β = 1.0,
β = 0.5,
β = 0.3, as shown in
Figure 12.
The curve in
Figure 12 is fitted from the measured experimental data points. There is a certain deviation between the data points and the simulation characteristic curve for the following reasons. Firstly, due to the use of the solar light source, there are fluctuations in environmental conditions, such as the light intensity during the experiment. It is difficult to be as stable as the simulated light source in the laboratory. Secondly, the principle of the I-U characteristic measurement circuit of the hot-spot battery unit built in this paper is relatively simple, the ammeter may divide part of the voltage and the voltmeter may divide part of the current during the experiment, and the measuring needle has contact resistance, so there is a certain error in the measurement process of the multimeter. However, because the I-U characteristics are measured for qualitative verification rather than quantitative analysis, it can still be concluded that the measured experimental data are consistent with the simulation results. In the actual experimental process, DSP is used to sample and process voltage and current data, and its sampling frequency can reach 5000 Hz. The whole scanning sampling process can be completed in 500 us, and the changes in environmental conditions can be ignored [
23]. Moreover, the current and voltage sampling circuit uses high-precision chip and peripheral circuit, and the sensors were corrected. Therefore, the DSP controller can measure the accurate output characteristics of the modules in the experimental process.
Obviously, under the condition of no shadow (
β = 1.0), the I-U output of the fault photovoltaic module is the same as that of the normal module, and does not show the characteristics of “inclined straight line”, which is mainly because all the battery units in the module are in normal working state. When the faulty unit is covered by local shadow (i.e.,
β = 0.5,
β = 0.3), its output I-U characteristics have obvious linear segment, which is consistent with the simulation results. With the increase in the illumination ratio, its low resistance characteristic is less and less obvious, especially when
β > 0.5, its output I-U characteristics tend to be similar to those without shadow occlusion. At this time, the change of curve slope is relatively gentle, and it is difficult to even distinguish the three working states of the modules according to their output I-U characteristics. At this time, the algorithm may not be able to accurately judge the existence of hot-spots, and the MPPT process will be carried out. However, the operating point, output power, and heating power of the system at this time are not significantly different from the control results of the algorithm for hot-spots diagnosis and suppression. As shown in
Figure 6 and
Table 2, when
β = 0.5, the difference between the output power of MPPT result and hot-spot suppression control is 0.41 W, when
β = 0.8, which is only 0.23 W, the difference of heating power between the two temperatures is only 0.76 W and 0.01 W. Obviously, the larger the illumination ratio is, the smaller the difference between the control results of the two algorithms is, and the smaller the harm of the hot-spot is, and there is no need to suppress the hot-spot failure of the low resistance. Therefore, this algorithm mainly needs to be targeted at the situation of a low resistance hot-spot with serious harm, that is,
β < 0.5. When the light ratio
β is large, the influence of misjudgment of the hot-spot diagnosis algorithm on the efficiency and security of the system control can be ignored.
In order to verify the hot-spot diagnosis algorithm, establish the photovoltaic experimental platform, as shown in
Figure 13. Design three local shadow occlusion including
β = 1,
β = 0.5 and
β = 0.3, and the experiment is carried out under the illumination intensity of 820 W/m
2. When
t = 10 s, add local shadow occlusion, and set the scanning cycle to 40 s. In the experiment, the voltage, current data, and temperature data of the hot-spot unit were recorded in real time.
Figure 14 shows the experimental results of the PV module hot-spot diagnosis control algorithm under different
β. It can be seen that, when
t < 10 s, the PV module has no shadow, and the system uses the conductance increment method to track the maximum power. When
t = 10 s, and a local shadow is added on the hot-spot battery unit, the system output power drops suddenly, and then tracks the new maximum power point under the action of the conductance increment method. When
t = 40 s, the scanning cycle is reached, and the system scans the I-U characteristics of the modules and performs suppression control. There is no shadow at
β = 1.0, so the module does not show “inclined straight line” characteristics. The system determines that the module has no hot-spot fault, and still tracks the maximum power point. At
β = 0.5 and
β = 0.3, because the hot-spot unit is partly shaded, the module shows “inclined straight line” characteristics, and the system directly fixes the voltage near the safe voltage to suppress the hot-spot. According to the temperature measurement data in
Table 4, after the hot-spot suppression, the temperature on the hot-spot unit decreases greatly, reducing the harm of hot-spots to photovoltaic cells.
Different lighting conditions are designed in the experiment, which are
β = 0,
β = 0.1,
β = 0.2 ···
β = 1. The measured experimental data of output efficiency and module temperature under different
β are shown in
Figure 15. With the increase in the illumination ratio
β, the output efficiency of photovoltaic modules increases significantly. When
β > 0.2, the output efficiency can be stable at more than 92%, which proves that the algorithm has less power loss when suppressing the low resistance hot-spot fault. When
β < 0.2, due to severe local shadow, the heating is serious, and the temperature of the fault unit can reach 140–160 °C, close to the junction temperature of silicon-based materials, which has great potential safety hazards. Therefore, in order to minimize the harm, the hot-spot suppression algorithm reduces the temperature of the failed unit to about 80 °C at the cost of losing part of the output power, which is close to the limit test temperature of the photovoltaic module. At this time, the module can operate within the safe temperature range. According to the temperature change curve before and after hot-spot suppression, the more serious the local shadow is, the better the effect of the temperature reduction is. The slighter the local shadow occlusion, the smaller the effect of hot-spot suppression on the output efficiency. When
β = 0.9, because the low resistance characteristic is not obvious at this time, the system has misjudgment. However, from the actual control results, the misjudgment has little impact on the control effect and can be ignored.
5. Conclusions
Based on the formation mechanism of the low resistance hot-spot, the fault mechanisms and fault characteristics of low resistance hot-spot modules are discussed from the aspects of the circuit model and mathematical model, and the output characteristics of low resistance hot-spot modules are verified by simulation. A fault diagnosis and suppression control algorithm for low resistance hot-spots based on I-U characteristic analysis is proposed. The algorithm can set the most suitable working mode according to the working states of photovoltaic modules. Finally, the feasibility of the algorithm is verified by simulation, and a photovoltaic experimental platform was built for experimental verification.
According to the simulation and experimental results of low resistance hot-spot diagnosis, and the suppression control performance based on the low resistance characteristics under different synthesis β, it can be seen that the low resistance hot-spot diagnosis and the suppression control algorithm, based on the low resistance characteristics, significantly reduce the thermal power generated by the abnormal operation of the low resistance hot-spot unit under the shadow, and greatly reduce the harm caused by its hot-spot fault. From the measured temperature data of the fault unit, the temperature can be reduced by more than 80 °C after hot-spot suppression, and the more serious the local shadow is, the more obvious the effect of temperature reduction is. The power loss caused by the optimization process is small. Generally, the power loss rate shall not exceed 8%. Taking into account the efficiency and safety of the faulty unit in the operation process, so it has great research value and application value in the actual operation of photovoltaic power station. Moreover, the algorithm has strong generality and it is also suitable for photovoltaic modules without low resistance hot-spot faults, which can track the maximum power efficiently. Even if the shadow change causes the “low resistance hot-spot” characteristic of the photovoltaic module to be hidden or displayed, the algorithm can still adaptively control it by timing the scanning.
On the whole, the control strategy proposed in this paper can rely on the existing photovoltaic MPPT platform, and can diagnose and suppress hot-spots only by upgrading the control program and some sensors, which makes up for the vacancy of the current MPPT controller in hot-spot diagnosis and ensures the safe and efficient operation of the system. In the long run, the control strategy has great advantages in efficiency, security, economy, and practicability, and has great application value.


