Article

Prediction Method of Beijing Electric-Energy Substitution Potential Based on a Grid-Search Support Vector Machine

School of Economics and Management, Beijing University of Technology, Beijing 100021, China
*
Author to whom correspondence should be addressed.
Energies 2022, 15(11), 3897; https://doi.org/10.3390/en15113897
Submission received: 21 April 2022 / Revised: 20 May 2022 / Accepted: 23 May 2022 / Published: 25 May 2022
(This article belongs to the Special Issue New Insights into Energy Economics and Sustainable Development)

Abstract

:
Recently, “power cuts” and “coal price surges” have been significant concerns of individuals and societies. The main reasons for a power cut are a recent rapid increase in power consumption, shortage of thermal coal or the large shutdown capacity of thermal power units, resulting in a tight power supply in the power grid. In recent years, the shortage of fossil resources has led to frequent energy crises. In the context of carbon peaks and carbon neutralization, how to better develop electric-energy substitution and eliminate the dependence on fossil energy has become a problem that needs to be solved at present. In this paper, the influencing factors of electric-energy substitution in Beijing are analyzed, and the indexes affecting the electric-energy substitution are outlined. By constructing various machine-learning models, the prediction is performed. The results show that the Gaussian kernel support vector machine model based on a grid search has a good prediction effect on the electric-energy substitution potential in Beijing, which has certain guiding significance for electric-energy substitution potential analysis.

1. Introduction

In September 2020, China set a double-carbon target of peak carbon dioxide emissions by 2030 and carbon neutrality by 2060 at the 75th UN General Assembly, and further announced a series of new measures to enhance national independent contribution at the Climate Ambition Summit in December, which was highly praised and widely responded to by the international community.
China, as the world’s largest developing country in the process of rapid industrialization and urbanization, is currently in a critical period of the comprehensive construction of socialist modernization; the huge challenge is mainly from our comprehensive construction of modernization and people’s desire for economic development to live a better life, and the “double carbon” goal—our global commitment to take responsibility for this challenging task between the contradiction brought about, and the way to solve this problem, is to promote low-carbon green transformation and achieve sustainable development. At present, the process of achieving the “double carbon” goal is extremely challenging, and, in the coming period, the total amount of carbon-dioxide emissions will continue to increase, the pressure to reduce emissions is great, and the situation is grim. China’s power-system production and operation accounted for about 40% of the annual emission of carbon dioxide of the whole society, mainly from coal power; the carbon neutrality of the power system is a key component of China’s realization of the double-carbon goal. With an uh-high-voltage power grid leading China’s energy Internet construction, accelerating the promotion of the clean substitution of energy production on the production side and accelerating the promotion of energy consumption and electric-energy substitution (“two alternatives”) on the consumption side, the energy zero carbon revolution can lead the whole society to accelerated decarbonization, in order to achieve energy and power development and carbon decoupling. Decoupling economic and social development from carbon emissions (“double decoupling”) opens up a fast, low-cost and high-efficiency path to China’s carbon neutrality [1].
There are many factors that affect carbon emissions, such as industrial structure, economic development, energy use and technological level. The root cause is the exploitation and utilization of fossil energy. The key to solving the carbon-emission problem is to reduce the energy carbon emission. The fundamental solution is to change the energy development mode, accelerate clean substitution and electric-energy substitution, completely eliminate our dependence on fossil fuels, and eliminate carbon emissions from the source. Clean substitution refers to the substitution of solar, wind, water and other clean-energy sources for fossil energy generation in energy production, accelerating the formation of clean-energy-based energy-supply system, and meeting energy needs in a clean and safe manner. The substitution of electric energy means to replace coal, oil, gas and wood with electricity in the process of energy consumption, and use clean-power generation to accelerate the formation of an energy-consumption system centered on electricity, making energy use greener and more efficient.
To achieve carbon neutrality and build new power systems, China has carried out the work of replacing electric energy with coal, oil and clean electricity as the core principles. Electric energy has the characteristics and advantages of cleanness, safety, convenience and numerous sources. Therefore, in terms of energy consumption, research should focus on increasing the proportion of electric energy, reducing the combustion emission of finite fossil energy and alleviating severe environmental pressure [2,3]. Beijing, as the capital of China, has played a leading role in achieving the goal of carbon neutrality, proposing that carbon neutrality will be achieved by 2050, ten years ahead of the national goal. Therefore, it is of great significance to promote the achievement of electric-energy substitution better and faster in Beijing, and the analysis of electric-energy substitution potential has become very important. Furthermore, as a new method of low-carbon consumption, electric-energy substitution is increasingly attracting consumers’ attention. The analysis of electric-energy substitution potential can provide theoretical guidance and practical significance for fossil-energy exploitation, power-grid-development planning and power-load-peak regulation. At present, common potential assessment and analysis methods include ordinary econometric methods, such as the regression analysis method and combination prediction method [4], data envelopment model (DEA) [5], factor analysis model [6], grey prediction model [7], Bass model [8], system dynamics model [9] and machine-learning-based methods, such as the deep neural network method [10], support vector machine method [11] and many other methods. The current research on electric-energy substitution pays more attention to the prediction of energy demand: the literature [12,13,14] uses the STIRPAT model and ridge regression fitting to obtain multiple linear models of multiple influencing factors and targets, and obtains the influence degree of each factor on the target. The STRIPAT model [15] is an improvement of the famous environmental pressure assessment model IPAT [16], which considers the individual impacts of different changes in population, wealth and technology on the environment and eliminates the impact of those same changes. Shan Baoguo et al. [17] analyze, based on the STIRPAT model, the terminal electric-energy substitution quantity is obtained by ridge regression fitting, and the multiple linear models of resident population, per capita GDP, terminal electric-energy consumption intensity, energy price, energy consumption and policy support. Sun Yi et al. [18] present an intelligent modified prediction model based on a wavelet neural network embedded in the analysis model, and various model parameters in different scenarios are determined by decoupling the theoretical model and analyzing the development trend of terminal electric-energy substitution under multiple scenarios; an effective prediction is then made.
Fan Decheng et al. [19] select DGP, population and other influencing factors included as goald of a low-carbon economy, and predicted China’s electricity demand value in 2020; Lin Boqiang [20] analyze the long-term growth rate of China’s power demand from the macro-economic point of view with the power market demand as the constraint. Li Yuancheng and others [21] analyze the load of the power system and predicted it through the method of a support vector machine, which effectively improved the forecasting accuracy. Yuan Xiaohui and others [22] introduce, in detail, the application of a particle swarm optimization algorithm in power-load prediction and power-grid-expansion planning. Gao Haibing [23] proposes a particle swarm optimization algorithm based on connection structure optimization for neural network training, which can partially eliminate the influence of redundant classification parameters and redundant connection structures on classification performance. Compared with the BP algorithm and genetic algorithm, this algorithm can speed up the training convergence while improving the accuracy of classification errors. Li Changzu and others [24], based on the improved particle swarm optimization BP neural network, model and predict the potential of electric-energy substitution in Zhejiang Province.
The above literature makes effective predictions of electric-energy substitution potential and power load, but there are still the following deficiencies: first of all, the simulation and prediction of small sample capacity data is prone to overfitting and generalization, and secondly, the prediction methods based on the support vector machine do not select the parameters, which will have a certain impact on the prediction accuracy.
On this basis, this paper proposes an analysis method based on the power substitution potential of the grid-search Gaussian kernel support vector machine, which can effectively solve the overfitting problem for small samples by using the Gaussian kernel support vector machine, and the fitting parameters can be calibrated more accurately through grid search. The historical data of Beijing from 2001 to 2014 was used as the training set, and the historical data from 2015–2019 was used as the verification set to verify its effectiveness, in order to provide a reference for Beijing’s electric-energy substitution work.

2. Methodology

2.1. Gaussian Kernel Support Vector Machine Model Based on Grid Search

2.1.1. The Basic Principle of Grey Correlation Degree Analysis

Grey correlation analysis is a multi-factor statistical analysis method. In the current economic and social development, it has a good application in the analysis of the correlation between complex and random factors. Under the premise of incomplete and asymmetric information, it can be better used for the prediction of the development potential of electric-energy substitution projects to realize the primary and secondary relations between things and investigate correlation relations. Based on sample data, it judges whether a sequence is closely related through the similarity degree of the development trend of the data sequence, which is quantified by the correlation degree. The closer the curve is, the greater the correlation degree between the corresponding sequences is; otherwise, the smaller the correlation degree is.

2.1.2. Cross-Validation of Grid Search

Grid search is a common parameter adjustment method and an exhaustive method. Given a series of superparameters, and then exhaustive traversal of all the combinations of superparameters, an optimal set of superparameters is selected from all combinations; in fact, it is an excellent method to find the optimal solution from all solutions.
Why is it called a grid search? As it is assumed that there are two super parameters, and each super parameter has a set of candidate parameters. These two sets of candidate parameters can be combined pairwise, and all combinations are listed as a two-dimensional grid (multiple superparameter pairwise combinations can be regarded as a grid of high-dimensional space), and all nodes in the grid are traversed to select the optimal solution. Therefore, it is called grid search.
Using grid search will lead to a better performance on the test set than the real situation, because the test set is used to adjust the parameters, which will eventually be adjusted to the best performance on the test set. However, as shown in Figure 1, the sample size of the test set is small, and the sample size of the real situation should be much larger than that of the test set, so the distribution of the sample data of the test set is somewhat different from that of the real sample data.
Therefore, this approach divides the data set once more to simulate the real data set. Once divided, if the verification set is too small, the weaker and more haphazard will be the performance of the verification set to the whole data set, meaning that the result of parameter tuning may be worse for the whole data set. The method of cross-validation is introduced here to reduce contingency. The method of cross-validation is to group the original data into a specific classification method, which is divided into a training set and verification set. First, the classifier is trained with the training set, then the trained model is tested with the verification set, and the performance index of the classifier is evaluated by the error analysis of the verification set.

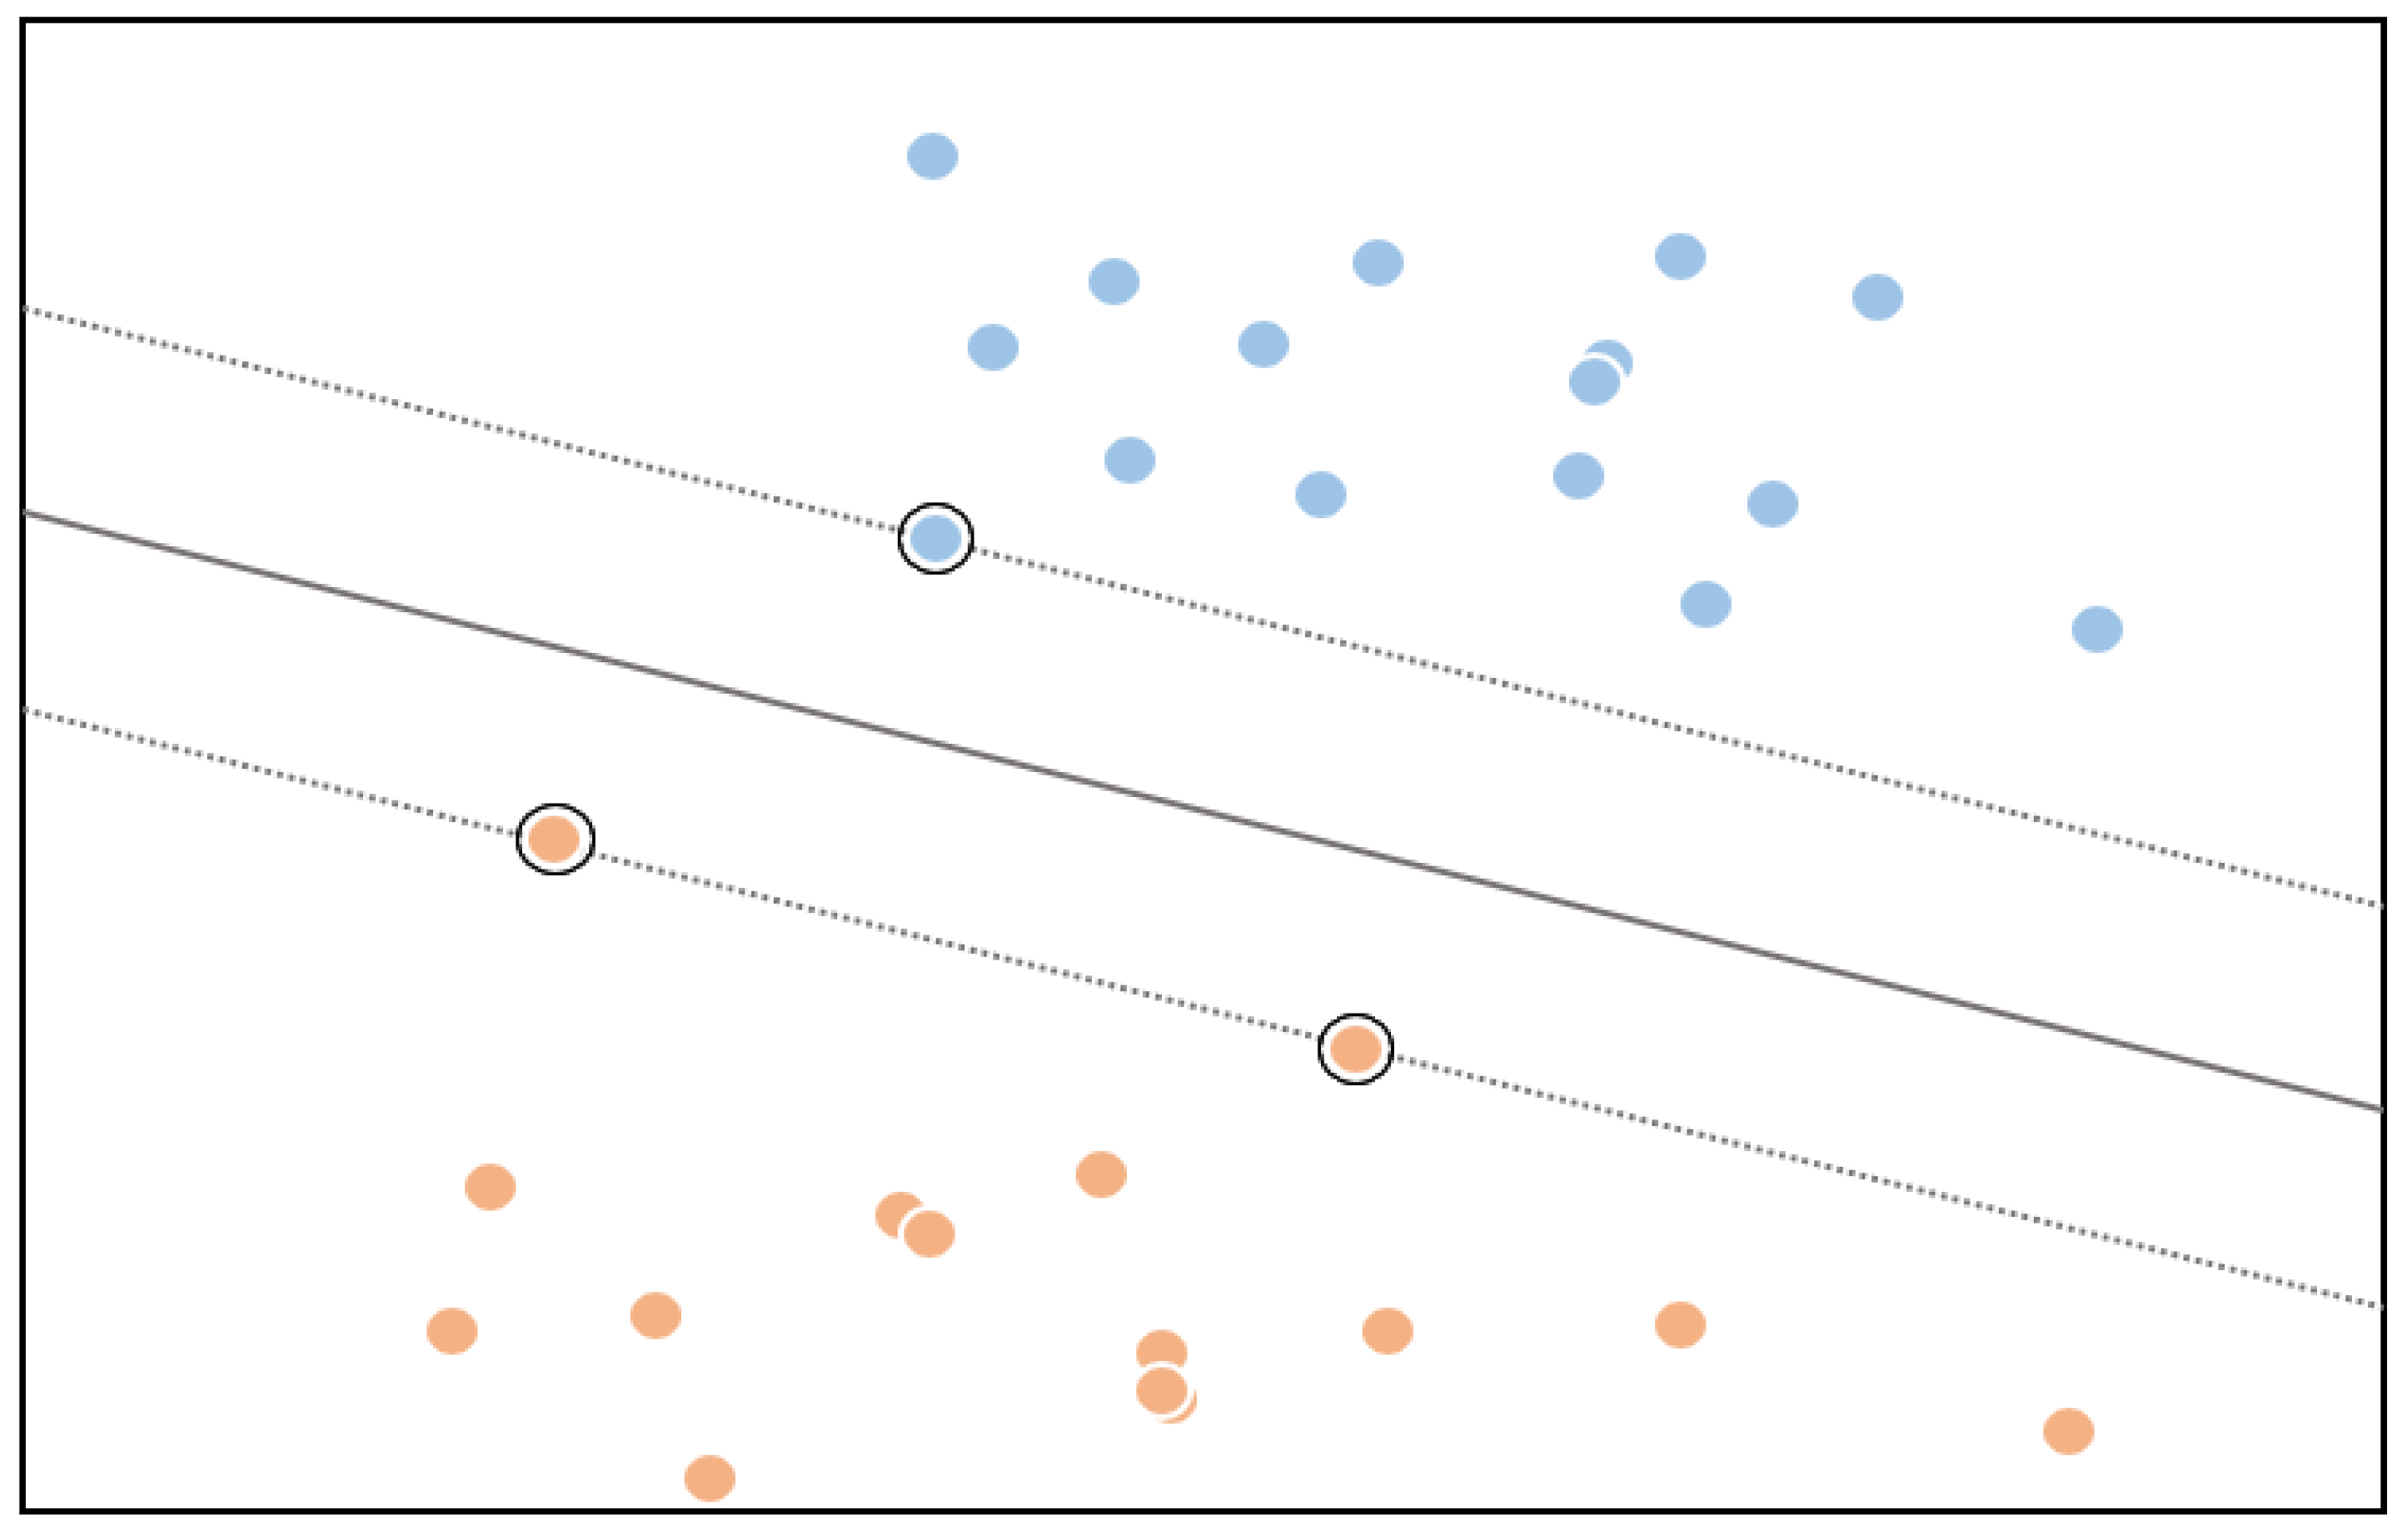
2.1.3. Gaussian Kernel Support Vector Machine

The basic idea of a support vector machine is to solve for the separation hyperplane that can correctly divide the training data set and has the largest geometric interval. Firstly, a hyperplane of one-dimensional or multi-dimensional space is constructed, which can be used for regression and classification. For linearly separable data sets, there are an infinite number of such hyperplanes, but the separated hyperplane with the largest geometric interval is unique. As shown in Figure 2, the three sample points on the boundary of the largest separated hyperplane are called “support vectors”.
In general, when linear non-separable problems are encountered, it is generally necessary to make the sample points separable through the high-dimensional hyperplane.
Given training vectors x i p , i = 1, …, n, and a vector y n   ε , -SVR solves the following primal problem:
m i n w , b , ζ , ζ * 1 2 w T w + C i = 1 n ( ζ i + ζ i * ) subject   to   y i w T ϕ ( x i ) b ε + ζ i , w T ϕ ( x i ) + b y i ε + ζ i * , ζ i , ζ i * 0 , i = 1 , , n
where C is the penalty factor; ζ i and ζ i * is the relaxation variable, w is the weight vector, and b is the degree of offset. As shown in Equation (1), first of all, a study needs to judge whether the predicted value of the sample is above or below the ε tube. According to the different point locations of the sample, the research punish the target sample by ζ i or ζ i * , respectively. Here, the researcher set a punishment distance ε , and punished the target sample when the distance between the predicted value and the real value was greater than ε .
The dual problem is
m i n z , z * 1 2 ( z z * ) T Q ( z z * ) + ε e T ( z + z * ) y T ( z z * ) subject   to   e T ( z z * ) = 0 0 z i , z i * C , i = 1 , , n
where e   is the vector of all ones, Q is an n by n positive semidefinite matrix, and Q i j K ( x i , x j ) = ϕ ( x i ) T ϕ ( x j ) is the kernel. As shown in Equation (2), here, training vectors are implicitly mapped into a higher (maybe infinite) dimensional space by the function ϕ .
The prediction is:
i S V ( z i z i * ) K ( x i , x ) + b

2.2. Model Accuracy Analysis
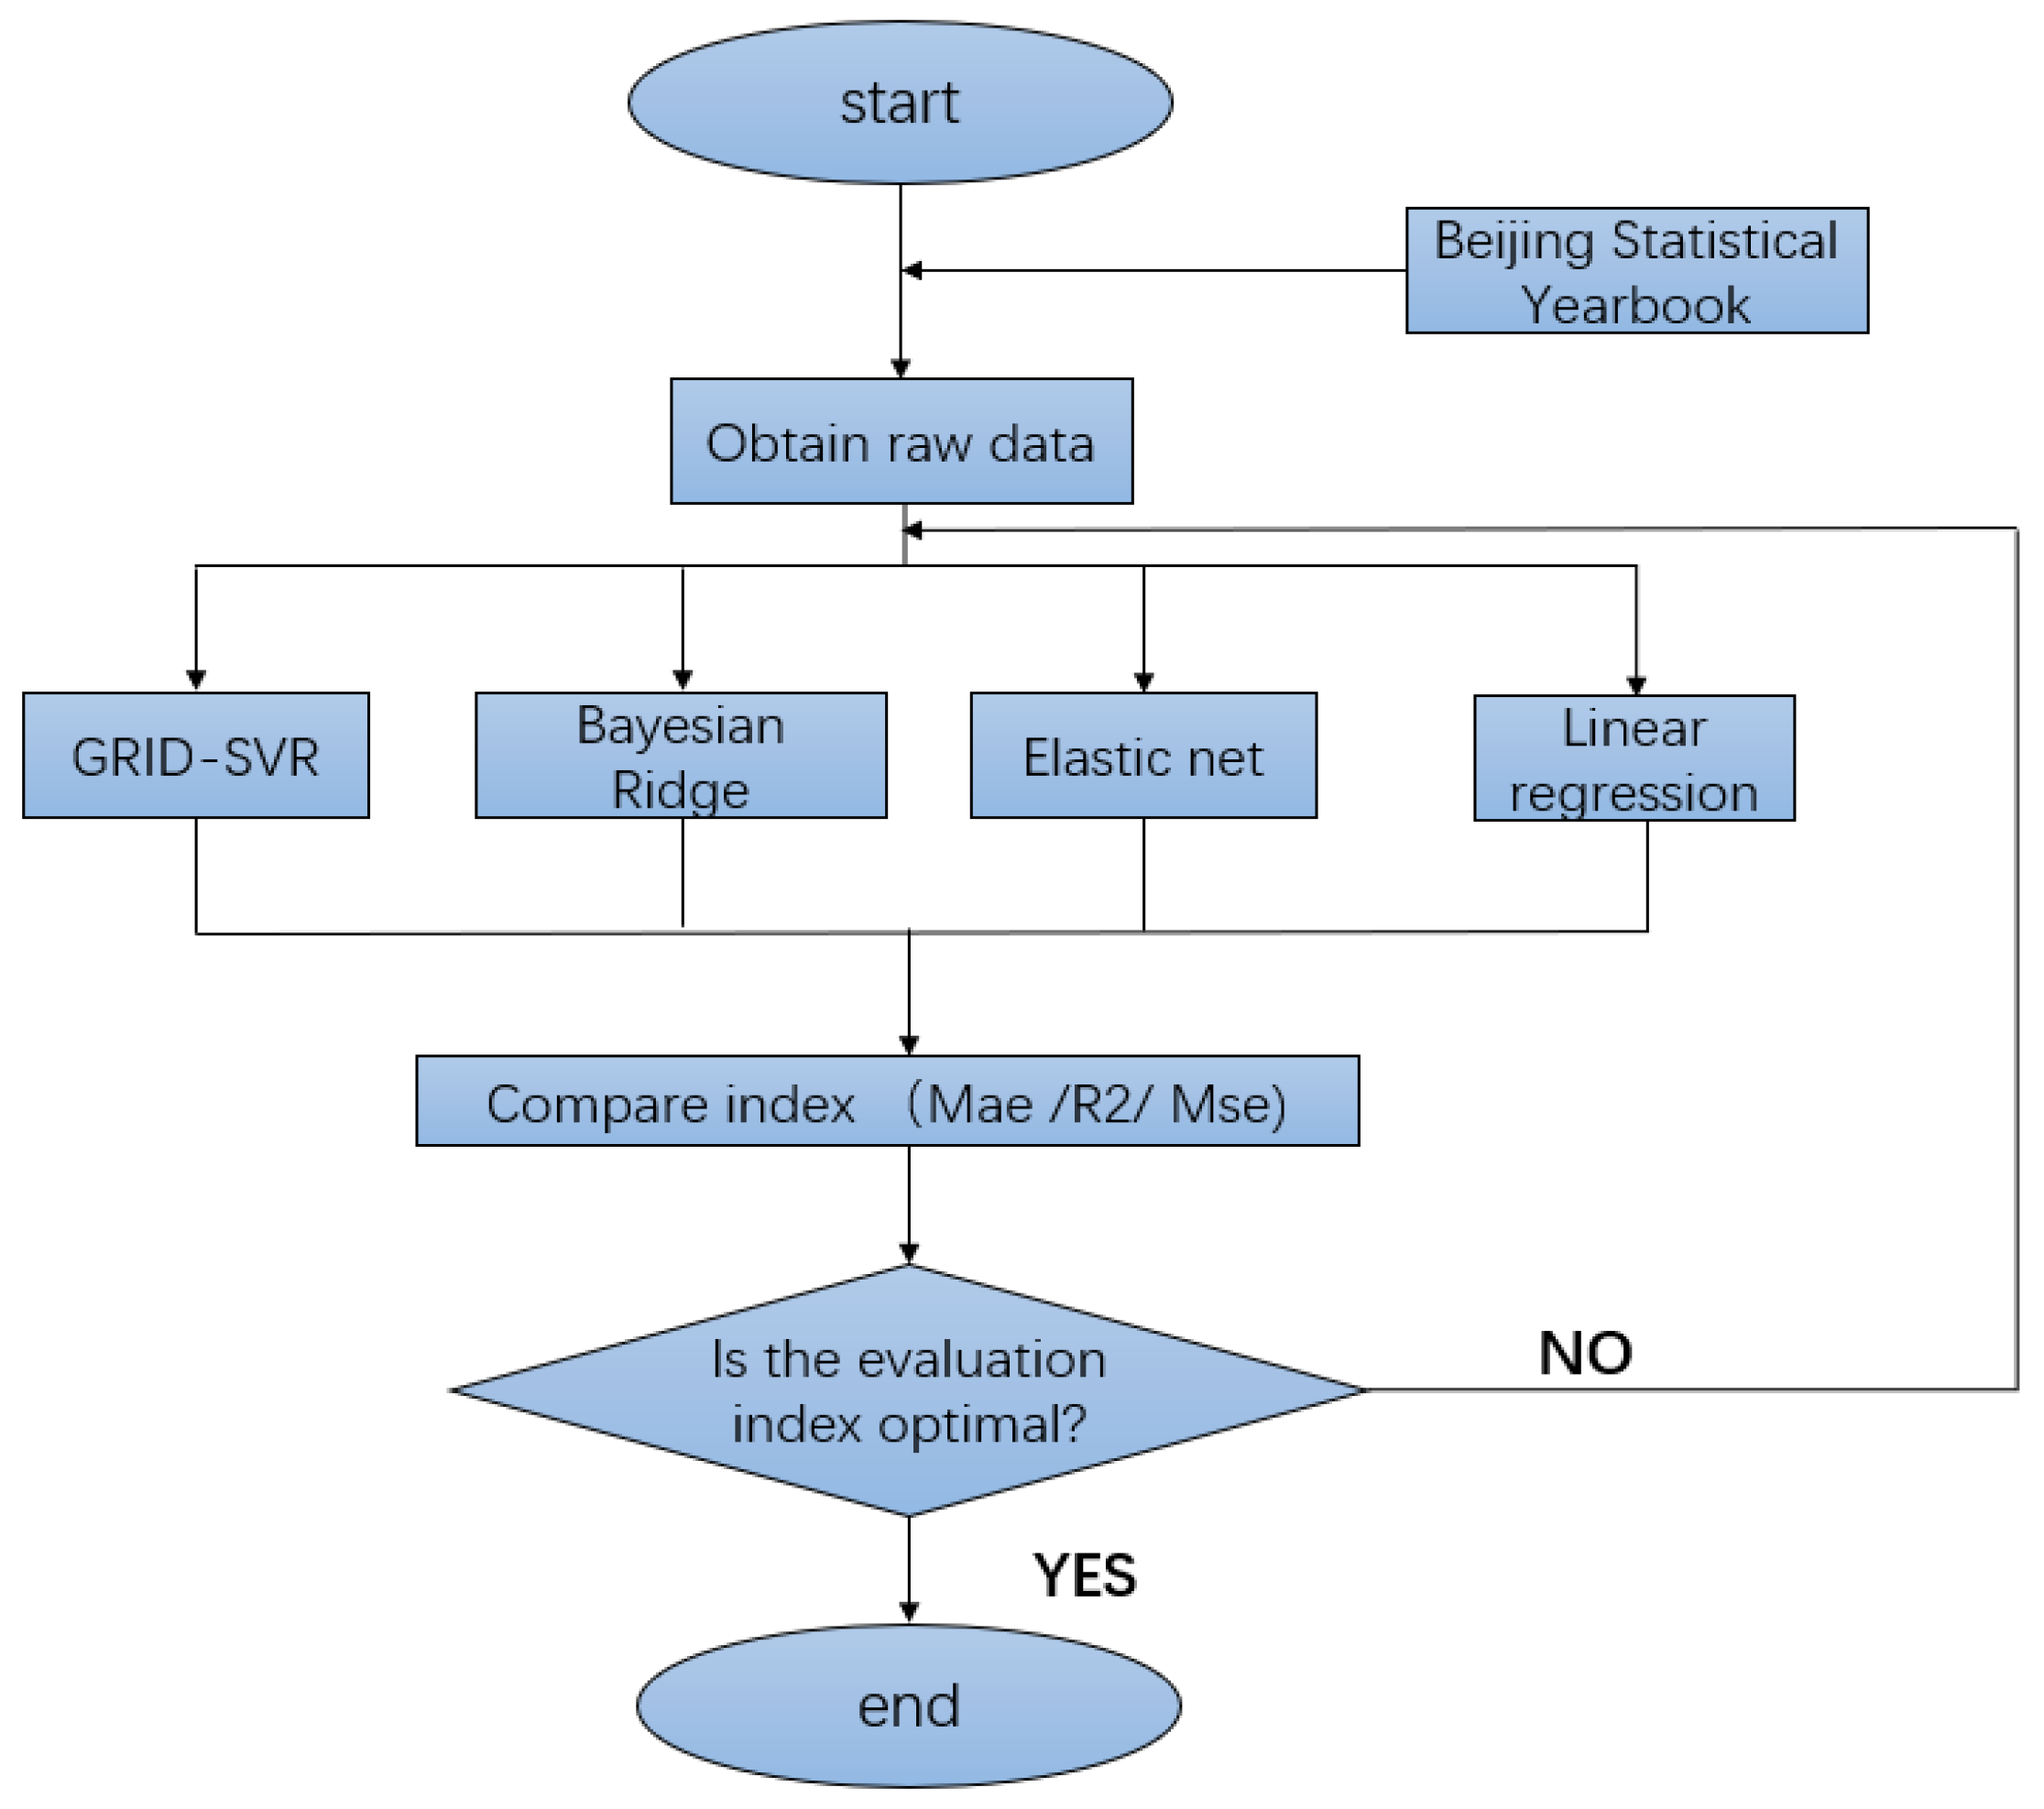
In this study, the mean square error ( M S E ) , mean absolute error ( M A E ) and R-squared (R2) are used to measure the accuracy of the prediction model. The research obtains the predicted value through machine learning through a regression model, and evaluates the quality of the regression model by the difference between the predicted value and the real value. The smaller the difference between the two values, the better the model fitting effect is. MSE (mean squared error) refers to the mean square of the difference between the predicted value and the real value. MSE can be used to evaluate the degree of change in data.
M S E = 1 m i = 1 m ( f i y i ) 2
where f i is the predicted value and y i is the true value. As shown in Equation (4), smaller M S E values indicate that the model describes experimental data with better accuracy. The comparison between models can be compared with it.
M A E (mean absolute error) refers to the average of the absolute values of the difference between the predicted value and the true value.
M A E = 1 m i = 1 m | f i y i |
where f i is the predicted value and y i is the true value. As shown in Equation (5), the smaller the M A E , the better. M A E is less sensitive to outliers. However, it is sensitive to mean and scale.
The measure of the R-squared (R2) (mean squared error) classification algorithm is the percentage of the correct rate, and there is also such a measure in linear regression-comparative accuracy.
R 2 = 1 i ( y ^ ( i ) y ( i ) ) 2 i ( y ¯ y ( i ) ) 2
where y ^ ( i ) is the predicted value, y ( i ) is the true value, and y ¯ is the average of the true value. As shown in Equation (6), R2 ∈ [−∞, 1], the more R2 tends to 1, the better. If the result is 1, it means that our model is correct. It is a normalized measure, which takes into account not only the difference between the predicted value and the true value, but also the difference between the true values of the problem itself.

3. Results

3.1. Data Description and Model Parameters

Electric-energy substitution is affected by a combination of factors, such as technological development, economy, policy measures, and user response [25].
In this study, eight indicators were selected as the influencing factors of Beijing’s alternative development of electricity, including power infrastructure investment, energy consumption, per capita GDP, total population, urbanization rate, renewable energy generation, electricity sales price, and coal and oil consumption. The potential of electric-energy substitution is affected by many factors. In this paper, the gray relationship analysis of each factor was firstly analyzed; the measure of the magnitude of the correlation that changes with time or different objects for the factors between the two systems is called the degree of association. In the process of system development, if the trend of change of the two factors is consistent, that is, the degree of synchronous change is higher, it can be said that the degree of correlation between the two is higher; if converse, it is lower. Therefore, the gray association analysis method is based on the degree of similarity or difference in the development trend between factors, that is, the “gray correlation degree”, as a measure of the degree of correlation between factors. The factors with high correlation were taken as the input data of the prediction model to accurately predict the potential of electric-energy substitution. The correlation between each influencing factor was tested by Python software by using the grey association analysis method to obtain the correlation between each factor and the energy substitution potential, as shown in Table 1.
Therefore, based on the above factors, the research selected four key factors: urbanization rate, total energy consumption, per capita GDP and carbon dioxide emissions, to quantitatively analyze the process of power substitution.
At present, there is no unified standard for the quantification of electric-energy substitution potential, so the research used the widely used electric-energy substitution quantity to quantify the potential of electric-energy substitution [18]. Let the actual electric energy consumption in the nth year be E f ( n ) , and the total terminal energy consumption be E q ( n ) . If the terminal energy consumption pattern is maintained at the level of the nth year, the proportion of electric energy in the terminal energy is the same as that in the nth year, so the increase in electric-energy consumption in the n th + 1 year compared with that in the previous year is defined as the annual electric-energy replacement in the n th + 1 year.
E s u b ( n + 1 ) = E f ( n + 1 ) E q ( n + 1 ) E f ( n ) E q ( n )
where: E s u b ( n + 1 ) is the electric-energy replacement amount in the n + 1 year; E f ( n + 1 ) is the actual electric-energy consumption in the n + 1 year; and E q ( n + 1 ) is the total terminal energy consumption in the n th+1 year. Since technology replacement and policy measures have a lag, and the research needed to consider the impact of the policy or technology update in the previous period on the replacement of electric energy in this period, the research set the replacement of electric energy in the base period as zero and calculated the cumulative replacement of electric energy in each year to represent the replacement potential of electric energy.
E ( n ) =   E s u b ( n )
where E ( n ) is the cumulative electric-energy substitution amount in the nth year, which is the sum of the electric-energy substitution amounts before the nth year.
This paper selected the data of Beijing’s electric-energy substitution potential indicators from 2001 to 2019: urbanization rate, electric energy consumption, per capita GDP and CO2 emissions as input variables, and Beijing’s electric-energy substitution electricity as output variables.
Among them, the data from 2001–2014 was selected as the training set of the model and the data was normalized; the data from 2015–2019 was selected as the verification set of the model, as shown in Table 2; and the validity of the prediction model was tested by comparing the data of the verification set with the real data.
The flowchart of the cumulative electrical-energy substitution prediction model is shown in Figure 3.

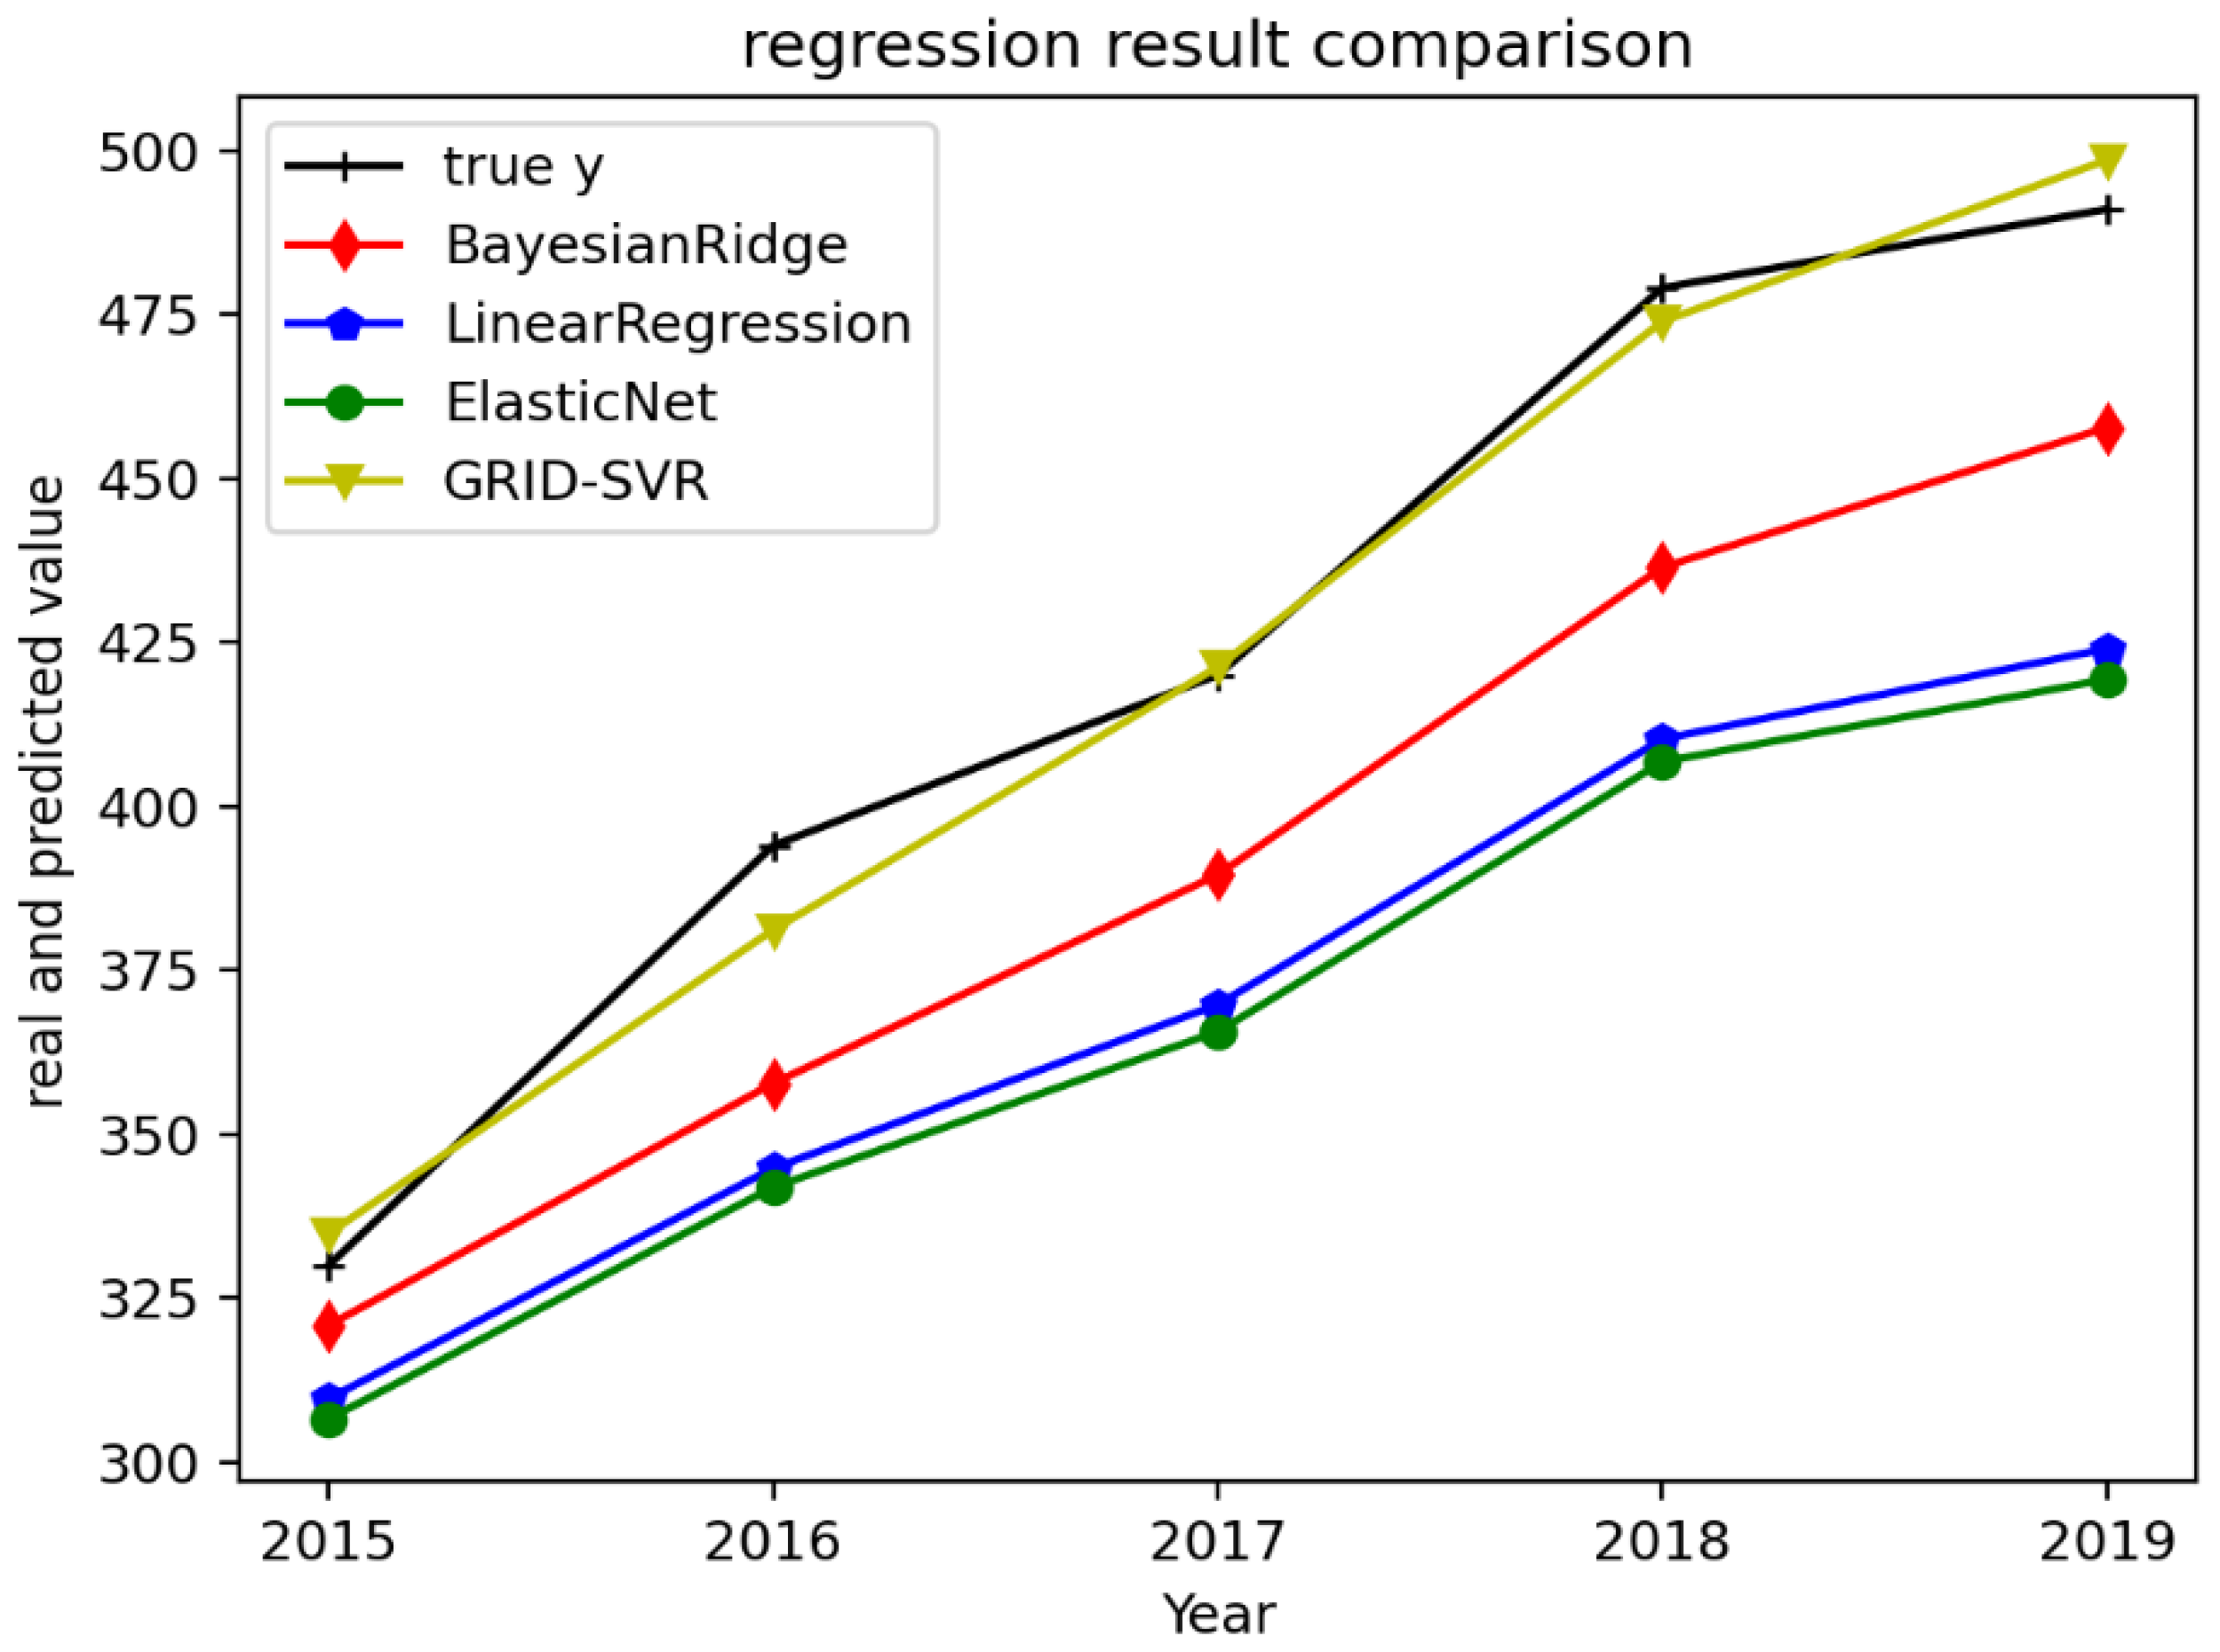
3.2. Forecasting Results of the Prediction Models

To verify the effectiveness of the GRID-SVR cumulative electric-energy substitution model described in this study, the development of electric-energy substitution in Beijing in recent twenty years was taken as an example. The data samples of the factors affecting the substitution of electrical energy from 2001 to 2014 were used as data samples. The cumulative amount of electrical energy substitution for 2015–2019 was predicted using linear regression, GRID-SVR, Bayesian Ridge regression and elastic network regression, to compare the prediction results with the real data and visualize them in the form of line charts, as shown in Figure 4. The penalty parameter CS and kernel function parameter GS in the GRID-SVR cumulative electric-energy substitution prediction model were obtained by grid search and cross-verification.
Through the selection and application of influencing factors and prediction models, the fitting results of the cumulative amount of electrical-energy substitution in Beijing from 2014 to 2019 are shown in Figure 4. The fit accuracy and precision of the support vector machine is higher than linear regression, Bayesian Ridge regression and elastic network regression. This is because the support vector machine is based on the principle of minimizing structural risk, and has good generalization ability, especially for nonlinear models, so results can be analyzed relatively accurately with relatively little reference data. However, due to the need to select parameters from the traditional support vector machine, different parameters have different effects on the fitting effect, affecting the accuracy of the fit, and the randomness and subjectivity of the parameter selection affect the accuracy of the fit. The algorithm in this paper has further improved the fitting effect after optimizing the parameter selection based on grid search cross-validation.
In order to further quantify the prediction model effect, the determination coefficient R2, MSE (mean square error) and MAE (mean absolute error), which describe the fitting degree of four kinds of prediction models, were calculated, respectively. As shown in Table 3, compared with linear regression, it can be found that the GRID-SVM method is more suitable for processing nonlinear data, with an R2 value of 0.98, which is about 0.28 higher than Bayesian Ridge regression; this is because the support vector machine can project sample points to a high-dimensional plane through the kernel function when faced with linear indivisibility problems. The MSE (mean squared error) and MAE (average absolute error) are also significantly better than the other three prediction models, so the optimized GRID-SVR model has higher prediction accuracy. In summary, the GRID-SVR method proposed in this paper achieves an effective prediction of the accumulated amount of electrical-energy substitution, which has theoretical and practical significance for subsequent power planning and output.

4. Discussion

In this study, the relationship between the influencing factors of cumulative electric-energy substitution and cumulative electric-energy substitution is nonlinear, and the nonlinear prediction accuracy of these models is usually low. The results of this study confirm this hypothesis. GRID-SVR adopts the principle based on structural risk minimization, and has good generalization ability, especially for nonlinear models, so it can be analyzed relatively accurately even if the amount of reference data is relatively small. The results of this study are consistent with those of previous studies [14,16]. The accuracy of the prediction model was evaluated. GRID-SVR is superior to other prediction models in all evaluation indexes of model fitting accuracy, in which R2 reaches 0.98, which is 0.28 higher than the second best, the Bayesian ridge regression model, and MAE and MSE indexes are also significantly superior to other prediction models. This is because the grid search cross-validation method optimizes the kernel function parameters and penalty parameters GS of the support vector machine model, so that the penalty parameters CS and kernel function parameters GS are the best.
This study can analyze the potential of regional electric-energy substitution by predicting the electric-energy substitution quantity in the future, standardize the identification of electric-energy substitution project, accelerate the development of the electric-energy substitution strategy, realize the transformation of energy-development modes, and ensure the scientificity and standardization of electric-energy substitution work.
There are still some shortcomings in this study, which can be improved in future studies. First of all, the sample size of this study is insufficient, and only the data from 2001 to 2019 were counted, which can be further expanded in time to increase the reliability of the samples. Secondly, quantitative evaluation indexes can be added to the selection of influencing factors of electric-energy substitution, and the correlation of influencing factors can be evaluated.

5. Conclusions

China’s 2060 carbon-neutrality target and the construction of a new power system makes electric-energy substitution particularly important. Especially, the consumption side of the energy-substitution prediction of new power-system construction and the realization of carbon-neutrality goals have an important role. The purpose of this research was to construct four kinds of electric-energy substitution models and analyze the prediction effectiveness of the amount of electric-energy substitution. The conclusions are as follows:
In this study, the key factors affecting electric-energy substitution (urbanization rate, electric energy consumption, carbon dioxide emissions, and per capita GDP) were quantitatively analyzed, and the potential of electric-energy substitution in Beijing was analyzed by using the amount of electric-energy substitution as a quantitative index.
This study proposes a GRID-SVR cumulative electricity substitution prediction model, which fits the relevant data of electric-energy substitution in Beijing from 2015 to 2019, and compares the three evaluation indicators of the four prediction models, the results show that the GRID-SVR model has obvious advantages in processing small samples and nonlinear data, which can solve well the problems of overfitting and generalization, and can effectively improve the prediction accuracy of the cumulative electricity substitution amount and reasonably analyze the potential of electric-energy substitution.
This study provides quantitative theoretical support for the development trend and potential analysis of electric-energy substitution, which can better guide the production side of electric-energy capacity planning, consumer-side power-load forecasting, and has significance as a reference for encouraging Beijing to reduce carbon emissions, achieve double-carbon targets, and build a new power system.

Author Contributions

Conceptualization, Y.Z. and Y.C.; methodology, Y.Z., G.L. and Y.Y.; software, Y.Z.; validation, Y.C., Y.Y. and Y.Z.; formal analysis, Y.Z.; investigation, Y.Z.; resources, Y.Z.; data curation, G.L. and Y.Y.; writing—original draft preparation, Y.Z.; writing—review and editing, Y.C.; visualization, Y.Z.; supervision, Y.C.; project administration, Y.C.; funding acquisition, Y.C. All authors have read and agreed to the published version of the manuscript.

Funding

This study was supported by The Humanities and Social Sciences Planning Fund Project of the Ministry of Education (21YJA790009).

Data Availability Statement

Beijing Statistical Yearbook (http://nj.tjj.beijing.gov.cn/nj/main/2021-tjnj/zk/indexch.htm (accessed on 15 January 2022)), China Carbon Accounting Database (ceads.net (accessed on 23 January 2022)).

Acknowledgments

The authors gratefully appreciate the reviewers for their constructive comments and suggestions.

Conflicts of Interest

The authors declare no conflict of interest.

References

  1. Liu, Z. Electric energy substitution is an important way to achieve carbon peak carbon neutrality. Report. Obs. 2021, 13, 25–27. [Google Scholar]
  2. National Development and Reform Commission; National Energy Administration; Ministry of Finance. Guiding Opinions on Promoting Electric Energy Substitution; Development and Reform Energy [2016] No. 1054; National Development and Reform Commission: Beijing, China, 2016. [Google Scholar]
  3. Yan, T.; Cheng, H.; Zeng, P. Architecture and key technologies of energy Internet. Power Grid Technol. 2016, 40, 105–113. [Google Scholar]
  4. Tang, J.; Liu, J.; Yang, K.; Liu, Y. Short-term load combination forecasting by grey model and least square support vector machine. Power Syst. Technol. 2009, 33, 63–68. [Google Scholar]
  5. Song, H.; Hou, Y.; Wang, L. Apparent potential of energy saving and emission reduction analysis based on DEA model. Environ. Pollut. Prev. 2015, 37, 100–105. [Google Scholar]
  6. Zheng, J. Analysis of Rural Electric Energy Substitution Potential and Environmental Benefits. Ph.D. Thesis, North China Electric Power University, Beijing, China, 2015. [Google Scholar]
  7. Wang, A. Grey Forecasting Model and Application of Medium and Long Term Power Load Forecasting. Ph.D. Thesis, Huazhong University of Science and Technology, Wuhan, China, 2013. [Google Scholar]
  8. Liu, T.; Chen, K. Research on diffusion model of new energy vehicles in china based on bass model. Enterp. Econ. 2016, 11, 115–118. [Google Scholar]
  9. Lv, T.; Zhang, M.; Lei, Q. Scenario analysis and forecast of India’s energy and coal demand based on system dynamics. Resour. Sci. 2015, 6, 1199–1206. [Google Scholar]
  10. Liu, L.; Huang, T.; Fu, Y. Neural network prediction method of critical section considering meteorological factors. Power Grid Technol. 2016, 40, 3399–3405. [Google Scholar]
  11. Luo, N.; Zhu, Y.; Du, C. Application of Support Vector Machine in Power Load Forecasting. Power Grid Technol. 2007, 31, 215–218. [Google Scholar]
  12. Huang, R.; Wang, Z. Influencing factors of carbon emissions from energy consumptions in Chongqing. Acta Sci. Circumstantiae 2013, 33, 602–608. [Google Scholar]
  13. Jiao, W.; Chen, X. Environmental impact analysis of Gansu province based on the STIRPAT model. Resour. Environ. Yangtze Basin 2012, 21, 105–110. [Google Scholar]
  14. Lu, N.; Qu, F.; Feng, S.; Shao, X. Trends and determining factors of energy consumption carbon footprint—an analysis for Suzhou-Wuxi-Changzhou region based on STIRPAT model. J. Nat. Resour. 2011, 26, 814–824. [Google Scholar]
  15. Diezt, T.; Rosa, E.A. Rethinking the environmental impacts of population, affluence and technology. Hum. Ecol. Rev. 1994, 1, 277–300. [Google Scholar]
  16. Wang, Y.; Wang, X.; Sun, C.; Lu, X. Research on the application of IPAT and its extended model. Chin. J. Appl. Ecol. 2015, 26, 949–957. [Google Scholar]
  17. Shan, B.; Zhao, J.; Jia, D. Electric power substitution potential analysis method based on STIRPAT-ridge regression. Distrib. Util. 2018, 35, 68–73. [Google Scholar]
  18. Sun, Y.; Shan, B.; Cao, Y. Analysis method of electric energy substitution potential based on particle swarm optimization support vector machine. Power Grid Technol. 2017, 41, 1767–1771. [Google Scholar]
  19. Fan, D.; Wang, S.; Zhang, W. Research on China’s power demand forecast under the goal of low-carbon economy. Power Grid Technol. 2012, 36, 19–25. [Google Scholar]
  20. Lin, B. Structural change, efficiency improvement and energy demand forecast-taking China’s electric power industry as an example. Econ. Res. 2003, 19, 57–65. [Google Scholar]
  21. Li, Y.; Fang, T.; Yu, E. Study of support vector machines for short-term load forecasting. Proc. CSEE 2003, 23, 55–59. (In Chinese) [Google Scholar]
  22. Yuan, X.; Wang, C.; Zhang, Y.; Yuan, Y. A survey on application of particle swarm optimization to electric power systems. Power Syst. Technol. 2004, 28, 14–19. [Google Scholar]
  23. Gao, H.; Gao, L.; Zhou, C.; Yu, D. Particle swarm optimization based algorithm for neural network learning. Acta Electron. Sin. 2004, 32, 1572–1574. [Google Scholar]
  24. Li, C.; Niu, D.; Zhang, X.; Miao, B. Prediction model of Zhejiang electric energy substitution potential based on improved particle swarm optimization BP neural network. Sci. Technol. Eng. 2020, 20, 5173–5179. [Google Scholar]
  25. Yin, H. Research on Evaluation Method of Electric Energy Replacing Other Energy Sources in Energy-Saving and Emission-Reducing Environment. Ph.D. Thesis, North China Electric Power University, Beijing, China, 2013. [Google Scholar]
Figure 1. Cross-validation packet.
Energies 15 03897 g001
Figure 2. The SVM classifier.
Energies 15 03897 g002
Figure 3. Flow chart of cumulative electric-energy substitution prediction model.
Energies 15 03897 g003
Figure 4. Comparison of cumulative electric-energy substitution prediction of four prediction models.
Energies 15 03897 g004
Table 1. Degree of correlation between each factor and electric-energy substitution potential.
FactorsDegree of CorrelationFactorsDegree of Correlation
Total energy consumption0.97Coal and oil consumption0.72
Per capita GDP0.95Investment in power infrastructure0.84
Renewable energy generation0.83Urbanization rate0.93
Sales of electricity0.87CO2 emissions0.92
Table 2. Research data related to electric-energy substitution in Beijing from 2001 to 2019.
YearUrbanization Rate (%)Electric Energy Consumption
(Ten Thousand Tons of Standard Coal)
Per Capita GDP (Yuan)CO2 Emissions
(Million Tons)
Cumulative Electric
Energy Substitution
(Ten Thousand Tons of
Standard Coal)
20190.871434164,22071491
20180.871404153,09571479
20170.871311137,59670420
20160.871254124,51675394
20150.871171114,66283330
20140.861152107,47289306
20130.861122101,02387295
20120.86107593,07896273
20110.86101086,36595235
20100.8699578,30797226
20090.8590871,05996192
20080.8584868,54192164
20070.8582063,62980142
20060.8475253,43881122
20050.8470147,18295120
20040.862742,4027735
20030.7956736,5836935
20020.7954132,2316434
20010.7849228,097629
Source: Beijing Statistical Yearbook, China Carbon Accounting Database (ceads.net (accessed on 23 January 2022)).
Table 3. Evaluation of fitting degree of four forecasting models.
Model Error Analysis
MODELR2MAEMSE
Bayesian Ridge0.730.31048
Linear Regression0.1651.12912
Elastic Net0.0454.73311
Grid-SVR0.986.354
Publisher’s Note: MDPI stays neutral with regard to jurisdictional claims in published maps and institutional affiliations.

