Abstract
Liquefied natural gas (LNG) is regarded as the cleanest among fossil fuels due to its lower environmental impact. In power plants, it emits 50–60% less carbon dioxide into the atmosphere compared to regular oil or coal-fired plants. As the demand for a lower environmental footprint is increasing, fuel cells powered by LNG are starting to appear as a promising technology, especially suitable for off-grid applications, since they can supply both electricity and heating. This article presents a techno-economic assessment for an integrated system consisting of a solid oxide fuel cell (SOFC) stack and a micro gas turbine (MGT) fueled by LNG, that feeds the waste heat to a multi-effect desalination system (MED) on the Greek island of Patmos. The partial or total replacement of the diesel engines on the non-interconnected island of Patmos with SOFC systems is investigated. The optimal system implementation is analyzed through a multi-stage approach that includes dynamic computational analysis, techno-economic evaluation of different scenarios using financial analysis and literature data, and analysis of the environmental and social impact on the island. Specific economic indicators such as payback, net present value, and internal rate of return were used to verify the economic feasibility of this system. Early results indicate that the most sensitive and important design parameter in the system is fuel cell capital cost, which has a significant effect on the balance between investment cost and repayment years. The results of this study also indicate that energy production with an LNG-fueled SOFC system is a promising solution for non-interconnected Greek islands, as an intermediate carrier prior to the long-term target of a CO₂-free economy.
Keywords:
energy system analysis; island energy system; Aspen Plus; LNG; SOFC; MED; non-interconnected islands 1. Introduction
In September 2020, in the framework of the European Green Deal, the European Commission recommended raising the 2030 greenhouse gas (GHG) emission reduction target to at least 55% below 1990 levels, since governments and industries are confronting major challenges on account of the environmental impact of air pollution [1]. Measures to improve energy efficiency are certainly an important incentive for reaching climate protection and sustainability goals and are therefore recognized as high-importance goals under the United Nations sustainable development goals (SDGs). To achieve such an ambitious vision, non-interconnected systems should be addressed, as they are environmentally expensive due to their geographical characteristics and there is a substantial margin for improvement in terms of various challenges with regard to their energy self-resilience and their decarbonization.
Specifically, island systems, as typical non-interconnected electrical systems, exhibit vital issues regarding their energy efficiency, as a series of their characteristics contribute to an increase in cost and uncertainty of electricity generation, which leads to an increased cost of electricity supply [2]. The Valletta political declaration on clean energy for EU Islands on 18 May 2017 recognized EU islands as the potential forerunners in the transition to a sustainable economy because they have the most pressing energy demands. Therefore, the EU is encouraging the development of cutting-edge technologies and initiatives that are accelerating their clean energy transition [3].
The majority of islands still rely on oil- and diesel-fueled generators, which are not environmentally friendly and must be ferried in by sea in order to be imported. Therefore, many islands confront significant additional energy expenditures. Furthermore, non-interconnected islands (NII) are often small, and therefore unable to benefit from the cost advantage of large-scale generation capacity based on economies of scale. At the same time, significant technical challenges arise, as the requirement to meet the energy demand at all times, the integration of higher intermittent renewable energy sources (RES) capacity, and the electrification of the transportation sector have a significant impact on the operation of island systems.
The situation is similar in Greece, where the NII are predominantly powered by inefficient and costly diesel generators. Lignite, which accounted for roughly 29% of electricity output in 2018, as well as RES such as hydropower, wind, solar energy, and biomass, which accounted for 11%, 12%, 7.5% and 0.6%, respectively, are the main domestic energy sources. The Greek regulatory system imposes a public service obligation (PSO) on consumers on the islands to deliver energy at the same rates as mainland consumers. A fee charged to all power consumers compensates island suppliers for the difference between their higher generation costs and the system marginal price on the mainland. The total cost for this PSO lies around EUR 600 M per year.
One of the key targets of the new Greek National Plan for Energy and Climate (NPEC) is the integration of the island systems into the mainland transmission system based on their economic and technical feasibility [4]. Interconnections are also important for the government’s energy policy, as they improve electricity supply security and help meet GHG reduction goals. The benefits of improved connectivity between the islands and the main grid include lower diesel generation costs and lower PSO for all power consumers. Many islands are scheduled to be connected to the mainland electrical system during the following decade, resulting in a substantial increase in demand. This will minimize any challenges regarding seasonal variability, fuel price volatility and the power demand of the continuously growing tourism industry [3]. One of the additional key ambitions for the coming years is connecting some island systems with a liquefied natural gas (LNG) grid.
In recent years, the LNG business has grown to a significant percentage of the energy market, and natural gas is now playing a vital role in satisfying the current energy demand. While technologies of natural gas depot searching have been developed, the unit cost of extraction has been reduced. Additionally, transport technologies have been improved, and the soaring demand for natural gas has led to a competitive market composition [5]. There were 24 large-scale LNG terminals in 11 EU Member States in 2020, as well as two small-scale terminals in Sweden and Finland, two of which were floating storage over re-gasification units [6]. Natural gas appears to be an essential element of the energy mix, allowing countries of the EU to achieve their climate objectives for decarbonization.
For Greece, under EU National Assistance Regulations, the European Commission has approved a Greek subsidy of EUR 166.7 M to build a new LNG terminal in Alexandroupoli, Greece. The project will strengthen the energy supply security and diversification in Greece and the general region of Southeast Europe [6]. The Alexandroupoli independent natural gas system (INGS) aims to develop a floating LNG terminal at the southwest side of Alexandroupoli, close to the Aegean Sea. The project is being developed by the Greek company Gastrade. The floating storage regasification unit will have an overall delivery capacity of 5.5 billion cubic meters per year. LNG will be transported from the floating unit to the Greek natural gas network via the underwater and onshore sections of the gas transmission pipeline.
New technical solutions are emerging to preserve living standards while moving toward more sustainable use of natural resources, as increasing concerns about anthropogenic GHG emissions grow around the world. Among sustainable technologies, fuel cells are attracting increasing interest for stationary and portable applications, as they can achieve high energy efficiency and low environmental impact [7]. Fuel cells are energy conversion devices that generate electricity and heat through an electrochemical reaction between fuel molecules and oxygen molecules.
According to “Research and Market, 2019” the stationary fuel cell market will grow to USD 5.08 billion by 2030. The biggest share of this market is located in Europe, Japan, and the USA [8]. Three primary fuel cell technologies, molten-carbonate fuel cells (MCFC), solid oxide fuel cells (SOFC), and phosphoric acid fuel cells (PAFC), are manufactured and widely used in large-scale states [9]. A major advantage occurs when fuel cell technologies are integrated with electrolyzers, forming hydrogen storage systems. Such storage cycles enable the exploitation of surplus green energy generated by intermittent renewables. The authors in [10] examine such opportunities, proposing an optimal scheduling model for robust optimal scheduling of isolated microgrids, considering also various demand-response programs.
Specifically, SOFCs are entirely of solid-state construction and are considered to hold great promise as highly efficient power generation systems with low carbon emissions and fuel flexibility. This type of fuel cell operates at high temperatures, typically around 900 °C, making it a suitable candidate for integration with other power generation systems. Hydrocarbons, particularly natural gas, are ideal fuels for SOFCs, because they require greater temperatures in the stack for reforming [11]. Several hybrid systems have been proposed, the most common of these being the combination of a SOFC and a micro gas turbine (SOFC-MGT) [12]. The gas turbine allows the system to respond more quickly to sudden variations in electricity demand. This system can therefore be considered a robust solution for network stability problems, which are more pronounced for large penetration of RES in the local energy mix. Simulation results indicate that the proposed system can achieve a net electrical efficiency of more than 60% and a system efficiency, including waste heat recovery for steam generation, of more than 80% [13]. The ability to achieve electrical efficiency rates above 60% using solid oxide fuel cells (SOFCs) makes them especially suitable for off-grid applications, since they can supply both electricity and heating. Additionally, in this scenario, waste heat is optimally used to cover the heat requirements of desalination plants to produce clean water for the island’s population.
The present article proposes a hybrid cogeneration system, whereby the SOFC primarily provides the system’s baseload using LNG as fuel. The use of the island’s existing conventional electricity stations and its complementarity with modern clean technologies has been examined in this work, recognizing the need for a planned, systematic transition in a way similar to that proposed in existing research [13,14]. The aim of the present study is to investigate, from a technical and an economical point of view, the prospect of using LNG combined with high-efficiency energy conversion systems in NII, as an intermediate energy carrier before reaching the total decarbonization era. A numerical model that is presented is used to generate optimized solutions for electricity supply, depending on the energy demand in NII. Its applicability is suited to isolated energy systems, and it follows the growing political consensus opposed to non-sustainable subsidy schemes that support fossil fuel-based electricity production.
This study examines the techno-economic viability of SOFC integration in small NII with LNG as a transition fuel until the required infrastructure for H2 is established. The main aspects of the study include:
- The use of a two-step approach for the techno-economic evaluation of the system. In the first step, a simplified optimization model produces a viable estimate for the capacity of the fuel cell. The second step performs a detailed economic evaluation considering also secondary income streams, such as waste heat to desalination.
- A sensitivity analysis on the assumed costs. The performed analysis aims to explore the variability of the investment due to the versatility of fuel prices, and especially the LNG price, which is vulnerable to the recent war events in Ukraine
The methodology followed can serve as a replicable case for other small NII, as it does not require high investment costs, while at the same time sets the stage for the H2 era.
Despite ongoing interconnection projects, the majority of the Aegean Sea islands will continue to produce electricity in a business-as-usual manner. In the short and medium term, it is not expected that interconnection to the main grid will be a universal solution for all islands. For the present scenario, the island of Patmos is selected as a potential island to be connected to the LNG grid in the near future. This allows exploration of the role of power system size in designing energy transition strategies. Studying, thus, a relatively wide spectrum of electricity demand profiles provides valuable insights that could be generalizable to a broader context providing guidance for other islands with similar characteristics.
2. Methodology
The methodology followed in the present work combines technical and economic evaluations through a multistep approach, as presented in Figure 1.
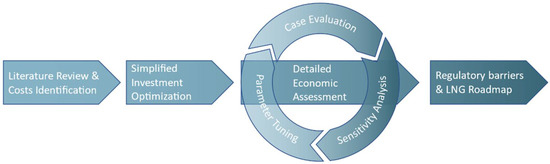
Figure 1.
Methodology followed for the techno-economic assessment of the SOFC unit.
The first step of the methodology involves the literature review and market research required to identify representative costs and trends that will lead to reliable results. In the next step, a preliminary investment optimization is formulated as a linear optimization problem to gain an initial cost-effective estimate for the SOFC sizing along with grid operation data. This information is used as an input for step 3, where the detailed economic assessment takes place. Furthermore, a sensitivity analysis procedure is performed to study the behavior of the system under uncertain parameter changes. Finally, a review of the specific regulatory barriers is presented, and the LNG roadmap is drawn.
The methodology that is adopted in this study is split into two main pillars:
Technical considerations
- Analysis of the energy system behavior when some or all of the diesel engines are replaced by the SOFC units—calculation of critical indicators such as fuel consumption, total system efficiency, amount of heat to be recovered and exploited. For that reason, we develop a model and perform energy system simulations on a yearly basis before and after the LNG-based system installation.
- Estimation of the quantities of desalinated water that can be produced and calculation of the percentage of potable water needs that can be covered.
- Thorough economic analysis to identify the conditions that make the concept feasible.
Non-technical considerations
- Logistics for LNG transport.
- Environmental and social aspects.
- Status of the legal framework and next steps.
2.1. Energy System Modeling
To assess the energetic and economic integration of fuel cell systems, an investment optimization problem was formulated as a linear programming model. In this way, we can optimize the investment of the generating assets. This method produces the optimal capacities of each generation unit, as well as the proper dispatch at each timestep (which in our case is hourly), also referred to as “unit commitment”. The objective function minimizes the yearly system costs which are the sum of the annualized capital costs and the marginal costs. This can be written formally as:
such that:
where s is the generation, os and cs are the marginal and capital costs of generation s, respectively, Gs is the capacity of generation s, gs,t is the power production of generator s at time t, and dt is the demand at time t. Here, complex terms like the annualization of the capital costs, the efficiencies of generation units, and the representation of storage devices have been omitted. For a detailed theoretical background, the reader is referred to [15,16]. The developed model involves a set of reasonable assumptions. First, it considers an inelastic load, i.e., the demand should be met at all times, thus no load-shedding actions are allowed. Additionally, all producers and consumers are price takers, which is a theoretical assumption of a perfect market, meaning that nobody can exercise market power. Network constraints are neglected, and a single network node is assumed; thus, no required transmission or distribution expansion costs are calculated.
2.2. Detailed Technoeconomic Assessment
To achieve a detailed technoeconomic analysis of the SOFC system on the island of Patmos, the specifications and costs of the SOFC system and its coupling with a multi-effect distillation (MED) unit based on literature data are presented. Moreover, the current energy profile of Patmos Island is assumed as a basis for the assessment. Finally, the results are presented, and sensitivity analysis of the main parameters is considered.
The parameters used for the technoeconomic assessment are key values that can present the viability and profitability of an investment. This allows the detailed evaluation of an investment, but also its comparison with other alternatives. The key parameters defined are the following:
2.2.1. Return Time of the Invested Capital (Repayment)
The payback period calculates the number of years required to recover the full amount of the original investment in the system based on cost and revenue. It is the year that the amount of total costs equals the amount of total revenue.
Moreover, the repayment year is the year where the summary of cash flows is zero. Specifically, cash flow is the annual cash balance after considering both revenues and costs and can be calculated by subtracting the expenses from the earnings for each time step.
2.2.2. Net Present Value (NPV)
The net present value (NPV) is used as a metric for long-term analysis of the viability of an investment. It calculates the difference between the present value of all costs and of all revenues with reference to a single date, for the rate of return on the project in which investment is made and calculated before implementing a system. A positive resulting value means that the implementation of the SOFC system is profitable; otherwise, its integration would lead to an economic loss. The higher the value of a positive NPV, the more profit the project will produce [17].
2.2.3. Internal Rate of Return (IRR)
The internal rate of return (IRR) is a metric used in financial analysis to estimate the profitability of potential investments. IRR is a discount rate that makes the NPV of all cash flows equal to zero in a discounted cash flow analysis. This is the interest rate that applies to the cash flow values and is referenced to the start date of the project, which makes the net present value zero [18]. The IRR value aimed in this investment is 10%, in order to have a compatible option to other investments.
2.2.4. Levelized Cost of Energy (LCOE)
Levelized cost of energy (LCOE) is widely used as a comparative measure between alternative sources of energy. LCOE is considered a cost metric, and evaluates energy storage systems with different characteristics on a comparable basis. These systems may have, for instance, unequal lifetime, capacities, rated power, capital cost, and efficiencies. The LCOE represents the lowest cost at which energy should be sold so as to realize break-even over the investment’s life cycle. This approach allows for a fast and simple assessment of various energy storage systems [19,20].
3. Case Definition
3.1. Patmos Case Study Description
This economic assessment is focused on the electricity requirements of the island of Patmos. The energy mix of the island constitutes a typical non-interconnected Greek island, heavily reliant on reciprocating engines running on diesel or heavy fuel oil. Figure 2 illustrates the installed power generation capacities on the island.
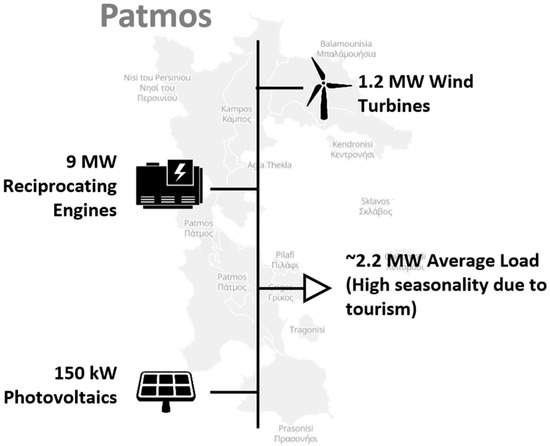
Figure 2.
Installed generation capacities in Patmos.
According to data provided by the Hellenic Electricity Distribution Network Operator (HEDNO), the energy requirements on the island for the year 2020 were around 17,806 MWh. Table 1 includes information about the island’s size and the number of inhabitants. It also provides data on the installed conventional thermal power capacity, electricity demand, and share of renewables [21].

Table 1.
General information and electricity production/consumption by conventional units and RES on Patmos (2020).
Figure 3 presents the energy mix of the island on a monthly basis for the year 2020. On average, a 16.2% RES penetration is achieved due to the high wind and solar resources of the Aegean Sea. Due to this low penetration level, the curtailment events because of excess of electricity from RES are insignificant and thus are neglected in this study. Moreover, since there is no actual plan for further installation of RES on the island, it would be meaningless to investigate excess power exploitation or energy storage unit installation in the near future.
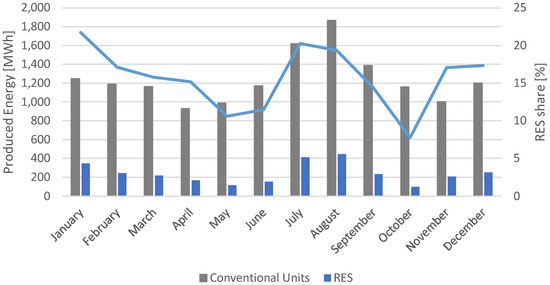
Figure 3.
Energy production from conventional units and renewable energy sources (RES) in Patmos in 2020.
3.2. Technical and Economic Parameters Assumed
This study aims to assess the SOFC technology as an investment by combining realistic assumptions for the energy market, data from the fuel cell industry, and published data in scientific journals. The considered technoeconomic parameters for the SOFC unit are presented in Table 2.
Table 2.
Technical specifications of the SOFC unit.
An annual stack degradation of 1% is assumed, resulting in the restack of the fuel cells every 80,000 h so that the facility returns to its original operating efficiency. The lifetime of SOFC is the useful life of the project; specifically, it is the number of years that the project is expected to be fully operational, reliably delivering electricity to the grid, and generating revenue.
Besides technical parameters, a set of economic parameters is also required for the study. Table 3 gathers the assumed values for the relevant capital and operating expenses.
Table 3.
Economic parameters assumed for the SOFC unit.
The operational expenditures (OPEX) value represents the sum of all expenses during the operation of the system. A breakdown of the categories of expenses included in the OPEX can be seen in Figure 4. It includes the annual operating costs and the total costs of the restacking procedure that takes place approximately every 9 years. Besides fixed OPEX, fuel costs and expenses for project management are also included [23,24]. Further to this, the annual expenses for the insurance that equal to 3% of the capital expenditures (CAPEX) have been included, which account for the estimated cost of insuring the facility.
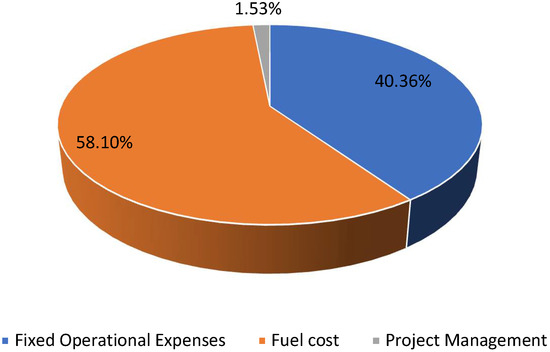
Figure 4.
Operational expense breakdown.
Lastly, a set of parameters were assumed regarding the economy of the island system, which are included in Table 4. At this stage, it is important to highlight some crucial aspects for the present analysis. Nowadays, more than ever, consumers are aware that prices in the energy sector are volatile and highly dependent in worldwide political and economic stability. The widening COVID-19 pandemic of 2020 and other factors have led to an unprecedented supply demand imbalance. Recent incidents regarding the war between Russia and Ukraine have had a significant impact in the European energy sector. EU leaders are in discussions regarding a drastic decrease in the NG imports in response to the geopolitical tension and instability [19]. The present work is performed using economic parameters from before these geopolitical conflicts. Moreover, a wide range of LNG prices are considered in the sensitivity analysis to cover the high deviation in prices.
Table 4.
General economic parameters.
3.3. Desalination System (Waste Heat Recovery and Exploitation Options)
The increase in freshwater consumption that has been directly linked to population and industrial growth has unavoidably resulted in a global imbalance between the demand and supply of fresh water. Water is required for industrial and agricultural reasons in addition to human consumption and its supply is critical in NII systems, because there is no link to the mainland water grid, and since the seawater is not drinkable, treatment is required [9]. Desalination has been recommended as a suitable technology for producing clean water on Greek islands.
The most reliable desalination technologies that can currently be exploited at a commercial scale are divided into two main categories:
- Thermal processes: multi-stage flash distillation (MSF), MED, thermal vapor compression (TVC) and mechanical vapor compression (MVC) processes;
- Membrane processes: reverse osmosis (RO) and electrodialysis (ED) processes.
In the Greek Cyclades and Dodecanese islands, several desalination plants have been installed. Local municipal water companies own and run these units, and they decide the water selling price every year. The cost of desalinated water depends on the technology used, and like most industrial processes, the production cost per plant is a negative function of the size of the process. RO is the most commonly applied desalination method in the Aegean islands and the production cost of desalinated water units is between 0.5 and 3.5 EUR/m3; however, in most cases, the cost is above 1.2 EUR/m3 [7,18]. Specifically, in Patmos, there is an existing RO system. The energy consumption of such systems is 2.3–7 kWh/m3. According to literature, the consumption of the existing units in Patmos Island is 5.5 kWh/m3, as seen in Table 5 [28,29].
Table 5.
Specific energy consumption and specifications of selected RO desalination units in Greece.
To provide sufficient and efficient water production on Patmos island it is also important to investigate the application of thermal desalination technologies, notably the multi-effect distillation desalination unit, MED, which would use the heat generated by the SOFC unit. For its multi-effect distillation, this desalination technology requires approximately 4–7 kWh/m3 of heat and 1.5–2 kWh/m3 of electrical energy. Furthermore, combining SOFC thermal power generation with MED has shown great promise in lowering the cost of water production while also increasing the electric power generation, thereby boosting the dispatch capability of thermal power-producing units. The cost for the heat demand of the MED plant is zero in this case, since it only uses waste heat from the SOFC unit. The coupling of MED with the flue gas derived from the gas turbine is therefore advisable [30].
4. Technoeconomic Assessment
4.1. Financing Values
The total amount of financing is equal to the sum of debt, private equity, and, if applicable, a subsidy amount. The financing of the investment in the investigated scenario consists of private equity, accounting for 60% of the total funding and 40% of the debt. In Table 6, it can be seen that the debt term will last for 13 years with an interest rate of 7%, and governmental tax rate is taken into consideration [22].
Table 6.
Analysis of permanent financing of the investment.
The term debt describes the CAPEX percentage that has been funded through loans and the interest rate represents the financing rate provided by the bank or any other debt investor. In this investment, a typical interest rate of 5% is considered [22]. In Table 7 the assumed sources of funding are presented. Such investments are also often funded through financial support from the government to promote financial, social, and environmental policies. To decrease the cost and to produce systems with lower power capacities, governments and states establish funding programs to promote these sustainable technologies and facilitate their transition from the research and development stage toward early market adoption. Japan and Europe are taking the lead in providing and supporting applications for FC-based micro-cogeneration units [27]. The percentage of state subsidies will be assumed to be zero in the initial assessment; however, scenarios with an increasing percentage of state subsidies will be studied for the sensitivity analysis. Since the project is a taxable entity, all the tax-related cash flows are treated with an addition of 24% tax, which was the Greek corporate tax rate in 2020. Although in 2021 the tax rate was reduced to 22% [31], the former value of 24% was considered in the present analysis in order to be on the safe side.
Table 7.
Summary of sources of funding for total installed cost.
4.2. Revenue—Generation of Electricity and Waste Heat
The total revenue of the project is dependent on the revenue stream from the produced electricity and from the sale of waste heat. In the present work, a scenario of using waste heat to produce clean, potable water through a thermal desalination process has been studied. The clean water production potential is of great importance for Greek islands, where, traditionally, the clean water supply is limited [32]. For this study, a MED system is assumed that requires 4 kWh/m3 of thermal energy and 1.5 kWh/m3 of electrical energy producing 720 m3/day, as shown in Table 8. The combined investment cost of an MED unit is approximately 1500 EUR/m3/day.
Table 8.
Specifications and costs of MED desalination considered.
There is no legal framework in Greece for producing and selling clean water, which is considered a public good and is regulated by locally based public services. It is, therefore, considered that the system will implement in collaboration with the local service on each island and connect to their respective water supply network. Since there is no market for water, similar to electricity exchange, it is assumed that the revenue generated from water production will be calculated based on the current sale price of desalinated water on the island, which as demonstrated on Table 9, is approximately 1.6 EUR/m3 [23].
Table 9.
The supplementary revenue stream.
5. Results and Discussion
5.1. Energy System Simulation Results
Following the methodology described in Section 2, an investment optimization problem was formulated and addressed using the Python for power system analysis (PyPSA) [33] module in Python. In this step, several opportunities are ignored, such as the possible income for desalination using waste heat recovery, state taxes, financial opportunities, etc. The model focuses on the estimation of the optimal SOFC-GT capacity, while ensuring the economic sustainability of the investment through a linear optimization model.
By setting the main model parameters according to Table 3 and Table 4, the model suggested an optimal SOFC capacity of 1.1 MW. Along with this suggestion, the optimal dispatch was generated and is depicted in Figure 5. It can be noted that the simulation results suggested to continue operating the diesel generators during the high-demand summer seasons. In other words, installing an SOFC system of higher capacity would be suboptimal in this economic environment, i.e., with the specific generation capital and marginal prices.
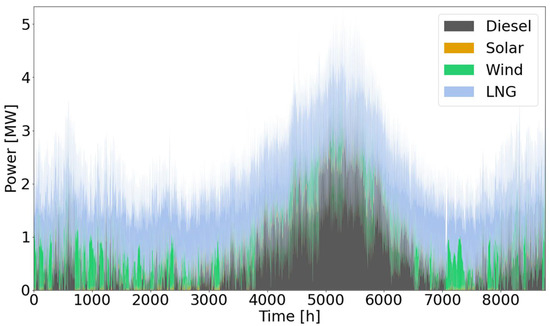
Figure 5.
Calculated optimal dispatch.
The significant contribution of LNG generation is better visualized in Figure 6. Figure 6a presents the SOFC operation throughout the year. It can be observed that the unit operates at partial load only a few times, when the RES generation is adequate, while the majority of the year its full capacity is used. Figure 6b presents the load duration curve, a common figure format in which the resulting operation of Figure 6 is sorted in descending order. This enables a better interpretation of the contribution of each generation type to the energy mix. The SOFC’s high use factor can be attributed to the high diesel marginal price, compared to the 30 EUR/MWh marginal cost for LNG that has been assumed. This describes the reason behind the economic feasibility of the proposed investments well. High marginal generation prices in such small islanded systems render the installation of fuel cells economical.
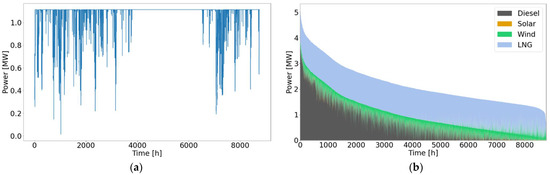
Figure 6.
Resulting dispatch; (a) presents the yearly operation of the SOFC unit, and (b) presents the corresponding load duration curve.
Table 10 includes the aggregated generation values produced by the optimal dispatch. A 78.7% share of the produced energy within the year is provided by the SOFC system using LNG fuel.
Table 10.
Yearly aggregated results for the generated energy by type.
5.2. Financial Results
The main economic results of the investment are presented in Table 11. It can be seen that with the current base scenario, the 1.1 MW unit presents a good NPV with low LCOE.
Table 11.
Summary of economic assessment outcomes.
In Figure 7, the revenue and the expenses are shown. The total revenue of the project is the sum of the revenue stream from electricity produced and from the sale of waste heat. In the expenses, a decrease is shown in the 13th year, when the debt will be repaid. The total amount of expenses is the sum of capital and operational costs and the funding of the investment.
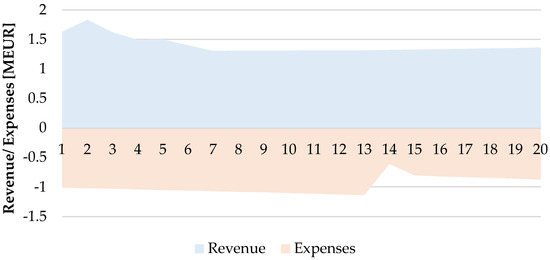
Figure 7.
The amount of revenue and expenses of the SOFC unit.
5.3. Sensitivity Analysis
To thoroughly investigate the impact of each input parameter on the investment under different scenarios, a sensitivity analysis is performed.
5.3.1. The Influence of CAPEX on the Net Present Value
Regarding the evolution of fuel cell manufacturing prices in the future, many believe that the cost of future mass-produced fuel systems is going to fall at around 1000 EUR/kW [22,25]. In this work, the capital cost assumption target is to reach half price of the current unit’s cost for a more conservative approach. Specifically, an analysis is performed on the effect a 50% increase and a 50% decrease would have on the NPV. In Figure 8 it is shown that the 1.1 MW unit manufacturing cost is sufficient to obtain a profitable investment in the base scenario for its current cost.
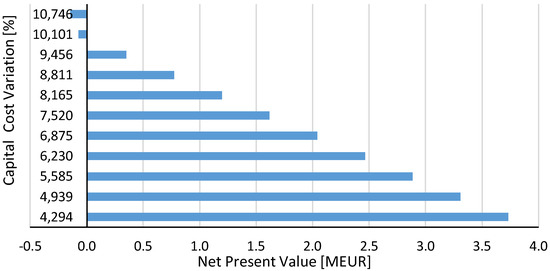
Figure 8.
CAPEX of SOFC+MED influence on Net Present Value.
5.3.2. The Influence of Electrical Energy Market Price on the Net Present Value
The price at which the produced electricity from the SOFC unit can be sold plays a vital role in the investment’s success. The effect of the price is presented in Figure 9, showing that the investment can be profitable for a selling price of at least 117 EUR/MWh.
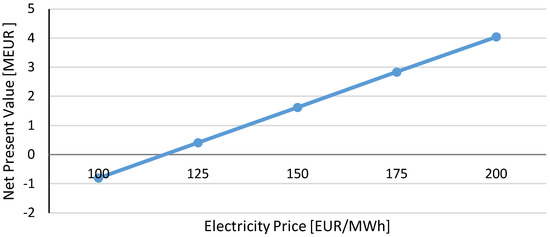
Figure 9.
Electricity price influence on Net Present Value.
5.3.3. Influence of Subsidy on Net Present Value
Subsidies and financial support from the government or other state-affiliated institutions to promote innovation and decarbonization are key factors often considered for an accurate economic evaluation. SOFCs are novel, eco-friendly, high-efficiency systems that would justify access to this funding.
In this analysis, the legislation of Greece has been taken into consideration and technoeconomic scenarios with and without state subsidies have been studied. A subsidy amount starting from 0% and reaching 30% is assumed, and the results are presented in Figure 10.
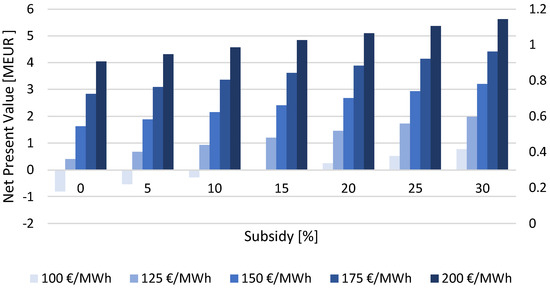
Figure 10.
Subsidy effect on Net Present Value and electricity price.
5.3.4. Influence of the Cost of the Fuel on the Levelized Cost of Electricity
For a high fuel cost of 50 EUR/MWh, the LCOE can reach 0.18 EUR/kWh. Meanwhile, if the fuel cost drops to 2 EUR/MWh, the LCOE would reach much lower values of 0.09 EUR/kWh.
6. Other Considerations
6.1. Logistics for LNG Transport
Despite the promising prospects for a profitable investment, the development of a sustainable supply chain for the LNG provision to the island is the most important aspect that should be addressed. Like all the Greek islands, Patmos is not connected to the national gas grid, and therefore a virtual pipeline network for LNG supply must be established. Apart from that, the necessary infrastructure for LNG storage, regasification, and transport via pipeline from the regasification plant to the thermal plant is necessary for the realization of the proposed concept. The successful paradigms of other virtual pipelines around the world for LNG supply to islands like Madeira, or to mainland destinations such as Japan, the USA, and Bolivia, show the way [34,35].
According to the Wärtsilä business white paper, the final LNG cost at end-user is strongly dependent on the scale of the overall supply chain and can be 2.5 to 4.3 times higher than the gas production cost. Based on the same study, the final NG supply cost when a small-scale LNG virtual pipeline network is set up is estimated to be 60% higher than the conventional price on the mainland [36]. More specifically, for the Patmos case study, it is considered that the LNG supply will begin from the Revythoussa terminal near Athens, where LNG will be transferred via ship. A small-scale storage tank and a regasification unit should be included before the gasified, compressed natural gas is transferred to the power plant [37]. Nevertheless, the sensitivity analysis on fuel price (Figure 11) showed that LCOE < 0.2 EUR/kWh and can certainly remain lower than the current electricity production prices regardless of the LNG supply chain scheme and its associated cost.
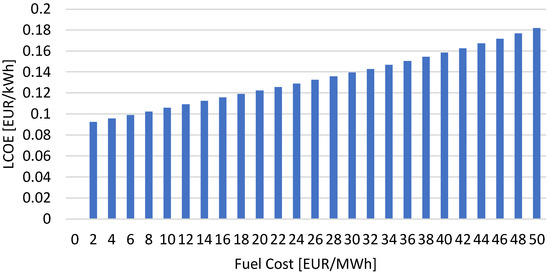
Figure 11.
Fuel cost influence on the Levelized Cost of Electricity.
This makes clear that a significant amount of additional investment cost should be taken into consideration in order to establish the required facilities and infrastructure for the LNG supply to the island. Undoubtedly, the power production company that will operate the LNG-based power plant cannot afford this additional cost, and only the operator of the gas transmission system could undertake this. In case the Patmos paradigm is followed by other neighboring islands, and other potential NG users beyond the power production sector (i.e., residential, hotels) express their interest to connect with the new NG grid, a larger LNG virtual pipeline network could be established, thus increasing the prospects for a viable project for the NG grid operator. In parallel, the logistics costs will be decreased and the final NG price will be lower.
6.2. Environmental Issues
Liquefied Natural Gas (LNG) is natural gas that is liquefied by cooling it to −162 °C, close to ambient temperature, and reducing its volume by roughly 600 times. It is stored in its liquid form and hence it is not explosive and cannot be burned. LNG needs first to be reheated, vaporized and then properly mixed with combustion air, resulting in a low excess of air required for complete combustion [38,39]. Therefore, LNG releases about 45–50% less carbon dioxide (CO2) than coal, 30% less CO2 than fuel oil, and dramatically reduces nitrogen oxide (NOx) emissions, whereas it produces insignificant amounts of sulfur oxides (SOx) and particulate matter (PM) compared to other fuels [40]. Considering the whole production-to-use pathway of fuels, which is known as well-to-wheels (WTW) analysis, Arteconi et al. (2010) showed a GHG emission reduction with LNG of up to 10%. Small-scale LNG production can result in GHG emissions in line with those of diesel. Strantzali et al. [41] performed a multi-criteria decision-making model at the environmental and technoeconomic level in order to investigate the suitable fuel mix (fuel oil, NG, LNG) for electricity generation in an insular energy system in Lesvos Island (Greece). Their analysis showed that the use of natural gas (including the transportation of LNG) and the parallel penetration of wind energy has low environmental impact.
6.3. Social Consideration
LNG as a fuel in an energy system can have a social impact on the local development and welfare of the region that houses the energy project, beyond the environmental benefit. Possible advantages are the creation of employment opportunities during the project implementation, the development of a chain of enterprises in the energy sector, the water management sector, the building of energy and social infrastructure, and the support of population growth [42]. In addition, it can improve the quality of life for people, since an LNG-fueled hybrid SOFC-GT system generates a low amount of noise and air pollutants [43]. Another positive aspect is that the proposed replacement of the thermal plants will not affect the existing job positions in the thermal stations and the existing personnel will be supplemented with new advanced engineers.
6.4. Energy Policy
Transportation of people and goods requires an enormous amount of energy, and this is the main contributor to greenhouse gas (GHG) emissions. In 2001, the European Union (EU) proposed a 20% substitution of oil by alternative fuels by 2020 in order to improve the security of European energy supply and reduce GHG emissions [44]. LNG is reported by the EU to be one of the most promising alternative fuels for achieving a reduction in GHG emissions and reaching the objective of fuel diversification in road transport [45]. According to the Directive 2014/94/EU, the EU sets the policy framework for promoting the construction of alternative fuel infrastructures in order to increase the demand for alternative fuels. The above directive also characterizes LNG as a cost-efficient technology allowing heavy-duty vehicles to meet the stringent pollutant emission limits of Euro VI [45]. The EU “Strategy for liquefied natural gas and gas storage” highlights the importance of LNG for the energy market [44].
In recent years, the share of LNG has stabilized, accounting for around 20% of total extra-EU gas imports in 2021, with most of these coming from the United States (28%), followed by Qatar and Russia (both around 20%), Nigeria (14%) and Algeria (11%). The biggest LNG importers in the EU are Spain (21.3 bcm), France (18.3 bcm), Italy (9.3 bcm), The Netherlands (8.7 bcm) and Belgium (6.5 bcm) [46].
In Greece, the electricity sector is the major consumer of natural gas. In 2016, 68.5% of natural gas consumption is related to electricity production, while 21.4% corresponds to the distribution network and 10.1 to the consumer network [37]. During the same year, the LNG imports in Greece were 1,307,000 m3, and in 2017 they increased by approximately 48% [47]. A committee assembled by the Regulatory Authority for Energy (REA) for interconnection projects concluded that LNG represents an optimal solution for large islands, such as those in the northeast Aegean Sea [47]. The majority of Greek islands are not connected to the mainland electricity grid. Their power demand is covered by internal combustion engines fueled by oil, which are owned by the Public Power Corporation (PPC). In 2018, REA issued a natural gas supply license to the main power utility PPC, paving the way for the electricity company to pursue a revised business plan for the future that is expected to include penetration into the natural gas sector’s retail and wholesale markets, as well as involvement in major-scale gas infrastructure projects. PPC is also looking to become involved in the LNG spot market, as its plans include small-scale LNG infrastructure development for supply to the islands. Meanwhile, the REA has approved the ten-year plan development of gas grid operator DEFSA. A virtual pipeline proposal envisioning LNG supply to Crete, the north Aegean islands, and the Dodecanese via tankers from the operator’s Revythoussa terminal just off Athens was left out of the approved plan [39]. In addition, two more LNG import terminals have been proposed in Alexandroupolis and Kavala [40].
The implementation of the LNG virtual pipelines and the operation of the two new LNG import terminals is imperative, taking into account the high gas prices during the last year and Russia’s invasion of Ukraine in February 2022. In 2021, the EU imported around 140 billion cubic meters (bcm) of gas by pipeline from Russia over the year as a whole. Additionally, around 15 bcm was delivered in the form of LNG. The total 155 bcm imported from Russia accounted for around 45% of the EU’s gas imports in 2021 and almost 40% of its total gas consumption [48]. Therefore, the European Commission proposed an outline of a plan (REPowerEU) to make Europe independent from Russian fossil fuels well before 2030 [49]. It sets out a series of measures to protect European consumers from energy price hikes and to ensure that the EU will have sufficient gas stocks for next winter. REPowerEU will seek to diversify gas supplies, speed up the roll-out of renewable gases, and replace gas in heating and power generation. This can reduce EU demand for Russian gas by two-thirds before the end of 2022. The United States will also supply 15 bcm of additional LNG to the EU market this year to help Europe break away from Russian fossil fuel supplies, as US President Joe Biden announced from Brussels [50]. This means that LNG is expected to play a critical role in the energy map of European countries, making policymakers reconsider its crucial contribution to the stable transition towards the green economy in both the mainland and EU islands.
6.5. Roadmap of Real Implementation in the Near-Term Future
A holistic approach for the integration of an LNG-fueled fuel cell in Patmos, maximizing the RES potential towards 2030:
- Design, sustainability study/research and selection of a proper energy partner, who can install and operate RES of 1 MW nominal power on the island and supply LNG to the energy system.
- Consultation with local authorities and the local community for the understanding of the technological concept, targeting funding as well.
- Consultation with local authorities for the upgrade of the environmental impact assessment report, based on the existing one of the energy partners.
- Installation, production and storage of the energy and water on the island.
7. Discussion and Outlook
A hybrid poly generation system based on a solid oxide fuel cell (SOFC) system combined with a micro-gas turbine (MGT) capable of producing both electric and thermal power is presented. The hybrid SOFC system can cover the energy demand in non-interconnected islands and with the use of the exhaust gas sensible heat in desalination units, it can cover the demand for potable water. At the same time, due to its improved efficiency, it releases a smaller amount of CO2 than conventional power systems into the atmosphere while covering the same energy demand and providing a more sustainable option.
For the Patmos Island case, the initial investment optimization solution suggested a SOFC-GT system with a capacity of 1.1 MW. The detailed economic evaluation revealed a positive NPV and an LCOE equal to 0.14 EUR/kWh, making it a very promising investment. A crucial point regarding the feasibility of an investment is the current manufacturing cost of the modules. For the 1.1 MW SOFC unit with the current capital cost, it was shown that its implementation is already cost-effective. However, as fuel cell technology matures with advancements in manufacturing methods and with the use of low-cost materials, an important manufacturing cost reduction in the near future could also be expected. An estimation of this manufacturing cost reduction is included as a parameter in this sensitivity analysis. Specifically, the target scenario of ±50% change in the CAPEX is mentioned in this study, for a more conservative approach. The investment in the SOFC unit of 1.1 MW appears to be profitable, providing a profit higher than EUR 1,600,000.
Another significant factor that heavily affects the implementation cost of SOFC is the fuel cost. Currently, the cost is high, but it is expected to decrease over the next few years due to the LNG distribution infrastructure. The LCOE reaches 0.14 EUR/kWh if the fuel cost falls under 30 EUR/MWh, which was a representative LNG cost in Greece from 2020. The results show that when the right conditions are met and the LNG fuel is provided on Patmos Island, the implementation of the SOFC system will be convenient and profitable.
Furthermore, the electricity selling price is an important parameter of the profitability of the investment. In order for the SOFC unit to be financially beneficial for the island, a selling price of at least 117 EUR/MWh is calculated, which is significantly lower than the current electricity production cost, of approximately 300 EUR/MWh, of covering the needs of the habitats.
In conclusion, the SOFC technology is a promising high-efficiency power production technology, and the potential excess heat exploitation could further cover other needs in an effective way. The conducted study agreed with the research community consensus that LNG can play the role of the transitional energy carrier from a fossil-based to a decarbonized era.
Author Contributions
Conceptualization, K.P. and P.I.; methodology, K.A.; software, P.I.; writing—original draft preparation, K.P.; writing—review and editing, P.B. and K.A.; supervision, A.N.; project administration, P.G.; All authors have read and agreed to the published version of the manuscript.
Funding
This research was funded by the Greek–German Bilateral Research and Innovation Cooperation program “SUstainable and Novel fuel applications for Island Energy Systems” (SUNIES) (General Secretariat for Research and Technology: Τ2ΔΓΕ-0181).
Institutional Review Board Statement
Not applicable.
Informed Consent Statement
Not applicable.
Data Availability Statement
Not applicable.
Conflicts of Interest
The authors declare no conflict of interest.
References
- EU: 2030 Climate & Energy Framework. Available online: https://Ec.Europa.Eu/Clima/Eu-Action/Climate-Strategies-Targets/2030-Climate-Energy-Framework_en (accessed on 10 March 2022).
- Weisser, D. Power Sector Reform in Small Island Developing States: What Role for Renewable Energy Technologies? Renew. Sustain. Energy Rev. 2004, 8, 101–127. [Google Scholar] [CrossRef]
- Kougias, I.; Szabó, S.; Nikitas, A.; Theodossiou, N. Sustainable Energy Modelling of Non-Interconnected Mediterranean Islands. Renew. Energy 2019, 133, 930–940. [Google Scholar] [CrossRef]
- Energy Laws and Regulations|Greece|GLI. Available online: https://www.globallegalinsights.com/practice-areas/energy-laws-and-regulations/greece (accessed on 12 March 2022).
- Energypedia. Available online: https://energypedia.info/wiki/Greece_Energy_Situation (accessed on 12 March 2022).
- Miętkiewicz, R. LNG Supplies’ Security with Autonomous Maritime Systems at Terminals’ Areas. Saf. Sci. 2021, 142, 105397. [Google Scholar] [CrossRef]
- Abujazar, M.S.S.; Fatihah, S.; Rakmi, A.R.; Shahrom, M.Z. The Effects of Design Parameters on Productivity Performance of a Solar Still for Seawater Desalination: A Review. Desalination 2016, 385, 178–193. [Google Scholar] [CrossRef]
- Stationary Fuel Cells Market, 2019–2030—Global Market Projected to Reach $5.1 Bn by 2030. Focus Catal. 2020, 2020, 2. [CrossRef]
- Tietz, F. Solid Oxide Fuel Cells. Encyclopedia of Materials: Science and Technology; Pergamon Press: Oxford, UK, 2008; pp. 1–8. [Google Scholar] [CrossRef]
- Tostado-Véliz, M.; Kamel, S.; Hasanien, H.M.; Turky, R.A.; Jurado, F. A Mixed-Integer-Linear-Logical Programming Interval-Based Model for Optimal Scheduling of Isolated Microgrids with Green Hydrogen-Based Storage Considering Demand Response. J. Energy Storage 2022, 48, 104028. [Google Scholar] [CrossRef]
- Kaldellis, J.K.; Kavadias, K.A.; Kondili, E. Renewable Energy Desalination Plants for the Greek Islands—Technical and Economic Considerations. Desalination 2004, 170, 187–203. [Google Scholar] [CrossRef]
- Chinda, P.; Brault, P. The Hybrid Solid Oxide Fuel Cell (SOFC) and Gas Turbine (GT) Systems Steady State Modeling. Int. J. Hydrogen Energy 2012, 37, 9237–9248. [Google Scholar] [CrossRef]
- Atsonios, K.; Samlis, C.; Manou, K.; Nikolopoulos, A.; Sfetsioris, K.; Mitsotakis, A.; Grammelis, P. Technical Assessment of LNG Based Polygeneration Systems for Non-Interconnected Island Cases Using SOFC. Int. J. Hydrogen Energy 2021, 46, 4827–4843. [Google Scholar] [CrossRef]
- European Commission. Available online: https://Ec.Europa.Eu/Commission/Presscorner/Detail/En/IP_21_3045 (accessed on 12 March 2022).
- Brown, T. Energy System Modelling Summer Semester 2019; Karlsruhe Institute of Technology: Karlsruhe, Germany, 2019. [Google Scholar]
- Kirschen, D. Fundamentals of Power System Economics, 2nd ed.; John Wiley & Sons, Ltd.: Hoboken, NJ, USA, 2019. [Google Scholar]
- Chen, J.M.P.; Ni, M. Economic Analysis of a Solid Oxide Fuel Cell Cogeneration/Trigeneration System for Hotels in Hong Kong. Energy Build. 2014, 75, 160–169. [Google Scholar] [CrossRef]
- Karagiannis, I.C.; Soldatos, P.G. Current Status of Water Desalination in the Aegean Islands. Desalination 2007, 203, 56–61. [Google Scholar] [CrossRef]
- Ochoa, A.; Dutra, C. Techno-Economic and Exergoeconomic Analysis of a Micro Cogeneration System for a Residential Use. Acta Sci. Technol. 2016, 3, 327. [Google Scholar] [CrossRef][Green Version]
- Berrada, A.; Loudiyi, K. Economic Evaluation and Risk Analysis of Gravity Energy Storage. Gravity Energy Storage 2019, 51–74. [Google Scholar] [CrossRef]
- Hellenic Electricity Distribution Network Operator. Available online: https://Www.Deddie.Gr/En/ (accessed on 15 March 2022).
- Mehr, A.S.; Lanzini, A.; Santarelli, M.; Rosen, M.A. Polygeneration Systems Based on High Temperature Fuel Cell (MCFC and SOFC) Technology: System Design, Fuel Types, Modeling and Analysis Approaches. Energy 2021, 228, 120613. [Google Scholar] [CrossRef]
- Eurostat. Available online: http://Appsso.Eurostat.Ec.Europa.Eu/Nui/Show.Do?Dataset=nrg_pc_202 (accessed on 10 March 2022).
- Baker, M.; Wurgler, J. Behavioral Corporate Finance: An Updated Survey. Handb. Econ. Financ. 2013, 2, 357–424. [Google Scholar] [CrossRef]
- Staffell, I.; Green, R. The Cost of Domestic Fuel Cell Micro-CHP Systems. Int. J. Hydrogen Energy 2013, 38, 1088–1102. [Google Scholar] [CrossRef]
- Psarras, I. Master Program: Technoeconomic Systems, National Technical University of Athens. Available online: http://mycourses.ntua.gr/course_description/index.php?cidReq=PSTGR1083 (accessed on 12 March 2022).
- Hellenic Association for Energy Economics (HAEE). Greek Energy Market Report 2019; HAEE: Athens, Greece, 2019. [Google Scholar]
- Scataglini, R. A Total Cost of Ownership Model for Solid Oxide Fuel Cells in Combined Heat and Power and PowerOnly Applications; Office of Energy Efficiency & Renewable Energy: Washington, DC, USA, 2015. [Google Scholar]
- Becker, W.L.; Braun, R.J.; Penev, M.; Melaina, M. Design and Technoeconomic Performance Analysis of a 1 MW Solid Oxide Fuel Cell Polygeneration System for Combined Production of Heat, Hydrogen, and Power. J. Power Sources 2012, 200, 34–44. [Google Scholar] [CrossRef]
- Zotalis, K.; Dialynas, E.G.; Mamassis, N.; Angelakis, A.N. Desalination Technologies: Hellenic Experience. Water 2014, 6, 1134–1150. [Google Scholar] [CrossRef]
- Greece—Interest Rate Spread (Lending Rate Minus Deposit Rate, %). Available online: Https://Tradingeconomics.Com/Greece/Interest-Rate-Spread-Lending-Rate-Minus-Deposit-Rate-Percent-Wb-Data.Html (accessed on 9 March 2022).
- Reuters. EU Rolls out Plan to Cut Russia Gas Dependency This Year. Available online: https://www.reuters.com/business/energy/eu-rolls-out-plan-cut-russia-gas-dependency-this-year-end-it-within-decade-2022-03-08/ (accessed on 12 March 2022).
- Brown, T.; Hörsch, J. PyPSA: Python for Power System Analysis. J. Open Res. Softw. 2018, 6, 4. [Google Scholar] [CrossRef]
- LNG Virtual Pipeline Madeira Island. Available online: https://www.gaslink.pt/en/virtual-gas-pipeline/ (accessed on 12 March 2022).
- LNG Virtual System Distribution. Available online: https://www.energy.sener/projects/lng-virtual-system-distribution (accessed on 9 March 2022).
- The LNG Logistics Chain. Available online: https://cdn.wartsila.com/docs/default-source/oil-gas-documents/white-paper-o-lng-logistics-chain.pdf?sfvrsn=4 (accessed on 20 March 2022).
- DESFA LNG Facility. Available online: https://www.desfa.gr/en/national-natural-gas-system/lng-facility (accessed on 12 March 2022).
- Triantafyllou, P.; Koroneos, C.; Kondili, E.; Kollas, P.; Zafirakis, D.; Ktenidis, P.; Kaldellis, J.K. Optimum Green Energy Solution to Address the Remote Islands’ Water-Energy Nexus: The Case Study of Nisyros Island. Heliyon 2021, 7, e07838. [Google Scholar] [CrossRef]
- Strantzali, E.; Aravossis, K.; Livanos, G.A. Evaluation of Future Sustainable Electricity Generation Alternatives: The Case of a Greek Island. Renew. Sustain. Energy 2017, 76, 775–787. [Google Scholar] [CrossRef]
- Pfoser, S.; Schauer, O.; Costa, Y. Acceptance of LNG as an Alternative Fuel: Determinants and Policy Implications. Energy Policy 2018, 120, 259–267. [Google Scholar] [CrossRef]
- Arteconi, A.; Brandoni, C.; Evangelista, D.; Polonara, F. Life-Cycle Greenhouse Gas Analysis of LNG as a Heavy Vehicle Fuel in Europe. Appl. Energy 2010, 87, 2005–2013. [Google Scholar] [CrossRef]
- Tsoutsos, T.; Drandaki, M.; Frantzeskaki, N.; Iosifidis, E.; Kiosses, I. Sustainable Energy Planning by Using Multi-Criteria Analysis Application in the Island of Crete. Energy Policy 2009, 37, 1587–1600. [Google Scholar] [CrossRef]
- Engerer, H.; Horn, M. Natural Gas Vehicles: An Option for Europe. Energy Policy 2010, 38, 1017–1029. [Google Scholar] [CrossRef]
- Commission of the European Communities. White Paper. European Policy for 2010: Time to Decide; European Commission: Brussels, Belgium, 2001. [Google Scholar]
- European Union. Directive 2014/94/EU of the European Parliament and of the Council of 22 October 2014 on the Deployment of Alternative Fuels Infrastructure. Off. J. Eur. Union 2014, L 307/1, 1–20. [Google Scholar]
- European Commission. Energy, Liquefied Natural Gas; European Commission: Brussels, Belgium, 2022. [Google Scholar]
- Energypress. DESFA 10-Year Plan Approved, Virtual Pipelines Not Included—LNG Supply for Islands. Available online: https://energypress.eu/desfa-10-year-plan-approved-without-virtual-pipelines/ (accessed on 12 March 2022).
- IEA. A 10-Point Plan to Reduce the European Union’s Reliance on Russian Natural Gas. Available online: https://www.iea.org/reports/a-10-point-plan-to-reduce-the-european-unions-reliance-on-russian-natural-gas (accessed on 20 March 2022).
- EU REPowerEU: Joint European Action for More Affordable, Secure and Sustainable Energy. Available online: https://ec.europa.eu/commission/presscorner/detail/en/ip_22_1511 (accessed on 20 March 2022).
- EUROACTIV EU. US Strike LNG Deal as Europe Seeks to Ditch Russian Gas. Available online: https://www.euractiv.com/section/section/energy/news/eu-us-strike-lng-deal-as-europe-seeks-to-ditch-russian-gas/ (accessed on 20 May 2022).
Publisher’s Note: MDPI stays neutral with regard to jurisdictional claims in published maps and institutional affiliations. |
© 2022 by the authors. Licensee MDPI, Basel, Switzerland. This article is an open access article distributed under the terms and conditions of the Creative Commons Attribution (CC BY) license (https://creativecommons.org/licenses/by/4.0/).