Article

Nano-Iron Oxide-Ethylene Glycol-Water Nanofluid Based Photovoltaic Thermal (PV/T) System with Spiral Flow Absorber: An Energy and Exergy Analysis

1
Electromechanical Engineering Department, University of Technology, Baghdad 19006, Iraq
2
Energy and Renewable Energies Technology Center, University of Technology, Baghdad 10001, Iraq
3
Chemical and Petroleum Industries Engineering Department, Al-Mustaqbal University College, Hillah 51001, Iraq
4
Engineering Department, American University of Iraq, Sulaymaniyah 46001, Iraq
5
Faculty of Engineering, Sohar University, Sohar 311, Oman
6
Solar Energy Research Institute, Universiti Kebangsaan Malaysia, Bangi 43600, Malaysia
7
Mechanical Engineering Department, University of Technology, Baghdad 19006, Iraq
8
School of Engineering and Technology, CQ University, Brisbane, QLD 4009, Australia
*
Author to whom correspondence should be addressed.
Energies 2022, 15(11), 3870; https://doi.org/10.3390/en15113870
Submission received: 22 March 2022 / Revised: 1 May 2022 / Accepted: 19 May 2022 / Published: 24 May 2022

Abstract

:
Both electrical and thermal efficiencies combine in determining and evaluating the performance of a PV/T collector. In this study, two PV/T systems consisting of poly and monocrystalline PV panels were used, which are connected from the bottom by a heat exchanger consisting of a spiral tube through which a nanofluid circulates. In this study, a base fluid, water, and ethylene glycol were used, and iron oxide nanoparticles (nano-Fe2O3) were used as an additive. The mixing was carried out according to the highest specifications adopted by the researchers, and the thermophysical properties of the fluid were carefully examined. The prepared nanofluid properties showed a limited effect of the nanoparticles on the density and viscosity of the resulting fluid. As for the thermal conductivity, it increased by increasing the mass fraction added to reach 140% for the case of adding 2% of nano-Fe2O3. The results of the zeta voltage test showed that the supplied suspensions had high stability. When a mass fraction of 0.5% nano-Fe2O3 was added the zeta potential was 68 mV, while for the case of 2%, it reached 49 mV. Performance tests showed a significant increase in the efficiencies with increased mass flow rate. It was found when analyzing the performance of the two systems for nanofluid flow rates from 0.08 to 0.17 kg/s that there are slight differences between the monocrystalline, and polycrystalline systems operating in the spiral type of exchanger. As for the case of using monocrystalline PV the electrical, thermal, and total PV/T efficiencies with 2% added Fe2O3 ranged between 10% to 13.3%, 43–59%, and 59 to 72%, respectively, compared to a standalone PV system. In the case of using polycrystalline PV, the electrical, thermal, and total PV/T efficiencies ranged from 11% to 13.75%, 40.3% to 63%, and 55.5% to 77.65%, respectively, compared to the standalone PV system. It was found that the PV/T electrical exergy was between 45, and 64 W with thermal exergy ranged from 40 to 166 W, and total exergy from 85 to 280 W, in the case of using a monocrystalline panel. In the case of using polycrystalline, the PV/T electrical, thermal, and total exergy were between 45 and 66 W, 42–172 W, and 85–238 W, respectively. The results showed that both types of PV panels can be used in the harsh weather conditions of the city of Baghdad with acceptable, and efficient productivity.

1. Introduction

In the period from 2008 till now, the price of oil fluctuated significantly due to the turmoil in the oil-producing regions [1]. Furthermore, pollution rates in all countries of the world, including Iraq, have increased significantly due to the total reliance on personal transportation and private electricity generators [2,3]. This persistent concern that the world’s number one energy resource (oil) is depleting has diverted attention towards the use of solar energy worldwide [4]. The trend towards sustainable energies as an alternative to fossil fuels has caused an increase in its share of the energy produced in some countries of the world. Solar energy is an endless source of sustainable energy and can replace fossil fuels. It is renewable, clean energy, and has huge potential in most regions of the globe, making it able to meet a large part of global energy needs [5,6].
Photovoltaic cells are considered one of the most important types of solar energy applications, in which solar energy can be converted into electrical energy [7]. Furthermore, solar tanks can store thermal energy from the sun by converting solar energy into thermal energy [8]. The trend toward making use of photovoltaic cells to generate electricity in hot and sunny areas faced two main dilemmas: These areas are mostly desert areas (such as North Africa and the Middle East) with dust storms abound [9,10]. The second thing is that the high irradiance causes the photovoltaic modules to heat up and thus reduce their performance [11,12]. The researchers studied both very carefully and found the appropriate solutions. Concerning dust, its components, types, and causes were studied, and the appropriate treatment was developed for it by defining the cleaning periods and the type of cleaning required [13,14]. As for the low performance of the PV modules, it is treated as suggested by many researchers using photovoltaic thermal systems (PV/T) [15,16]. These systems cool the PV module by air [17], water [18], nanofluids [19], and using phase-changing materials (PCM) or by cooling PCM and nanofluids [20,21]. The use of PV/T systems in regions with high solar radiation is gaining increasing interest. These systems are useful in converting high solar radiation into electrical and thermal energy together, with greater productivity by PV modules.
There have been many developments in PV/T systems, whether in terms of efficiency or cost, and studies in this regard are still being conducted in full swing. Cooling using a nanofluid can be considered more attractive than using water because of the high thermal conductivity of the first, which increases the cooling efficiency and enhances the system performance [22]. The process of mixing nanomaterials with the base fluid has become an easy and simple process, and some researchers have even set standard conditions for it. Ref. [23] studied the effect of several surfactant types on the thermophysical properties of nanofluids. Ref. [24] studied the effect of variable base fluids on the thermophysical properties of nanofluids. As for the nanoparticles used in nanofluids, they differed from metallic and non-metallic nanoparticles, as Ref. [25] investigated the effect of adding Cuo, Al2O3, and MWCNT to water without surfactant on the resulting thermophysical properties. This addition caused a tiny increase in the prepared fluid density and viscosity with a significant increase in thermal conductivity. MWCNT causes the best improvement in electrical efficiency due to its superior thermal conductivity over the other two fluids. Ref. [26] studied the use of a nanofluid formed from adding copper oxide (CuO) nanoparticles to water in the cooling of the PV/T system in the laboratory. The study also dealt with the thermophysical properties of the prepared nanofluid. The results showed a limited effect of adding nanoparticles on the density and viscosity of the resulting fluid due to the small amount added. As for the thermal conductivity of the produced nanofluids, it increased significantly, reaching 100.3% (when adding 2% nano-CuO).
Ref. [27] used single-walled carbon nanoparticles (SWCNTs) to form a nanofluid with water (75.0% volume ratio) and ethylene glycol (25% volume ratio). The researchers chose to add 0.5% by volume of SWCNT after studying the thermophysical characteristics of a number of fluids that were prepared in different proportions. The use of the proposed nanofluid resulted in an increase in the thermal and electrical efficiencies of 25.2% and 11.7%, respectively, compared to a stand-alone PV panel.
One of the major influences on the efficiency of a PV/T system is the heat exchange between the PV panel and the heat exchanger attached to it. This topic was studied by a group of researchers [28,29,30], where Ref. [31] found after studying three types of heat exchangers (web type, direct type, and spiral type) connected to PV modules that the spiral flow exchanger produced the best efficiency compared to the other exchangers (direct and web). Practical tests have shown that the temperature of the photovoltaic panel decreases in varying proportions according to the heat exchanger type used. The spiral heat exchanger PV/T system produced an output of 17.7 V, 2.89 A, and 51.3 W, with an overall efficiency of 35.0%. While the web and direct heat exchangers PV/T systems produced about 18.5% and 28.0% total generating efficiency, respectively.
In this study, all previous studies will be taken advantage of to reach the best PV/T system that can be assembled and used at the lowest possible costs and from materials available in the local Iraqi markets. Therefore, iron oxide nanoparticles were selected as nanoparticles added to a water-ethylene glycol blend to form a nanofluid with the greatest thermal conductivity. A spiral heat exchanger was also manufactured and glued to the back of the photovoltaic cell. For this purpose, two cells of the type of monocrystalline and polycrystalline were used to find the possible differences and which one is better to be used in the harsh conditions of Iraq’s weather. Furthermore, an exergy and energy analysis will be held for the two systems and compared with stand-alone PV module results.

2. Materials and Methods

2.1. System Description

In this study, the researchers intended to benefit from the results of several published studies, so the spiral flow absorber was chosen for the nanofluid circulation of the PV/T collector (shown in Figure 1) based on the results of Ref. [31]. Figure 1 shows a schematic drawing of the PV/T systems used in the experiments, which consist of two nanofluid-cooled PV/T systems and a standalone PV module. The spiral flow absorber consists of a unilateral channel for nanofluid flow down two PV modules, one of which is polycrystalline, and the other is monocrystalline. Table 1 shows the specifications of both modules used in the experiments. The modules used have the following measurements: 0.65 m wide and 1 m long.
The tested systems were installed at an angle of 33° to the south to suit the conditions of the city of Baghdad [32]. The city of Baghdad, the capital of Iraq, suffers from a very hot continental climate in summer with low to no rain during the past two decades and frequent dust storms, so it can be considered one of the harsh weather. Table 2 lists some average weather conditions per month for the study area. When the systems were loaded, variations in voltage and current were recorded. During these tests, the mass flow rate ranged from 0.08 to 0.017 kg/s according to Ref. [31] results. Data is collected and stored in the ADAM data acquisition system at intervals of one minute. This data will be used later in the electrical and thermal efficiency calculations of the tested systems. The nanofluid cooling system is a closed system. The entry and exit of nanofluids are controlled by valves prepared for this purpose, and within this cycle, there is a tank for storing the nanofluid.

2.2. Materials

Non-ionized distilled water was prepared in the laboratory while the ethylene glycol (C2H6O2) was supplied from local markets with a purity of more than 99.5%. It has a density of 1114 kg/m3, a melting point of −14 °C, and a boiling point of 197 °C.
Nano-iron oxide (Fe2O3) produced by (Sky Spring Nanomaterials, Inc., Houston, TX, USA) purchased from the local market was used in this study. The used nano-Fe2O3 has a purity of over 99% and its outer diameters range from 20–40 nm. These nanoparticle’s density is about 5240 kg/m3 and has high thermal conductivity (TC) of (32.9 W/mK). It was selected because they have sizes suitable for suspended in the emulsions for appropriate periods (high stability period) when good mixing is achieved. Furthermore, it was sold at a very reasonable price (1 US$/g), and this price is considered one of the cheapest in the local markets. Nano-iron oxide has been used by many researchers in the production of magnetic or magnetically active nanofluids in many applications. Among these applications are: (1) Magnetic coatings and coatings designed to absorb electromagnetic waves. (2) Data storage, and high-intensity magnetic recording. (3) In magnetic detectors. (4) Many high-tech microwaves. (6) In medical applications such as magnetically controlled drug delivery, medical imaging, cell separation, and refrigeration. (7) In the purification of biological contexts and wastewater [34,35,36,37,38,39]. Table 3 lists the studied materials properties.
In this study, the base fluid was prepared by mixing 75% volume of non-ionic distilled water with 25% volume of ethylene glycol (EG). These percentages were based on the results of the study [24]. This mixture was used as a base fluid for the nanofluid, as it acts as a lubricant that prevents the adhesion of nanoparticles and then their accumulation as long as the nanofluid circulates [24].

2.3. Mixing Procedure

The components of the nanofluid were mixed using the method followed by the Ref. [40] in preparing the nanofluids. After mixing EG with water and ensuring the homogeneity of the mixture, nano-Fe2O3 was added to them, and the components were mixed using an ultrasonic shaker. Ultrasonic vibration causes the particles to separate and diverge from each other and then spread throughout the base fluid. This method delays the agglomeration of nanoparticles and then their deposition for an appropriate period. The researchers differed in determining this appropriate period (or the nanofluids’ stability period). Ref. [41] considered the fluid to be stable if no deposition of nanoparticles occurred for a period of ten days, while Ref. [40] considered the fluid to be stable if no sedimentation occurred for more than six months. A recent study [42] considered the fluid stability of sixty days a sufficient period. The sonication time used to mix the components was three and a quarter-hour depending on the results of Ref. [43]. Furthermore, 0.1 mL of surfactant (Cetyl Trichromyl Ammonium Bromide (CTAB)) was added to the mixture to ensure longer stability of the suspension. The results of Ref. [23] were adopted in choosing the type of surfactant and its amount added.

2.4. Measurements

Heat transfer using nanofluids is affected by their thermophysical properties. Therefore, it is very important to measure and verify these properties before using any nanofluid in PV/T systems. The thermophysical properties of the prepared fluids were measured using several devices in the current study, which are:
  • HOT DESK Tps 500 (KIJTALEY, Sweden) for measuring the thermal conductivity of emulsions.
  • Density tester meter for prepared emulsions density.
  • Brookfield Programmer Viscometer (Model: LVDV-III Ultra-programmable) is used to measure the viscosity of emulsions. This instrument is connected to a laptop to collect and store the measured data.
  • Nano Zeta-Sizer (ZSN) was used to measure the stability of the prepared emulsions.
It was also adopted to re-measure the samples three times to ensure repeatability and reduce uncertainty in the measurements. After calibrating each device before using it, the uncertainty values described in Table 4 were used to find the total uncertainty using equation [44]:
  e R = ( R V 1 e 1 ) 2 + ( R V 2 e 2 ) 2 + + ( R V n e n ) 2
where
  • eR: Measurements uncertainty.
  • R: An independent variable function V1, V2, …, Vn or
  • R = R (V1, V2, …, Vn).
  • ei: nth variable uncertainty interval.
  • R V i : A single variable measured result sensitivity.
The total uncertainty resulted was 1.89% revealing high accuracy of the measuring procedure. Table 4 lists the instrumentations used and its uncertainty.

2.5. Energy Analysis

The PV/T system consists of a photovoltaic module that produces electricity and a heat-storage collector that transfers thermal energy. Therefore, the performance of this system depends on the electrical power produced by the PV module (Equation (3) in Table 5) and the useful thermal energy produced by the collector (Equation (2) in Table 5). The performance of the system combines two expressions: thermal efficiency ( η t h ) and electrical efficiency ( η P V ) (Equations (1) and (4), respectively, in Table 5).
The electrical efficiency expresses the ratio of the electrical energy produced by the PV module to the falling solar radiation intensity on it. Whereas thermal efficiency expresses the ratio of the useful heat gain produced by the system to the intensity of the incident solar radiation during a specified period. The overall system efficiency is defined as the total sum of thermal and electrical efficiencies (Equation (5)), and it is an important factor in the overall evaluation of such systems.

2.6. Exergy Analysis

In recent years, many researchers have relied extensively on exergy analysis when evaluating the performance of thermal systems. In the case of neglecting the effect of kinetic changes on the potential energy, the exergy balance can be expressed as listed in Table 6. Exergy analysis is an excellent way to determine the optimal design or operation strategy for a large number of industrial processes that use thermal systems [45]. This form of analysis aids in acquiring an understanding of the useful heat produced as mechanical work at the temperature of which heat is available and considers the grade of the energy produced (i.e., high- or low-grade energy). It can determine plant size, energy conservation, operating cost, fuel use, and pollutants [46,47].

3. Results and Discussion

The first measurement adopted by the study is to verify the thermophysical properties of the prepared nanofluids. Then, tested the effect of the nanofluids flow on the energy and exergy of the prepared PV/T with a spiral flow in Baghdad city weather conditions.

3.1. Climate Conditions

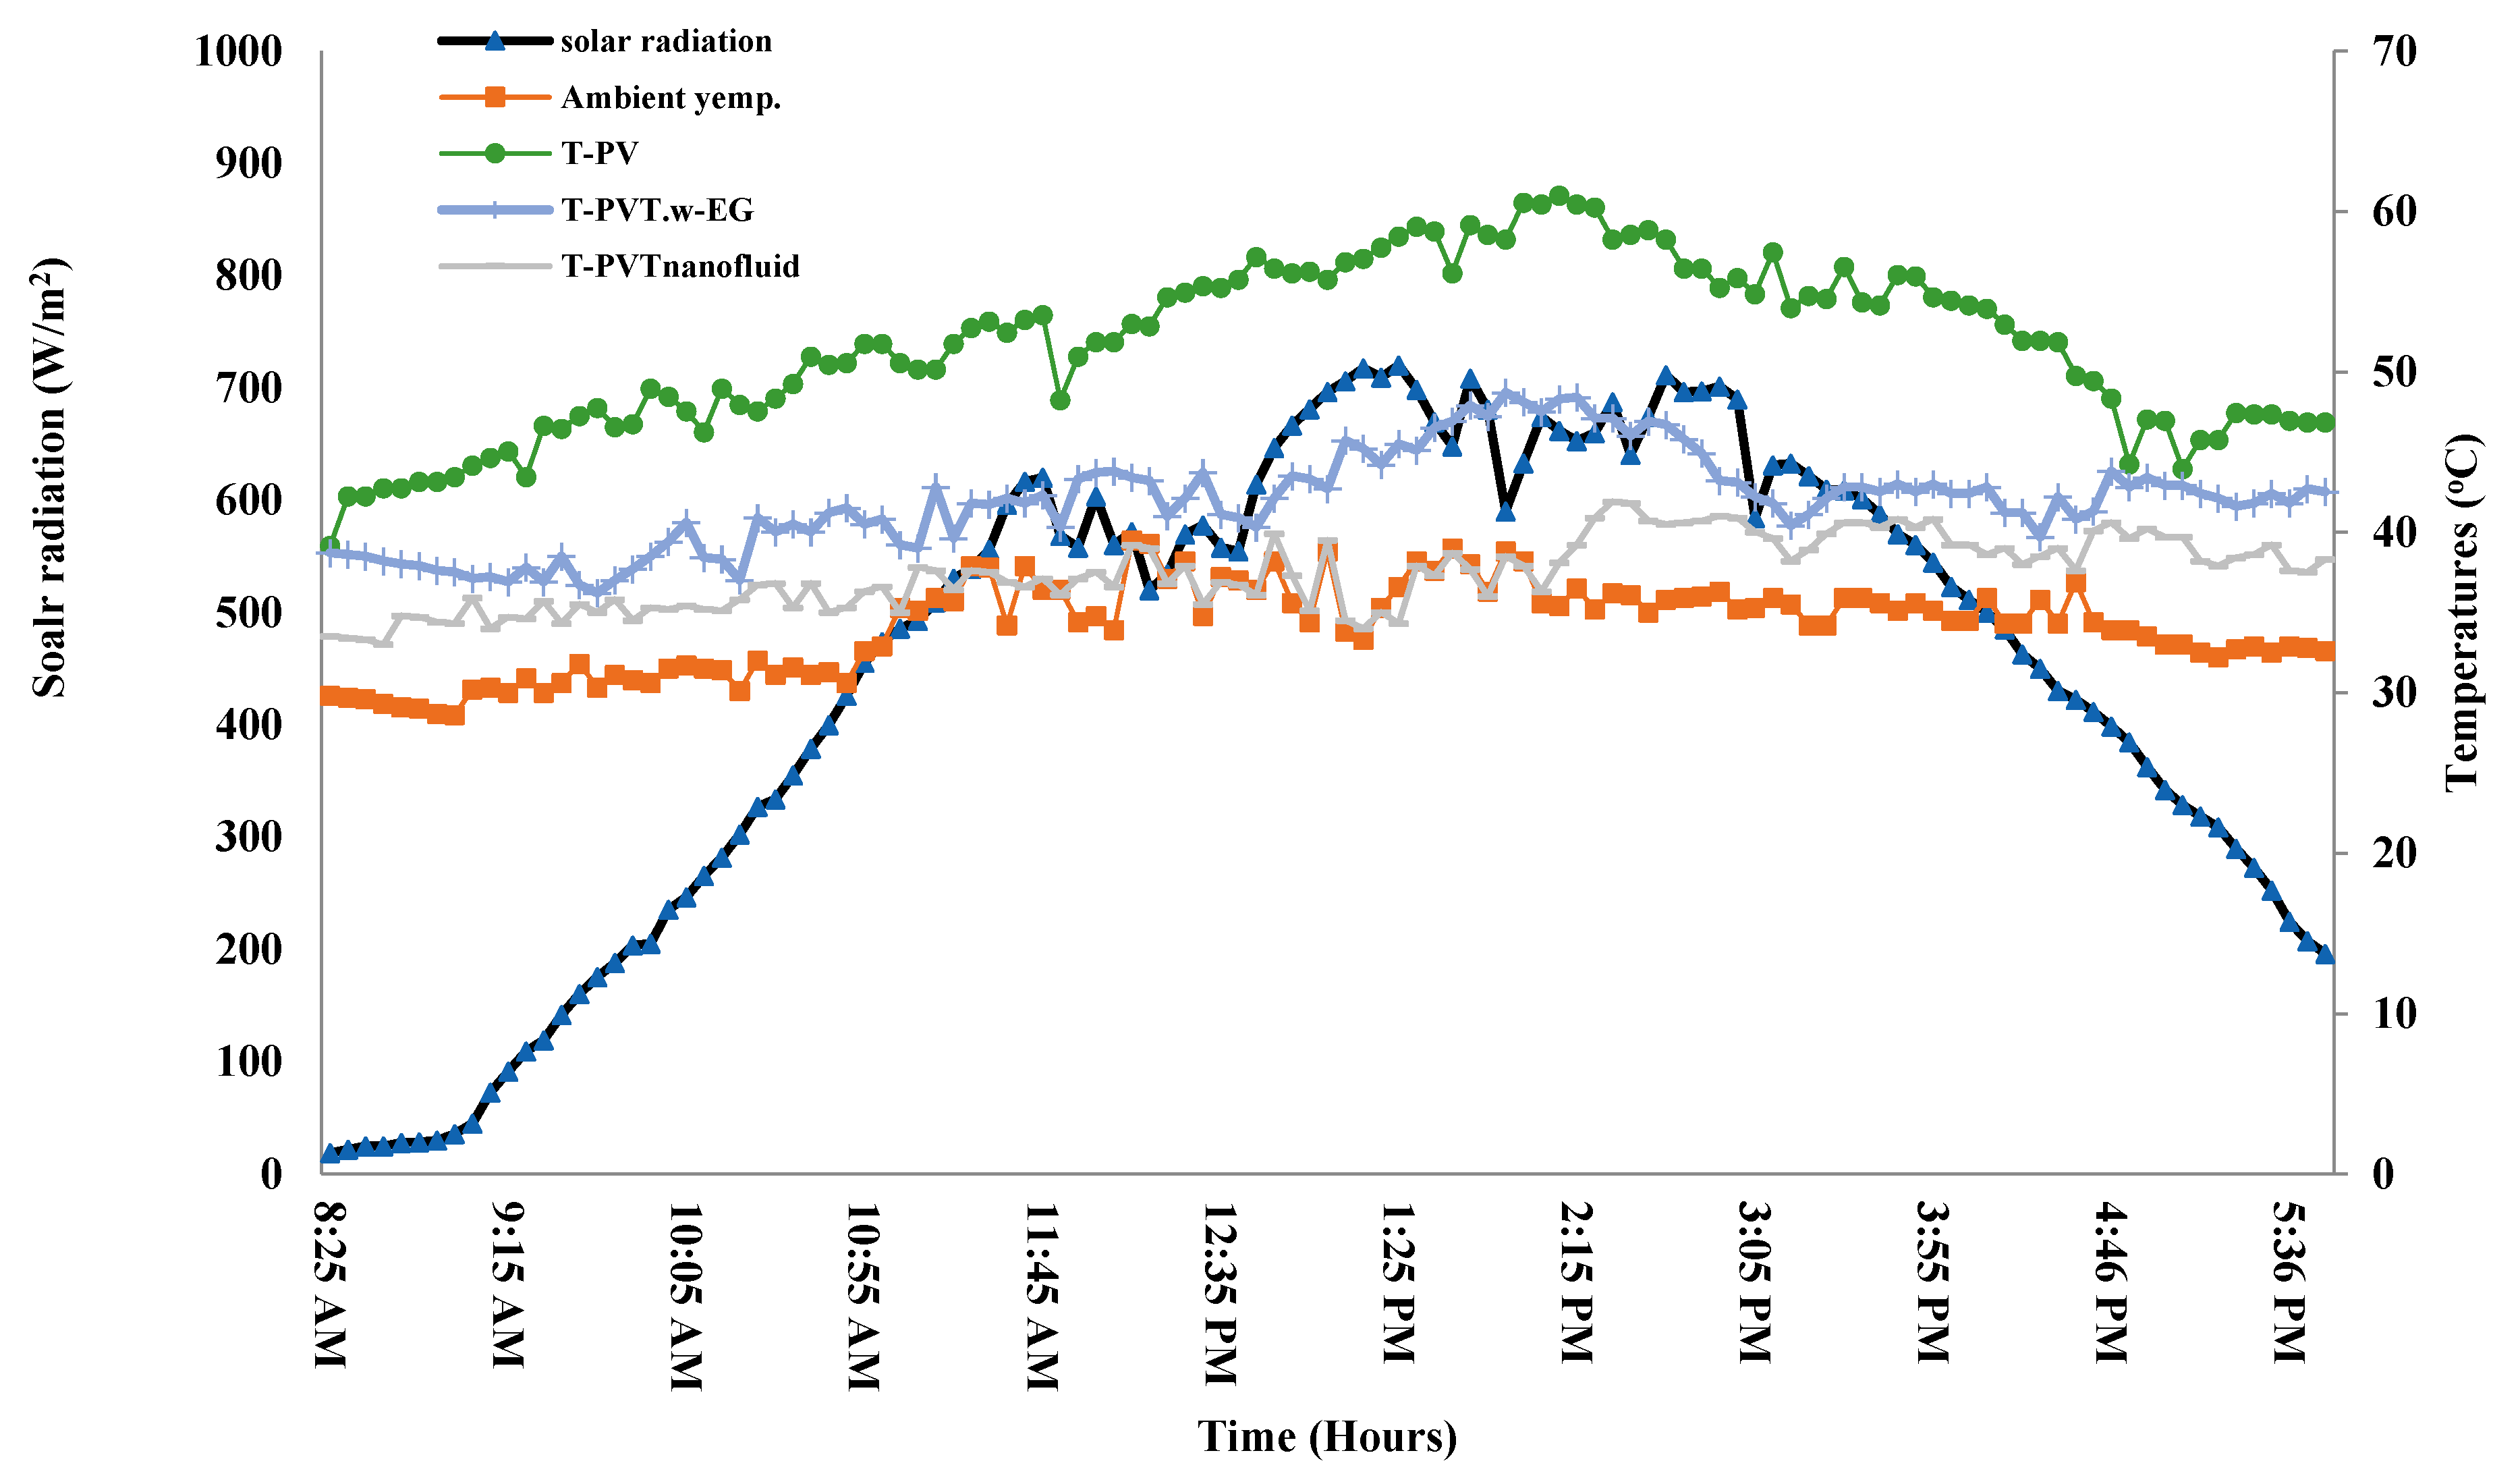
The climate of the study area (Baghdad) is characterized by being a desert climate with mild winters (from mid-December to mid-February) and very hot summers (from May to October). Figure 2 shows the relation between average solar radiation intensity, and average ambient temperature for the testing days (11, 12, and 14 May). May is considered the beginning of the summer season in Baghdad. The ambient temperature is relatively high. The maximum temperature recorded was 38.82 °C at peak time. The solar radiation intensity enlarged from the first morning hours to reach its maximum value (720 W/m2) at peak hours. This value is moderate compared to measured values in July and August (more than 1000 W/m2) at the peak period [32].
The figure also shows the effect of the solar radiation intensity on the studied systems. The temperature of the standalone PV module started to rise since sunrise and reached a level higher than the ambient temperature. The PV module is cooled by ambient air through convection streams. Due to the low convective heat transfer coefficient of air, the cooling process is slow compared to the speed of the module’s gain of heat. The EG-water cooled PV/T system has a lower temperature than the PV system because this mixture has higher specific heat than air, but its thermal conductivity is low. While for the case of cooling the system with a nanofluid, the PV module temperatures were less than in the previous two cases, and the reason for this refers to the high thermal conductivity of the nanofluid. The results in the figure prove that the nanofluid-cooled PV/T system is more effective in cooling the PV module and increasing its electrical and thermal productivity. The PV panels’ temperatures were reduced by 18.85%, and 27.57% when it was cooled by EG-water blend and Iron oxide nanofluid, respectively.

3.2. Thermophysical Properties

The properties of the laboratory-measured thermophysical prepared nanofluids were measured and analyzed. These features were examined in detail due to their importance and impact on the energy and exergy of the studied PV/T systems.

3.2.1. Viscosity

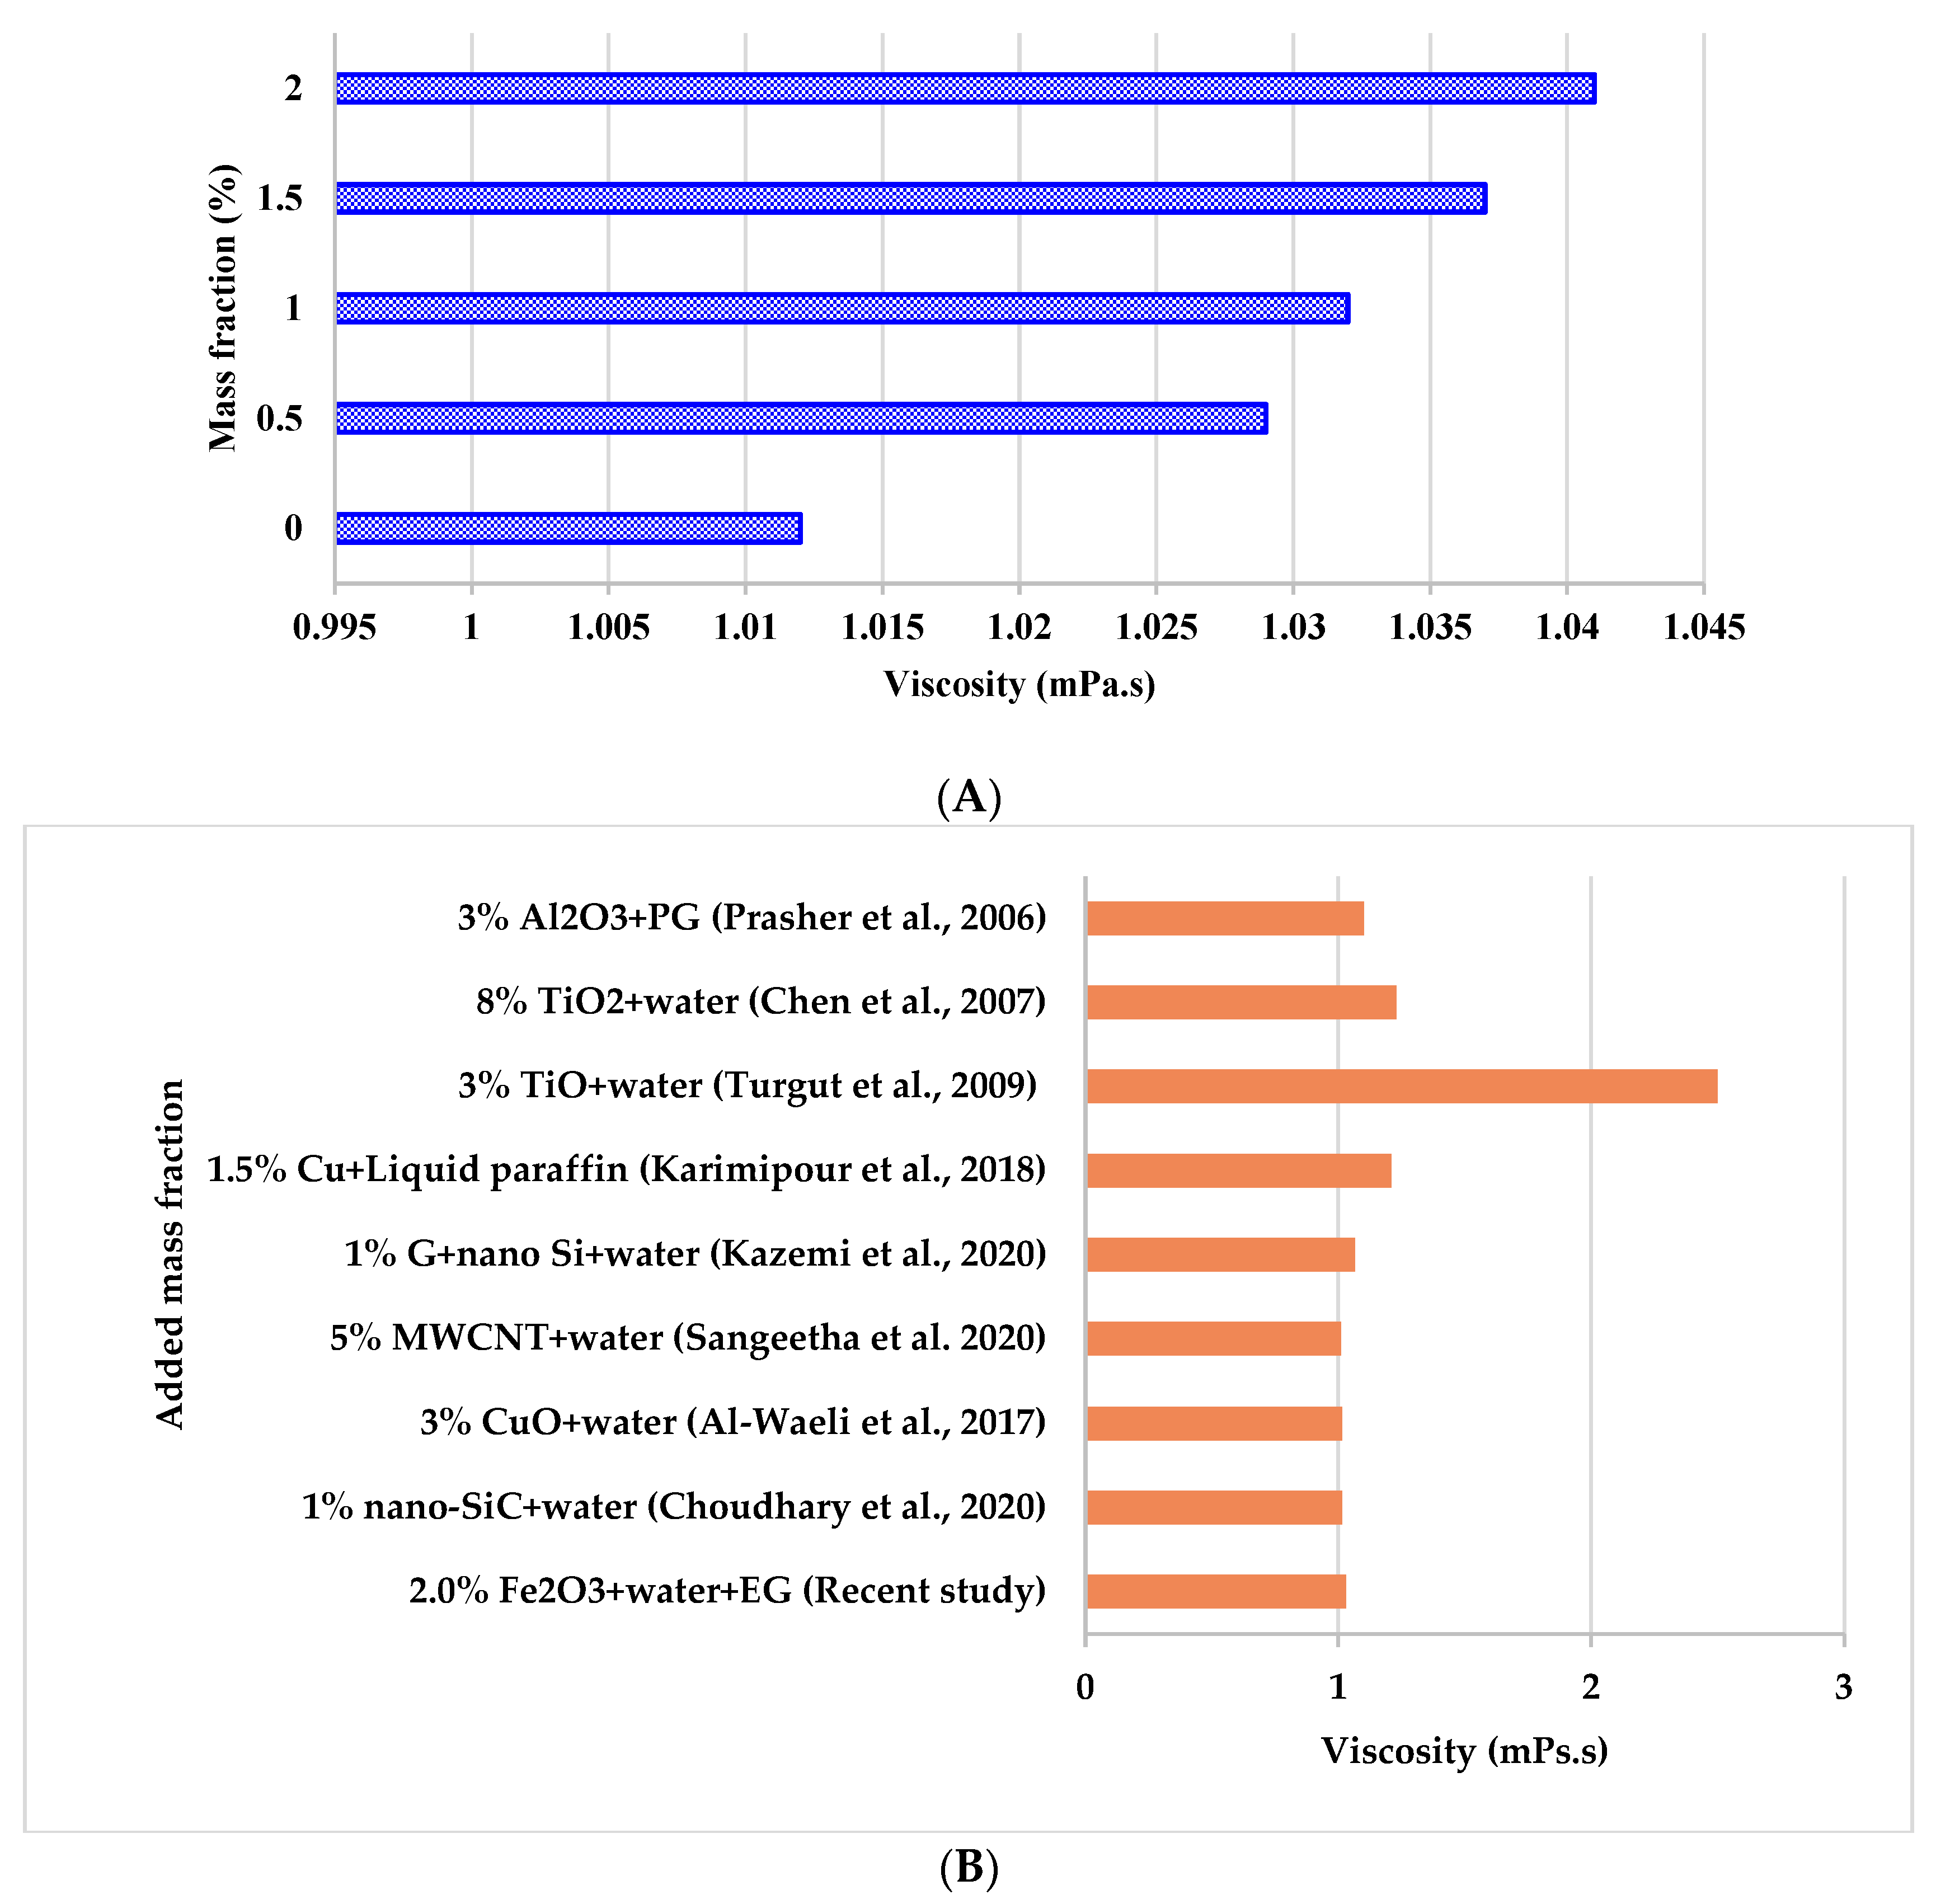
The viscosity of the nanofluid increased with the increase in the mass of the nanoparticles added as Figure 3A declares. The results indicate that the increments in the prepared nanofluids viscosity were 1.67%, 1.97%, 2.47%, and 2.86% for added mass fraction by 0.5%, 1.0%, 1.5%, and 2%. These increments are relatively fair, and the authors did not see any effect on system performance during the experiments. Figure 3B shows a comparison between the recent study viscosity and some other works in literature [25,41,51,52,53,54,55,56]. The results indicate a clear convergence due to the small amount of nanoparticles added, except for Ref. [54] results for adding TiO2 powder to water, which resulted in high viscosity.

3.2.2. Density

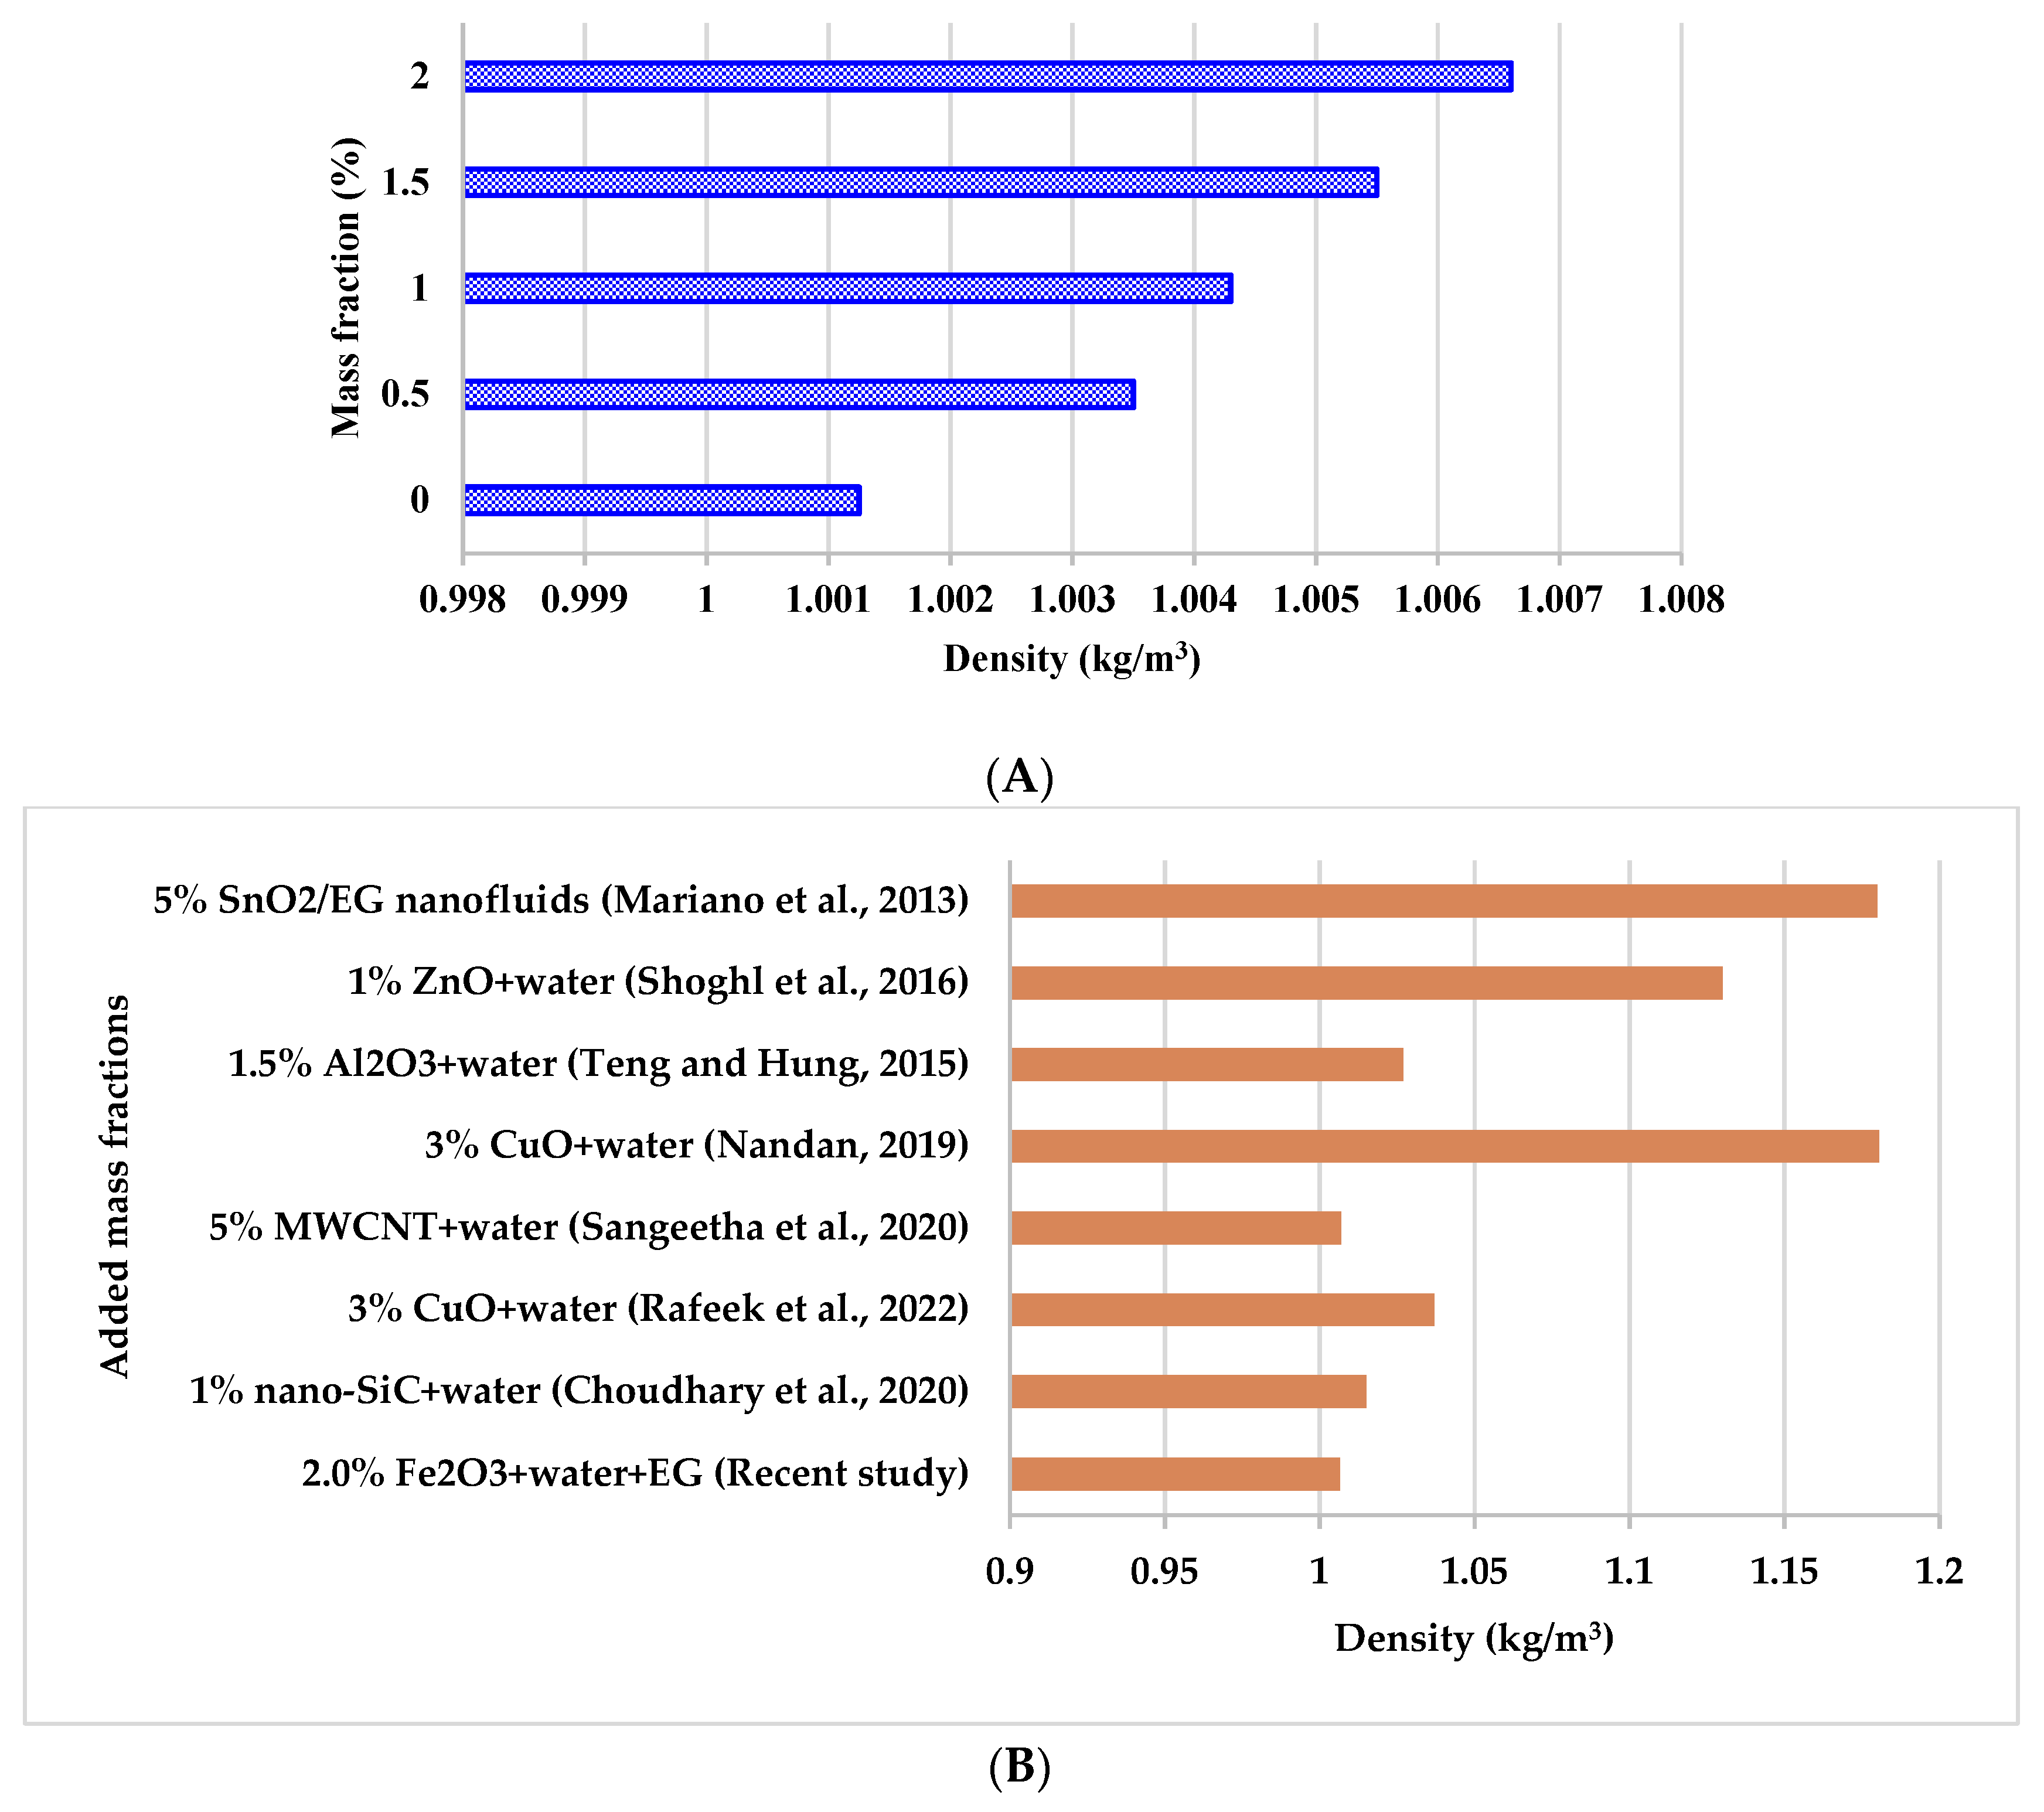
The nanofluid density increased by the nanoparticle’s addition. However, as the added nanoparticles mass fractions are little, the resulted densities variations were also small. The EG has a higher density than water (1.11 g/cm3), for this reason, the water-EG blend has a higher density than water. For the nanofluids the increments in the densities as Figure 4A declares were 0.22%, 0.30%, 0.42%, and 0.53% for 0.5%, 1.0%, 1.5%, and 2% nano-Fe2O3 mass fractions add to water, respectively, compared to water-EG density. These increments have a neglected impact on the system performance because of their small values. Figure 4B represents a comparison between the achieved maximum density in this study with others from the literature [25,41,51,57,58,59,60]. The result of the current study is consistent with many studies in the literature as the figure shows. As for the high-density nanofluids, the reason is due to the type of the base fluid (pure EG as in the case of the Ref. [60]) or the type of nanoparticles added, as in the case of Ref. [57].

3.2.3. Thermal Conductivity

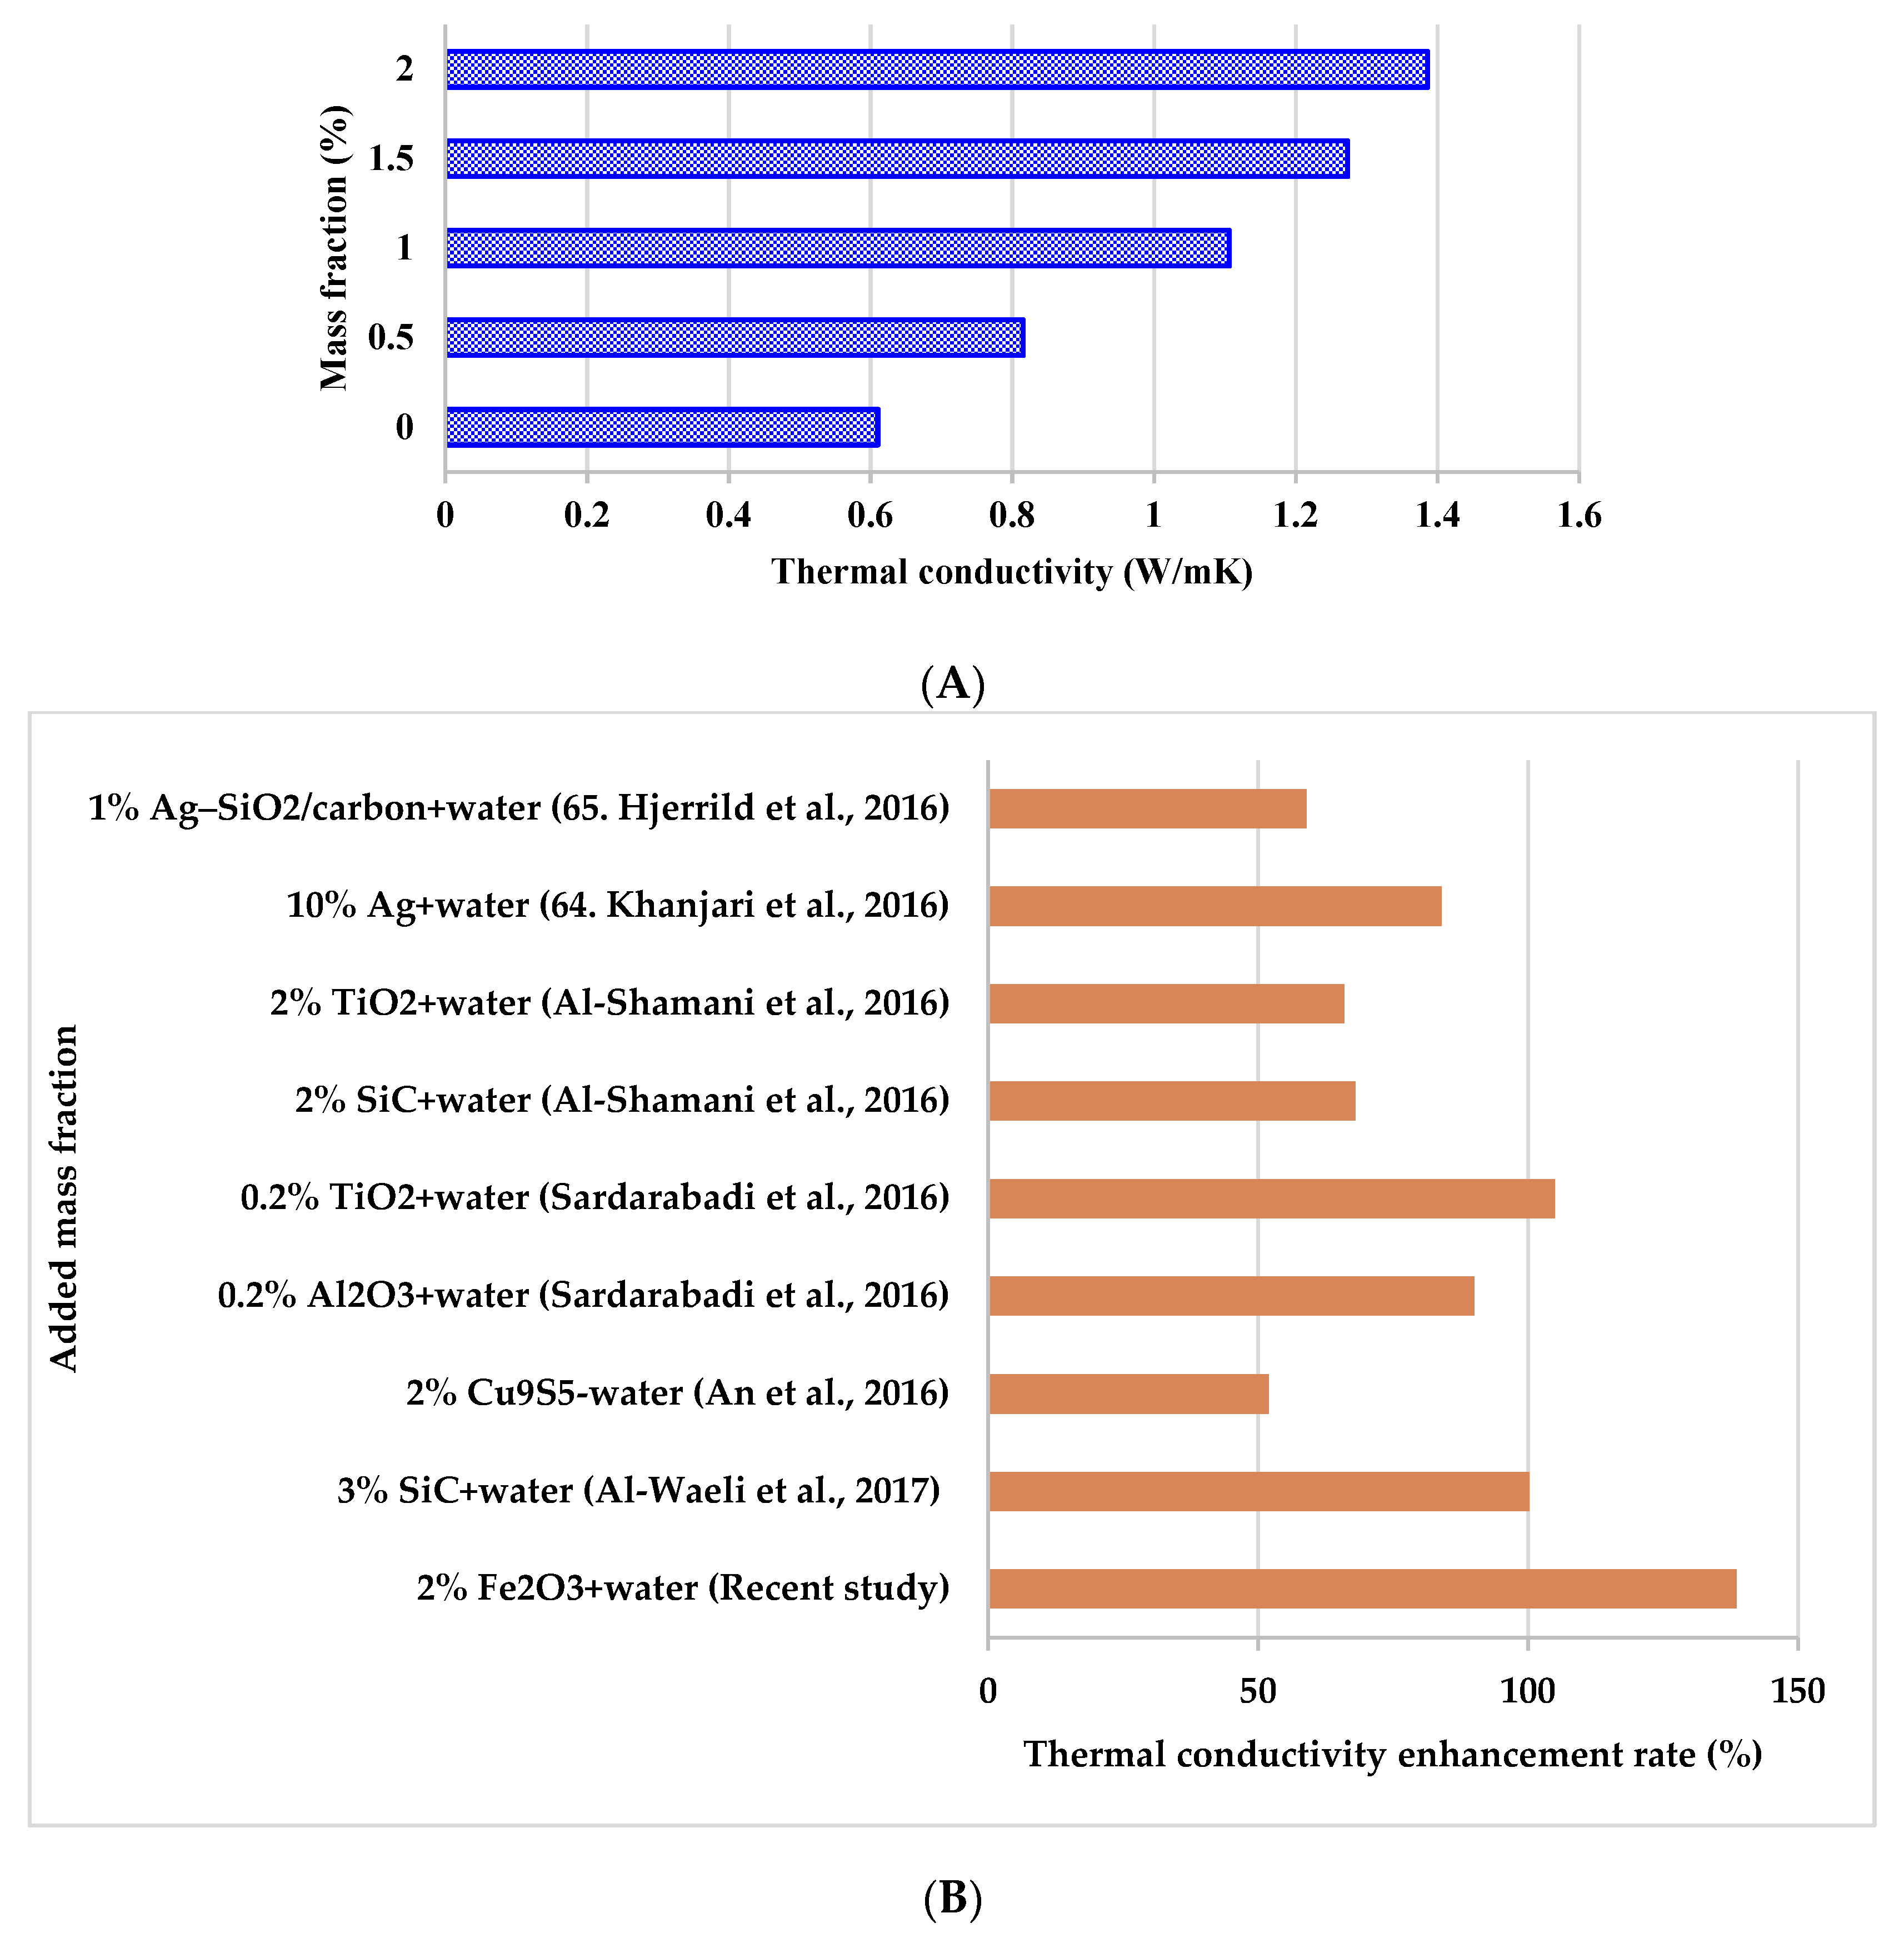
TC increased when the nano-Fe2O3 added mass fraction was increased in the water EG mixture. Iron oxide is one of the highly conductive metal oxides, so adding its nanoparticles to water caused a clear enhancement in the nanofluid TC amounting to 33.6%, 81.3%, 105.3%, and 123.6% for 0.5%, 1.0%, 1.5%, and 2% nano-Fe2O3 mass fractions add to water-EG blend, respectively, as Figure 5A reveals. Figure 5B compares the TC enhancement rate in the recent study with others from the literature [51,61,62,63,64,65]. It is clear that the recent study’s TC is higher than the others due to the high TC of the nanoparticles used as well as for the careful mixing procedure used.

3.2.4. Stability

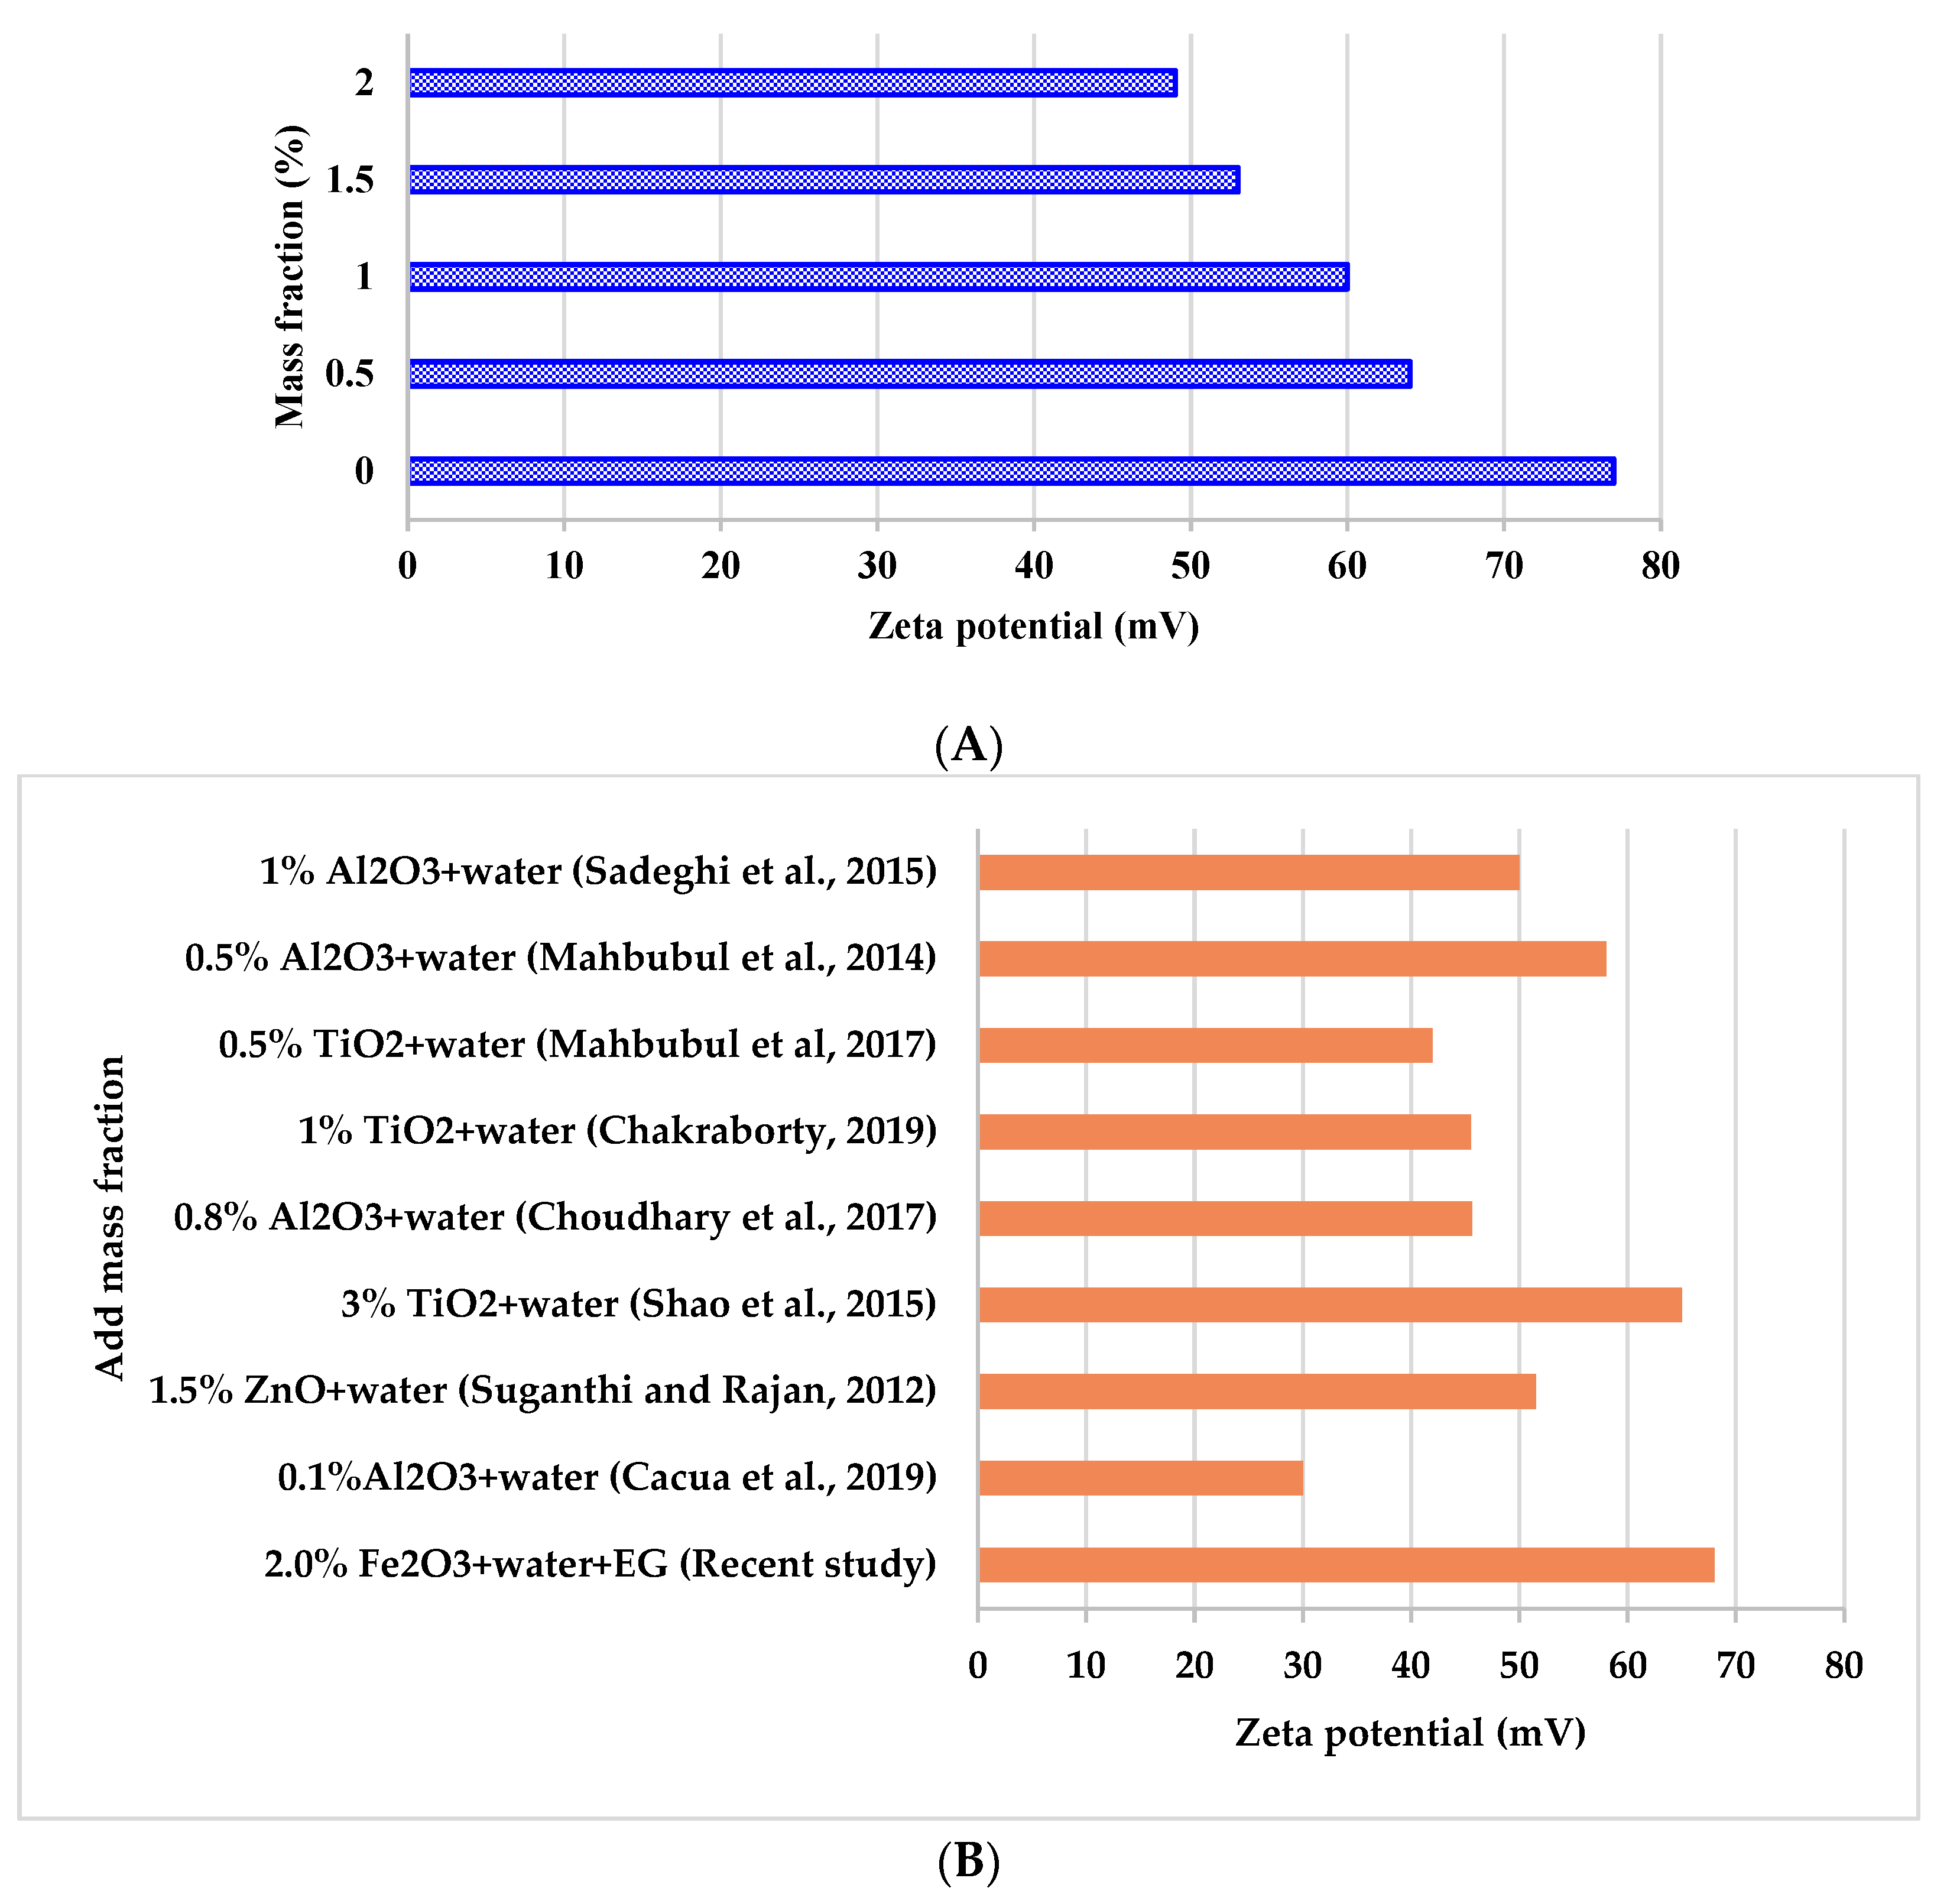
One of the most important thermophysical properties that must be checked before using any nanofluid is the stability of this fluid. This stability plays a vital role in the behavior of the nanofluid and in enhancing its function as a heat carrier. Methods of mixing nanofluids with the base liquid have been developed using sonication, which resulted in the production of many nanofluids with high stability. The researchers used several methods to analyze the stability of nanofluids, such as the sedimentation method [66,67], zeta potential analysis [68,69,70,71], absorption spectroscopy [72], and pH measurement method [73,74]. The zeta potential was used to measure the stability of nanofluids in this study. In this method (zeta potential) the electric charge between the nanoparticles is measured. The nanofluids are considered completely stable when their zeta voltage is between 40 and 60 mV, while the nanofluids are considered to be exceptionally stable if their zeta voltage is more than 60 mV. As for nanofluids with a zeta potential of less than 25 mV, the possibility of nanoparticles agglomeration and sedimentation in the fluid is high, which makes these fluids unstable [66,67,68,69,70,71,72,73,74,75,76,77,78,79,80,81,82,83,84,85,86,87,88]. Figure 6A shows the zeta potential of the nanofluids prepared in this study. The results show that all tested suspensions samples have high stability. The most stable prepared suspension was the one to which Fe2O3 was added at a mass fraction rate of 0.5%, as its zeta potential reached 64 mV, and the least stable was the suspension with a mass fraction ratio of 2% (zeta potential of 49 mV). The rate of deterioration of the zeta potential of the nanofluid was increased by increasing the nanoparticles mass fraction [14]. Good mixing using ultrasound for an appropriate period of time resulted in high stability of the prepared suspensions.
Figure 6B shows a comparison between the measured stability in a recent study with others from the literature [75,76,77,78,79,80,81,82]. The figure curves show that the prepared nanofluid in this study has high and suitable stability compared to the included studies, which confirms the validity of the work steps and the accuracy of the measurements. The results showed that nano-Fe2O3 is suitable as a coolant for PV/T systems, as it has high stability and good thermal conductivity, in addition to the fact that the change in density and viscosity is limited.
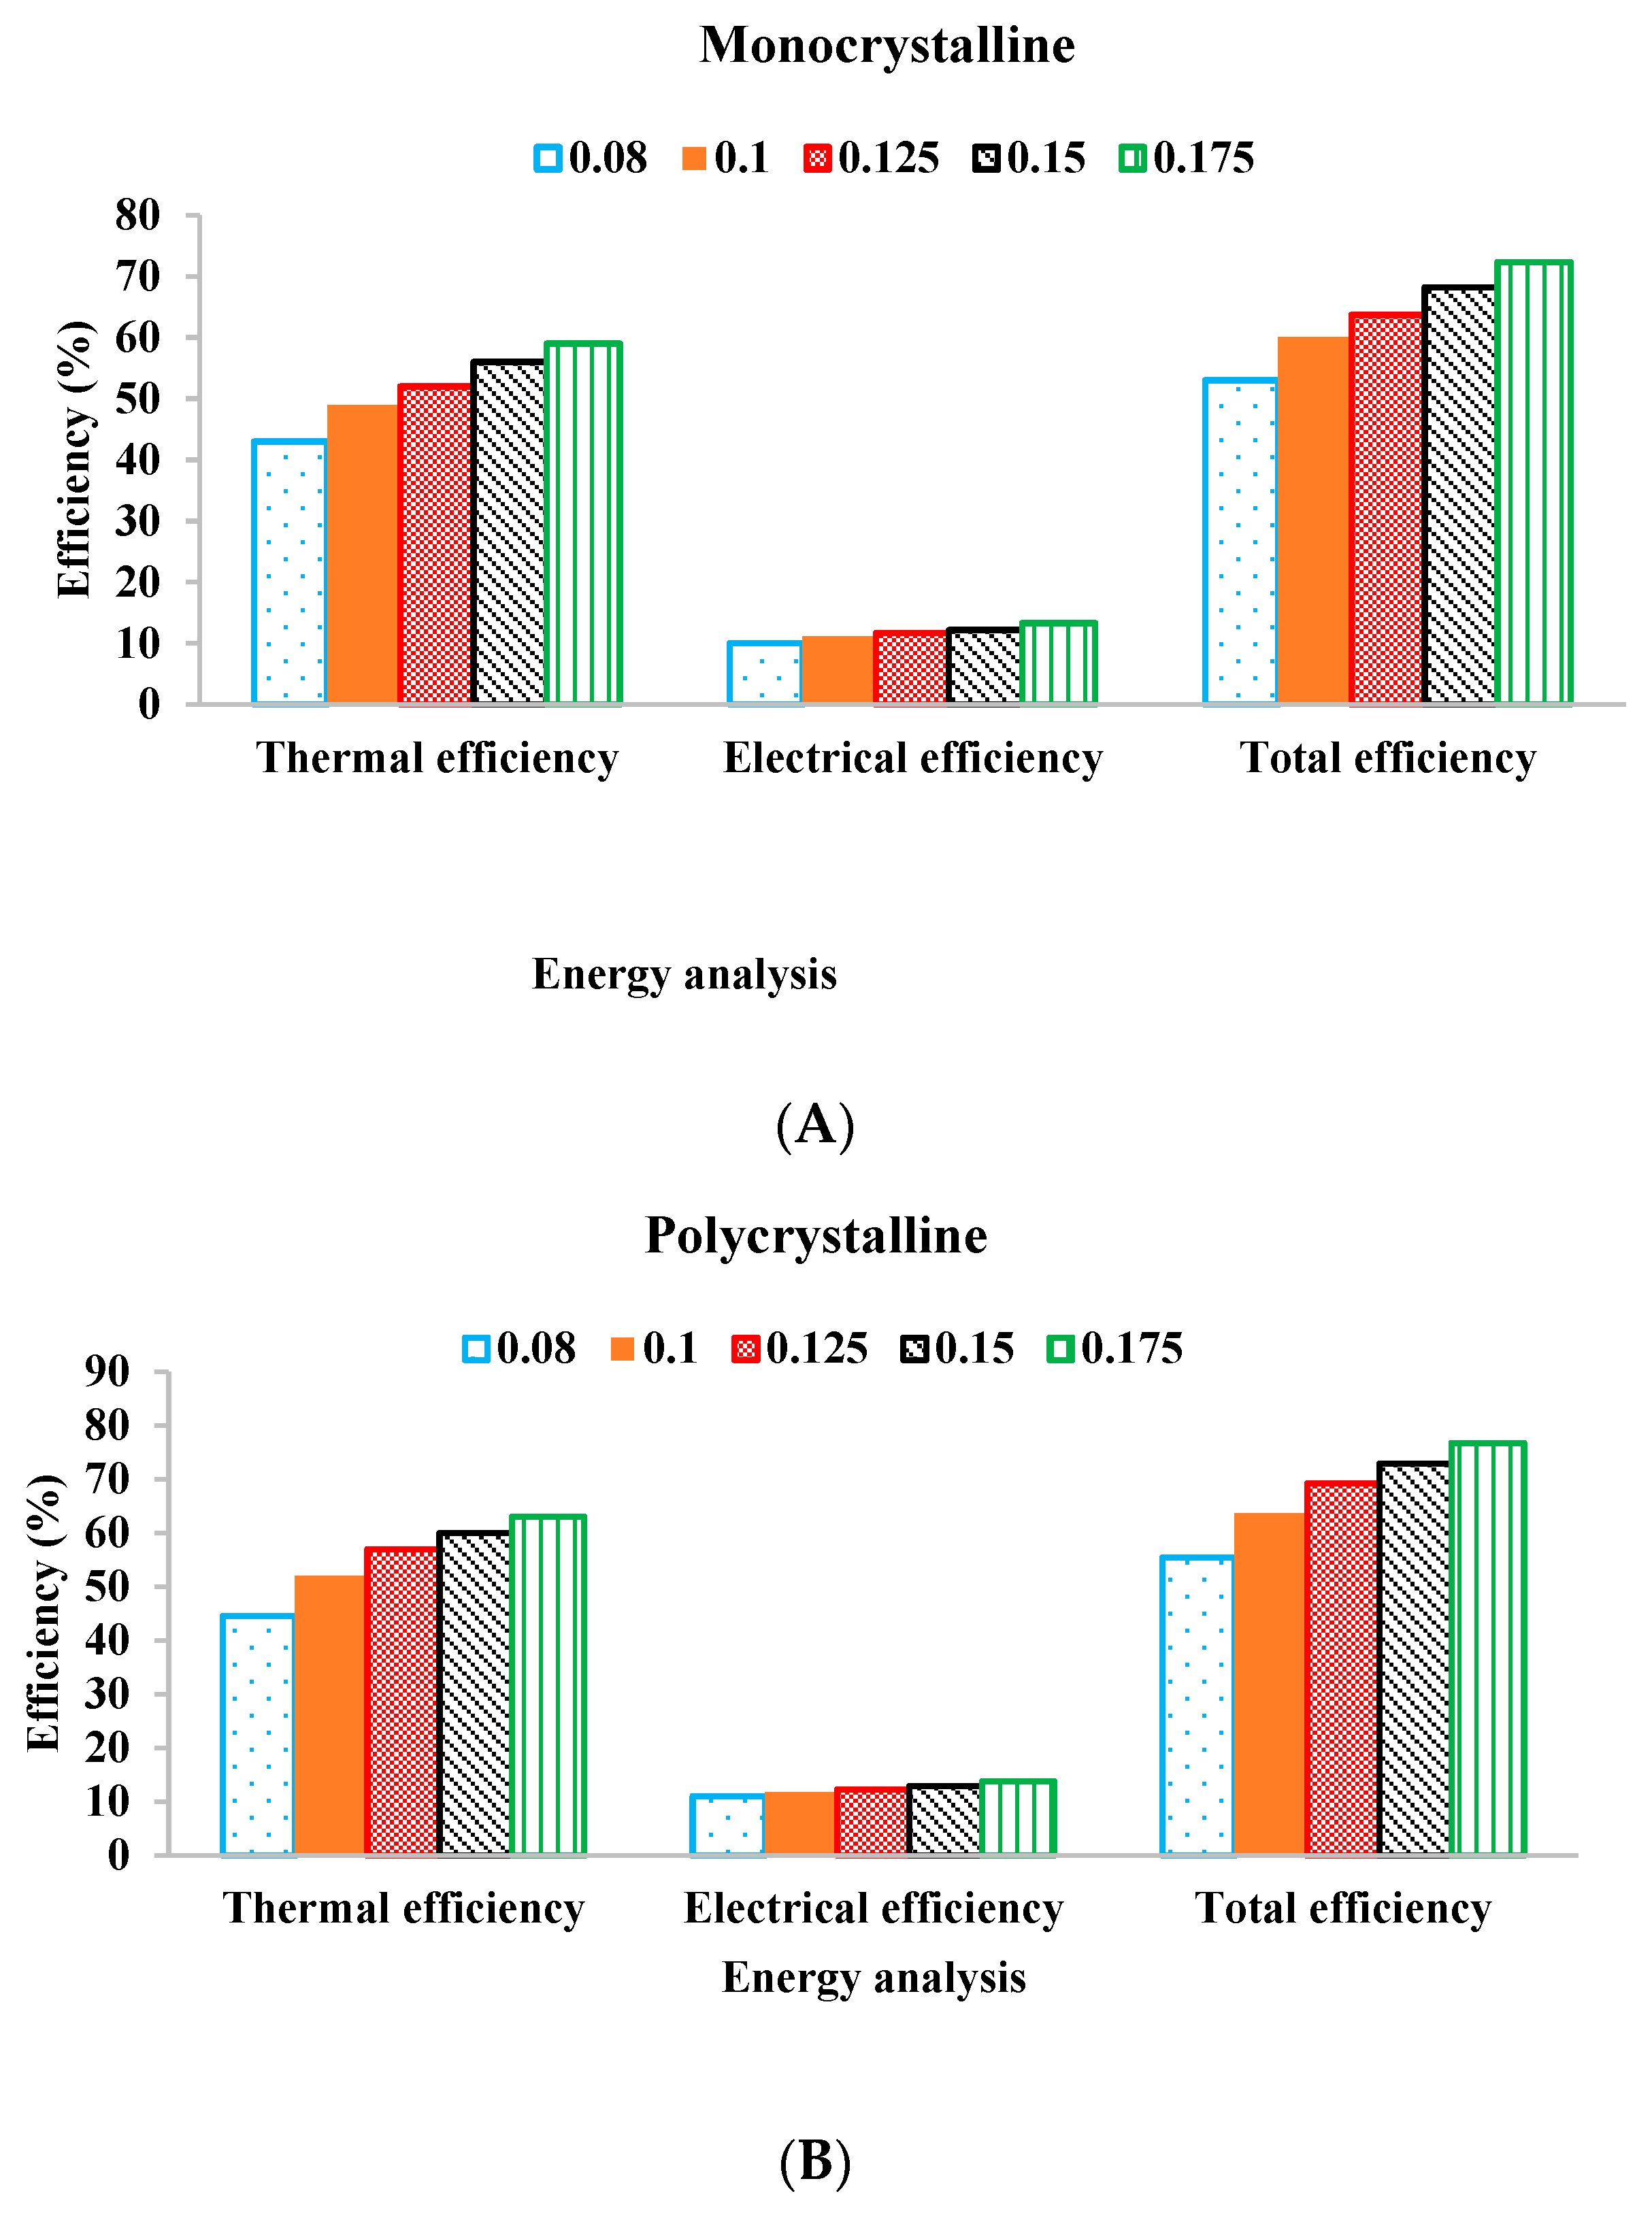
Figure 7 shows an analysis of the energy (energy-saving efficiencies electrical, thermal, and total) of the two PV/T systems when circulating a nanofluid with the highest thermal conductivity (2% nano-Fe2O3 with EG-water blend). The nanofluid is circulated in a spiral flow heat exchanger. The figure studies the effect of mass flow rate which ranges from 0.08 kg/s to 0.017 kg/s. Figure 7A shows the maximum electrical, thermal and total efficiencies for a system using monocrystalline PV and Figure 7B shows the same efficiencies for the working case of a polycrystalline PV system. For both cases, increasing the mass flow rate produced higher efficiencies. The monocrystalline PV/T system produced a total efficiency ranging from 59% to 72.3%, where the electrical efficiency was between 10% to 13.3% and the thermal efficiency was from 43% to 59%. When using a polycrystalline photovoltaic panel, the PV/T system produced a total efficiency ranging from 55.5% to 76.75%, where the electrical efficiency was between 11% to 13.75% and the thermal efficiency from 44.3% to 63%. These results show a partial superiority of the polycrystalline PV/T system over the monocrystalline system.
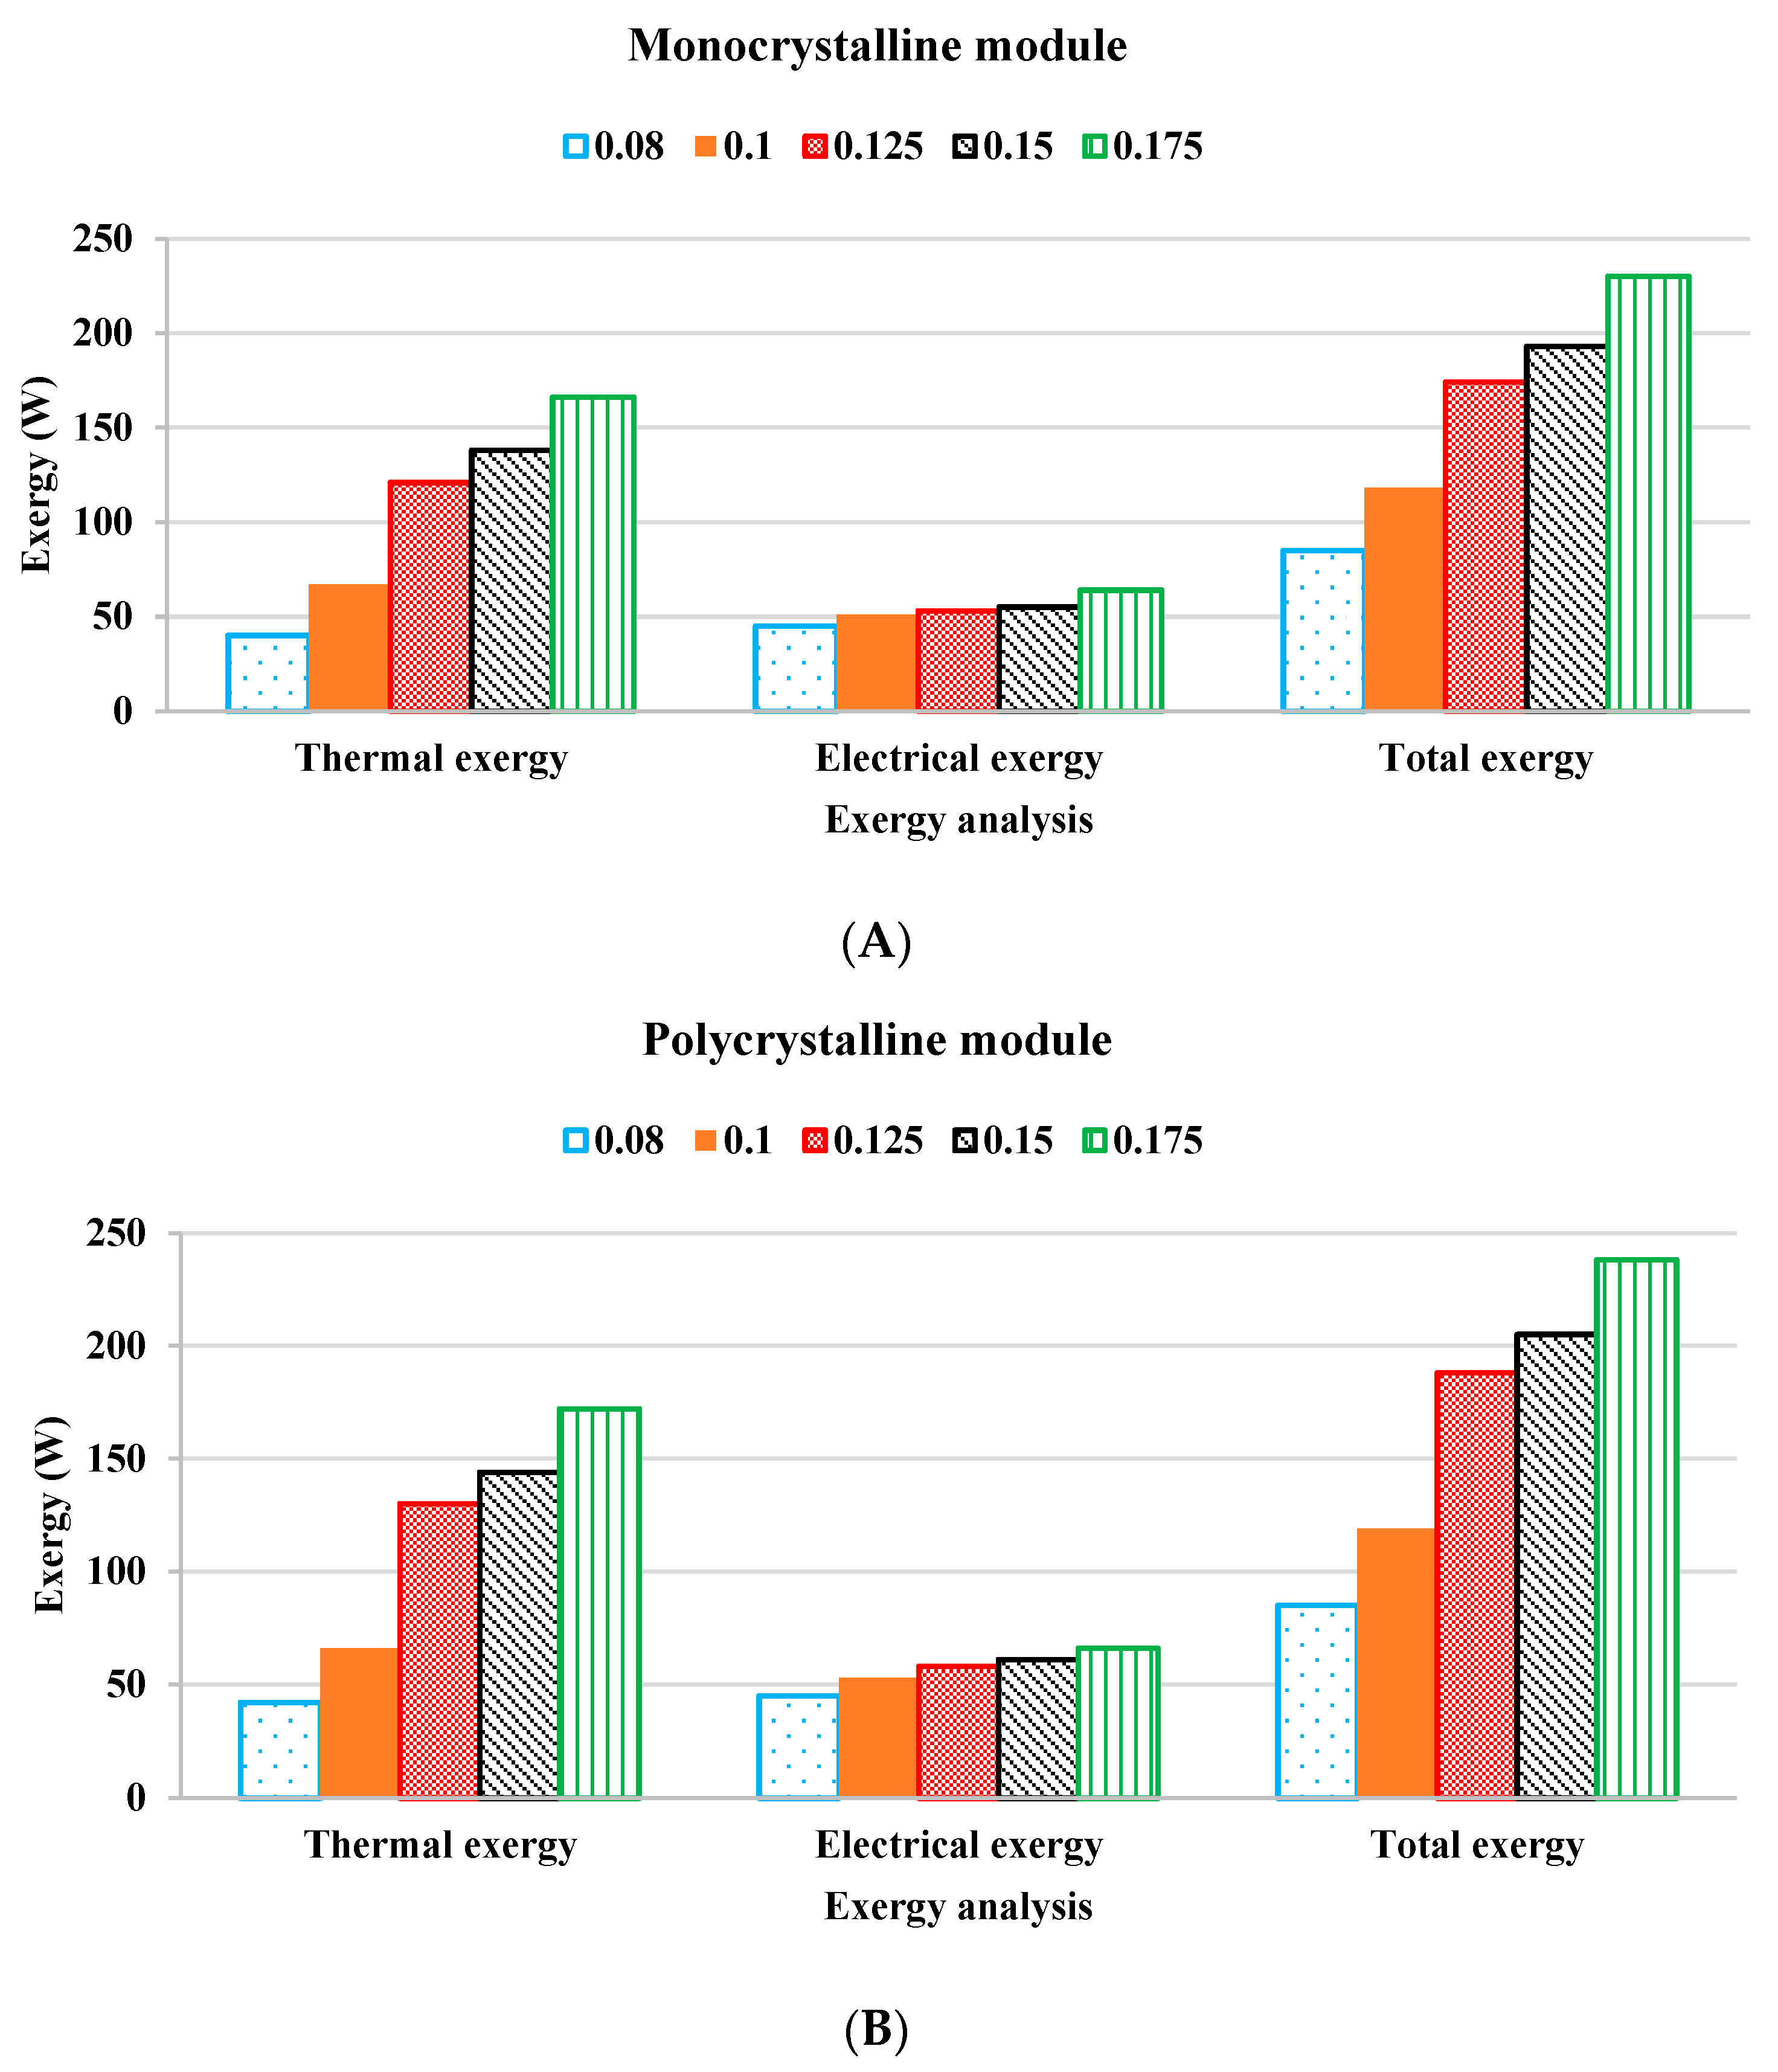
Figure 8 shows the exergies variation of the two PV/T systems (monocrystalline and polycrystalline). Like the previous figure, the thermal, electrical, and total exergies increase with the increase in the mass flow rate from 0.08 kg/s to 0.17 kg/s. The photovoltaic power increases very slowly. The electrical exergy of the monocrystalline system ranged between 45 W and 64 W while the thermal exergy was from 40 W to 166 W, and the total exergy ranged from 85 W to 280 W. As for the case of the polycrystalline PV/T system, the electrical exergy ranged from 45 W to 66 W, the thermal exergy ranged from 42 W to 172 W, and the total exergy ranged from 85 W to 238 W. The results show a slight superiority in the exergy of the PV/T system powered by polycrystalline PV compared to the other system.
At high mass flowrates, the PV/T thermal exergy remains high, and it is observed to continue to rise up to a certain point, which is consistent with the mathematical models and other studies published on this topic. Increasing the mass flowrate from 0.08 kg/s to 0.175 kg/s led to an increase in the thermal exergy of around 300% (from 42 to 172 W) and 315% (from 40 to 166 W) for the poly- and mono-crystalline PV/T collectors—considering an average exergy input of around 328.65 W/m2. Meanwhile, minimal variations were observed for the electrical exergy produced by the PV model, which means this type of system can be considered to be thermally biased. It is noteworthy to mention that the electrical yield of the system is a high-grade form of energy, while the thermal yield is considered to be low-grade. Table 7 lists the results of some valuable studies in the literature and the current study efficiencies results. The table included the type of heat collector and the cooling fluid used for comparison. Comparison of these results may not be fair due to differences in flow type, the material of the heat exchanger, flow rate, coolant type, etc. However, such tables remain useful, as they give an indication of whether the results are acceptable or not. When comparing the results of the current study with the studies listed in Table 7, it is noted that the two systems used gave excellent results compared to the rest of the studies, except for the Ref. [89], which can be superior to using nano-PCM and nanofluid together. Such collectors are considered to be very expensive compared to cooling only with nanofluid. The issue here remains the balance between the cost and the financial return from the system.

4. Conclusions

This study presented an empirical analysis of the energy and exergy for two nanofluid cooling systems consisting of an EG-water mixture (75% to 25%, respectively) and iron oxide nanoparticles. A spiral heat exchanger attached to the back of the photovoltaic panel was used. Two types of PV technologies, which are monocrystalline and polycrystalline, were examined in the harsh weather conditions of Baghdad city. The efficiency of three cooling methods (conventional PV, EG-water-cooled PV/T, and nano-fluid-cooled PV/T) was compared. The results show that cooling with the EG-water mixture alone reduced the temperature of the PV panel to 18.85%, while when using the nanofluid, the percentage of reduction was about 27.57%. Important properties of the nanofluid such as viscosity, density, thermal conductivity, and stability of the fluid were evaluated. The results showed that the addition of nano-Fe2O3 by weight of 2% caused a limited increase in the density and viscosity of the nanofluid, but it caused a clear increase in its thermal conductivity up to 140%. The prepared nanofluids proved to be of high stability as a result of good mixing and use of sonication for a sufficient period of time. Finally, by comparing exergy and energy between the two PV/T systems working with mono and polycrystalline, it was found that the polycrystalline system produced higher energy and exergy than the monocrystalline case. The total electrical, thermal, and total efficiencies obtained were 13.75%, 63%, and 77.65% for a PV/T system with a polycrystalline PV panel. As for the highest total exergy that was reached, it was 238 W for the same system, compared to 172 W for the case of monocrystalline.
The study results clarify the need for several future studies to reach the most suitable nanofluid for PV/T systems. It is also very appropriate to study the effect of magnetic field on nanofluids containing nano-ferrous oxide and the effect of this method on the efficiency of PV/T systems.

Author Contributions

Conceptualization, A.A.E., M.T.C. and H.A.K.; methodology, A.H.A.A.-W. and A.A.E.; validation, H.S.M., M.A.F. and H.A.D.; investigation, M.T.C.; resources, H.S.M. and M.A.F.; data curation, K.S.; writing—original draft preparation, M.T.C., A.H.A.A.-W. and H.A.D.; writing—review and editing, T.Y. and H.A.K.; supervision, K.S., H.A.D. and T.Y. All authors have read and agreed to the published version of the manuscript.

Funding

This research received no external funding.

Conflicts of Interest

The authors declare no conflict of interest.

References

  1. Li, Z.; Huang, Z.; Failler, P. Dynamic correlation between crude oil price and investor sentiment in China: Heterogeneous and asymmetric effect. Energies 2022, 15, 687. [Google Scholar] [CrossRef]
  2. Chaichan, M.T.; Kazem, H.A.; Abed, T.A. Traffic and outdoor air pollution levels near highways in Baghdad, Iraq. Environ. Dev. Sustain. 2018, 20, 589–603. [Google Scholar] [CrossRef]
  3. Long, E.; Carlsten, C. Controlled human exposure to diesel exhaust: Results illuminate health effects of traffic-related air pollution and inform future directions. Part. Fibre Toxicol. 2022, 19, 11. [Google Scholar] [PubMed]
  4. Halttunen, K.; Slade, R.; Staffell, I. What if we never run out of oil? From certainty of “peak oil” to “peak demand”. Energy Res. Soc. Sci. 2022, 85, 102407. [Google Scholar] [CrossRef]
  5. Colasante, A.; D’Adamo, I.; Morone, P. What drives the solar energy transition? The effect of policies, incentives and behavior in a cross-country comparison. Energy Res. Soc. Sci. 2022, 85, 102405. [Google Scholar] [CrossRef]
  6. Wattana, B.; Aungyut, P. Impacts of solar electricity generation on the Thai electricity industry. Int. J. Renew. Energy Dev. 2022, 11, 156–163. [Google Scholar] [CrossRef]
  7. Duda, J.; Kusa, R.; Pietruszko, S.; Smol, M.; Suder, M.; Teneta, J.; Wójtowicz, T.; Żdanowicz, T. Development of roadmap for photovoltaic solar technologies and market in Poland. Energies 2022, 15, 174. [Google Scholar] [CrossRef]
  8. Gupta, B.; Bhalavi, J.; Sharma, S.; Bisen, A. Phase change materials in solar energy applications: A review. Mater. Today Proc. 2021, 46, 5550–5554. [Google Scholar] [CrossRef]
  9. Meilinger, S.; Herman-Czezuch, A.; Zemo, A.; Bebber, M. Impact of dust storms and urban air pollution on PV-power systems: Case studies from Ghana. In Proceedings of the EMS Annual Meeting Abstracts 2021, No. EMS2021-419, Online, 6–10 September 2021. [Google Scholar] [CrossRef]
  10. Ravindra, B. Forecasting solar radiation during dust storms using deep learning. arXiv 2018, arXiv:1808.10854. [Google Scholar]
  11. Charfi, W.; Chaabane, M.; Mhiri, H.; Bournot, P. Performance evaluation of a solar photovoltaic system. Energy Rep. 2018, 4, 400–406. [Google Scholar] [CrossRef]
  12. Mamun, M.A.A.; Islam, M.M.; Hasanuzzaman, M.; Selvaraj, J. Effect of tilt angle on the performance and electrical parameters of a PV module: Comparative indoor and outdoor experimental investigation. Energy Built Environ. 2021, 3, 278–290. [Google Scholar] [CrossRef]
  13. Alnasser, T.M.; Mahdy, A.M.; Abass, K.I.; Chaichan, M.T.; Kazem, H.A. Impact of dust ingredient on photovoltaic performance: An experimental study. Sol. Energy 2020, 195, 651–659. [Google Scholar] [CrossRef]
  14. Kazem, H.A.; Chaichan, M.T.; Al-Waeli, A.H.; Sopian, K. A review of dust accumulation and cleaning methods for solar photovoltaic systems. J. Clean. Prod. 2020, 276, 123187. [Google Scholar] [CrossRef]
  15. Al-Waeli, A.H.; Sopian, K.; Kazem, H.A.; Chaichan, M.T. Photovoltaic solar thermal (PV/T) collectors past, present and future: A review. Int. J. Appl. Eng. Res. 2016, 11, 10757–10765. [Google Scholar]
  16. Esfe, M.H.; Kamyab, M.H.; Valadkhani, M. Application of nanofluids and fluids in photovoltaic thermal system: An updated review. Sol. Energy 2020, 199, 796–818. [Google Scholar] [CrossRef]
  17. Shrivastava, A.; Jose, J.P.A.; Borole, Y.D.; Saravanakumar, R.; Sharifpur, M.; Harasi, H.; Razak, R.A.; Afzal, A. A study on the effects of forced air-cooling enhancements on a 150 W solar photovoltaic thermal collector for green cities. Sustain. Energy Technol. Assess. 2022, 49, 101782. [Google Scholar] [CrossRef]
  18. Gomaa, M.R.; Ahmed, M.; Rezk, H. Temperature distribution modeling of PV and cooling water PV/T collectors through thin and thick cooling cross-fined channel box. Energy Rep. 2022, 8, 1144–1153. [Google Scholar] [CrossRef]
  19. Parsa, S.M.; Yazdani, A.; Aberoumand, H.; Farhadi, Y.; Ansari, A.; Aberoumand, S.; Karimi, N.; Afrand, M.; Cheraghian, G.; Ali, H.M. A critical analysis on the energy and exergy performance of photovoltaic/thermal (PV/T) system: The role of nanofluids stability and synthesizing method. Sustain. Energy Technol. Assess. 2022, 51, 101887. [Google Scholar]
  20. Kong, X.; Zhang, L.; Li, H.; Wang, Y.; Fan, M. Experimental thermal and electrical performance analysis of a concentrating photovoltaic/thermal system integrated with phase change material (PV/T-CPCM). Sol. Energy Mater. Sol. Cells 2022, 234, 111415. [Google Scholar] [CrossRef]
  21. Azimi, N.; Davoodbeygi, Y.; Rahimi, M.; Ahmadi, S.; Karami, E.; Roshani, M. Optimization of thermal and electrical efficiencies of a photovoltaic module using combined PCMs with a thermo-conductive filler. Sol. Energy 2022, 231, 283–296. [Google Scholar] [CrossRef]
  22. Sathyamurthy, R.; Kabeel, A.E.; Chamkha, A.; Karthick, A.; Manokar, A.M.; Sumithra, M.G. Experimental investigation on cooling the photovoltaic panel using hybrid nanofluids. Appl. Nanosci. 2021, 11, 363–374. [Google Scholar] [CrossRef]
  23. Al-Waeli, A.H.; Chaichan, M.T.; Kazem, H.A.; Sopian, K. Evaluation and analysis of nanofluid and surfactant impact on photovoltaic-thermal systems. Case Stud. Therm. Eng. 2019, 13, 100392. [Google Scholar] [CrossRef]
  24. Al-Waeli, A.H.; Chaichan, M.T.; Sopian, K.; Kazem, H.A. Influence of the base fluid on the thermo-physical properties of PV/T nanofluids with surfactant. Case Stud. Therm. Eng. 2019, 13, 100340. [Google Scholar] [CrossRef]
  25. Sangeetha, M.; Manigandan, S.; Chaichan, M.T.; Kumar, V. Progress of MWCNT, Al2O3, and CuO with water in enhancing the photovoltaic thermal system. Int. J. Energy Res. 2020, 44, 821–832. [Google Scholar] [CrossRef]
  26. Al-Ghezi, M.K.; Abass, K.I.; Salam, A.Q.; Jawad, R.S.; Kazem, H.A. The possibilities of using nano-CuO as coolants for PVT system: An experimental study. J. Phys. Conf. Ser. 2021, 1973, 012123. [Google Scholar] [CrossRef]
  27. Kazem, H.A.; Chaichan, M.T.; Al-Waeli, A.H.; Sopian, K. Investigation of a nanofluid-based photovoltaic thermal system using single-wall carbon nanotubes: An experimental study. Int. J. Energy Res. 2021, 45, 10285–10303. [Google Scholar] [CrossRef]
  28. Fu, Z.; Liang, X.; Li, Y.; Li, L.; Zhu, Q. Performance improvement of a PVT system using a multilayer structural heat exchanger with PCMs. Renew. Energy 2021, 169, 308–317. [Google Scholar] [CrossRef]
  29. Siddiqui, M.U.; Siddiqui, O.K.; Al-Sarkhi, A.; Arif, A.F.M.; Zubair, S.M. A novel heat exchanger design procedure for photovoltaic panel cooling application: An analytical and experimental evaluation. Appl. Energy 2019, 239, 41–56. [Google Scholar] [CrossRef]
  30. Yadav, S.; Panda, S.K.; Tiwari, G.N.; Al-Helal, I.M.; Alsadon, A.A.; Shady, M.R.; Tiwari, A. Semi-transparent photovoltaic thermal greenhouse system combined with earth air heat exchanger for hot climatic condition. J. Therm. Sci. Eng. Appl. 2022, 14, 081007. [Google Scholar]
  31. Kazem, H.A.; Al-Waeli, A.H.; Chaichan, M.T.; Al-Waeli, K.H.; Al-Aasam, A.B.; Sopian, K. Evaluation and comparison of different flow configurations PVT systems in Oman: A numerical and experimental investigation. Sol. Energy 2020, 208, 58–88. [Google Scholar] [CrossRef]
  32. Al-Ghezi, M.K.; Mahmoud, B.K.; Alnasser, T.; Chaichan, M.T. A comparative study of regression models and meteorological parameters to estimate the global solar radiation on a horizontal surface for Baghdad City, Iraq. Int. J. Renew. Energy Dev. 2022, 11, 71–81. [Google Scholar] [CrossRef]
  33. Chaichan, M.T.; Kazem, H.A. Generating Electricity Using Photovoltaic Solar Plants in Iraq; Springer: Berlin/Heidelberg, Germany, 2018; ISBN 978-3-319-75030-9. [Google Scholar] [CrossRef]
  34. Al-Waeli, A.H.; Kazem, H.A.; Sopian, K.; Chaichan, M.T. Techno-economical assessment of grid connected PV/T using nanoparticles and water as base-fluid systems in Malaysia. Int. J. Sustain. Energy 2018, 37, 558–575. [Google Scholar] [CrossRef]
  35. Kong, X.; Ohadi, M.M. November. Applications of micro and nano technologies in the oil and gas industry-an overview of the recent progress. In Proceedings of the Abu Dhabi International Petroleum Exhibition and Conference, OnePetro, Abu Dhabi, United Arab Emirates, 1 November 2010. [Google Scholar]
  36. Zhao, B.; Wang, Q.; Jin, L. Heat-resistant antiflaming and friction mechanisms in nano-Fe2O3-reinforced silicon rubber. Sci. Eng. Compos. Mater. 2013, 20, 331–335. [Google Scholar] [CrossRef]
  37. Nikolic, V.N.; Spasojevic, V.; Panjan, M.; Kopanja, L.; Mrakovic, A.; Tadic, M. Re-formation of metastable ε-Fe2O3 in post-annealing of Fe2O3/SiO2 nanostructure: Synthesis, computational particle shape analysis in micrographs and magnetic properties. Ceram. Int. 2017, 43, 7497–7507. [Google Scholar] [CrossRef]
  38. Nabhani, N.; Emami, M.; Moghadam, A.T. Application of nanotechnology and nanomaterials in oil and gas industry. In AIP Conference Proceedings 2011; American Institute of Physics: College Park, MD, USA, 2011; Volume 1415, pp. 128–131. [Google Scholar]
  39. Shirini, F.; Abedini, M. Application of nanocatalysts in multi-component reactions. J. Nanosci. Nanotechnol. 2013, 13, 4838–4860. [Google Scholar] [CrossRef]
  40. Al-Waeli, A.H.; Chaichan, M.T.; Kazem, H.A.; Sopian, K.; Ibrahim, A.; Mat, S.; Ruslan, M.H. Comparison study of indoor/outdoor experiments of a photovoltaic thermal PV/T system containing SiC nanofluid as a coolant. Energy 2018, 151, 33–44. [Google Scholar] [CrossRef]
  41. Choudhary, S.; Sachdeva, A.; Kumar, P. Investigation of the stability of MgO nanofluid and its effect on the thermal performance of flat plate solar collector. Renew. Energy 2020, 147, 1801–1814. [Google Scholar] [CrossRef]
  42. Al-Waeli, A.H.; Sopian, K.; Kazem, H.A.; Chaichan, M.T. Evaluation of the electrical performance of a photovoltaic thermal system using nano-enhanced paraffin and nanofluids. Case Stud. Therm. Eng. 2020, 21, 100678. [Google Scholar] [CrossRef]
  43. Chen, Z.; Shahsavar, A.; Al-Rashed, A.A.; Afrand, M. The impact of sonication and stirring durations on the thermal conductivity of alumina-liquid paraffin nanofluid: An experimental assessment. Powder Technol. 2020, 360, 1134–1142. [Google Scholar] [CrossRef]
  44. Mohtar, H.; Chesse, P.; Chalet, D. Describing uncertainties encountered during laboratory turbocharger compressor tests. Exp. Tech. 2012, 36, 53–61. [Google Scholar] [CrossRef]
  45. Madu, K.; Uyaelumuo, A.E. Water based photovoltaic thermal (PVT) collector with spiral flow absorber: An energy and exergy evaluation. Equat. J. Eng. 2018, 51–58. [Google Scholar]
  46. Zhang, X.; Zhao, X.; Smith, S.; Xu, J.; Yu, X. Review of R&D progress and practical application of the solar photovoltaic/thermal (PV/T) technologies. Renew. Sustain. Energy Rev. 2012, 16, 599–617. [Google Scholar]
  47. Radziemska, E. Performance analysis of a photovoltaic-thermal integrated system. Int. J. Photo-Energy 2009, 2009, 732093. [Google Scholar] [CrossRef] [Green Version]
  48. Islam, M.M.; Hasanuzzaman, M.; Rahim, N.A.; Pandey, A.K.; Rawa, M.; Kumar, L. Real time experimental performance investigation of a NePCM based photovoltaic thermal system: An energetic and exergetic approach. Renew. Energy 2021, 172, 71–87. [Google Scholar] [CrossRef]
  49. Shahsavar, A. Experimental evaluation of energy and exergy performance of a nanofluid-based photovoltaic/thermal system equipped with a sheet-and-sinusoidal serpentine tube collector. J. Clean. Prod. 2021, 287, 125064. [Google Scholar] [CrossRef]
  50. Rafeek, M.T.M.; Muthu, V.; Athikesavan, M.M.; Sathyamurthy, R.; Kabeel, A.E. Experimental investigation of an active inclined solar panel absorber solar still-energy and exergy analysis. Environ. Sci. Pollut. Res. 2022, 29, 14005–14018. [Google Scholar] [CrossRef]
  51. Al-Waeli, A.H.; Chaichan, M.T.; Kazem, H.A.; Sopian, K. Comparative study to use nano-(Al2O3, CuO, and SiC) with water to enhance photovoltaic thermal PV/T collectors. Energy Convers. Manag. 2017, 148, 963–973. [Google Scholar] [CrossRef]
  52. Kazemi, I.; Sefid, M.; Afrand, M. A novel comparative experimental study on rheological behavior of mono & hybrid nanofluids concerned graphene and silica nano-powders: Characterization, stability and viscosity measurements. Powder Technol. 2020, 366, 216–229. [Google Scholar]
  53. Karimipour, A.; Ghasemi, S.; Darvanjooghi, M.H.K.; Abdollahi, A. A new correlation for estimating the thermal conductivity and dynamic viscosity of CuO/liquid paraffin nanofluid using neural network method. Int. Commun. Heat Mass Transf. 2018, 92, 90–99. [Google Scholar] [CrossRef]
  54. Turgut, A.; Tavman, I.; Chirtoc, M.; Schuchmann, H.P.; Sauter, C.; Tavman, S. Thermal conductivity and viscosity measurements of water-based TiO2 nanofluids. Int. J. Thermophys. 2009, 30, 1213–1226. [Google Scholar] [CrossRef]
  55. Chen, H.; Ding, Y.; He, Y.; Tan, C. Rheological behavior of ethylene glycol based titania nanofluids. Chem. Phys. Lett. 2007, 444, 333–337. [Google Scholar] [CrossRef]
  56. Prasher, R.; Song, D.; Wang, J.; Phelan, P. Measurements of nanofluid viscosity and its implications for thermal applications. Appl. Phys. Lett. 2006, 89, 133108. [Google Scholar] [CrossRef]
  57. Nandan, G. Performance of solar photovoltaic panel using forced convection of water-based CuO nanofluid: An understanding. In IOP Conference Series: Materials Science and Engineering 2019; IOP Publishing: Bristol, UK, 2019; Volume 691, p. 012088. [Google Scholar]
  58. Teng, T.P.; Hung, Y.H. Estimation and experimental study of the density and specific heat for alumina nanofluid. J. Exp. Nanosci. 2014, 9, 707–718. [Google Scholar] [CrossRef]
  59. Shoghl, S.N.; Jamali, J.; Moraveji, M.K. Electrical conductivity, viscosity, and density of different nanofluids: An experimental study. Exp. Therm. Fluid Sci. 2016, 74, 339–346. [Google Scholar] [CrossRef]
  60. Mariano, A.; Pastoriza-Gallego, M.J.; Lugo, L.; Camacho, A.; Canzonieri, S.; Piñeiro, M.M. Thermal conductivity, rheological behavior and density of non-Newtonian ethylene glycol-based SnO2 nanofluids. Fluid Phase Equilibria 2013, 337, 119–124. [Google Scholar] [CrossRef]
  61. An, W.; Wu, J.; Zhu, T.; Zhu, Q. Experimental investigation of a concentrating PV/T collector with Cu9S5 nanofluid spectral splitting filter. Appl. Energy 2016, 184, 197–206. [Google Scholar] [CrossRef]
  62. Sardarabadi, M.; Passandideh-Fard, M.; Heris, S.Z. Experimental investigation of the effects of silica/water nanofluid on PV/T (photovoltaic thermal units). Energy 2014, 66, 264–272. [Google Scholar] [CrossRef]
  63. Al-Shamani, A.N.; Sopian, K.; Mat, S.; Hasan, H.A.; Abed, A.M.; Ruslan, M.H. Experimental studies of rectangular tube absorber photovoltaic thermal collector with various types of nanofluids under the tropical climate conditions. Energy Convers. Manag. 2016, 124, 528–542. [Google Scholar] [CrossRef]
  64. Khanjari, Y.; Pourfayaz, F.; Kasaeian, A.B. Numerical investigation on using of nanofluid in a water-cooled photovoltaic thermal system. Energy Convers. Manag. 2016, 122, 263–278. [Google Scholar] [CrossRef]
  65. Hjerrild, N.E.; Mesgari, S.; Crisostomo, F.; Scott, J.A.; Amal, R.; Taylor, R.A. Hybrid PV/T enhancement using selectively absorbing Ag–SiO2/carbon nanofluids. Sol. Energy Mater. Sol. Cells 2016, 147, 281–287. [Google Scholar] [CrossRef]
  66. Chen, T.; Qi, C.; Tang, J.; Wang, G.; Yan, Y. Numerical and experimental study on optimization of CPU system cooled by nanofluids. Case Stud. Therm. Eng. 2021, 24, 100848. [Google Scholar] [CrossRef]
  67. Aberoumand, S.; Woodfield, P.; Shabani, B.; Dao, D.V. Advances in electrode and electrolyte improvements in vanadium redox flow batteries with a focus on the nanofluidic electrolyte approach. Phys. Rep. 2020, 881, 1–49. [Google Scholar] [CrossRef]
  68. Jin, H.; Cheol, I.; Onoe, J. Characteristic stability of bare Au-water nanofluids fabricated by pulsed laser ablation in liquids. Opt. Laser Eng. 2009, 47, 532–538. [Google Scholar] [CrossRef]
  69. Zhu, D.; Li, X.; Wang, N.; Wang, X.; Gao, J.; Li, H. Dispersion behavior and thermal conductivity characteristics of Al2O3-H2O nanofluids. Curr. Appl. Phys. 2009, 9, 131–139. [Google Scholar] [CrossRef]
  70. Ding, Z.; Qi, C.; Wang, Y.; Tu, J.; Sun, L.; Wang, C. Preparation and photothermal conversion performance of carbon-silica nanocomposite films for spectrally selective solar absorbers. Sol. Energy Mater. Sol. Cells. 2021, 233, 111391. [Google Scholar] [CrossRef]
  71. Qi, C.; Li, C.; Li, K.; Han, D. Natural convection of nanofluids in solar energy collectors based on a two-phase lattice Boltzmann model. J. Therm. Anal. Calorim. 2021, 147, 2417–2438. [Google Scholar] [CrossRef]
  72. Huang, J.; Wang, X.; Long, Q.; Wen, X.; Zhou, Y.; Li, L. Influence of pH on the stability characteristics of nanofluids. In Proceedings of the 2009 Symposium Photonics Optoelectron, SOPO, Wuhan, China, 14–16 August 2009; pp. 2–4. [Google Scholar] [CrossRef]
  73. Li, X.; Zhu, D.; Wang, X. Evaluation on dispersion behavior of the aqueous copper nano-suspensions. J. Colloid Interface Sci. 2007, 310, 456–463. [Google Scholar] [CrossRef]
  74. Utomo, A.T.; Poth, H.; Robbins, P.T.; Pacek, A.W. Experimental and theoretical studies of thermal conductivity, viscosity and heat transfer coefficient of titania and alumina nanofluids. Int. J. Heat Mass Transf. 2012, 55, 7772–7781. [Google Scholar] [CrossRef]
  75. Cacua, K.; Ordoñez, F.; Zapata, C.; Herrera, B.; Pabón, E.; Buitrago-Sierra, R. Surfactant concentration and pH effects on the zeta potential values of alumina nanofluids to inspect stability. Colloids Surf. A Physicochem. Eng. Asp. 2019, 583, 123960. [Google Scholar] [CrossRef]
  76. Suganthi, K.S.; Rajan, K.S. Temperature induced changes in ZnO–water nanofluid: Zeta potential, size distribution and viscosity profiles. Int. J. Heat Mass Transf. 2012, 55, 7969–7980. [Google Scholar] [CrossRef]
  77. Shao, X.; Chen, Y.; Mo, S.; Cheng, Z.; Yin, T. Dispersion stability of TiO2-H2O nanofluids containing mixed nanotubes and nano-sheets. Energy Procedia 2015, 75, 2049–2054. [Google Scholar] [CrossRef] [Green Version]
  78. Choudhary, R.; Khurana, D.; Kumar, A.; Subudhi, S. Stability analysis of Al2O3/water nanofluids. J. Exp. Nanosci. 2017, 12, 140–151. [Google Scholar] [CrossRef] [Green Version]
  79. Chakraborty, S. An investigation on the long-term stability of TiO2 nanofluid. Mater. Today Proc. 2019, 11, 714–718. [Google Scholar] [CrossRef]
  80. Mahbubul, I.M.; Elcioglu, E.B.; Saidur, R.; Amalina, M.A. Optimization of ultrasonication period for better dispersion and stability of TiO2–water nanofluid. Ultrason. Sonochem. 2017, 37, 360–367. [Google Scholar] [CrossRef] [PubMed]
  81. Mahbubul, I.M.; Chong, T.H.; Khaleduzzaman, S.S.; Shahrul, I.M.; Saidur, R.; Long, B.D.; Amalina, M.A. Effect of ultrasonication duration on colloidal structure and viscosity of alumina–water nanofluid. Ind. Eng. Chem. Res. 2014, 53, 6677–6684. [Google Scholar] [CrossRef]
  82. Sadeghi, R.; Etemad, S.G.; Keshavarzi, E.; Haghshenasfard, M. Investigation of alumina nanofluid stability by UV–vis spectrum. Microfluid. Nanofluid. 2015, 18, 1023–1030. [Google Scholar] [CrossRef]
  83. Dubey, S.; Tiwari, G.N. Analysis of PV/T flat plate water collectors connected in series. Sol. Energy 2009, 83, 1485–1494. [Google Scholar] [CrossRef]
  84. Huang, B.J.; Lin, T.H.; Hung, W.C.; Sun, F.S. Performance evaluation of solar photovoltaic/thermal systems. Sol. Energy 2001, 70, 443–448. [Google Scholar] [CrossRef]
  85. Chow, T.T.; Ji, J.; He, W. Photovoltaic thermal collector system for domestic application. J. Sol. Energy Eng. 2007, 129, 205–209. [Google Scholar] [CrossRef]
  86. He, W.; Chow, T.T.; Ji, J.; Lu, J.P.; Pei, G.; Chan, L.S. Hybrid photovoltaic and thermal solar collector designed for natural circulation of water. Appl. Energy 2006, 83, 199–210. [Google Scholar] [CrossRef]
  87. Ji, J.; Lu, J.P.; Chow, T.T.; He, W.; Pei, G. A sensitivity study of a hybrid photovoltaic/thermal water-heating system with natural circulation. Appl. Energy 2007, 84, 222–237. [Google Scholar] [CrossRef]
  88. Gangadevi, R.; Vinayagam, B.K.; Senthilraja, S. Experimental investigations of hybrid PV/Spiral flow thermal collector system performance using Al2O3/water nanofluid. IOP Conf. Ser. Mater. Sci. Eng. 2017, 197, 012041. [Google Scholar] [CrossRef]
  89. Al-Waeli, A.H.; Kazem, H.A.; Chaichan, M.T.; Sopian, K. Experimental investigation of using nano-PCM/nanofluid on a photovoltaic thermal system (PVT): Technical and economic study. Therm. Sci. Eng. Prog. 2019, 11, 213–230. [Google Scholar] [CrossRef]
Figure 1. Schematic drawing of the PV/T system used in tests with a spiral heat exchanger.
Energies 15 03870 g001
Figure 2. The solar radiation and various temperatures measured during the test days.
Energies 15 03870 g002
Figure 3. The effect of mass fraction added on resulted nanofluid viscosity (A), and a comparison between recent study viscosity and others from literature (B).
Energies 15 03870 g003
Figure 4. The effect of mass fraction added on resulted nanofluid density (A), and a comparison between recent study density and others from literature (B).
Energies 15 03870 g004
Figure 5. The effect of mass fraction added on resulted nanofluid TC (A), and a comparison between recent study TC and others from literature (B).
Energies 15 03870 g005
Figure 6. The effect of mass fraction added on resulted nanofluid stability (A), and a comparison between recent study stability and others from literature (B).
Energies 15 03870 g006
Figure 7. Energy analysis for both monocrystalline (A) and polycrystalline (B) PV/T systems.
Energies 15 03870 g007
Figure 8. Exergy analysis for both monocrystalline (A) and polycrystalline (B) PV/T systems.
Energies 15 03870 g008
Table 1. The poly and monocrystalline modules specifications.
Module TypePolycrystalline Monocrystalline
Company nameA starNuru Tech Fzco
Peak power (Pmax)100 W100 W
Open circuit voltage (Voc)22.5 V22.6 V
Short circuit current (Isc)5.81 A5.76 A
Maximum power voltage (Vmp)18.0 V17.96 V
Maximum power current (Imp)5.56 A5.57 A
Power tolerance±3%±3%
Dimension (mm)1012 × 660 × 301010 × 660 × 34
Table 2. Average weather conditions per month for Baghdad city [33].
JanuaryFebruaryMarchAprilMayJuneJulyAugustSeptemberOctoberNovemberDecember
Max. Temp (°C)15.51721303741454340332517
Min. Temp. (°C)568142022252422.516105
Shinning hours (H)196200248256300355350360310285212200
Precipitation (mm)231922103000031323
Rainy days667531003478
Humidity (%)706054493221202227385668
Wind speed (m/s)111112221111
Table 3. Used material specifications.
Particleρp
(kg/m3)
kp
(W/m·°C)
Puritydp (nm)Color Source
Fe2O352403099.0%20–40Red nanopowderSky Spring Nanomaterials Inc. (Houston, TX, USA)
Base fluidρf (kg/m3)kf (W/m·°C)cpf (J/kg·°C)μf (nm)
De-ionized water
(DIW) (75%)
+
Ethaline glycol (25%)
1007.10.611747730.00997Steam Lap.
+
Merck KGaA, Darmstadt, Germany
Table 4. The measuring devices used and its uncertainty.
No.Measured ParameterMeasuring DeviseUncertainty (%)
1Voltage and currentMulti-meter0.9
2Coolants flow rateFlowmeter0.34
3ThermocouplesTemperature0.27
4IrradianceSolar radiation intensity meter0.98
5Nanoparticle mass fraction weightSensitive weight0.001
6Nanofluids densityDensity tester0.28
7ViscosityBrookfield Programmer Viscometer (Model: LVDV-III Ultra-programmable)0.3
8Thermal conductivity and capacityHot desk Tps 500 1.2
Table 5. Energy analysis equations.
No.ParameterEquationParametersRef.
(1)Thermal efficiency η t h = Q u I s × A c η t h :   thermal   efficiency   ( % ) ,   Q u :   heat   gain   ( W ) ,
I s :   solar   irradiance   ( W m 2 ) ,   A c :   collector   area   ( m 2 )
[45]
(2)Useful gained heat Q u = m ˙   C p ( T o T i ) Q u : heat   gain   ( W ) ,   m ˙ : mass   flow   rate   ( kg / s ) ,
T o : outlet   fluid   ( ) ,   T i : inlet   fluid   ( )
[45]
(3)Electrical power P m p = I m p × V m p P m p : maximum   power   output   ( W ) ,  
I m p : maximum   power   current   ( A ) ,
V m p : maximum   power   voltage   ( V )
[46]
(4)Electrical efficiency η e = P m p I s × A p a n e l η e : Electrical   efficiency   of   the   PV   ( % ) ,
P m p : maximum   power   output   ( W ) ,
I s : Solar   irradiance   ( W m 2 ) ,
A p a n e l : PV   area   ( m 2 )
[47]
(5)Total PV/T system efficiency η P V T = η t h + η P V η P V T : Photovoltaic   thermal   efficiency   ( % ) ,
η t h : Thermal   efficiency   ( % ) ,
η P V : Photovoltaic   efficiency   ( % )
[47]
(6)Primary energy saving efficiency E f = η P V T η P + η t h E f : Primary   energy saving   efficiency   ( % ) ,
η t h : Thermal   efficiency   ( % ) ,
η P V T : Photovoltaic   thermal   efficiency   ( % ) ,
η P : electric   power   generation   efficiency   ( % )
[46]
Table 6. Exergy analysis equations.
No.ParameterEquationParameterRef.
1The general exergy
balance
E x i n E x o = E x d E x i n : Exergy   input   ( W ) ,
E x o : Exergy   output   ( W ) ,
E x d : Exergy   destruction   ( W )
[48,49,50]
2The general exergy
balance
E x i n ( E x t h + E x p v ) = E x d E x i n :   Exergy   input   ( W ) ,
E x o :   Exergy   output   ( W ) ,
E x d : Exergy   destruction   ( W ) ,
E x t h : Thermal   exergy   ( W ) ,
E x p v : PV   exergy   ( W )
[48,49,50]
3The input exergy E x i n = A c N c I [ 1 4 3 ( T a T s + 1 3 ( T a T s ) 4 ) ] E x i n :   Exergy   input   ( W ) ,
A c : Cell   area   ( m 2 ) ,
N c : number   of   cells ,
I : solar   irradiance   ( W / m 2 ) ,
T a : Ambient   temperature   ( K ) ,
T s : Sun   temperature   ( K )
[48,49,50]
4The thermal exergy E x t h = Q u ( 1 T a + 273 T o + 273 ) E x t h : Thermal   exergy   ( W ) ,
Q u : heat   gain   ( W ) ,
T a : Ambient   temperature   ( K ) ,
T o : Outlet   temperature   ( K )
[48,49,50]
5The PV exergy E x P V = η c A c N c I E x p v :   PV   exergy   ( W ) ,
η c : Cell   efficiency   ( % ) ,
A c : Cell   area   ( m 2 ) ,
N c : number   of   cells ,
I : solar   irradiance ( W / m 2 )
[48,49,50]
6The photovoltaic thermal exergy E x P V T = E x T h + E x P V E x P V T :   PVT   exergy   ( W ) ,
E x t h :   Thermal   exergy   ( W ) ,
E x p v :   PV   exergy   ( W )
[48,49,50]
7The exergy destruction or irreversibility E x d = T a S g e n E x d :   PVT   exergy   ( W ) ,
T a : Ambient   temperature   ( K ) ,
S g e n : Rate   of   Entropy   generation
[48,49,50]
8The exergy efficiency η e x = 1 E x d E x i n E x d : Exergy   destruction   ( W ) ,
E x d : PVT   exergy   ( W ) ,
E x i n : Exergy   input   ( W )
[48,49,50]
Table 7. A comparison of energy analysis of recent study and others from literature.
Ref. No.Electrical EfficiencyThermal EfficiencyTotal EfficiencyCooling FluidCollector Design
[83]9.55059.5WaterFlat plate
[84]93847WaterCorrugated polycarbonate panel
[85]115162WaterAluminum-alloy flat-box
[86]--64.9WaterFlat-box absorber
[87]9.874049.87WaterFlat-box Al-alloy absorber plate
[88]134558Nano-Al2O3-WaterSpiral flow absorber
[25]17.254.872MWCNT-waterCopper sheet and tube
[63]9.954.2864.18Nano-SiC—waterDirect-flow configuration
[89]167086Nano-SiC—water +Nano-paraffinCopper tubes in heat storage tank
Current study (Monocrystalline)13.35972.3Nano-Fe2O3-water-EGSpiral flow absorber
Current study (Polycrystalline)13.756376.75Nano-Fe2O3-water-EGSpiral flow absorber
Publisher’s Note: MDPI stays neutral with regard to jurisdictional claims in published maps and institutional affiliations.