Article

Investigation of the Temperature Sensitivity of 20-Years Old Field-Aged Photovoltaic Panels Affected by Potential Induced Degradation

by
Oscar Kwame Segbefia
* and
Tor Oskar Sætre
Department of Engineering Sciences, University of Agder, 4879 Grimstad, Norway
*
Author to whom correspondence should be addressed.
Energies 2022, 15(11), 3865; https://doi.org/10.3390/en15113865
Submission received: 20 April 2022 / Revised: 11 May 2022 / Accepted: 14 May 2022 / Published: 24 May 2022
(This article belongs to the Topic Solar Thermal Energy and Photovoltaic Systems)

Abstract

:
One effect of moisture ingress on solar panels is potential induced degradation (PID). Solar panels affected by PID experience large leakage currents between the solar cells and the module’s frame, which leads to substantial power degradation. In the present work, the temperature coefficients of 3 old PV panels affected by PID were investigated. In the electroluminescence images, solar cells nearer to the edge of the modules appear darker due to ohmic shunting. IR thermal images acquired under clear sky outdoor conditions show that the majority of the warmer cells (hotspots) were located closer to the edge of the modules. The difference in cell temperature (∆T) due to PID effect ranges from 7 °C to 15 °C for the 3 field-aged modules. The average temperature coefficient of efficiency (βηm) was found to be −0.5%/°C. Also, it was observed that the temperature coefficients of open circuit voltage (βVoc = −0.4%/°C), maximum power point voltage (βVmpp = −0.5%/°C), and fill factor (βFF = −0.2%/°C), were the underlying factors for the degradation in the Pmax of the old solar panels affected by PID. This accounted for an average 1.2%/year overall degradation in the efficiency of these modules. Most notably, it was discovered that the PV modules affected by PID show negative temperature coefficients of maximum power point current (βJmpp) due to large leakage currents. This observed negative βJmpp we believe is characteristic of PV panels affected by PID.

1. Introduction

One of the underlying effects of moisture ingress on photovoltaic (PV) modules is potential induced degradation (PID) [1,2,3,4,5,6,7]. PID occurs when there is an increased material conductivity and leakage current between the PV module’s frame and the cells [8,9,10,11,12,13,14,15]. This has severe consequences for PV module power reliability and can constitute up to 100% of power loss in PV plants [16].
According to Naumann et al. [10], high surface defect density on interdigitated back contact (IBC) solar cells results in decreased field effect passivation. Decreased field effect passivation leads to high surface recombination, and hence, causes PID of polarization/passivation (PID-p) type. However, PID-p is temporary and reversible [10,17,18,19]. Investigations revealed that the transport of mobile ions, especially sodium (Na+) ions, within the PV module bulk is responsible for the PID of shunting (PID-s) type [2,15,20,21]. High conductivity of sodium decorated stacking faults across the solar cell emitter leads to shunting, hence, PID-s [2,20]. PID-s manifests itself in the degradation in the open circuit voltage, short circuit current, and fill factor [2,3]. Hence, PID-s type appears to be the key problem in the field [17].
There have been efforts to prevent PID at the cell and module manufacturing levels, installation, and during operation [2,5,22]. Current-voltage (I-V) characterization, electroluminescence (EL), and infrared (IR) thermography could be used to detect and monitor the onset of PID in PV plants under sunlight or in the dark with external bias conditions [2,21]. PID-s cells are identified as warmer cells in IR thermal images and darker cells in EL images [3,6,15]. According to Carolus et al. [14], Current-voltage (I-V) and external quantum efficiency (EQE) measurements could be used to differentiate PID-s from PID-p. Proposed methods for reversing the PID effect appears to be saddled with other limitations [8,22]. Indeed, the TS IEC 62804-1 standard exists to ensure PID reliability of commercial PV modules. However, the PID effect continues to be a challenge for the PV community [2,6,20,23,24].
In addition to power degradation, PID also induces mismatch losses due to non-uniform degradation [9,20,25,26]. Degraded cells that are affected by PID cause current reverse biasing, which leads to local overheating or joule heating [14,27]. This triggers hotspots, which influence the PV module operating temperature (Tm), hence, the temperature sensitivity [20,25,28]. According to Islam et al. [23], PID in polycrystalline solar panels can accelerate cell crack propagation and can lead to the degradation in the temperature coefficient of efficiency. In addition, Wang et al. [24] observed an increased temperature coefficient of maximum power (Pmax) in PV modules affected by PID. Extensive research on the influence of the temperature sensitivity on PV modules main electrical parameters is available in literature [25,26,28,29,30,31]. However, studies on the influence of PID on the temperature coefficients of PV modules are rare [20,25,26,28]. Moreover, only a few were done on field-aged PV modules [23,24]. Yet, we have not found any report on the influence of PID on the temperature coefficients of the maximum power point voltage (βVmpp) and current (βJmpp) of PV modules.
A procedure for detecting PID based on temperature coefficient profiling of PID affected field-aged multicrystalline silicon (mc-Si) PV modules is presented in this contribution. I-V characterization, EL, and IR thermal imaging were used for the investigation. It turned out that PV modules affected by PID could be detected by monitoring the temperature coefficient of maximum power point current (βJmpp). Section 2 presents the material and methods used for the investigation and the results and the insights from the investigation are presented in Section 3.

2. Materials and Methods

In the present work, field-aged NESTE NP100G12 multicrystalline silicon (mc-Si) PV modules affected by PID were investigated. The 3 solar panels (namely A, B, and C) were chosen from a batch of solar panels which were installed on a Renewable Energy Park in Dømmesmoen, Grimstad (58.3447° N, 8.5949° E), Norway in the year 2000. However, the PV modules on the Energy Park were decommissioned in 2011 and were kept securely for research purposes [32]. In an earlier report on the types of defects and faults modes of these old solar panels by the present authors, EL and IR thermal data of PV panel C was used to show that some of the old PV panels were affected by PID. The manufacture’s data sheet and the measured electrical data on the 3 old PV panels (namely A, B, and C) is summarized in Table 1.
The PV modules were made using anodized aluminum (Al-) frame, low iron tempered front glass, ethylene vinyl acetate (EVA) encapsulation, white multi-layered Tedlar®/Polyester/Tedlar® (TPT) backsheet, and 2 weatherproof plastic casing junction boxes (accommodating a bypass diode each). Each PV module consists of (12 × 2) series connected solar cells and 3 substrings, refer to Figure 1. The solar cells feature a full area screen-printed Al-grid rear surface with dimensions of 100 × 100 mm2 and a titania antireflective coating (ARC).

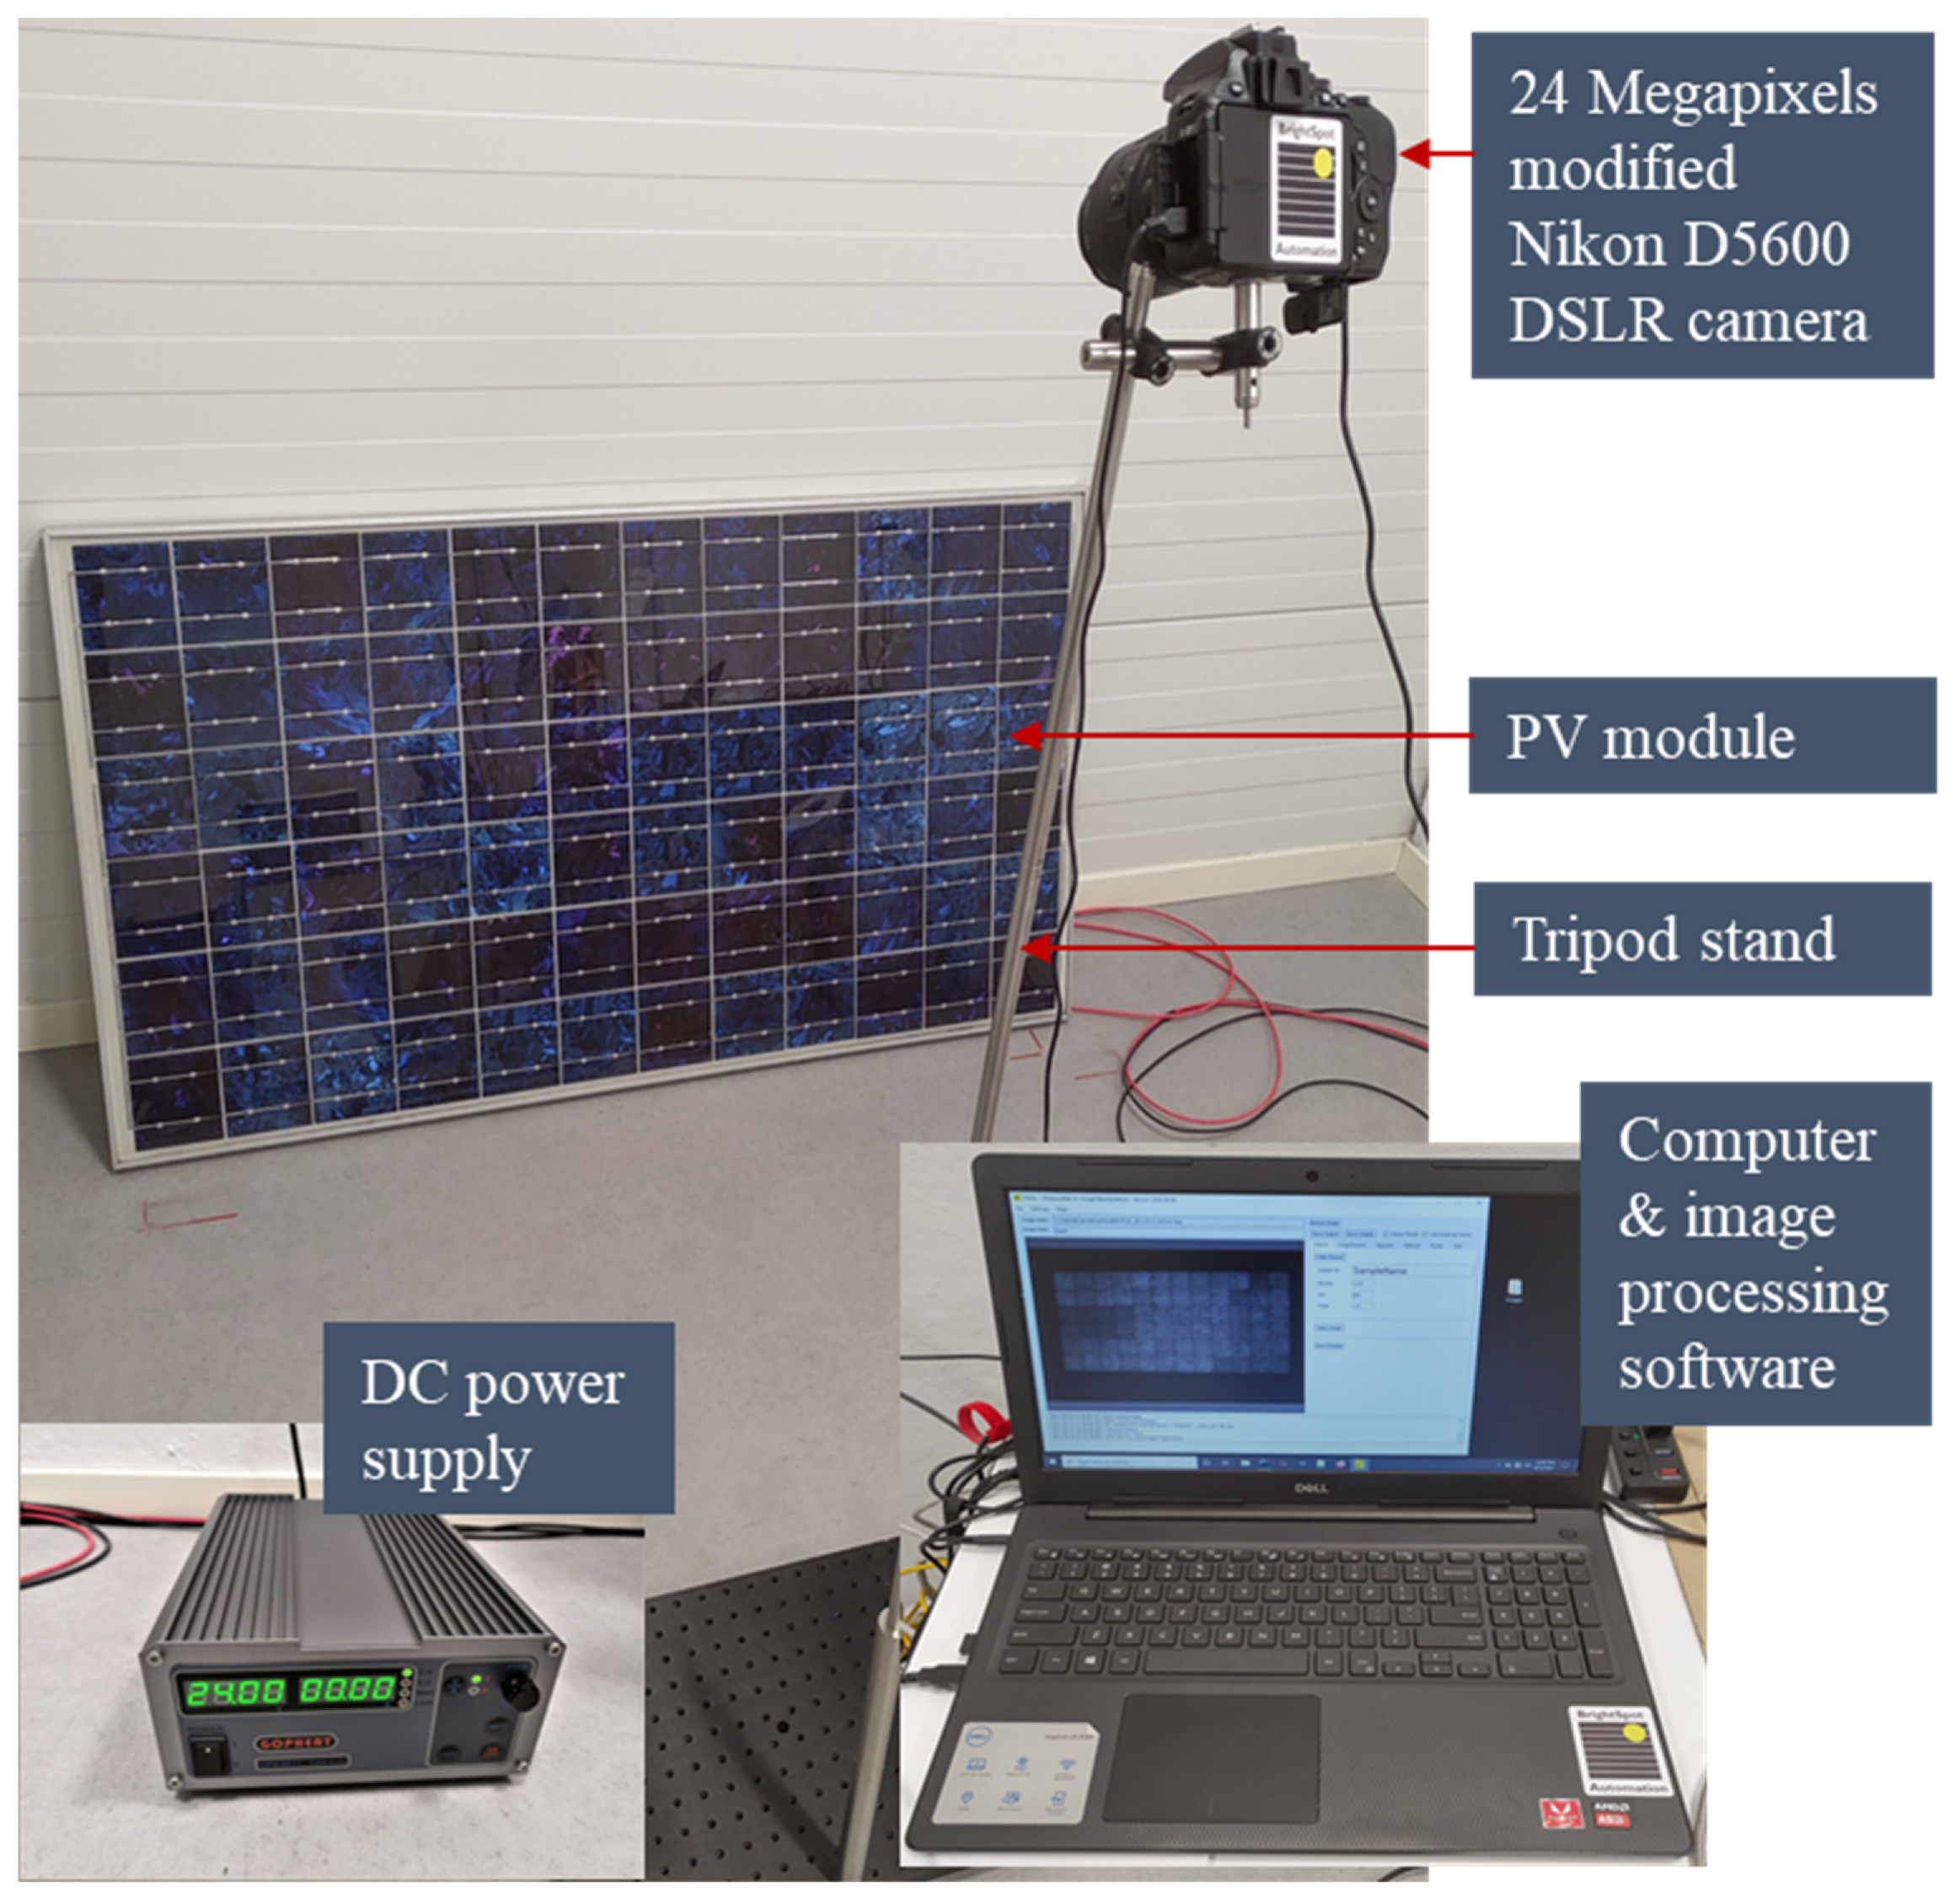
2.1. I-V Measurements

The sampled old solar panels were each taken through electrical performance measurements using an HT® Instruments I-V 500 w I-V Curve Tracer. This was done by following the IEC 60904-1 standard. By these measurements, information on the maximum power (Pmax), open circuit voltage (Voc), maximum power point voltage (Vmpp), short circuit current (Isc), maximum power point current (Impp), fill factor (FF), in-plane irradiance (GI), and module temperature characteristics of each panel at Standard Test Conditions (STC) was acquired. STC indicates solar cell temperature at 25 °C, GI at 1000 W/m2 and air mass 1.5 (AM1. 5) spectrum for commercial solar PV panels. The entire experimental procedure was carried out under clear sky in-plane irradiance conditions (960–1060 W/m2). The I-V tracer converted all measurements to STC automatically to minimize errors associated with data acquisition.

2.2. Temperature Coefficient Profiling

On a clear sky sunny day in the summer, the PV modules were taken out to the outdoor measuring rack in turns from a storeroom where the modules were kept. The PV module and the reference device were shaded using a cardboard. Measurement was initiated immediately after the shade was removed. The measurements on the 3 field-aged PV modules were done on the same day between 12.30 and 14.30 h and at wind speed less than 2 ms−1. According to IEC 60891-4 standard, the temperature range of the data values should be at least 30 °C. However, this seems challenging in practical field measurements, especially for the investigation site.
A graph of electrical parameters (Pmax, Voc, Isc, FF, ηm, Vmpp, Impp) versus PV module’s temperature (Tm) was plotted and a least-squares-fit graph through each data set was acquired to get the relative temperature coefficients. The regression equation for such relation can be represented as y = mx + c, where m and c are the slope (temperature coefficient) and the intercept (the value of the electrical parameter at 0 °C), respectively [33]. The relative temperature coefficient of parameter X (βx) in%/°C was calculated by dividing the slope of parameter X by the intercept of parameter X. That is, βx = m/c.

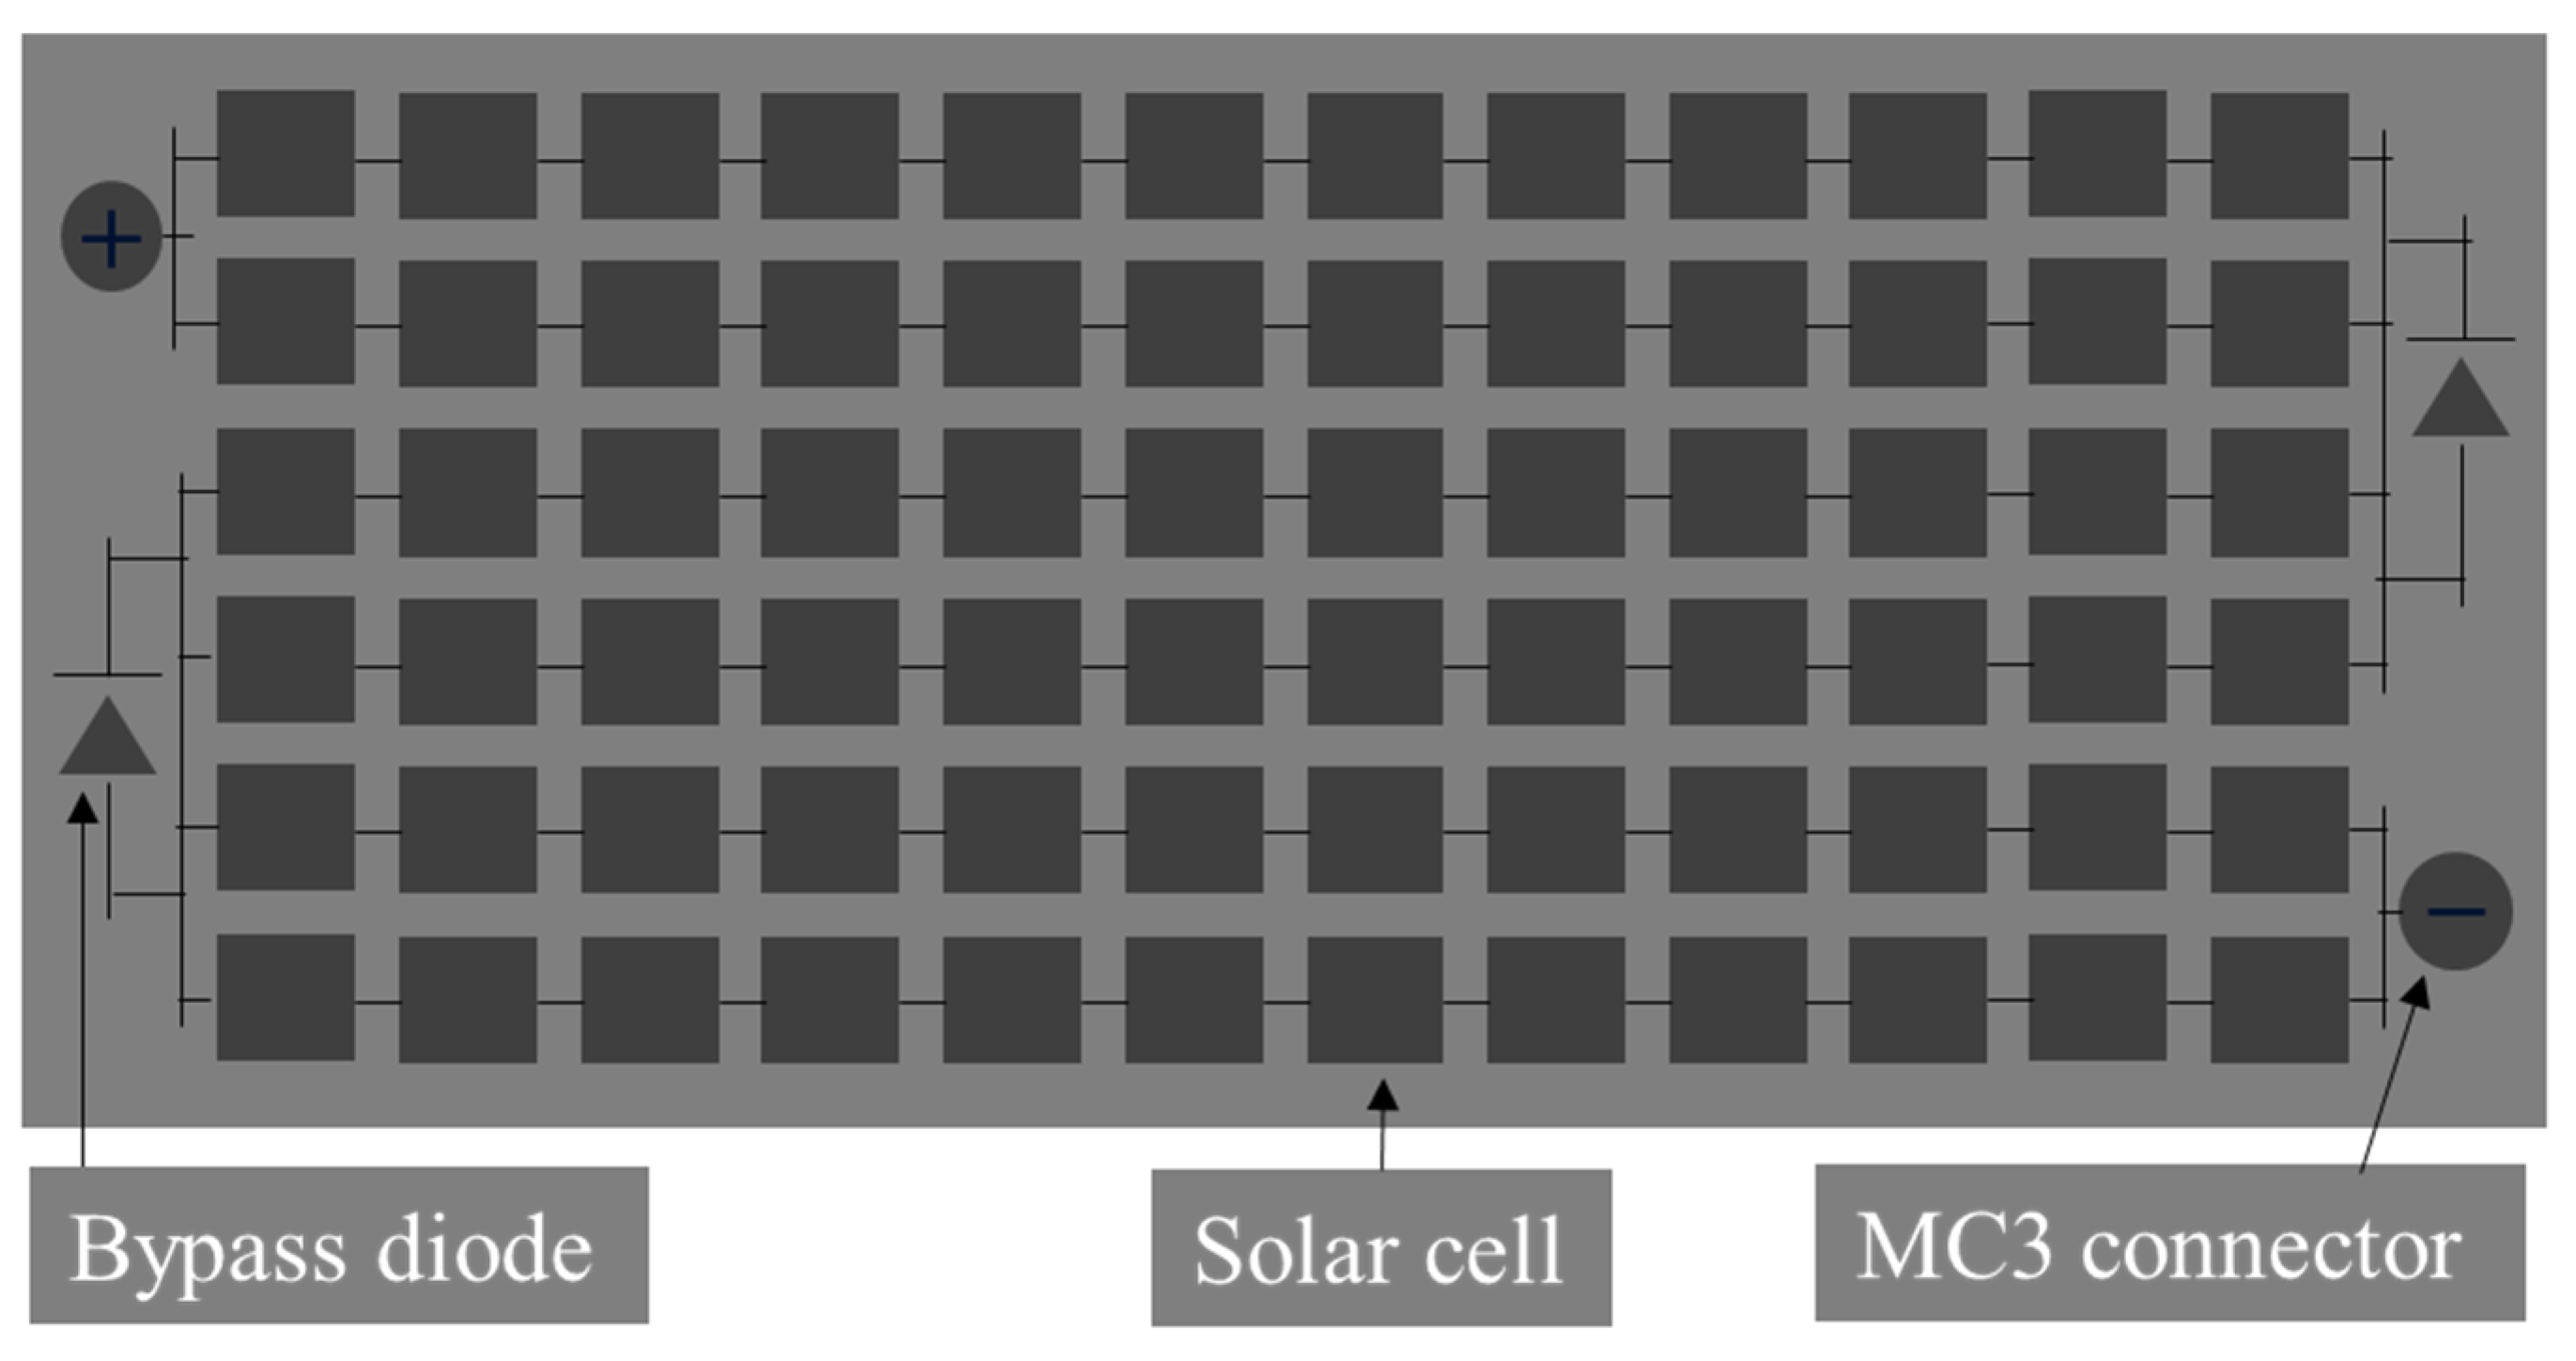
2.3. Electroluminescence (EL) Tomography

EL tomography is interesting especially for characterizing old PV panels affected by PID. The 3 sampled PV panels were taken through the EL characterization in a dark room using the BrightSpot EL Test Kit, see Figure 2. The kit comprises of a 24 megapixels modified DSLR (digital single-lens reflex) Nikon D5600 camera, DC power supply set, and computer with data acquisition and image processing software. The image acquisition and processing were done according to the IEC 60904-13 standard and the IEA procedure [3,15]. The EL characterization of the PV modules was done under 0.1Isc and at Isc current density conditions.

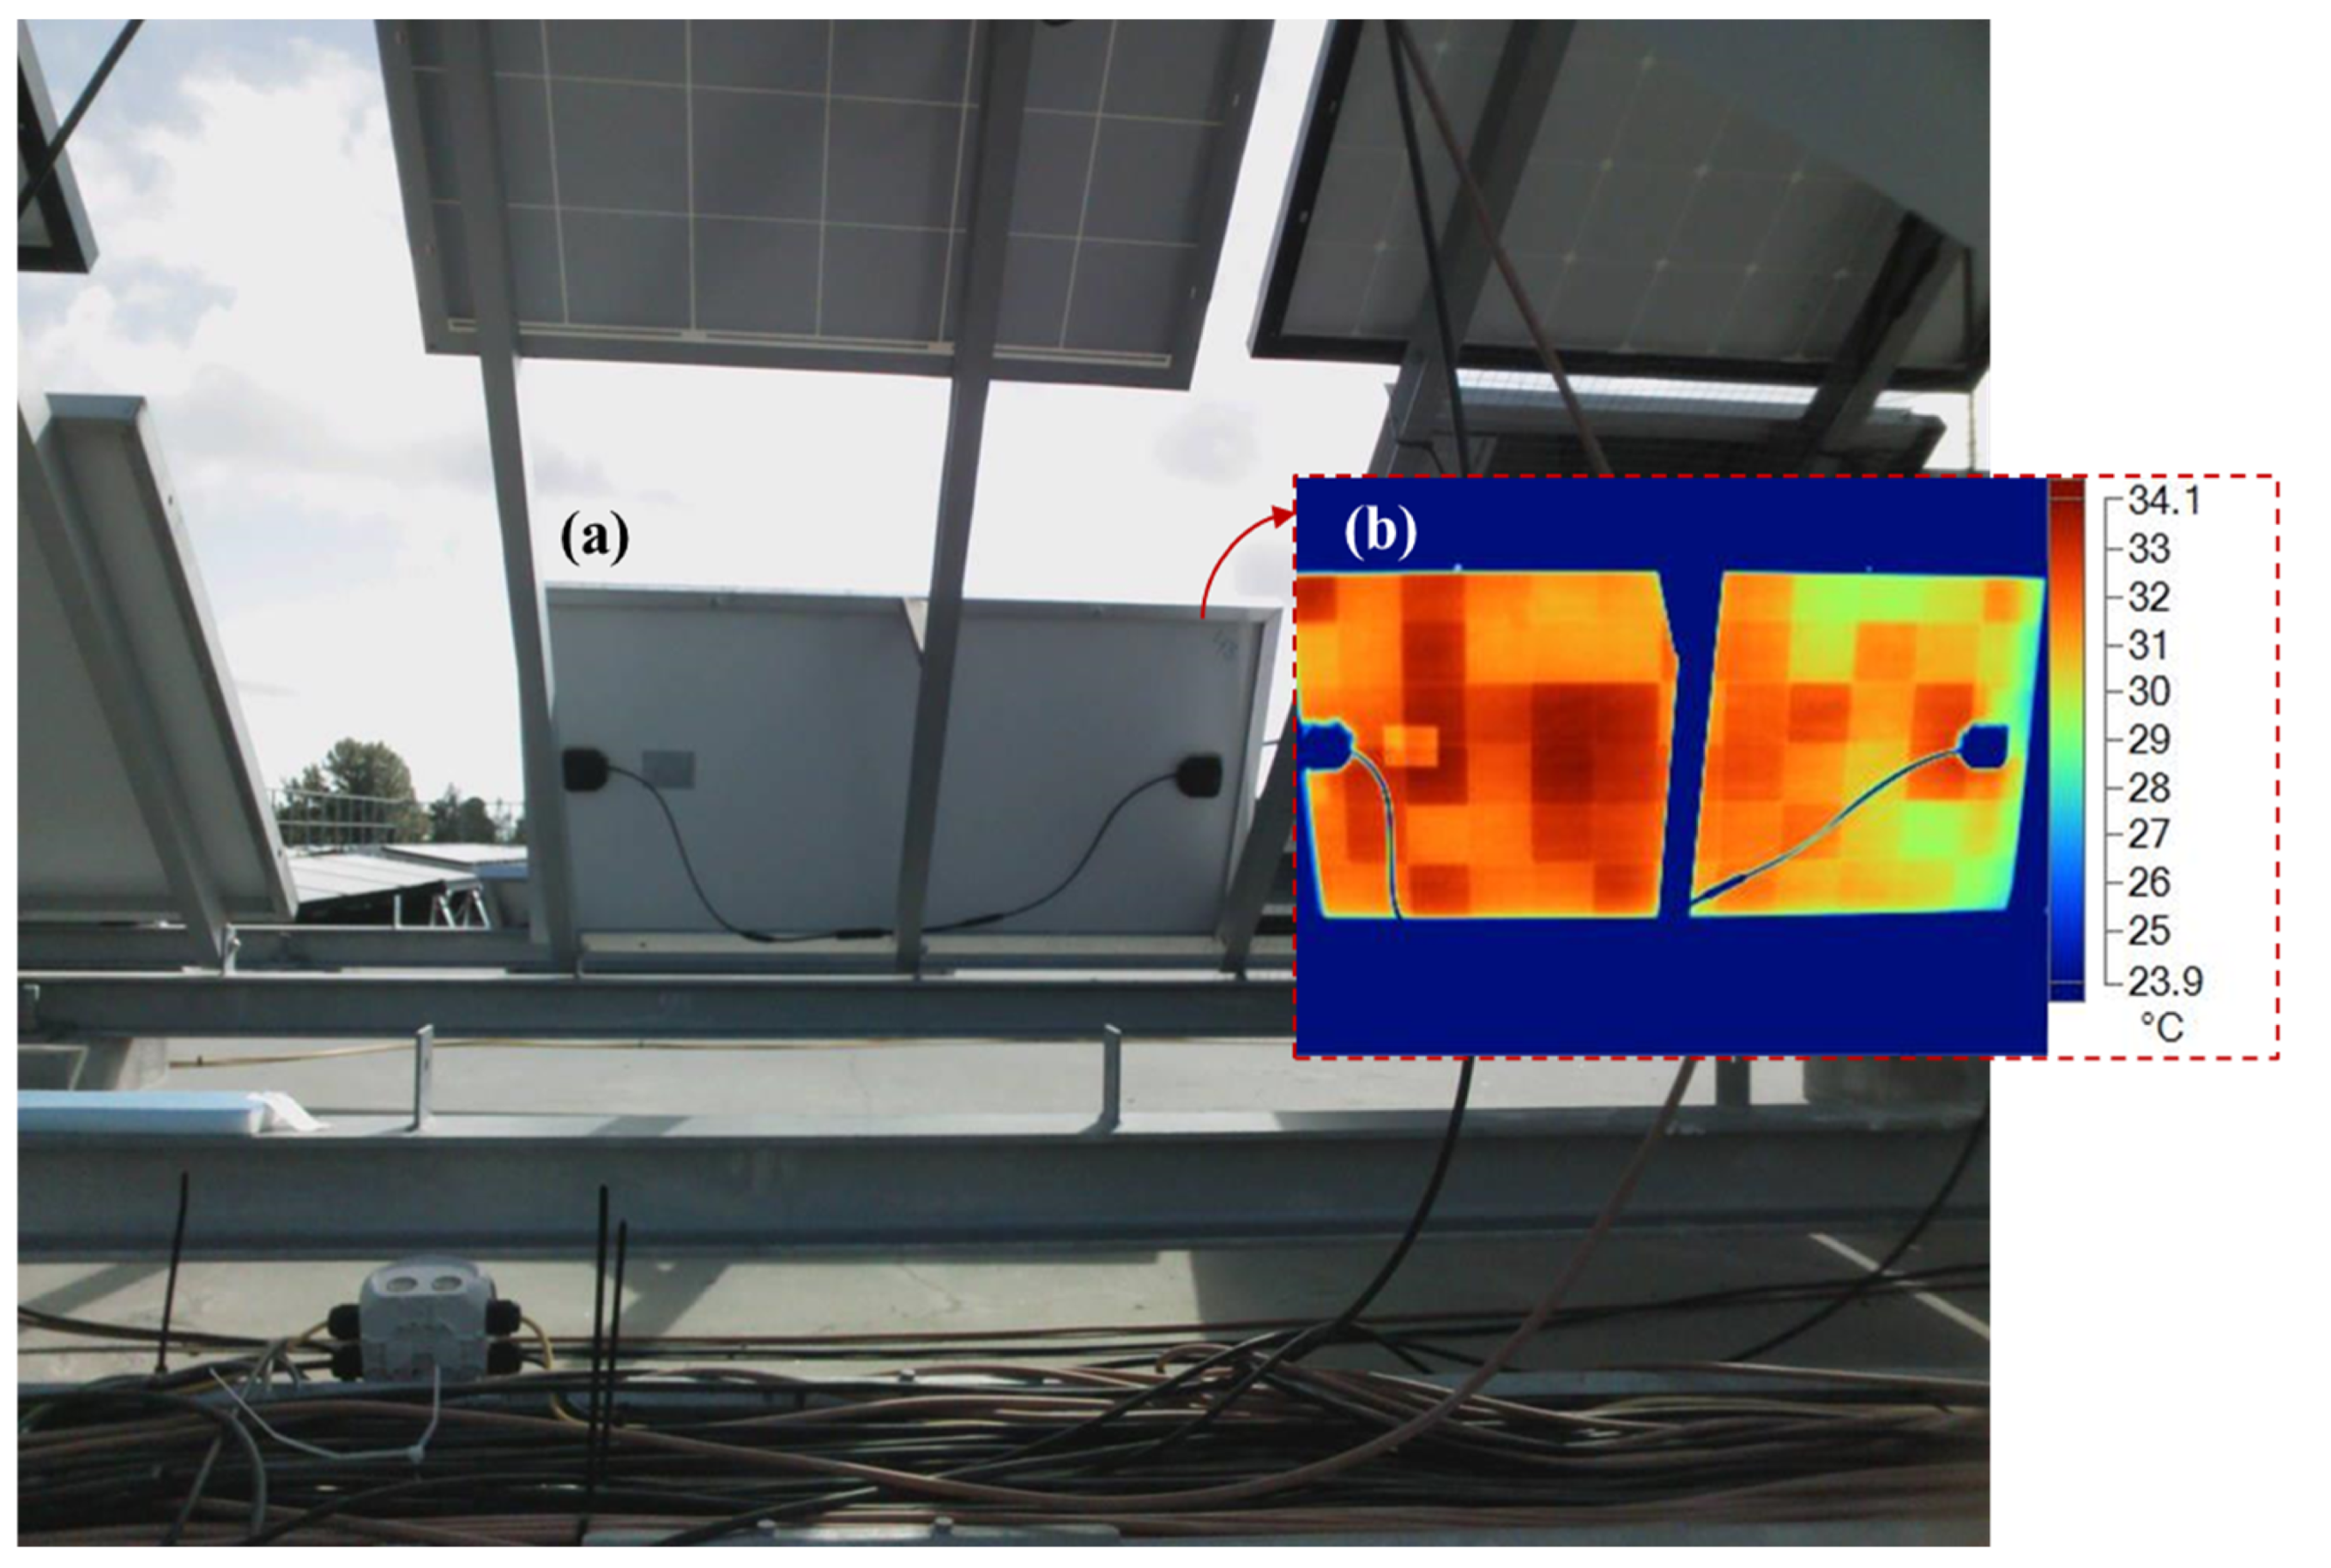
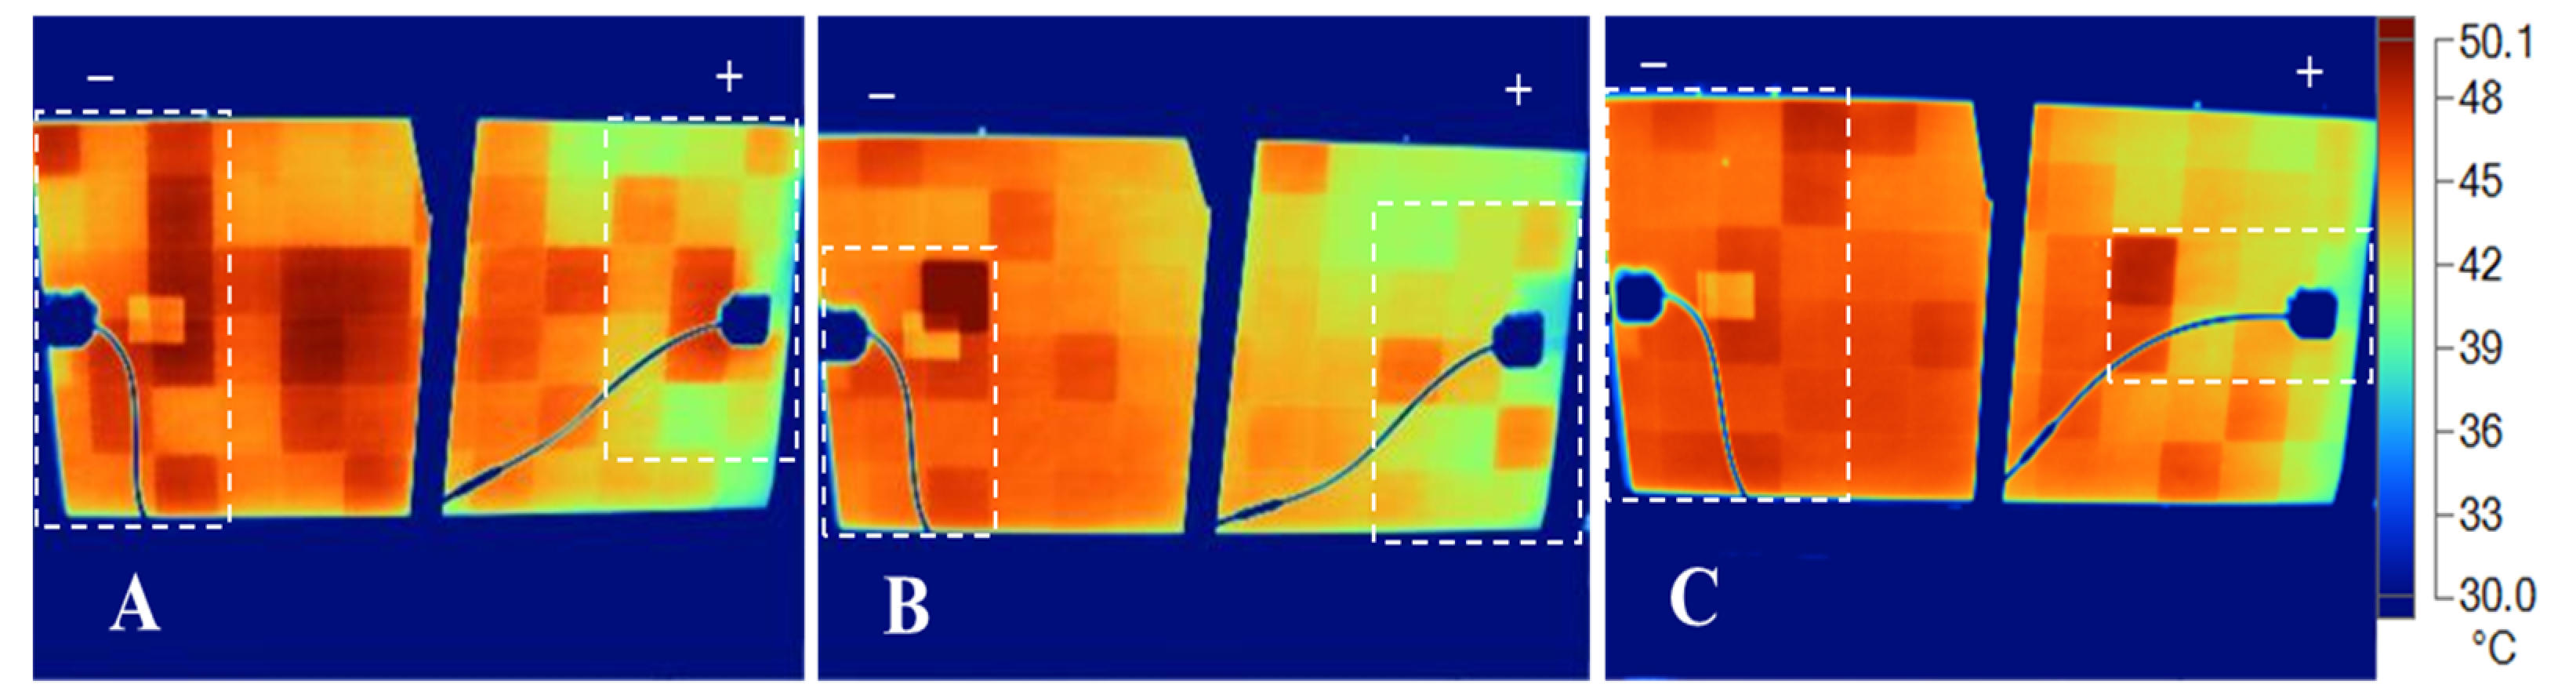
2.4. Infrared (IR) Thermal Imaging

The sampled solar panels were also taken through IR thermography using the Fluke Ti400 Infrared Camera (λ ≈ 650 nm) as per the IEA recommended procedure [15] and the IEC 62446-3 standard. Figure 3 shows the outdoor experimental setup. Measurements were done under clear sky field conditions. The IR thermal images were acquired after soaking the PV modules in the sun for at least 15 min, as prescribed by the IEC 62446-3 standard.

3. Results and Discussion

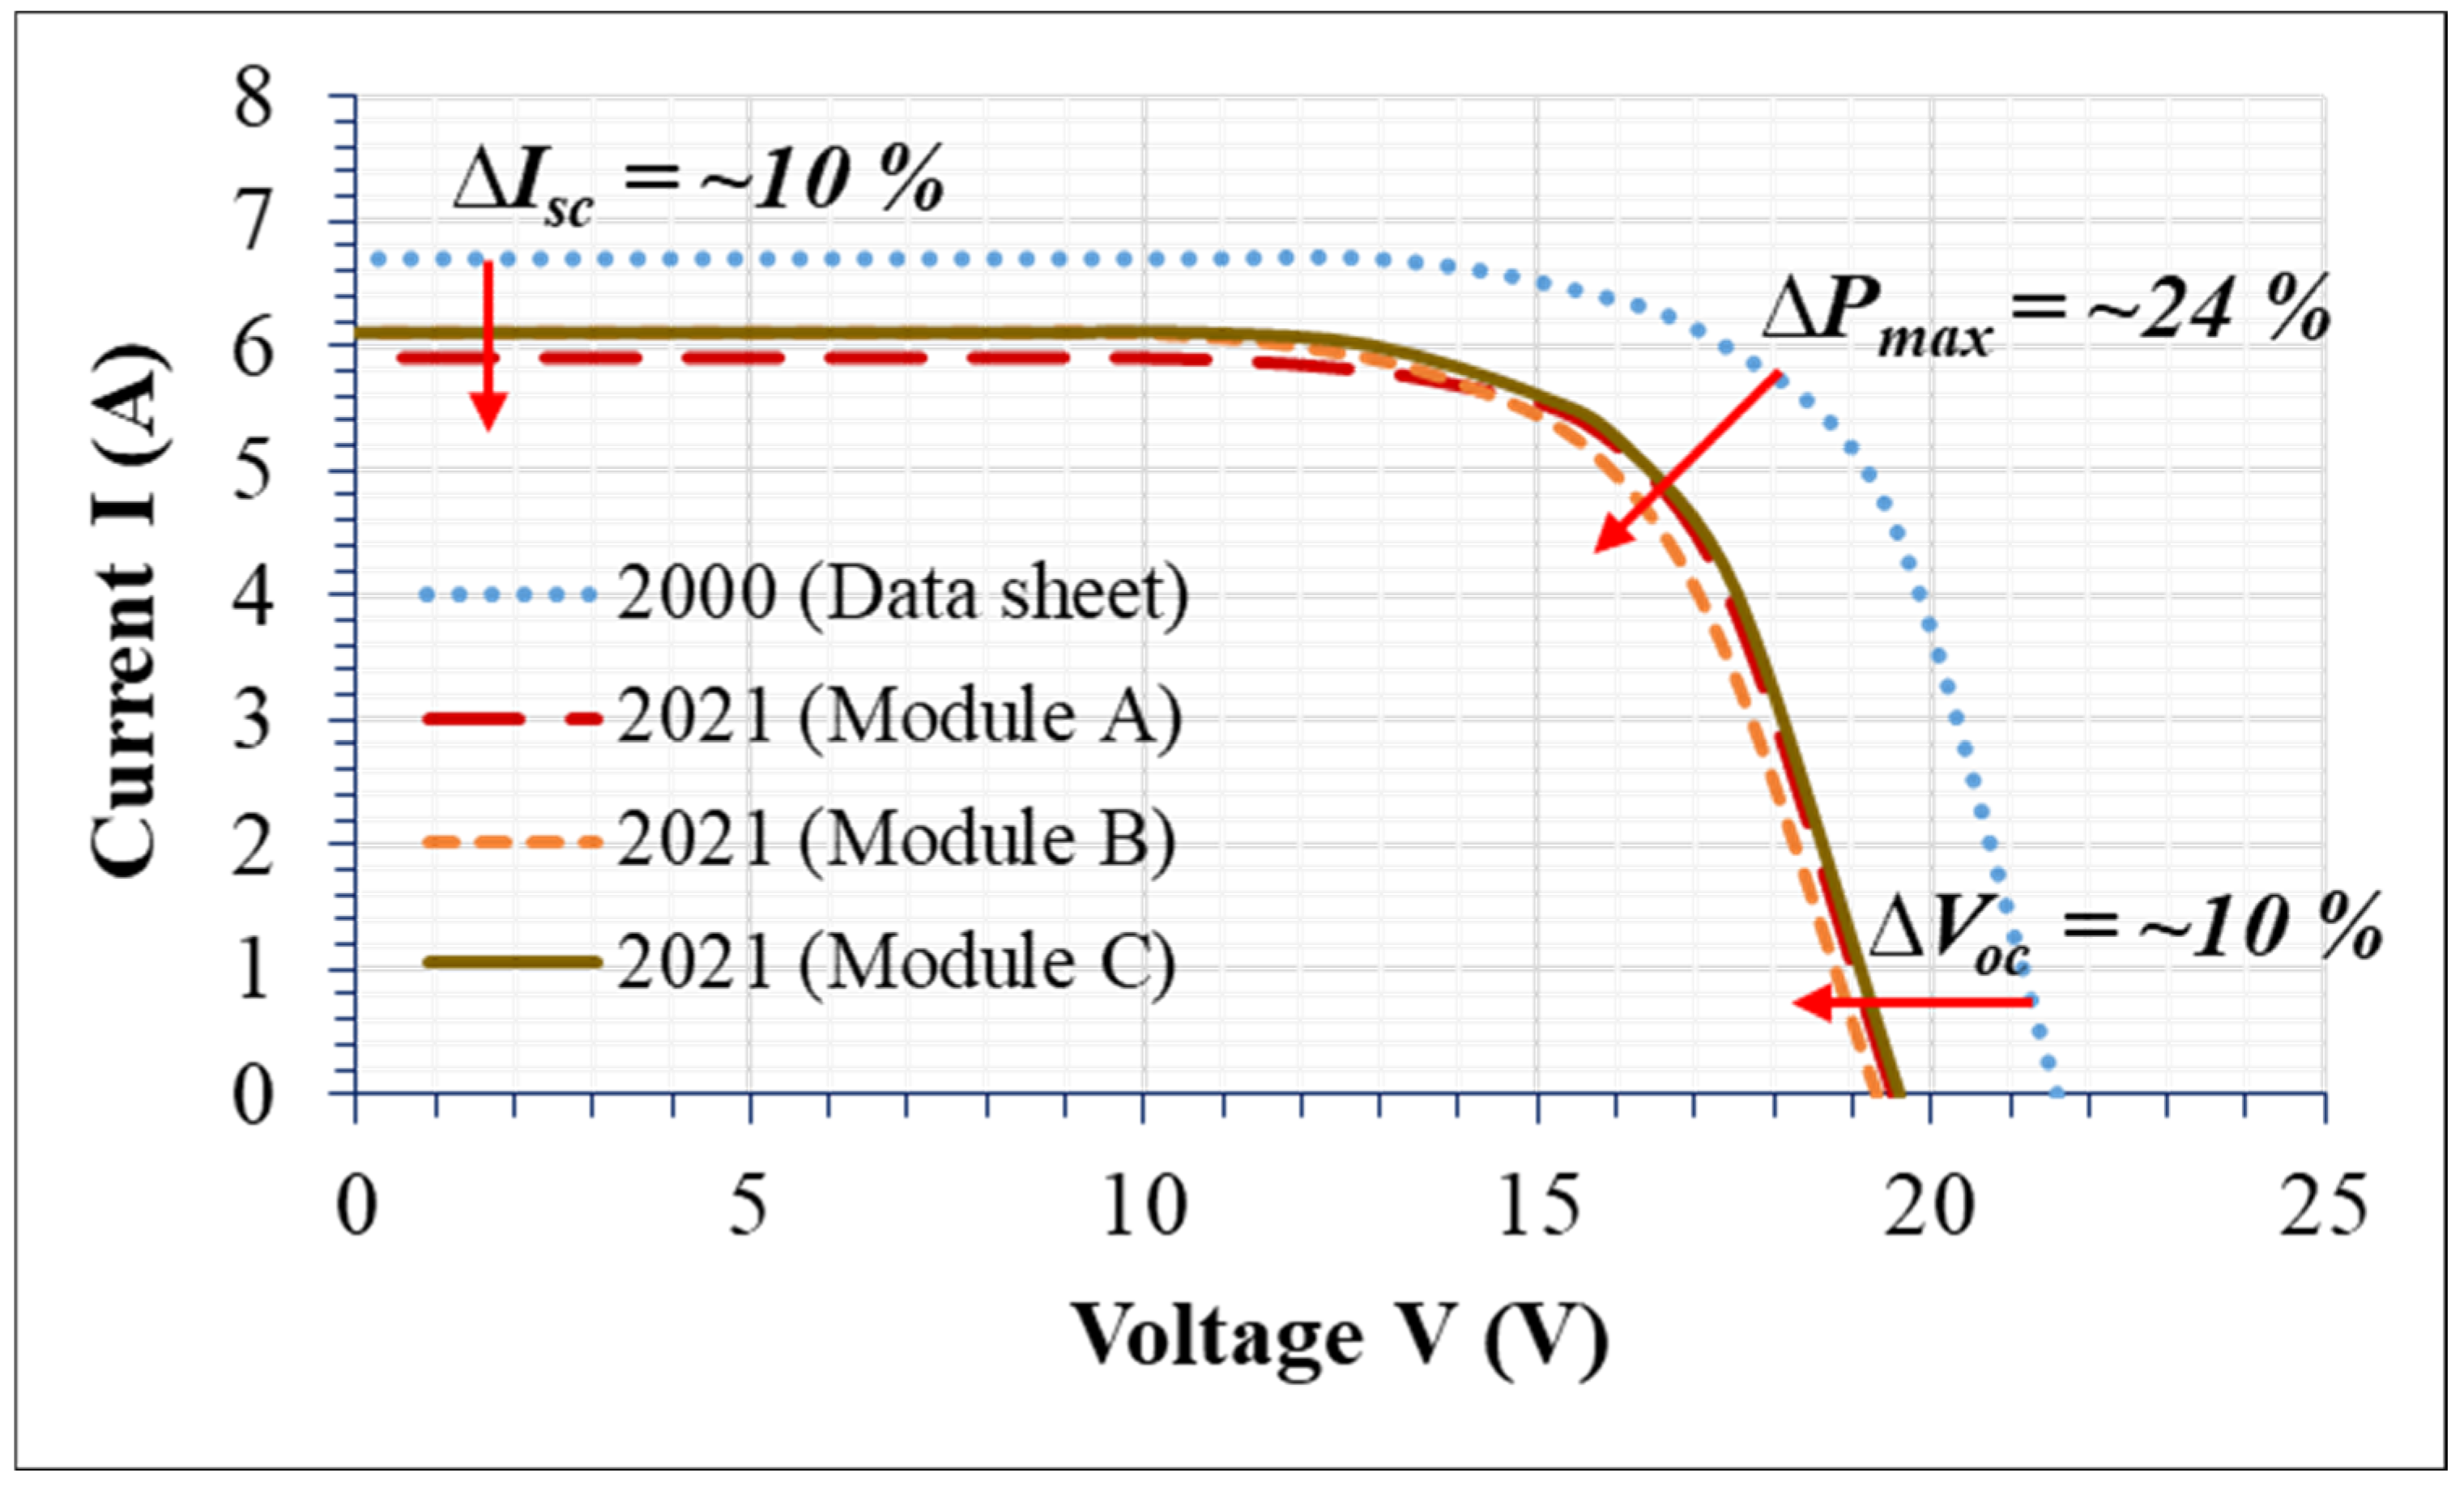
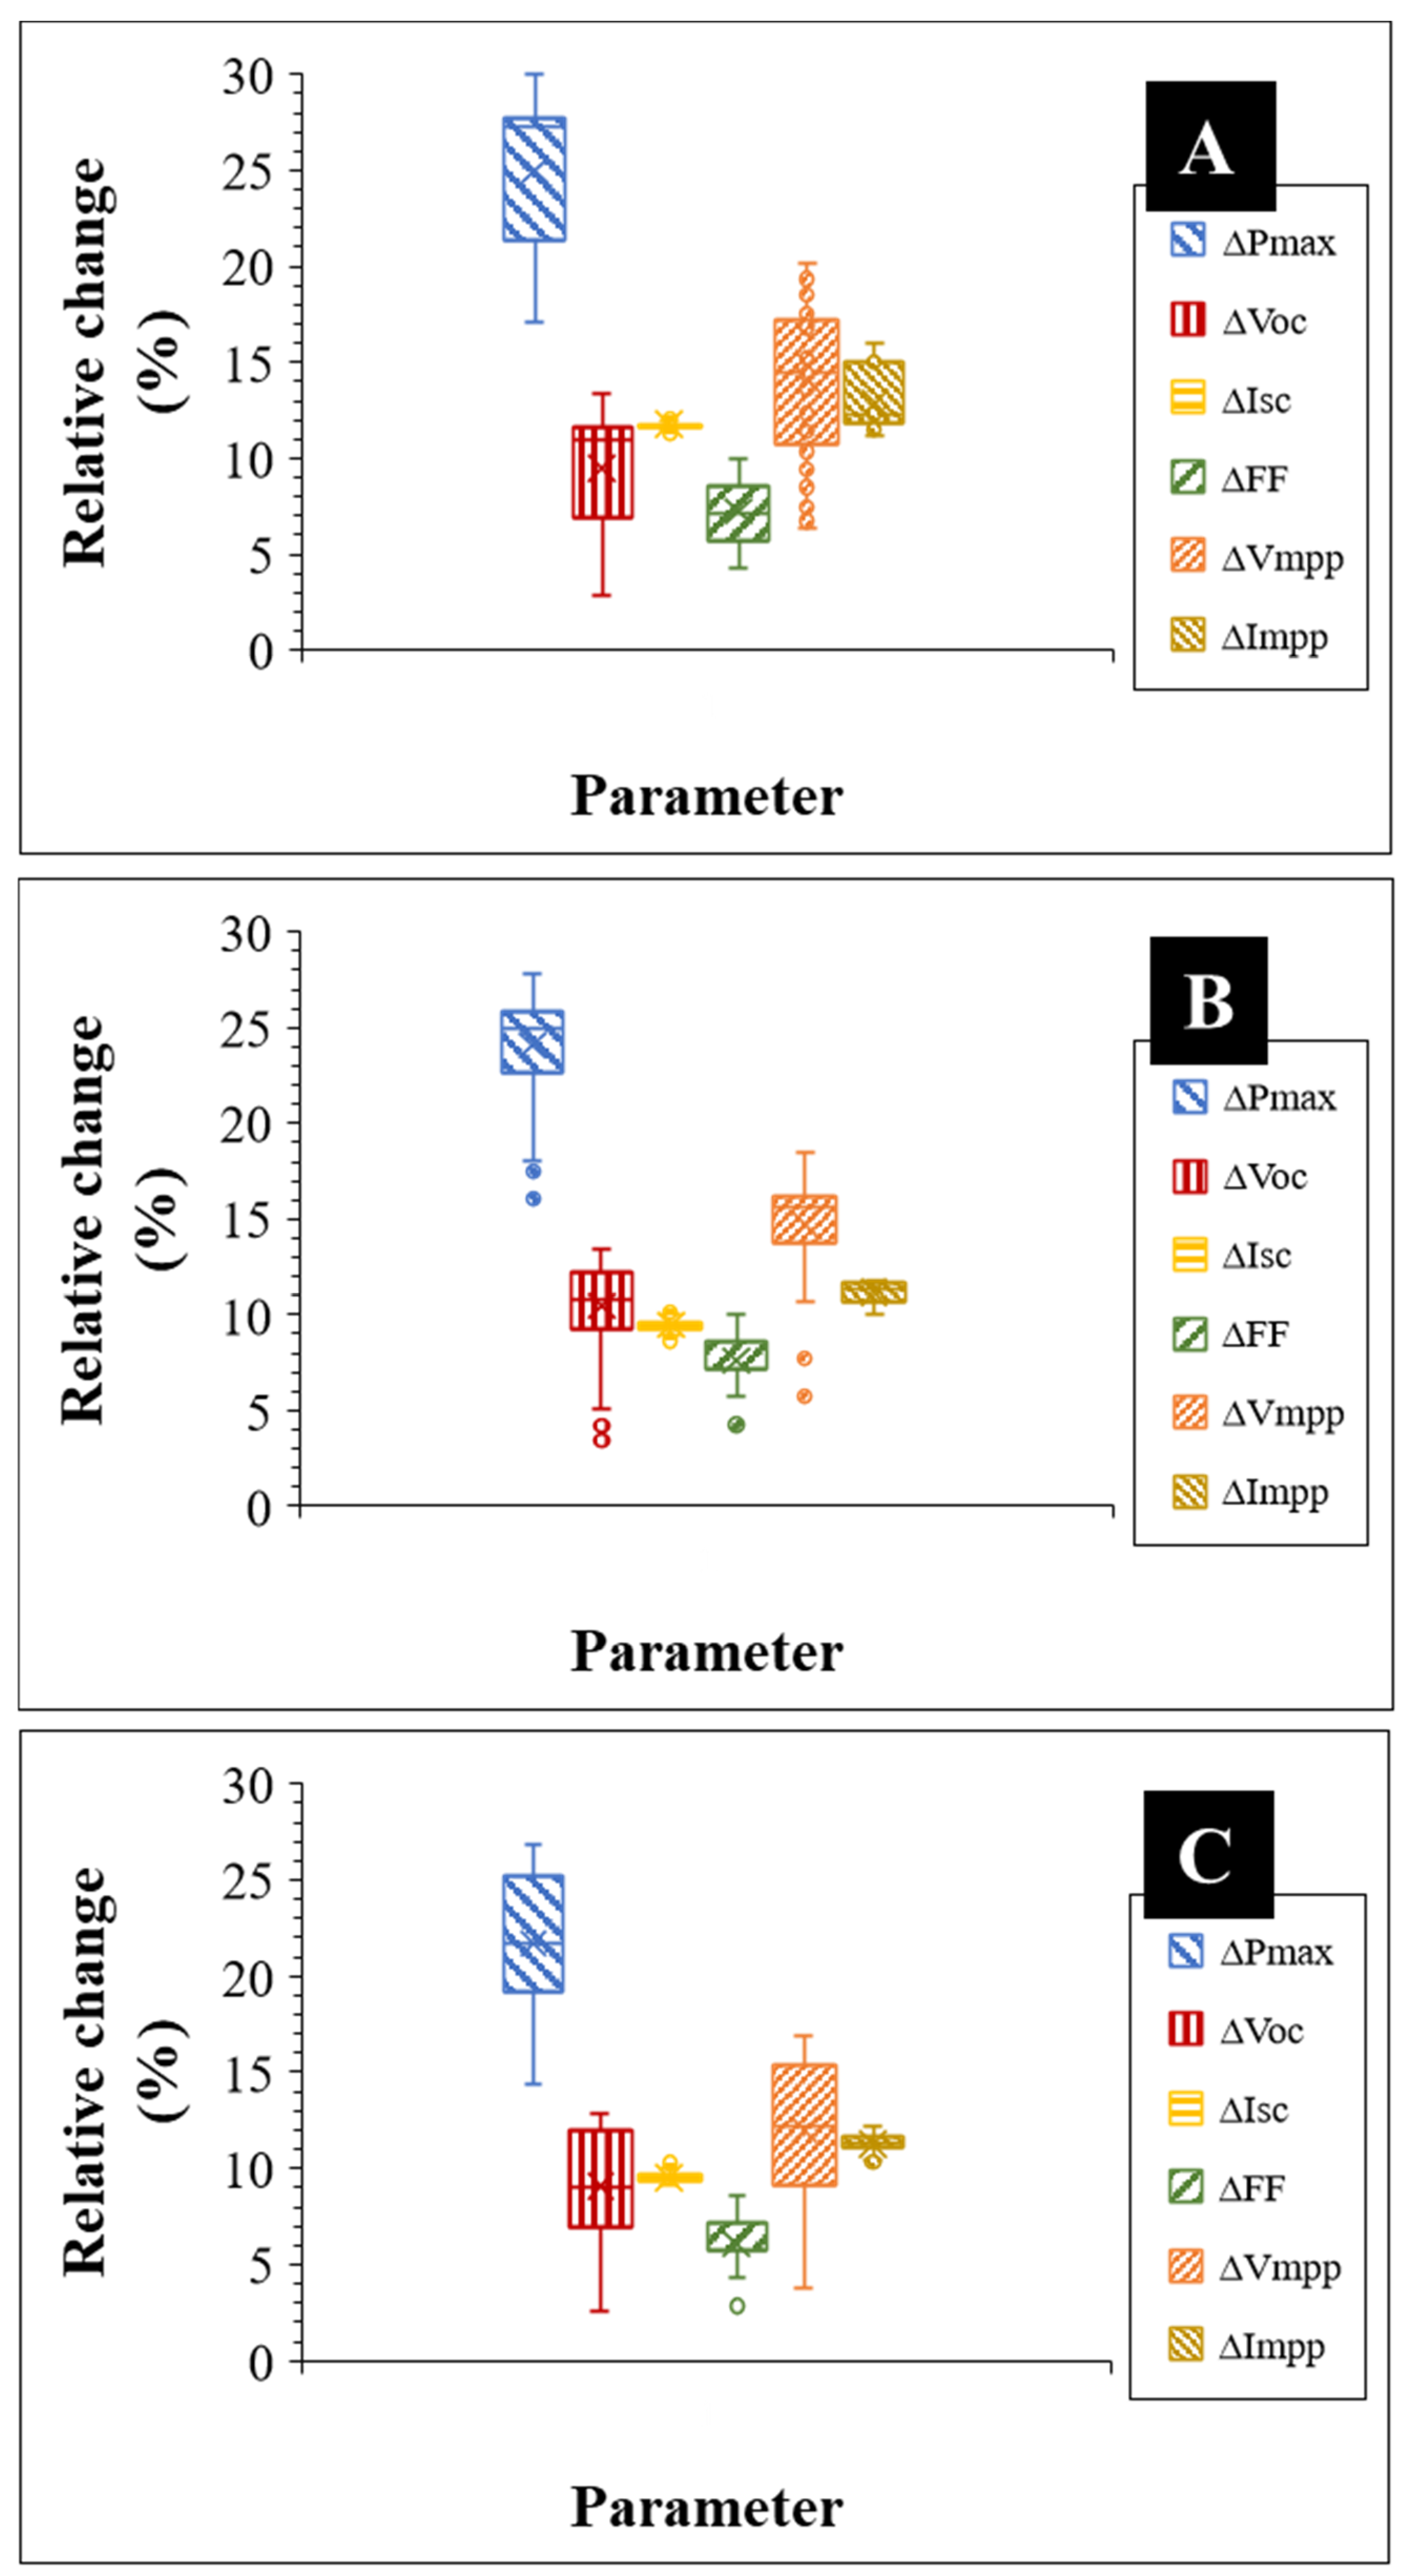
3.1. I-V Characteristics of the PV Panels

Figure 4 illustrates the I-V characteristics of the field-aged PV Modules A, B, and C. The I-V curve for the manufacturer’s data sheet in 2000 illustrates the I-V characteristics of the panels when they were new, i.e., when they were not affected by PID. However, in 2021, when the solar panels were affected by PID, the 3 panels show similar degradation trend in electrical characteristics. There was ca. 10% degradation in both Isc and Voc and ca. 24% degradation in Pmax over the 20 years. That is, annual degradation of ca. 0.5% in Isc and Voc and ca. 1.2% in Pmax, which agrees with observation elsewhere [34]. This resulted in the decrease in fill factor (F) of ca. 0.3%/year and a drop in efficiency of ca. 1.2%/year, see Table 1. A drop in the Pmax, Isc, Voc, and FF was also observed by other researchers [3,14,15,29].
It was reported that the effect of PID is more severe under lower irradiation conditions as compared to STC [3,16]. This means that PV modules deployed in the cold regions are more susceptible to the PID effect than those deployed in climates with high regular irradiance conditions. Low irradiance and shading conditions predispose PV modules to mismatch losses, hence, hotspots [33]. These hotspots can induce the onset of PID [16,20,35]. For the 3 field-aged PV modules, the average degradation in the Vmpp and Impp were 0.7% and 0.6% per year, respectively (refer to Table 1). Figure 5 illustrates the relative change (∆) in the electrical parameters of the old solar panels affected by PID over the 20 years. The relative change (∆) in the electrical parameters of the PID affected old solar panels was computed as the difference between the datasheet values (2000) and the values measured in the year 2021, a recommended procedure by Köntges et al. [17].
The position of the box indicates the percentage degradation, and the dots show the outliers. The degree of deviation of the electrical parameter from the mean value is indicated by the length of the box. The degradation in the electrical parameters of the 3 old solar panels follow a similar trend. Pmax shows more than 20% degradation over the 20 years, refer to Table 1. It appears from Figure 5 that the underlying cause of the Pmax degradation is the degradation in all electrical parameters, especially degradation in Voc and Vmpp. Yet, it is blurry as to the degree of contribution from each electrical parameter to the overall degradation in Pmax.
It is known that Pmax is directly related to the maximum power point voltage (Vmpp) and the maximum power point current (Impp) by the following relation:
P m a x = V mpp · I mpp
However, fill factor (FF) of a PV module could also be written as
FF = V mpp · I mpp V oc · I sc
So, the maximum power output of a PV panel is related to the fill factor as
P m a x = V oc · I sc · FF
The PV module efficiency (ηm) is related to the Pmax, module’s area (Am), and the input power (Pin) as
η m = P m a x A m · P i n
That means, any drop or degradation in Voc, Isc, FF, Vmpp, and Impp affects the Pmax or ηm of the PV module directly, refer to Figure 4. Since the Pin for ηm calculations is assumed as 1 kWm−2, Pmaxηm/Am. Am is the product of the solar cell’s area and the number of solar cells in the module. From Table 2, the regression plots (which indicates the degree of correlation) for Pmax versus Voc and Vmpp gave R2 > 97. On the other hand, the R2 < 0.6 for Isc and Impp. Resistance losses due to PID is the reason for the higher R2 values for the fill factor (FF) of the modules, especially for solar panels A and C. The I-V curves of the modules in Figure 4 support this observation. Solar panel C appears to be the least affected by PID, hence, shows the weakest R2 in both ∆Isc and ∆Impp, refer to Table 2. This is because PID alters the current flow characteristics of the PV module [5,8,13]. When PID is caused by negative bias, it can induce optical degradation [5]. This is why most of these old solar panels were found to be affected by optical degradation as well.
Degradation in Pmax, Voc, Vmpp, and FF due to PID was also reported by other authors [3,14,16,29]. They believed that the loss in Pmax due to PID could be up to 100% in severe cases [16]. The I-V characteristics of the old solar panels suggest that they are suffering from PID, as reported in other investigations [2,3,5,8,13,14,16,20,21,24,35].

3.2. Electroluminescence Characteristics

Figure 6 shows the EL analyses of the solar panels. The EL images were acquired under Isc (Figure 6a–c) and 0.1Isc (Figure 6d–f) forward bias conditions, respectively. The red marked out areas on the images in Figure 6 show some of the areas affected by PID in each PV module. In Figure 6a–c, apart from some darker spots, these images give little or no information on the areas affected by PID. This is because EL under Isc conditions highlights metal contact or shunt issues [3,15]. In fact, contact issues such as cracks and corrosion are highlighted as darker spots in Figure 6a–c. Hence, EL under Isc conditions are less suitable for detecting PID in PV modules, as observed in other studies [3,13,15].
On the other hand, under 0.1Isc conditions, the effect of PID in the field-aged PV modules are well highlighted, see Figure 6d–f. The effect of PID manifests itself in the degradation of the solar cells located closer to the perimeter of the solar panel [8,22]. This accelerated degradation of the cells nearer to the frame of the PV module is due to high leakage currents associated with the PID effect [2,7,24]. Degraded solar cells appear as darker cells in the EL analyses due to strong ohmic shunting of the cell with the panel’s Al-frame [24,27].
The PID affected areas in the solar panels are marked out in red. The trend in Figure 6 is that majority of the darker cells are located close to the edge of the old solar panels. The degradation pattern in Figure 6 suggests that these PV modules are affected by PID, as reported by other authors [3,9,14,15,35].

3.3. IR Thermal Image Characteristics

In IR thermal images, solar cells affected by PID appear as warmer cells or hotspots [16,36]. Figure 7 shows the IR thermograms of the 3 old solar panels (A, B, and C). In Figure 7, the areas marked out in white corresponds to the areas marked out in Figure 6. They show some of the areas in the PV modules that have been affected by PID. Figure 7 shows that majority of the warmer cells are located nearer to the perimeter of the old solar panels, as observed elsewhere [3,15,20,35].
It could be seen that the locations of the warmer cells in the IR thermal images (Figure 7) correspond with the locations of the darker cells in the EL images, refer to Figure 6. Another observation from Figure 7 is that the cells which are closer to the negative terminal (left) of the field-aged PV modules are warmer than the cells which are located nearer to the positive terminal (right), especially those cells that are closer to the Al- frame. This was also reported by other researchers [9,15,35]. This is due to the direction of current flow in a PV module under illumination. Under in-plane radiation, current move by diffusion from the negative to the positive terminal. In PID affected areas, there is high resistance to current flow culminating into high module temperature localized to these areas [20,26,28], as observed in Figure 7.
This is opposite to the direction of current flow when the IR thermal imaging is done under forward bias (drift) conditions, as it is done in EL imaging. This also explains why the defective solar cells are clearly seen at the areas closer to the negative terminal in the field-aged PV modules. Also, high negative leakage current accelerates PID degradation [5,9,20,24,35]. Table 3 shows the extracted solar cells’ temperatures of the old solar panels from the IR thermograms. The difference in the solar cells’ temperature (∆T) extracted from the IR thermograms of each solar panel was calculated according to Equation (4):
Δ T = T cH T cL ,
where TcH is the solar cell with the highest temperature and TcL is the solar cell with the lowest temperature. ∆T due to PID for the 3 modules which have been affected by PID ranges from 7 °C to 15 °C. Our results for these old panels agrees with the ∆T values reported in literature [15]. The reported ∆T values for solar panels affected by PID is in the range of ca. 7.5–30 °C depending on the severity of the PID effect [3,15,16].
The severity of the PID effect depends on the module materials- antireflection coating and encapsulation [6,21], module configuration [3,11], climatic conditions such as temperature and humidity [4,24,26], and voltage stress [5,9].

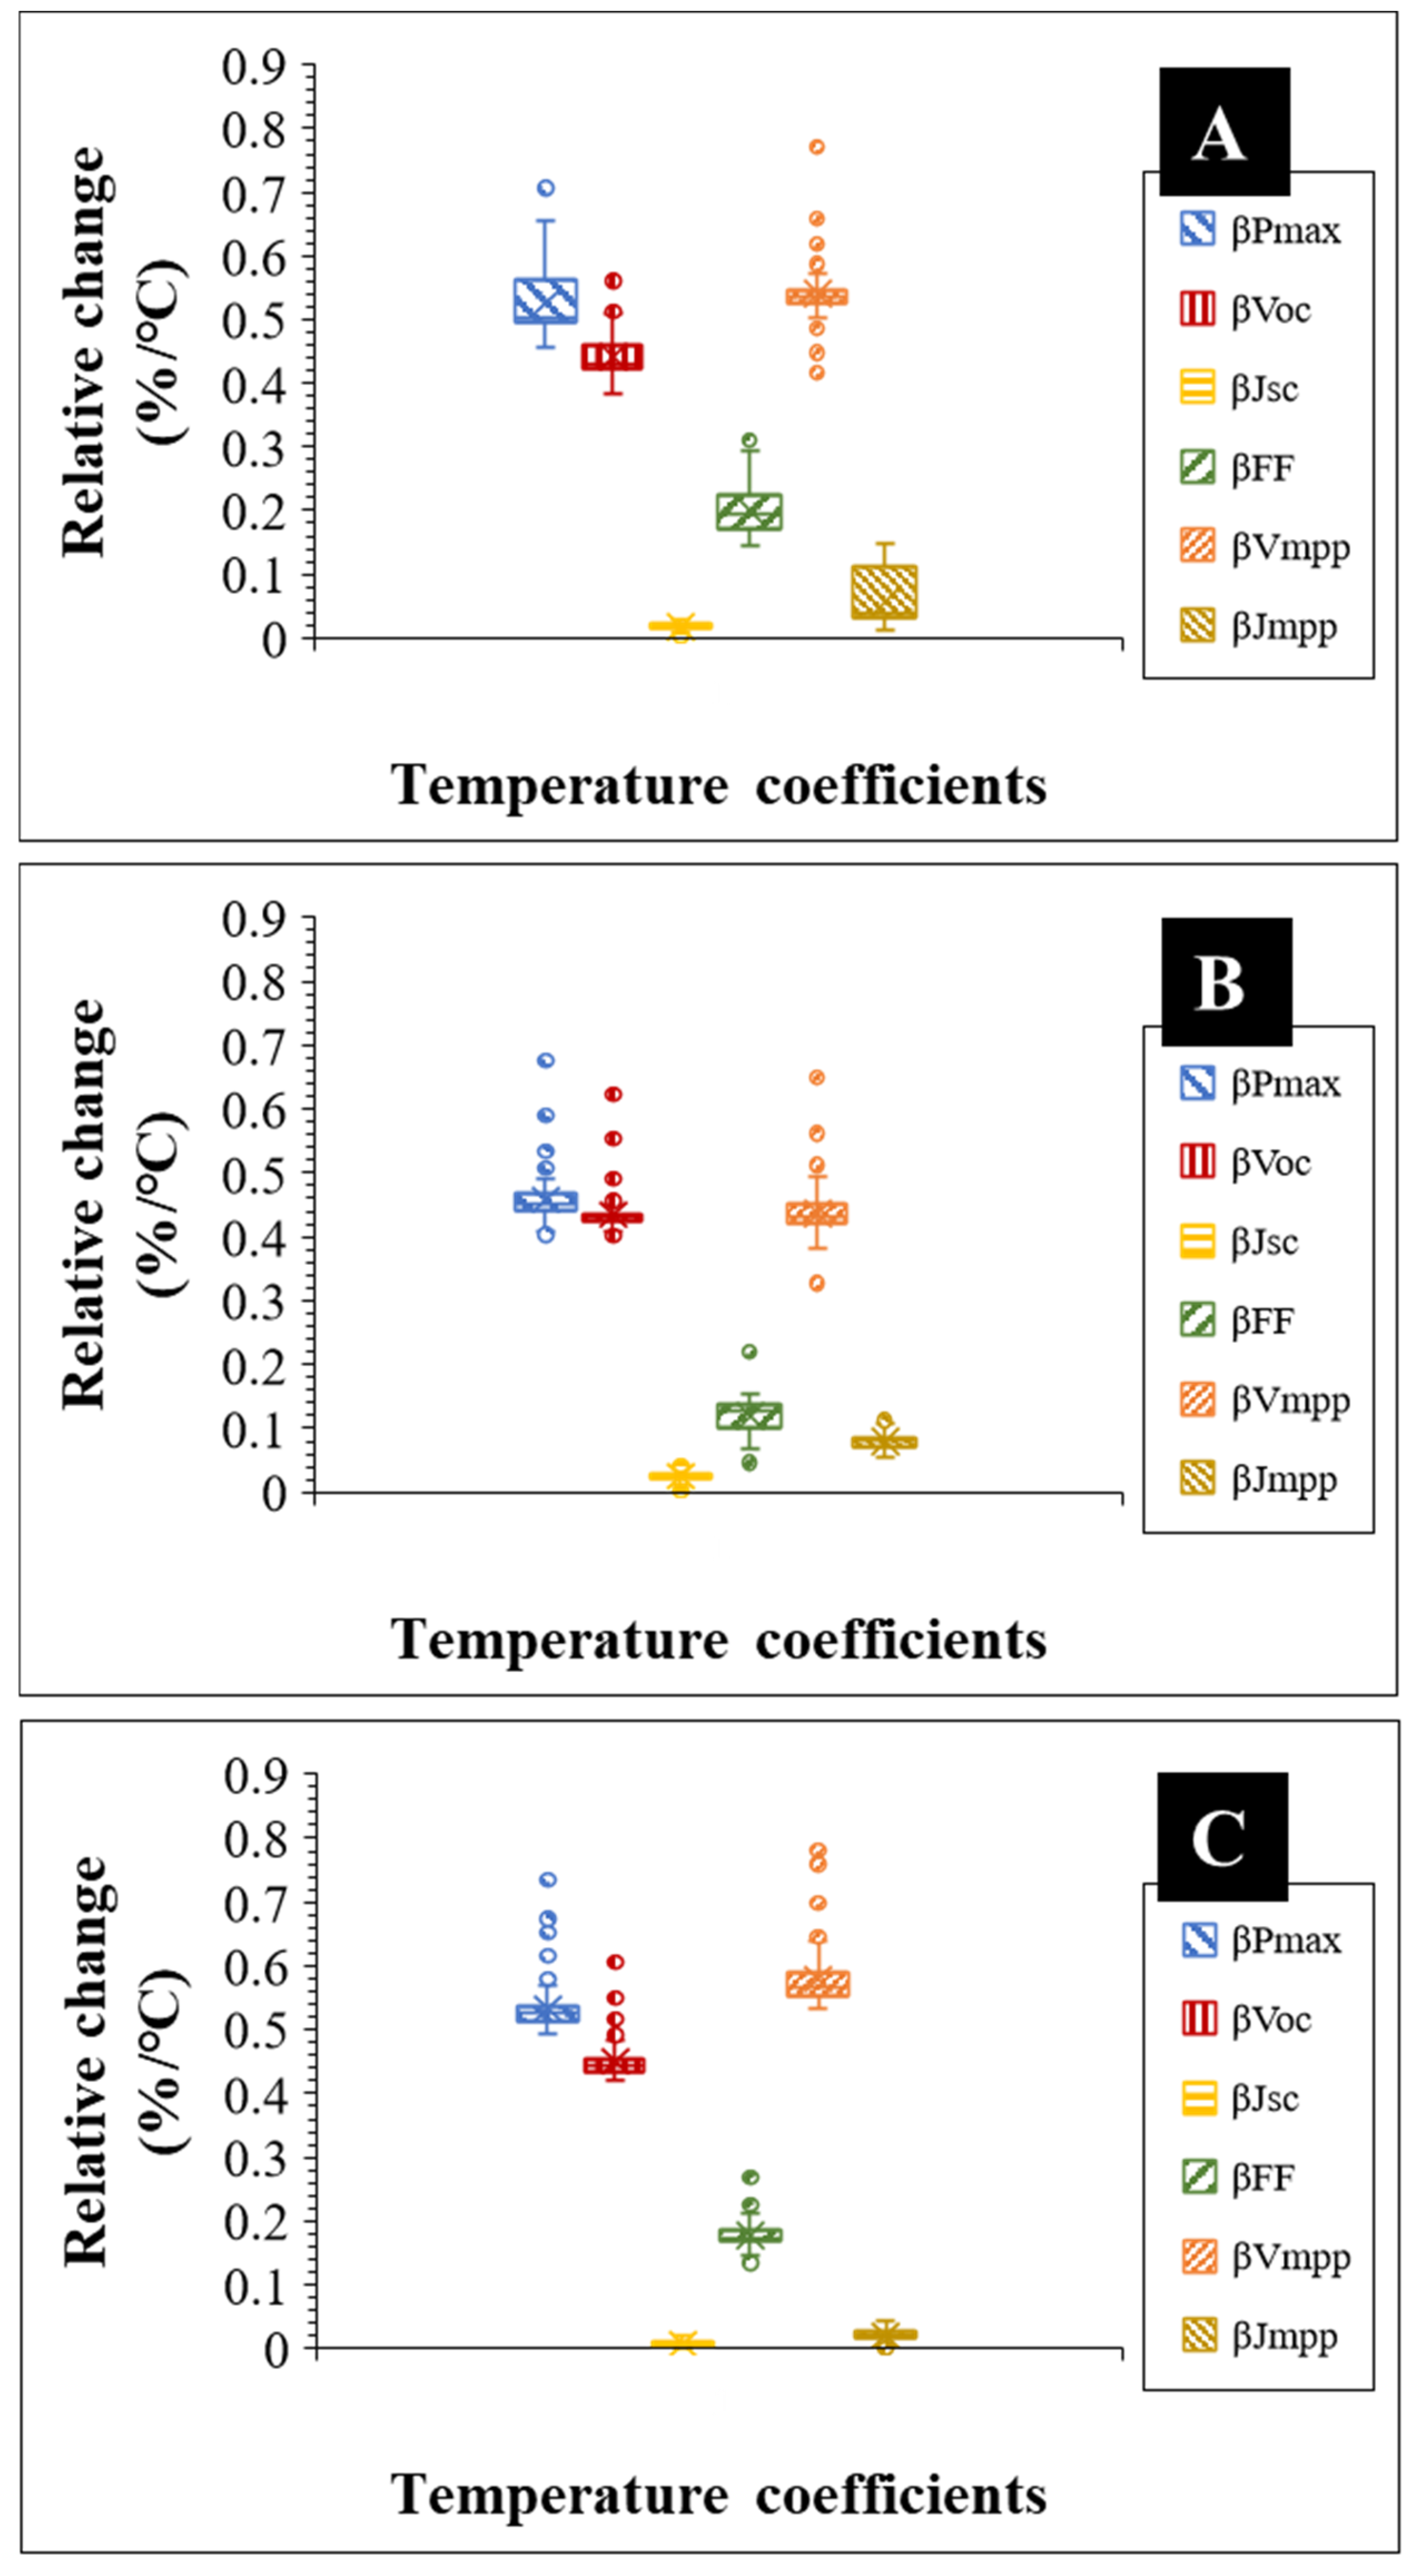
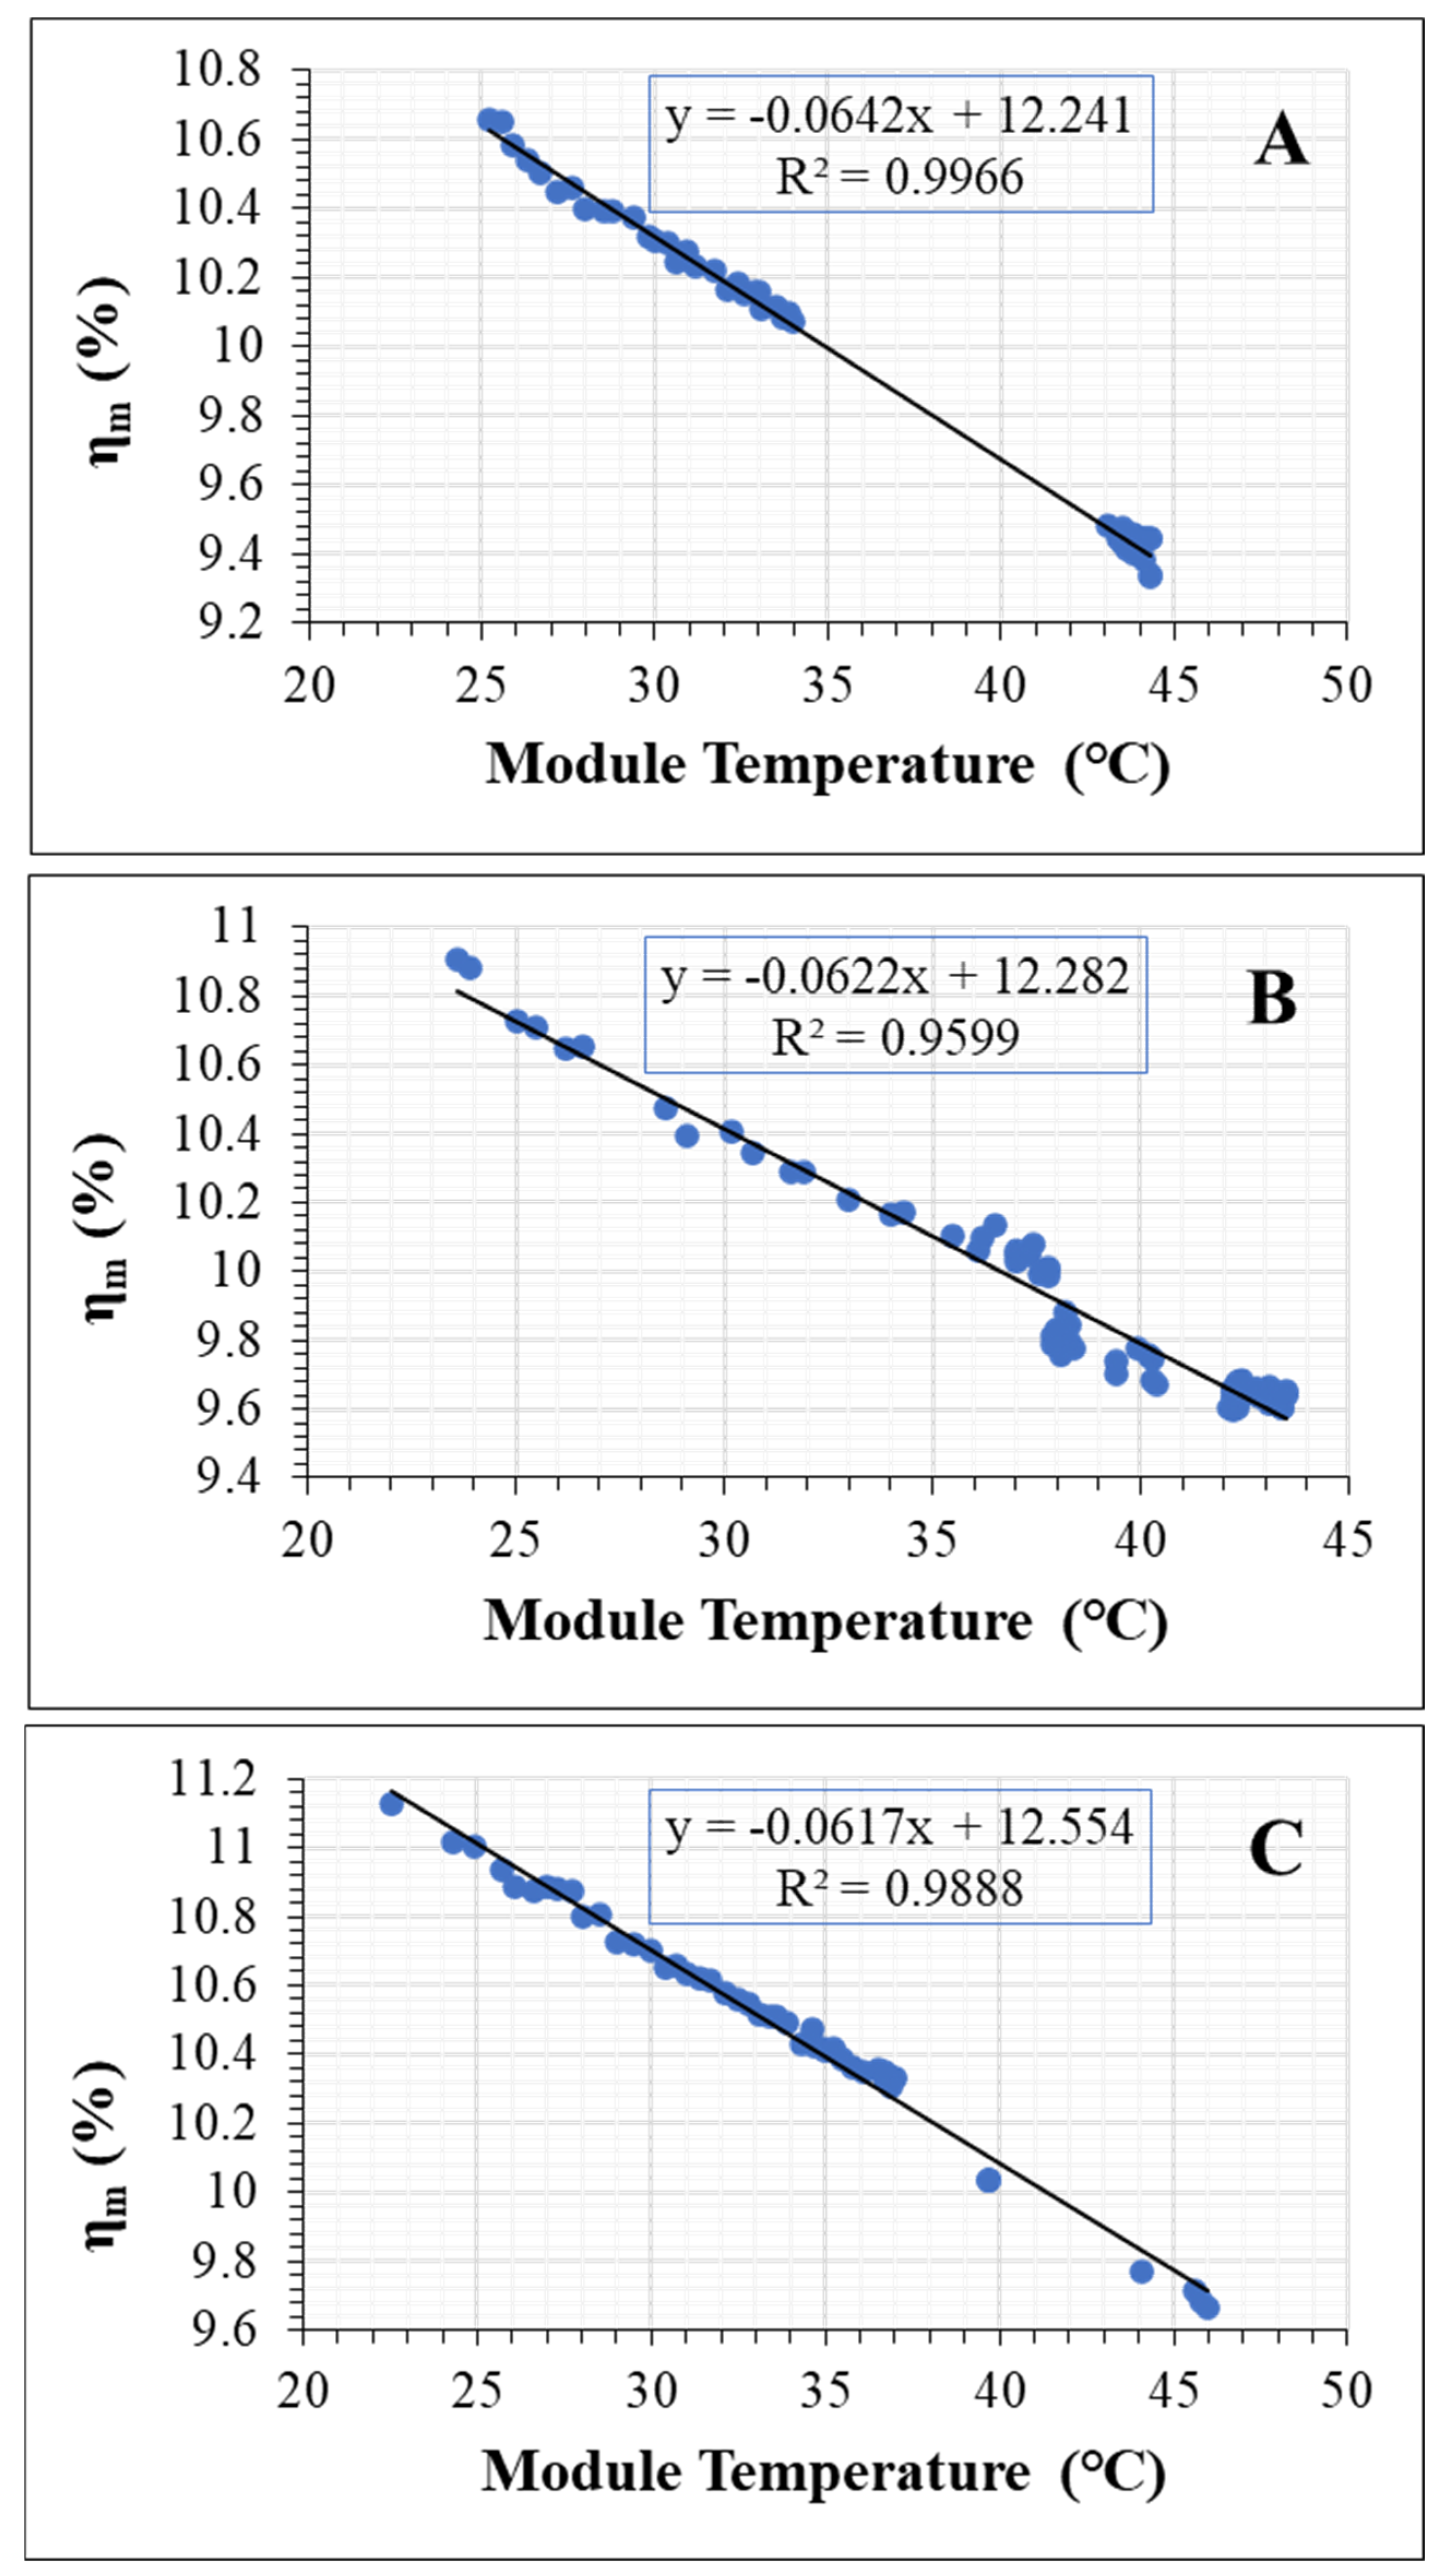
3.4. Temperature Coefficient Characteristics

Figure 8 illustrates the characteristics of the relative temperature coefficients of Pmax (βPmax), Voc (βVoc), Isc (βJsc), FF (βFF), Vmpp (βVmpp), and Impp (βJmpp) of solar panels A, B, and C. Figure 8 compares the variation of each electrical parameter from the average value measured in the year 2021. Degradation in electrical parameters stems from the degradation in the relative temperature coefficients of PV modules [25,26,29]. That is, PID increases recombination in the emitter region of the solar cell [10,11,17,18,19], and this leads to a drop in the Voc [25]. A drop in the Voc influence the temperature characteristics of the solar panel [30,37]. A change in the Voc accounts for more than 80% of the temperature sensitivity of the PV modules [25]. From Figure 8, the main root causes for the observed degradation in Pmax became clearer, unlike in Figure 5. That is, the βVoc and βVmpp of the PV modules are the main underlying causes of the Pmax degradation.
Figure 8 also suggests that degradation in βFF is significantly responsible for the degradation in Pmax. This supports the earlier observation in Figure 5 that the solar panels affected by PID experience large resistance losses. Degradation in βVoc and βFF due to PID effects were reported earlier [20,26,28]. Figure 8 also shows clear outliers for βPmax, βVoc, βVmpp, and βFF. It could be seen that the majority of these outliers are correlated to higher temperature coefficient values which results from higher Tm [38]. This suggests that when Tm increases, the reliability of PV modules affected by PID decreases, as observed elsewhere [24,39].
Conceptually, the effect of Tm on Pmax could be derived from Equation (3) because PV module parameters (Voc, Isc, FF) depend strongly on Tm [30,32,40]. Hence, could be represented as
β Pmax = β Voc + β Jsc + β FF
Interestingly, each of these parameters in Equation (5) depends on different loss mechanisms in the PV module [25,35]. These loss mechanisms mainly depend on the effects of different defects and fault mechanisms on the charge carrier generation-recombination balances at maximum power point (MPP) [35,41]. Therefore, Equations (1) and (5) could be represented in terms of Vmpp and Impp as
β Pmax = β Vmpp + β Jmpp
The Voc is the charge carrier generation-recombination characteristic of a solar panel. So, the temperature sensitivity of a solar panel improves when the Voc increases [40,42]. Moreover, the βVoc of a PV module accounts for 80–90% of the βPmax of the PV module [25]. For that matter, and inferring from Equation (6), βVmpp could be assumed to have the greatest impact on the degradation in βPmax, and hence, on Pmax degradation. The correlation of values of βVoc and βVmpp to βPmax degradation is shown in Figure 9. In Figure 9, the regression plots show high correlation of R2 > 90 and R2 > 88 for βVoc and βVmpp, respectively. Indeed, Figure 8 and Figure 9 suggest that the root causes of degradation in the PV modules affected by PID are more accurately profiled using their temperature coefficients. They suggest that the βVoc and βVmpp are the underlying factors for the degradation in the efficiency of the solar panels.
In Figure 9a,d, the slopes of the regression plots for PV Module A are 0.14 and 0.19 for βVoc and βVmpp, respectively. However, the average of the slope values of βVoc and βVmpp is ca. 0.17. Interestingly, from Figure 9, the slopes of PV Modules B and C for both βVoc and βVmpp regression plots are ca. 0.17. Also, the slopes of the regression plots for βVmpp are closer to the average 0.17 value. Hence, we can predict the behaviour of βPmax better with the slopes of βVmpp for the PV modules affected by PID. This suggests that a unit change in βPmax is accounted for by 0.17 change in either βVoc or βVmpp for each PV module affected by PID. The values of the slopes from the regression plots of βPmax versus βVoc and βVmpp can be used to monitor PID severity in solar panels. On that basis, Figure 9 suggest that the effect of PID on PV Module A is the severest. Another observation from Figure 9d–f is that, when βPmax is zero, then by extrapolation, βVmpp will be ca. 0.4%/°C, 0.6%/°C, and 0.6%/°C for PV Module A, B, and C, respectively. These values are very close to the βVmpp values for the 3 field-aged PV modules in Table 4.
Figure 10 shows the profiles of the temperature coefficients of efficiency, ηm (βηm) of the 3 solar panels. The average of βηm has been found to be ca. −0.5%/°C for the 3 field-aged PV modules. In literature, the βηm for mc-Si PV modules is 0.4%/°C [25,26,28,29,30]. PV modules in good conditions are expected to be more efficient when PV module operating temperature (Tm) drops below 25 °C [30,32]. However, by extrapolation when Tm is equal to zero, ηm < 13%, refer to Figure 10. This is characteristic of degraded PV modules which are suffering from resistive losses [20,26,40].
The average temperature coefficients of the 3 solar panels are shown in Table 4. The observed values for βVoc and βVmpp agree with the values reported by King et al. [30] for conventional mc-Si PV modules. However, the βVoc values are far less than the −1.2%/°C reported by Cheng et al. [38] and the −0.7%/°C reported by Wang et al. [24] for PV modules affected by PID. On the other hand, the βJsc values are relatively lower for these PV modules that have been affected by PID than observed elsewhere [24,38]. This suggests that in solar panels affected by PID, the contribution from thermally generated electrons towards the overall current density is less.
In addition, the βFF values for the 3 field-aged PV modules are lower than the −0.4%/°C reported for βFF by Cheng et al. [38] for solar panels affected by PID. The fact that the modules studied by Cheng et al. [38] were aged artificially whiles our modules were field aged should not be ignored. Comparison of lab and field results are to be done with caution due to factors of uncertainty [43,44]. Our values are also in a good agreement with the −0.2%/°C reported for βFF by Wang et al. [24] for solar panels affected by PID.
Interestingly, the βJmpp of all the 3 solar panels show negative values. It is believed that the negative βJmpp values observed for the 3 old solar panels is due to the large leakage current experienced by PV modules affected by PID. Indeed, earlier investigation on the temperature profiles of solar panels affected by optical degradation indicated that negative βJmpp values are likely when the electrical circuit of the module is affected. However, in such cases, the βJmpp values are relatively higher and the βJsc values are by far higher as well. In that investigation, one of the modules affected by optical degradation showed a βJmpp of −0.01%/°C and an average βJsc for the 3 modules was 0.05%/°C. Moreover, a majority of the darker cells in the EL and warmer cells in IR thermal images were closer to the edge of the PV module affected by optical degradation. This suggests that the module in question is affected by at least optical degradation and PID. It is known that PID can lead to optical degradation and vice versa [5].
Furthermore, an earlier investigation on some of the solar panels under partial shading conditions, negative βJmpp values were observed for the modules investigated. However, under partial shading conditions, beside the peculiar I-V characteristics, the degradation in the Pmax strongly depends mainly on the degradation in the βJmpp and βFF. Moreover, under partial shading conditions, the effect on βηm becomes far higher, with βηm ≥ −0.6%/°C [33]. It therefore suggests that an effective, quick, and reliable method of detecting PID in solar panels is to monitor the temperature coefficients, and specifically, the βJmpp of PV panels.

4. Conclusions

The temperature coefficients of 20 years old field-aged mc-Si PV modules which were affected by PID were investigated. Characterization utilized I-V characterization, EL imaging, IR thermal imaging, and temperature coefficient profiling. The results showed that the field-aged PV modules were indeed affected by PID. EL images acquired under 0.1Isc indoor conditions show degraded darker cells located closer to the perimeter of the PV modules. The weak signal of the cells closer to the edge of the modules is due to strong ohmic shunting of the solar cells with the PV module’s Al- frame. In the IR thermal images acquired under clear sky conditions, majority of the warmer cells (hotspots) were seen closer to the perimeter of the modules. In addition, areas closer to the negative terminals were also observed to be warmer than areas closer to the positive terminals. Our results show that the module ∆T due to PID ranges from 7 °C to 15 °C for the 3 old solar panels.
The modules show an average degradation of 0.5%/year in both Isc and Voc, 1.2%/year in Pmax, and 0.3%/year in fill factor. For the 3 field-aged PV panels, the average degradation in the Vmpp and Impp were 0.7% and 0.6% per year, respectively. It turns out that the key underlying causes for PID in the field-aged PV modules and the subsequent degradation is degradation in Voc, Vmpp, and FF. The average temperature coefficients of βηm, βVoc, βJsc, βFF, βJmpp, and βVmpp were found to be −0.5%/°C, −0.4%/°C, 0.02%/°C, −0.2%/°C, −0.06%/°C, and −0.5%/°C, respectively. This shows that all the temperature coefficients of the field-aged modules have undergone some form of degradation. However, it was observed that the βVoc, βVmpp, and βFF were the primary factors for the degradation in the Pmax for the old solar PV panels affected by PID. This translated into an average 1.2%/year overall degradation in the efficiency of these modules.
Most interestingly, it was observed that solar panels affected by PID show negative βJmpp due to large leakage currents. Hence, PID could be detected decisively by monitoring the βJmpp of solar PV panels. These findings have the potential of enhancing the existing knowledge on defects and faults diagnostics in PV arrays.

Author Contributions

Conceptualization, O.K.S.; methodology, O.K.S.; validation, O.K.S.; investigation, O.K.S.; resources, T.O.S.; writing—original draft preparation, O.K.S.; writing—review and editing, T.O.S.; supervision, T.O.S.; funding acquisition, T.O.S. All authors have read and agreed to the published version of the manuscript.

Funding

This research was funded by the University of Agder, Norway.

Institutional Review Board Statement

Not applicable.

Informed Consent Statement

Not applicable.

Data Availability Statement

The data presented in this study are available on request from the corresponding author. The data are not publicly available at this time as the data also forms part of an ongoing study.

Acknowledgments

The authors acknowledge the continuous support of the University of Agder, Norway.

Conflicts of Interest

The authors declare no conflict of interest.

References

  1. Segbefia, O.K.; Imenes, A.G.; Saetre, T.O. Moisture ingress in photovoltaic modules: A review. Sol. Energy 2021, 224, 889–906. [Google Scholar] [CrossRef]
  2. Luo, W.; Khoo, Y.S.; Hacke, P.; Naumann, V.; Lausch, D.; Harvey, S.P.; Singh, J.P.; Chai, J.; Wang, Y.; Aberle, A.G.; et al. Potential-induced degradation in photovoltaic modules: A critical review. Energy Environ. Sci. 2017, 10, 43–68. [Google Scholar] [CrossRef] [Green Version]
  3. Köntges, M.; Kurtz, S.; Packard, C.; Jahn, U.; Berger, K.A.; Kato, K. Performance and Reliability of Photovoltaic Systems: Subtask 3.2: Review of Failures of Photovoltaic Modules: IEA PVPS Task 13: External Final Report IEA-PVPS; International Energy Agency, Photovoltaic Power Systems Programme: Paris, France, 2014. [Google Scholar]
  4. Hoffmann, S.; Koehl, M. Effect of humidity and temperature on the potential-induced degradation. Prog. Photovolt. 2014, 22, 173–179. [Google Scholar] [CrossRef]
  5. Hacke, P.; Terwilliger, K.; Smith, R.; Glick, S.; Pankow, J.; Kempe, M.; Bennett, S.K.I.; Kloos, M. System voltage potential-induced degradation mechanisms in PV modules and methods for test. In Proceedings of the 2011 37th IEEE Photovoltaic Specialists Conference, Seattle, WA, USA, 19–24 June 2011; pp. 000814–000820. [Google Scholar]
  6. Virtuani, A.; Annigoni, E.; Ballif, C. One-type-fits-all-systems: Strategies for preventing potential-induced degradation in crystalline silicon solar photovoltaic modules. Prog. Photovolt. 2019, 27, 13–21. [Google Scholar] [CrossRef]
  7. Lausch, D.; Naumann, V.; Breitenstein, O.; Bauer, J.; Graff, A.; Bagdahn, J.; Hagendorf, C. Potential-Induced Degradation (PID): Introduction of a Novel Test Approach and Explanation of Increased Depletion Region Recombination. IEEE J. Photovolt. 2014, 4, 834–840. [Google Scholar] [CrossRef]
  8. Pingel, S.; Frank, O.; Winkler, M.; Daryan, S.; Geipel, T.; Hoehne, H.; Berghold, J. Potential induced degradation of solar cells and panels. In Proceedings of the 2010 35th IEEE Photovoltaic Specialists Conference, Honolulu, HI, USA, 20–25 June 2010; pp. 002817–002822. [Google Scholar]
  9. Hylský, J.; Strachala, D.; Vyroubal, P.; Čudek, P.; Vaněk, J.; Vanýsek, P. Effect of negative potential on the extent of PID degradation in photovoltaic power plant in a real operation mode. Microelectron. Reliab. 2018, 85, 12–18. [Google Scholar] [CrossRef]
  10. Naumann, V.; Geppert, T.; Grosser, S.; Wichmann, D.; Krokoszinski, H.J.; Werner, M.; Hagendorf, C. Potential-induced degradation at interdigitated back contact solar cells. In Proceedings of the 4th International Conference on Crystalline Silicon Photovoltaics (Siliconpv 2014), ‘s-Hertogenbosch, The Netherlands, 25–27 March 2014; Volume 55, pp. 498–503. [Google Scholar]
  11. Yamaguchi, S.; Yamamoto, C.; Ohshita, Y.; Ohdaira, K.; Masuda, A. Influence of emitter position of silicon heterojunction photovoltaic solar cell modules on their potential-induced degradation behaviors. Sol. Energy Mater. Sol. Cells 2020, 216, 110716. [Google Scholar] [CrossRef]
  12. Schütze, M.; Junghänel, M.; Koentopp, M.B.; Cwikla, S.; Friedrich, S.; Müller, J.W.; Wawer, P. Laboratory study of potential induced degradation of silicon photovoltaic modules. In Proceedings of the 2011 37th IEEE Photovoltaic Specialists Conference, Seattle, WA, USA, 19–24 June 2011; pp. 000821–000826. [Google Scholar]
  13. Kwembur, I.M.; McCleland, J.L.C.; van Dyk, E.E.; Vorster, F.J. Detection of Potential Induced Degradation in mono and multi-crystalline silicon photovoltaic modules. Phys. B—Condens. Matter 2020, 581, 411938. [Google Scholar] [CrossRef]
  14. Carolus, J.; Tsanakas, J.A.; van der Heide, A.; Voroshazi, E.; de Ceuninck, W.; Daenen, M. Physics of potential-induced degradation in bifacial p-PERC solar cells. Sol. Energy Mater. Sol. Cells 2019, 200, 109950. [Google Scholar] [CrossRef] [Green Version]
  15. Jahn, U.; Herz, M.; Köntges, M.; Parlevliet, D.; Paggi, M.; Tsanakas, I. Review on Infrared and Electroluminescence Imaging for PV Field Applications: International Energy Agency Photovoltaic Power Systems Programme: IEA PVPS Task 13, Subtask 3.3: Report IEA-PVPS T13-12; International Energy Agency: Paris, France, 2018. [Google Scholar]
  16. Tsanakas, J.A.; Ha, L.; Buerhop, C. Faults and infrared thermographic diagnosis in operating c-Si photovoltaic modules: A review of research and future challenges. Renew. Sustain. Energy Rev. 2016, 62, 695–709. [Google Scholar] [CrossRef]
  17. Köntges, M.; Oreski, G.; Jahn, U.; Herz, M.; Hacke, P.; Weiß, K.-A. Assessment of Photovoltaic Module Failures in the Field: International Energy Agency Photovoltaic Power Systems Programme: IEA PVPS Task 13, Subtask 3: Report IEA-PVPS T13-09; International Energy Agency: Paris, France, 2017. [Google Scholar]
  18. Halm, A.; Schneider, A.; Mihailetchi, V.D.; Koduvelikulathu, L.J.; Popescu, L.M.; Galbiati, G.; Chu, H.F.; Kopecek, R. Potential-induced degradation for encapsulated n-type IBC solar cells with front floating emitter. In Proceedings of the 5th International Conference on Silicon Photovoltaics, SiliconPV 2015, Konstanz, Germany, 25–27 March 2015; pp. 356–363. [Google Scholar]
  19. Swanson, R.; Cudzinovic, M.; DeCeuster, D.; Desai, V.; Jürgens, J.; Kaminar, N.; Mulligan, W.; Rodrigues-Barbarosa, L.; Rose, D.; Smith, D. The surface polarization effect in high-efficiency silicon solar cells. In Proceedings of the 15th PVSEC, Shanghai, China, 10–15 October 2005. [Google Scholar]
  20. Naumann, V.; Lausch, D.; Hahnel, A.; Bauer, J.; Breitenstein, O.; Graff, A.; Werner, M.; Swatek, S.; Grosser, S.; Bagdahn, J.; et al. Explanation of potential-induced degradation of the shunting type by Na decoration of stacking faults in Si solar cells. Sol. Energy Mater. Sol. Cells 2014, 120, 383–389. [Google Scholar] [CrossRef]
  21. Oh, K.S.; Bae, S.; Lee, K.J.; Kim, D.; Chan, S.I. Mitigation of potential-induced degradation (PID) based on anti-reflection coating (ARC) structures of PERC solar cells. Microelectron. Reliab. 2019, 100, 113462. [Google Scholar] [CrossRef]
  22. Masuda, A.; Akitomi, M.; Inoue, M.; Okuwaki, K.; Okugawa, A.; Ueno, K.; Yamazaki, T.; Hara, K. Microscopic aspects of potential-induced degradation phenomena and their recovery processes for p-type crystalline Si photovoltaic modules. Curr. Appl. Phys. 2016, 16, 1659–1665. [Google Scholar] [CrossRef]
  23. Islam, M.A.; Hasanuzzaman, M.; Rahim, N.A. Investigation of the potential induced degradation of on-site aged polycrystalline PV modules operating in Malaysia. Measurement 2018, 119, 283–294. [Google Scholar] [CrossRef]
  24. Wang, H.; Cheng, X.L.; Yang, H.; He, W.S.; Chen, Z.L.; Xu, L.H.; Song, D.Y. Potential-induced degradation: Recombination behavior, temperature coefficients and mismatch losses in crystalline silicon photovoltaic power plant. Sol. Energy 2019, 188, 258–264. [Google Scholar] [CrossRef]
  25. Dupré, O.; Vaillon, R.; Green, M.A. Physics of the temperature coefficients of solar cells. Solar energy materials and solar cells. Sol. Energy Mater. Sol. Cells 2015, 140, 92–100. [Google Scholar] [CrossRef]
  26. Dubey, R.; Batra, P.; Chattopadhyay, S.; Kottantharayil, A.; Arora, B.M.; Narasimhan, K.; Vasi, J. Measurement of temperature coefficient of photovoltaic modules in field and comparison with laboratory measurements. In Proceedings of the 2015 IEEE 42nd Photovoltaic Specialist Conference (PVSC), New Orleans, LA, USA, 14–19 June 2015; pp. 1–5. [Google Scholar]
  27. Kaden, T.; Lammers, K.; Moller, H.J. Power loss prognosis from thermographic images of PID affected silicon solar modules. Sol. Energy Mater. Sol. Cells 2015, 142, 24–28. [Google Scholar] [CrossRef]
  28. Mattei, M.; Notton, G.; Cristofari, C.; Muselli, M.; Poggi, P. Calculation of the polycrystalline PV module temperature using a simple method of energy balance. Renew. Energy 2006, 31, 553–567. [Google Scholar] [CrossRef]
  29. Skoplaki, E.; Palyvos, J.A. On the temperature dependence of photovoltaic module electrical performance: A review of efficiency/power correlations. Sol. Energy 2009, 83, 614–624. [Google Scholar] [CrossRef]
  30. King, D.L.; Kratochvil, J.A.; Boyson, W.E. Temperature coefficients for PV modules and arrays: Measurement methods, difficulties, and results. In Proceedings of the Conference Record of the Twenty Sixth IEEE Photovoltaic Specialists Conference-1997, Anaheim, CA, USA, 29 September–3 October 1997; pp. 1183–1186. [Google Scholar]
  31. Evans, D.; Florschuetz, L. Terrestrial concentrating photovoltaic power system studies. Sol. Energy 1978, 20, 37–43. [Google Scholar] [CrossRef]
  32. Segbefia, O.K.; Imenes, A.G.; Sætre, T.O. Outdoor Fault Diagnosis of Field-Aged Multicrystalline Silicon Solar Modules. In Proceedings of the 37th EU PVSEC, Lisbon, Portugal, 7–11 September 2020. [Google Scholar]
  33. Segbefia, O.K.; Paudyal, B.R.; Burud, I.; Sætre, T.O. Temperature Coefficients of Photovoltaic Modules under Partial Shading Conditions. In Proceedings of the 38th EU PVSEC, Lisbon, Portugal, 6–10 September 2021; pp. 1180–1186. [Google Scholar]
  34. Islam, M.A.; Hasanuzzaman, M.; Rahim, N.A. A comparative investigation on in-situ and laboratory standard test of the potential induced degradation of crystalline silicon photovoltaic modules. Renew. Energy 2018, 127, 102–113. [Google Scholar] [CrossRef]
  35. Green, M.A. General temperature dependence of solar cell performance and implications for device modelling. Prog. Photovolt. Res. Appl. 2003, 11, 333–340. [Google Scholar] [CrossRef]
  36. Buerhop, C.; Schlegel, D.; Niess, M.; Vodermayer, C.; Weigmann, R.; Brabec, C.J. Reliability of IR-imaging of PV-plants under operating conditions. Sol. Energy Mater. Sol. Cells 2012, 107, 154–164. [Google Scholar] [CrossRef]
  37. Segbefia, O.K.; Imenes, A.G.; Burud, I.; Sætre, T.O. Temperature profiles of field-aged multicrystalline silicon photovoltaic modules affected by microcracks. In Proceedings of the 2021 IEEE 48th Photovoltaic Specialists Conference (PVSC), Fort Lauderdale, FL, USA, 20–25 June 2021; pp. 0001–0006. [Google Scholar]
  38. Cheng, X.; Dong, Y.; Yang, T.; Zhou, T.; Wang, H.; Yu, H. Investigation on Temperature Coefficients of Crystalline Silicon Solar Modules before and after Potential-induced Degradation. In Proceedings of the 2019 IEEE 46th Photovoltaic Specialists Conference (PVSC), Chicago, IL, USA, 16–21 June 2019; pp. 1942–1945. [Google Scholar]
  39. Spataru, S.; Hacke, P.; Sera, D.; Packard, C.; Kerekes, T.; Teodorescu, R. Temperature-dependency analysis and correction methods of in situ power-loss estimation for crystalline silicon modules undergoing potential-induced degradation stress testing. Prog. Photovolt. 2015, 23, 1536–1549. [Google Scholar] [CrossRef]
  40. Green, M.; Emery, K.; Blakers, A. Silicon solar cells with reduced temperature sensitivity. Electron. Lett. 1982, 18, 97–98. [Google Scholar] [CrossRef]
  41. Dupré, O.; Vaillon, R.; Green, M.A. Experimental assessment of temperature coefficient theories for silicon solar cells. IEEE J. Photovolt. 2015, 6, 56–60. [Google Scholar] [CrossRef]
  42. Zhao, J.; Wang, A.; Robinson, S.; Green, M. Reduced temperature coefficients for recent high-performance silicon solar cells. Prog. Photovolt. Res. Appl. 1994, 2, 221–225. [Google Scholar] [CrossRef]
  43. Reise, C.; Müller, B.; Moser, D.; Belluardo, G.; Ingenhoven, P. Uncertainties in PV System Yield Predictions and Assessments; IEA: Paris, France, 2018. [Google Scholar]
  44. Berghold, J.; Koch, S.; Böttcher, A.; Ukar, A.; Leers, M.; Grunow, P. Potential-induced degradation (PID) and its correlation with experience in the field. Photovolt. Int. 2013, 19, 87–93. [Google Scholar]
Figure 1. Electrical layout of the field-aged PV modules. Three serially circuited substrings; each consisting of a pair of 12 series connected solar cells in 3 series connected substrings.
Energies 15 03865 g001
Figure 2. Experimental setup of the EL imaging system. The system runs on a DC power supply.
Energies 15 03865 g002
Figure 3. (a) Visual image and (b) IR thermal image (insert) of a PV module measured from the backside during the outdoor IR thermal imaging. The supporting metal trestle (behind the PV module) and the cables in the visual image show corresponding blue traces in the IR thermal image.
Energies 15 03865 g003
Figure 4. Normalized I-V characteristics of the 3 old PV panels (A, B, C). The data sheet curve by the manufacturer in the year 2000 is also shown.
Energies 15 03865 g004
Figure 5. Degradation in the electrical parameters of the old PV panels under STC conditions using Box and Whisker plots. The tips of the boxes show the interquartile ranges. The internal lines show the median and the x-marks show mean. ∆ is the difference between data sheet (2000) and measured (2021) values. Measurements were done under 960–1060 W/m2 in-plane irradiance conditions.
Energies 15 03865 g005
Figure 6. EL analyses of the 3 old solar panels under Isc (ac) and 0.1Isc (df) conditions, respectively. Corresponding PID affected areas in EL images under both bias conditions are marked out in red. EL at 0.1Isc revealed PID affected areas better.
Energies 15 03865 g006
Figure 7. IR thermograms of the 3 old solar panels (AC) affected by PID under clear sky outdoor conditions. Corresponding defects areas in Figure 6 are marked in white. The negative terminal (left) and the positive terminal (right) are indicated above the modules.
Energies 15 03865 g007
Figure 8. Change in the relative temperature coefficients of the 3 solar panels under STC conditions. The tips of the boxes show the interquartile ranges. The internal lines show the median and the x-marks show the mean. Measurements were done under 960 W/m2–1060 W/m2 in-plane irradiance conditions.
Energies 15 03865 g008
Figure 9. Dependence of absolute βPmax on absolute βVoc (ac) and βVmpp (df) of the 3 solar panels affected by PID. R2 indicates the degree of correlation.
Energies 15 03865 g009
Figure 10. The relationship among the efficiency (ηm), module temperature, and temperature coefficient of efficiency(βηm) of the 3 solar panels. R2 indicates the degree of correlation.
Energies 15 03865 g010
Table 1. Technical data sheet (2000) and the measured electrical parameters (2021) of old solar panels normalized to Standard Test Conditions (STC).
PV ModulePmax (W)Voc (V)Isc (A)Vmpp (V)Impp (A)FF (%)η (%)
2000 (Data sheet)10021.66.716.76.07013.0
A75.019.55.914.35.2659.7
2021B75.919.36.114.25.3659.9
C78.319.66.114.75.36610.2
Table 2. Correlation of the degradation in PV modules electrical parameters to the degradation in Pmax due to PID. R2 indicates the degree of correlation.
PV ModuleR2
VocVmppFFImppIsc
A0.980.990.860.230.47
B0.980.980.570.550.17
C0.990.990.880.060.04
Table 3. Difference in temperature (∆T) of the solar cells with the highest temperature (TcH) and lowest temperature (TcL) for PV Modules A, B, and C which were affected by PID.
PV ModuleTemperature (°C)T (°C)
TcHTcL
A36.929.57.4
B51.336.714.6
C49.540.59.0
Table 4. Average temperature coefficients of the 3 solar panels.
PV ModuleTemperature Coefficient (%/°C)
βVocβJscβFFβηmβVmppβJmpp
A−0.40.02−0.2−0.5−0.5−0.06
B−0.40.03−0.1−0.5−0.4−0.09
C−0.40.01−0.2−0.5−0.5−0.02
Publisher’s Note: MDPI stays neutral with regard to jurisdictional claims in published maps and institutional affiliations.

