Article

Reservoir Interpretation of Intrusive Rock Buried-Hill with Mud-Logging Data while Drilling—Taking the Y Area in the Qiongdongnan Basin of the South China Sea as an Example

1
College of Petroleum and Gas Engineering, Chongqing University of Science and Technology, Chongqing 401331, China
2
Chongqing Key Laboratory of Complex Oil and Gas Exploration and Development, Chongqing 401331, China
3
Zhanjiang Branch of China France Bohai Geoservices Co., Ltd., Zhanjiang 524057, China
4
Zhanjiang Branch, CNOOC China Limited, Haikou 570100, China
5
School of Geoscience and Technology, Southwest Petroleum University, Chengdu 610500, China
*
Authors to whom correspondence should be addressed.
Energies 2022, 15(10), 3813; https://doi.org/10.3390/en15103813
Submission received: 16 March 2022 / Revised: 3 May 2022 / Accepted: 16 May 2022 / Published: 22 May 2022
(This article belongs to the Special Issue Shale Oil and Gas Accumulation Mechanism)

Abstract

:
The intrusive rock buried-hill reservoir is one of the main targets for oil and gas exploration in the offshore sedimentary basins of China. In order to discover the reservoir as early as possible for decision-making to save costs, reservoir interpretation with mud-logging data needs to be studied. Previous studies have showed that the homogeneity rocks reservoir can be well interpreted with mud-logging data u the Kb (mechanical specific energy ratio) method and the WL (tangential power)-WH (vertical power) intersection method. However, reservoir interpretation with mud-logging data for intrusive rock buried-hill has not been reported. The key steps or parameters of these two kinds of methods used for reservoir interpretation need to be modified for the vertical variation of intrusive rock buried-hill. Furthermore, confirming the interpretation of these two kinds of methods has not been reported. Taking the Y area in the Qiongdongnan Basin of the South China Sea as an example, the intrusive rock buried-hill can be divided into four zones based on its characteristics and genesis in descending order: the sand–gravel weathering zone, the weathering fracture zone, the inner fracture zone, and the base rock zone. The reservoir can be well interpreted when taking the MSE (mechanical specific energy) geometrical mean of the base rock zone as a basic value to calculate Kb. The reservoir will also be well interpreted when WH ranges from 0 to 4.5 MPa and WL ranges from 0 to 99 MPa in the column while intersecting. The layers of the reservoir can be interpreted as Kb < 1 in the sand–gravel weathering zone and the weathering fracture zone. The Kb < 1 and effective intersection of WL-WH layers at the same time could be interpreted as a reservoir in the inner fracture zone and the base rock zone. After combining the Kb method with the WL-WH intersection method, the reservoir of intrusive rock buried-hill can be well interpreted. The total thickness of the uninterpretable reservoir ratio is less than 20% compared to reservoir interpretation with well-logging for each well.

1. Introduction

Buried hill is one of several ancient landforms, with accumulating oil and gas, known as the buried-hill hydrocarbon reservoir [1,2,3,4]. In the offshore sedimentary basins of China, a variety of rocks can form buried hill, such as carbonate rock, metamorphic rock, and igneous rocks. With the recent continuous discovery of granite buried-hill reservoirs, such as Penglai 9-1, Yongle 8-1, and Huizhou 26-6 oil and gas field [5,6,7], intrusive rock buried-hill has attracted more and more attention. Offshore petroleum drilling is very expensive, decreasing the duration of drilling, and decision making is favorable for saving costs. In order to discover the reservoir as earlier as possible for decision making, reservoir interpretation with mud-logging data for the intrusive rock buried-hill while drilling needs to be studied. There are different methods for reservoir identification and evaluation during mud-logging: (i) some pores, vugs, and fractures could be observed directly on the core, and the reservoir can be evaluated qualitatively (the more pores, vugs, and fractures, the better the reservoir physical properties); (ii) the reservoir also can be evaluated qualitatively using the rate of penetration (ROP) (the higher ROP, the better the reservoir physical properties); (iii) the porosity, permeability, and their distribution image could be acquired for reservoir evaluation based on core nuclear magnetic resonance analysis; and (iv) the work index is the work carried out using the drill bit while breaking rocks per meter. It is equivalent to the horizontal and perpendicular component of force which acts on the strata multiplied by the footage in the corresponding direction [8,9,10,11]. As previously shown, a smaller work index means the more development of fractures and pores [9,11]. However, the reservoir cannot be well identified and evaluated using the methods mentioned above while drilling. Core observation and nuclear magnetic resonance analysis on mud-logging sites are relatively hysteretic to drilling. Furthermore, few core and sidewall core can be provided for analysis during offshore petroleum exploration. ROP is greatly affected by engineering factors. Work index is greatly affected by bit types, and the reservoir cannot be well interpreted with the work index in the layers drilled by PDC bits. Meanwhile, there are three empirical values used to calculate work index, which struggle to confirm the areas with little wells [8,9,10,11]. At present, the Kb method and the WL-WH intersection method are two kinds of reliable reservoir interpretation methods with mud-logging data while drilling [11,12]. The reservoirs of volcanic rocks, pyroclastic rocks, and dolomitic limestone have been well interpreted by these two kinds of methods [11,12]. There are three key points for reservoir interpretation with mud-logging data: confirm the basic value used to calculate Kb, confirm the optimal numerical ranges of WL and WH while intersecting, and establish the principles of reservoir interpretation based on these two kinds of methods. In fact, reservoir interpretation with mud-logging data for the intrusive rock buried-hill has not been reported. Compared with homogeneity rocks, such as volcanic rocks, the rock mechanical properties of intrusive rock buried-hill are vertically variable. The key steps or parameters of these two kinds of methods used for reservoir interpretation need to be modified based on the characteristics and genesis of intrusive rock buried-hill. Furthermore, confirming the interpretation of these two kinds of methods has not been mentioned by other authors. In this study, we use the Y area in the Qiongdongnan Basin of South China Sea as an example, try to find a new method to calculate a basic value for Kb, confirm the optimal numerical ranges of WL and WH while intersecting, and establish the principles of reservoir interpretation based on these two kinds of methods to reservoir interpretation with mud-logging data, in order to accelerate the petroleum exploration and production of offshore intrusive rock buried-hill.

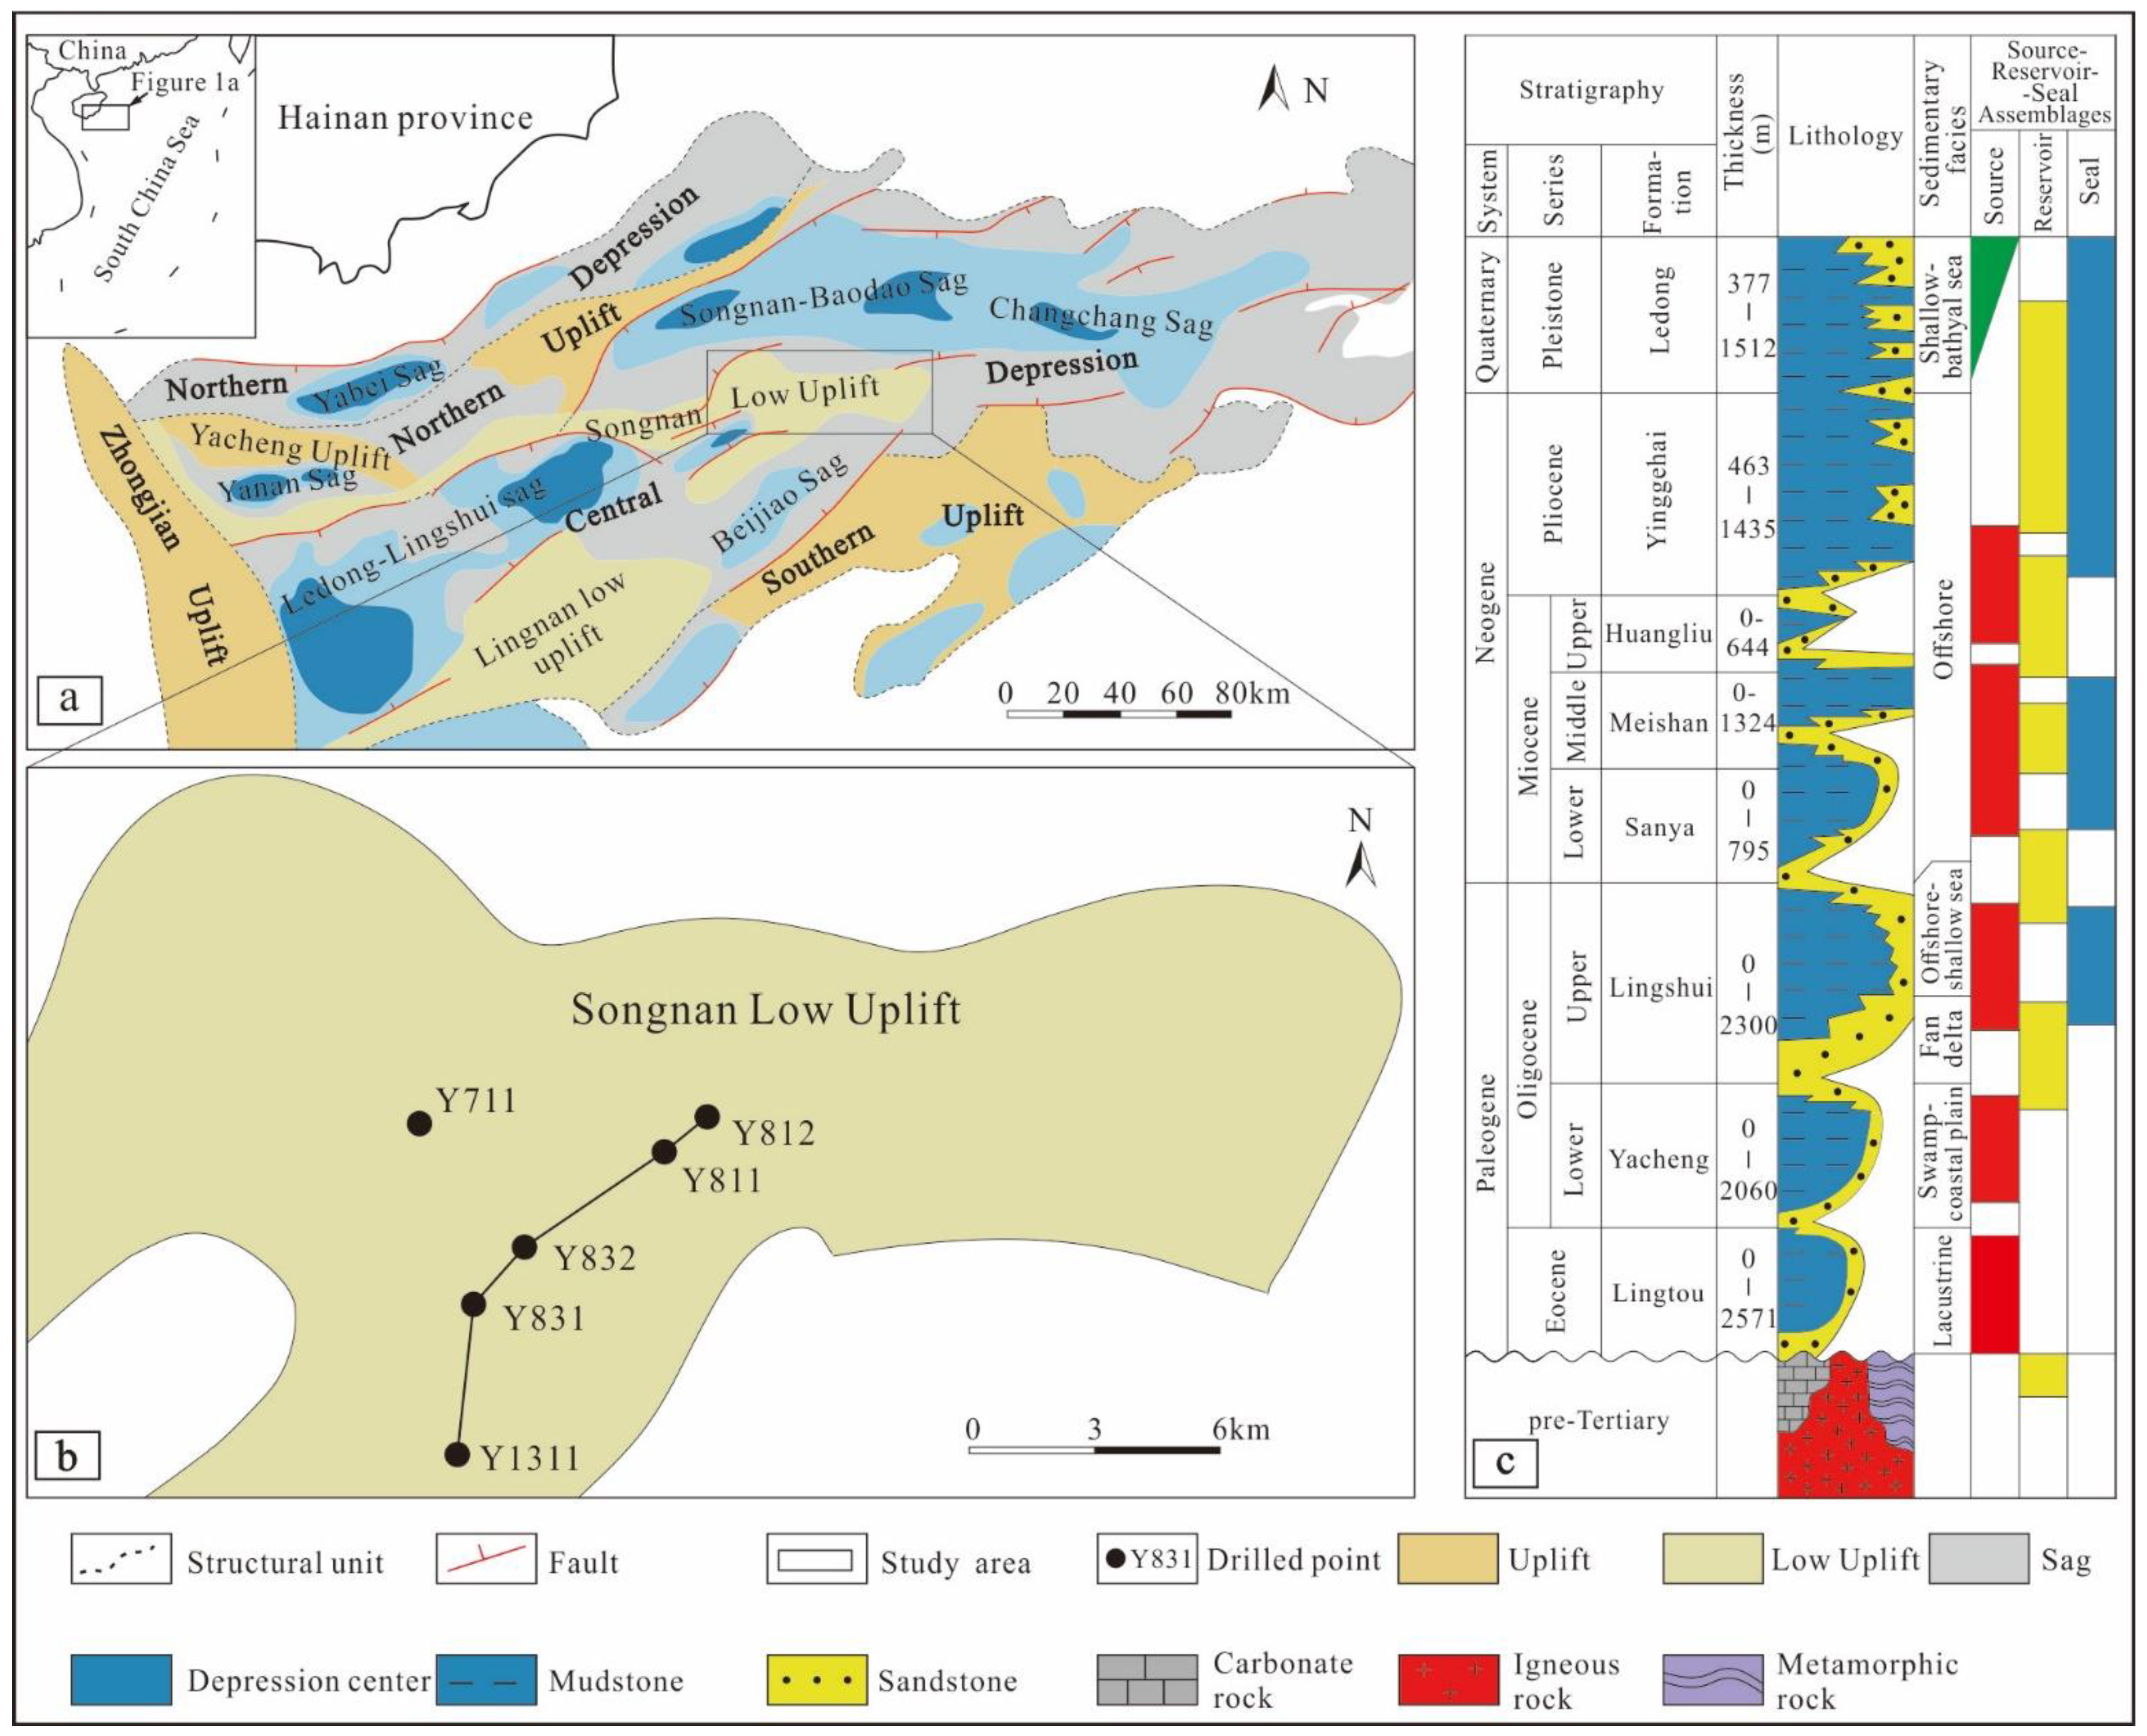
2. Geological Setting

The Qiongdongnan Basin is a large-scale Cenozoic petroliferous basin, around 4.5 × 10⁴ km2 (Figure 1a), which was developed on the extensional tectonic setting of the northern quasi-passive continental margin in the South China Sea [13,14]. The deep-water areas in the northern South China Sea are rich in oil and gas resources, and the Qiongdongnan Basin is an important oil and gas exploration region [14,15,16,17]. The Qiongdongnan Basin was strongly affected by the Eurasian Plate, the Indo-China Plate, and the Pacific Plate, and was widely distributed with igneous rocks since Mesozoic, which are conducive to the formation of basement intrusive rock buried-hill [18,19,20,21]. The top of the basin basement experienced long-term weathering and denudation in the Late Mesozoic and formed buried hill [21]. At the same time, the fracture–porosity-type weathered crust reservoir was constructed (Figure 2). Intrusive rock buried-hill and its periphery in the Qiongdongnan Basin commonly are paleo-uplifts surrounded by hydrocarbon-rich sag (Figure 1a), where there is an effective low potential zone for hydrocarbon supply and lateral migration [16]. They usually have favorable geological conditions for hydrocarbon migration and accumulation. In the Cenozoic, the Qiongdongnan Basin developed a set of lacustrine, marine-terrigenous, and marine deposits. From bottom to top, the Cenozoic is composed of the Eocene, Oligocene Yacheng Formation and Lingshui Formation, Miocene Sanya Miocene Formation, Meishan Formation, Huangliu Formation, Pliocene Yinggehai Formation, and Pleistocene Ledong Formation (Figure 1c). The Yacheng Formation is a major source of rock strata, the intrusive rock buried-hill developed in the structural high is one of the reservoir strata, and regional Cenozoic thick marine mudstone overlies these strata. This forms a favorable source–reservoir–seal assemblage for gas accumulation in the area (Figure 1c) [22,23,24,25].
Songnan low uplift lies in the middle part of the central depression of the Qiongdongnan basin with irregular boundary, E-W strike, around 3000 km2 [26] (Figure 1a). Songnan low uplift is characterized by multi-sag hydrocarbon supply, sufficient hydrocarbon supply, and buried-hill traps (which occur in groups due to locations in the sag transition zone, i.e., one of the favorable zones for medium to large gas field) [26,27,28]. The Y area, located in the eastern higher position of Songnan low uplift (Figure 1a), includes a series of buried-hill traps, such as Y8 and Y1. In 2019, there was a major breakthrough in gas exploration in the Mesozoic granite buried hill in the Songnan low uplift, and over 1 million m3 of industrial gas flow per day has been obtained from the Well Y831 [29]. The estimation of oil and gas resources shows that buried hill in the Y area has great exploration potential, and the gas reserve may exceed 100 billion m3 [6].

3. Data, Basic Models, and Methods for Reservoir Interpretation with Mud-Logging Data

3.1. Primary Materials

There are six wells which reached the intrusive rock buried-hill in the Y area of the Qiongdongnan Basin, including Well Y811, Well Y812, Well Y831, Well Y832, Well Y1311, and Well 711 (Figure 1b). Among them, Well 711 only reached the intrusive rock buried-hill at 16 m and without reservoir interpretation with well-logging data. This study was based on geological data, drilling data, mud-logging data, and well-logging data (covering five wells except for Well 711). Based on core, sidewall core, cutting, and thin section observation, the main rock types of intrusive rock buried-hill were identified. The drilling data and mud-logging data include ROP, weight on bit (WOB), revolutions per minute (RPM), diameter of rock bit (Dia), and X-ray diffraction (XRD) data, while drilling and element logging data were used for vertical zonation and reservoir interpretation in the intrusive rock buried-hill. Furthermore, the results of reservoir interpretation with mud-logging data can be verified using the well-logging data.

3.2. Mechanical Specific Energy (MSE) Model and Mechanical Specific Energy Ratio (Kb) Model

3.2.1. Mechanical Specific Energy (MSE) Model

MSE is the mechanical energy consumed by WOB and TOR (torque) for breaking rocks of per unit volume in per unit time [30]. The MSE model was proposed by Teale in 1965 [30], and was modified by Rabia [31], Pessier and Fear [32], Dupriest and Koederitz [33], Armenta [34], Mohan et al. [35], Rafatian et al. [36], Cherif [37], Azike-Akubue et al. [38], and Fan et al. [39] from different angles.
The bit torque, one of the key parameters in Teale’s model, is hard to acquire through ground facilities. However, the bit torque is no longer needed in Fan’s model (Equation (1)). All the parameters in Fan’s model are routine parameters recorded on the ground with drilling and mud-logging. The Fan’s model is widely used in the drilling industry for its higher computational accuracy. In this study, the Fan’s model is also used to calculate the MSE of intrusive rock buried-hill for each well.
M SE = 4 × W O B D i a 2 × π + 2.91 × W O B × R P M D i a × R O P
where MSE is the mechanical specific energy, MPa; WOB is the weight on bit, kN; RPM is the revolutions per minute, r/min; ROP is the rate of penetration, m/h; Dia is the diameter of rock bit, mm.

3.2.2. Mechanical Specific Energy Ratio (Kb) Model

The mechanical specific energy ratio (Kb) is the ratio of MSE to the basic value of correspondence depth (Equation (2)).
K b = M SE E n
where Kb is the mechanical specific energy ratio, dimensionless; MSE is the mechanical specific energy, MPa; En is the basic value of MSE, MPa.

3.3. Vertical Power (WH) Model and Tangential Power (WL) Model

During the drill bit breaking rock process, the rock is fractured due to the effect of weight on the drill bit, and then the cracks propagate due to the effect of torque, before the rock is then finally cut [40]. Further analysis shows that the MSE model consists of vertical power (WH) and tangential power (WL) [11]. WH is perpendicular to the drill bit cross section and can be calculated by Equation (3); WL is parallel to the drill bit cross section and can be calculated by Equation (4).
W H = 4 × W O B D i a 2 × π
W L = 2.91 × W O B × R P M D i a × R O P
where WH is the vertical power, MPa; WL is the tangential power, MPa; WOB is the weight on the drill bit, kN; RPM is the revolutions per minute, r/min; ROP is the rate of penetration, m/h; Dia is the diameter of rock bit, mm.

3.4. Basic Methods for Reservoir Interpretation with Mud-Logging Data

The essence of break rocks using the drill bit uses rocks by consumption of mechanical energy. Moreover, the work carried out by the drill bit is constrained by the rock strength, which is largely affected by the porosity and density of rocks. Therefore, it is possible to identify the layers of reservoir based on the mud-logging data. At present, the Kb method and the WL-WH intersection method are two kinds of reservoir interpretation methods which can confirm each other while drilling.
Previous studies have shown that smaller MSE will develop more fractures and pores [11]. However, the accuracy of calculated MSE is low due to the rock strength, bit types, drilling engineering parameters, borehole circumstance, and other factors in different rocks [12]. Although the same rocks are broken, the calculated MSE may be different. Practices indicate that the reservoir properties can only be qualitatively evaluated by MSE, while the reservoir properties can be qualitatively evaluated by Kb [11,12]. The Kb is the ratio of MSE to the basic value of correspondence depth; the smaller Kb means the reservoir properties is better. Usually, the layers can be interpreted as the reservoir where Kb < 1. In addition, the Kb is also conducive to horizontal and longitudinal reservoir comparison.
As previously mentioned, the MSE model consists of WH and WL when the rock is broken by the drill bit. In the poor reservoir properties layers, the curves of WH and WL tend to coincide with each other in the column, while in the favorable reservoir property layers, a dramatic decrease in WL compared to WH can change the intersection area between the curves. Furthermore, a larger intersection area means the reservoir properties is better [12].

4. Main Rock Types and Vertical Zonation of the Intrusive Rock Buried-Hill

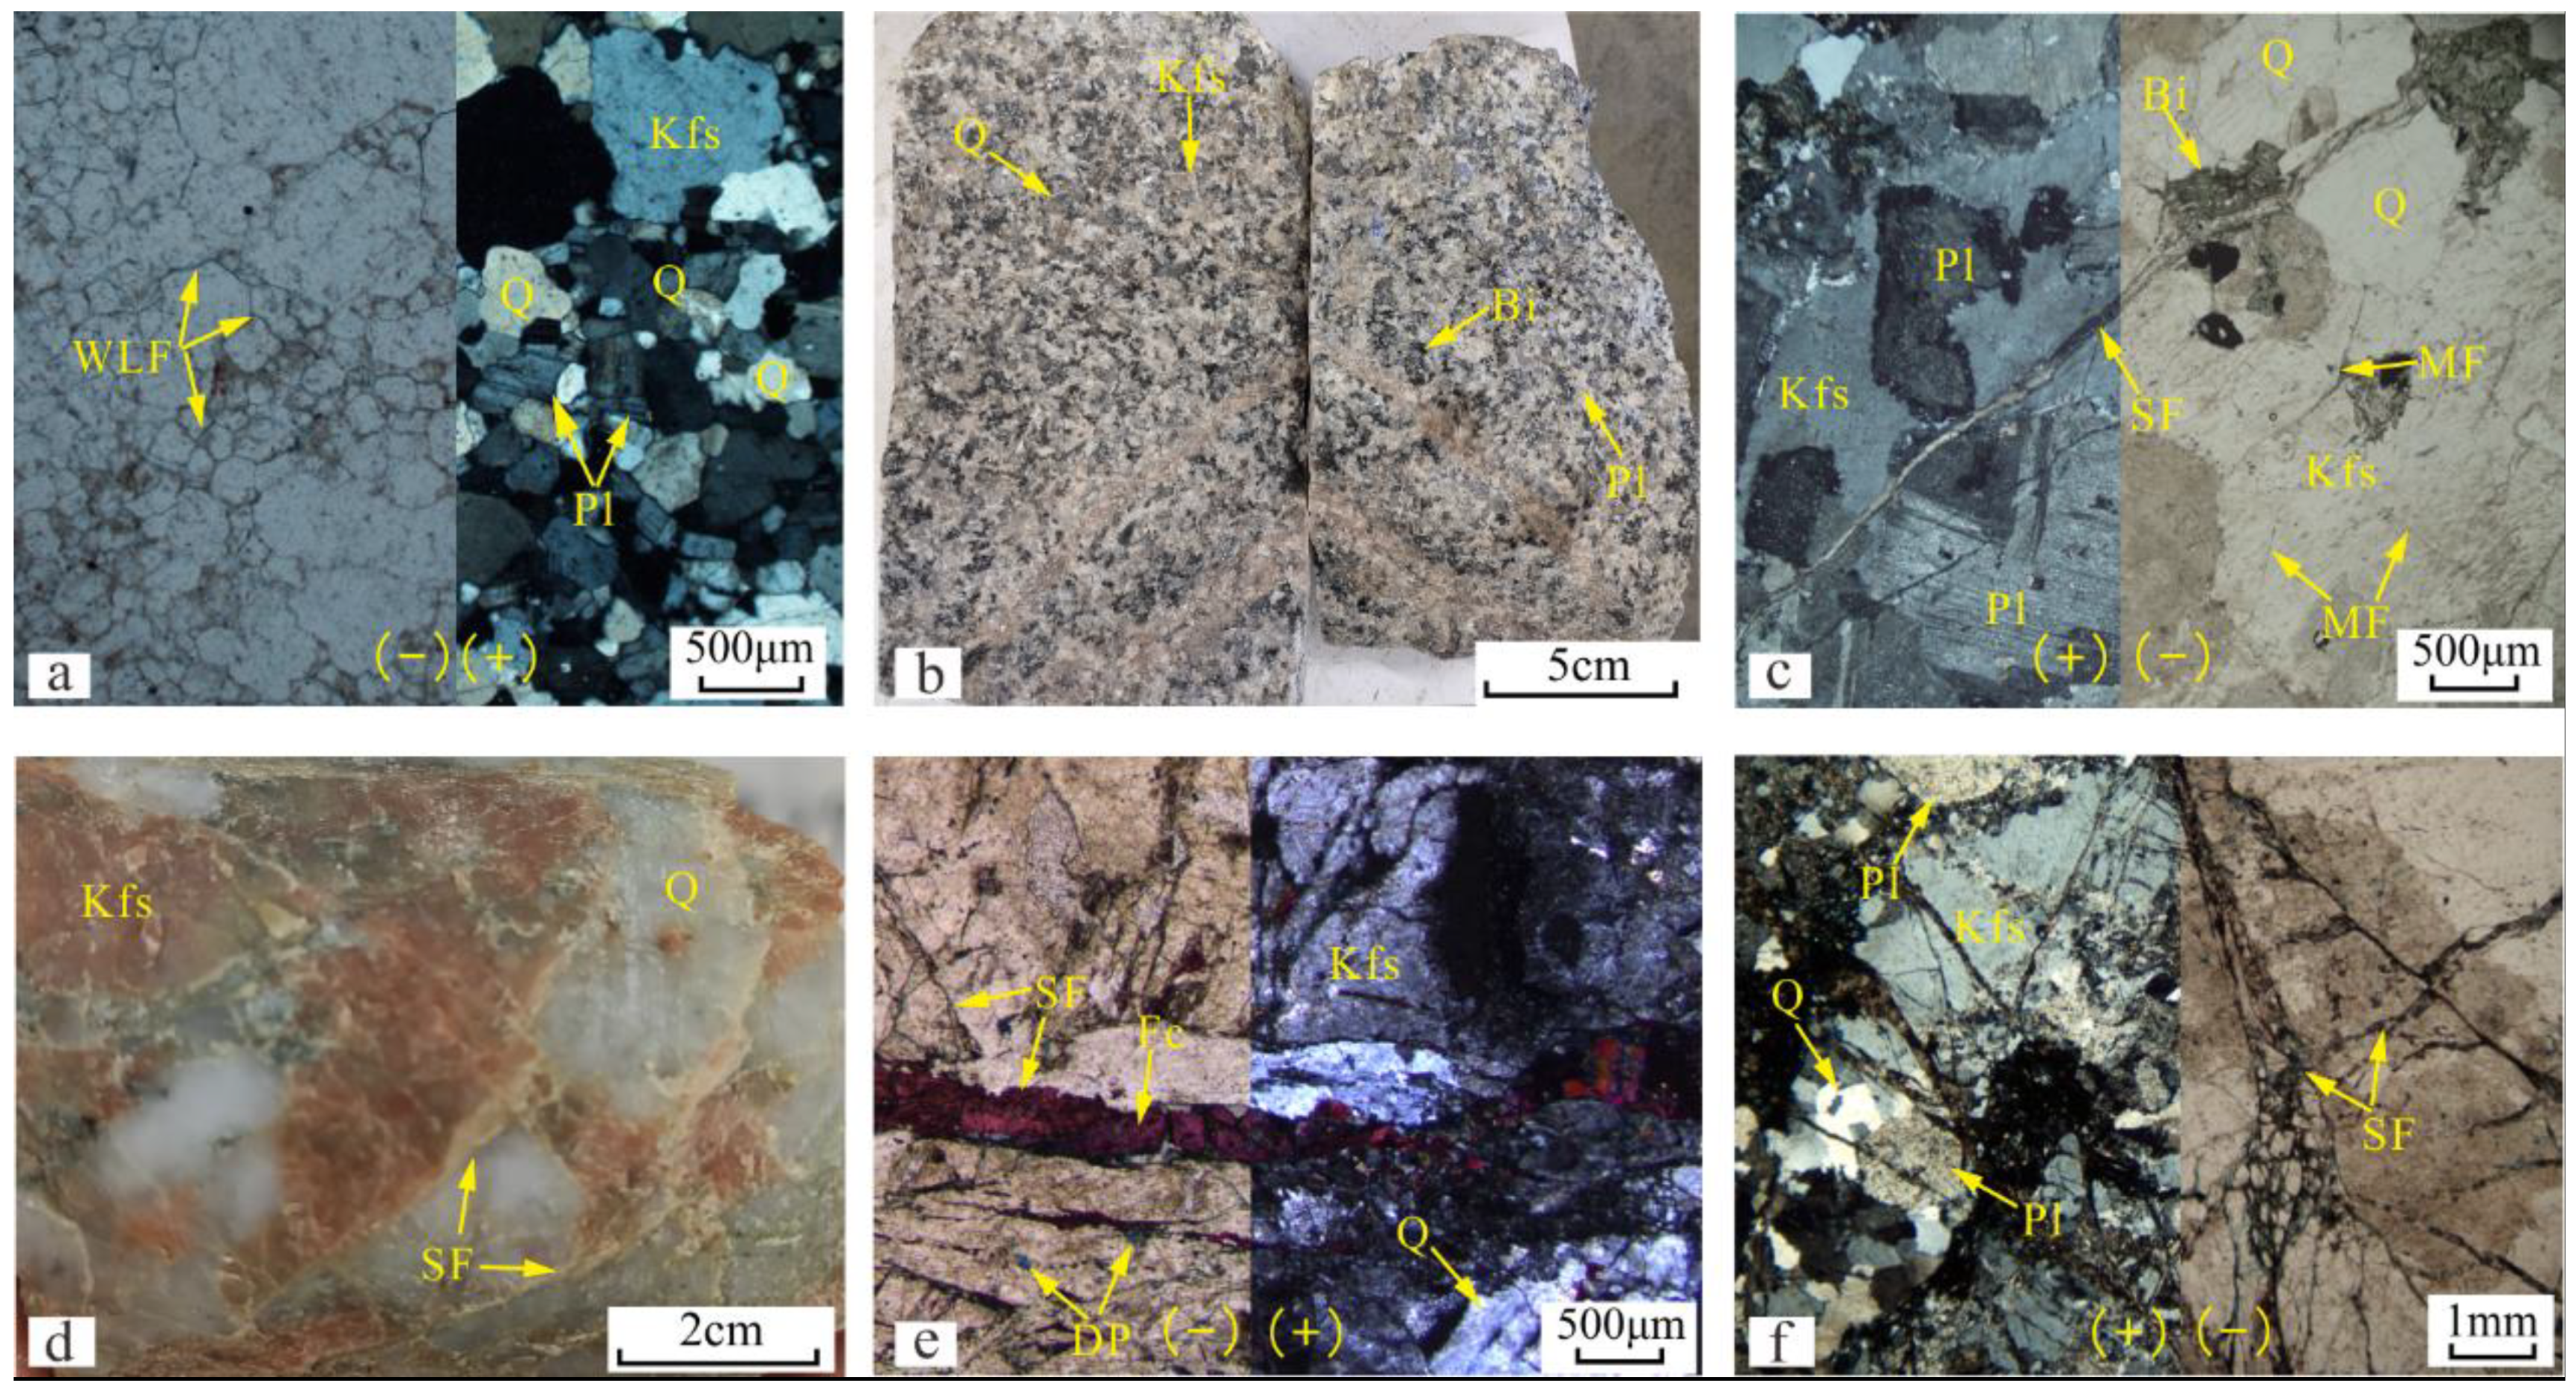
4.1. Main Rock Types and Reservoir Space Types

The buried hill in the Y area of the Qiongdongnan Basin mainly consists of acidic intrusive rocks, and dynamic metamorphic rocks are also identified locally. Research suggests that the buried hill is dominated by monzonitic granite (Figure 2a–c), followed by syenite granite (Figure 2d,e). Dynamic metamorphic rocks (cataclastic rocks), mainly found in Well Y811, are located in the fracture zone controlled by two faults (Figure 3). In addition, the protolith of these cataclastic rocks is monzonitic granite (Figure 2f). The fracture–pore reservoirs of the intrusive rock buried-hill in the study area are mainly controlled by vertical zonation, the mineral composition of rocks, structural positions, and so on. The reservoir spaces of fracture reservoirs include weathering and leaching fractures (Figure 2a), structural fractures (Figure 2c–f), and micro fractures (Figure 2c). However, the reservoir spaces of pore reservoirs include feldspar dissolution pores (Figure 2e) and a small number of carbonate dissolution pores. The weathering and leaching fractures develop on the top of the intrusive rock buried-hill; however, with an increase in depth, the structural fractures, micro fractures, and dissolution pores are likely to decrease.

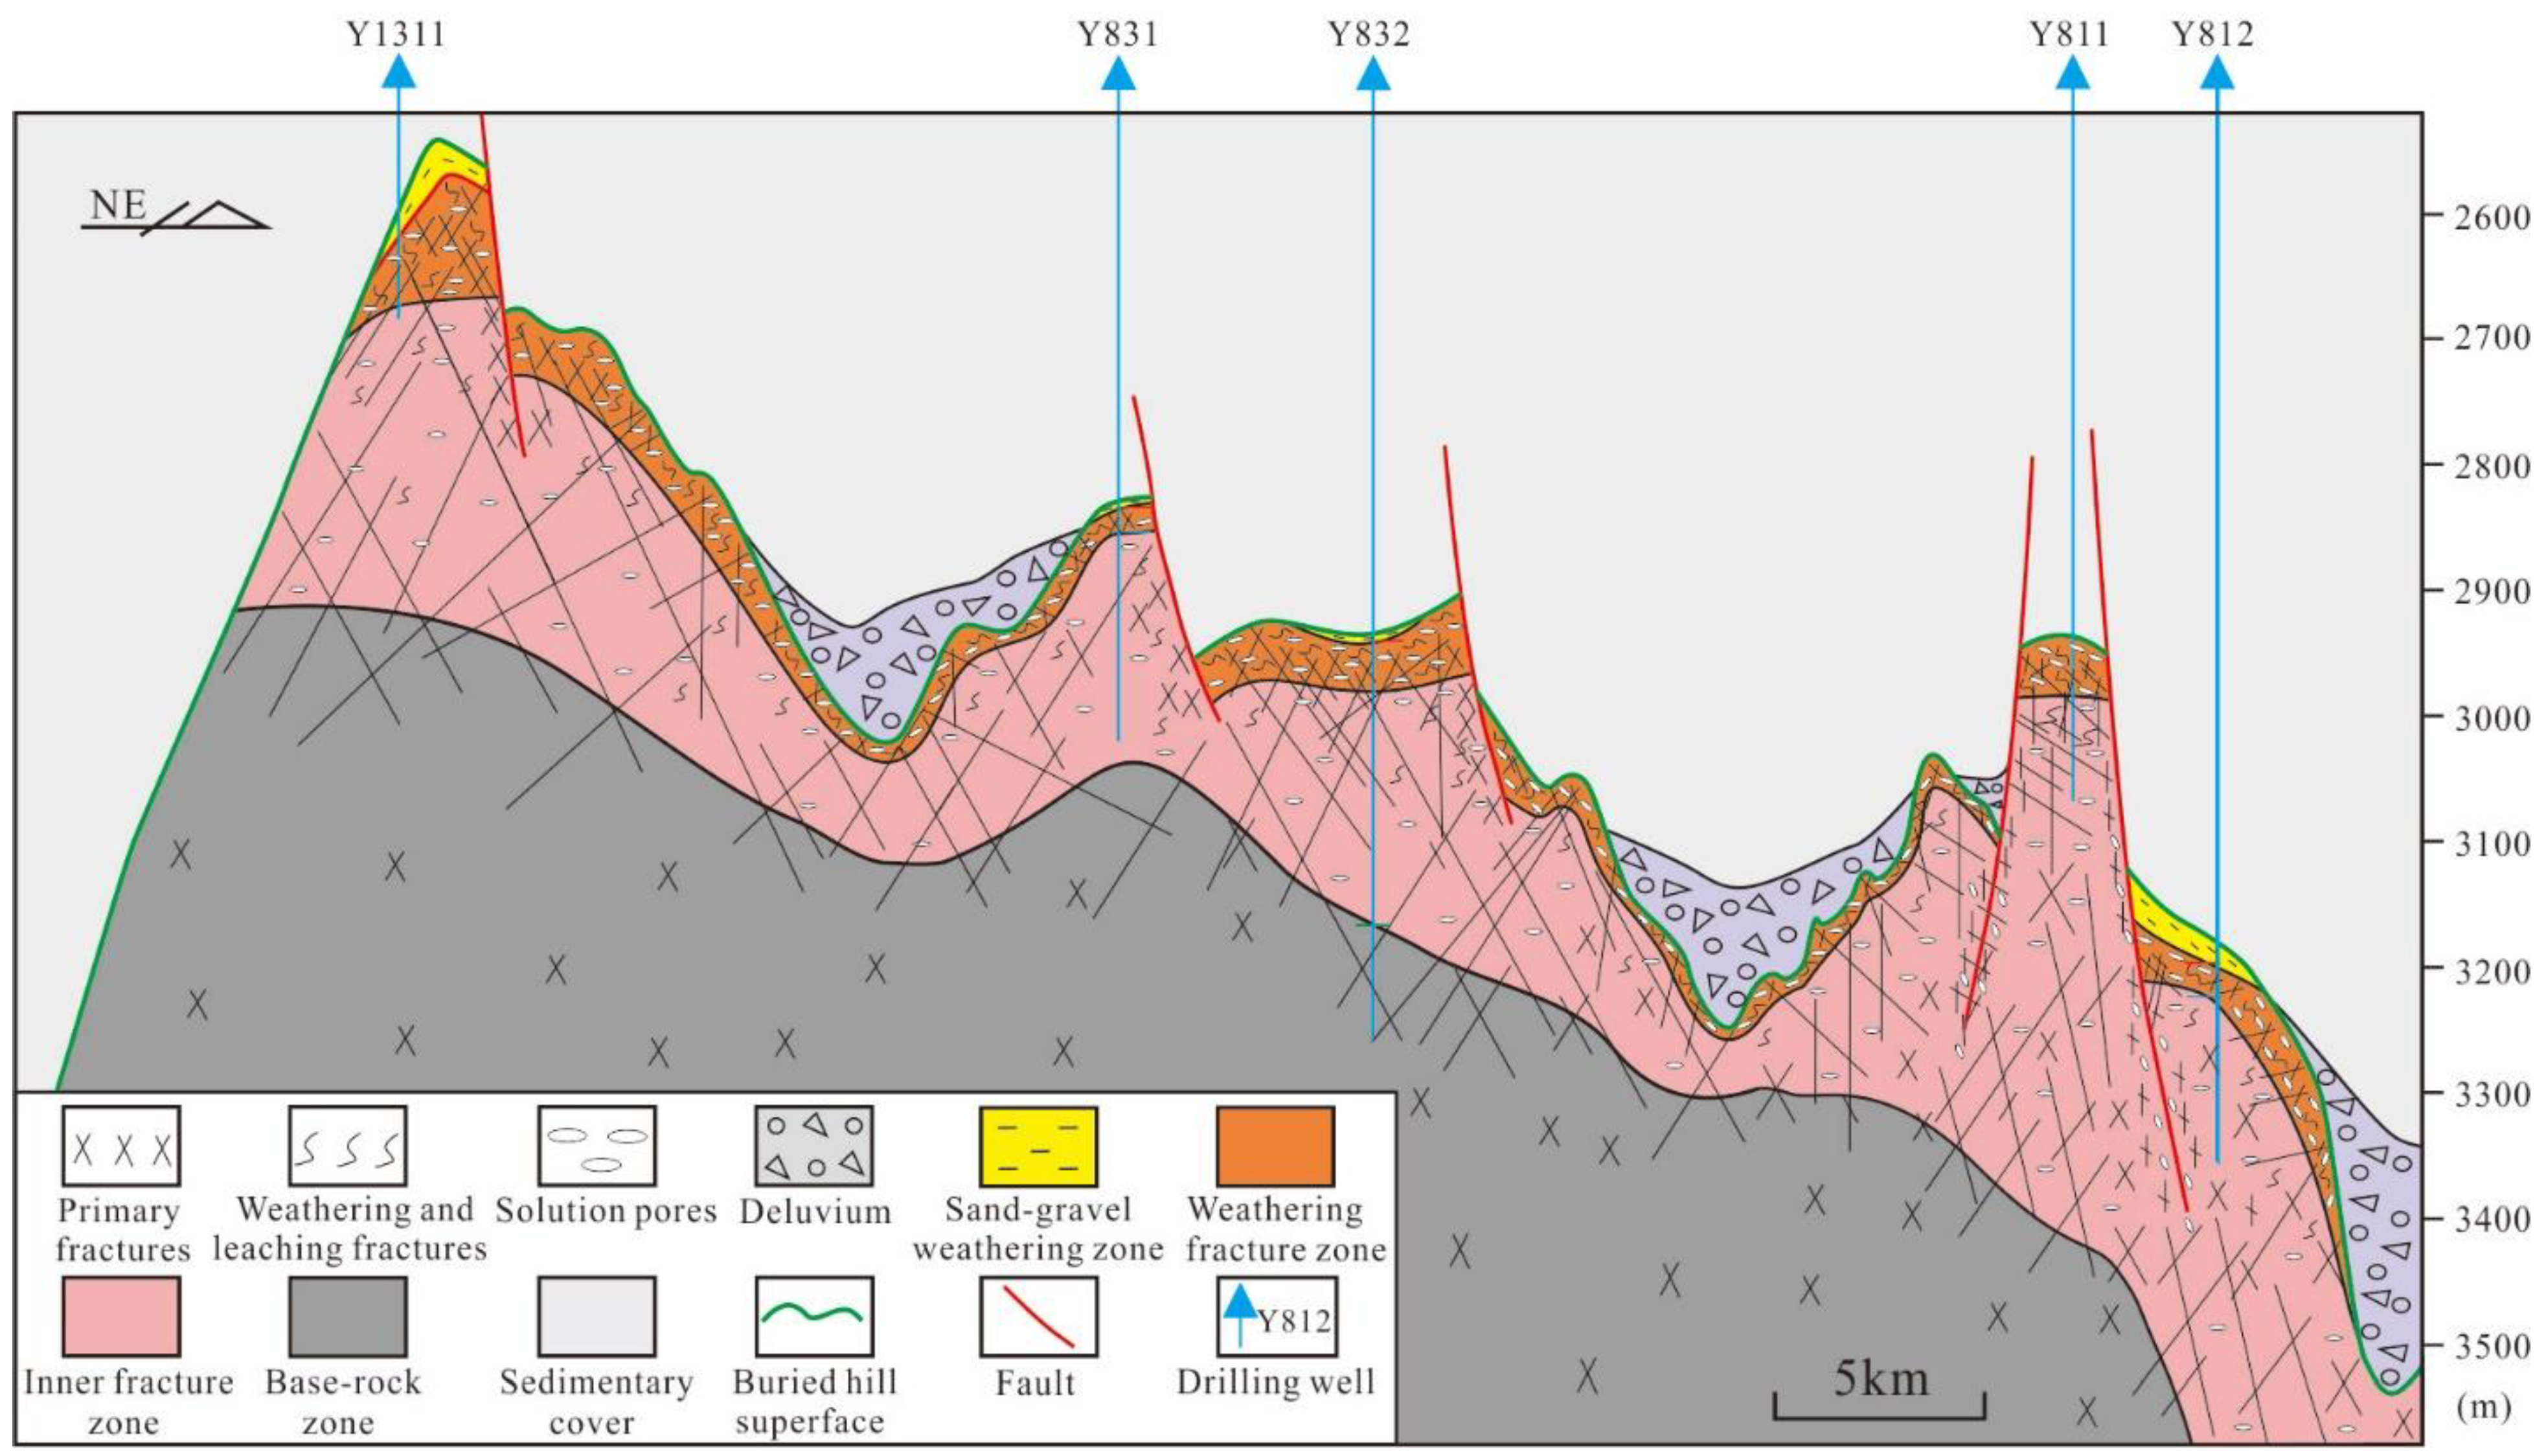
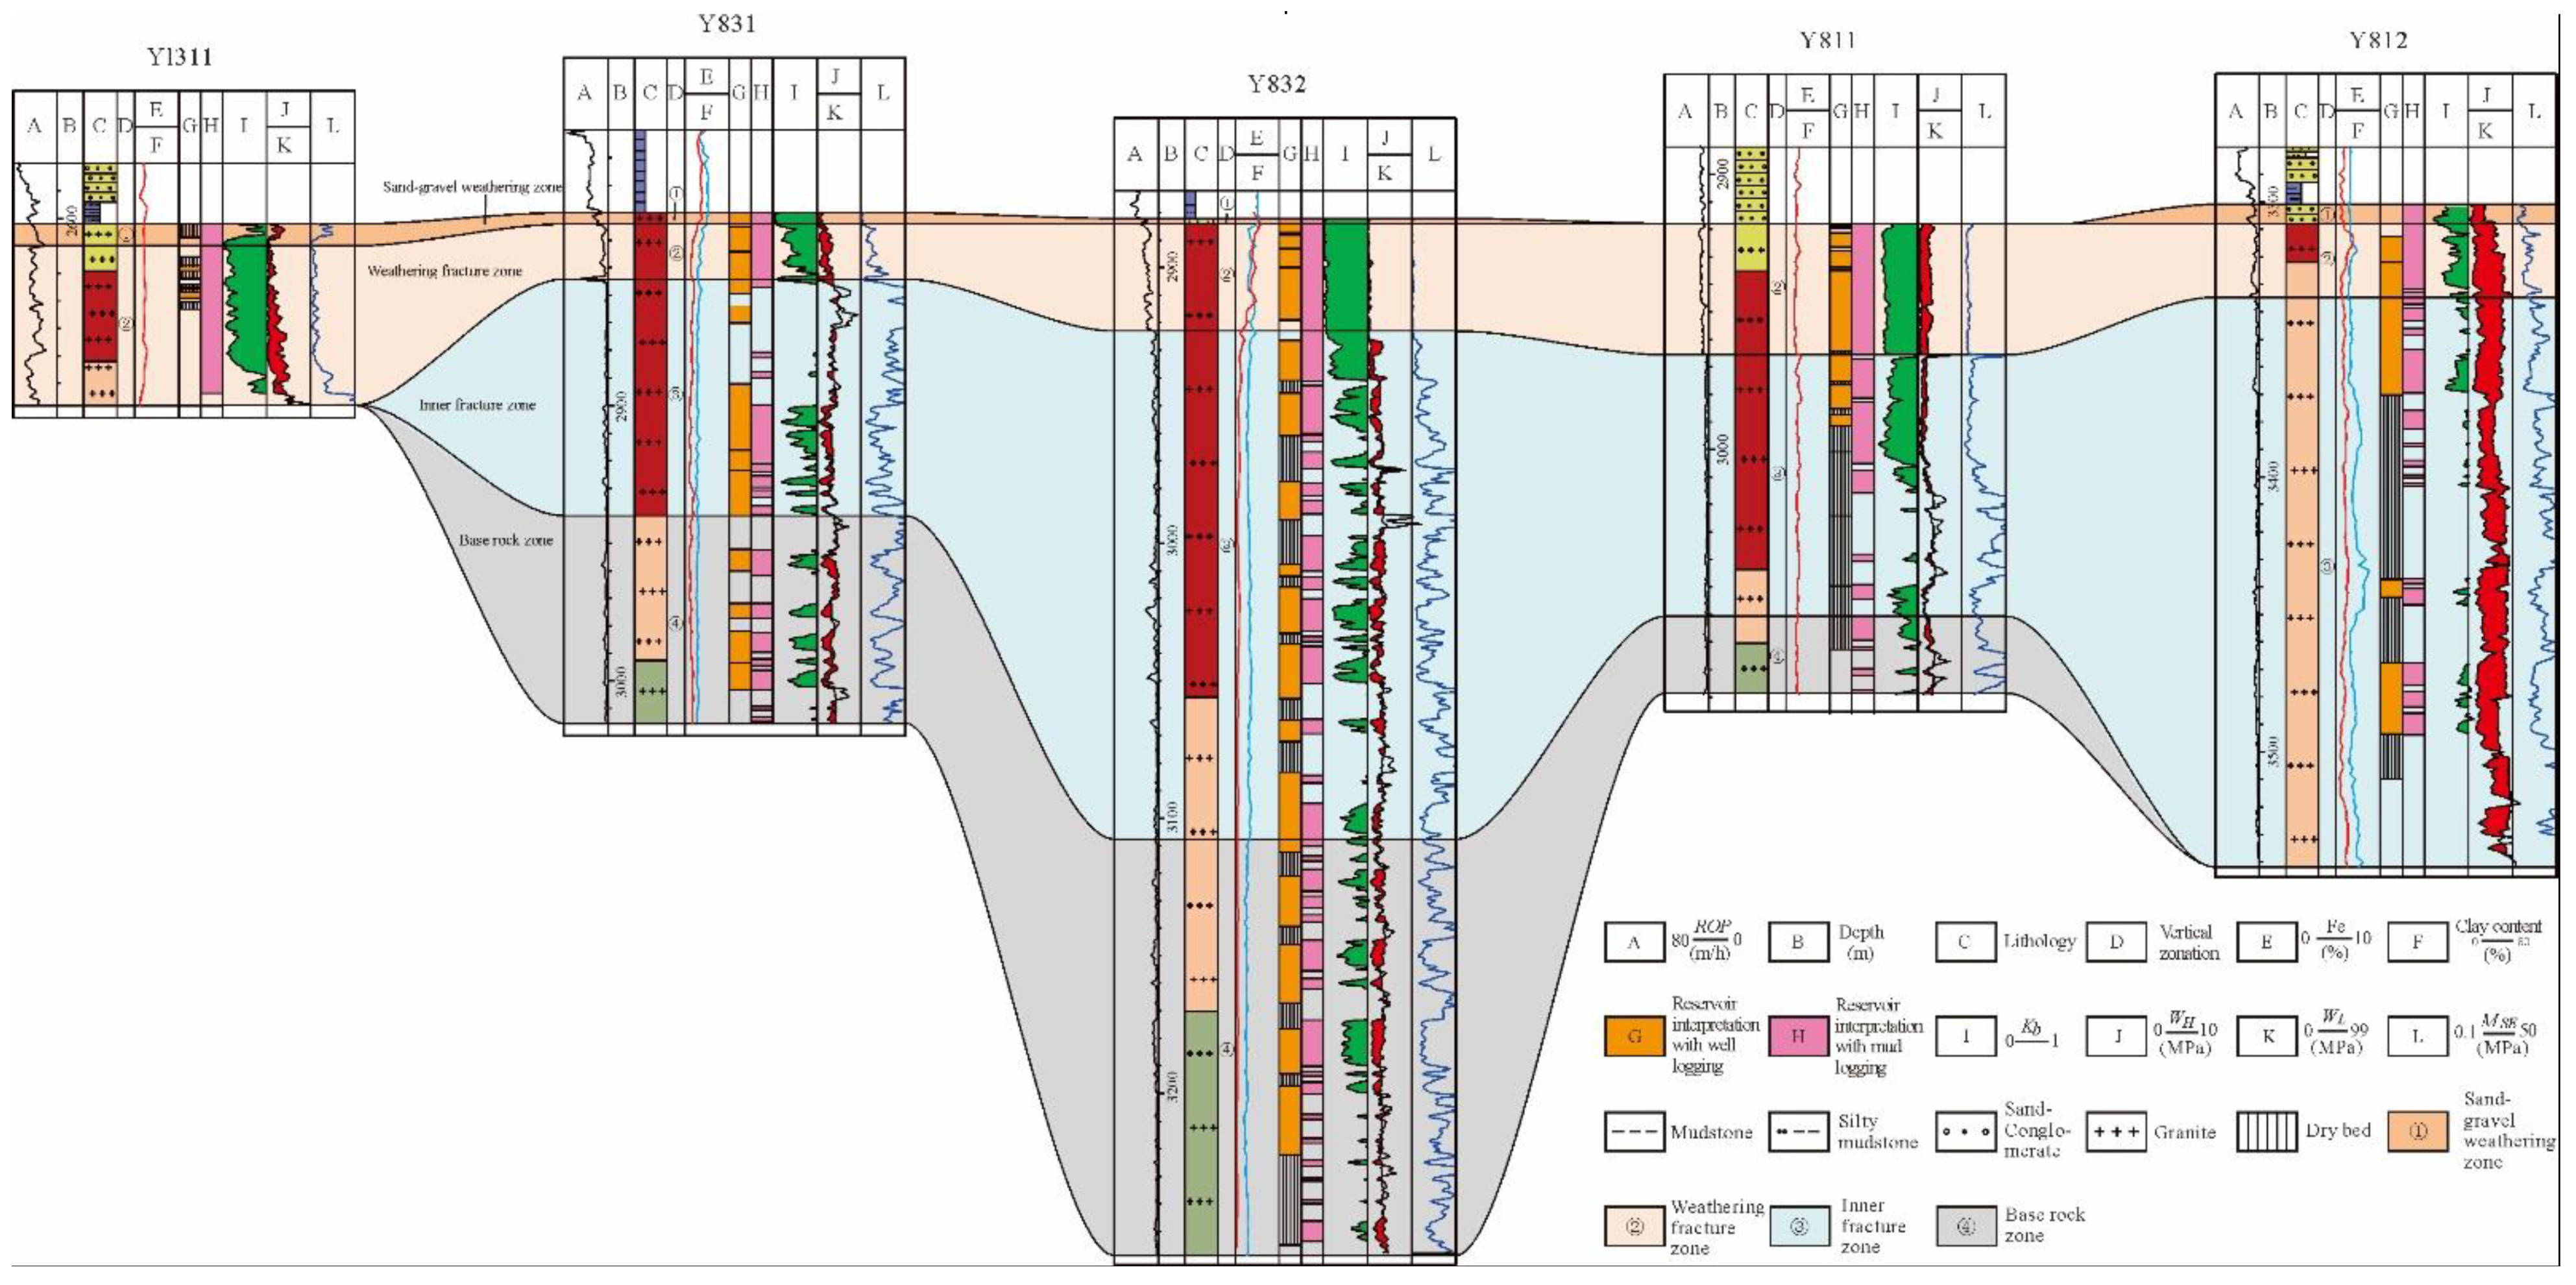
4.2. Vertical Zonation of the Intrusive Rock Buried-Hill

The intrusive rocks are hard and compact, and the intrusive rock buried-hills are characterized by vertical zonation after long-term weathering and denudation. There are three kinds of vertical zonation models for the intrusive rock buried-hills: three zone models [41,42], four zone models [43], and five zone models [5]. According to the results of previous studies, and taking into account characteristics of buried-hill rock in the study area and the accuracy of vertical zonation while drilling, the intrusive rock buried-hill can be divided into four zones in descending order: the sand–gravel weathering zone, the weathering fracture zone, the inner fracture zone, and the base rock zone (Figure 3).

4.2.1. Sand–Gravel Weathering Zone

The sand–gravel weathering zone is located at the top of the intrusive rock buried-hill, and the lithology is sand–conglomerate or granite, based on the mud-logging data. A thin soil layer may be developed on the top of sand–gravel weathering zone, but it is hard to distinguish with mudstone. Because of the inheritance of palaeogeomorphic highs, this zone in the study area is developed in the structural high part and suffers from long-term weathering (Figure 3). The thickness of the sand–gravel weathering zone is generally thin, and ranges from 0 to 10 m (Figure 4 and Figure 5). The sand–gravel weathering zone can be confirmed by three discriminant conditions: sand–conglomerate, a thickness of less than 10 m, and an ROP that is dramatically higher than that of the underlying zone. On the other hand, a set of thick sand–conglomerate which develops and covers the intrusive rocks is the product of transportation and accumulation. Therefore, those thick sand–conglomerate is not belong to the sand–conglomerate zone, e.g., Well Y811 (Figure 5). Furthermore, when the intrusive rocks is covered by mudstone, the sand–gravel weathering zone can be split out from the intrusive rocks according to a dramatically change in the column’s ROP curve, e.g., Well Y831 and Well Y1311. If not, this zone can end up being badly preserved (Figure 4 and Figure 5).

4.2.2. Weathering Fracture Zone

The lithology of the weathering fracture zone is granite based on the mud-logging data. Compared to the sand–gravel weathering zone, the rock of this zone is relatively hard, retaining the original features of intrusive rocks. Weathering and leaching fractures and dissolution pores are well developed in this zone for long-term weathering (Figure 2a). Rock drillability (ROP) is lower in the sand–gravel weathering zone, though it is dramatically higher in the inner fracture zone (Figure 4 and Figure 5). In addition, the feldspar of intrusive rocks turned into clay minerals for long-term weathering, and the clay content of this zone is usually greater than 15%, which is much higher than in the inner fracture zone (Figure 4 and Figure 5).

4.2.3. Inner Fracture Zone

The lithology of the inner fracture zone, based on the mud-logging data, is granite, and multi-phase structural fractures are developed (Figure 2c–f). Vertically, with the increase in depth, the density of structural fractures decreases gradually, while being enriched locally in some layers. The rock of this zone is harder than that of the weathering fracture zone, and the rock drillability (ROP) is lower. With the increase in depth, the ROP decreases gradually and increases locally, corresponding to the fracture-enriched layers. The clay content of this zone is dramatically lower than in the weathering fracture zone, which shows relatively weaker weathering. However, the clay content and its curve in column are slightly higher than in the base rock zone. In addition, the fractures are usually filled with ferrocalcite, ankerite, and so on (Figure 2e). The Fe content and its curve in the column are also higher than the base rock zone too (Figure 4 and Figure 5).

4.2.4. Base Rock Zone

The lithology of the base rock zone is fresh granite based on mud-logging data, and some structural fractures are also developed (Figure 2c–f). The ROP, clay content, and Fe content of the base rock zone are lower than in the inner fracture zone, and their curves in column are smooth and straight (Figure 4 and Figure 5).

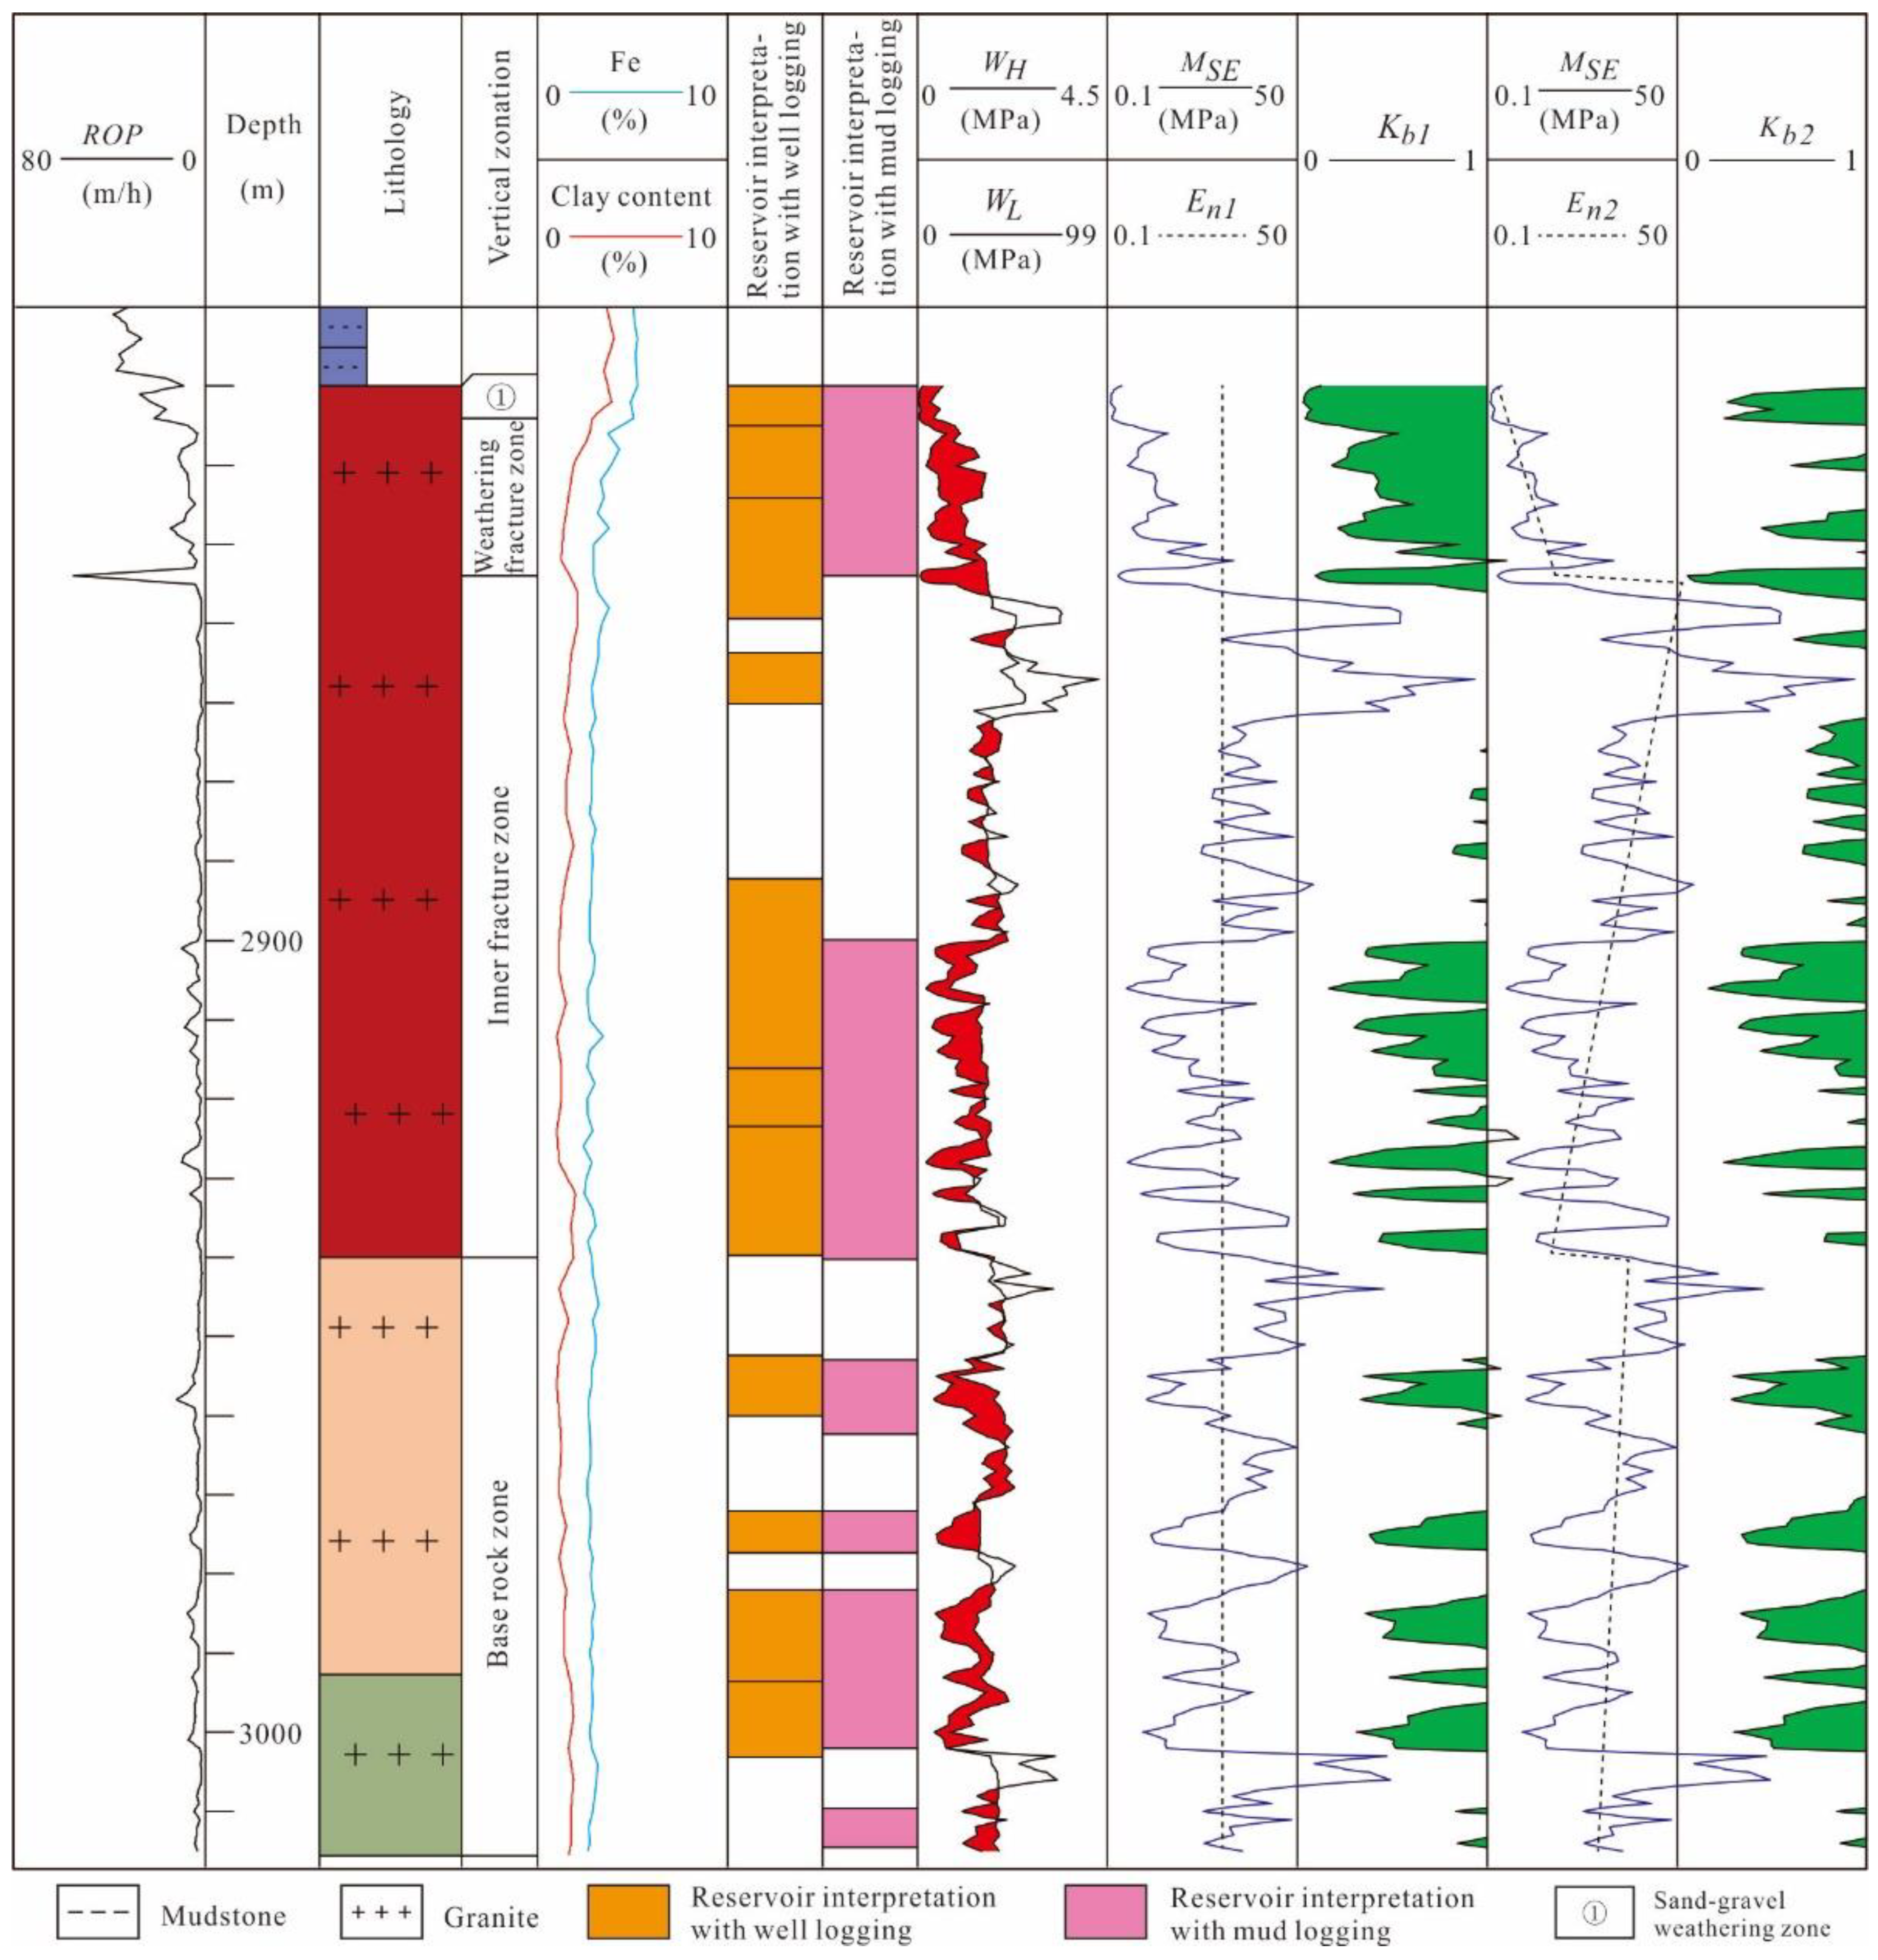
5. Method Modification and Results of Reservoir Interpretation with Mud-Logging Data

The reservoir of homogeneity rocks is well interpreted by the Kb method and the WL and WH intersection method [11,12]. Compared with the homogeneity rocks, the mechanical properties of the intrusive rock buried-hill can vary vertically. Therefore, in order to interpret the reservoir effectively, these two kinds of methods need to be modified based on the characteristics and genesis of intrusive rock buried-hill.

5.1. Reservoir Interpretation with Kb

The key point of reservoir interpretation with Kb is to confirm the basic value (En) which is used to calculate Kb in Equation (2). There are two kinds of methods used to calculate the basic value for Kb: taking the rock strength value calculated by well-logging data or the est data of core as En [44], or using the MSE trend line fitting to calculate the En of the correspondence depth [10,12]. The rock strength value can be calculated by the relationship of linear correlation between the acoustic logging data and the rock uniaxial compressive strength [45]. However, this method is not applicable to the intrusive rock buried-hill in the Y area due to the lack of mechanical rock parameters. The linear correlation of MSE to depth is the only way to confirm the En in the study area, which includes piecewise fitting and whole-well length fitting of the intrusive rock buried-hill: firstly, a linear, log linear, exponent function, or power function model is used to establish the relationship between MSE and correspondence depth, and the En is calculated using the best fitness model.
We tried to confirm the En in the study area by piecewise fitting and whole-well length fitting. As the sand–gravel weathering zone is very thin (<10 m), we assembled it with the weathering fracture zone while piecewise fitting. The piecewise fitting results of the sand–gravel weathering zone and the weathering fracture zone indicate that the reservoir could not be well interpreted, e.g., En2 and Kb2, as shown in Figure 4. On the other hand, the whole-well length fitting of the intrusive rock buried-hill results indicate that the correlation between MSE and depth is very poor, e.g., the maximum of R2 is 0.08 in Well Y831, and the reservoir could not be well interpreted in Well Y812. Therefore, a new method is needed to calculate the En for Kb to interpret the reservoir with mud-logging data for intrusive rock buried-hill.
In order to find the new method to calculate the En for Kb, the formation mechanism and process of intrusive rock buried-hill were analyzed. It is shown that the base rock zone is the most complete and minimally damaged zone, the inner fracture zone is the product of fault modification and weak weathering, and the sand–gravel weathering zone and weathering fracture zone are the products of strong weathering and leaching. Therefore, the MSE geometrical mean of the base rock zone could be taken as the basic value of the whole intrusive rock buried-hill, e.g., En1, presented in Figure 4. The results show that the reservoir can be well interpreted when taking the MSE geometrical mean of the base rock zone as a basic value to calculate Kb. The layers of reservoir interpretation with well-logging data mainly correspond to the layers in association with Kb < 1 (Kb1 in Figure 4 and Figure 5). If the well (e.g., Well Y812) does not reach the intrusive rock buried-hill, the En of the closest well (e.g., Well Y811) can be used to calculate its Kb.

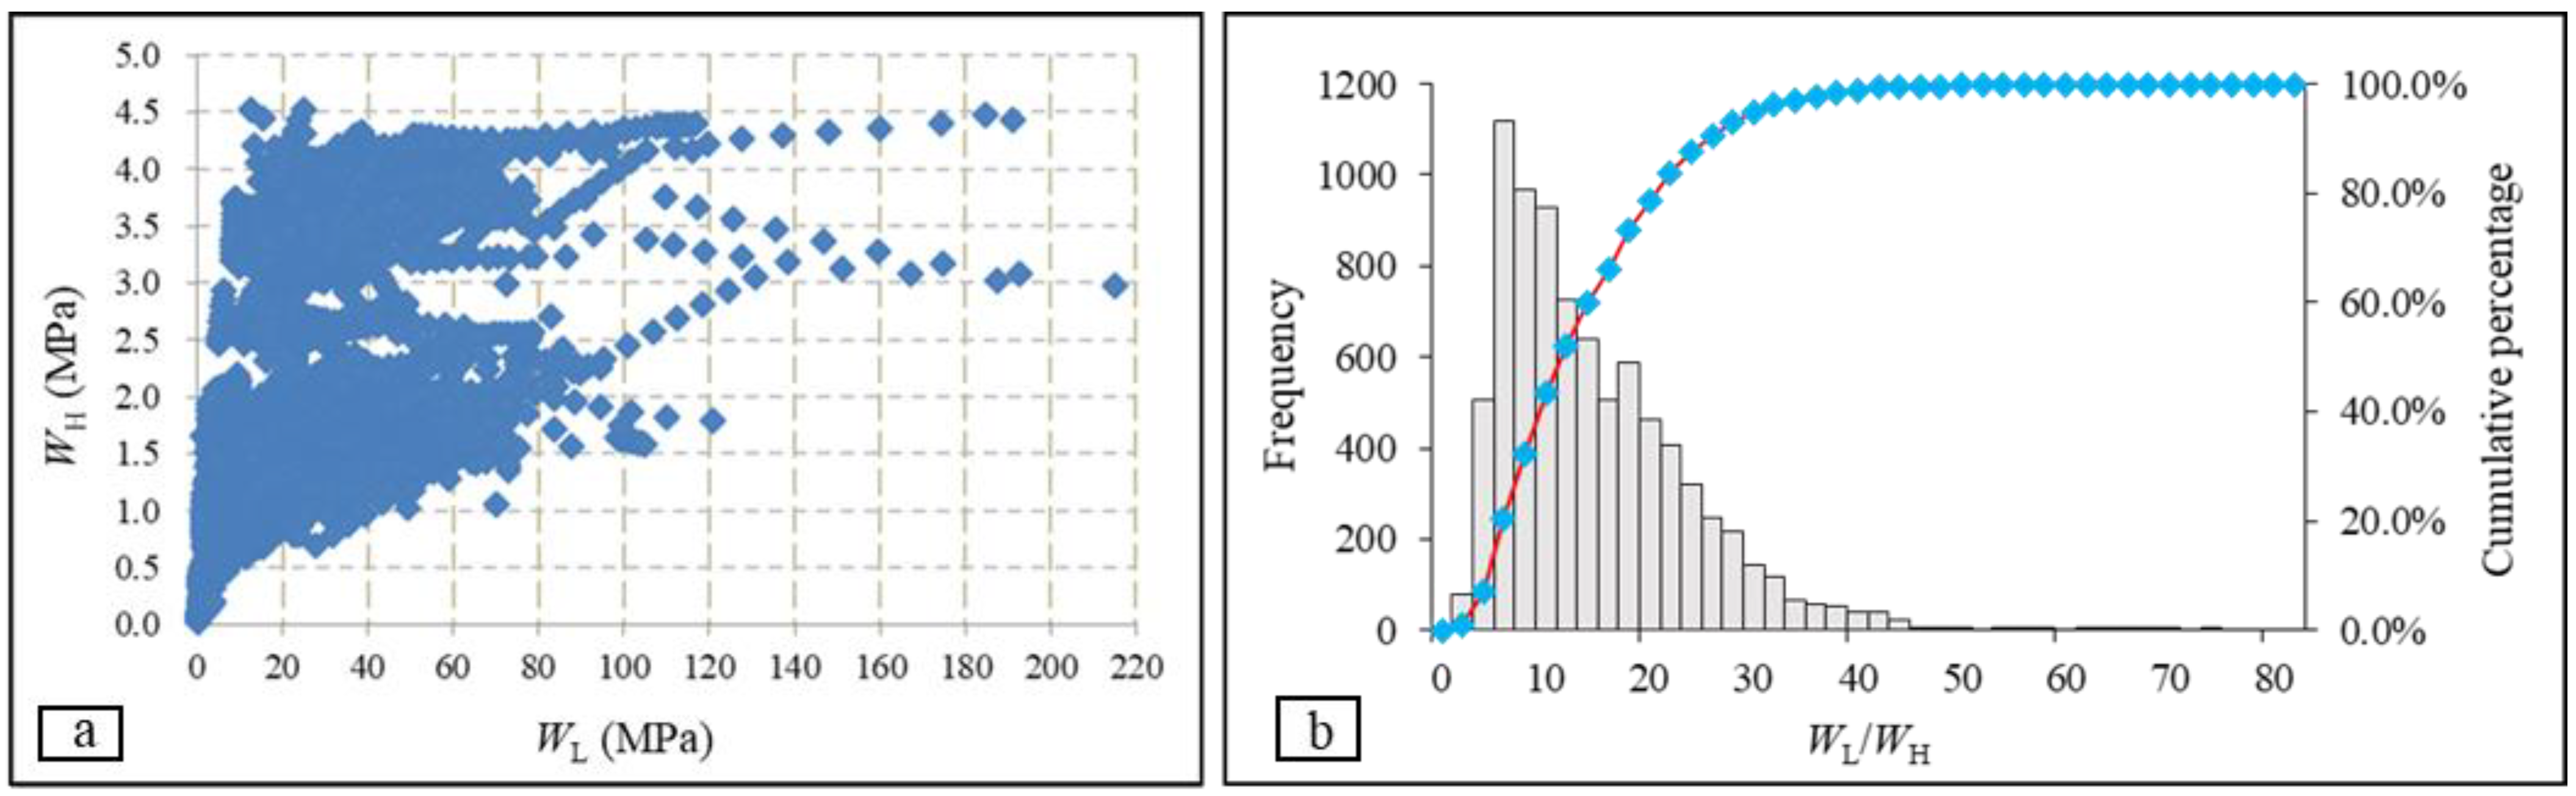
5.2. Reservoir Interpretation with WL-WH Intersection

The reservoir can be easily interpreted using the intersection results of WH and WL curves in the column. Most importantly, the WH and WL needed to break the rocks while drilling can vary in different rock types and reservoir types. Therefore, the optimal numerical ranges of WL and WH while intersecting is the key point for reservoir interpretation. Taking the volcanic rocks and pyroclastic rocks in the Di’nan area of the Junggar Basin as examples, the reservoir can be well interpreted when WH and WL both range from 0 to 10 MPa in the column while intersecting [12]. However, compared with the homogeneity rocks in the Di’nan area, the rock mechanical properties of intrusive rock buried-hill in the Y area of the Qiongdongnan Basin are vertically variable. The results show that the reservoir could not be well interpreted for buried-hill rock in the Y area based on the Di’nan area while intersecting.
In order to confirm the optimal numerical ranges of WL and WH while intersecting, the WL and WH of six wells of buried hill in the Y area were analyzed. The WH-WL scatter plot shows that the WH and WL should start from 0 Mpa while intersecting, and the maximum of WH is 4.5 Mpa (Figure 6a). If the WH ranges from 0 to 4.5 Mpa in the column, all of the data could be covered while intersecting (Figure 6a). Moreover, the WH/WL ratio frequency curve shows that 22 is the inflexion of the curve (round-off number) (Figure 6b). Obviously, 22 times that of 4.5 Mpa is 99 Mpa. Furthermore, most of the data will be covered when WH ranges from 0 to 4.5 Mpa and WL ranges from 0 to 99 Mpa (Figure 6a). More importantly, the research results show that the reservoir can be well interpreted when WH ranges from 0 to 4.5 Mpa and WL ranges from 0 to 99 Mpa in the column while intersecting (Figure 4 and Figure 5).

5.3. Reservoir Interpretation and Verification

5.3.1. Reservoir Interpretation with Mud-logging Data

The Kb method and the WL-WH intersection method are two kinds of reliable reservoir interpretation methods. In order to find the accurate layers of reservoir, these two kinds of methods should confirm each other when interpreting. There are four kinds of combinations: (i) the layers could be interpreted as a reservoir by both methods; (ii) the layers could be interpreted as a reservoir by one of the methods and (iii) the layers could not be interpreted as a reservoir by both methods. Undoubtedly, the results of reservoir interpretation with mud-logging data must be verified by the well-logging data. The results show that, by combining the Kb method with the WL-WH intersection method, the reservoir of intrusive rock buried-hill can be well interpreted. The layers can be interpreted as a reservoir showing Kb < 1 in the sand–gravel weathering zone and the weathering fracture zone. Moreover, the intersection of Kb < 1 and WL-WH layers could be interpreted as a reservoir in the inner fracture zone and the base rock zone (Figure 4 and Figure 5).

5.3.2. Reservoir Verification with Well-Logging Data

In order to verify the results of reservoir interpretation with mud-logging data, the reservoir thickness ratio and the total thickness ratio of uninterpretable reservoir are used to evaluate the accuracy. The reservoir thickness ratio is the ratio of the total thickness of reservoir interpretation with mud-logging data (TTR-IML) to the total thickness of reservoir interpretation with well-logging data (TTR-IWL), abbreviated to TTR-IML/TTR-IWL (Equation (5)). The total thickness ratio of the uninterpretable reservoir is the ratio of the total thickness of reservoir which is not interpreted with mud-logging data (TTR-NIML) to TTR-IWL, abbreviated to TTR-NIML/TTR-IWL (Equation (6)). The thickness of each single layer interpreted by well-logging data is H1, H2 …… Hn in descending order. The thickness of each single layer interpreted by mud-logging data is h1, h2 …… hn in descending order.
TTR-IML/TTR-IWL = (h1 + h2 + …… + hn)/(H1 + H2 + …… + Hn)
TTR-NIML/TTR-IWL = (TTR-NIML)/(H1 + H2 + …… + Hn)
Every single effective reservoir interpretation column directly and qualitatively shows that the results of reservoir interpretation with mud-logging data match well with the well-logging data (Figure 4 and Figure 5). Furthermore, the TTR-IML/TTR-IWL and TTR-NIML/TTR-IWL quantitatively shows that the reservoir interpreted by mud-logging data is reliable (Table 1). The range of TTR-IML/TTR-IWL for three wells (Well Y812, Well Y831, and Well Y832) is between 80% and 120%, while Well Y811 and Well Y1311 is 179% and 1255%, respectively (Table 1). The TTR-NIML/TTR-IWL of all the wells in the study area is less than 30% (Table 1). It should be pointed out that the well-logging porosity of Well Y811 3000.9–3024.2 m and 3049.6–3072.7 m is 7.5% and 7.8%, respectively, and the well-logging porosity of Well Y13111 2602.0–2630.3 m is 11.6–29.1%. Although those layers are not be interpreted as the reservoir based on well-logging data, the relatively high porosity and reservoir capacity of the layers show that they are easily drilled, corresponding to the results of reservoir interpretation with mud-logging data.

5.4. Distribution of Intrusive Rock Buried-Hill Reservoir in the Y Area

The characteristics and distribution of the intrusive rock buried-hill reservoir in the Y area are different, both longitudinally and horizontally. The thickness of the sand–gravel weathering zone reservoir is thin, and ranges from 0 to 10 m. While the reservoir condition of this zone is favorable, the thickness ratio of reservoir to strata for each well is 100.0% (Table 2). The thickness of the weathering fracture zone is usually more than 20 m. Moreover, the favorable reservoir for oil and gas can accumulate, while the thickness ratio of the reservoir to strata for each well is more than 90.0% (Table 2). The sand–gravel weathering zone and the weathering fracture zone is located at the top of the intrusive rock buried-hill, which is usually less than 50 m in total, while the local area may reach over 60 m. The reservoir condition and plane continuity of those two zones are favorable to the accumulation of oil and gas (Table 2, Figure 3). The thickness of the inner fracture zone is 39.3 to 118.7 m, and the thickness ratio of reservoir to strata for each well is relatively low, ranging from 32.3% to 64.3% (Table 2). This zone can connect with the weathering fracture zone, which is horizontal for fault dislocation, and then the reservoir can be continuously distributed in plane (Figure 3). The thickness of the base rock zone is 14.2 to 72.2 m, and the thickness ratio of reservoir to strata is usually less than 50.0% (Table 2). Moreover, the reservoir of the base rock zone is distributed discontinuously in plane (Figure 3).
In summary, the sand–gravel weathering zone and the weathering fracture zone are the most favorable zones for the intrusive rock buried-hill reservoir with a high thickness ratio of reservoir to strata and a continuous distribution in plane. Although the thickness ratio of reservoir to strata in the inner fracture zone is lower than that in the sand–gravel weathering zone and the weathering fracture zone, it also could be favorable to the accumulation of oil and gas in the local layers, as the layers connect with the weathering fracture zone horizontally and with the fracture concentrated layers longitudinally. Furthermore, the reservoir condition of the base rock zone is the worst for a low thickness ratio of reservoir to strata, a thin thickness of each single layer, and a discontinuous distribution in plane.

6. Conclusions

The buried hill in the Y area of the Qiongdongnan Basin mainly consists of acidic intrusive rocks, and can be divided into four zones in descending order. The sand–gravel weathering zone is characterized by very high ROP; the ROP and clay content are both high in the weathering fracture zone, while are both low in the inner fracture zone and the base rock zone. Compared to the inner fracture zone, the base rock zone shows very low ROP, clay content, and Fe content, and the curves of those three parameters in column are smooth and straight. The reservoir can be well interpreted when taking the MSE geometrical mean of the base rock zone as a basic value to calculate Kb. The reservoir can also be well interpreted when WH ranges from 0 to 4.5 MPa and WL ranges from 0 to 99 MPa in the column while intersecting. Furthermore, 4.5 MPa is the maximum WH of intrusive rock buried-hill in the study area. Furthermore, 99 MPa is 22 times of 4.5 MPa, and 22 is the inflexion of the WL/WH cumulative frequency curve (round-off number). The layers can be interpreted as the reservoir with Kb < 1 in the sand–gravel weathering zone and the weathering fracture zone. The Kb < 1 and effective intersection of WL-WH layers at the same time could be interpreted as the reservoir in the inner fracture zone and the base rock zone. Using the methods mentioned above, the reservoir of the intrusive rock buried-hill could be well interpreted with the mud-logging data. The total thickness of the uninterpretable reservoir ratio is less than 20% compared to reservoir interpretation with well-logging data for each well. The sand–gravel weathering zone and the weathering fracture zone are the most favorable zones. The inner fracture zone could also be favorable to oil and gas accumulation in the local layers. Moreover, the reservoir condition of the base rock zone is the worst.

Author Contributions

Conceptualization, X.Q. and N.J.; methodology, X.Q. and X.C.; software, C.Z.; validation, Y.X. and C.Z.; formal analysis, S.G.; investigation, X.Q., C.Z. and Y.X.; resources, P.C. and X.C.; data curation, B.T. and X.Q.; writing—original draft preparation, X.Q.; writing—review and editing, X.Q.; visualization, Y.X.; supervision, N.J.; project administration, N.J.; funding acquisition, X.Q. and N.J. All authors have read and agreed to the published version of the manuscript.

Funding

This work is supported by the National Natural Science Foundation of China (Grant Numbers. 42102135), and Science and Technology Research Program of Chongqing Municipal Education Commission (grant number: KJQN202101535).

Institutional Review Board Statement

Not applicable. The study did not require ethical approval.

Informed Consent Statement

Not applicable. The study did not involve humans.

Data Availability Statement

Not applicable.

Conflicts of Interest

The authors declare no conflict of interest.

References

  1. Li, D.S. The progress in the petroleum geology of China towards new century. Acta Pet. Sin. 2000, 21, 1–8. [Google Scholar]
  2. Dou, L.R.; Wei, X.D.; Wang, J.C.; Li, J.L.; Wang, R.C.; Zhang, S.H. Characteristics of granitic basement rock buried-hill reservoir in Bongor Basin, Chad. Acta Pet. Sin. 2015, 36, 897–904, 925. [Google Scholar]
  3. Cortez, M.M.M.; Santos, M.A.C. Seismic interpretation. Seismic interpretation, attribute analysis, and illumination study for targets below a volcanic-sedimentary succession, Santos Basin, offshore Brazil. Interpretation 2016, 4, SB37–SB50. [Google Scholar] [CrossRef]
  4. Wang, Y.; Xiong, W.; Lin, H.X.; Wu, S.B.; An, T.X.; Liu, R.J.; Xiang, L.H.; Yin, L.J.; Meng, W.; Zhang, S. The reservoir characteristics and hydrocarbon accumulation model of Lower Paleozoic buried-hill in Jiyang depression. Acta Pet. Sin. 2020, 41, 1334–1347. [Google Scholar]
  5. Hu, Z.W.; Xu, C.G.; Yang, B.; Huang, Z.; Su, W. Reservoir forming mechanism of Penglai 9-1 granite buried-hills and its oil geology significance in Bohai Sea. Acta Pet. Sin. 2017, 38, 274–285. [Google Scholar]
  6. Shi, H.S.; Yang, J.H.; Zhang, Y.C.; Gan, J.; Yang, J.H. Geological understanding innovation and major breakthrough to natural gas exploration in deep water in Qiongdongnan Basin. China Pet. Explor. 2019, 24, 691–698. [Google Scholar]
  7. Tian, L.X. Sedimentary-Reservoir Characteristics under control of transfer model and implications for hydrocarbon exploration in Huizhou Depression, Pearl River Mouth Basin. Earth Sci. 2021, 46, 4043–4056. [Google Scholar]
  8. Wang, J.R.; Deng, Q.; Tan, W.X.; Gong, M.; Qin, L. Granite reservoir evaluation while drilling: Method and application. Xinjiang Pet. Geol. 2015, 36, 228–233. [Google Scholar]
  9. Sui, Z.D.; Hu, Z.M.; Qin, B.J.; Zheng, L.J.; Chen, L.; Guang, Y.H. Fracture interpretation and evaluation and fluid identification with mud logging work index ratio for igneous rock reservoirs in Zhongguai area, Xinjiang. Mud Logging Eng. 2015, 26, 13–17. [Google Scholar]
  10. Zhang, Z.H.; Wang, J.R.; Deng, Q.; Tan, W.X.; Ma, M.; Qin, L.; Li, G.D.; Du, B. Power exponential model in geological and engineering logging. Mud Logging Eng. 2016, 27, 1–6. [Google Scholar]
  11. Geng, C.X.; Hu, Z.M.; Qian, W.B.; Wang, P.; Chen, D.W.; Yuan, B.Y. Application study of mud logging physical property of evaluation technology while drilling. Mud Logging Eng. 2017, 28, 27–32, 47, 155. [Google Scholar]
  12. Huang, W.D.; Sui, Z.D.; Chen, X.H.; Huang, G.R.; Wu, Z.; Zhao, Y.Q.; Chen, L. Study on evaluation technology of mechanical specific energy and physical properties of igneous rock reservoir. Mud Logging Eng. 2019, 30, 79–83, 148–149. [Google Scholar]
  13. Zhou, D.; Sun, Z.; Chen, H.Z.; Xu, H.H.; Wang, W.Y.; Pan, X.; Cai, D.S.; Hu, D.K. Mesozoic paleogeography and tectonic evolution of South China Sea and adjacent areas in the context of Tethyan and Paleo-Pacific interconnections. Isl. Arc. 2008, 17, 186–207. [Google Scholar] [CrossRef]
  14. Zhu, W.L.; Zhang, G.C.; Zhong, K.; Liu, B.M. South China Sea: Oil and gas outlook. Strateg. Study CAE 2010, 5, 46–50. [Google Scholar]
  15. Zhang, Y.C.; Xu, X.D.; Gan, J.; Zhu, J.T.; Guo, X.X.; He, X.H. Study on the Geological Characteristics, Accumulation Model and Exploration Direction of the Giant Deepwater Gas Field in the Qiongdongnan Basin. Acta Geol. Sin. 2017, 91, 1620–1633. [Google Scholar]
  16. Qiu, Y.; Li, A.Q.; Zhou, J.; Song, A.X.; Hu, B. Calibrating The bottom interface of granite weathering crust reservoir on the Songnan Lift in the deep water areas of Qiongdongnan Basin. Mar. Geol. Front. 2021, 37, 87–96. [Google Scholar]
  17. He, J.X.; Yao, Y.J.; Ma, W.H.; Zhang, S.L.; Shi, X.B.; Liu, H.L.; Wan, Z.F. Status of oil & gas exploration and analysis of geological character in Mesozoic residual basins, northeastern South China Sea. Nat. Gas Geosci. 2007, 18, 635–642. [Google Scholar]
  18. Zhou, D.; Sun, Z.; Chen, H.Z.; Qiu, Y.X. Mesozoic lithofacies, paleogeography, and tectonic evolution of the South China Sea and surrounding areas. Earth Sci. Front. 2005, 3, 204–218. [Google Scholar]
  19. Sun, X.M.; Zhang, X.Q.; Zhang, G.C.; Lu, B.L.; Yue, J.P.; Zhang, B. Petrology and Depositional Environments of Mesozoic Strata in the Northeastern South China Sea. Sci. China Earth Sci. 2014, 44, 1312–1323. [Google Scholar]
  20. Shao, L.; You, H.Q.; Hao, H.J.; Wu, G.X.; Qiao, P.J.; Lei, Y.C.; Zhang, B. Texture and tectonic attribute of Cenozoic basin basement in the northern South China Sea. Geol. Rev. 2007, 53, 164–170. [Google Scholar]
  21. Tang, L.S.; Zhu, J.T.; Yao, Z.; Guo, M.G.; Mao, X.L. Evolution and reservoir formation conditions of buried hills in Songnan Low Uplift of the Qiongdongnan Basin. Spec. Oil Gas Reserv. 2017, 24, 87–91. [Google Scholar]
  22. Huang, B.J.; Tian, H.; Li, X.S.; Wang, Z.F.; Xiao, X.M. Geochemistry, origin and accumulation of natural gases in the deepwater area of the Qiongdongnan Basin, South China Sea. Mar. Pet. Geol. 2016, 72, 254–267. [Google Scholar] [CrossRef]
  23. Xu, X.D.; Zhang, Y.C.; Liang, G.; Xiong, X.F.; Li, X.; Guo, X.X.; Liu, H.Y. Hydrocarbon source condition and accumulation mechanism of natural gas in deepwater area of Qiongdongnan Basin, northern South China Sea. Nat. Gas Geosci. 2016, 27, 1985–1992. [Google Scholar]
  24. Gan, J.; Zhang, Y.C.; Liang, G.; Yang, X.B.; Li, X.; Song, P. Deposition pattern and differential thermal evolution of source rocks, deep water area of Qiongdongnan Basin. Earth Sci. 2019, 44, 2627–2635. [Google Scholar]
  25. Li, S.Y.; Hu, L.; Gan, J.; Wu, Q.L.; Li, X.L.; Li, M.; Chen, K.; Li, F.X.; Zheng, F. Accumulation conditions of buried-hill hydrocarbon reservoirs on the Lingnan Low Uplift in the deep water areas of Qiongdongnan Basin. Mar. Geol. Front. 2021, 37, 68–75. [Google Scholar]
  26. You, J.J.; Sun, Z.P.; Li, J.L.; Guo, M.G.; Zhu, J.T. Exploration potential of Songnan low-uplift in the deep water region, Qiongdongnan basin. China Min. Mag. 2012, 21, 56–59. [Google Scholar]
  27. Guo, M.G.; Zeng, X.Y.; Jiang, R.F.; Zhu, J.T.; Sun, Z.P.; Mao, X.L.; Man, X.; He, X.H. The forming condition of multiple oil gas accumulation and accumulation model of Songnan low uplift in deep-water area of Qiongdongnan Basin. Contrib. Geol. Miner. Resour. Res. 2017, 32, 577–587. [Google Scholar]
  28. Yang, J.H.; Huang, B.J.; Yang, J.H. Gas accumulation conditions and exploration potentials of natural gases in Songnan low uplift, deep water area of Qiongdongnan basin. China Offshore Oil Gas 2019, 31, 1–10. [Google Scholar]
  29. Chen, P.; Yu, X.J.; Chen, X.J.; Guo, S.S.; Tan, B.; Qu, X.J. Rock types and logging identification characteristics of basement buried hill in YL8 area of southeastern Hainan Basin. Glob. Geol. 2021, 40, 613–623. [Google Scholar]
  30. Teale, R. The concept of specific energy in rock drilling. Int. J. Rock Mech. Min. Sci. Geomech. Abstr. 1965, 2, 57–73. [Google Scholar] [CrossRef]
  31. Rabia, H. Specific Energy as a Criterion for Bit Selection. J. Pet. Technol. 1985, 37, 1225–1229. [Google Scholar] [CrossRef]
  32. Pessier, R.C.; Fear, M.J. Quantifying common drilling problems with mechanical specific energy and a bit-specific coefficient of sliding friction. In Proceedings of the 67th Annual Technical Conference and Exhibition of the Society of Petroleum Engineers, Washington, DC, USA, 4–7 October 1992; pp. 373–388. [Google Scholar]
  33. Dupriest, F.E.; Koederitz, W.L. Maximizing drill rates with real-time surveillance of mechanical specific energy. In Proceedings of the SPE/IADC Drilling Conference, Amsterdam, The Netherlands, 23–25 February 2005; pp. 1–10. [Google Scholar]
  34. Armenta, M. Identifying inefficient drilling conditions using drilling-specific energy. In Proceedings of the 2008 SPE Annual Technical Conference and Exhibition, Denver, CO, USA, 21–24 September 2008; pp. 1–16. [Google Scholar]
  35. Mohan, K.; Adil, F.; Samuel, R. Tracking drilling efficiency using hydro-mechanical specific energy. In Proceedings of the SPE/IADC Drilling Conference and Exhibition, Amsterdam, The Netherlands, 17–19 March 2009; pp. 1–12. [Google Scholar]
  36. Rafatian, N.; Miska, S.; Ledgerwood, L.W.; Ahmed, R.; Yu, M.J.; Takach, N. Experimental study of MSE of a single PDC cutter interacting with rock under simulated pressurized conditions. SPE Drill Compl. 2010, 25, 10–18. [Google Scholar] [CrossRef]
  37. Cherif, H. FEA modeled MSE/UCS values optimize PDC design for entire hole section. In Proceedings of the North Africa Technical Conference and Exhibition, Cairo, Egypt, 20–22 February 2012; pp. 1–11. [Google Scholar]
  38. Azike-Akubue, V.; Barton, S.; Gee, R.; Burnett, T. Agitation tools enables significant reduction in mechanical specific energy. In Proceedings of the SPE Asia Pacific Oil and Gas Conference and Exhibition, Perth, Australia, 22–24 October 2012; pp. 1–13. [Google Scholar]
  39. Fan, H.H.; Feng, G.Q.; Xiao, W.; Ma, J.L.; Ye, Z.; Zhao, C. New Approach for Real-Time Bit Wear Monitoring Based on the Theory of MSE. Pet. Drill. Tech. 2012, 40, 116–120. [Google Scholar]
  40. Bernt, S.A. Petroleum Rock Mechanics Drilling Operations and Well Design; Gulf Professional Publishing: Oxford, UK, 2011; pp. 131–149. [Google Scholar]
  41. Hou, M.C.; Cao, H.Y.; Li, H.Y.; Chen, A.Q.; Wei, A.J.; Chen, Y.; Wang, Y.C.; Zhou, X.W.; Ye, T. Characteristics and controlling factors of deep buried-hill reservoirs in the BZ19-6 structural belt, Bohai Sea area. Nat. Gas Ind. 2019, 39, 33–44. [Google Scholar] [CrossRef]
  42. Liu, Z.; Zhu, M.L.; Liu, H.M.; Li, X.K.; Liang, S.Z.; Gong, J.Q.; Zhang, P.F. Formation mechanism and distribution characteristics of granitic weathering crust reservoir:a case study of the western segment of the northern belt of Dongying sag. Acta Pet. Sin. 2021, 42, 163–175. [Google Scholar]
  43. Wang, X.; Zhou, X.H.; Xu, G.S.; Liu, P.B.; Gao, K.S.; Guan, D.Y. Characteristics and controlling factors of reservoirs in Penglai 9-1 large-scale oilfield in buried granite hills, Bohai Sea. Oil Gas Geol. 2015, 3, 262–270. [Google Scholar]
  44. Cui, M.; Li, J.J.; Ji, G.D.; Chen, Y.H. Optimize Method of Drilling Parameter of Compound Drilling Based on Mechanical Specific Energy Theory. Pet. Drill. Tech. 2014, 42, 66–70. [Google Scholar]
  45. Yan, J.; Li, Z.K.; Li, C.C.; Zhao, X.J.; Zai, Y.H.; Wang, K.X. Experimental study on rock uniaxial compression strength prediction by using acoustic velocity. J. Southwest Pet. Inst. 1999, 21, 13–15. [Google Scholar]
Figure 1. Tectonic framework and comprehensive stratigraphic column of the Qiongdongnan Basin. (a) Tectonic map of the Qiongdongnan Basin (after reference [16]); (b) drilling well location of intrusive rock buried-hill in the Y area; and (c) comprehensive stratigraphic column of the Qiongdongnan Basin.
Energies 15 03813 g001
Figure 2. Typical photographs of rock types and reservoir spaces of intrusive rock buried-hill in the Y area. (a) Monzonitic granite, weathering and leaching fractures, Well Y832, 2883.3 m, sidewall core thin section; (b,c) biotite monzonitic granite, structural fractures filled with calcite, potash feldspar with micro fracture, strongly alternated plagioclase, biotite chloritized, Well Y832, 2935 m, core and its thin section; (d,e) syenite granite, structural fractures filled with ferrocalcite, Well Y812, 3439.3 m, sidewall core and its thin section; and (f) cataclastic monzonitic granite, structural fractures, strongly alternated plagioclase, Well Y811, 3003 m, sidewall core thin section. Q—quartz; Pl—plagioclase; Kfs—potash feldspar; Bi—biotite; Fc—ferrocalcite; WLF—weathering and leaching fracture; SF—structural fracture; MF—micro fracture; DP—dissolution pores.
Energies 15 03813 g002
Figure 3. Zonation model of intrusive rock buried-hill in the Y area, Qiongdongnan Basin. The location of the section is shown in Figure 1a,b.
Energies 15 03813 g003
Figure 4. Mud-logging characteristics of zonation and reservoir interpretation with mud-logging data of intrusive rock buried-hill of Well Y831. En1 is the basic value calculated with the MSE geometrical mean of the base rock zone. Kb1 is equal to MSE divided by En1 in correspondence with the depth. En2 is the basic value calculated by piecewise fitting based on the linear correlation of MSE in correspondence with the depth. Kb2 is equal to MSE divided by En2 in correspondence with the depth.
Energies 15 03813 g004
Figure 5. Mud-logging characteristics of zonation and reservoir interpretation with mud-logging data of intrusive rock buried-hill of Well 1311~Y831~Y832~Y811~Y812, location of the section is shown in Figure 1a,b.
Energies 15 03813 g005
Figure 6. WH-WL scatter plot and WH/WL ratio cumulative frequency curve of intrusive rock buried-hill in the Y area (includes 6 wells and 8309 datapoints). (a) WH-WL scatter plot; (b) WH/WL ratio cumulative frequency curve.
Energies 15 03813 g006
Table 1. Reservoir interpretation correlation between well-logging data and mud-logging data of intrusive rock buried-hill in the Y area.
WellTTR-IWL (m)TTR-IML (m)TTR-NIML (m)TTR-IML/TTR-IWL (%)TTR-NIML/TTR-IWL (%)
Y81163.9 114.5 3.0 179.14.7
Y81290.4 99.4 17.7 110.019.5
Y831117.6 96.8 29.4 82.325.0
Y832239.2 231.8 67.0 96.928.0
Y13114.9 61.5 01255.10
TTR-IWL: the total thickness of reservoir interpretation with well-logging data; TTR-IML: the total thickness of reservoir interpretation with mud-logging data; TTR-IML/TTR-IWL: the reservoir thickness ratio; TTR-NIML: the total reservoir not interpreted with mud-logging data; TTR-NIML/TTR-IWL: the total thickness ratio of the uninterpretable reservoir.
Table 2. Statistics table of the reservoir thickness, the strata thickness, and their ratio of intrusive rock buried-hill in the Y area.
WellSand–Gravel Weathering ZoneWeathering Fracture ZoneInner Fracture ZoneBase Rock Zone
TTRS (m)TTS (m)TRRS1 (%)TTRW (m)TTW (m)TRRS2 (%)TTRI (m)TTI (m)TRRS3 (%)TTRB (m)TTB (m)TRRS4 (%)
Y81100 /47.147.5 99.252.895.155.514.228.050.6
Y8127.5 7.5100.025.126.395.366.9207.132.30.00.0/
Y8314.0 4.0100.020.020.0 100.039.386.045.733.475.644.2
Y8322.0 2.0100.039.039.0 100.0118.7184.564.372.2151.247.7
Y13117.0 7.0100.054.559.0 92.400/00/
TTRS: the total thickness of the reservoir in the sand–gravel weathering zone; TTRW: the total thickness of the reservoir in the weathering fracture zone; TTRI: the total thickness of the reservoir in the inner fracture zone; TTRB: the total thickness of the reservoir in the base-rock zone; TTS: the total thickness of the reservoir in the sand–gravel weathering zone; TTW: the total thickness of reservoir in the weathering fracture zone; TTI: the total thickness of the reservoir in the inner fracture zone; TTB: the total thickness of the reservoir in the base rock zone; TRRS: the thickness ratio of reservoir to strata, TRRS1 = TTRS/TTS, TRRS2 = TTRW/TTW, TRRS3 = TTRI/TTI, TRRS4 = TTRB/TTB.
Publisher’s Note: MDPI stays neutral with regard to jurisdictional claims in published maps and institutional affiliations.

