Article

Water Weakening of Artificially Fractured Chalk, Fracture Modification and Mineral Precipitation during Water Injection—An Experimental Study

by
Tine Vigdel Bredal
1,2,*,
Reidar Inge Korsnes
1,2,
Udo Zimmermann
1,2,
Mona Wetrhus Minde
2,3 and
Merete Vadla Madland
2,4
1
Department of Energy Resources, University of Stavanger, Ullandhaug, 4036 Stavanger, Norway
2
The National IOR Centre of Norway, University of Stavanger, Ullandhaug, 4036 Stavanger, Norway
3
Department of Mechanical and Structural Engineering and Materials Science, University of Stavanger, Ullandhaug, 4036 Stavanger, Norway
4
Division of Research, University of Stavanger, Ullandhaug, 4036 Stavanger, Norway
*
Author to whom correspondence should be addressed.
Energies 2022, 15(10), 3817; https://doi.org/10.3390/en15103817
Submission received: 20 April 2022 / Revised: 17 May 2022 / Accepted: 18 May 2022 / Published: 22 May 2022
(This article belongs to the Special Issue Management of High Water Cut and Mature Petroleum Reservoirs)

Abstract

:
This experiment was designed to study the water-weakening effect of artificially fractured chalk caused by the injection of different compositions of brines under reservoir conditions replicating giant hydrocarbon reservoirs at the Norwegian Continental Shelf (NCS). NaCl, synthetic seawater (SSW), and MgCl2, with same ionic strength, were used to flood triaxial cell tests for approximately two months. The chalk cores used in this experiment originate from the Mons basin, close to Obourg, Belgium (Saint Vast Formation, Upper Cretaceous). Three artificially fractured chalk cores had a drilled central hole parallel to the flooding direction to imitate fractured chalk with an aperture of 2.25 (±0.05) mm. Two additional unfractured cores from the same sample set were tested for comparison. The unfractured samples exposed a more rapid onset of the water-weakening effect than the artificially fractured samples, when surface active ions such as Ca2+, Mg2+ and SO42− were introduced. This instant increase was more prominent for SSW-flooded samples compared to MgCl2-flooded samples. The unfractured samples experienced axial strains of 1.12% and 1.49% caused by MgCl2 and SSW, respectively. The artificially fractured cores injected by MgCl2 and SSW exhibited a strain of 1.35% and 1.50%, while NaCl showed the least compaction, at 0.27%, as expected. Extrapolation of the creep curves suggested, however, that artificially fractured cores may show a weaker mechanical resilience than unfractured cores over time. The fracture aperture diameters were reduced by 84%, 76%, and 44% for the SSW, MgCl2, and NaCl tests, respectively. Permeable fractures are important for an effective oil production; however, constant modification through compaction, dissolution, and precipitation will complicate reservoir simulation models. An increased understanding of these processes can contribute to the smarter planning of fluid injection, which is a key factor for successful improved oil recovery. This is an approach to deciphering dynamic fracture behaviours.

1. Introduction

About 40% of the world’s oil is produced from chalk and carbonate rocks [1]. North Sea carbonate reservoirs have great potential to accumulate oil, as the porosity may often be very high, reaching 40–50% [2]. However, carbonate reservoirs are often characterised by low permeability and tend not to be water-wet, which challenges primary oil production. Matrix permeability for chalk is often in the range of 1–5 mD [2]. The recovery factor on Ekofisk, a giant chalk reservoir on the Norwegian continental shelf (NCS), is over 50% [3], and there is still great potential for improved oil recovery (IOR) methods. By implementing enhanced oil recovery (EOR), or tertiary recovery, immobile oil that remains in the reservoir after production by conventional methods are prone to be recovered.
Ekofisk started oil production in 1971 by pressure depletion. Water injection was introduced in 1987 to create pressure support and to prevent seabed subsidence. The field subsequently experienced a substantial increase in oil recovery. Experience proved that water displaced the oil much more effectively than anticipated. Another consequence of the seawater injection was the deformation of the chalk matrix, hence the further compaction of the soft chalk despite the stabilization of pore pressure. This is referred to as a water-weakening effect and has been widely studied in laboratory experiments [4,5,6,7].
Geo-mechanical responses related to the water weakening of chalk are mainly a result of surface chemistry and chemical alterations which lead to calcite dissolution and the precipitation of new mineral phases associated with surface-active ions present in seawater Ca2+, Mg2+, and SO42− [6,8]. Dissolution and precipitation processes are also dependent on effective stresses, temperatures, porosity, chemistry, and diagenetic processes such as cementation [9]. Precipitated magnesite (MgCO3) is identified in experiments where Mg2+ is present in the injected brine [10]. It has a smaller crystal size compared to the dissolved calcite, and thereby it may reduce the solid volume. These brine–rock interaction processes that take place are also dependent on noncarbonate minerals [11]. Madland et al. (2011) [11] observed that pure chalk experienced a lower compaction rate compared to chalk with impurities of silicate and clay minerals. Andersen et al. (2017) [4] suggested that reprecipitation of Si-bearing minerals advances the dissolution of calcite, which justified the high compaction in MgCl2-flooded chalk. SO42− is also present in seawater and in injected brine (SSW). It’s presence will cause additional strain by adsorbing to the calcite surface and cause a reduction in the bulk modulus and yield points compared to experiments where NaCl is injected under the same conditions. The disjoining pressure in granular contacts is increased by the interaction between charged surfaces and, furthermore, net repulsive forces that act as normal forces in the grains’ vicinity, will counteract the cohesive forces and enhance pore collapse during loading [12].
NaCl is the major constituent in seawater. Geochemical analysis following laboratory experiments on chalk at 130 °C has shown that, without the presence of surface-active ions, precipitation of new mineral phases has not been observed in pure systems [11,13]. NaCl is therefore expected to be inert. However, calcite dissolution has been identified in laboratory experiments with prolonged test duration under elevated stress states, which has caused morphological changes such as the smoothing of grain surfaces [4]. This surface grain rounding has been suggested to weaken mechanical intergranular friction and provoke additional compaction [14].
During pressure depletion, the reservoir experience increased effective overburden stresses, seabed subsidence, and reduced matrix permeability. On the other hand, compaction may also induce fractures [15]. Since chalk reservoirs have a combination of high porosity and rather low permeability, fractures and high permeable zones are of great importance to sustain an effective fluid flow [16]. The presence of a naturally fractured system will increase the potential for fluid transportation, hence the oil recovery. The naturally fractured system on Ekofisk Field is believed to increase reservoir permeability by a factor of 50 [2]. A high intensity of fractures can create a spatially distinct, permeable zone [17]. The single fracture’s contribution to reservoir fluid flow depends on size features, which include length, height, aperture, and aspect ratio [18]. This may change if fractures seal and may help to obtain a better sweep of the reservoir if the injected water is forced into the matrix instead of flowing throught the fractures. To better understand the complexity of reservoir fluid behaviour and petrophysical properties, it is beneficial to consider the details of a fault zone, and to categorize the zones with distinct hydrogeological units as barriers, conduits, or combined conduits and barriers [19]. The fault core is a narrow zone that commonly forms between major slip surfaces. The original host rock is here destroyed by mechanical and chemical processes such as the dissolution and precipitation of minerals. The inner core of the fault zone has experienced the highest strain and thus reduced the porosity to a degree that permeability is so decreased that the inner core acts as a barrier [20,21]. The adjacent damaged zone is a wider zone of deformation with numerous fractures and smaller faults. The fracture network, fracture density, and orientation will ultimately control bulk permeability in these damage zones. The continuous flood behaviour is dependent on the fracture’s ability to seal [22]. For carbonate reservoirs, isolated fractures may even affect the bulk permeability [18].
A laboratory experiment demonstrated that a core sample from the damaged zone presented permeability of several orders higher than that of samples extracted from the fault core [23]. Their experiment was performed on core scale but suggested that these microfractures (micron to centimetre scale) and the heterogeneous density distribution could be upscaled, and similar observations for macro fractures (up to meters) could be expected in the reservoir. However, microfractures are more prone to becoming sealed. During the water injection and depletion of the reservoir, the altered stress state and the induced water-weakening effect may modify reservoir properties dramatically. Mechanical and chemical alterations may induce or enhance natural fractures and reactivate faults, which can alter matrix permeabilities. The faulting and fracturing of carbonate reservoirs have major implications for hydrocarbon fluid pathways [24]. These processes will collectively cause additional compaction in the reservoir and provide extra drainage and increased recovery. However, injection may over time cause precipitation, which seals off minor fractures and reduce local permeability and alter fluid transportation. Matrix permeability may be further diminished by pore collapse due to increased effective stress during depletion of the reservoir. By studying the link between water weakening and the composition of brine, and by further comparing these geo-mechanical responses with the ability to seal smaller fractures, one can improve the prediction of seawater injection and thereby maximize production. Here, we present geo-mechanical responses to artificially fractured cores versus unfractured cores and further report how these responses differ depending on the ion composition of the injected brine. Beside studying the geo-mechanical response and ion concentration in the effluent, we study textural characteristics obtained by Scanning Electron Microscope combined with Energy Dispersive Spectroscopy (SEM-EDS) and specific surface area (SSA) adjacent fracture in addition to bulk geochemistry. This study demonstrates changes in terms of dissolution and precipitation processes for artificially fractured samples as an analogue to reservoir conditions at the NCS. Furthermore, this study links fracture aperture modification to the composition of the injected brine in addition to the experienced strain for fractured samples. By characterizing fracture geometry and spatial distribution related to mechanical properties, input data for reservoir flooding models to predict fluid flow properties may be refined.

2. Samples, Sample Preparation and Methodology

An Upper Cretaceous succession (Coniacian) from the Obourg quarry within the St. Vaast Formation of the Mons basin (OBSV) was chosen as an analogue to Ekofisk reservoir chalk due to the accessibility of onshore chalk and earlier studies (e.g., [4,25]). Five samples were cored parallel from the same outcrop block with a diameter of 38.1 mm and a length of about 70 mm. The average porosity was 41 (±1)%, and the permeability ranged around 0.56 mD on intact cores (Table 1). A 2 mm drill bit was used to produce cylindrical holes along the flooding axis, mimicking fractures in three cores. The size of the fractures measured 2.25 (±0.05) mm in diameter. Two supplementary intact cores were added to the experiment as reference. Three different brines were used in the experiment to detect results related to different concentration of surface-active ions. Synthetic seawater (SSW) is a laboratory mixed brine, reproducing the ion concentration in seawater, which is used for IOR purposes in the reservoir. The composition of this fluid is described in detail in Madland et al. (2011) [11] and is comprised of Na+, Cl, Mg2+, Ca2+, K+, and SO42. Mg2+ is one of the most reactive ions in SSW, and in these experiments, a higher and isolated concentration of MgCl2 in addition to NaCl was selected such that all brines had equal ion strength to SSW in the experiment. NaCl was added as a reference, as it is expected to be inert with chalk. The concentrations are presented in Table 1.
The experiments were conducted in a triaxial cell, simulating reservoir conditions at Ekofisk reservoir with a temperature of 130 °C and constant hydrostatic pressure (effective overburden) of 12 MPa while flooding the cores. Replication of actual reservoir conditions have been implemented in laboratory routines and has been demonstrated to be highly representative [4,5,6,11]. The triaxial cell is connected to three high pressure pumps (Gilson Pump-Model 307 HPLC), where two provided axial and confining pressure and the last was a fluid pump to provide brine injection through the core. The triaxial cell system is arranged such that the confining pressure also supplied pressure in axial direction. Moreover, the piston providing axial pressure only supplied an additional threshold pressure to keep the piston in contact with the sample. The axial displacement in this test set-up, was therefore not purely hydrostatic because of the additional pressure supplied in the axial direction causing a slightly higher stress in axial versus lateral direction. The confining pressure was gradually increased to 12 MPa, with a stable piston pressure at 0.7 MPa, just above the friction pressure, to simulate hydrostatic test conditions. The quantity of axial compaction was detected by a linear variable differential transformer (LVTD), tracking the movement of the piston in contact with the chalk core. The triaxial cells were not equipped to measure radial strain. The cores were injected with a flow rate corresponding to one pore volume a day based on the original pore volume. Pore pressure was kept constant at 0.7 MPa by using a back-pressure regulator. The triaxial cells were equipped with a Backer 1500 W heating Jacket, covering the triaxial cell, and a regulating system (Omron E5CN), which allowed a stable test temperature of 130 (±0.1) °C that was continuously monitored by a Pt100 sensor inside the cell. LabView software was used to log all real time data recorded from the experiments. Drainage discs allow for even distribution of the brine at inlet and outlet surfaces. For fractured cores, the drainage disk will not work as intended, since brine follows the easiest path with the least resistance in the central fracture. Permeability will, for these three tests, therefore be irrelevant. The reader is referred to Geitle K. (2013) [26] and Abubeker E. (2013) [27] for additional information regarding these tests.
All five samples (Figure 1) were initially saturated and flooded by NaCl during loading, and the primary creep phase lasted six days. In the second phase, the two unfractured cores, OBSV 9 SSW and OBSV 6 MgCl2, were followed by injection of SSW and MgCl2, respectively. Two of the artificially fractured samples, OBSV 12 AF-SSW and OBSV 4 AF-MgCl2, were injected with SSW and MgCl2, respectively. The third artificially fractured core was flooded with NaCl during the complete test period. The total number of flooding days ranged between 18 and 60 days (Table 2). The cores were sliced after the test, where the inlet was given the number one, and the outlet was given the highest number (Figure 1), ex: OBSV 4.1 is the inlet of OBSV 4 AF-MgCl2. End slices were kept for reference analysis.

2.1. Axial Strain, Yield Strength, and Bulk Modulus

Axial strain (Equation (1)) is compaction given in [%], where ΔL is the change in length from the original core length (L).
Axial   Strain   = Δ   L L   × 100
Yield point is, in this study, determined as the intersection of two tangent lines that follows the elastic and the plastic phase of the loading curve. The yield strength is the stress [MPa] applied to the core where the elastic strain is passed. The bulk modulus (K) is an elastic coefficient used to determine the relationship between stress and volumetric strain during hydrostatic loading. The bulk modulus reflects the material’s ability to resist compression (Equation (2)) and is given in [GPa], where σ h is hydrostatic stress and ε v is volumetric strain under hydrostatic test conditions.
K   =   σ h ε v
A logarithmic formula (Equation (3)) was used for extrapolation of creep, where A and t0 are constants that were determined by adjustment to the experimental creep curve. εcreep is the logarithmic creep behavior and t is the endpoint of the observed creep phase. For detailed descriptions, the reader is referred to Madland et al., 2006 [28].
εcreep = A ln (1 + t/t0)

2.2. Porosity and Permeability

Porosity is the ratio of pore volume (PV) to its bulk volume (BV), (Equation (4)). Porosities were simply measured by weight analysis. The samples were dried in a heating chamber to evaporate the remaining moisture before applying vacuum to approximately 0.04 kPa followed by saturation with distilled water. PV was determined by the dry and the fully saturated weight of the cores, and BV was calculated from the dimensions of the cores, where φ is porosity:
φ   = PV BV × 100
Porosity calculations post-test were calculated based on strain (where φ0 is the original porosity and εv is volumetric strain) in addition to mass, where BV is measured by gas pycnometer and derived densities, where Ms is solid mass and Ƥ is density of the core (Equation (5)).
φ   = ( 1 Ms Ƥ BV   )
Permeabilities were calculated using Darcy’s law, (Equation (6)), where k is permeability (mD), q is flow rate (cm2/s), µ is viscosity (cp), L is core length (cm), A is core area (cm2), and ΔP is differential pressure (atm).
k = q μ L A Δ P

2.3. Ion Chromatography (IC)

Water samples were frequently collected throughout the experiments. Effluent samples were prepared by diluting the samples 500 times by using the Gilson Gx-271 dilution system. They were further filtered before chemical analyses were performed by using the Dionex ICS-3000 Ion Chromatography System. The ion concentrations of the produced fluid were analysed and verified by external standards. Ion deviation in the effluent, from the ion concentration in the original brine injected, contributed to our understanding of the non-equilibrium status of the rock–fluid interactions during the test. These changes were used to predict the dissolution and precipitation of minerals inside the core.

2.4. Optical Light Microscopy (OLM) and Fracture Modification

The optical light microscope, Zeiss Stemi DV4, has a maximum of 20 times magnification. This was used to observe textural differences and enabled the study of colour variations. Magnification allowed for the measurement of the final fracture diameters.

2.5. Geochemistry

Method 1: Sample material was milled in an agate beaker to a fine mesh. The milled sample was mixed with LiBO2/Li2B4O7 flux in crucibles and fused in a furnace. The cooled bead was dissolved in American Chemical Society (ACS) grade nitric acid. The geochemical data were then obtained by using Inductively Coupled Plasma-Mass Spectrometry (ICP-MS) at the ACME laboratory (Vancouver, Canada). Loss on ignition (LOI) was determined by igniting a sample split then measuring the weight loss after being ignited at 1000 °C for 1 h and was then cooled and weighed again. Total amounts of carbon and sulphur were determined by the LECO® method. Here, induction flux was added to the prepared sample then ignited in an induction furnace. A carrier gas sweeps up released carbon to be measured by adsorption in an infrared spectrometric cell. Additional 14 elements were measured after dilution in Aqua Regia. The prepared sample was processed with a modified Aqua Regia solution of equal parts concentrated HCl, HNO3, and DI-H2O for 1 h in a heating block. The sample volume was increased with dilute HCl-solutions, and splits of 0.5 g were analysed. Accuracy and precision are between 2 and 3% per element. Detection limits are found in Table 3.
Method 2: Major elements for samples < 5 g were analysed geochemically by Fusion Inductively Coupled Plasma (FUS-ICP) without the detection of LOI and were processed at Actlabs (Canada).

2.6. Field Emission Gun Scanning Electron Microscopy (SEM) and Energy Dispersive X-ray Spectroscopy (EDS)

Fresh surfaced samples were mounted on aluminum holders, followed by coating with palladium (Pd) or gold (Au). A Zeiss Supra 35-VP FEG-SEM at the University of Stavanger (UiS) was used for the high magnification of morphological differences and to obtain elemental composition by using an Energy dispersive X-ray spectroscopy (EDS) detector. Images were acquired by using the secondary electron (SE) detector at a fixed working distance of 10 mm, accelerating voltage of 15.00 kV and using an aperture size of 30 µm. EDS was performed on squared areas of 2 × 2 µm.

2.7. Specific Surface Area (SSA)

Approximately two grams of sample material was ground in an agate mortar. The samples were heated in a tube at a temperature of 80 °C and kept under vacuum for 4.5 h. A Micromeritics TriStar II was utilized for the purpose of measuring Brunauer–Emmett–Teller (BET) surface area based on the BET theory [29]. Nitrogen gas was introduced to the sample continuously under a vacuum of around 20–30 mTorr. The sample tube was submerged in liquid nitrogen (LN2) for cooling during measurement. At increased partial pressures, nitrogen gas filled a greater area of the micro-pores, which adsorbed as a monolayer on the surface of the grains. The change in pressure is a measure of the amount of gas that was adsorbed on the surface. Along with the exact sample weight, the SSA was calculated by TriStar II 3020 Software, and the resulting surface extension is given in m2/g.

3. Results

3.1. Geo-Mechanical Responses

Axial strain rates were continuously measured throughout the experiment. The average axial strain during loading under injection of NaCl was 0.85 (±0.16)% for intact samples (Figure 2). OBSV 12 AF-SSW showed a higher compaction, just outside the expected range, with 1.08%. The two other cores with an artificial fracture experienced a similar strain (0.81% and 0.86%) as the two flooded unfractured cores. The yield stress was similar for all cores, ranging from 9.1 to 9.9 MPa (Table 1).
The average axial creep strain for both unfractured and the artificially fractured cores following the 6-day period of NaCl injection (Creep 1) was 1.29% (Figure 3a). Unfractured cores showed an average axial strain of 1.11 (±0.17)%. The artificially fractured cores, on the other hand, OBSV 4 AF-MgCl2, OBSV 12 AF-SSW, and OBSV 18 AF-NaCl, experienced a higher strain of 1.25%, 1.59%, and 1.38% respectively, with an average for the three of 1.40%. OBSV 12 AF-SSW and OBSV 18 AF-NaCl exhibitedd significantly higher compaction rates compared to the intact reference samples (both outside the expected range).
In Creep 2, after six days of the creep with injection of NaCl, four of the samples changed brine: OBSV 9 SSW and OBSV 12 AF-SSW to SSW and OBSV 4 AF-MgCl2, and OBSV 6 MgCl2 to MgCl2. OBSV 18 AF-NaCl continued the injection of NaCl throughout the entire test duration. During Creep 2, starting after six days, the five different samples experienced distinct axial strain rates (Figure 3b). The most dramatic increase in strain rate was observed for OBSV 9 SSW. It had the highest strain rate of 0.302%/day on day eight. When the test passed 16 days of duration, OBSV 9 SSW experienced a dramatic increase in differential pressure, and the test had to be terminated. A lower and later onset of increased compaction rate was identified for the artificially fractured core, OBSV 12 AF-SSW, which reached the highest strain rate of 0.089%/day on the 12th day of the test duration. The MgCl2-flooded samples experienced a lower compaction rate compared to the SSW-flooded cores. A distinct rate and onset of increased compaction was also noted for the two MgCl2-flooded samples. The difference between the artificially fractured core and the unfractured core was however less significant than observed for the two SSW-flooded cores. OBSV 6 MgCl2 distributed a maximum strain rate of 0.074%/day on the 12th day of testing, and OBSV 4 AF-MgCl2 reached the highest compaction rate of 0.054%/day on the 13th day. The lowest strain rate was observed for OBSV 18 AF-NaCl, with a stable and maximum axial strain rate close to 0.027%/day at the start of Creep 2, decreasing towards 0.018%/day on the last test day.

3.2. Porosity, Permeability, and Mechanical Strength Data

Porosity measurements were performed both before and after the experiment (Table 2) in addition to permeability calculations. Pre-test average porosity of the five samples was 40.83 (±1.38)%. All samples flooded with SSW and MgCl2 distributed significantly reduced porosities. The two cores flooded with SSW experienced a reduction of 4.19% and 4.32% for OBSV 12 AF-SSW and OBSV 9 SSW, respectively. The two cores flooded with MgCl2 showed a lower porosity reduction of 2.21% and 2.54% for OBSV 6 MgCl2 and OBSV 4 AF-MgCl2. Both artificially fractured cores showed lower porosity reduction compared to its reference intact core.

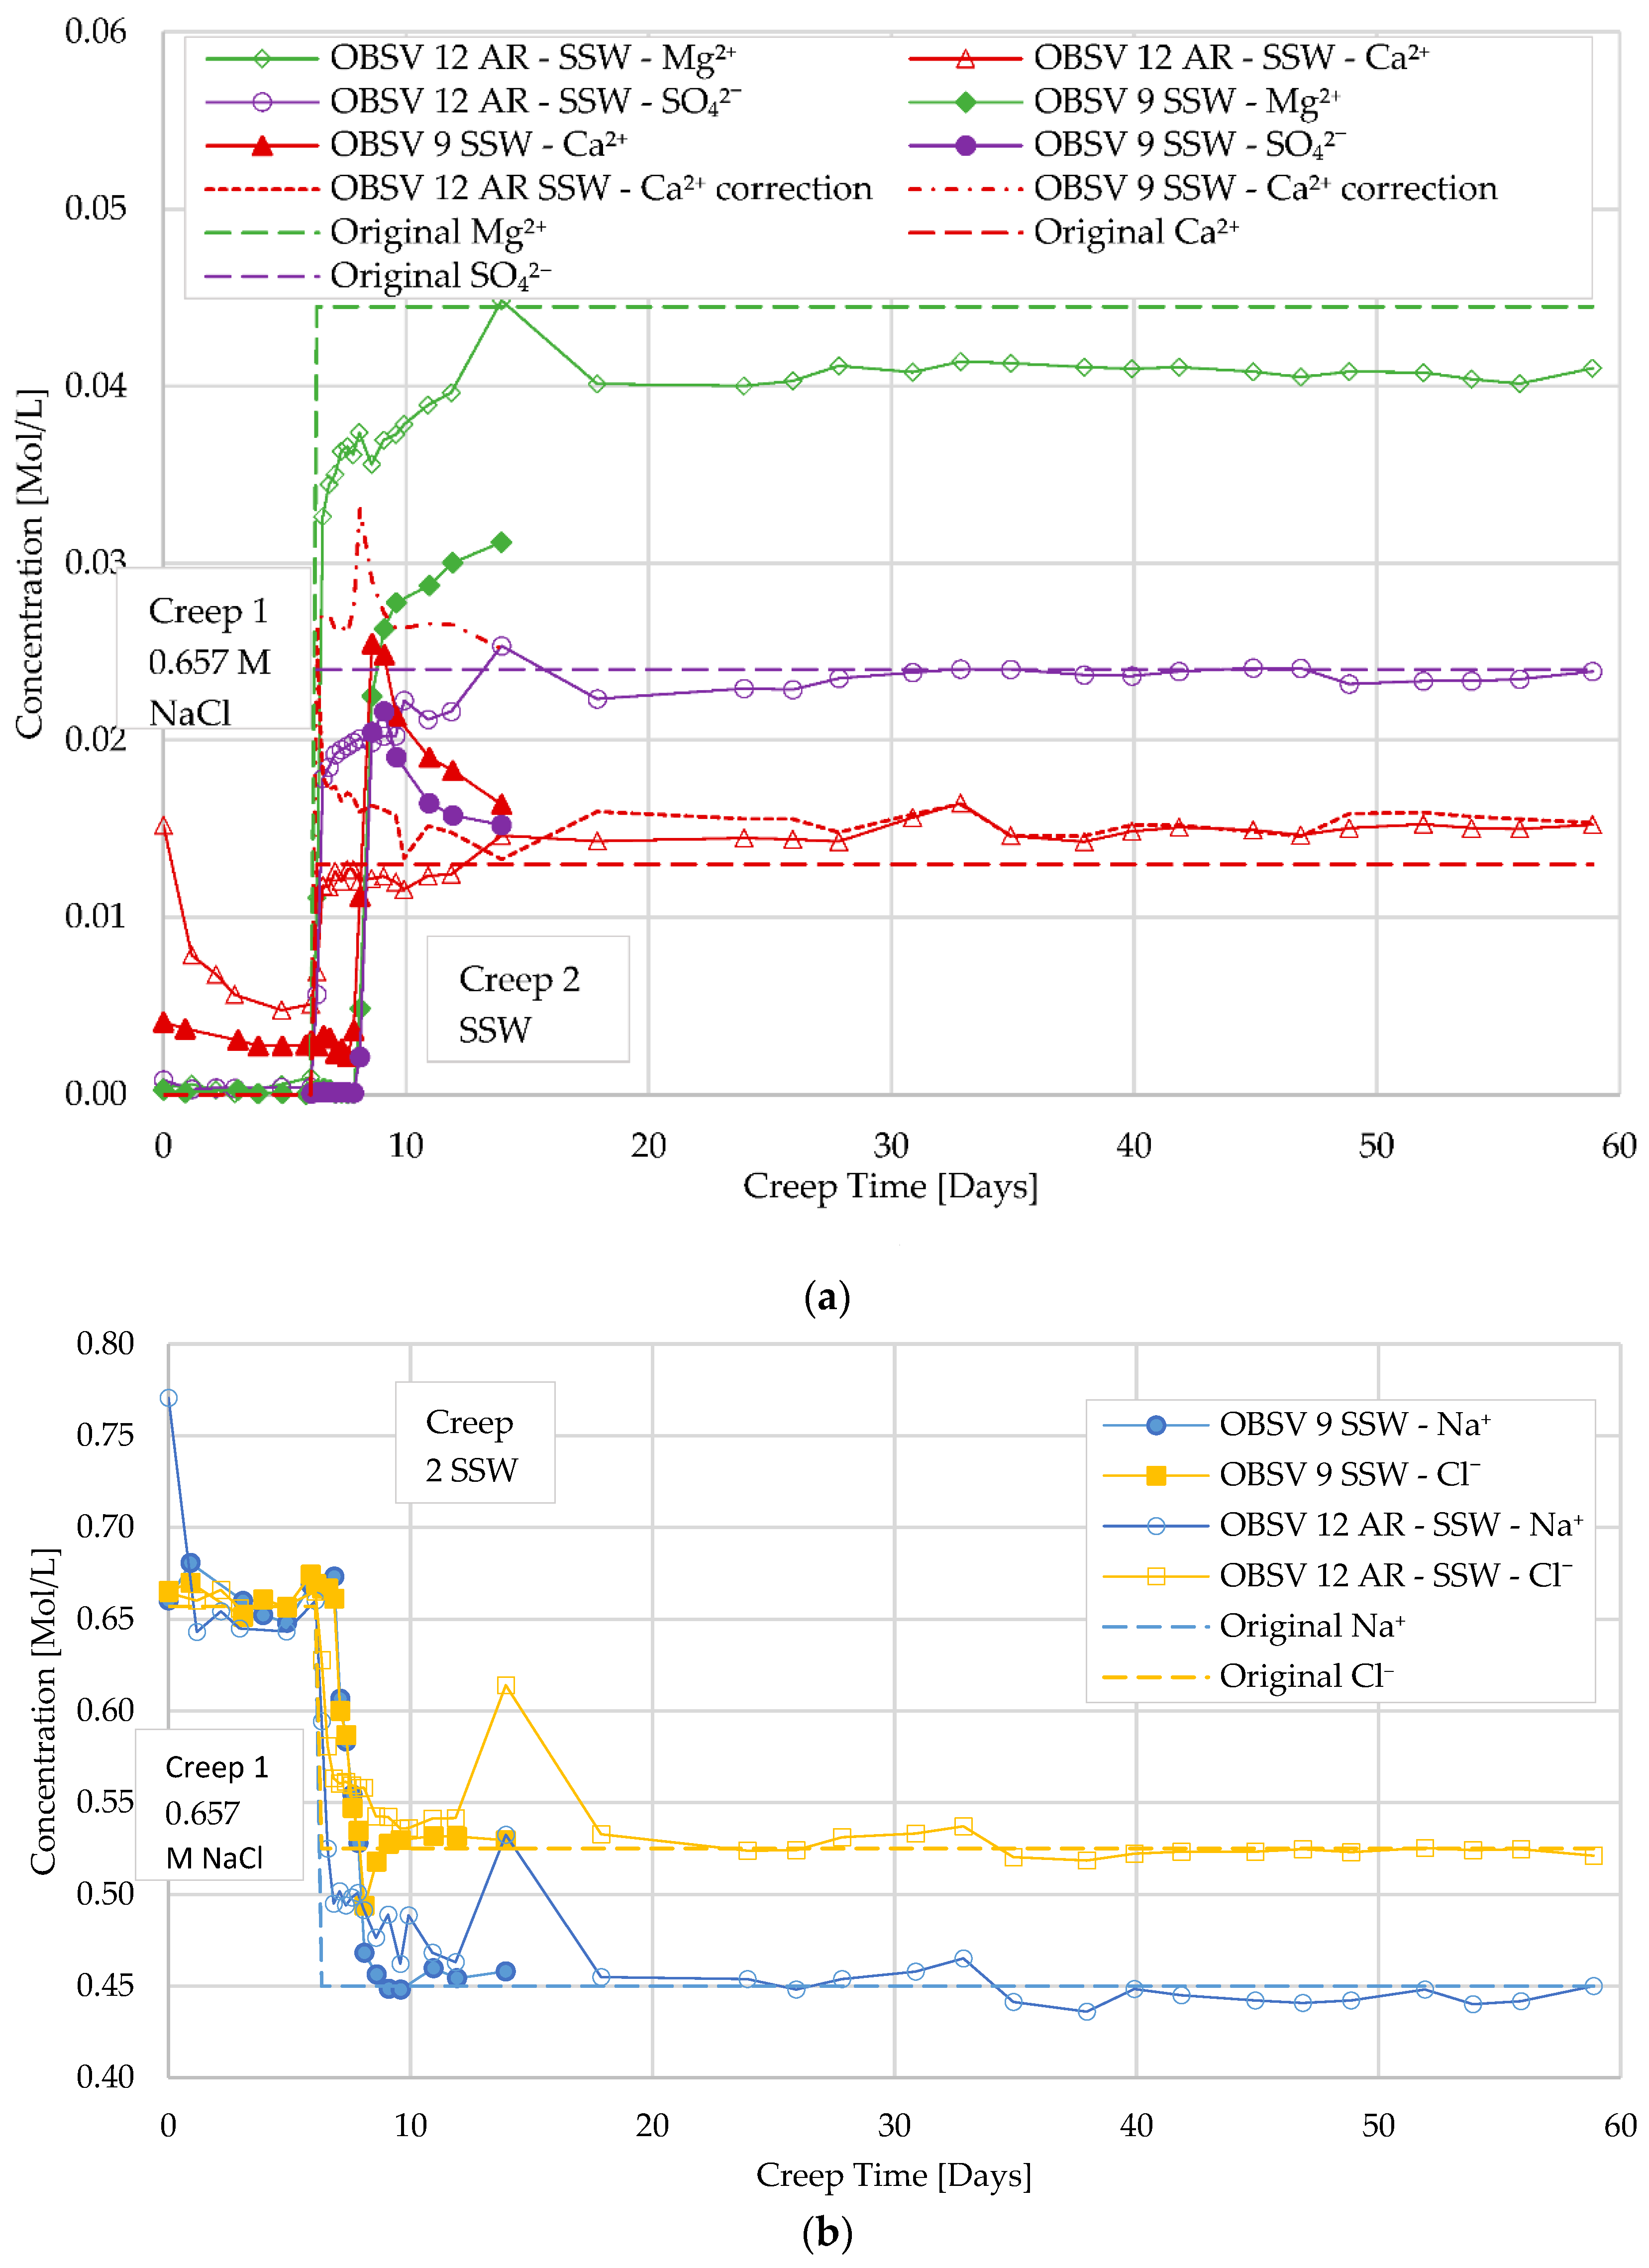
3.3. Ion Chromatography and Analysis of Effluent

The ion concentration of Ca2+, Mg2+, Na+, and Cl for OBSV 4 AF-MgCl2 and OBSV 6 MgCl2 oscillated around the original values of the injected brines during Creep 1 (Figure 4). The accuracy of the ion chromatography results is within 3%. A significant deviation from original concentrations was observed after brine change for both samples when the injected brine was switched to MgCl2 on the sixth day (Creep 2). The unfractured core, OBSV 6 MgCl2, spent 24 h before breakthrough of Mg2+ was observed, whereas the artificially fractured sample showed a breakthrough a few hours after brine change (Figure 4a). Both samples constantly lost Mg2+ to the core after brine change. Both samples showed a constant deviation from the injected concentration of Mg2+, which flattened out over time and showed 0.205 M MgCl2 for the unfractured sample and 0.213 M MgCl2 for OBSV 4 AF-MgCl2 at 45 days of testing. The artificially fractured OBSV 4 AF-MgCl2 instantly produced 0.010 M Ca2+, gradually increasing to a maximum level of 0.015 M Ca2+ 12 days after the brine change. The intact core (OBSV 6 MgCl2) started; however, production one day after brine change with a maximum level of 0.064 M Ca2+ was followed by a reduction of 0.018 M. The production gradually reduced yet kept a slightly higher production compared to the fractured core (OBSV 4 AF-MgCl2). Na+ and Cl gradually decreased towards the concentration of the injected brine within two days for the unfractured core (OBSV 6 MgCl2) (Figure 4b). The artificially fractured core (OBSV 4 AF-MgCl2) showed an instant drop in Na+ concentration when MgCl2 was injected but spent nine days until reaching the same concentration as the intact sample (the same injection rate was used for all tests (1 PV/day) based on matrix volume). A similar trend, yet less significant was observed for Cl.
SSW-flooded samples (OBSV 9 SSW and OBSV 12 AF-SSW) experienced a similar yet less significant response of Ca2+ dissolution and Mg2+ retention observed for the unfractured and artificially fractured cores flooded with MgCl2 in start of Creep 2 (Figure 5). Mg2+ breakthrough was observed instantly for the artificially fractured core flooded with SSW (OBSV 12 AF-SSW) and showed 0.036 M Mg2+ 24 h into Creep 2 (whereas it was 0.044 M Mg2+ in SSW). OBSV 9 SSW showed breakthrough after two days, with a more prominent loss of 0.021 M Mg2+. Ca2+ showed an instant breakthrough for OBSV 12 AF-SSW yet did not pass original concentrations until one week into Creep 2. A relative constant Ca2+ production of 0.0015 M persisted throughout the remaining test period. The SSW 9 SSW experienced a breakthrough of Ca2+ production again after two days with a maximum of 0.025 M, which gradually reduced. SO42 showed an instant breakthrough for OBSV 12 AF-SSW and reached original values after one week into Creep 2 and oscillated around original values thereafter. Again, a two-day delayed breakthrough was observed for OBSV 9 SSW, with a maximum level of 0.022 M SO42−, which rapidly reduced. SO42− loss is often linked with the precipitation of anhydrite (CaSO4), which in turn will lead to the same concentration of Ca2+ loss, a process that is corrected for in Figure 5.
Na+ and Cl oscillated around its original concentration during the first creep phase with NaCl injection. The intact core rapidly reduced the concentrations of Na+ and Cl to zero starting after only one day (earlier than the divalent ions) and returned to zero within two days during Creep 2 (Figure 5b), whereas the artificially fractured core, OBSV 12-SSW, Na+, and Cl spent five days to reduce concentration to zero.

3.4. Textural and Morphological Observation OLM

The three artificially fractured cores were sliced parallel and perpendicular to the flooding direction (Figure 6). OBSV 4 AF-MgCl2 presented a distinct boarder with empty space between the core matrix and the fracture “fill”. The filling (diameter of 2.75 mm) was not completely attached to the remaining core and has a white appearance (Figure 6d). The central part of the core (OBSV 12 AF-SSW) showed longitudinal accumulation of brownish green precipitate (Figure 6b,e), measuring a width < 1 mm. The border between the original core wall and new precipitated or redeposited minerals from the core was not possible to detect with optical light microscopy. The inner surface of the fracture (OBSV 18 AF-NaCl) presented a sheet-like texture with a beige colour, which stood out from the remaining pale grey core (Figure 6c).
The fracture aperture diameter measured approximately 2.25 mm before testing. The three artificially fractured cores, OBSV 4 AF-MgCl2, OBSV 12 AF-SSW, and OBSV 18 AF-NaCl, presented different values of vacant space after flooding (Figure 7). OBSV 18 AF-NaCl shows, on average, the lowest magnitude of aperture reduction, at 44%. OBSV 12 AF-SSW showed almost complete closure of the fracture aperture, with the first four slices being completely diminished, and an average reduction of 84%. OBSV 4 AF-MgCl2 reduced the aperture diameter by 76%. The vacant spaces varied depending on the distance from inlet.

3.5. Geochemistry

Geochemistry was measured on unflooded end slices and flooded core material (Figure 1). The unflooded end samples showed 5 wt.% (weight percent) noncarbonate material (summing Si, Al, Na, and K) (Table 3). Among those, the most abundant component was SiO2 (3.45 wt.%), followed by Al2O3 (1.02 wt.%). The average calcium concentration for reference samples was 52.00 (±0.37) wt.%. After testing, a reduction in CaO was measured for most slices in sample OBSV 6 MgCl2, with the most significant decrease occurring in the first few slices (Table 3). OBSV 4 AF-MgCl2 and OBSV 9 SSW also showed CaO reduction, but only the third slice in OBSV 4 AF-MgCl2 in addition to two slices in OBSV 9 SSW experienced a significant reduction in CaO concentration. The average MgO concentration was 0.28 wt.% for the reference samples. The highest concentration is observed for OBSV 6 MgCl2, with 1.50 wt.% in the second slice, with an almost linear reduction throughout the sample, measuring 1.01 wt.% for the outlet sample (OBSV 6 MgCl2 #7) (Table 3). OBSV 4 AF-MgCl2 experienced an increase of MgO concentration with a maximum of 0.99 wt.% in slice 4 (central core) and the lowest in the inlet slice (0.66 wt.%). MgO concentration increased in both cores flooded with SSW, but to a lesser extent than observed for the MgCl2-flooded cores. The unfractured core, OBSV 9 SSW, experienced the highest precipitation of MgO in the inlet slice of 0.55 wt.%, which linearly reduced towards the outlet. The artificially fractured core, OBSV 12 AR-SSW, showed the same trend as the artificially fractured core flooded with MgCl2 (OBSV 4 AF-MgCl2), with the highest concentration of 0.53 wt.% in slice three. The central fill in sample OBSV 4 AF-MgCl2 showed a completely different content compared to the matrix. Its inlet and outlet slices of the central fill showed a dominance of MgO of 41.01 and 42.68 wt.% and a CaO concentration of 1.95 and 4.11 wt.%, respectively (Table 3). The noncarbonate concentration was above ten and five percent for the inlet and outlet central fill, respectively.

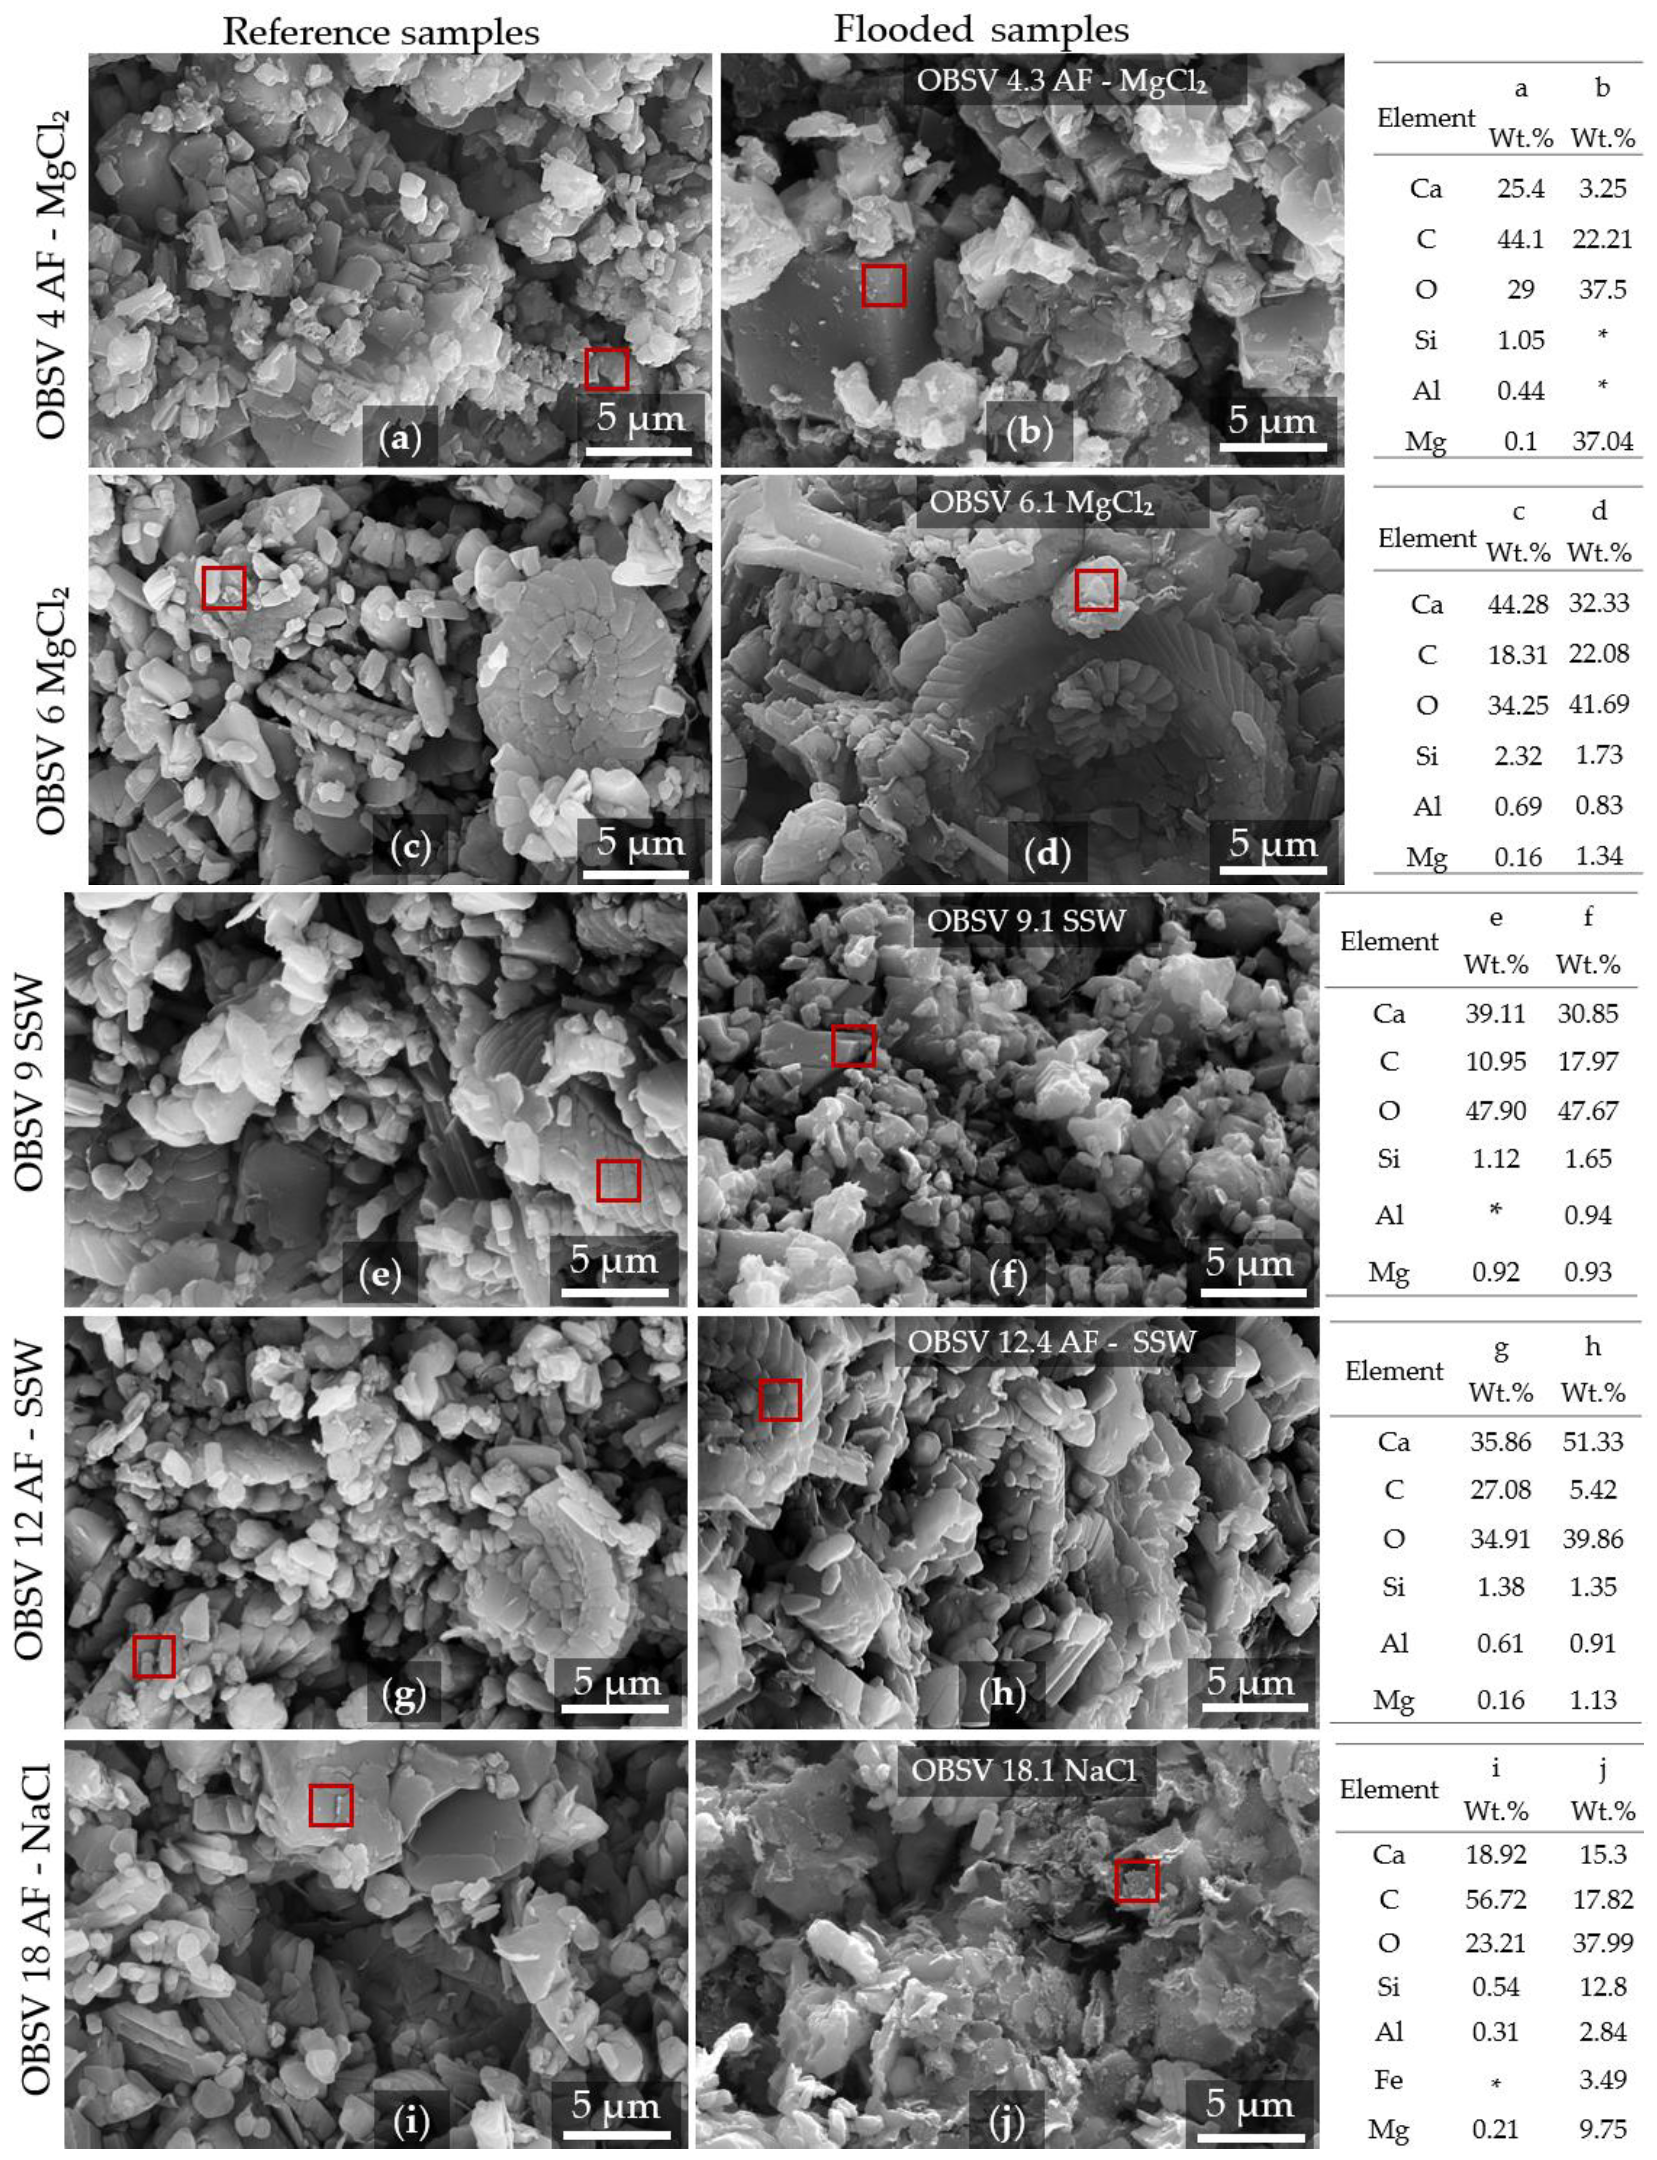
3.6. Field Emission Gun Scanning Electron Microscopy (SEM) and Energy Dispersive X-ray Spectroscopy (EDS)

Secondary electron (SE) images disclosed gross morphological and compositional variation when focusing on the surface of the fractures or the fracture fill (right column Figure 8) compared to the unflooded matrix (left column Figure 8). Coccoliths were not identified on the fracture surface of OBSV 4.3 AF-MgCl2 (Figure 8b). The most frequently present mineral was square-shaped with sizes up to seven µm and with a high concentration of Mg. OBSV 6.1 MgCl2 did not disclose any significant textural changes compared to its unflooded reference (Figure 8c). OBSV 9.1 SSW was dominated by coccolithophore debris, such as the unflooded material (Figure 8e). No significant textural differences were observed for the fracture fill in OBSV 12.4 AF-SSW compared to its unflooded reference. The inner surface of the fracture of OBSV 18.1 AF-NaCl was dominated by flaky shaped minerals with high concentrations of Si, Mg, Fe, and Al (Figure 8j).

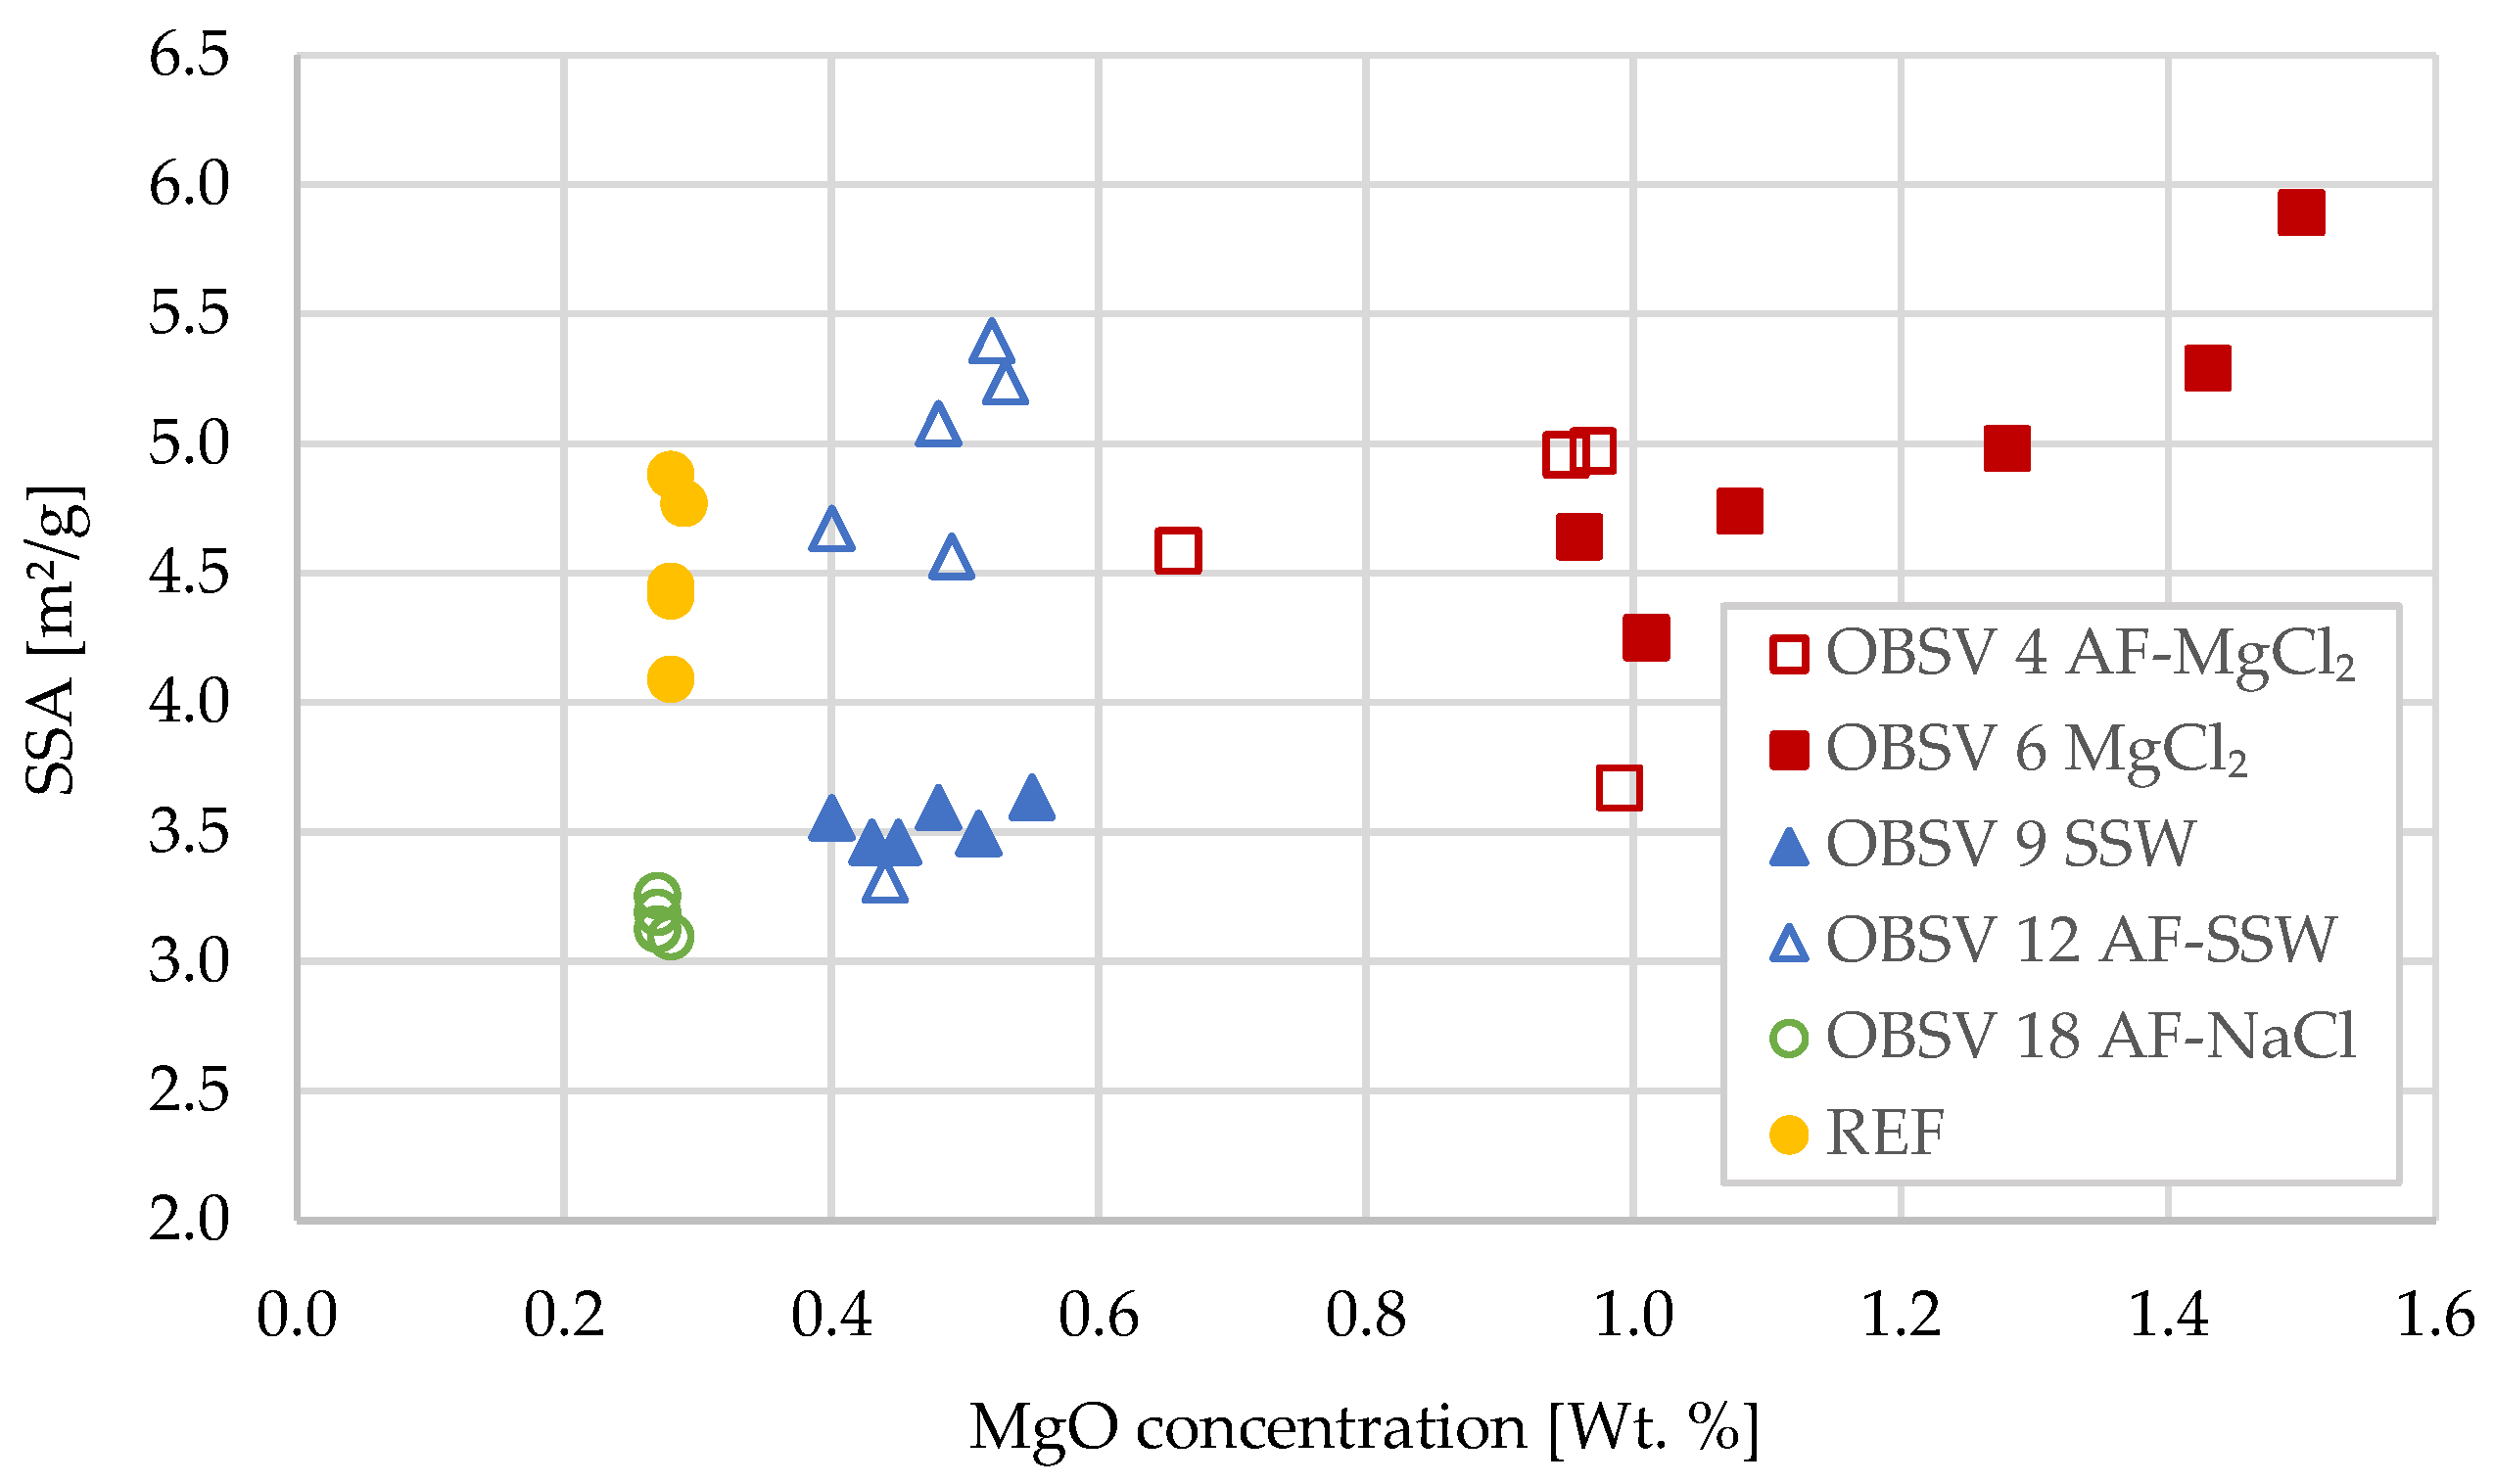
3.7. Specific Surface Area (SSA)

SSA for unflooded reference slices held an average of 4.60 m2/g with a high normal distribution of ±1.35, which is related to a different cleaning procedure than flooded samples. An average of 4.52 (±0.16) m2/g was measured for the same samples in a larger SSA study by Wen S.T.S. (2018) [30]. For flooded samples, material from the outer rim of the core was sampled. OBSV 6 MgCl2 showed the highest surface area for the second slice with 5.89 m2/g, followed by a linear decrease towards the outlet of the core (slice 7) (Table 4), which held 4.25 m2/g. OBSV 4 AF-MgCl2 showed a maximum of 4.97 m2/g in the third slice and lowest in slice four (3.67 m2/g). OBSV 9 SSW showed stable values (averagely 3.53 m2/g), with significantly lower SSA compared to the unflooded samples. OBSV 12 AF-SSW showed a reduction only in the first slice (3.32 m2/g) and a few slices with increased SSA, with a maximum of 5.40 m2/g in the fourth slice. OBSV 18 AF-NaCl distributed stable (3.16 m2/g) and significantly lower SSA compared to the reference.

4. Discussion

4.1. Water-Weakening Effect versus Composition of Brine Injected

OBSV 18 AF-NaCl experienced the lowest compaction rate during Creep 2, as expected, since NaCl is inert to chalk. Both the MgCl2-flooded cores (OBSV 4 AF-MgCl2 and OBSV 6 MgCl2) experienced a more prominent compaction rate than the OBSV 18 AF-NaCl sample. In an experimental study by Megawati et al. (2011) [14], a link between the increased compaction rate and the dissolution of Ca2+ with the simultaneous precipitation of Mg2+ was observed while flooding chalk cores with brine-containing Mg2+. Researchers have discussed that the weakening of chalks, when injecting Mg2+, may be related to the dissolution of calcite and the precipitation of secondary minerals such as magnesite and magnesium carbonate-bearing clay minerals [31,32]. Madland et al. (2011) [11] discussed the hypothesis that the precipitation of secondary minerals enhanced dissolution, which will lead to increased creep. The higher compaction rate and lowering of porosity for SSW-flooded cores compared to MgCl2-flooded cores (Figure 3b) may be linked to the dissolution and reprecipitation of noncarbonate minerals, possibly clays, which enhanced the compaction for SSW-flooded cores. The two cores flooded with SSW surpassed the strain rate of the two samples flooded with MgCl2. This difference in compaction (related to composition of the injected brine) was evidenced despite the SSW-flooded samples producing lower amounts of Ca2+ and a modest retention of Mg2+ compared to the MgCl2-flooded samples. All samples showed homogeneous properties in terms of strength (yield and bulk modulus) and geochemistry. The distinct compaction rates (Creep 2) for the various brine points to effects caused by different ions in the injected brine, hence the dissimilar chemical and chemo-physical processes. Adsorption of SO42− to calcite surfaces is believed to play a key role in water weakening. Madland et al. (2008) [33] showed that Kansas chalk samples (with purity of 99% calcite) flooded with SSW without the presence Mg2+ experienced a considerable amount of compaction; however, experiments performed with SSW without SO42− experienced a lower compaction rate than the SSW-flooded samples. Megawati et al. (2013) [12] showed that SO42− ions present in a brine to adsorb the chalk surface, resulting in a negative surface charge, which triggers the occurrence of repulsive forces at granular contacts, thus reducing the cohesion between grains. They also reported a link between the escalating strain and the increased concentration of SO42− in the injecting brine and test temperature. Kallesten et al., 2020 [34], however, observed in reservoir samples that a MgCl2-flooded sample compacted more than a sample flooded with SSW. This may imply that the presence of noncarbonate phases influence chemo-physical processes, and that the role of SO42− is yet not completely understood in the presence of clays.

4.2. Compaction Rate in Artificially Fractured Samples versus Unfractured

The artificial fractures had no significant effect on the mechanical strength during hydrostatic loading with NaCl injection and distributed similar strength in terms of yield and bulk modulus (Table 2 and Figure 2). During Creep 1, still injected with NaCl, ion chromatography analysis identified concentrations that straddled original values. This points to no or minimal chemical interaction with the tested rock samples and strengthened the interpretation that NaCl is inert (compilation in Andersen et al., 2017 [4]). However, all three artificially fractured cores showed a higher strain rate (Figure 3a) than the two intact cores during Creep 1. This lowering of mechanical strength above yield stress may indicate that the artificial fracture is significant despite a small aperture of 2.25 (±0.05) mm versus a total diameter of 38.1 mm and thereby present a lower bulk volume to withstand the effective overburden pressure. The cores became shorter, and the artificially fractured diameter reduced as a result of axial and radial strain forcing the matrix into void space.
The injection fluid was changed from NaCl to SSW and MgCl2 for two fractured and two intact cores in Creep 2 (Figure 3b). The result demonstrated an increased compaction rate for all cores injected by either MgCl2 or SSW. At the start of the brine change, the two unfractured samples (OBSV 6 MgCl2 and OBSV 9 SSW) showed a higher creep rate compared to their paired artificially fractured samples injected with the same brine (OBSV 4 AF-MgCl2 and OBSV 12 AF-SSW). The increased deformation rate observed for the unfractured cores is suggested to be a result of the entire core matrix being immediately in contact with the flooding brine. For the cores containing an artificial fracture, the ions in the brine spent longer time to diffuse into the matrix and used the open fracture as a “highway” through the core. This delayed fluid transport to peripheral parts of the sample and is reflected in the ion chromatography results, where two of the artificially fractured cores (OBSV 4 AF-MgCl2 and OBSV 12 AF-SSW) showed Ca+ production/Mg+ retention similar to unfractured cores (OBSV 6 MgCl2 and OBSV 9 SSW), albeit in a lower rate and with a later onset (Figure 4 and Figure 5). The ion concentration (Na+ and Cl) lasted approximately seven days until the effluent achieved the same composition as the injected brine. The unfractured cores returned, however, to stable levels after one day, which reflects the injection rate of one PV/day and an immediate contact with matrix (Figure 4 and Figure 5). The higher creep rate observed for OBSV 4 AF-MgCl2 and OBSV 12 AF-SSW, compared to OBSV 18 AF-NaCl, which showed a lower compaction rate (Figure 3b) and NaCl is believed to be chemically inert to chalk, evidencing that chemical water-weakening is certainly present in peripheral locations despite the low matrix permeability and was therefore caused by ion diffusion (Table 2).

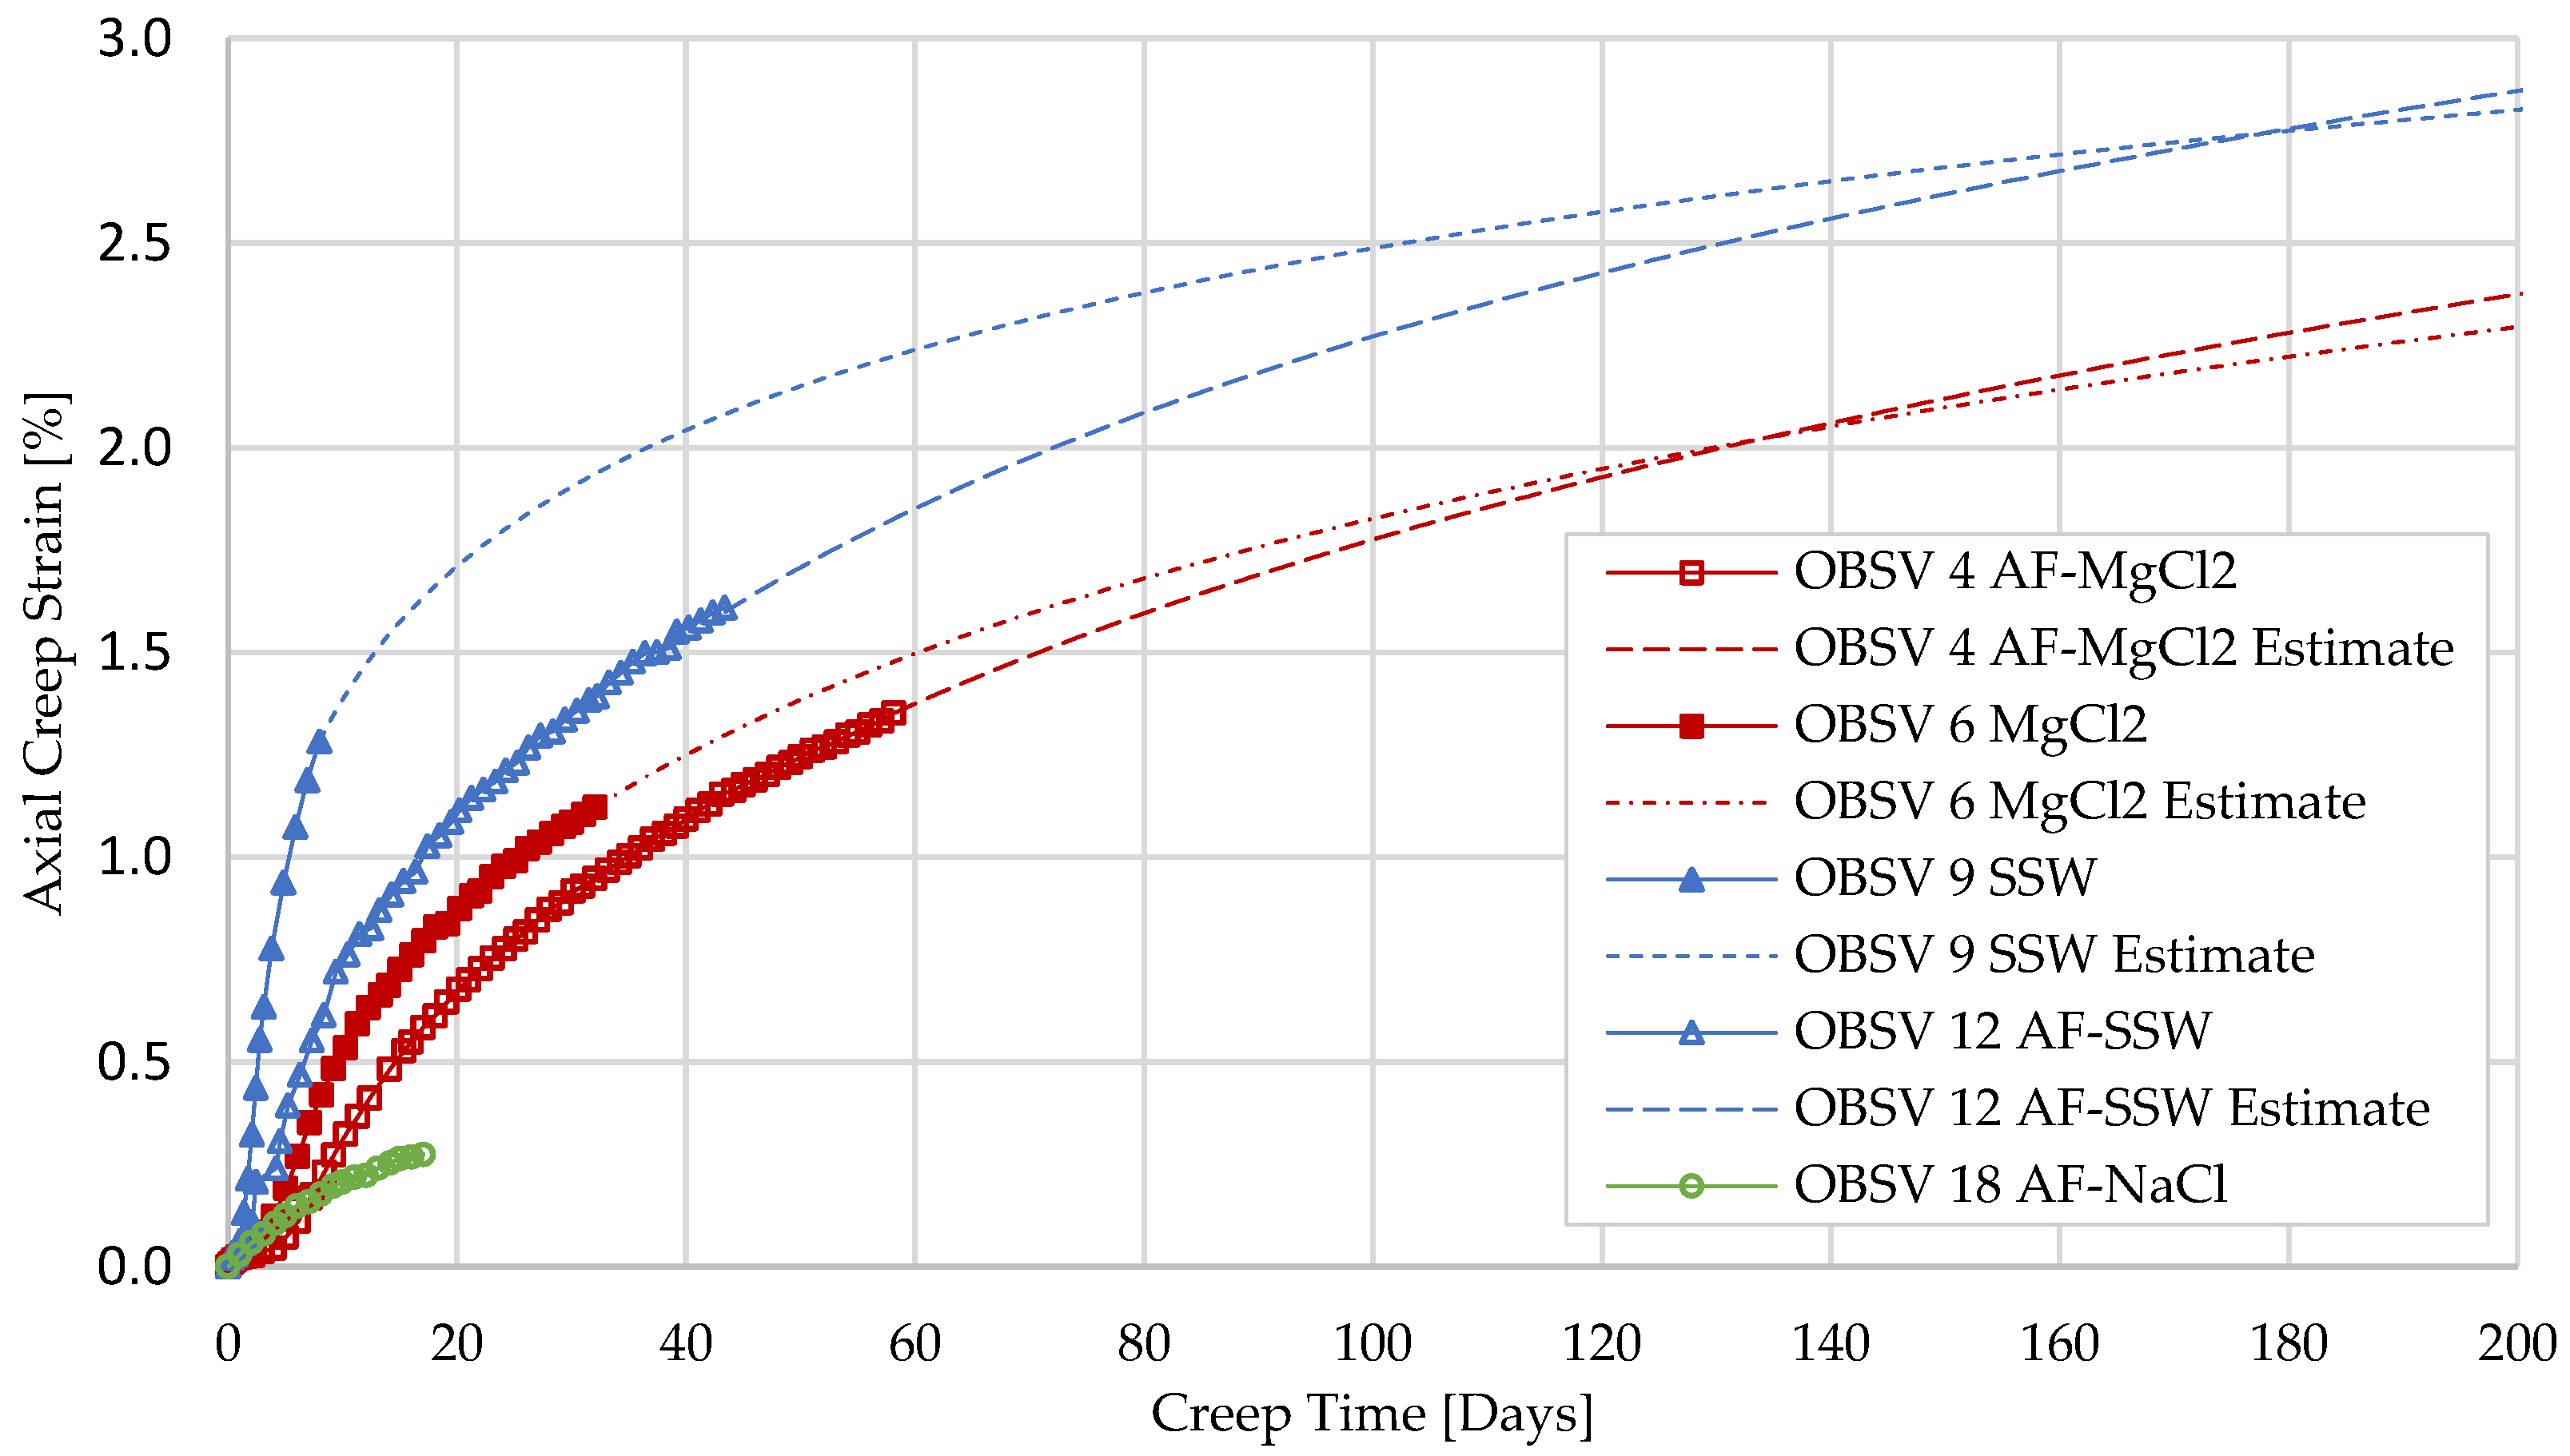
4.3. Extrapolation of Compaction

The results showed that artificially fractured cores were mechanically weaker when no (or limited) brine–rock interactions took place during the primary creep phase under NaCl injection (Creep1). On the contrary, we observed a predominant compaction for unfractured samples during Creep 2, when brines with surface active ions such as Mg2+ and SO42− were injected. However, unfractured and artificially fractured compaction behaviour, along with effluent data (Figure 4 and Figure 5), showed that these creep rates stagnated most evidently for the two unfractured cores (OBSV 6 MgCl2 and OBSV 9 SSW). An extrapolated logarithmic behaviour (Equation (3)) of the geo-mechanical response (Figure 9) illustrates that artificially fractured cores, with the same composition of the injected brine, may be geomechanically weaker after ruffly four to six months despite the experimental creep rates showing the opposite (complete description of methodology in Madland et al. (2006) [28] and statistical references for applicability in [4,10,11]). Regardless of the delayed ions’ diffusion from the high permeable fracture to the matrix, water weakening will eventually take place in the entire core. It is therefore possible that an unfractured sample will experience less creep over time than an artificially fractured sample, despite an instant onset of water weakening when surface-active ions are injected. Moreover, the artificially fractured sample experienced lower mechanical resilience caused by the presence of the fracture, showing water weakening in peripheral locations by ion diffusion from the main fluid transport through the fracture. This process is dependent on matrix permeability, the size of the fracture aperture, the distance of the ion diffusion from the fracture and duration of brine injection. A longer test duration in future experiments may verify if artificially fractured samples or unfractured samples are most prone to compact in the long run.
These results may be considered as a primary approach to decipher dynamic reservoir conditions caused by fracture alterations. Future laboratory experiments may repeat testing for the verification of test results and include geological evolution, including different formation properties related to a hydrocarbon play and identify its statistical significance and modification of hydrocarbon production. This also refers to a thorough evaluation with a variety of analytical techniques to describe the reservoir [35], which, in the next phase, would be applied for modelling fracture behaviour [36].

4.4. Textural Alterations versus Mineral Precipitation

OBSV 18 AF-NaCl was added to the experiment as a reference sample as it is expected to produce minute mineralogical changes [11,13]. Geochemistry did not disclose chemical differences from unflooded samples. The SSA measurements showed, however, a reduced SSA (Table 4). A similar reduction in SSA was observed by Andersen et al. (2017) [4] in Aalborg chalk (Maastrichtian Cretaceous) rich in opal CT, where SSA reduced from 4.9 to 2.1 m2/g for the inlet slice and identified a reduction in opal CT. The core was flooded with NaCl at 130 °C. For pure chalk samples, reduction in SSA was, however, not significant. Samples with higher noncarbonate content also showed the highest dissolution of Ca2+ of 0.004 M (near the detection limit) in the effluent compared to chalk samples with purer concentrations of CaCO2. Another study on Aalborg samples, also flooded under a temperature of 130 °C, (Minde et al., 2018) [10], showed the same SSA reduction when flooding with NaCl. Additionally, they observed the rounding of calcite grains. Since chemical alteration is in this study unexpected, the SSA reduction is interpreted to be related to the rounding of grain surfaces by dominantly physio-mechanical forces.
OBSV 6 MgCl2 experienced the most significant precipitation of MgO-containing phases, predominantly in the inlet slices, which gradually decreased towards the outlet (Table 3). Simultaneously, OBSV 6 MgCl2 also experienced the greatest increase in SSA, again with the most significant SSA alteration in the inlet and decreasing towards the outlet slice (Table 4). The link between the abundance of phases enriched in MgO and increased SSA (Figure 10) supports the interpretation that these phases are secondary products that are also present in previous EOR experiments [4,37]. Another possible reason for increased SSA (OBSV 6 MgCl2) could be a stepwise chemical dissolution of coccoliths (calcite) producing a rougher surface, thus increasing the SSA (or, potentially the reprecipitation of small calcite particles). The fractured OBSV 12 AF-SSW showed similar precipitation of MgO-containing phases as the intact OBSV 9 SSW; however, the SSA is generally higher for the fractured OBSV 12 AF-SSW. The higher SSA in OBSV 12 AF-SSW could be related to the crystallization of ions in the brine despite a thorough cleaning procedure passing three times the volume used in standard cleaning procedures.

4.5. Aperture Modification versus Strain

Bulk permeability estimates depend on anisotropy as fracture density, orientation, aperture size distribution, and fracture versus matrix permeability. Seawater injection will introduce water weakening, altering matrix permeability. Fracture aperture modification may change fracture permeability and complicate the prediction of flow behaviour through a reservoir. Here, permeability was calculated for the two intact cores, which experienced a reduction as water weakening proceeded (Table 2). Porosity reduction was observed for all samples (Table 2). Textural (Table 2) and bulk geochemistry data (Table 3) suggest also that the peripheral matrix, adjacent to the fracture fill, has been changed, which could indicate reduced matrix permeability for artificially fractured cores despite the great permeability difference between fracture versus matrix. Caine et al. (1996) [20] suggested that, despite low matrix permeability, it may not necessarily act as a barrier to flow, especially during compaction. All three samples reduced the overall fracture aperture in this experiment to different extents. Gale et al., 2010 [38], showed that cement accumulated gradually at rates governed by temperature history. They suggested that cement patterns in fractures are a consequence of the surface areas and volumes of the fractures of various sizes. Fracture connectivity may reduce by filling the narrow tips of fractures and small fractures in addition to cement reducing overall open-fracture length and connectivity [18]. The geochemistry result of the fracture fill, which was detached from the surrounding matrix in OBSV 4 AF-MgCl2, showed a predominance of MgO (42 wt.%) and higher SiO2 and Al2O3 compared to the matrix (Table 3). This indicates a higher concentration of noncarbonate phases in the fracture fill compared to the surrounding matrix. The exact mineralogy present in the fracture fill will be further analysed and discussed in a follow up article. Mainly coccoliths with an abundance of a flaky noncarbonate phase were identified (Figure 6 and Figure 8) in the fracture fill of OBSV 12 AF-SSW and OBSV 18 AF-NaCl. The presence of intact coccoliths in the fracture fill (Figure 8) may be related to an aperture reduction caused by mechanical forces, pushing the matrix to void spaces in the fracture during creep (Figure 11).
The overall fracture apertures were reduced for all three artificially fractured samples throughout the cores, from inlet to outlet, and have been suggested to be caused by a combination of mechanical and chemical consequences. The experiment was performed under hydrostatic test conditions, where radial strain was not measured, yet was expected to execute the similar strain as identified in the axial direction and thereby contribute to the fracture modification. OBSV 12 AF-SSW experienced the most significant aperture diameter reduction of 84%, which also experienced the highest total strain of 4.16%, where 2.66% compacted during loading and Creep 1 (NaCl injection) and 1.50% compacted during Creep 2 under injection of SSW (Table 2). On average, OBSV 4 AF-MgCl2 reduced the aperture diameter by 76%. Moreover, OBSV 4 AF-MgCl2 experienced a total axial strain of 3.41% (Table 2), where 2.06% strain was identified during loading and Creep 1 (NaCl injection), and 1.35% strain was detected during MgCl2 injection in Creep 2. The OBSV 18 AF-NaCl experienced the lowest total strain (2.51%) (where 2.24% was related to loading and Creep 1 and only 0.27% strain was detected during Creep 2) and showed the smallest aperture reduction of 44% (Figure 7). A relationship between strain and aperture reduction is very likely. A linear relationship was drawn from origo through the reference sample of OBSV 18 AF-NaCl, representing the relationship between increased strain and a reduction in aperture diameter caused by mechanical forces alone, as NaCl did not cause any chemical alteration (Figure 12). This demonstrates that the additional reduction (deviation from the linear relationship) may indicate additional aperture reduction caused by chemical alteration. The deviation indicated that OBSV 4 AF-MgCl2 experienced the steepest curve for Creep 2, which was caused by mineral precipitation. Furthermore, OBSV 12 AF-SSW also showed an additional reduction (steeper curve) than the OBSV 18 AF-NaCl caused by dissolution and precipitation processes. Ion chromatography strengthen this relationship, with a more prominent ion exchange (dissolution of Ca2+ and precipitation of Mg2+) present in OBSV 4 AF-MgCl2 compared to OBSV 12 AF-SSW (Figure 4 and Figure 5). Higher precipitation of MgO in OBSV 4 AF-MgCl2 compared to OBSV 12 AF-SSW was also confirmed by geochemistry (Table 3), which enhances this theory. Future experiments with several fracture diameters flooded with primarily NaCl could confirm a more accurate relation between creep and fracture modification before adding several experiments with brines expected to generate dissolution and precipitation processes contributing to the additional reduction of an aperture.
The detached fracture fill of OBSV 4 AF-MgCl2 (Figure 6a,d) was dominated by MgO (Table 3) and measured a larger diameter of 2.75 mm (Figure 11) compared to the initial aperture of 2.25 (±0.05) mm. Two simultaneous processes have been identified for OBSV 4 AF-MgCl2 affecting the modification of the artificial fracture: reduction of the fracture aperture caused by axial and radial strain, simultaneously with Ca2+ dissolution/Mg2+ precipitation (Figure 4) predominantly along the fracture wall.

5. Conclusions

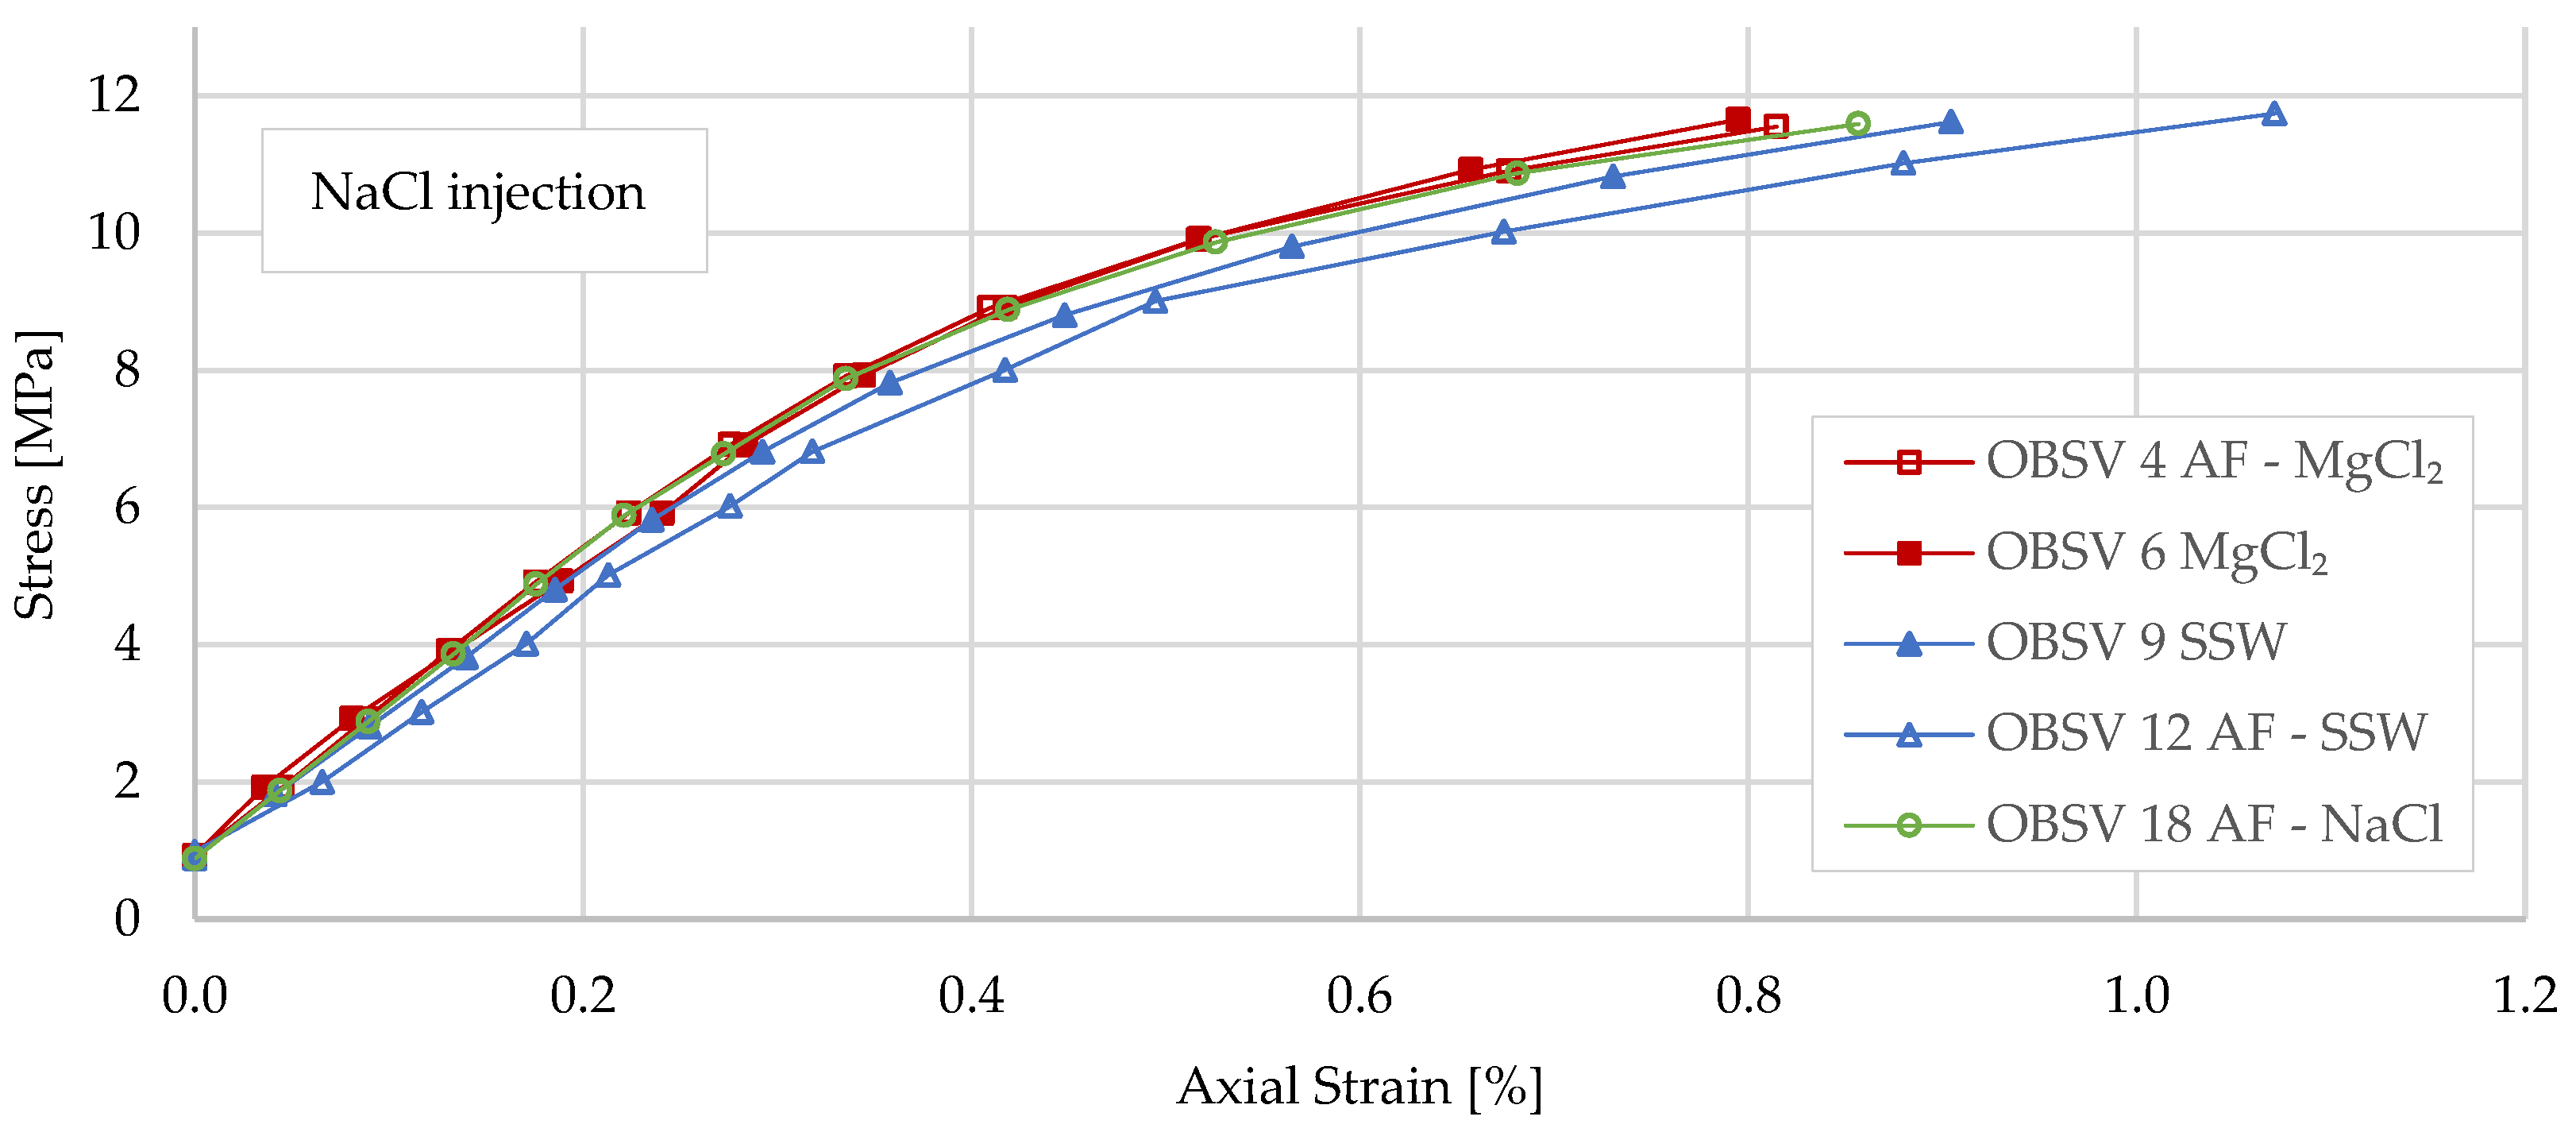
  • Flooded samples showed no significant difference in yield strength during loading when comparing unfractured with artificially fractured samples;
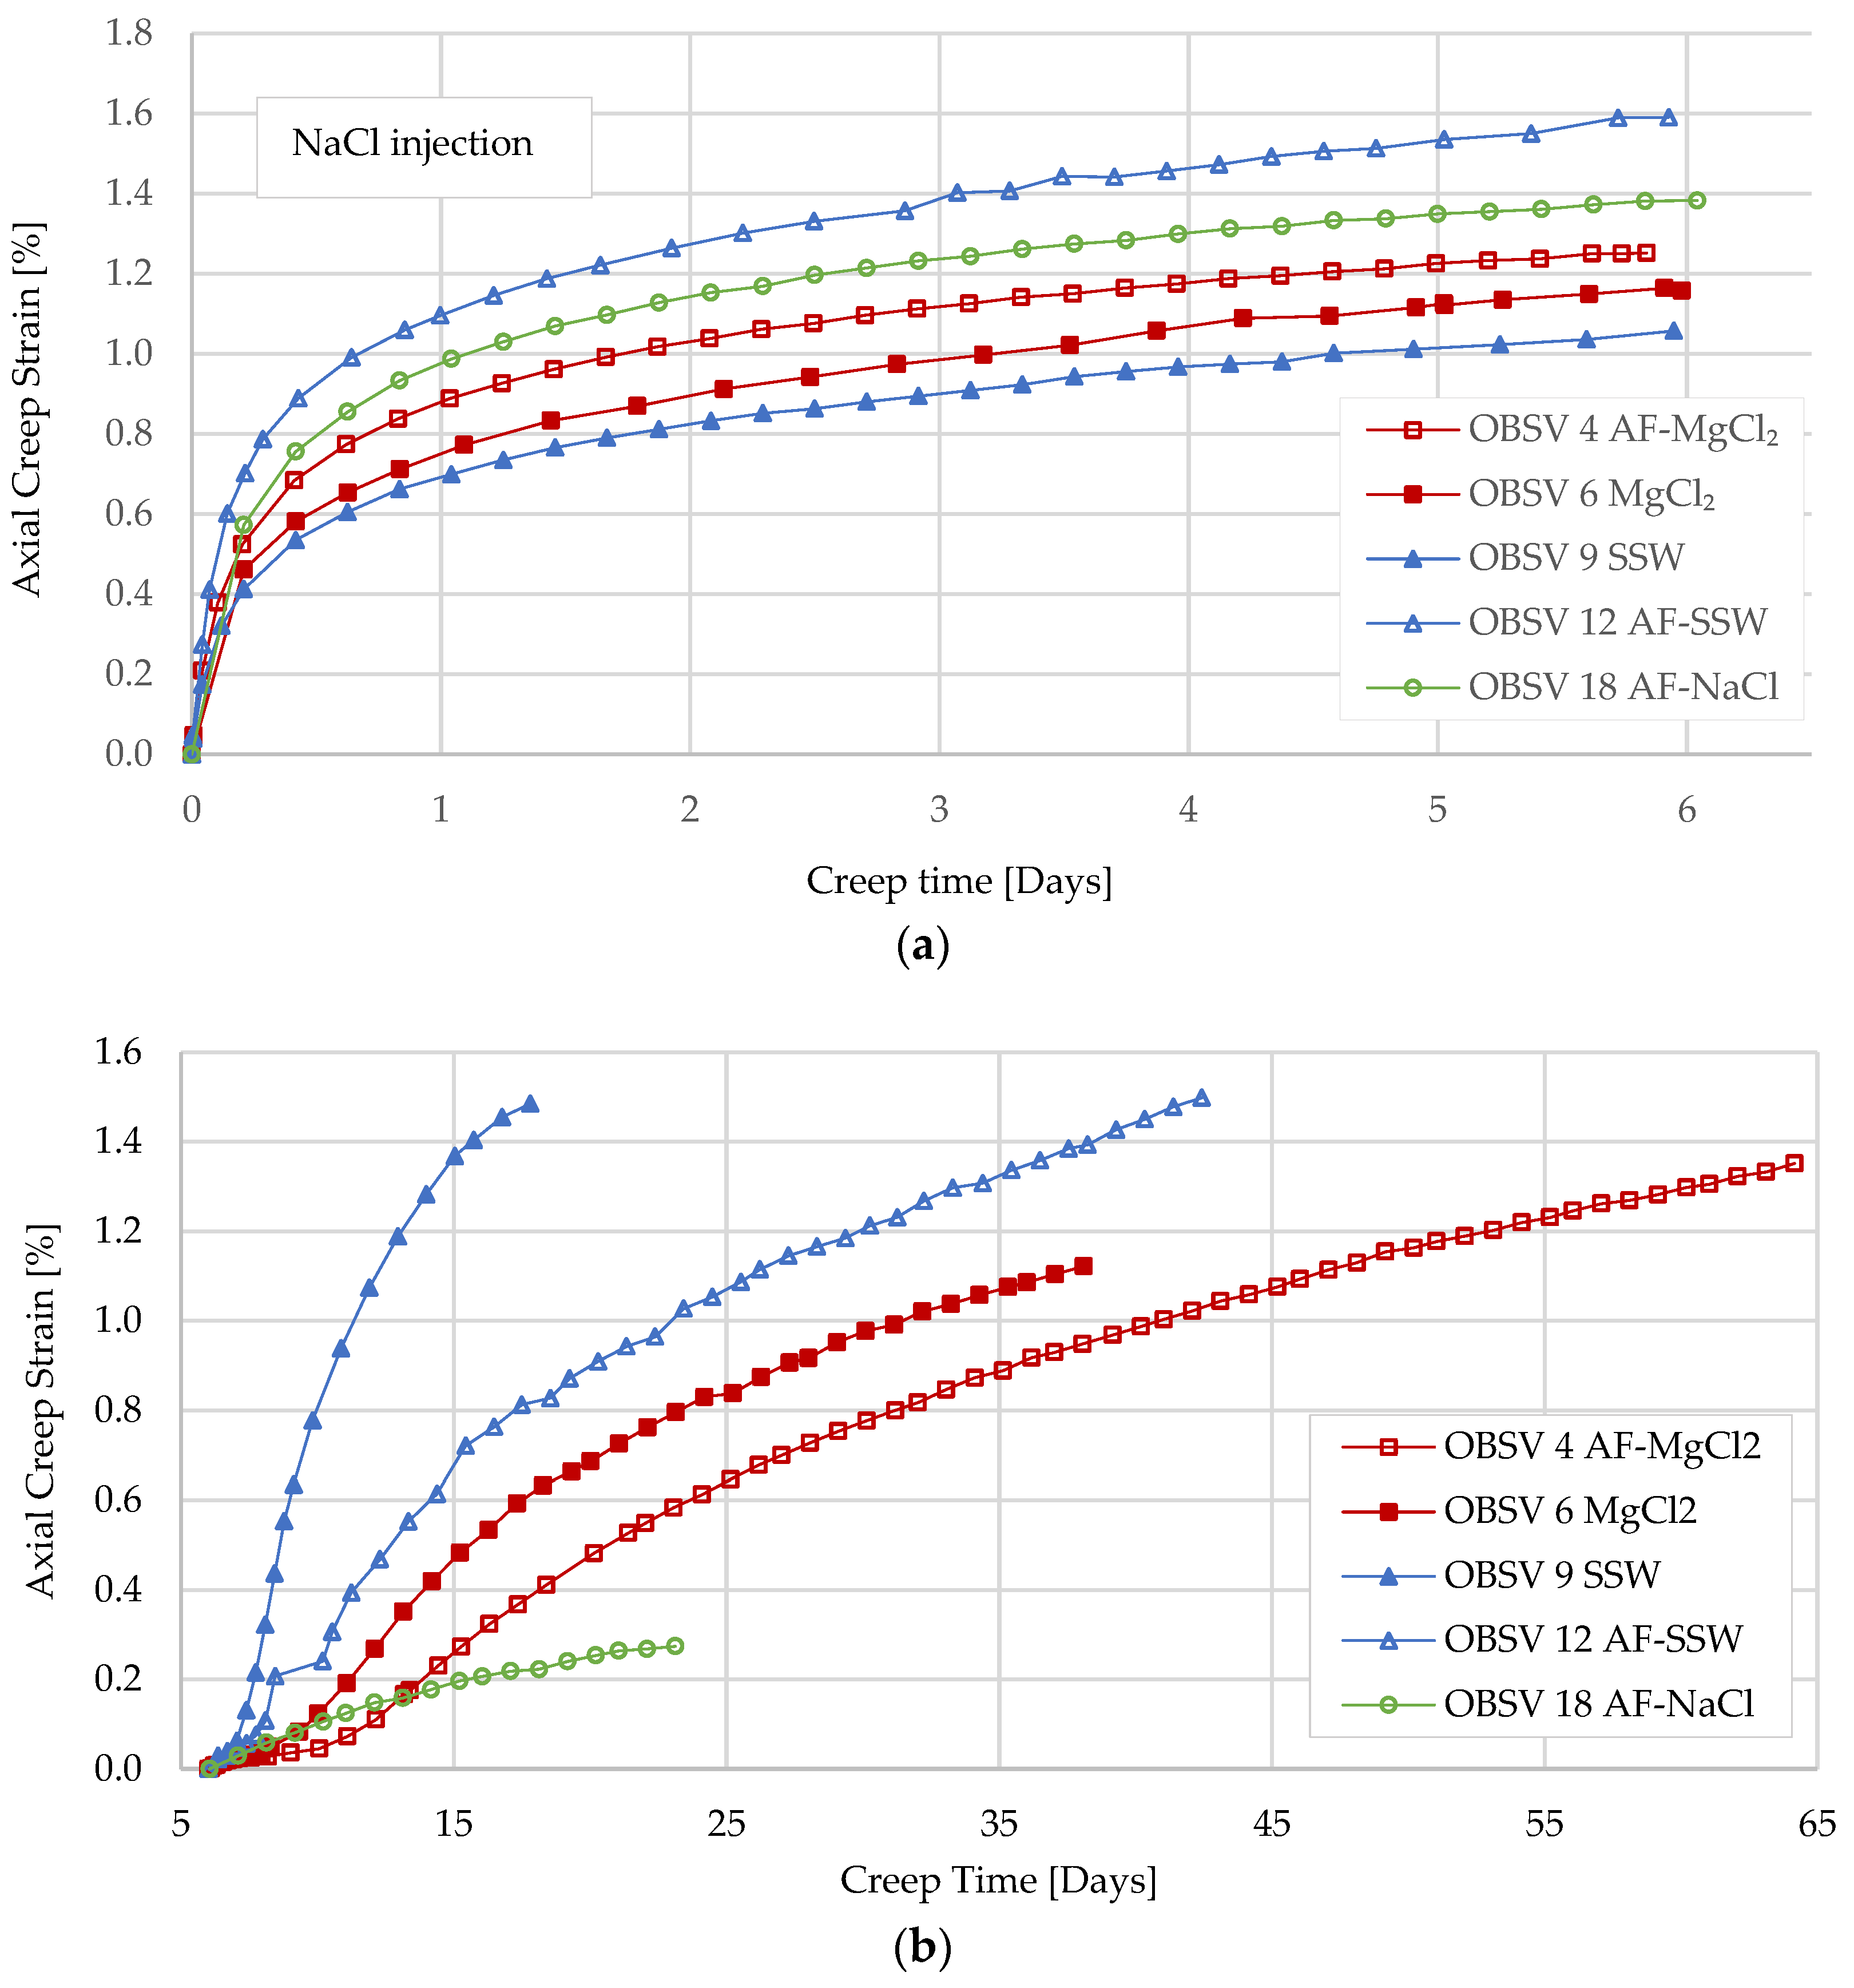
  • Compaction during NaCl injection showed that artificially fractured cores experienced significantly higher axial strain compared to unfractured samples;
  • Water weakening was identified during injection of SSW and MgCl2 for unfractured and artificially fractured cores. Geo-mechanical response indicated that water weakening is activated shortly after injecting brines with surface-reactive ions (SSW and MgCl2) for unfractured samples. The artificially fractured samples showed a later onset of the increased compaction rate compared to the unfractured samples. Effluent data supported the water-weakening effect;
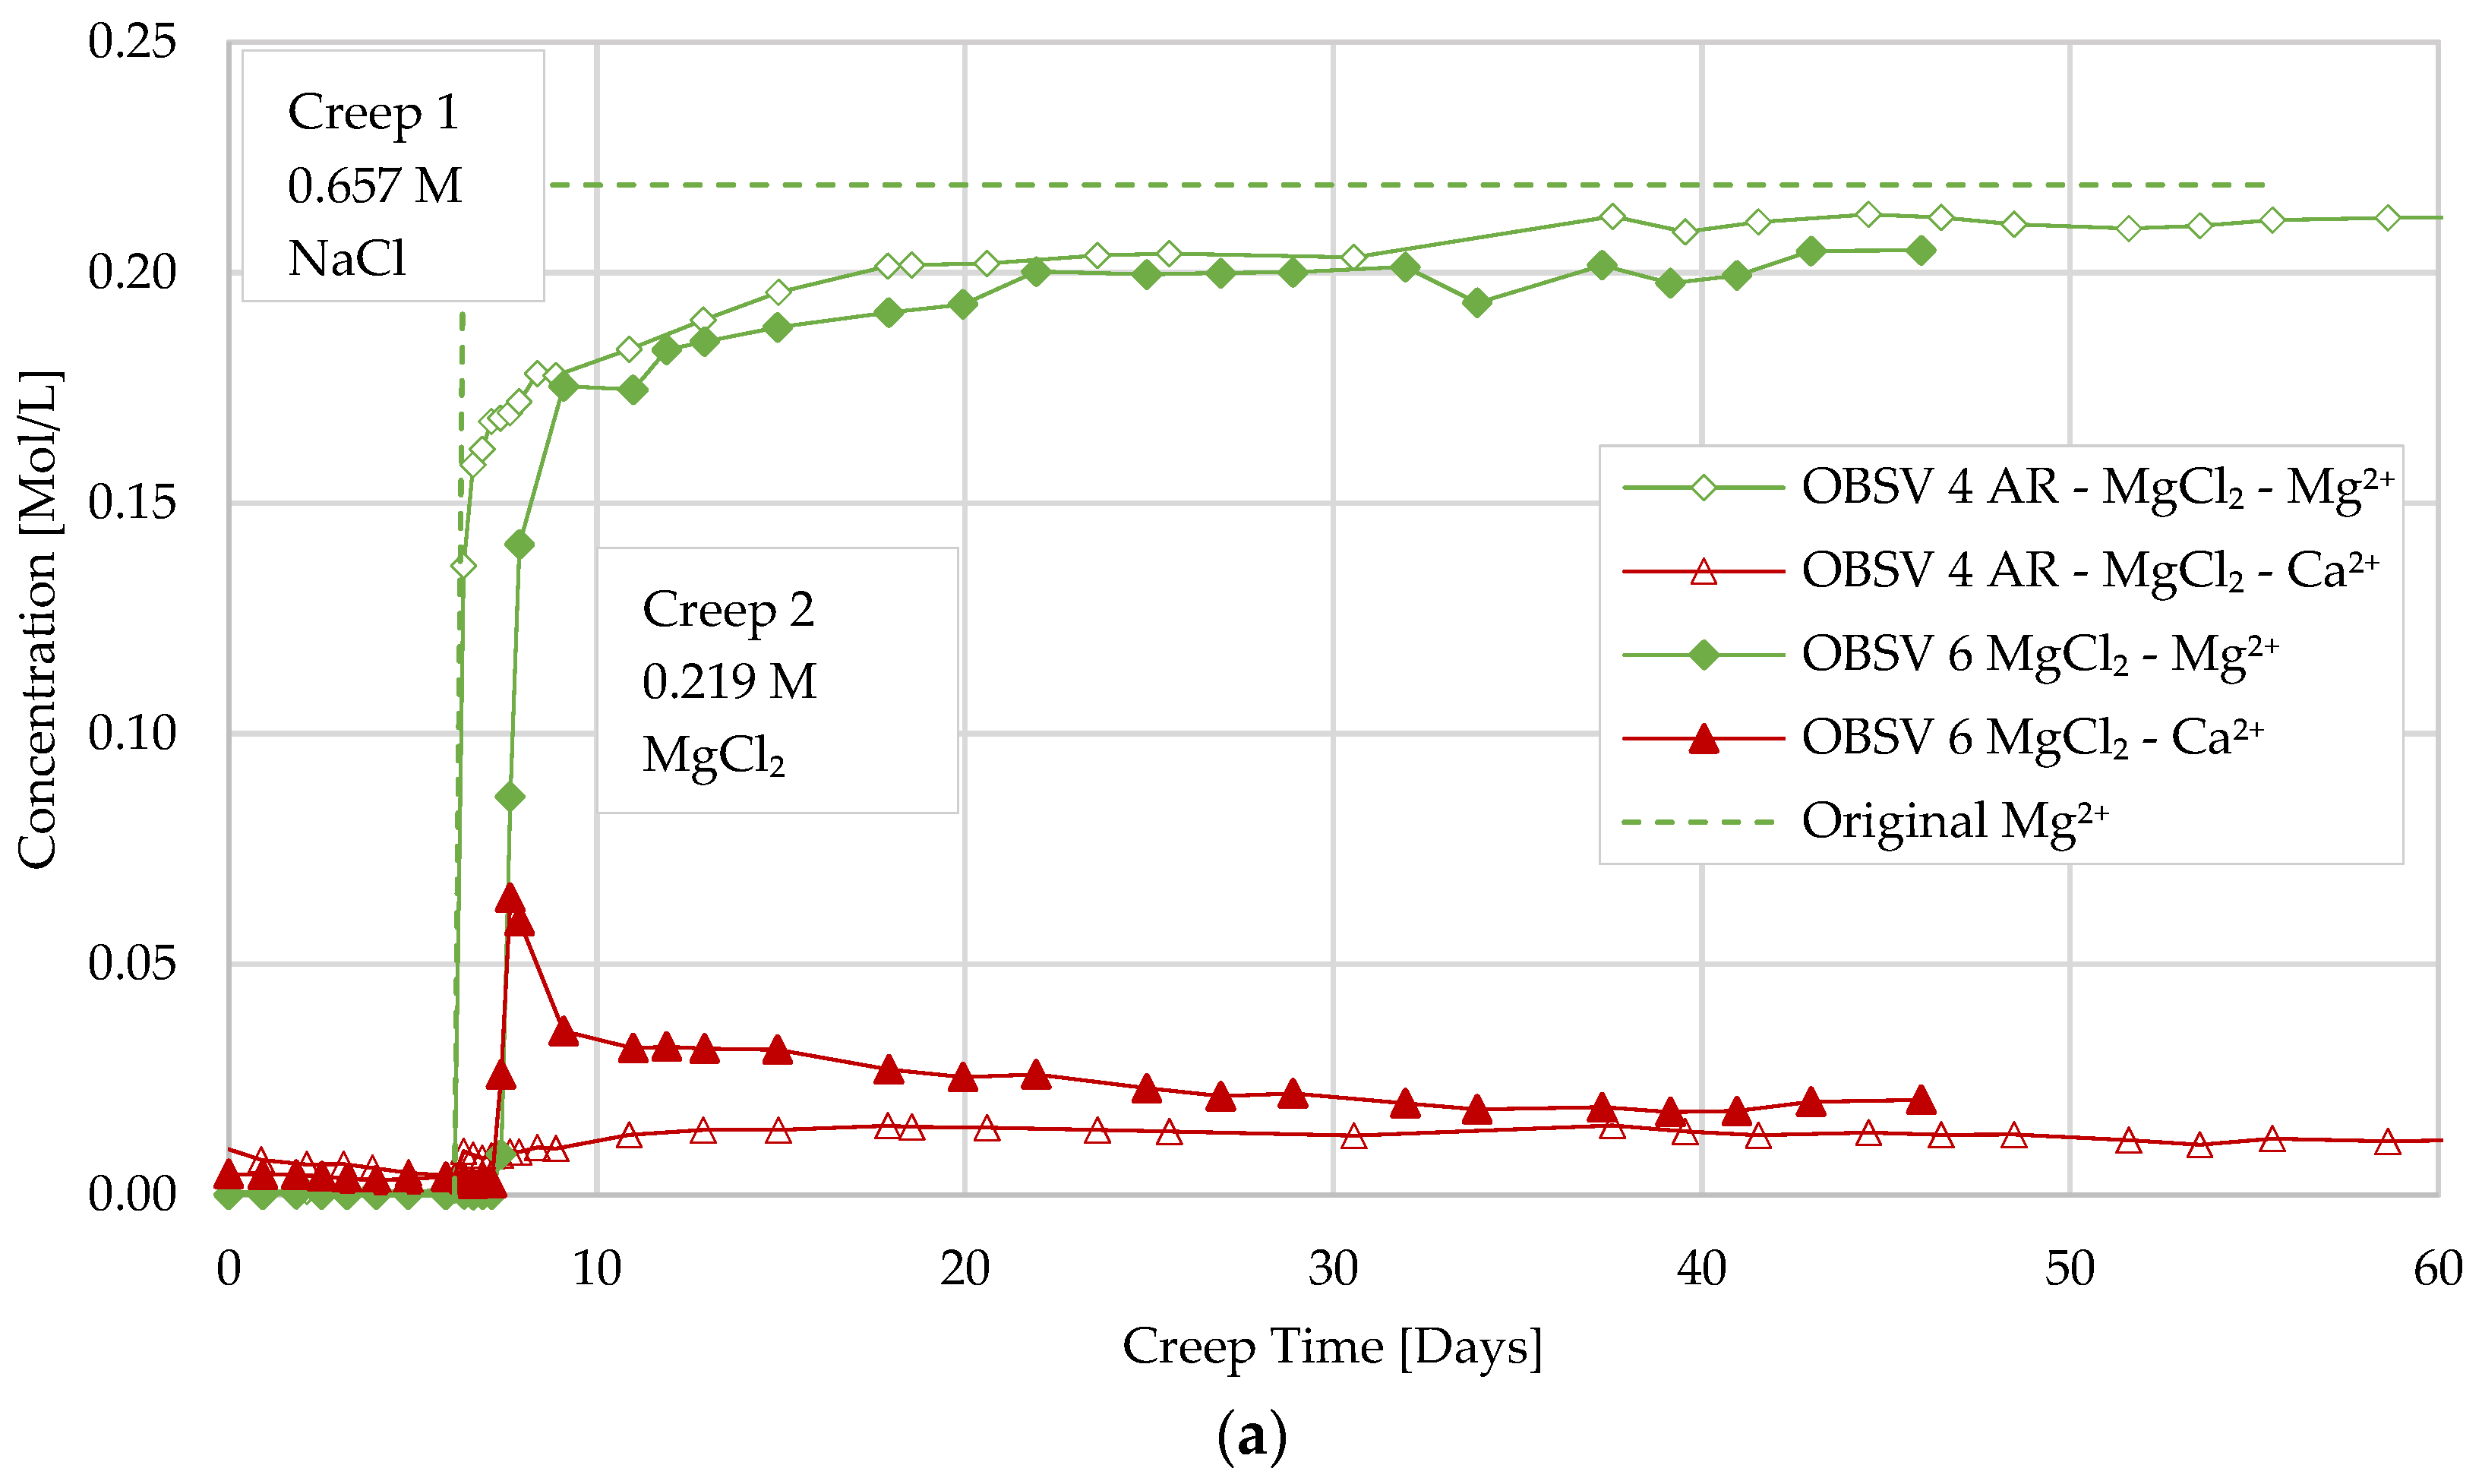
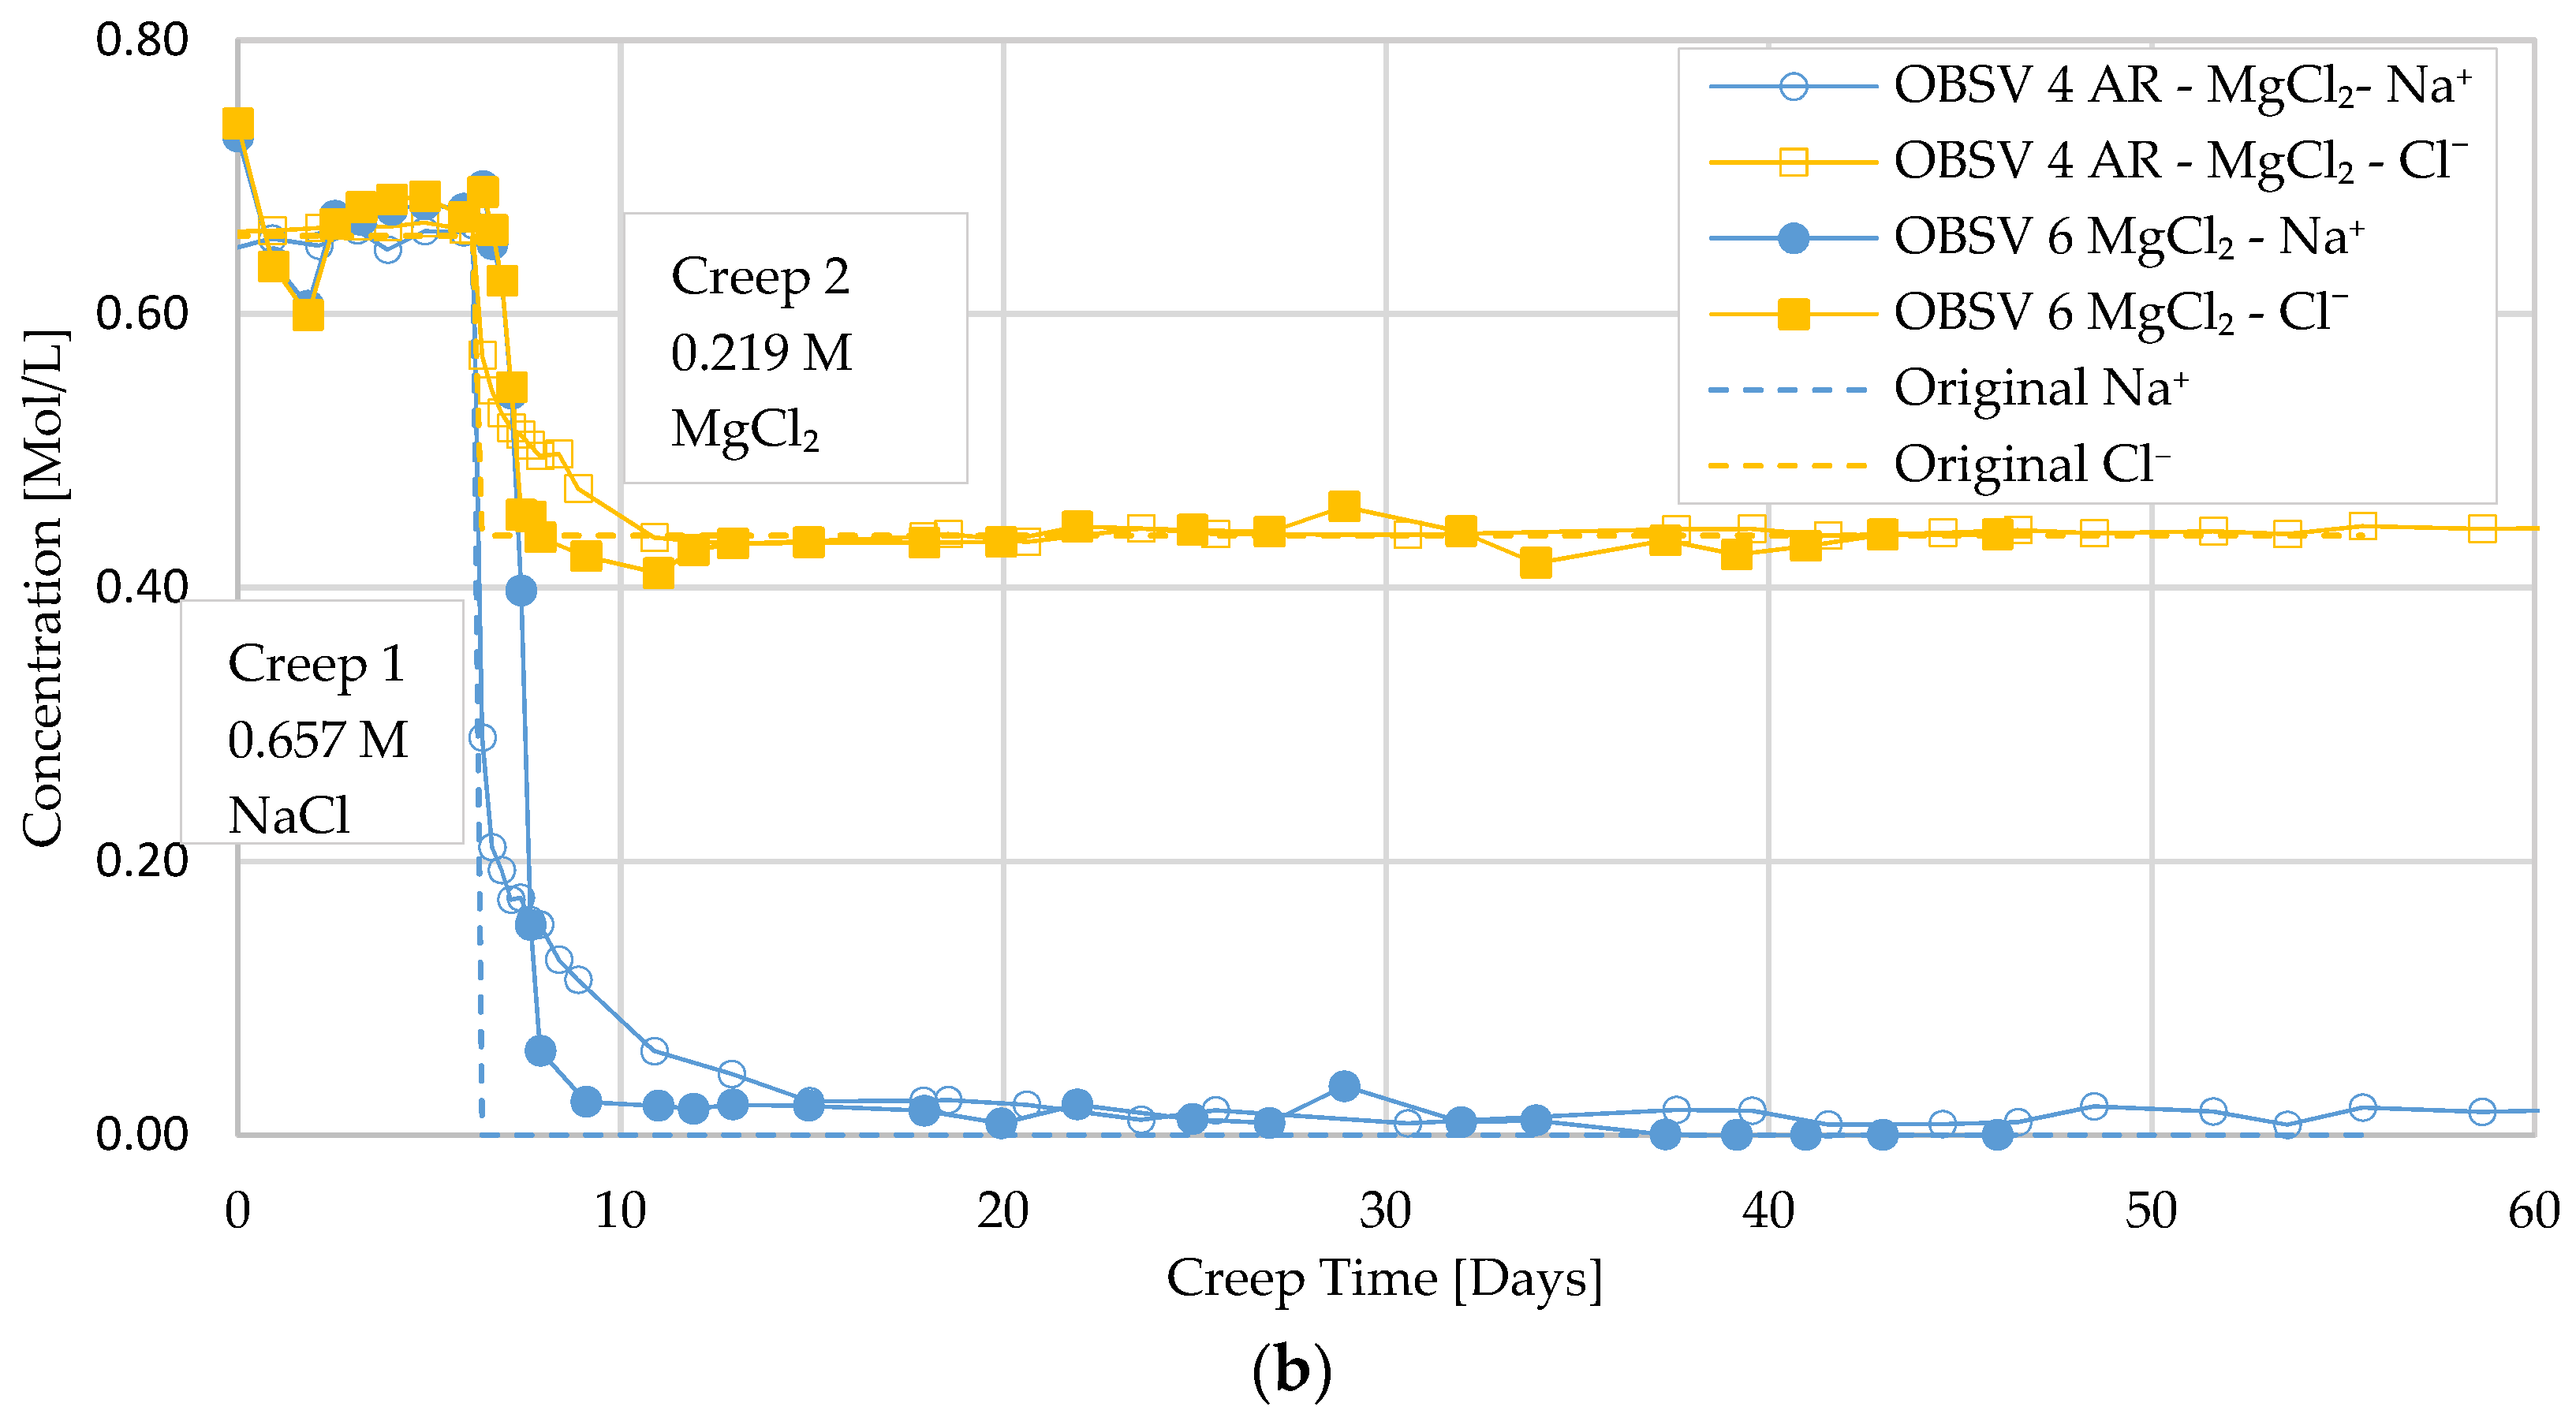
  • A delayed water-weakening effect was observed for artificially fractured cores and is suggested to be linked to a later onset of brine–rock interaction processes in peripheral matrix locations caused by the diffusion of surface-active ions from the fracture despite a low permeable matrix. Geochemistry data identified MgO precipitation in unfractured samples besides the peripheral locations of artificially fractured samples;
  • SSW-flooded samples experienced axial strain beyond MgCl2-flooded cores during the test phase when different brines were injected (Creep 2). Unfractured samples compacted 1.12% and 1.49%, caused by MgCl2 and SSW, respectively. The artificially fractured SSW-flooded core experienced a total strain of 1.50%, MgCl2 exhibited 1.35%, and NaCl showed the least compaction, at 0.27% (samples had different test duration);
  • Extrapolation of the geo-mechanical response indicated that unfractured samples over time will be mechanically weaker than artificial fractured samples; despite that, the results obtained in this time-limited experiment showed that unfractured samples experienced the highest strain. The extrapolation suggests that the water-weakening effect will stagnate for intact cores and be delayed to the peripheral matrix in artificially fractured cores due to diffusion. A longer test duration of a similar setup is suggested to confirm the theory;
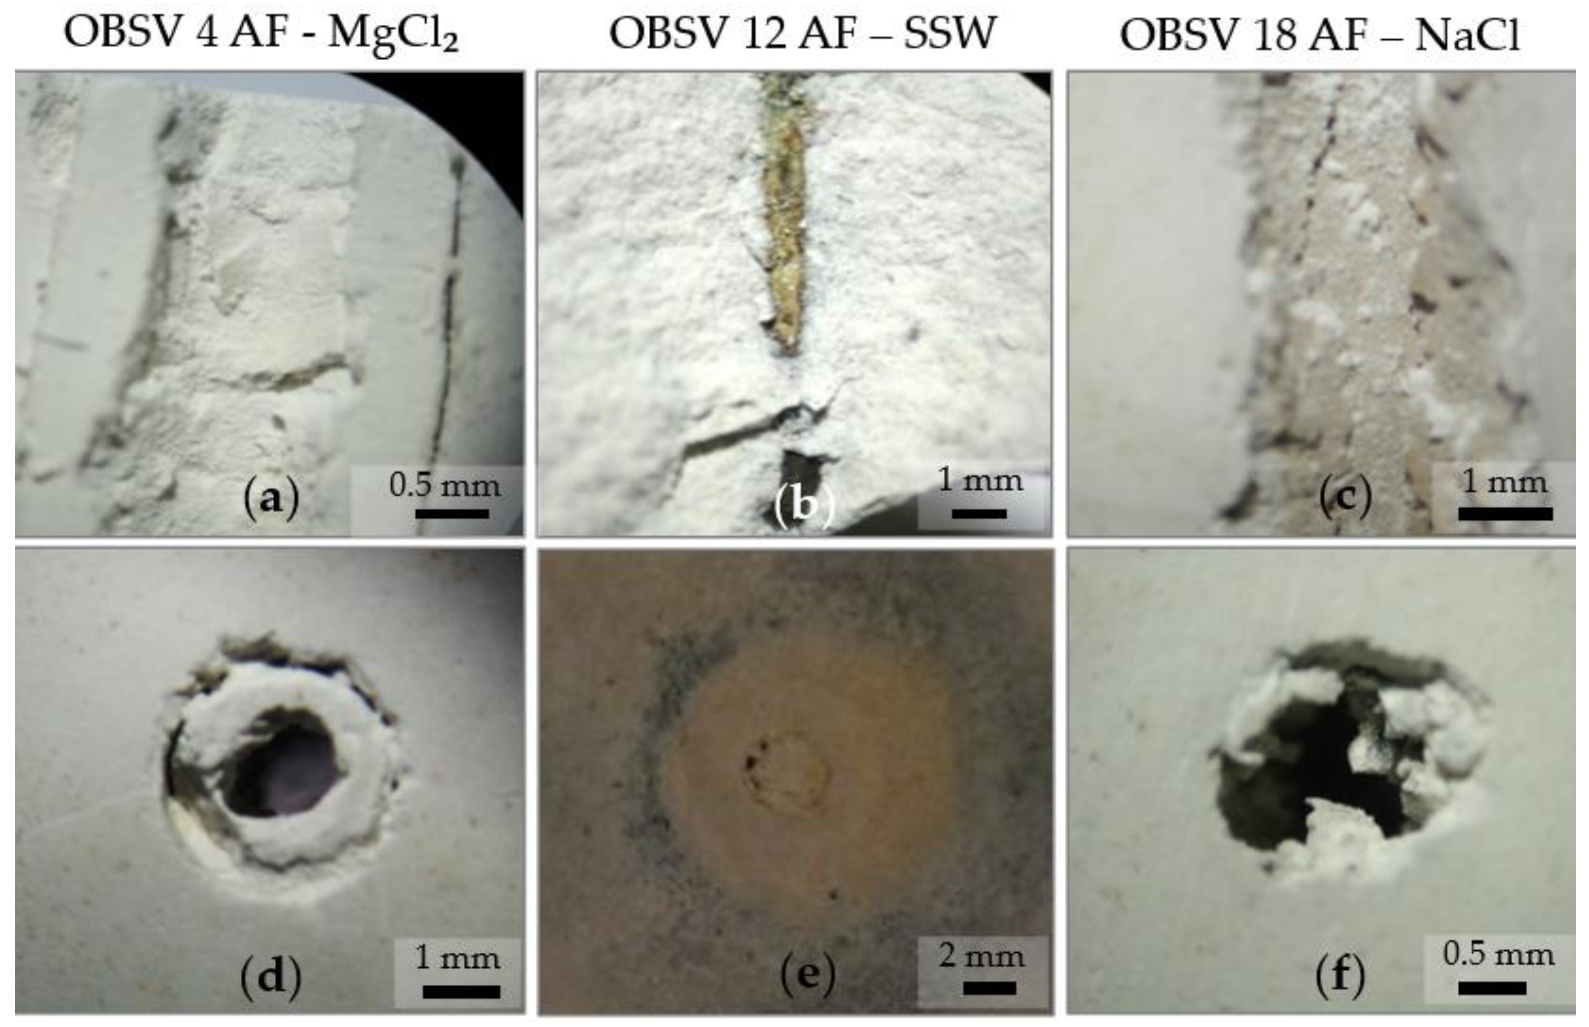
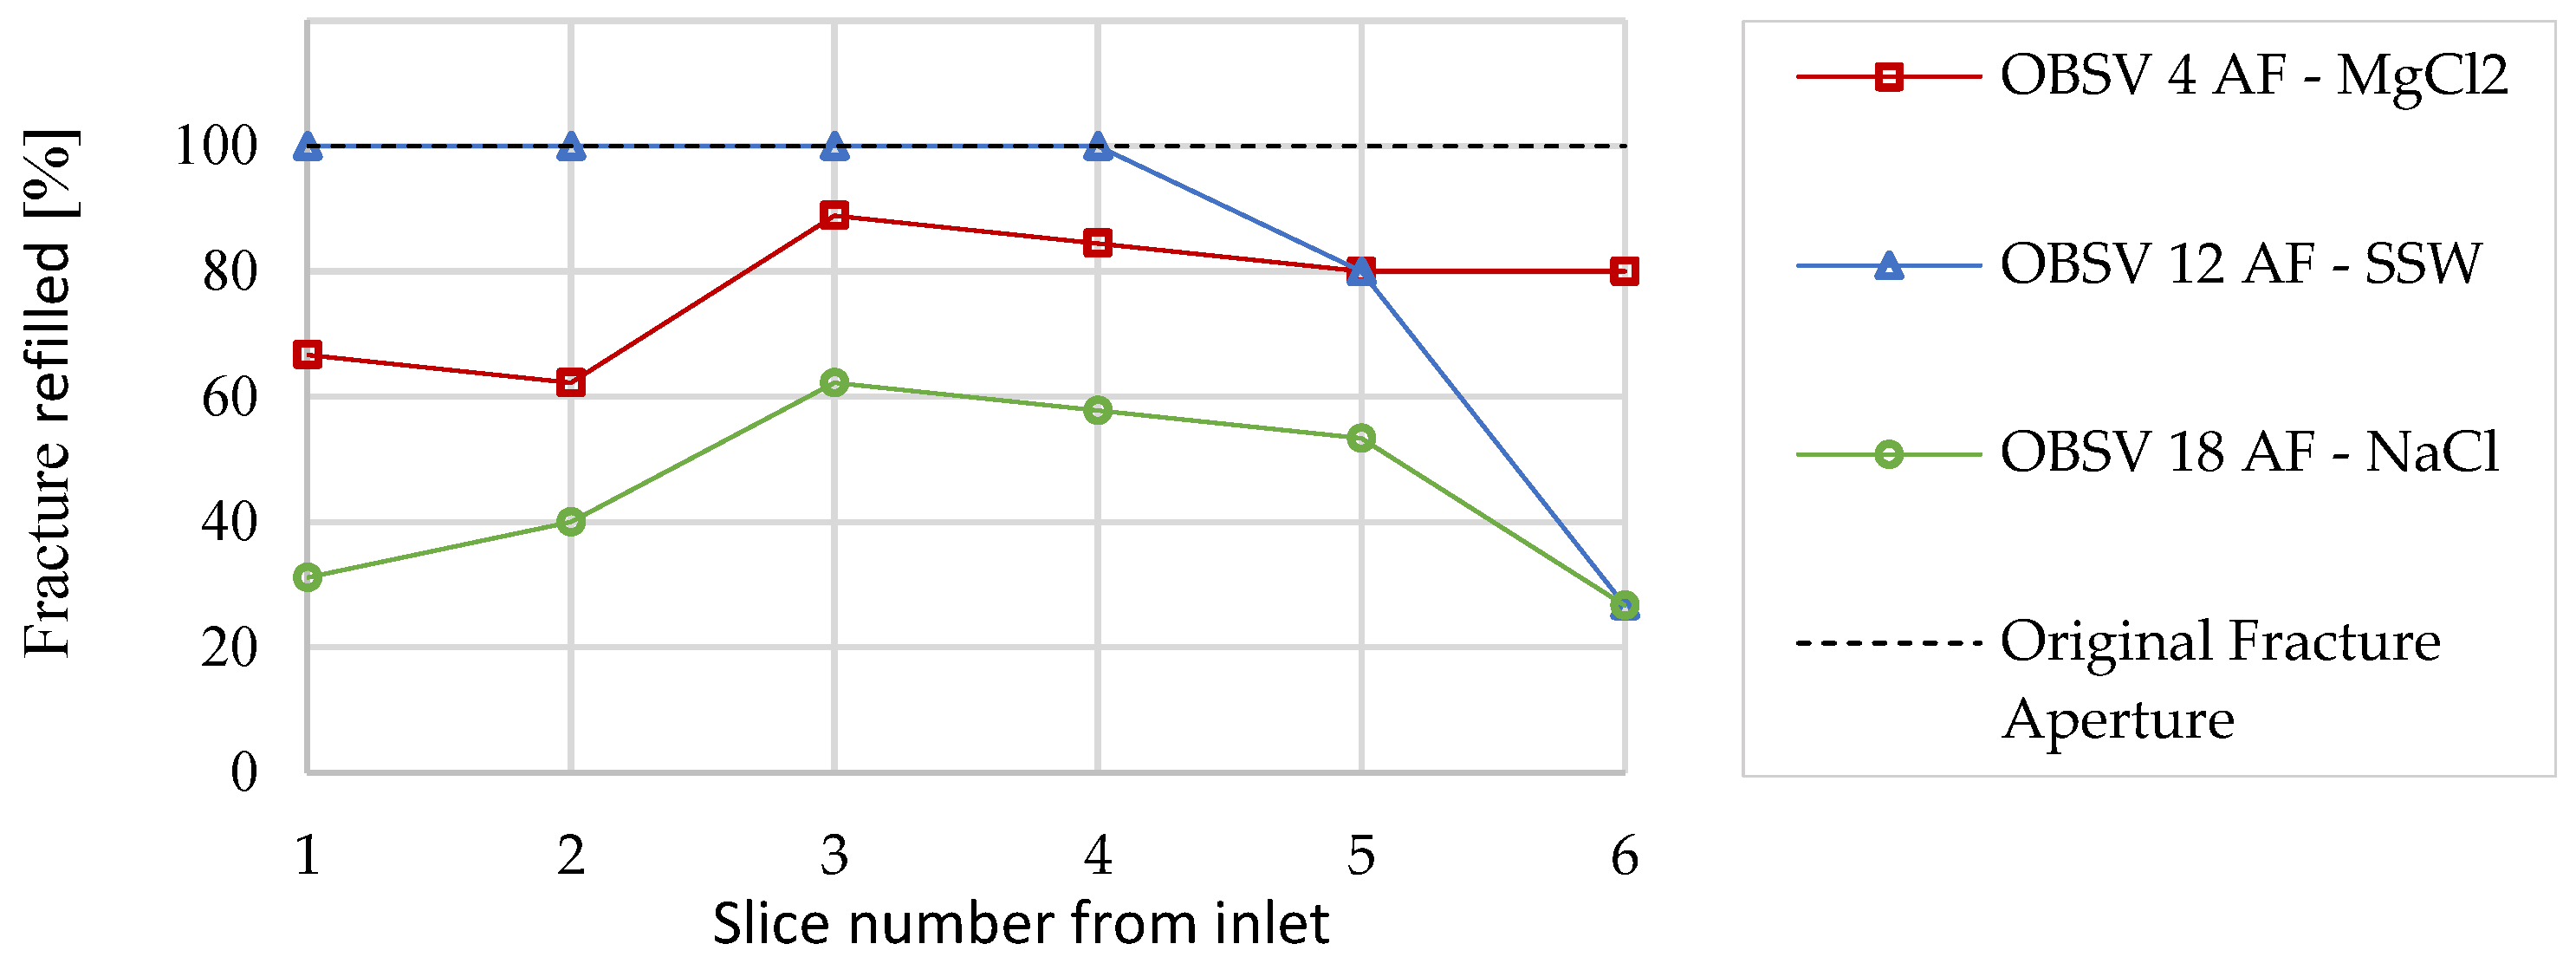
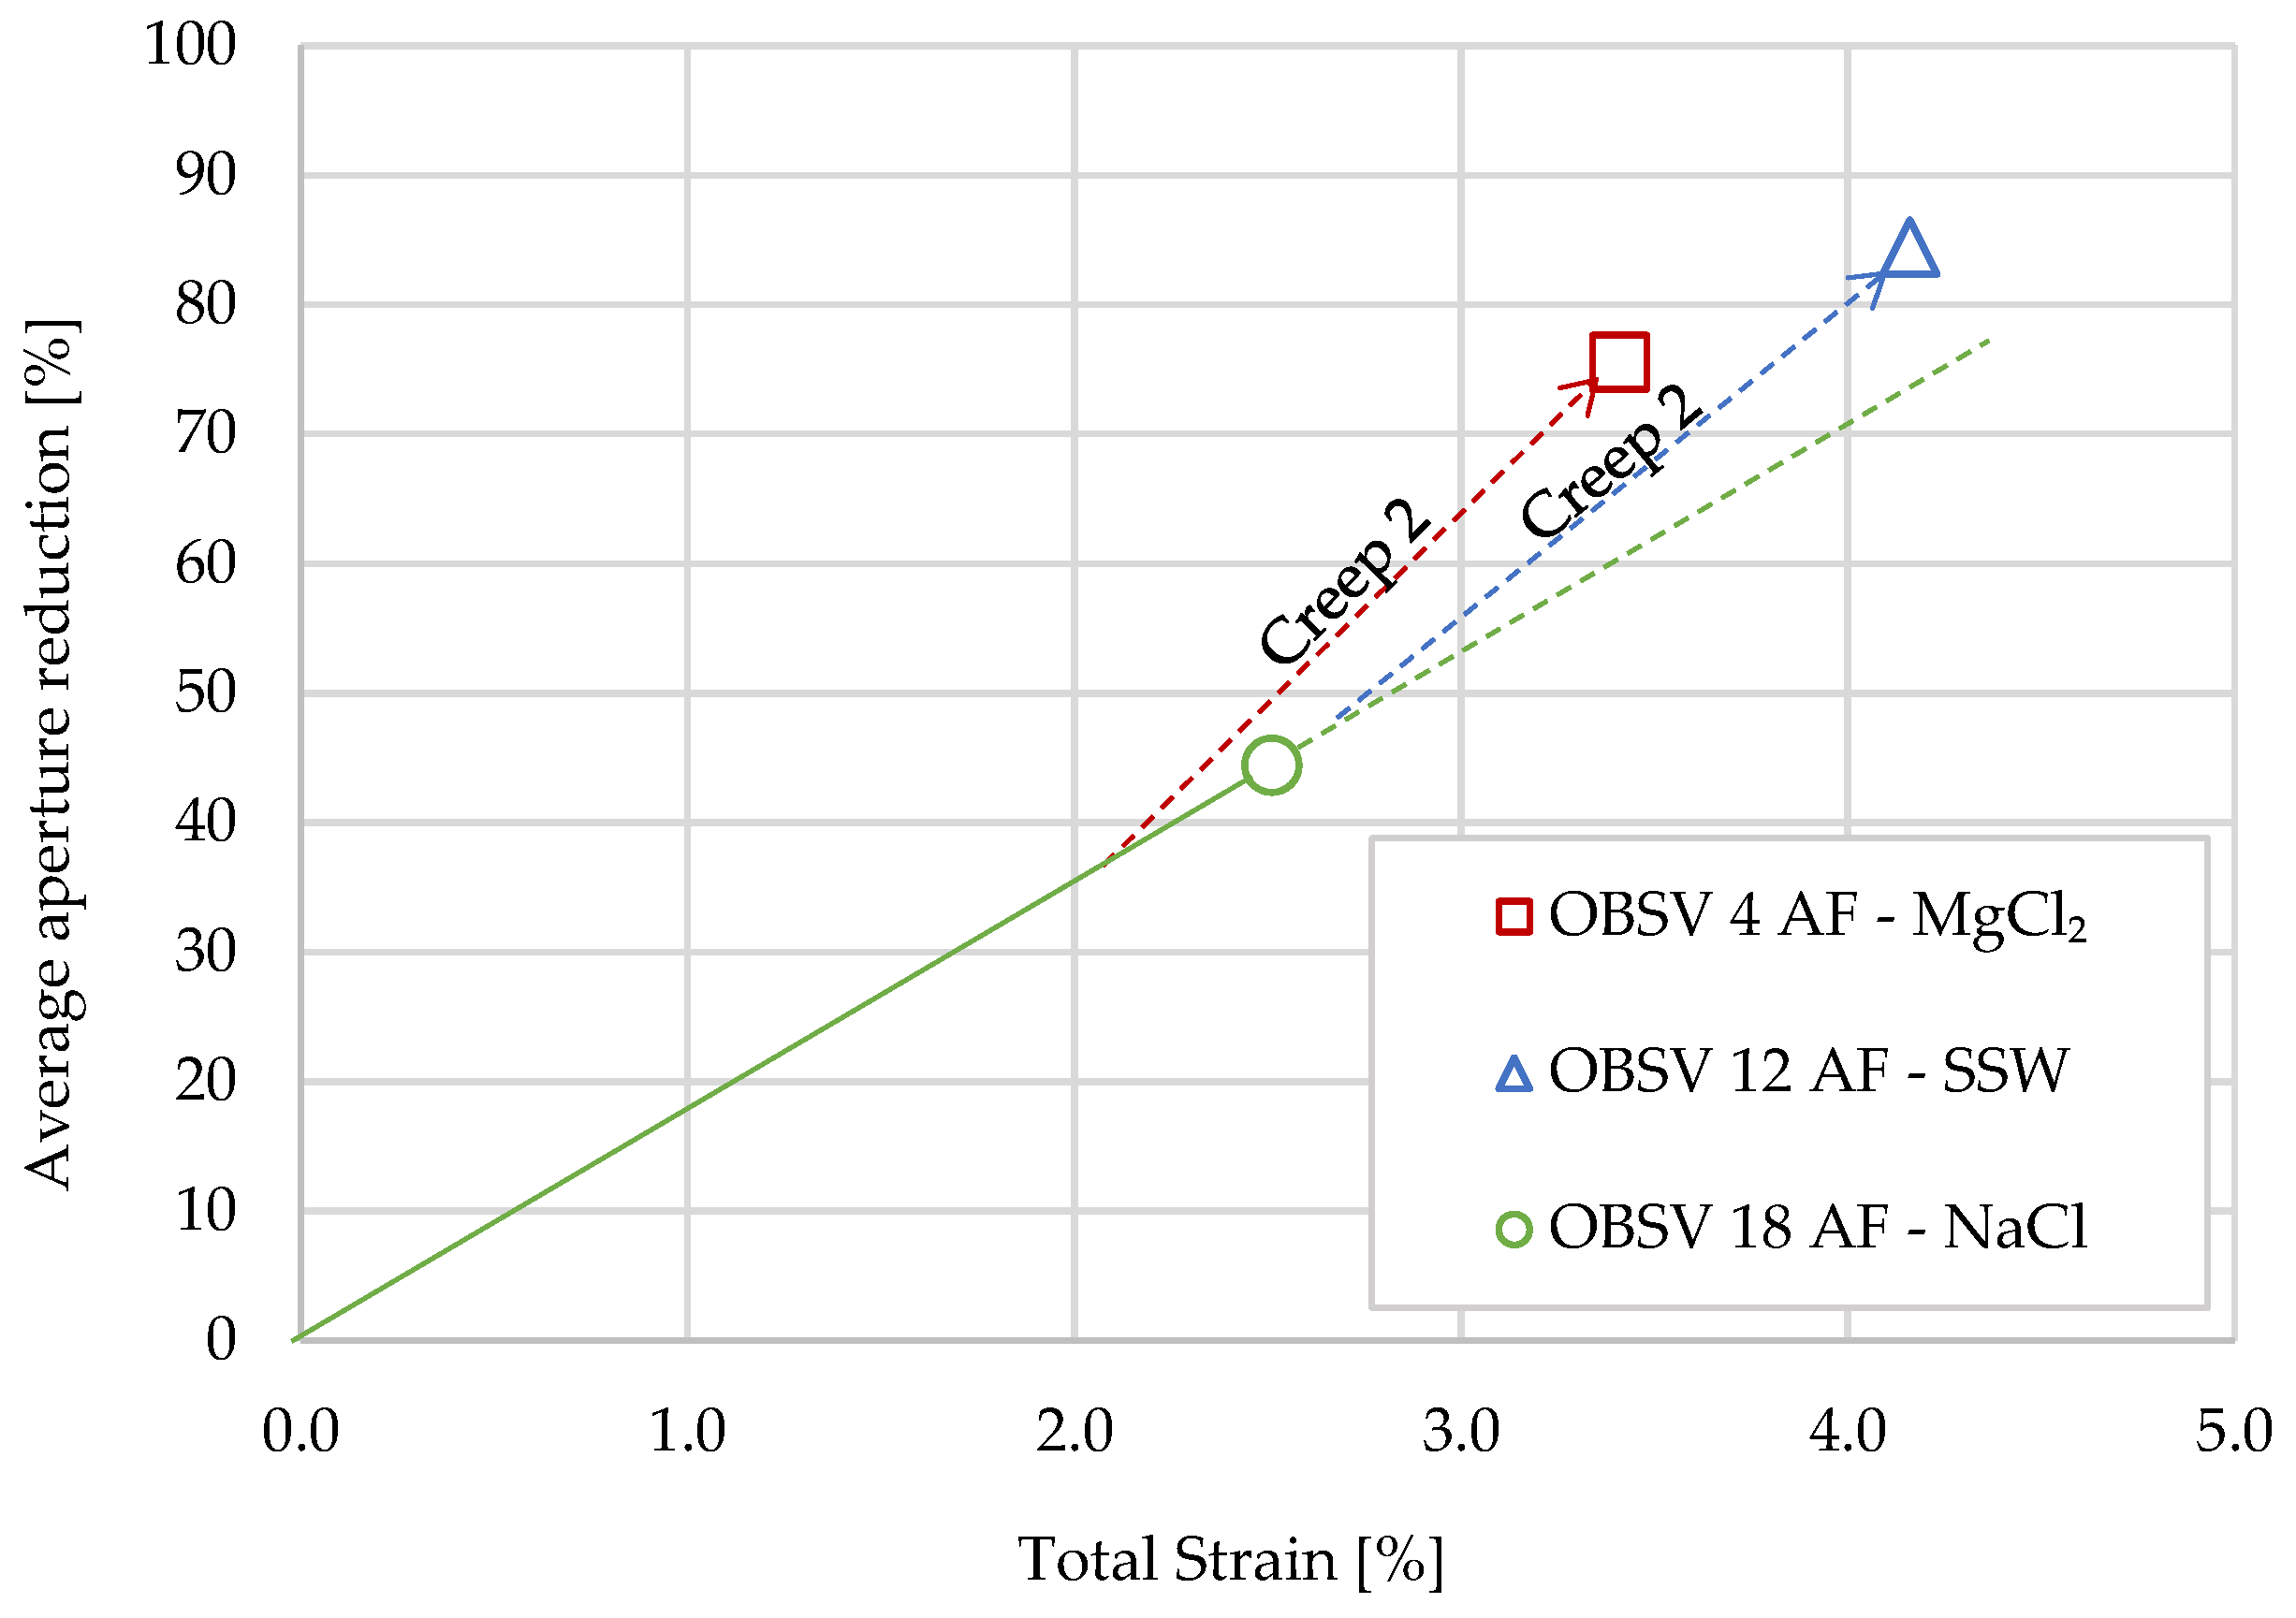
  • The original fracture aperture of 2.25 (±0.05) mm was reduced in all three artificially fractured samples. The average aperture diameter reduction throughout the samples were 84%, 76%, and 44% for SSW, MgCl2, and NaCl, respectively;
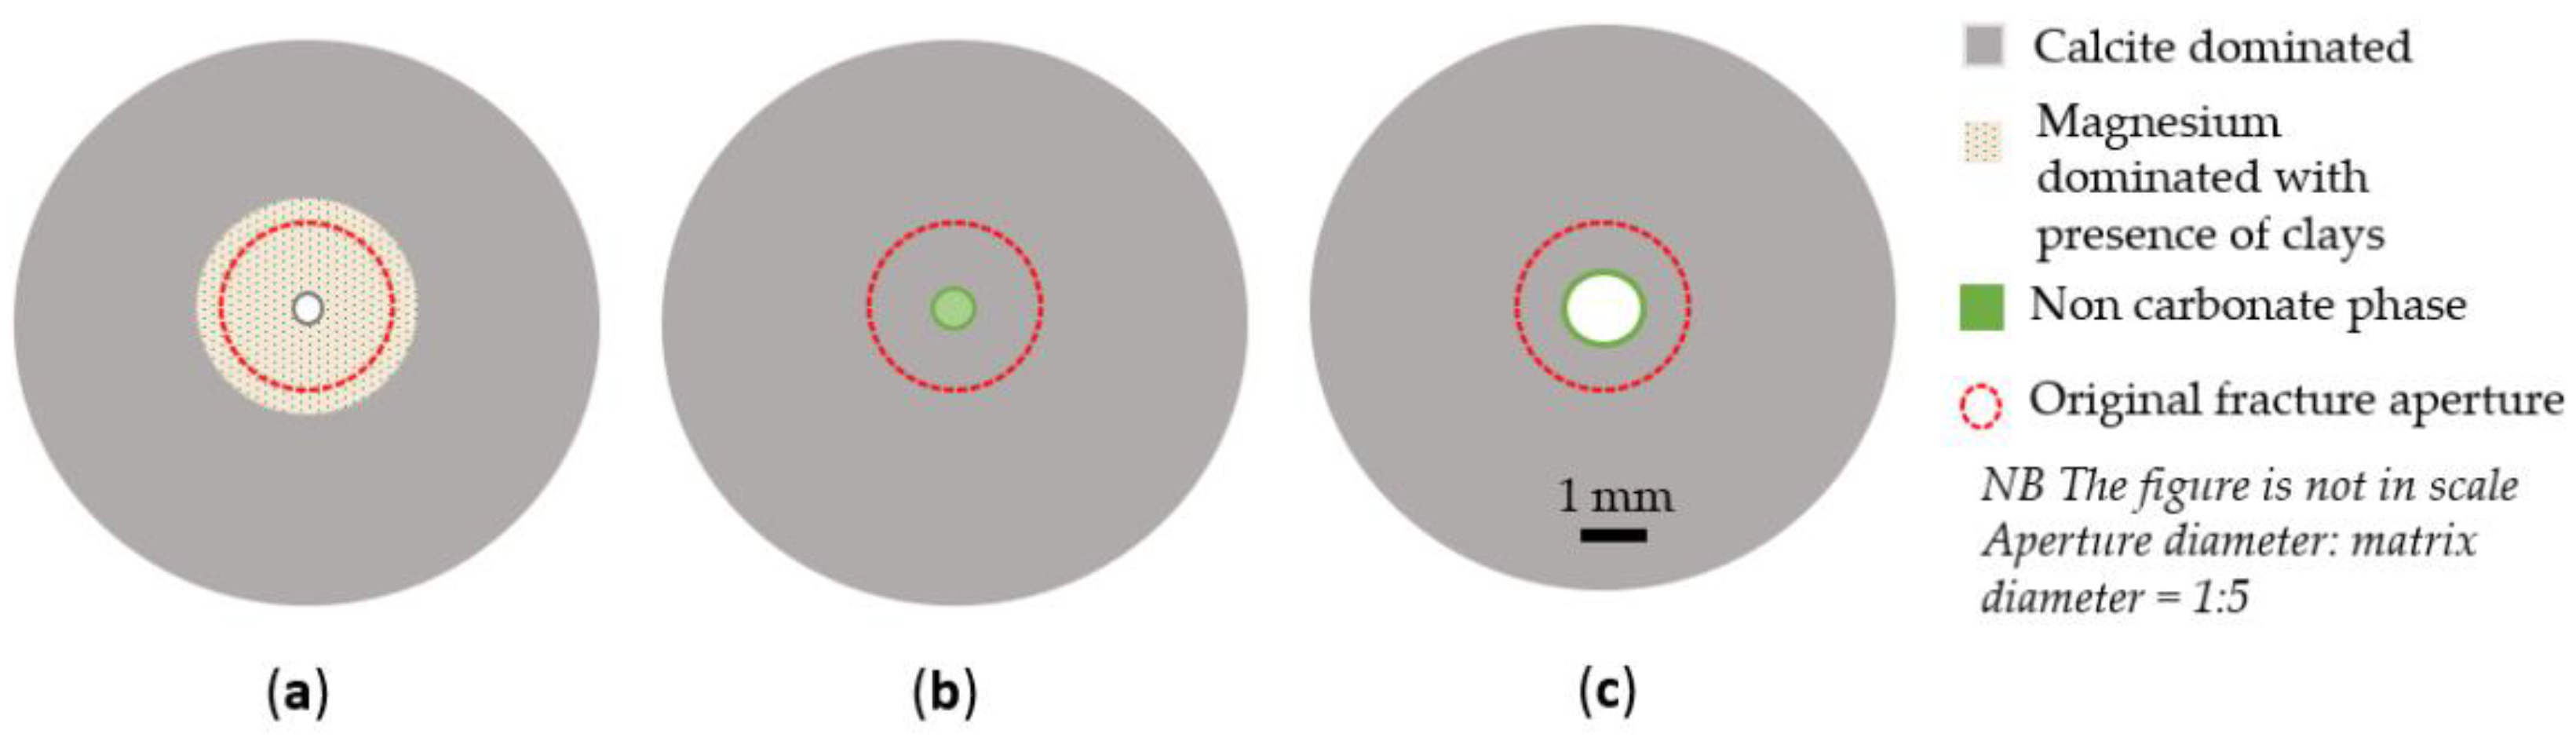
  • A relationship between strain and aperture reduction was identified. The artificial aperture reduction is believed to be caused by a combination of mechanical forces, where axial and radial strains drive the matrix towards void spaces besides mineral precipitation, causing additional aperture reduction, which is dependent on the brine composition and mineral present in the sample.
The degree of water weakening of the matrix adjacent to a fracture will depend on the fracture density and connectivity and the travel distance from the permeable zone, as well as on porosity and permeability differences. Nevertheless, the experiment showed the potential of aperture diameter reduction and a link to a water-weakening effect. When smaller fractures reduce, the injected brine may be forced into the adjacent matrix and find new paths throughout the more compacted reservoir, and further complex EOR processes will develop. If those yield in higher hydrocarbon production, it is left to be substantiated.

Author Contributions

Conceptualization, R.I.K. and U.Z.; Methodology, R.I.K. and U.Z.; Software, T.V.B. and R.I.K.; Validation, ALL; Formal Analysis, T.V.B. and R.I.K.; Investigation: ALL; Resources, U.Z. and M.V.M.; Data Curation, ALL; Writing—Original Draft Preparation, T.V.B.; Writing—Review and Editing, ALL; Visualization. ALL; Supervision, U.Z., M.W.M., R.I.K. and M.V.M.; Project Administration, U.Z.; Funding Acquisition: U.Z. All authors have read and agreed to the published version of the manuscript.

Funding

The project was supported by the Research Council of Norway and the industry partners, ConocoPhillips Skandinavia AS, Aker BP ASA, Vår Energi AS, Equinor Energy AS, Neptune Energy Norge AS, Lundin Energy Norway AS, Halliburton AS, Schlumberger Norge AS, and Wintershall Dea Norge AS, of The National IOR Centre of Norway. The project is part of a PhD thesis and is not granted.

Institutional Review Board Statement

Not applicable.

Informed Consent Statement

Not applicable.

Data Availability Statement

All data supporting the results are mentioned in the text.

Acknowledgments

We like thank the National IOR Center of Norway and its supporters as the Research Council of Norway and industry partners, ConocoPhillips Skandinavia AS, Aker BP ASA, Vår Energi AS, Equinor Energy AS, Neptune Energy Norge AS, Lundin Energy Norway AS, Halliburton AS, Schlumberger Norge AS, and Wintershall Dea Norge AS, of The National IOR Centre of Norway. We also thank three reviewers for their helpful comments and evaluations to enhance the outreach of the paper. We also thank the guest editors and the journal editor for the kind handling of the manuscript.

Conflicts of Interest

The authors declare no conflict of interest.

References

  1. Tanner, R.S.; Udegbunam, E.O.; McInerney, M.J.; Knapp, R.M. Microbially enhanced oil recovery from carbonate reservoirs. Geomicrobiol. J. 1991, 9, 169–195. [Google Scholar] [CrossRef]
  2. Sulak, R.; Danielsen, J. Reservoir aspects of Ekofisk subsidence. J. Pet. Technol. 1989, 41, 709–716. [Google Scholar] [CrossRef]
  3. NPD. Available online: https://factpages.npd.no/en/field/pageview/all/43506 (accessed on 13 July 2018).
  4. Andersen, P.; Wang, W.; Madland, M.V.; Zimmermann, U.; Korsnes, R.I.; Bertolino, S.R.A.; Minde, M.; Schulz, B.; Gilbricht, S. Comparative Study of Five Outcrop Chalks Flooded at Reservoir Conditions: Chemo-mechanical Behaviour and Profiles of Compositional Alteration. Transp. Porous Media 2017, 121, 135–181. [Google Scholar] [CrossRef]
  5. Korsnes, R.; Madland, M.; Austad, T. Impact of brine composition on the mechanical strength of chalk at high Temperature. In Eurock 2006; CRC Press: Boca Raton, FL, USA, 2006; pp. 133–140. [Google Scholar] [CrossRef]
  6. Korsnes, R.I.; Madland, M.V.; Austad, T.; Haver, S.; Røsland, G. The effects of temperature on the water weakening of chalk by seawater. J. Pet. Sci. Eng. 2008, 60, 183–193. [Google Scholar] [CrossRef]
  7. Nermoen, A.; Korsnes, R.I.; Aursjø, O.; Madland, M.V.; Kjørslevik, T.A.; Østensen, G. How stress and temperature conditions affect rock-fluid chemistry and mechanical deformation. Front. Phys. 2016, 4, 2. [Google Scholar] [CrossRef]
  8. Strand, S.; Standnes, A.D.C.; Austad, T. Spontaneous imbibition of aqueous surfactant solutions into neutral to oil-wet carbonate cores: Effects of brine salinity and composition. Energy Fuels 2003, 17, 1133–1144. [Google Scholar] [CrossRef]
  9. Bjørlykke, K.; Høeg, K. Effects of burial diagenesis on stresses, compaction and fluid flow in sedimentary basins. Mar. Pet. Geol. 1997, 14, 267–276. [Google Scholar] [CrossRef]
  10. Minde, M.W.; Wang, W.; Madland, M.V.; Zimmermann, U.; Korsnes, R.I.; Bertolino, S.R.; Andersen, P. Temperature effects on rock engineering properties and rock-fluid chemistry in opal-CT-bearing chalk. J. Pet. Sci. Eng. 2018, 169, 454–470. [Google Scholar] [CrossRef]
  11. Madland, M.V.; Hiorth, A.; Omdal, E.; Megawati, M.; Hildebrand-Habel, T.; Korsnes, R.I.; Evje, S.; Cathles, L.M. Chemical alterations induced by rock–fluid interactions when injecting brines in high porosity chalks. Transp. Porous Media 2011, 87, 679–702. [Google Scholar] [CrossRef]
  12. Megawati, M.; Hiorth, A.; Madland, M.V. The impact of surface charge on the mechanical behavior of high-porosity chalk. Rock Mech. Rock Eng. 2012, 46, 1073–1090. [Google Scholar] [CrossRef]
  13. Megawati, M.; Madland, M.; Hiorth, A. Mechanical and physical behavior of high-porosity chalks exposed to chemical perturbation. J. Pet. Sci. Eng. 2015, 133, 313–327. [Google Scholar] [CrossRef] [Green Version]
  14. Megawati, M.; Andersen, P.Ø.; Korsnes, R.I.; Evje, S.; Hiorth, A.; Madland, M.V. The effect of aqueous chemistry pH on the time-dependent deformation behaviour of chalk- experimental and modelling study. Les Rencontres scientifiques d’IFP Energies Nouvelles. Flows and mechanics in natural porous media from pore to field scale. In Proceedings of the Pore2Fluid IFP Energies Nouvelles Paris, Aussois, France, 16–18 November 2011. [Google Scholar]
  15. Mukherjee, H.; Poe, B.J.; Heidt, J.H.; Watson, T.B.; Barree, R.D. Effect of Pressure Depletion on Fracture-Geometry Evolution and Production Performance. SPE Prod. Facil. 2000, 15, 144–150. [Google Scholar] [CrossRef]
  16. Snow, S.E.; Brownlee, M.H. Practical and theoretical aspects of well testing in the Ekofisk area chalk fields. In SPE Annual Technical Conference and Exibition; OnePetro: Richardson, TX, USA, 1989. [Google Scholar]
  17. Michie, E.; Haines, T.; Healy, D.; Neilson, J.; Timms, N.; Wibberley, C. Influence of carbonate facies on fault zone architecture. J. Struct. Geol. 2014, 65, 82–99. [Google Scholar] [CrossRef]
  18. Philip, Z.G.; Jennings, J.W.; Olson, J.E.; Laubach, S.E.; Holder, J. Modeling coupled fracture-matrix fluid flow in geomechanically simulated fracture networks. SPE Reserv. Eval. Eng. 2005, 8, 300–309. [Google Scholar] [CrossRef]
  19. Chester, F.M.; Evans, J.P.; Biegel, R.L. Internal structure and weakening mechanisms of the San Andreas Fault. J. Geophys. Res. Earth Surf. 1993, 98, 771–786. [Google Scholar] [CrossRef]
  20. Caine, J.S.; Evans, J.P.; Forster, C.B. Fault zone architecture and permeability structure. Geology 1996, 24, 1025–1028. [Google Scholar] [CrossRef]
  21. Goddard, J.V.; Evans, J.P. Chemical changes and fluid-rock interaction in faults of crystalline thrust sheets, northwestern Wyoming, U.S.A. J. Struct. Geol. 1995, 17, 533–547. [Google Scholar] [CrossRef]
  22. Laubach, S.E. Practical approaches to identifying sealed and open fractures. AAPG Bull. 2003, 87, 561–579. [Google Scholar] [CrossRef]
  23. Wibberley, C.A.; Shimamoto, T. Internal structure and permeability of major strike-slip fault zones: The Median Tectonic Line in Mie Prefecture, Southwest Japan. J. Struct. Geol. 2003, 25, 59–78. [Google Scholar] [CrossRef]
  24. Agosta, F.; Prasad, M.; Aydin, A. Physical properties of carbonate fault rocks, fucino basin (Central Italy): Implications for fault seal in platform carbonates. Geofluids 2007, 7, 19–32. [Google Scholar] [CrossRef]
  25. Hjuler, M.; Fabricius, I. Engineering properties of chalk related to diagenetic variations of Upper Cretaceous onshore and offshore chalk in the North Sea area. J. Pet. Sci. Eng. 2009, 68, 151–170. [Google Scholar] [CrossRef]
  26. Geitle, K. Chemically Induced Compaction in Fractured and Intact Chalk Cores in Institute for Energy and Resources (IER). Master’s Thesis, University of Stavanger, Stavanger, Norway, 2013; p. 78. Available online: https://uis.brage.unit.no/uis (accessed on 13 December 2021).
  27. Abubeker, E. Water weakening of chalks-comparsion of intact and fractured cores, in Faculty of Science and Technology. Master’s Thesis, University of Stavanger, Stavanger, Norway, 2013; p. 88. Available online: https://uis.brage.unit.no/ (accessed on 13 December 2021).
  28. Madland, M.V.; Finsnes, A.; Alkafadgi, A.; Risnes, R.; Austad, T. The influence of CO2 gas and carbonate water on the mechanical stability of chalk. J. Pet. Sci. Eng. 2006, 51, 149–168. [Google Scholar] [CrossRef]
  29. Brunauer, S.; Emmett, P.H.; Teller, E. Adsorption of gases in multimolecular layers. J. Am. Chem. Soc. 1938, 60, 309–319. [Google Scholar] [CrossRef]
  30. Wen, S.T.S. Systematic Specific Surface Area Analysis on Rocks to Implement as a Necessary, Quick, and Informative Method to Understand Geo-Mechanical Parameter in IOR Experiments, in Faculty of Science and Technology. Master’s Thesis, University of Stavanger, Stavanger, Norway, 2018; p. 253. Available online: https://uis.brage.unit.no/uis-xmlui/handle/11250/2570740 (accessed on 3 February 2022).
  31. Minde, M.W.; Zimmermann, U.; Madland, M.V.; Korsnes, R.I.; Schulz, B.; Gilbricht, S. Mineral replacement in long-term flooded porous carbonate rocks. Geochim. Cosmochim. Acta 2019, 268, 485–508. [Google Scholar] [CrossRef]
  32. Kallesten, E.; Zimmermann, U.; Madland, M.; Bertolino, S.; Omdal, E.; Andersen, P. Mineralogy and geochemistry of reservoir and non-reservoir chalk from the Norwegian continental shelf. J. Pet. Sci. Eng. 2021, 205, 108914. [Google Scholar] [CrossRef]
  33. Madland, M.V.; Midtgarden, K.; Manafov, R.; Korsnes, R.I.; Kristiansen, T.; Hiorth, A. The effect of temperature and brine composition on the mechanical strength of Kansas chalk. In Proceedings of the International Symposium of the Society of Core Analysts, Abu Dhabi, United Arab Emirates, 29 October–2 November 2008; p. 6. Available online: scaweb.org (accessed on 16 April 2022).
  34. Kallesten, E.; Andersen, P.; Berawala, D.S.; Korsnes, R.I.; Madland, M.V.; Omdal, E.; Zimmermann, U. Modeling of Permeability and Strain Evolution in Chemical Creep Compaction Experiments with Fractured and Unfractured Chalk Cores Conducted at Reservoir Conditions. SPE J. 2020, 25, 2710–2728. [Google Scholar] [CrossRef]
  35. Shahbazi, A.; Monfared, M.S.; Thiruchelvam, V.; Fei, T.K.; Babasafari, A.A. Integration of knowledge-based seismic inversion and sedimentological investigations for heterogeneous reservoir. J. Southeast Asian Earth Sci. 2020, 202, 104541. [Google Scholar] [CrossRef]
  36. Soleimani, M. Naturally fractured hydrocarbon reservoir simulation by elastic fracture modeling. Pet. Sci. 2017, 14, 286–301. [Google Scholar] [CrossRef] [Green Version]
  37. Zimmermann, U.; Madland, M.V.; Nermoen, A.; Hildebrand-Habel, T.; Bertolino, S.A.; Hiorth, A.; Korsnes, R.I.; Audinot, J.-N.; Grysan, P. Evaluation of the compositional changes during flooding of reactive fluids using scanning electron microscopy, nano-secondary ion mass spectrometry, X-ray diffraction, and whole-rock geochemistry Compositional Changes during Flooding. AAPG Bull. 2015, 99, 791–805. [Google Scholar] [CrossRef] [Green Version]
  38. Gale, J.F.; Lander, R.H.; Reed, R.M.; Laubach, S. Modeling fracture porosity evolution in dolostone. J. Struct. Geol. 2010, 32, 1201–1211. [Google Scholar] [CrossRef]
Figure 1. Selected samples and associated fluid composition versus flooding condition (artificial fractured cores have small holes in the center). Flooding direction indicates slice one being the so-called “inlet” followed by slice two, etc., until slice six, which is named the “outlet”.
Energies 15 03817 g001
Figure 2. Axial creep strain during loading with injection of NaCl.
Energies 15 03817 g002
Figure 3. The graphs distribute the axial creep strain for Creep 1 and Creep 2: (a) Axial creep strain for five cores during Creep 1 with six days of NaCl injection for all samples. (b) Compaction behaviour during Creep 2 starting at day six, when the injected brine changed from NaCl to MgCl2 and SSW, and OBSV 18 AF-NaCl continued with NaCl injection throughout the entire test period.
Energies 15 03817 g003
Figure 4. Effluent concentration for OBSV 4 AF-MgCl2 and OBSV 6 MgCl2: (a) Effluent concentration of Mg2+ and Ca2+ for the artificially fractured and intact sample flooded with MgCl2 (OBSV 4 AF-MgCl2 and OBSV 6 MgCl2). (b) Effluent concentration of Na+ and Cl for the artificially fractured and intact sample flooded with MgCl2 (OBSV 4 AF-MgCl2 and OBSV 6 MgCl2).
Energies 15 03817 g004aEnergies 15 03817 g004b
Figure 5. Effluent data for OBSV 9 SSW and OBSV 12 AF-SSW: (a) Mg2+, Ca2+, and SO42− concentrations for the intact and artificially fractured sample flooded with SSW (OBSV 9 SSW and OBSV 12 AF-SSW) Ca2+ correction reflects potential Ca2+ production without anhydrite (CaSO4) precipitation. (b) Effluent data for Na+ and Cl is presented for samples as in Figure 5a.
Energies 15 03817 g005
Figure 6. Photographs of textural characteristics of the three artificially fractured cores: (a) OBSV 4 AF-MgCl2 #4 parallel to flooding direction. (b) OBSV 12 AF-SSW #5 parallel to flooding direction. (c) OBSV 18 AF-NaCl #1, parallel to flooding direction. The black arrow points to beige surface of the fracture precipitate. (d) OBSV 4 AF-MgCl2 #1 perpendicular to flooding direction. Black arrow points to the void space between matrix and fracture precipitate. (e) Wet condition of OBSV 12 AF-SSW #1 perpendicular to flooding direction. (f) OBSV 18 AF-NaCl #3 perpendicular to flooding direction.
Energies 15 03817 g006
Figure 7. Distribution of artificially fractured aperture diameter reduction (mm) for the three fractured samples from inlet to outlet.
Energies 15 03817 g007
Figure 8. (aj) SEM-EDS analysis highlights morphological and elemental differences between reference samples (left column) and flooded samples (right column). The artificially fractured samples were extracted from the surface of the fracture fill (Figure 6a,c). The EDS analysis was extracted from a two-time two µm area marked with a red square on each SEM image. The corresponding elemental composition is presented to the right of the images (semi-quantitative). See text for more detailed descriptions. * Element not detected.
Energies 15 03817 g008
Figure 9. Extrapolation of the geo-mechanical response of creep rates for two artificially fractured samples (OBSV 4 AF-MgCl2 and OBSV 12 AF-SSW) and two unfractured samples (OBSV 6 MgCl2 and OBSV 9 SSW) over a period of 200 days.
Energies 15 03817 g009
Figure 10. A presentation of the link between precipitation of MgO and SSA for all flooded samples compared with unflooded reference samples.
Energies 15 03817 g010
Figure 11. The sketch simplifies aperture modification and mineralogy in a cross-section for the three artificially fractured cores. All samples represent the third slice, where the apertures are most significantly reduced. The red circle symbolizes the original aperture size. (a) OBSV 4 AF-MgCl2; (b) OBSV 12 AF-SSW; (c) OBSV 18 AF-NaCl.
Energies 15 03817 g011
Figure 12. The graph presents the link between the average aperture reduction [%] and the total axial strain [%] experienced during Loading, Creep 1, and Creep 2 for the three artificially fractured cores (radial strain was not identified in this hydrostatic test; however, the aperture reduction is necessarily a result of the combined strain). A linear relationship between total strain [%] and aperture reduction [%] for OBSV 18 AF-NaCl is marked from origo through the final point of axial strain and aperture reduction (the reduction is expected to be related to mechanical forces only). The deviation above the linear relationship for OBSV 4 AF-MgCl2 and OBSV 12 AF-SSW are ambiguous estimations related to aperture reduction caused by mineral precipitation during Creep 2.
Energies 15 03817 g012
Table 1. Ion concentration of the brine used in the experiment. * The ion is not present in the brine.
Brine/mol/LClNa+K+Mg2+Ca2+SO42−
MgCl20.438**0.219**
SSW0.5250.4500.0100.04450.0130.024
NaCl0.6570.657****
Table 2. The table distributes porosity, permeability, strain, yield strength, bulk modulus, and test duration. * No data available.
SamplePorosity PermeabilityStrainYield StrengthBulk ModulusDuration
[%][mD][%][MPa][GPa][Days]
Pre-TestPost-TestStartStopLoadingCreep 1Creep 2Total
OBSV 4 AF-MgCl240.4937.95**0.811.251.353.419.40.75062
OBSV 6 MgCl240.8138.600.530.170.801.161.123.089.90.68546
OBSV 9 SSW41.3437.020.590.000.901.061.493.459.10.69618
OBSV 12 AF-SSW41.3437.15**1.071.591.504.169.40.62553
OBSV 18 AF-NaCl40.18***0.861.380.272.519.40.73027
Table 3. Major element geochemistry for reference material, flooded samples, and central fill (CF) from OBSV 4 AF-MgCl2.
Element wt.%SiO2Al2O3Fe2O3MgOCaONa2OK2OTiO2P2O5LOISum
Detection limit LF 2000.010.010.040.010.010.010.010.010.01
OBSV 4 REF IN3.320.970.340.2952.060.040.220.040.0642.599.84
OBSV 4 AF-MgCl2 #13.380.990.310.6651.810.030.180.040.0542.499.85
OBSV 4 AF-MgCl2 #33.391.000.360.9751.370.030.160.050.0742.499.80
OBSV 4 AF-MgCl2 #43.320.980.340.9951.730.030.150.040.0942.199.77
OBSV 4 AF-MgCl2 #63.370.980.340.9851.670.030.160.040.0642.299.83
OBSV 4 AF-MgCl2 #73.320.980.350.9551.680.030.150.040.0642.299.76
OBSV 4 REF OUT3.501.030.370.2852.010.040.230.050.0542.399.86
OBSV 6 REF IN3.381.000.340.2852.290.040.220.050.0642.299.86
OBSV 6 MgCl2 #23.191.000.341.5051.240.030.150.050.0742.299.77
OBSV 6 MgCl2 #33.371.020.361.4351.210.030.150.050.0842.199.80
OBSV 6 MgCl2 #43.271.000.341.2851.380.040.160.050.0942.299.81
OBSV 6 MgCl2 #53.311.020.411.0851.680.030.170.050.0842.099.83
OBSV 6 MgCl2 #63.521.050.380.9651.500.040.170.050.1042.099.77
OBSV 6 MgCl2 #73.541.030.401.0151.860.040.180.050.0841.699.79
OBSV6 REF OUT3.401.030.330.3051.890.040.230.050.0942.599.86
OBSV9 REF IN3.441.010.390.2951.970.040.220.050.1042.399.81
OBSV 9 SSW #13.371.040.360.5551.880.040.210.050.1042.299.80
OBSV 9 SSW #23.431.030.400.5151.640.040.220.050.0942.499.81
OBSV 9 SSW #33.521.040.380.4851.500.040.230.050.0842.599.82
OBSV9 SSW #43.451.040.390.4551.650.050.220.050.0842.599.88
OBSV 9 SSW #53.491.020.420.4351.800.050.230.050.0742.399.86
OBSV 9 SSW #63.551.040.420.4051.600.050.240.050.0642.499.81
OBSV9 REF OUT3.591.050.470.2852.000.040.230.050.0742.099.78
OBSV 12 REF IN 3.581.050.400.2851.890.040.240.050.0642.299.79
OBSV 12 AF-SSW #13.611.070.470.4451.930.040.240.050.0841.999.83
OBSV 12 AF-SSW #23.521.050.380.4852.050.040.220.050.0742.099.86
OBSV 12 AF-SSW #33.561.070.400.5351.930.030.230.050.0841.999.78
OBSV 12 AF-SSW #43.641.080.430.5251.880.040.220.050.0641.999.82
OBSV 12 AF-SSW #53.601.060.390.4951.670.040.230.050.0742.299.80
OBSV 12 AF-SSW #63.621.080.430.4051.940.040.240.050.0842.099.88
OBSV 18 AF-NaCl #13.491.020.390.2852.210.060.220.050.0942.099.81
OBSV 18 AF-NaCl #23.300.980.380.2752.520.060.210.040.1042.099.86
OBSV 18 AF-NaCl #33.210.980.360.2752.460.060.210.040.0942.199.78
OBSV 18 AF-NaCl #43.301.000.380.2752.460.070.210.040.0742.099.80
OBSV 18 AF-NaCl #53.280.990.390.2752.380.070.210.040.0742.199.80
OBSV 18 AF-NaCl #63.391.090.430.2852.940.060.220.050.1141.6100.16
OBSV 18 REF IN3.391.000.540.2751.900.040.220.050.1042.399.81
Detection limit FUS-ICP0.010.010.010.010.010.010.010.0010.01
OBSV 4 AF-MgCl2 CF #18.771.550.7741.051.95<0.010.240.0740.12 54.55
OBSV 4 AF-MgCl2 CF #74.961.140.4442.684.11<0.010.160.050.1 53.69
Table 4. Measured SSA for flooded unfractured and artificially fractured samples. For the fractured cores (OBSV 4 AF-MgCl2, OBSV 12 AF-SSW, and OBSV 18 AF-NaCl), the material is extracted from the peripheral parts of the cores, not in touch with the fracture. * Data not acquired.
OBSV 4 AF-MgCl2OBSV 6 MgCl2OBSV 9 SSWOBSV 12 AF-SSWOBSV 18 AF-NaCl
m2/gm2/gm2/gm2/gm2/g
Slice 14.585.493.643.323.09
Slice 2*5.893.495.083.25
Slice 34.975.293.60*3.19
Slice 43.674.983.465.403.12
Slice 5*4.743.46*3.13
Slice 64.95*3.564.67*
Slice 7* 4.25 ** *
Publisher’s Note: MDPI stays neutral with regard to jurisdictional claims in published maps and institutional affiliations.

