1. Introduction
The dual-flow channel pump station has the advantages of a small floor area, a compact structure, and less engineering investment. It is widely used in waterlogging drainage and irrigation projects in China. There is less engineering land in some areas, which needs to play the role of flood control, water diversion, and drainage of pump stations at the same time. Therefore, a two-way channel pump station came into being. However, in the operation process, due to the influence of mechanical, electric, hydraulic, and other factors, the pumping station building is prone to vibration, which may have a serious impact on the safe and stable operation of the whole pumping station. Therefore, it is very important for the stable operation of the pump station to study the dynamic response of the water pressure fluctuation of the station structure to the station structure under different working conditions.
At present, some scholars use measurement point data provided by the manufacturer or conduct a physical model test to study the pressure pulsation field by arranging the pressure pulsation measurement points. For example, Wang et al. [
1] used the basic law of pressure fluctuation distribution and the measurement point data provided by the manufacturer to estimate by the linear interpolation method and they analyzed the vibration response of the pump house through various methods. Guo et al. [
2] assumed the pressure pulsation as a simple harmonic load and used the finite element method to simulate the influence of pressure pulsation on the vibration of the plant. Qian et al. [
3] simulated by SST k-ω turbulence model and studied the position where the flow affects the maximum pressure fluctuation of the pump turbine under the working condition of the turbine. Geng et al. [
4], combined with CFD numerical simulation, proposed a new method to study the characteristics of the hydraulic vibration source of powerhouse. Ma et al. [
5] calculated the dynamic displacement and velocity response of key parts under the action of water pressure pulsation and found that their values met the requirements. Liu et al. [
6] analyzed the feasibility of hydraulic oscillation of the pumped storage power station. The research shows that the pressure pulsation of a hydraulic turbine will even cause the resonance and damage of the runner structure in serious cases. Yang et al. [
7] built a physical model and summarized the water pressure pulsation characteristics of the two-way pump device through experimental research. Jiao et al. [
8] used CFD technology to study the pressure pulsation characteristics of a two-way channel pump device and verified it in combination with the model test. Tu et al. [
9] studied the pressure pulsation characteristics of the Shangwuwei port pump station under different flow conditions and obtained the evolution law of pressure pulsation of overflow structure during forward and reverse operations of the pump device.
Foreign scholars have also carried out a series of studies on the pressure pulsation of hydraulic turbines. Zobeiri et al. [
10] studied the influence of dynamic and static interference on the pressure pulsation in the vaneless area of the pump turbine. Rezghi et al. [
11] used the one-dimensional characteristic line method of the static characteristic curve to study the changes of the runner speed and water hammer pressure during the load rejection transition.
There are many methods to study the dynamic response of station building structure, including resonance check method, quasi-static method, harmonic response analysis method and dynamic time history method [
12]. The resonance check method is relatively rough, and the anti-vibration safety of the pump house can only be evaluated inaccurately. In the pseudo-static method, the dynamic load is equivalent to the static load, and the dynamic response may have deviation, which can only be used as a reference. In the harmonic response analysis method, the fluctuating load of water pressure is equivalent to simple harmonic load, which is different from the actual situation. The transient dynamic time history method is reasonable, but it is difficult to apply. At present, many experts and scholars [
13,
14,
15] use the harmonic response analysis method to calculate the dynamic response of the structure and check it by analyzing the vibration displacement and stress of the plant structure.
At present, there are relatively few studies on the dynamic response of water pressure pulsation [
16,
17,
18,
19,
20,
21] to the station building structure of a two-way channel pump station. In this paper, a model test and numerical simulation were used. Taking the three-dimensional solid modeling of the station building of the two-way channel pump station as the research object, the vibration displacement and stress response of the station building structure under the action of water pressure pulsation were comprehensively analyzed, and the dynamic response of the station building structure of the two-way channel pump station was analyzed; this provides a basis for the design of the two-way channel pump station and puts forward reasonable suggestions for the stable operation of the two-way channel pump station.
2. Research Object and Numerical Methods
2.1. Calculation Model and Grid Division of Station Building
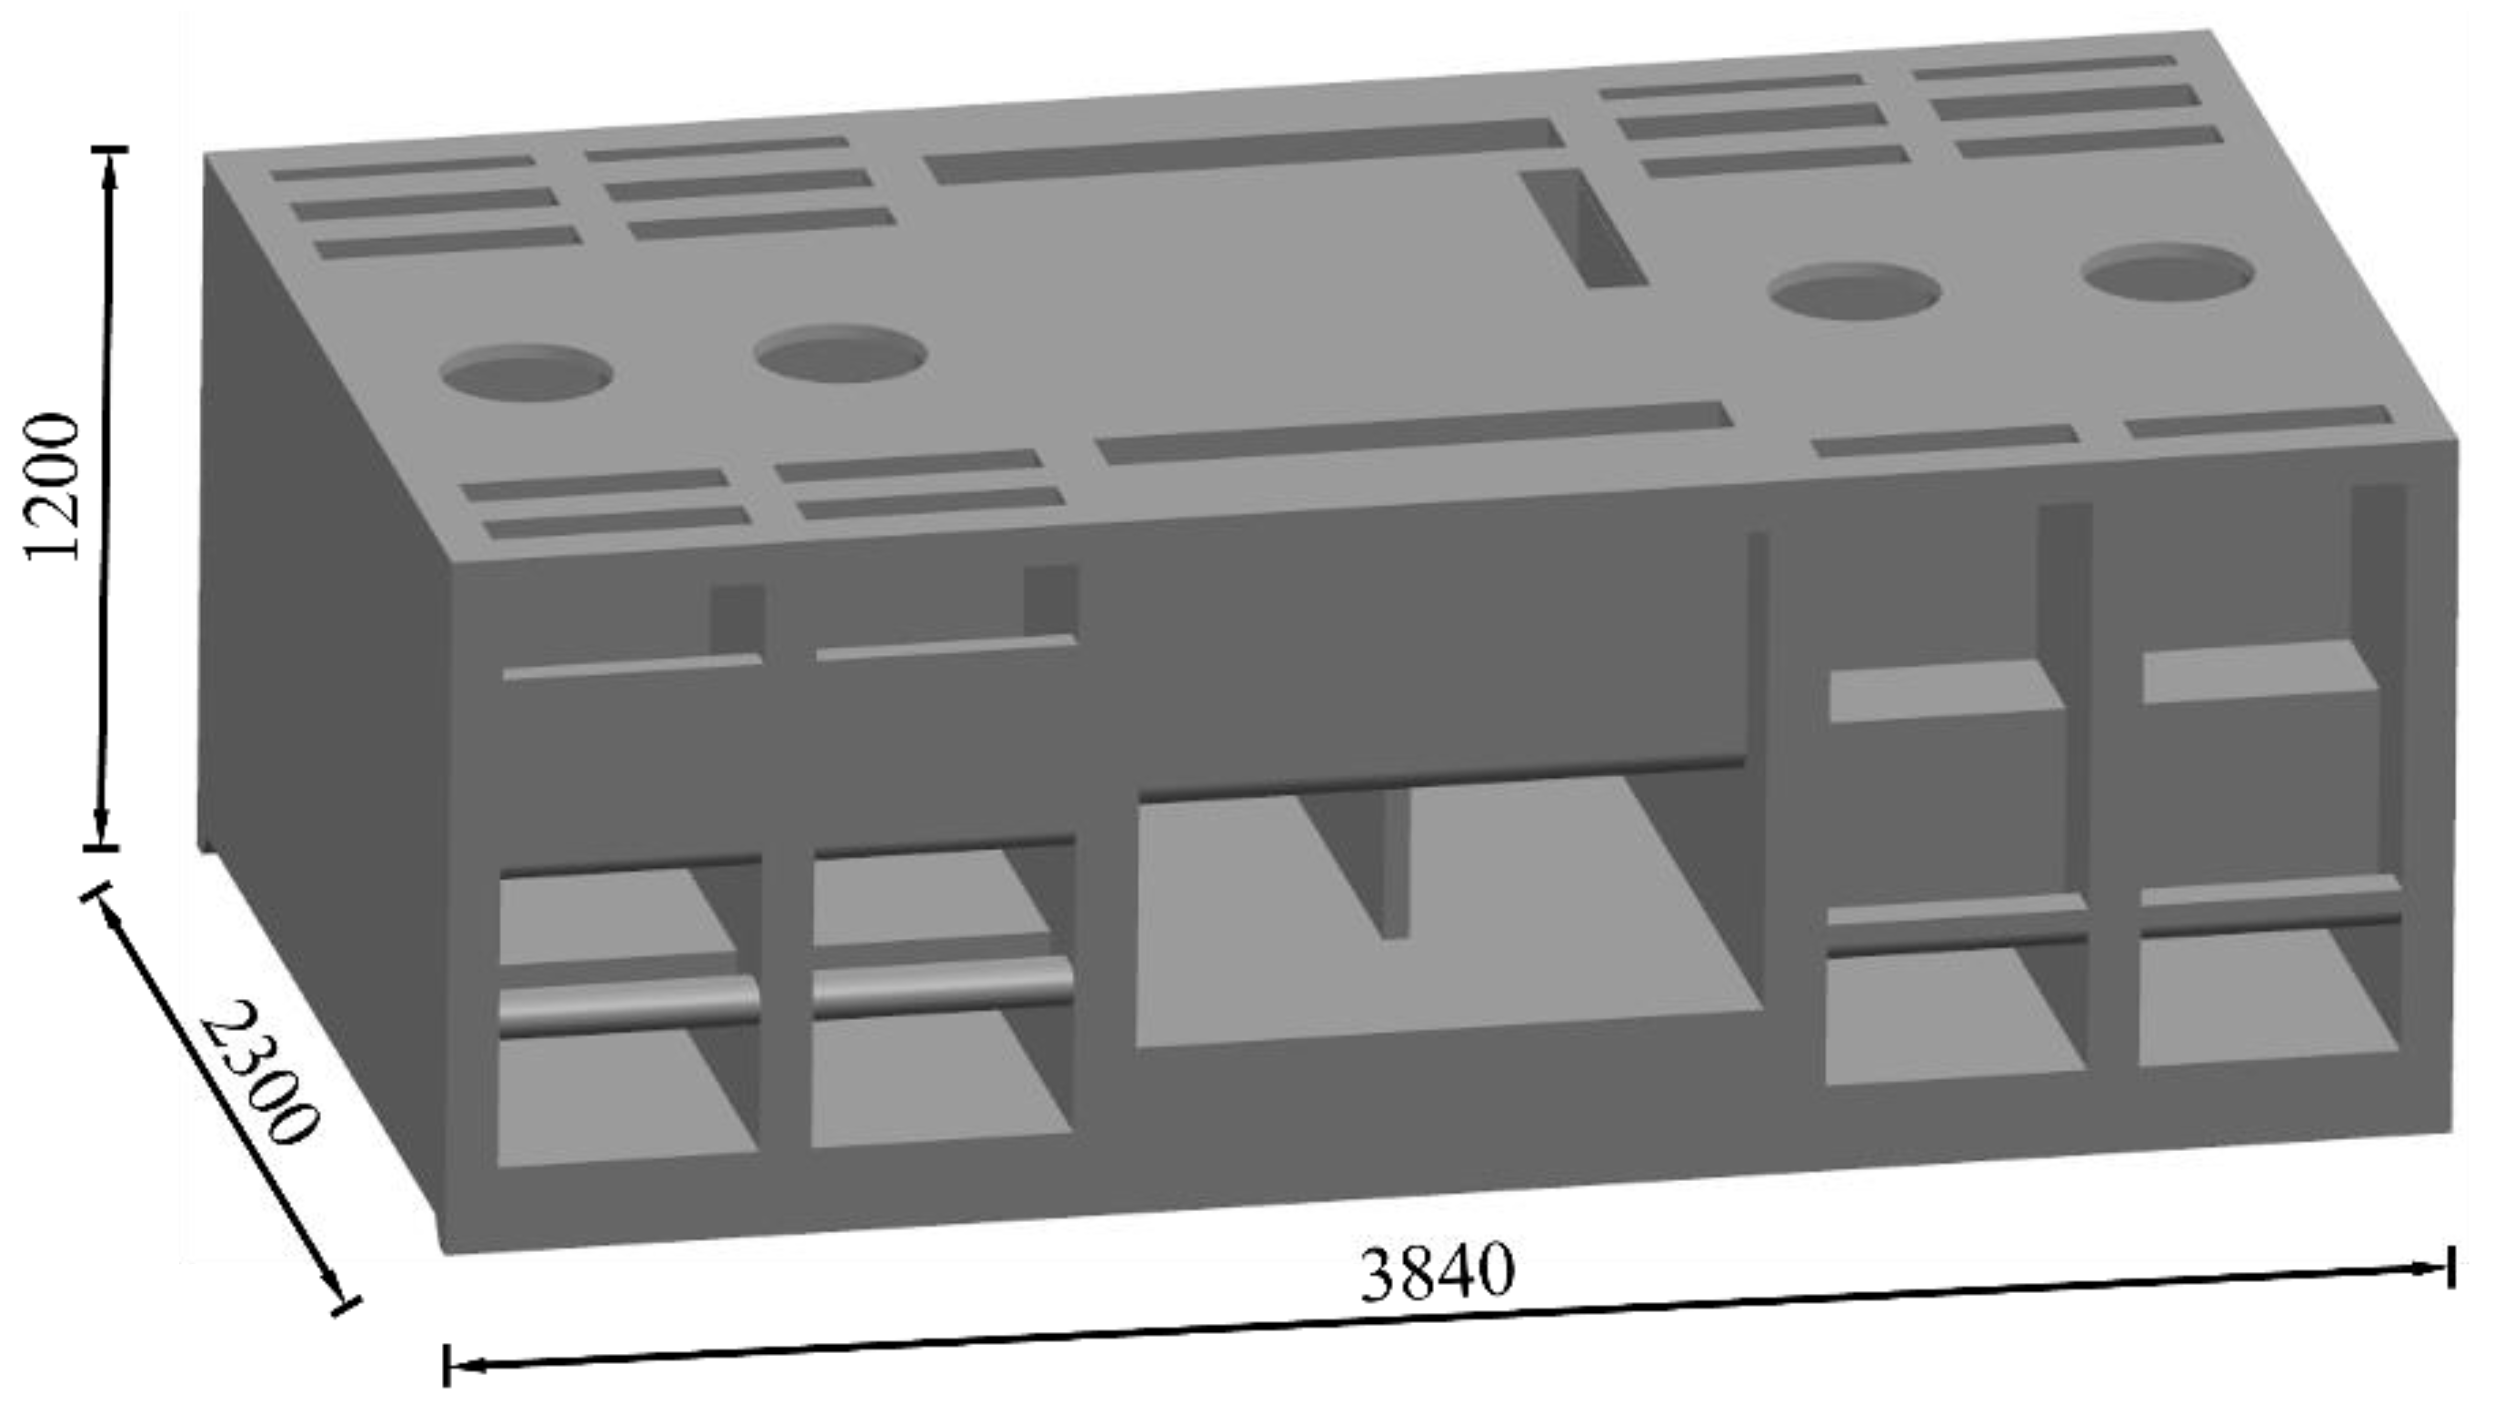
Taking the whole pump station project as the research object, the geometric model of station building was established. The total length along the water inlet and outlet direction (longitudinal axis) of the station building is 23.0 m, along the transverse axis of the station building are four units and sluice gates, with a total width of 38.4 m, a floor elevation of 6.9 m, and a motor floor elevation of 18.9 m, and a total of 12.0 m. The geometric model of the station building is shown in
Figure 1.
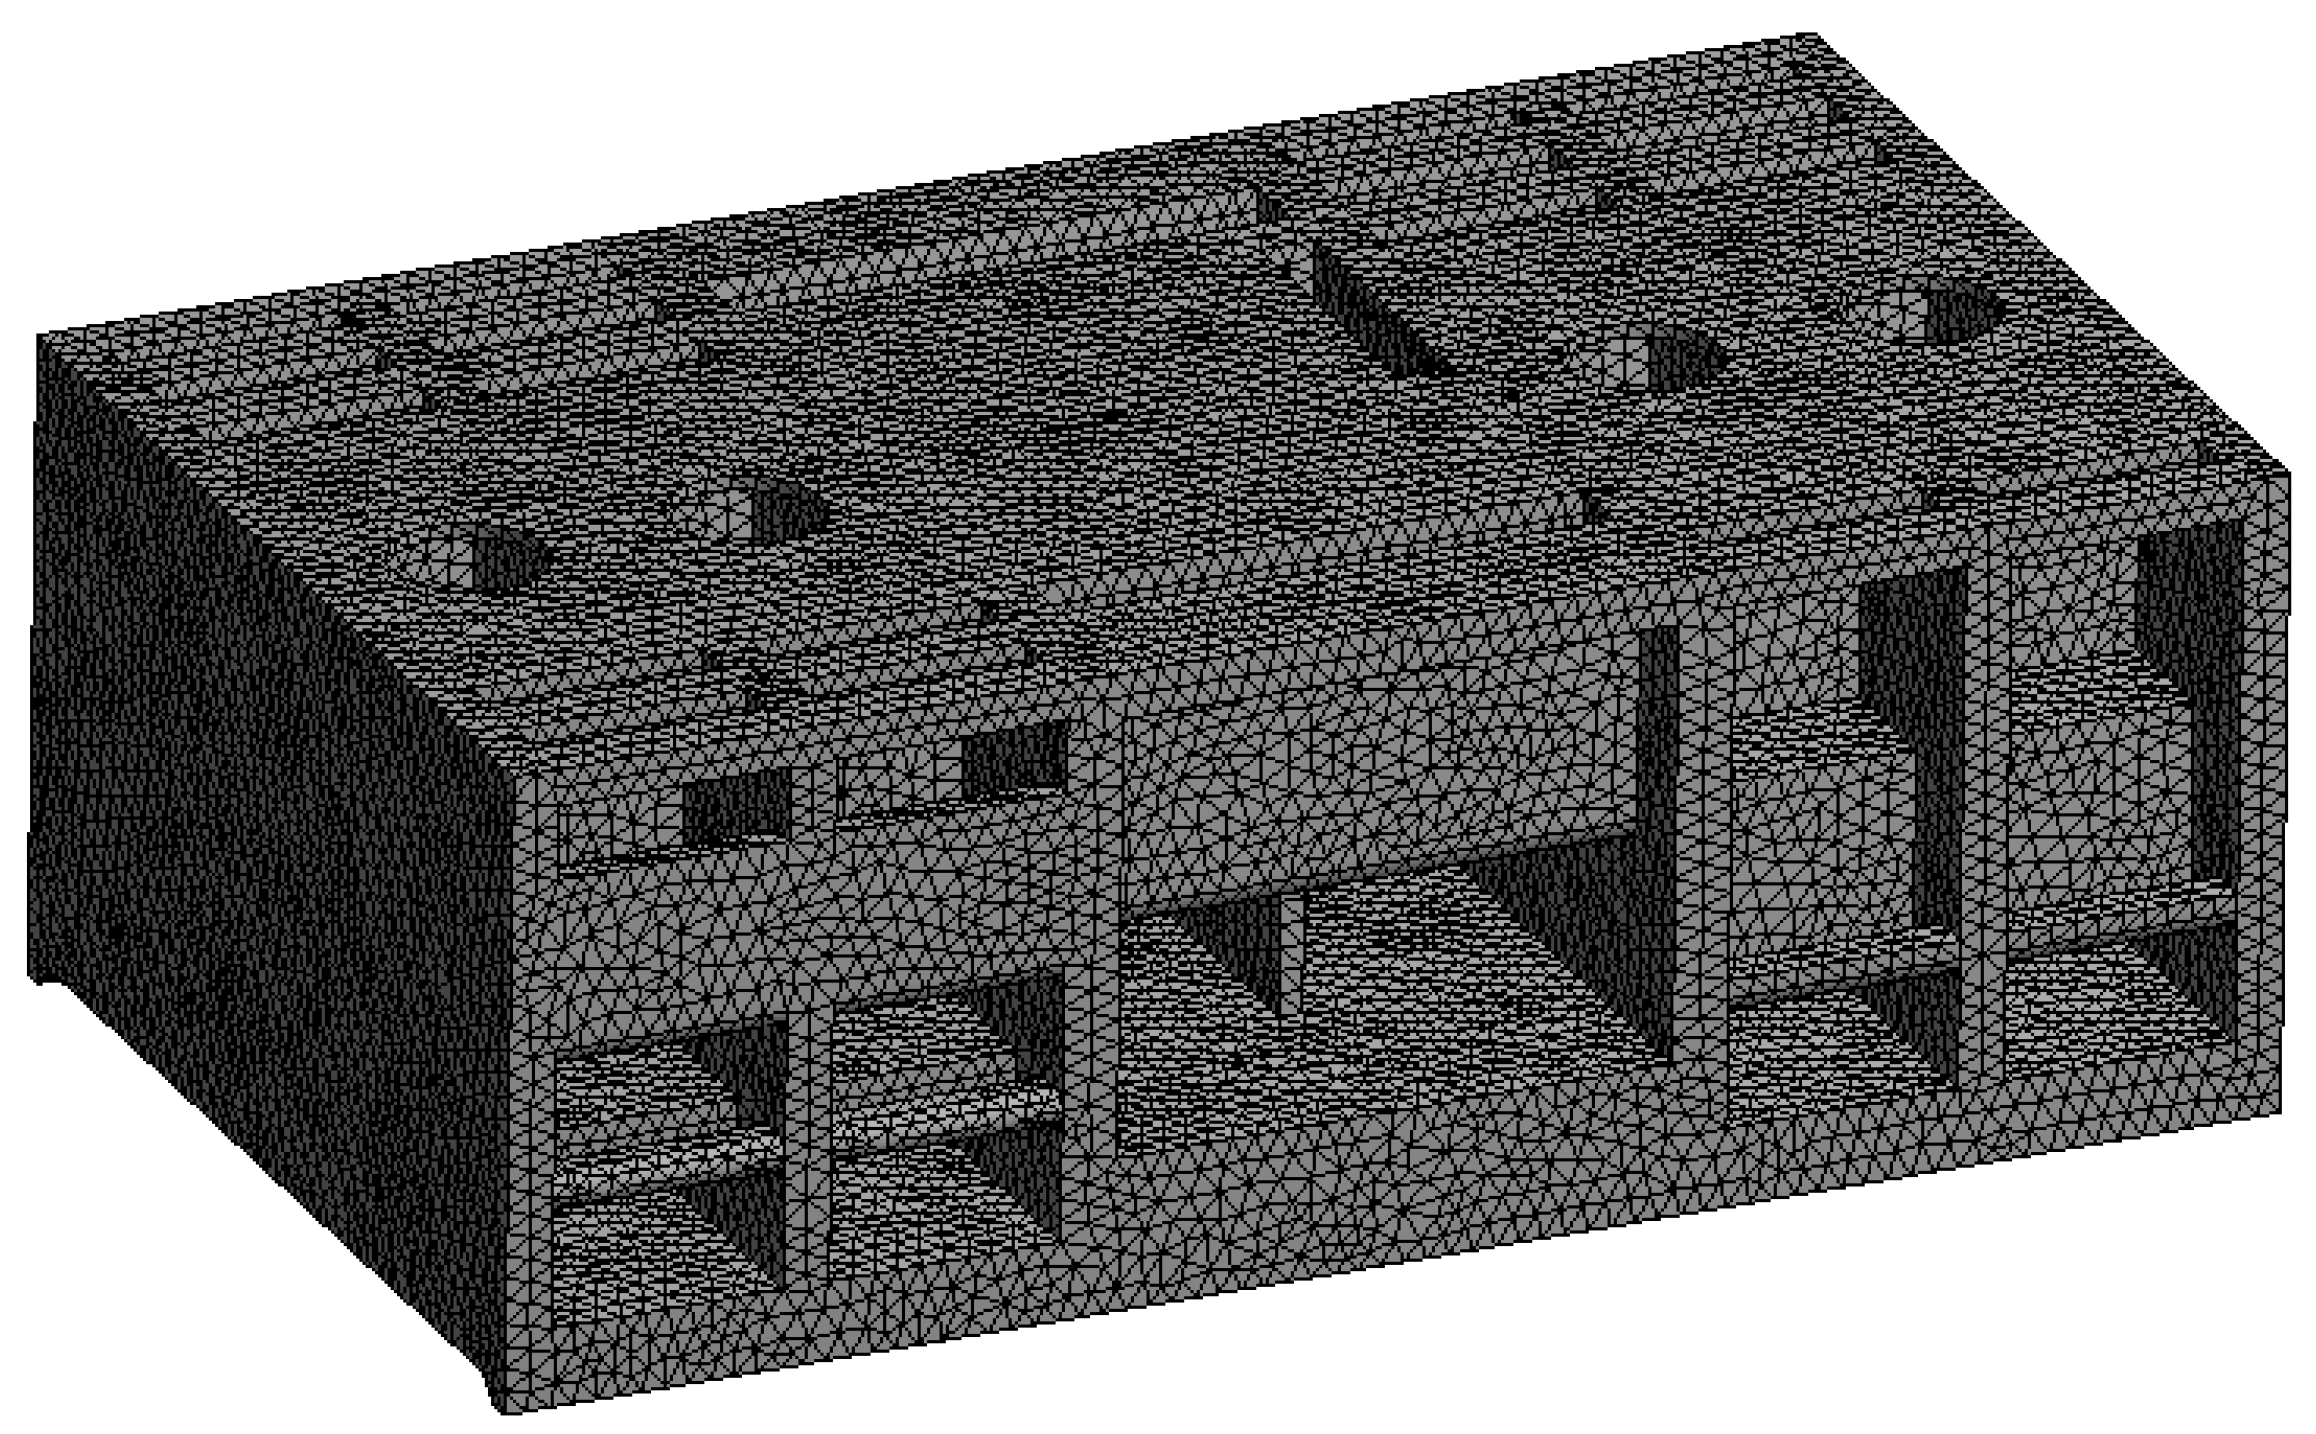
Using the non-structural meshing technology with good adaptability, the overall structure of the station building is meshed, and a high-quality grid is obtained. In order to improve the measurement accuracy of grid, grid encryption was carried out in the study of complex main components. The total grid number of the station building model is 366,000, and the grid quality is 0.81.
Figure 2 shows the finite element mesh of the station building.
2.2. Calculation Model and Grid Division of Pump Device
Four vertical axial flow pump units were selected. The diameter of the pump impeller was D = 1600 mm and the speed was n = 245 r/min. the startup conditions included drainage conditions and diversion conditions. The design flow of a single unit under drainage conditions was
; the design flow of a single unit under the diversion condition was
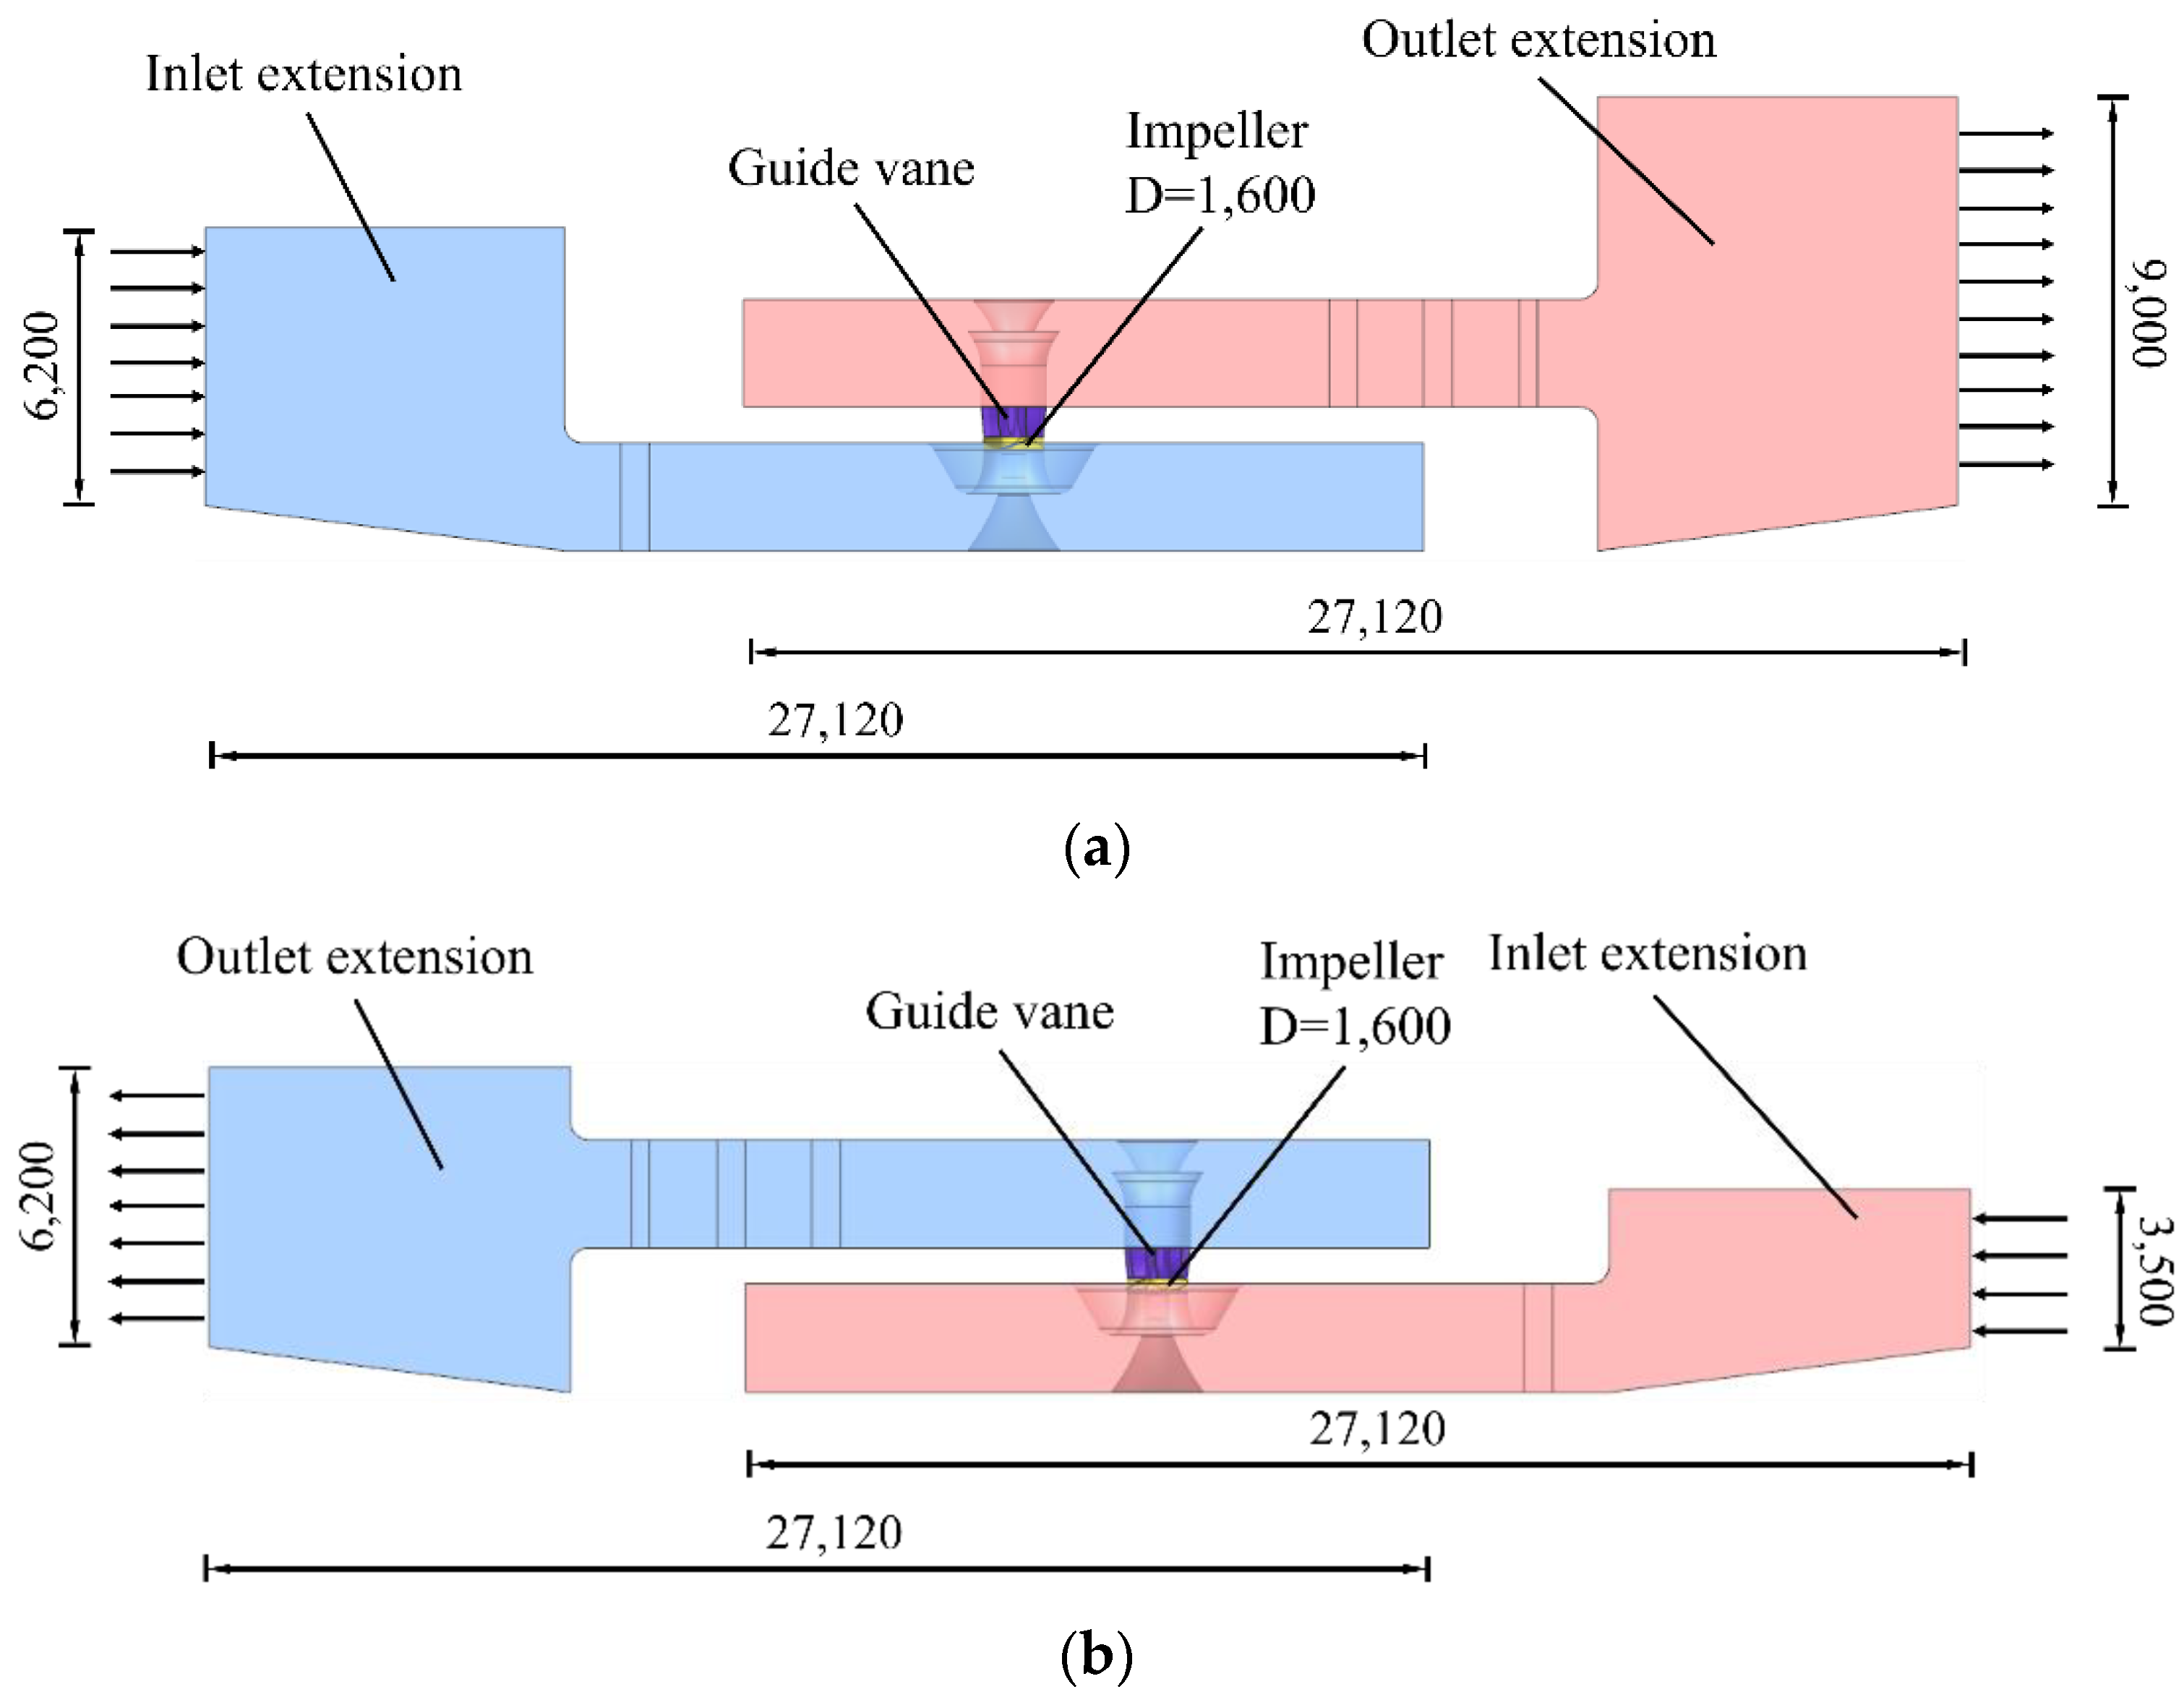
. Under the design drainage condition, the water level at the inner river side was 14.0 m and that at the outer river side was 16.9 m. Under the design diversion condition, the water level at the inner river side was 11.3 m and that at the outer river side was 14.0 m. The water pressure pulsation under two startup conditions was modeled and calculated, respectively, and a pump device was selected for calculation. The calculation model of the pump device included the extension section of the inlet and outlet water channel, the inlet and outlet water channel, the impeller, and the guide vane. The calculation model is shown in
Figure 3.
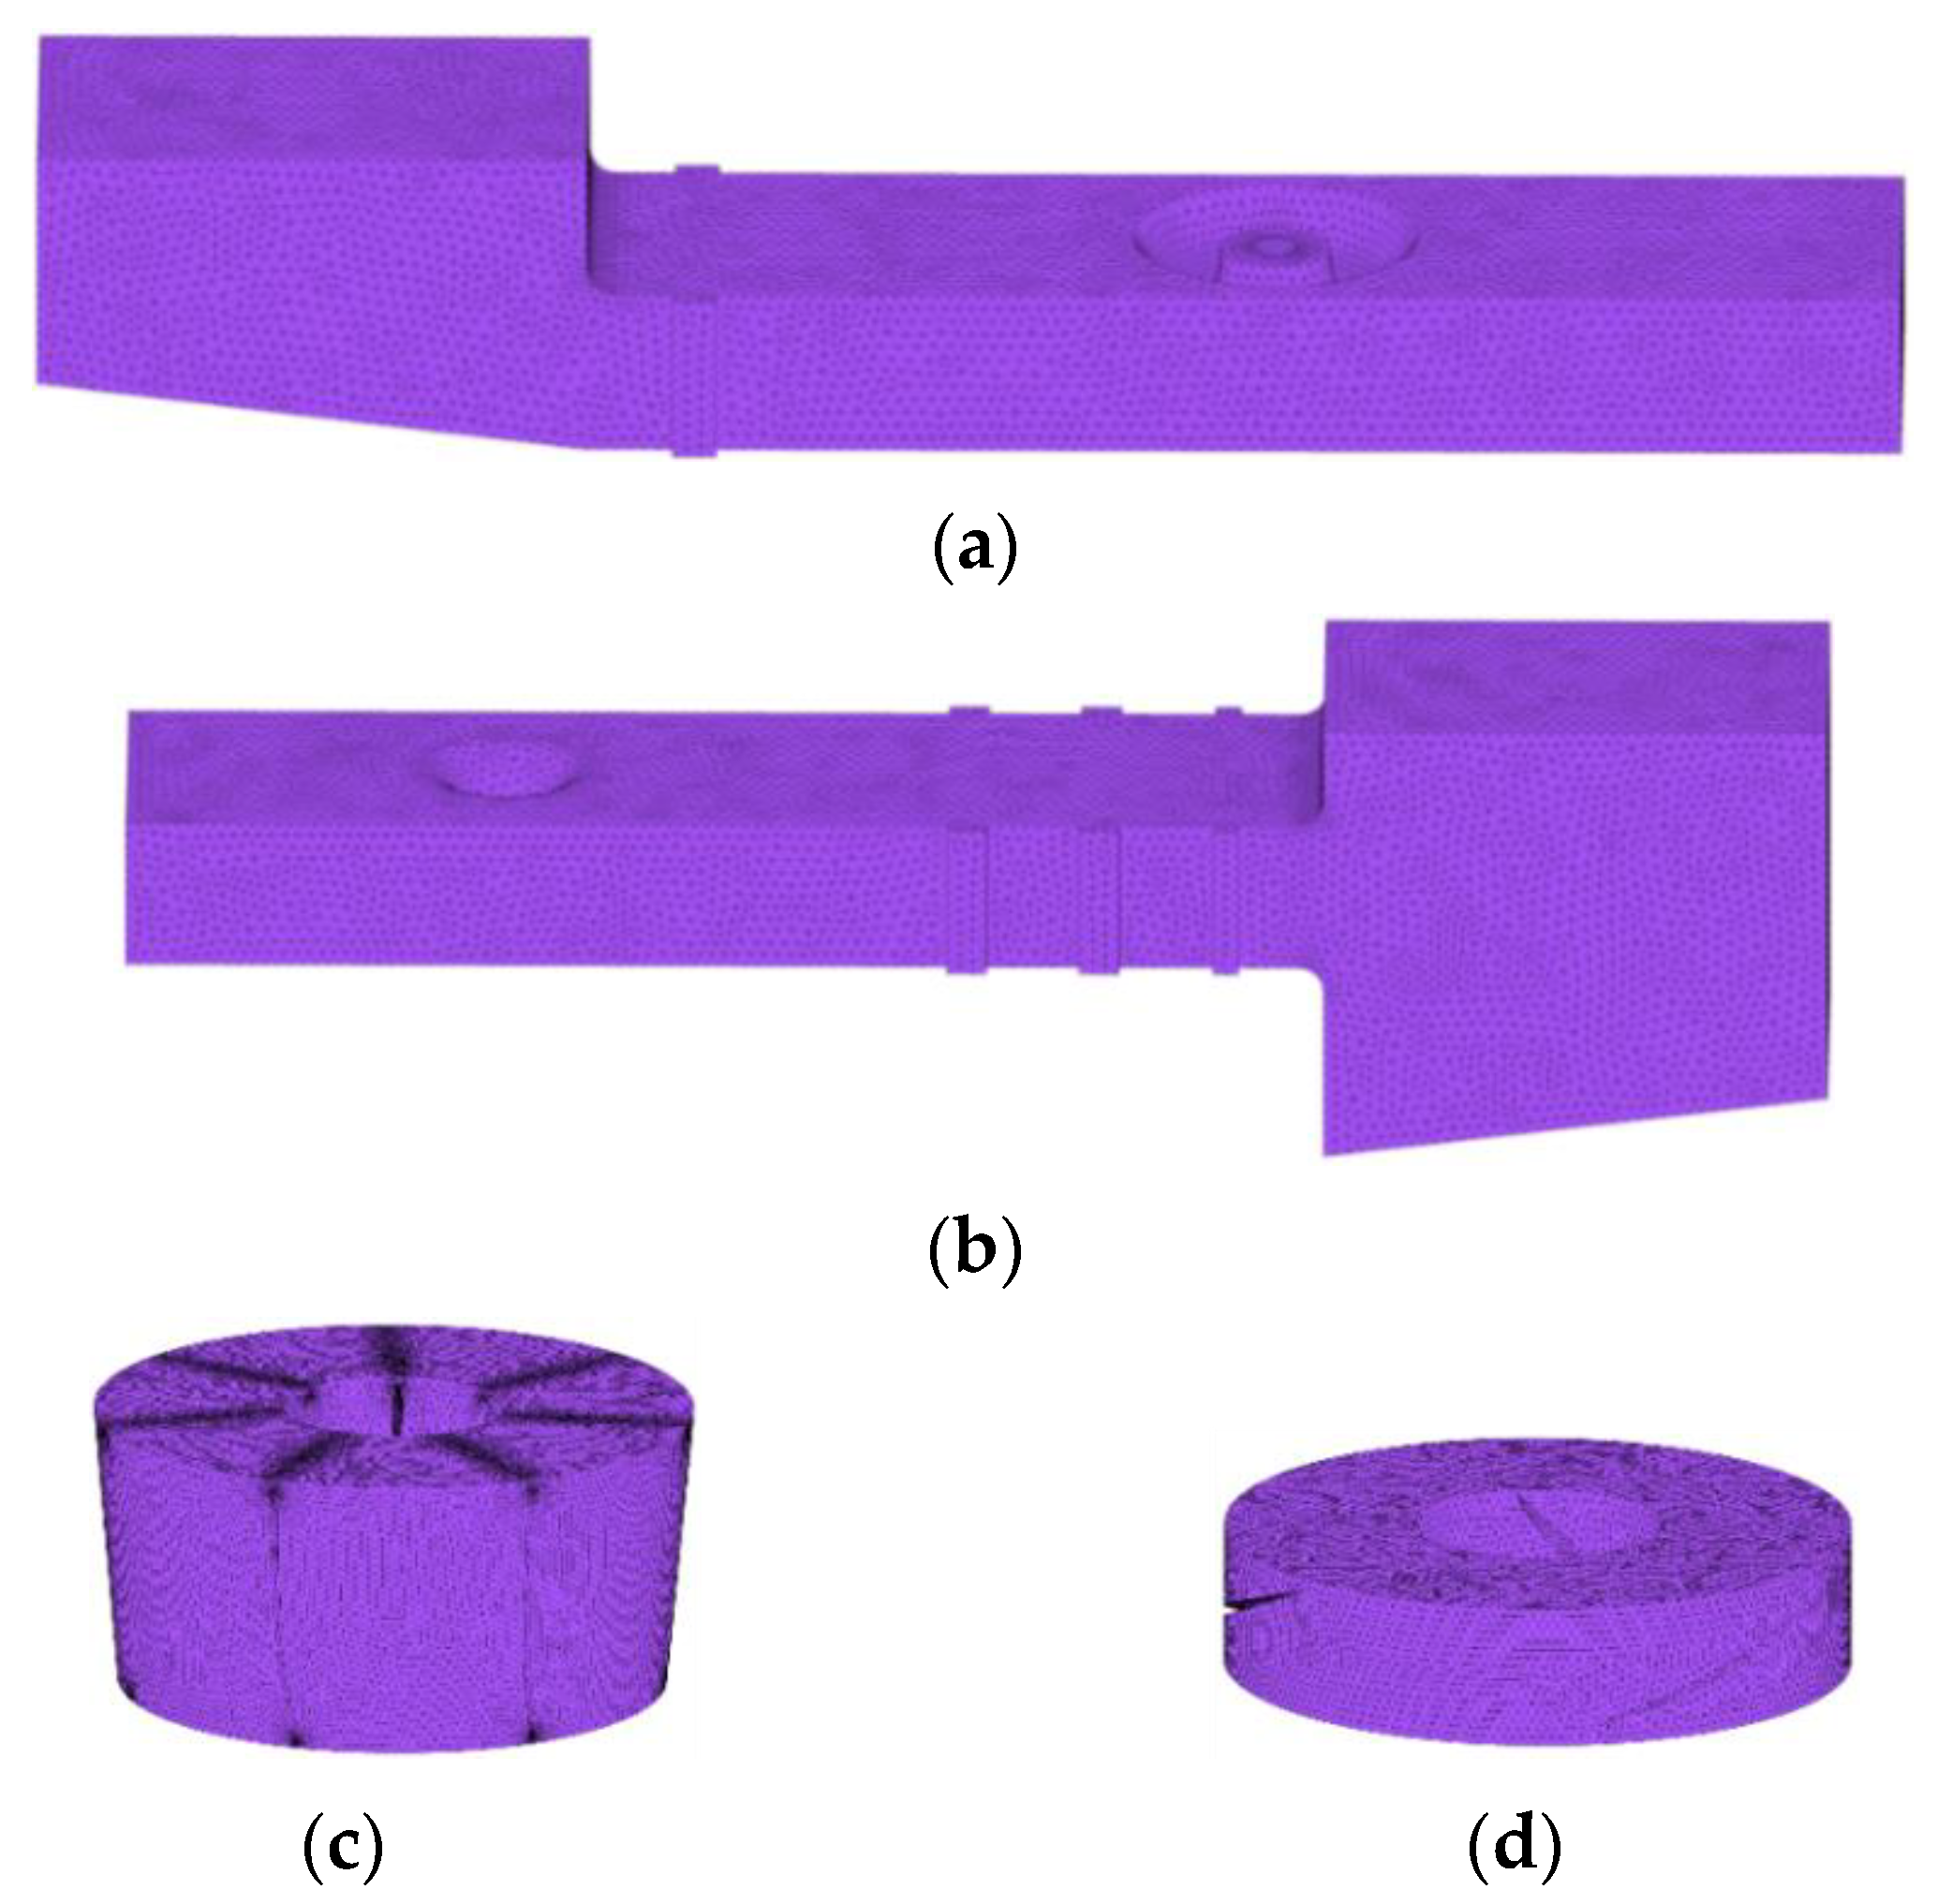
Mesh the impeller, guide vane, inlet, and outlet channels and their extension sections. The schematic diagram of the grid is shown in
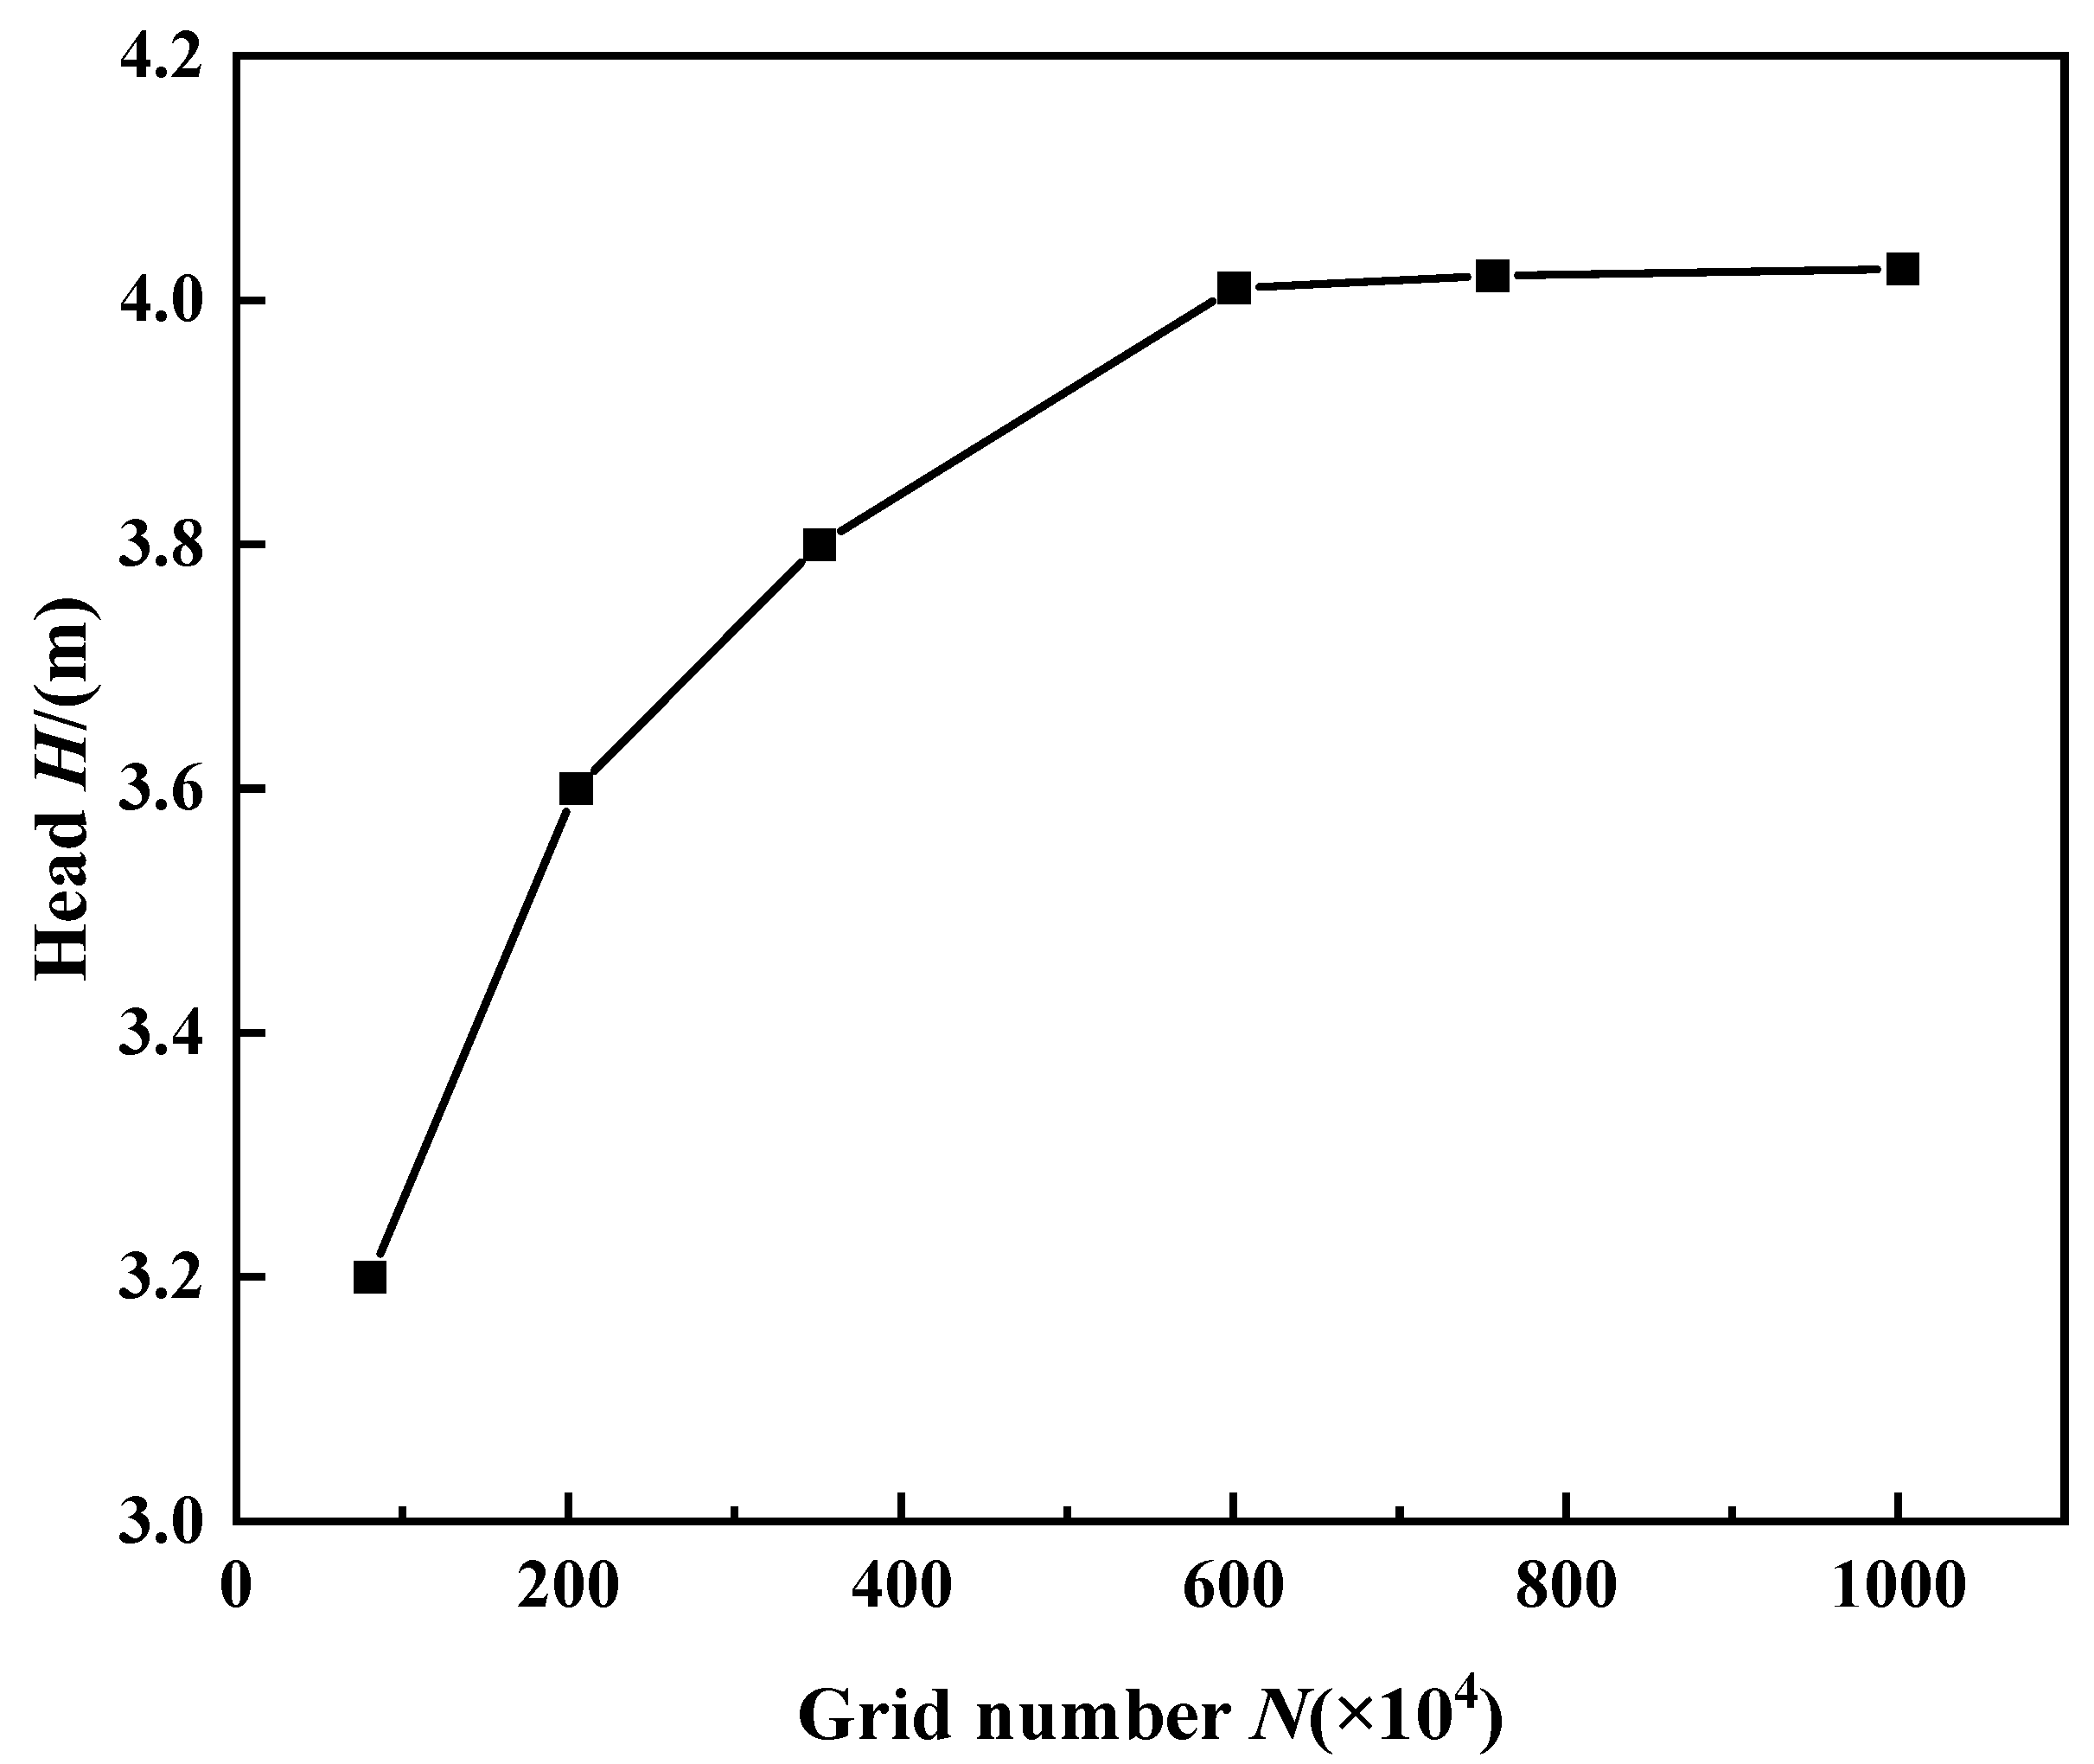
Figure 4. Theoretically, the more grids there are, the more accurate the calculation results will be, but correspondingly more computing resources will be required. In order to improve the calculation speed and, at the same time, ensure the accuracy of the numerical simulation results, numerical calculations were carried out for different grid numbers of the pump device under the design flow condition. It can be seen from
Figure 5 that when the number of grids exceeded 7.56 million, the head of the device changed little, and the number of grids had little effect on the calculation results. Therefore, in order to save computing resources, the final overall computing grid number was determined to be 7.56 million.
2.3. Harmonic Response Analysis and Computational Fluid Dynamics
For a single degree of freedom system, under the action of resonant force,
is the amplitude of force,
is the excitation frequency, and the differential equation of motion is [
22,
23]
The solution of the equation is
When the system has viscous damping
C,
Only steady state response is calculated in ANSYS.
For a multi-degree of freedom system, the differential equation of motion is
The matrix and the matrix are simply harmonic, and the frequency is ω:
Then the dynamic equation of the harmonic response analysis is
The internal flow of the axial pump is three-dimensional viscous turbulence, which cannot be compressed. It follows the continuity and momentum equations in the fluid domain. The continuity equation is also called mass equation.
The RNG k-ε turbulence model is derived from rigorous statistical techniques. It is a modified equation of the standard k-ε model. The RNG k-ε model improves computational accuracy, particularly in terms of turbulent vortices, by adding conditions to the ε equation that complement the analytical formulation for low Reynolds number flow viscosity. Since the RNG k-ε model can better handle flows with high strain rates and greater flow curvature, it is more accurate than other models for complex shear flows and flows with high shear rates and vortices. The formula k and the equation ε are as follows.
In the formula, ; ; the constants take the values: , , , , .
2.4. Boundary Conditions
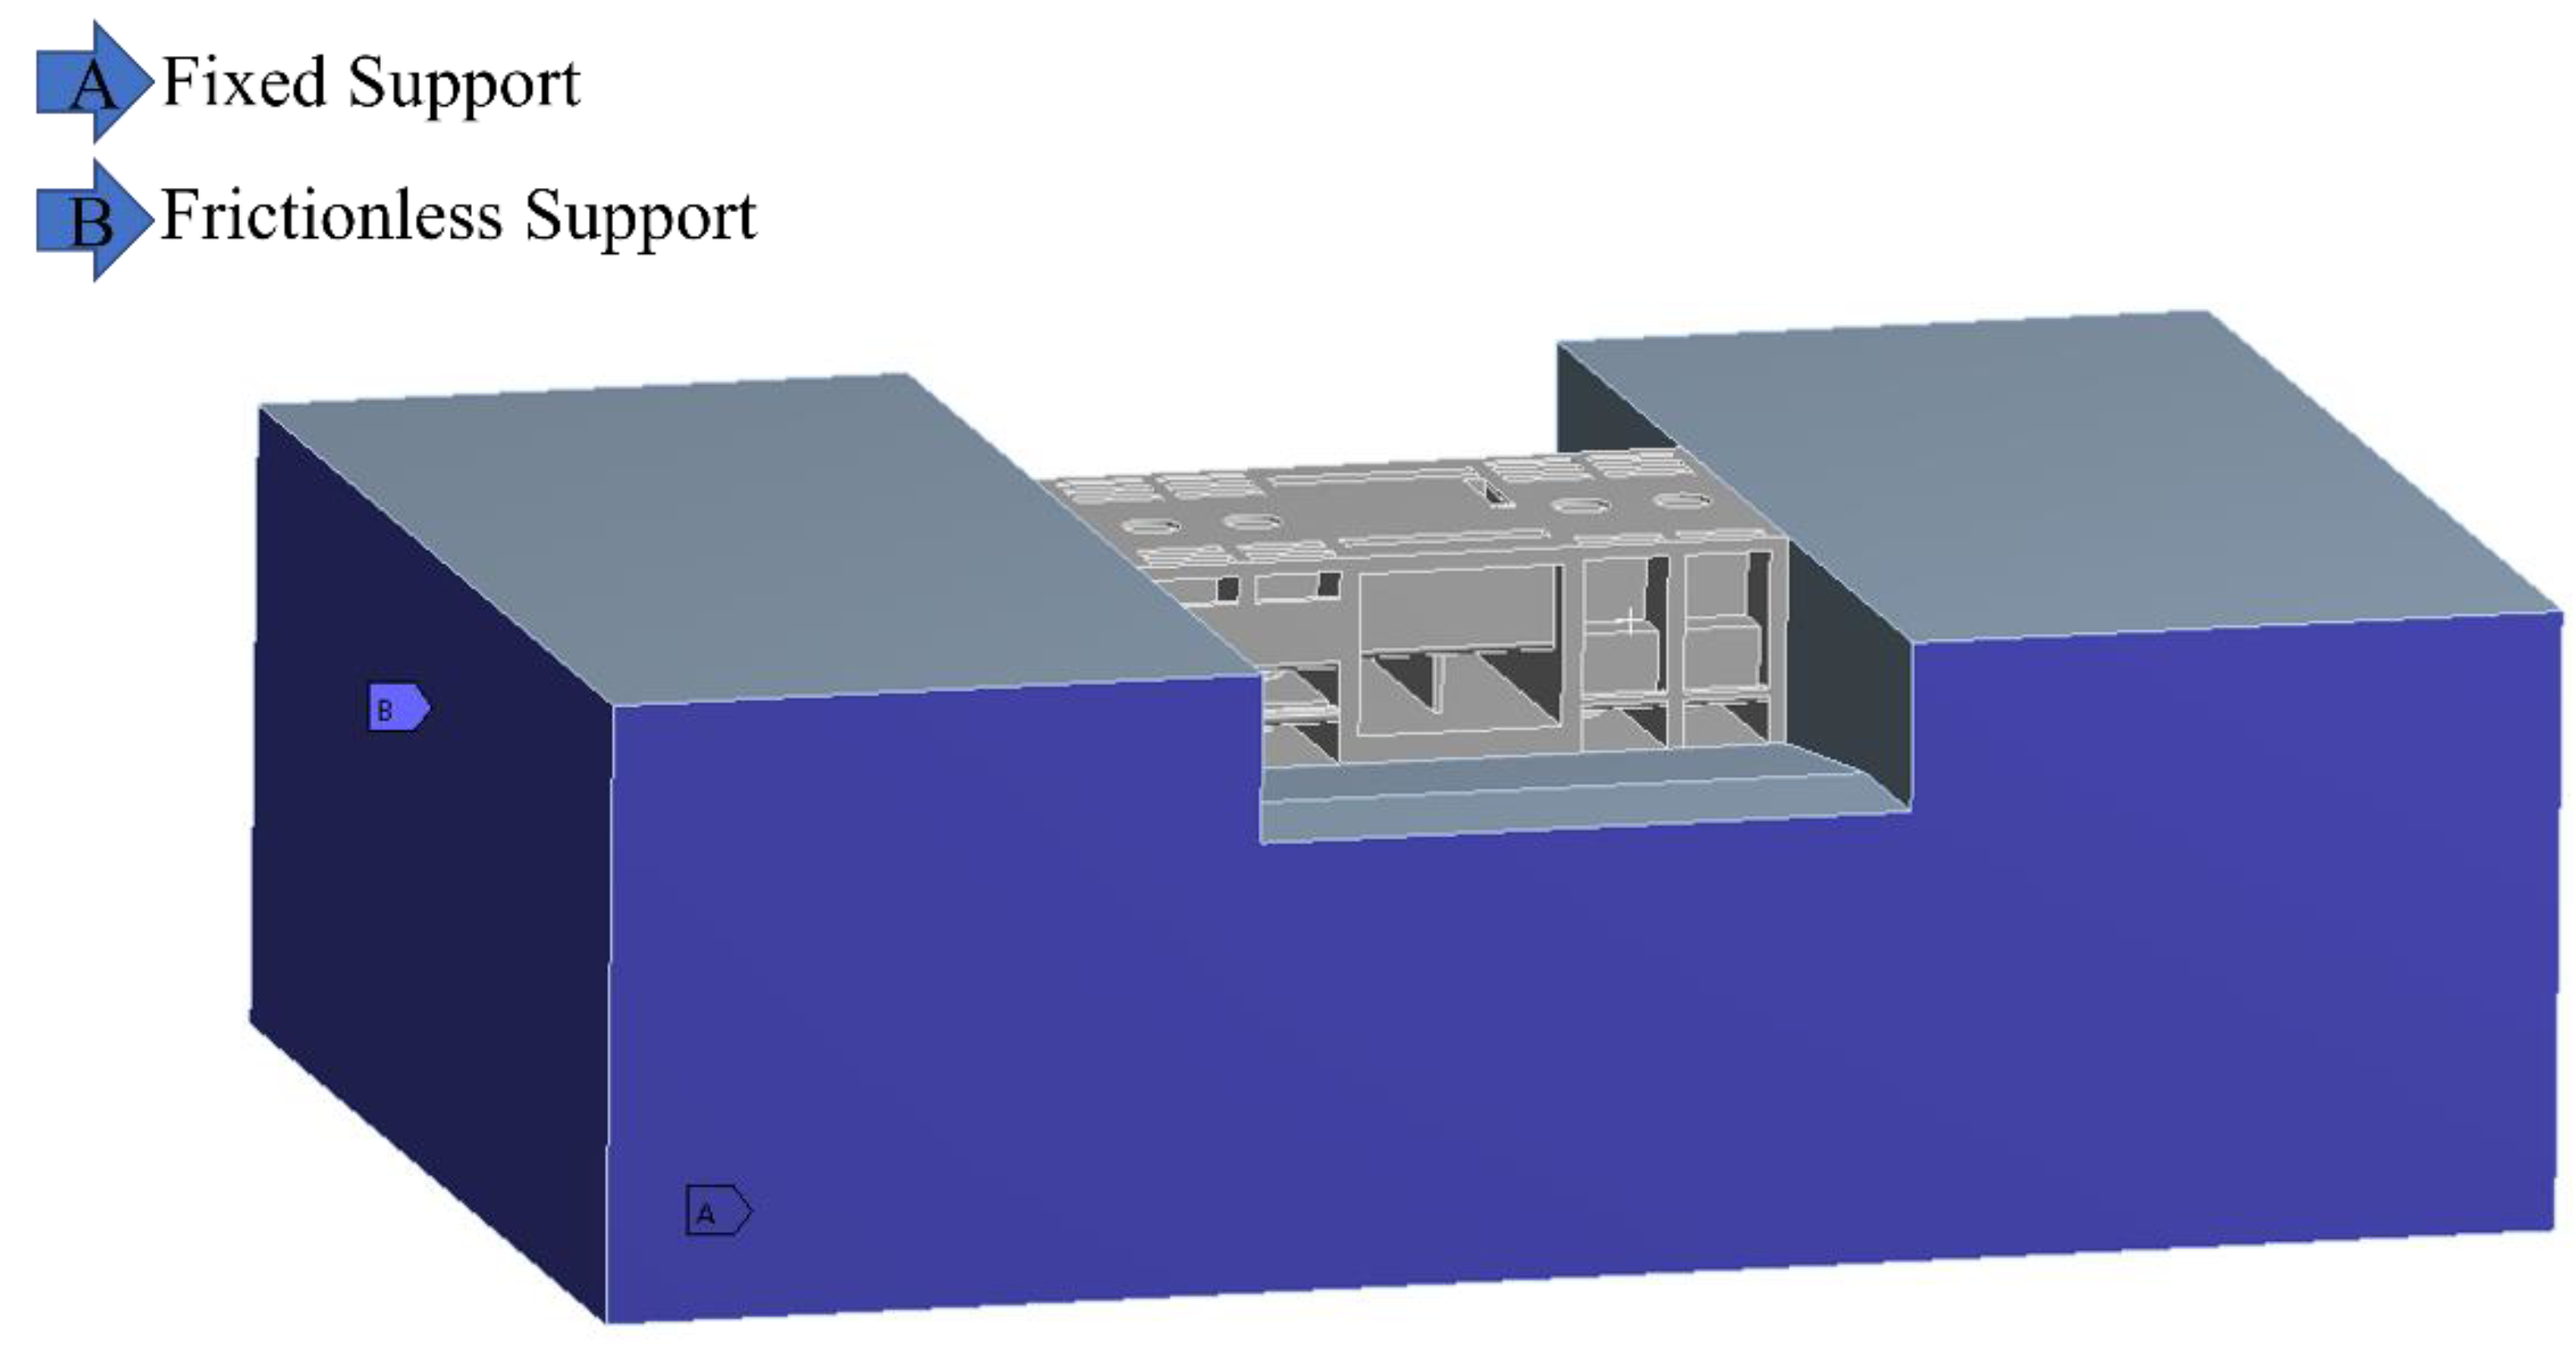
For the boundary conditions of the station building calculation, the vibration of the filling was considered, the bottom of the filling was the fixed end constraint, and the surrounding was the normal constraint. The boundary nodes of the side wall of the station building were in contact with the filling in the normal direction, the normal direction was deformed together, and the tangential direction was not constrained. The schematic diagram of the setting of boundary conditions is shown in
Figure 6.
The materials of the calculation model are assumed to be isotropic linear elastic materials, and the parameter values are shown in
Table 1.
The calculation area of the pump device includes the impeller, guide vane, inlet and outlet channels, and the extension section. The mass flow inlet boundary condition is adopted at the inlet of the calculation area. The single unit flow under the design drainage condition is 7.3 m3/s, and the single unit flow under the design diversion condition is 7.0 m3/s. The pressure outlet boundary condition is adopted for the outlet, which is set as 1 standard atmospheric pressure, and the free water surface at the inlet and outlet is set as the symmetrical plane by using the steel cover assumption. The diameter of the impeller is 1600 mm, the impeller is set as the rotating domain, the speed is 245 r/min, and the rest is set as the stationary domain. The non-slip boundary condition is adopted for the wall, and the standard wall function is adopted for the near wall region.
2.5. Distribution of Monitoring Points
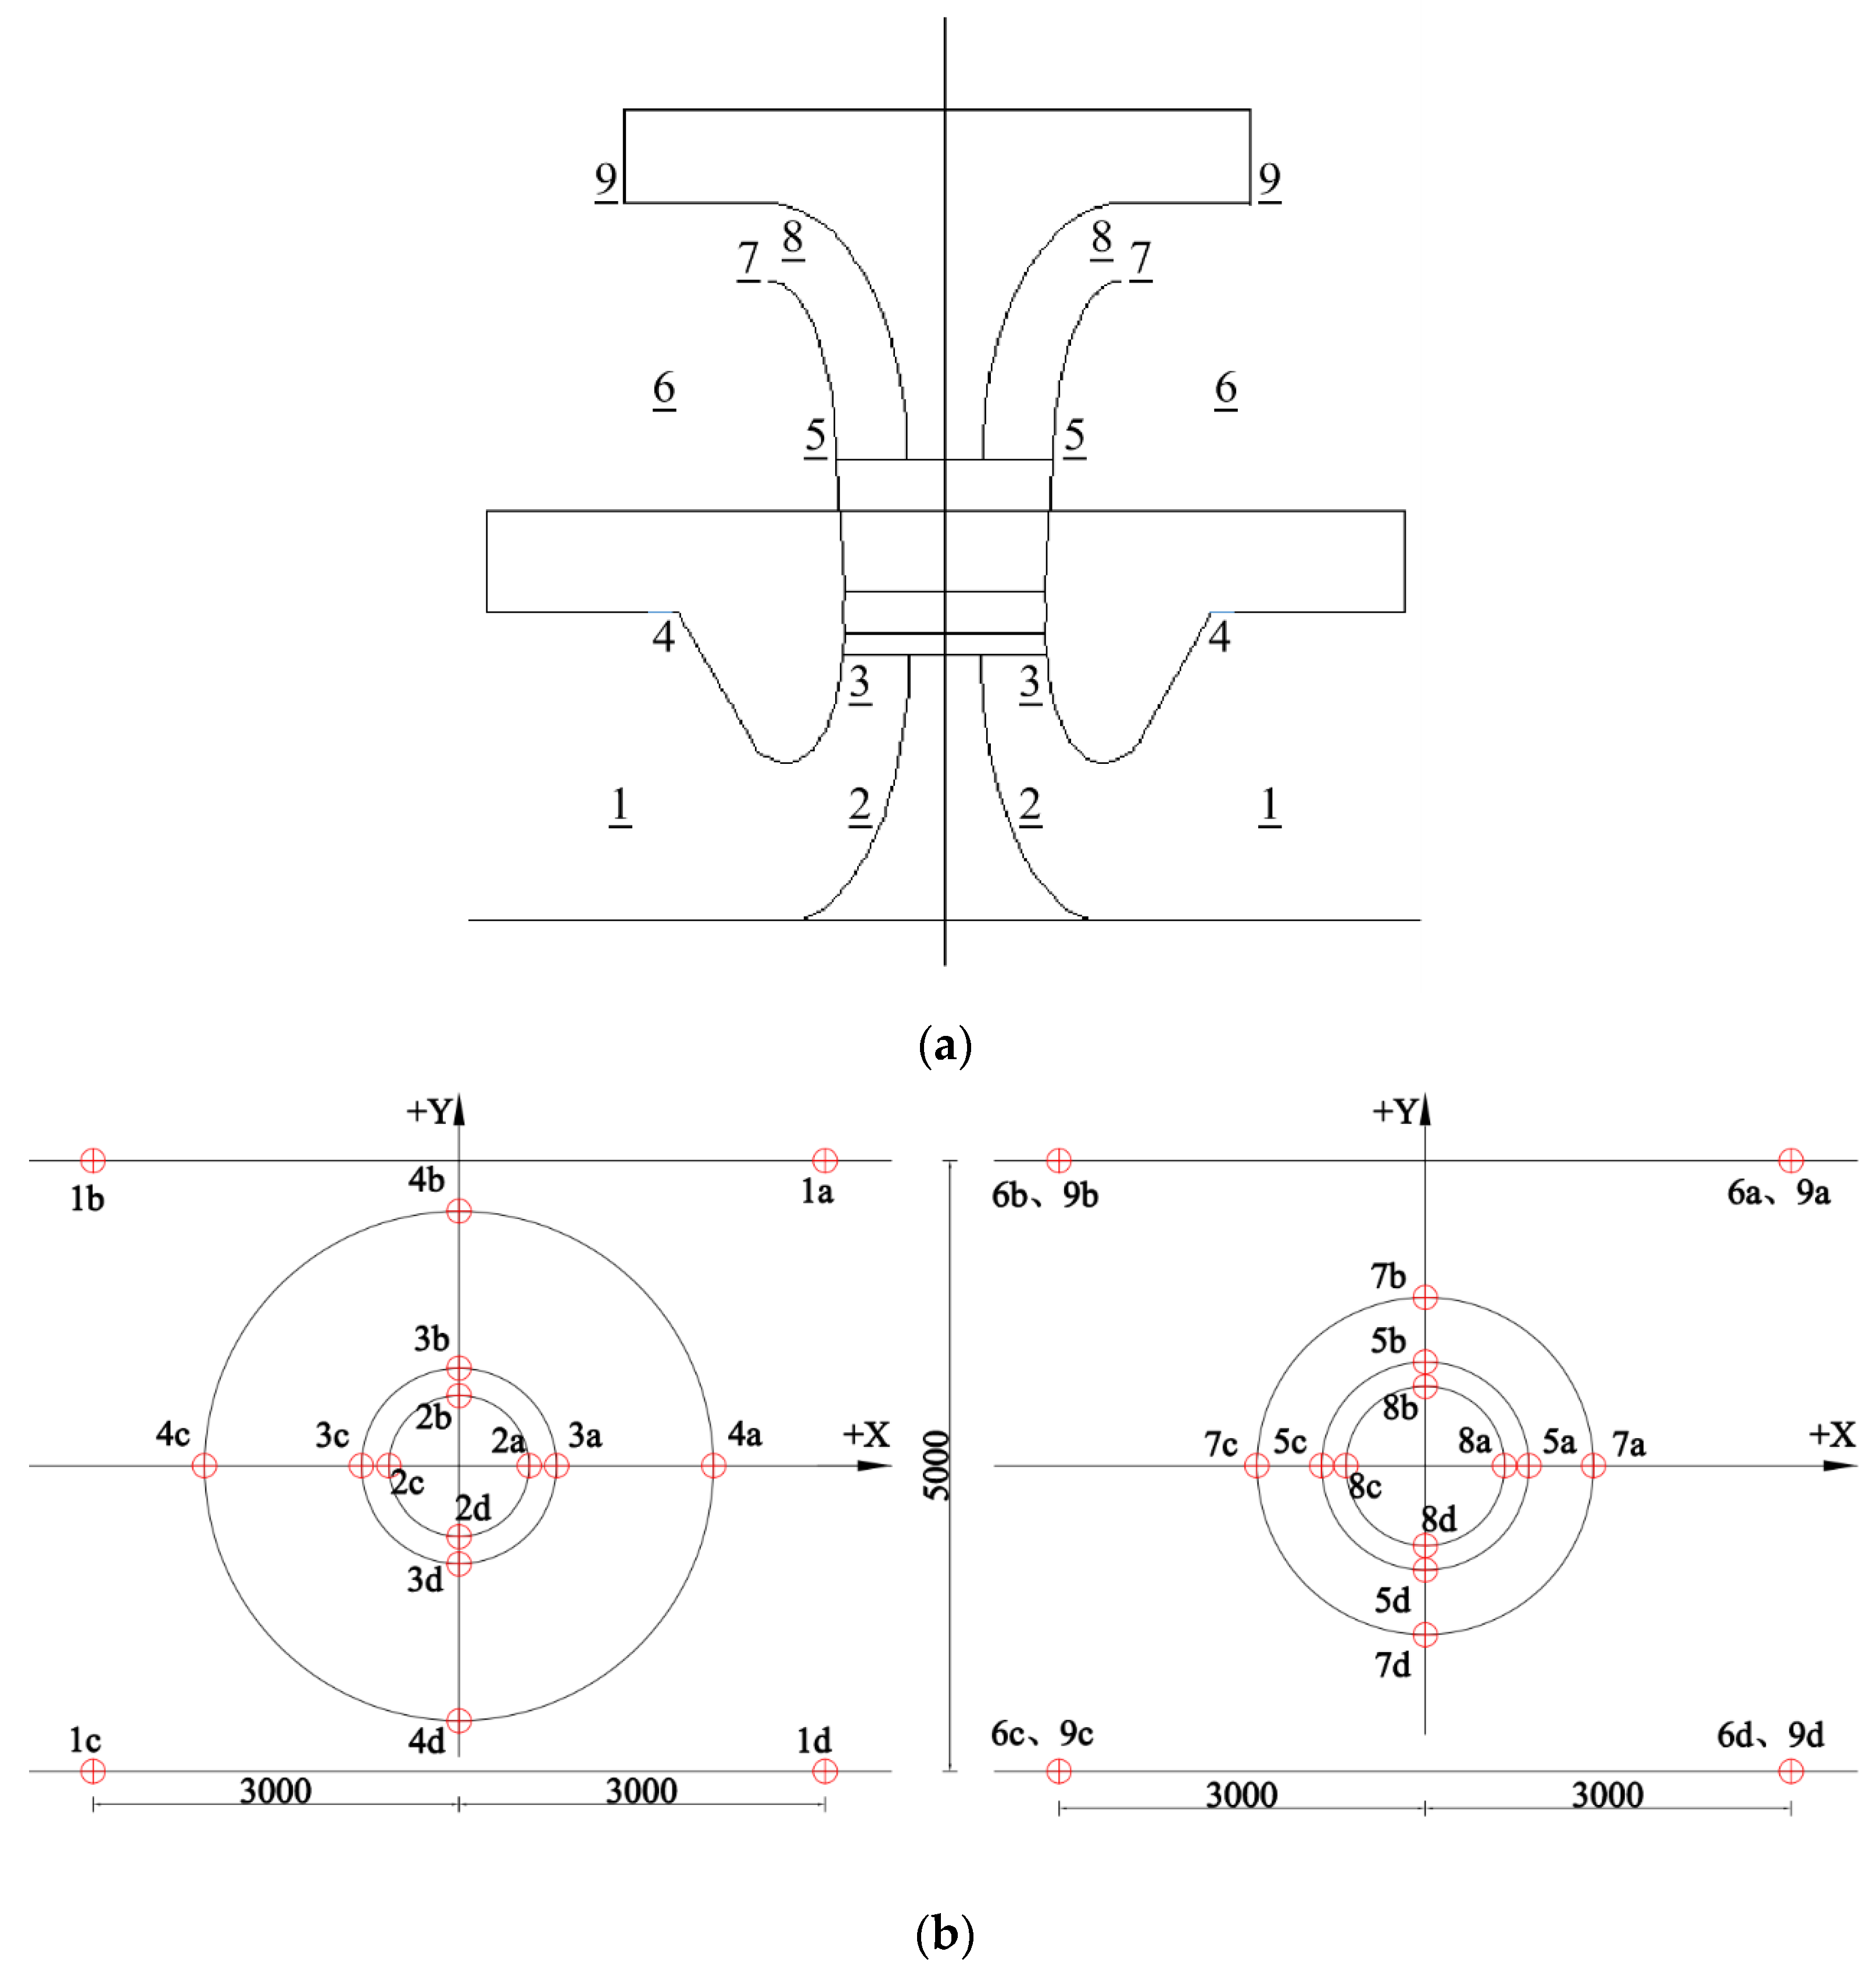
A total of nine monitoring sections were set on the side wall of the inlet channel, the inlet guide cone, the impeller inlet, the top of the inlet channel, the guide vane outlet, the side wall of the outlet channel, the outlet horn pipe, the outlet guide cone, and the top section of the outlet channel. Each section took four abcd nodes at a 90-degree angle in each quadrant, a total of 36 monitoring points.
Figure 7 shows the layout of characteristic monitoring points.
2.6. Calculation Conditions and Loads
When the pumping station discharges waterlogging, four units start up at the same time and run forward. During water diversion operation, units 1 and 2 operate in reverse, with one for use and one for standby. The startup and shutdown conditions under different working conditions are shown in
Table 2.
The load loading condition is shown in
Table 3. The vibration load of the unit is applied according to the startup condition of the unit. The dynamic load is generated when the unit is started, and there is no dynamic load when it is stopped.
2.7. Model Experiment Verification
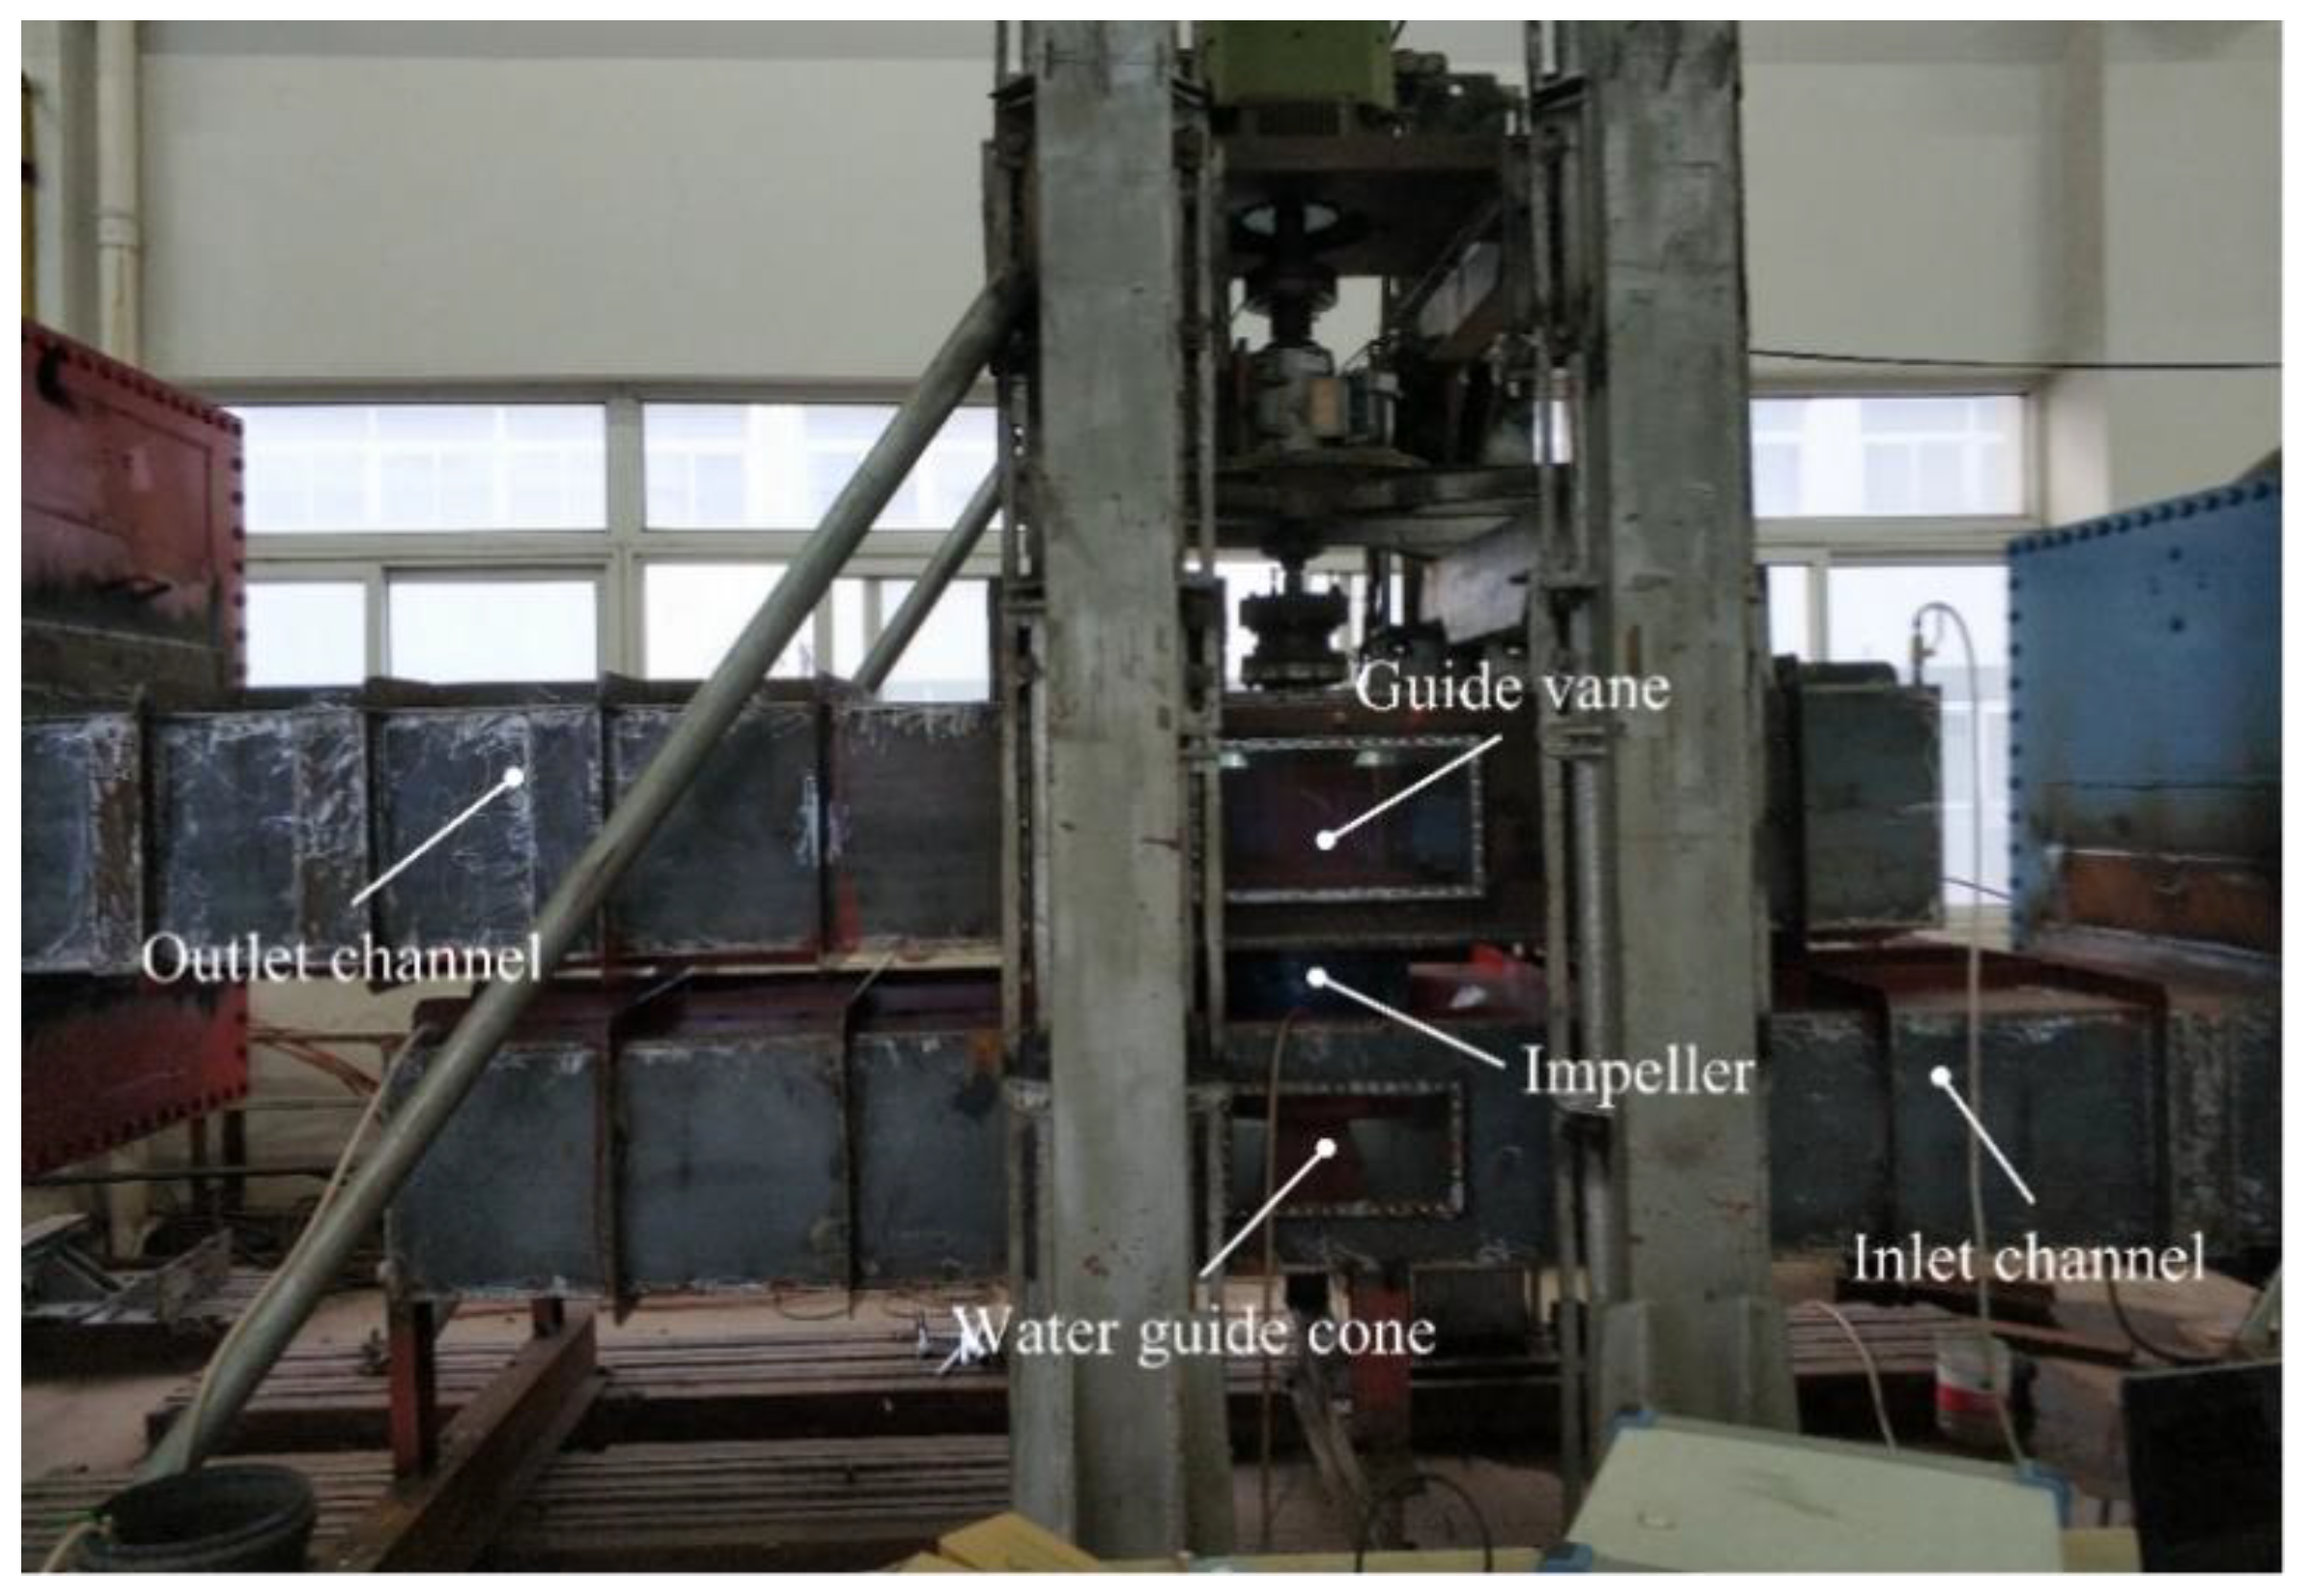
In order to verify the accuracy of the numerical simulation of the two-way channel pump device, the model test of the dual-flow channel pump device was carried out on the high-precision hydraulic machinery test bench ast Jiangsu Key Laboratory of hydraulic power engineering. The diameter of the impeller model was 300 mm and the model scale of the water pump device was 1:5.33. The test speed of the model pump was determined to be 1307 r/min according to the equal head conversion with the prototype. See
Figure 8 for the diagram of the model test device. The test results are converted to the performance data of the prototype pump device, and the external characteristics are compared with the results of numerical simulation under different working conditions. The comparison results are shown in
Figure 9. It can be seen from the figure that the overall trend of the performance curve obtained by the test and numerical simulation is similar, the coincidence degree is high under the design working conditions, the overall fit between the test and numerical simulation is good, and the calculation method and results adopted by the numerical simulation are effective.
3. Results
3.1. Calculation Results of Pressure Fluctuation
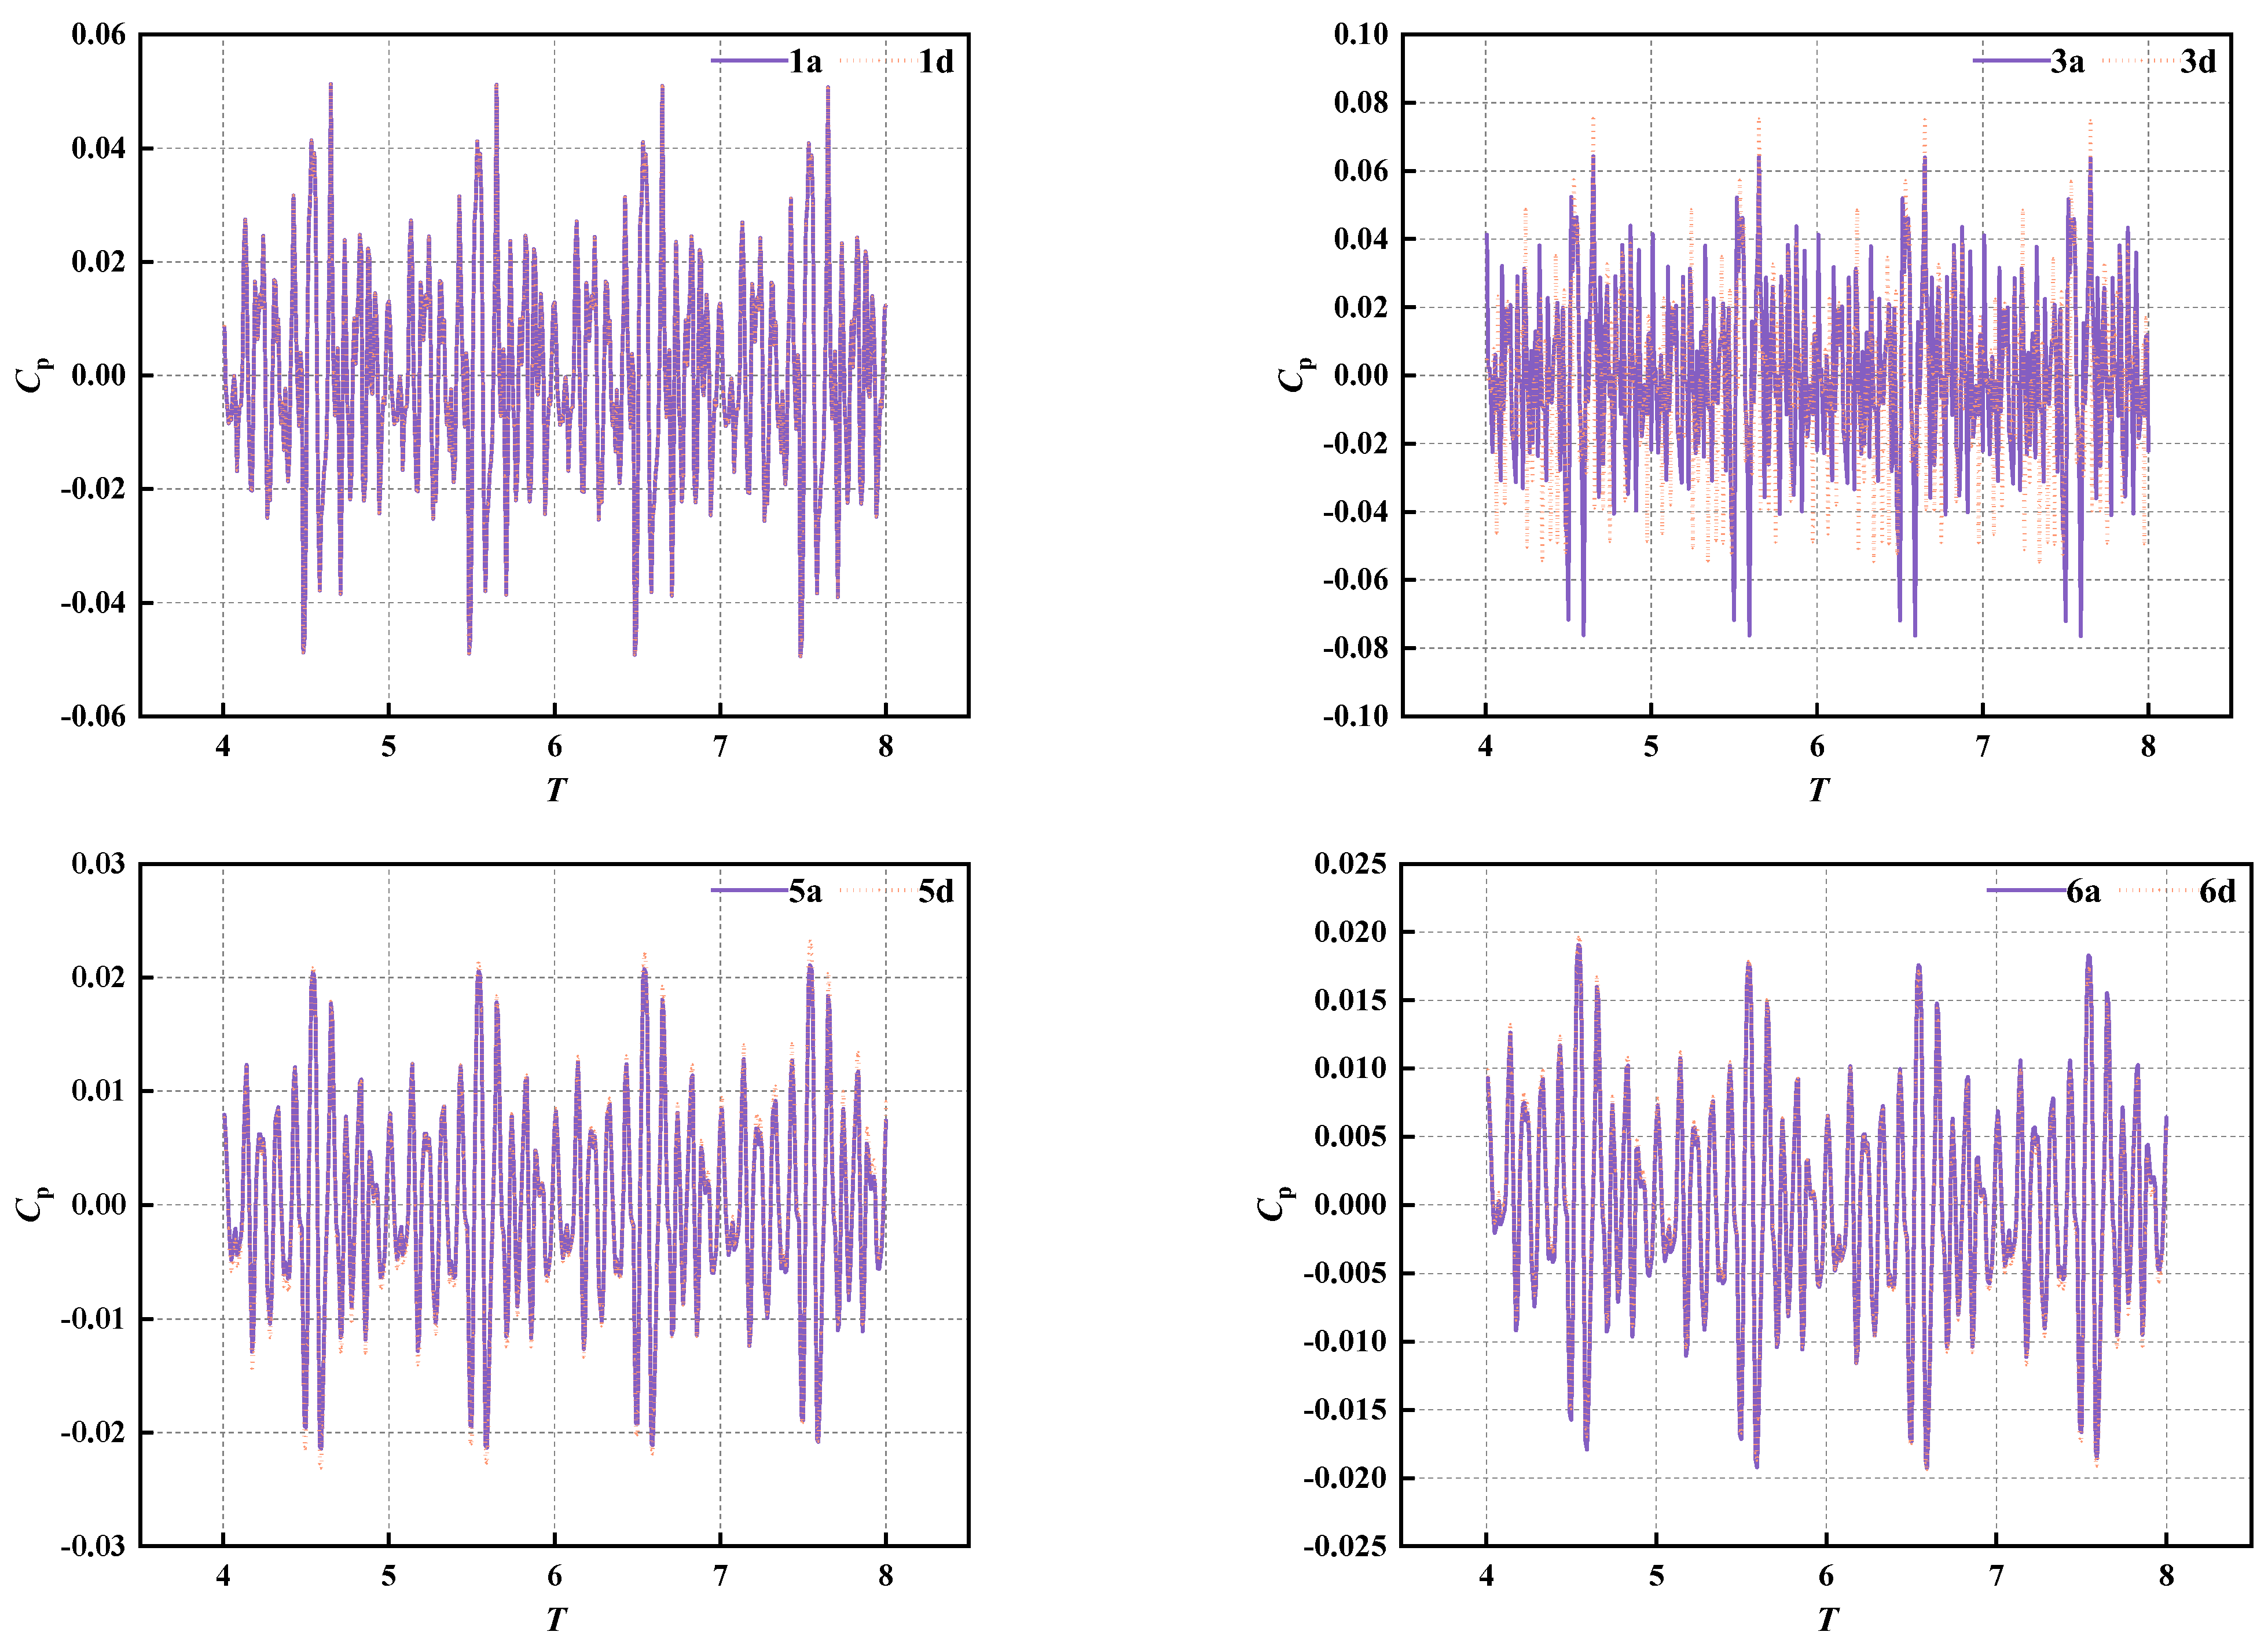
In order to eliminate the influence of the static pressure of the monitoring point on the overall pressure pulsation, the pressure pulsation coefficient
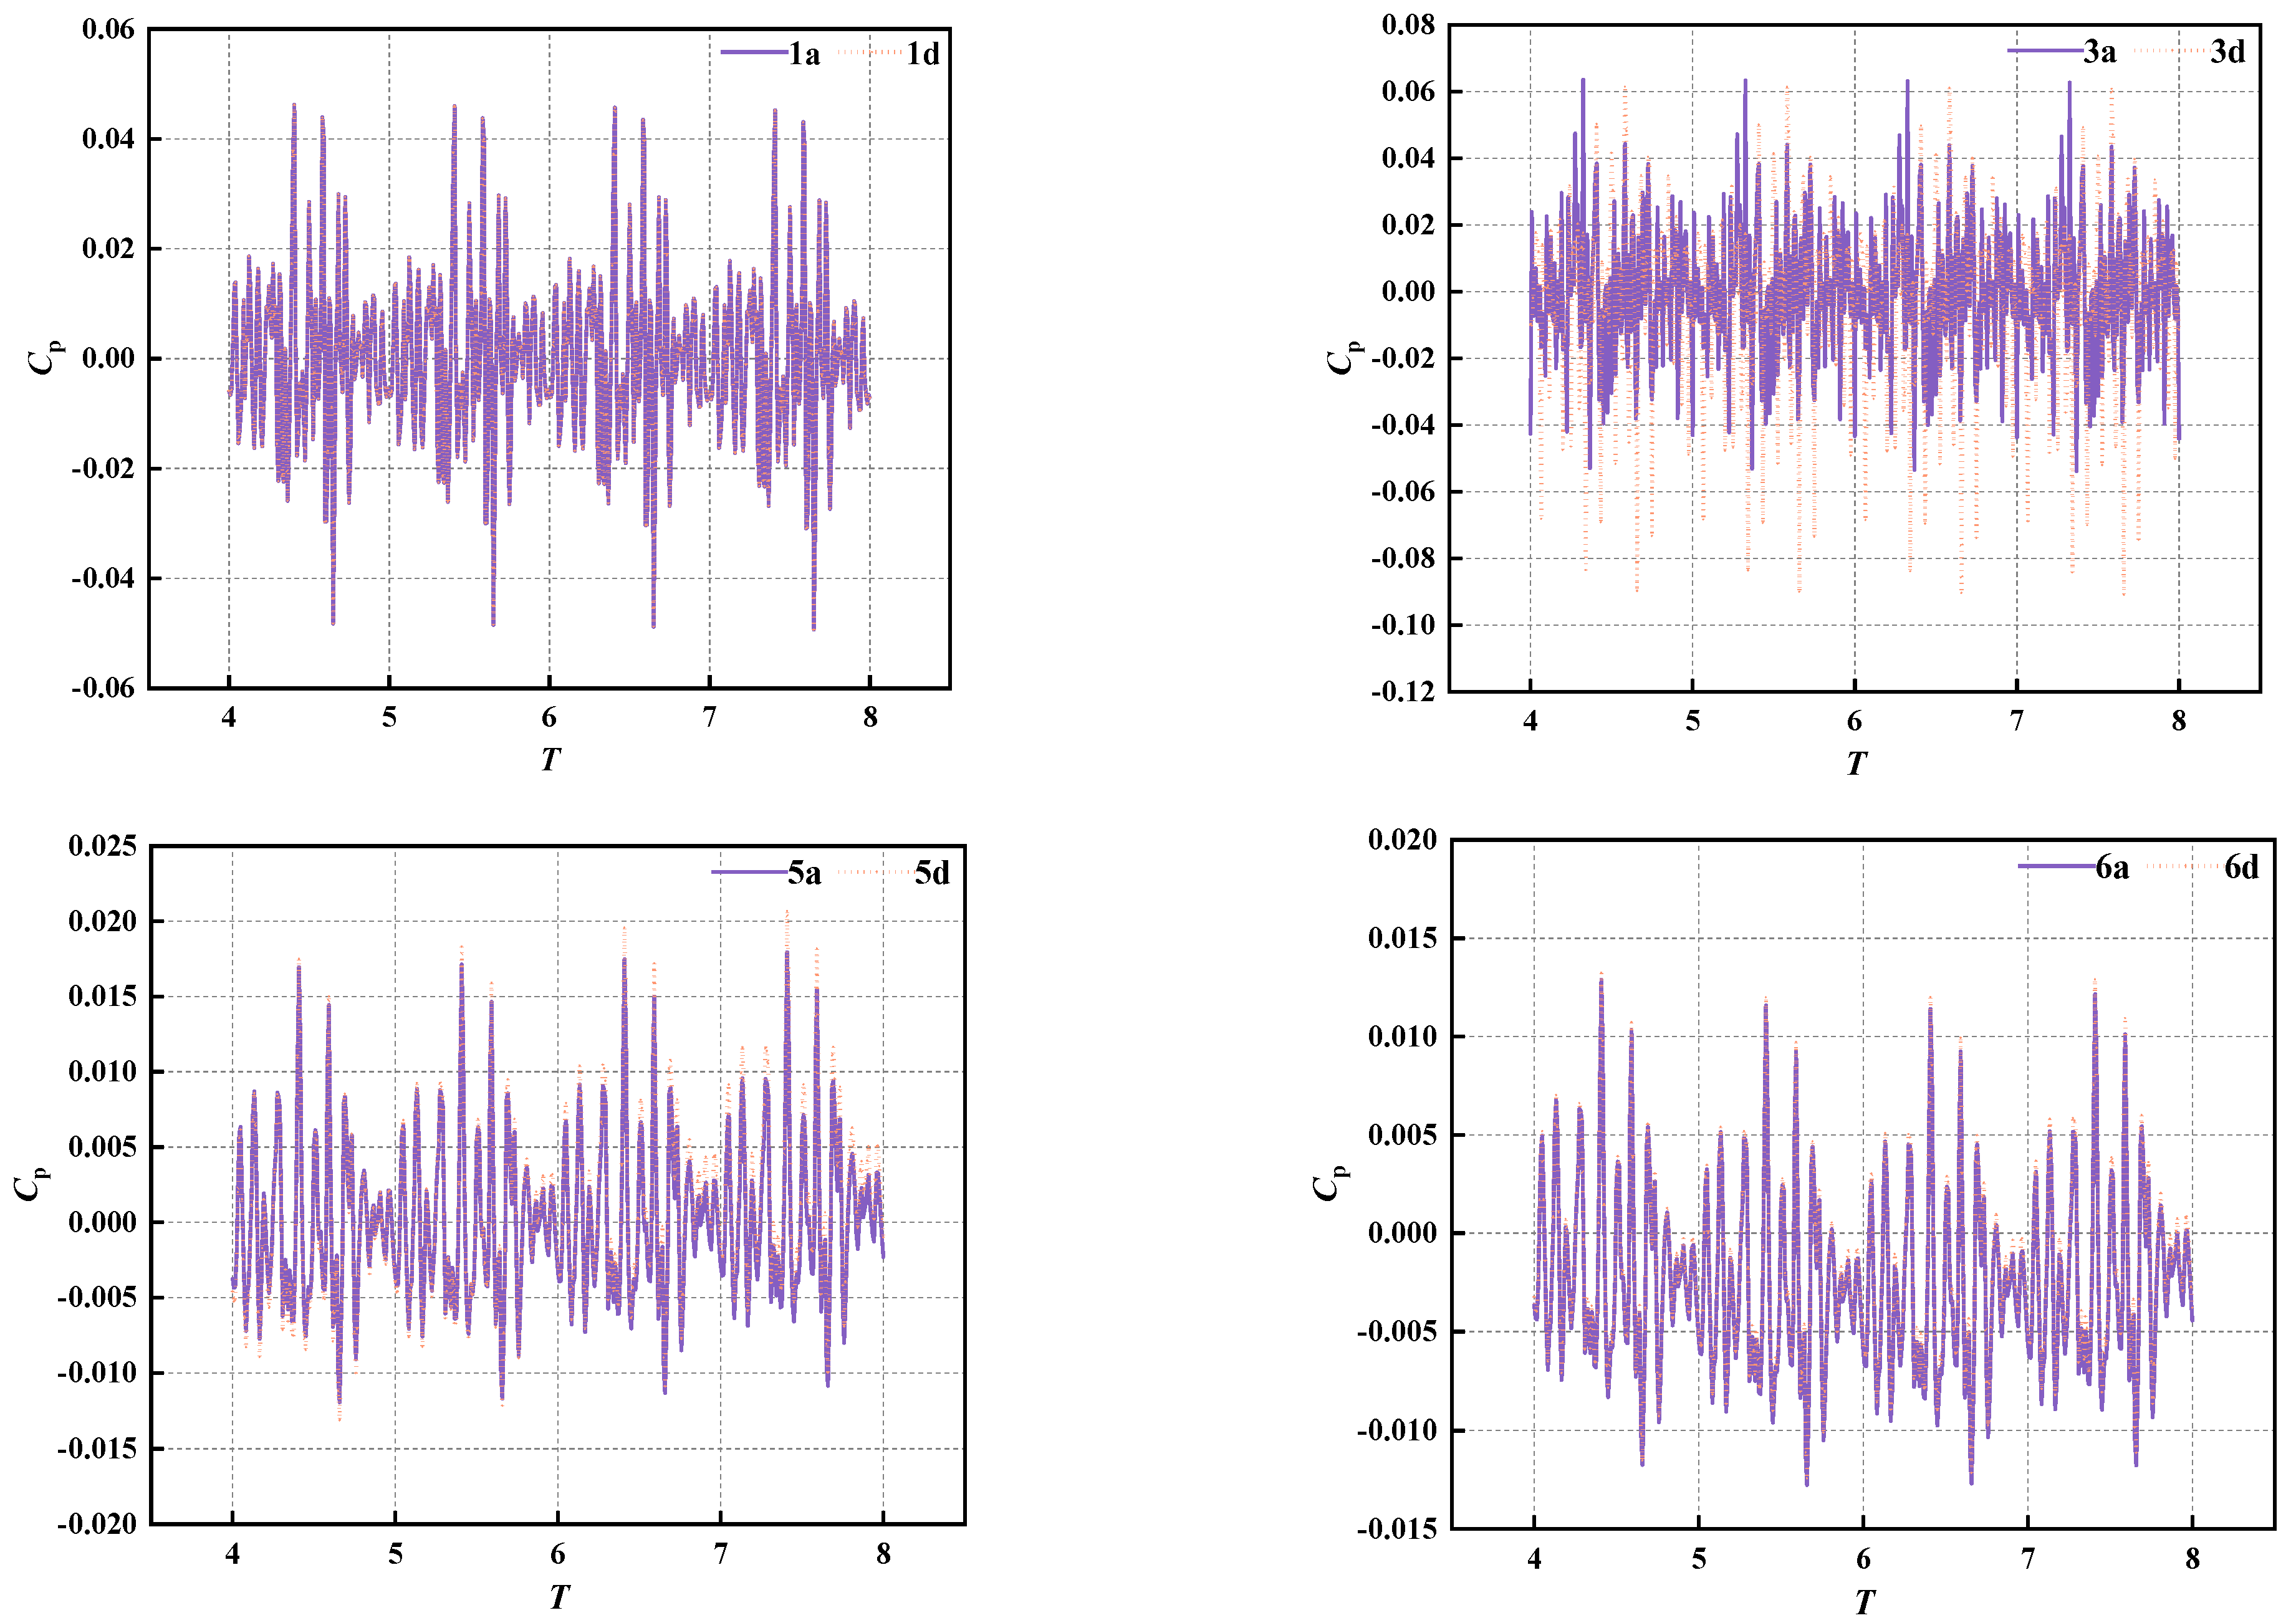
was introduced to represent the pressure pulsation. Taking the water pressure pulsation at the side wall of the inlet and outlet channel and the monitoring points at the impeller guide vane as an example,
Figure 10 and
Figure 11 respectively present the time domain diagrams of the water pressure pulsation at the characteristic monitoring points under two working conditions.
By comparing the amplitude of water pressure fluctuation under the two working conditions, it can be seen that the amplitude of the drainage working condition at the inlet of impeller is 0.06 and that of diversion working condition is 0.07, with a difference of 0.01. At the outlet of guide vane, the amplitude of the drainage condition is 0.018 and that of the diversion condition is 0.02, with a difference of only 0.002. The average period calculated under the drainage condition is 12, the average period calculated under the diversion condition is 10, and the difference between the average periods is 2.
The main difference between the drainage working condition and diversion working condition is the difference of inlet and outlet water levels. Therefore, it can be considered that the inlet and outlet water levels have little influence on the distribution of water pressure pulsation in the channel. Therefore, the dynamic response of station structure under the action of water pressure pulsation under the drainage working condition and diversion working condition can meet the demand.
3.2. Pressure Pulsation Zone Loading
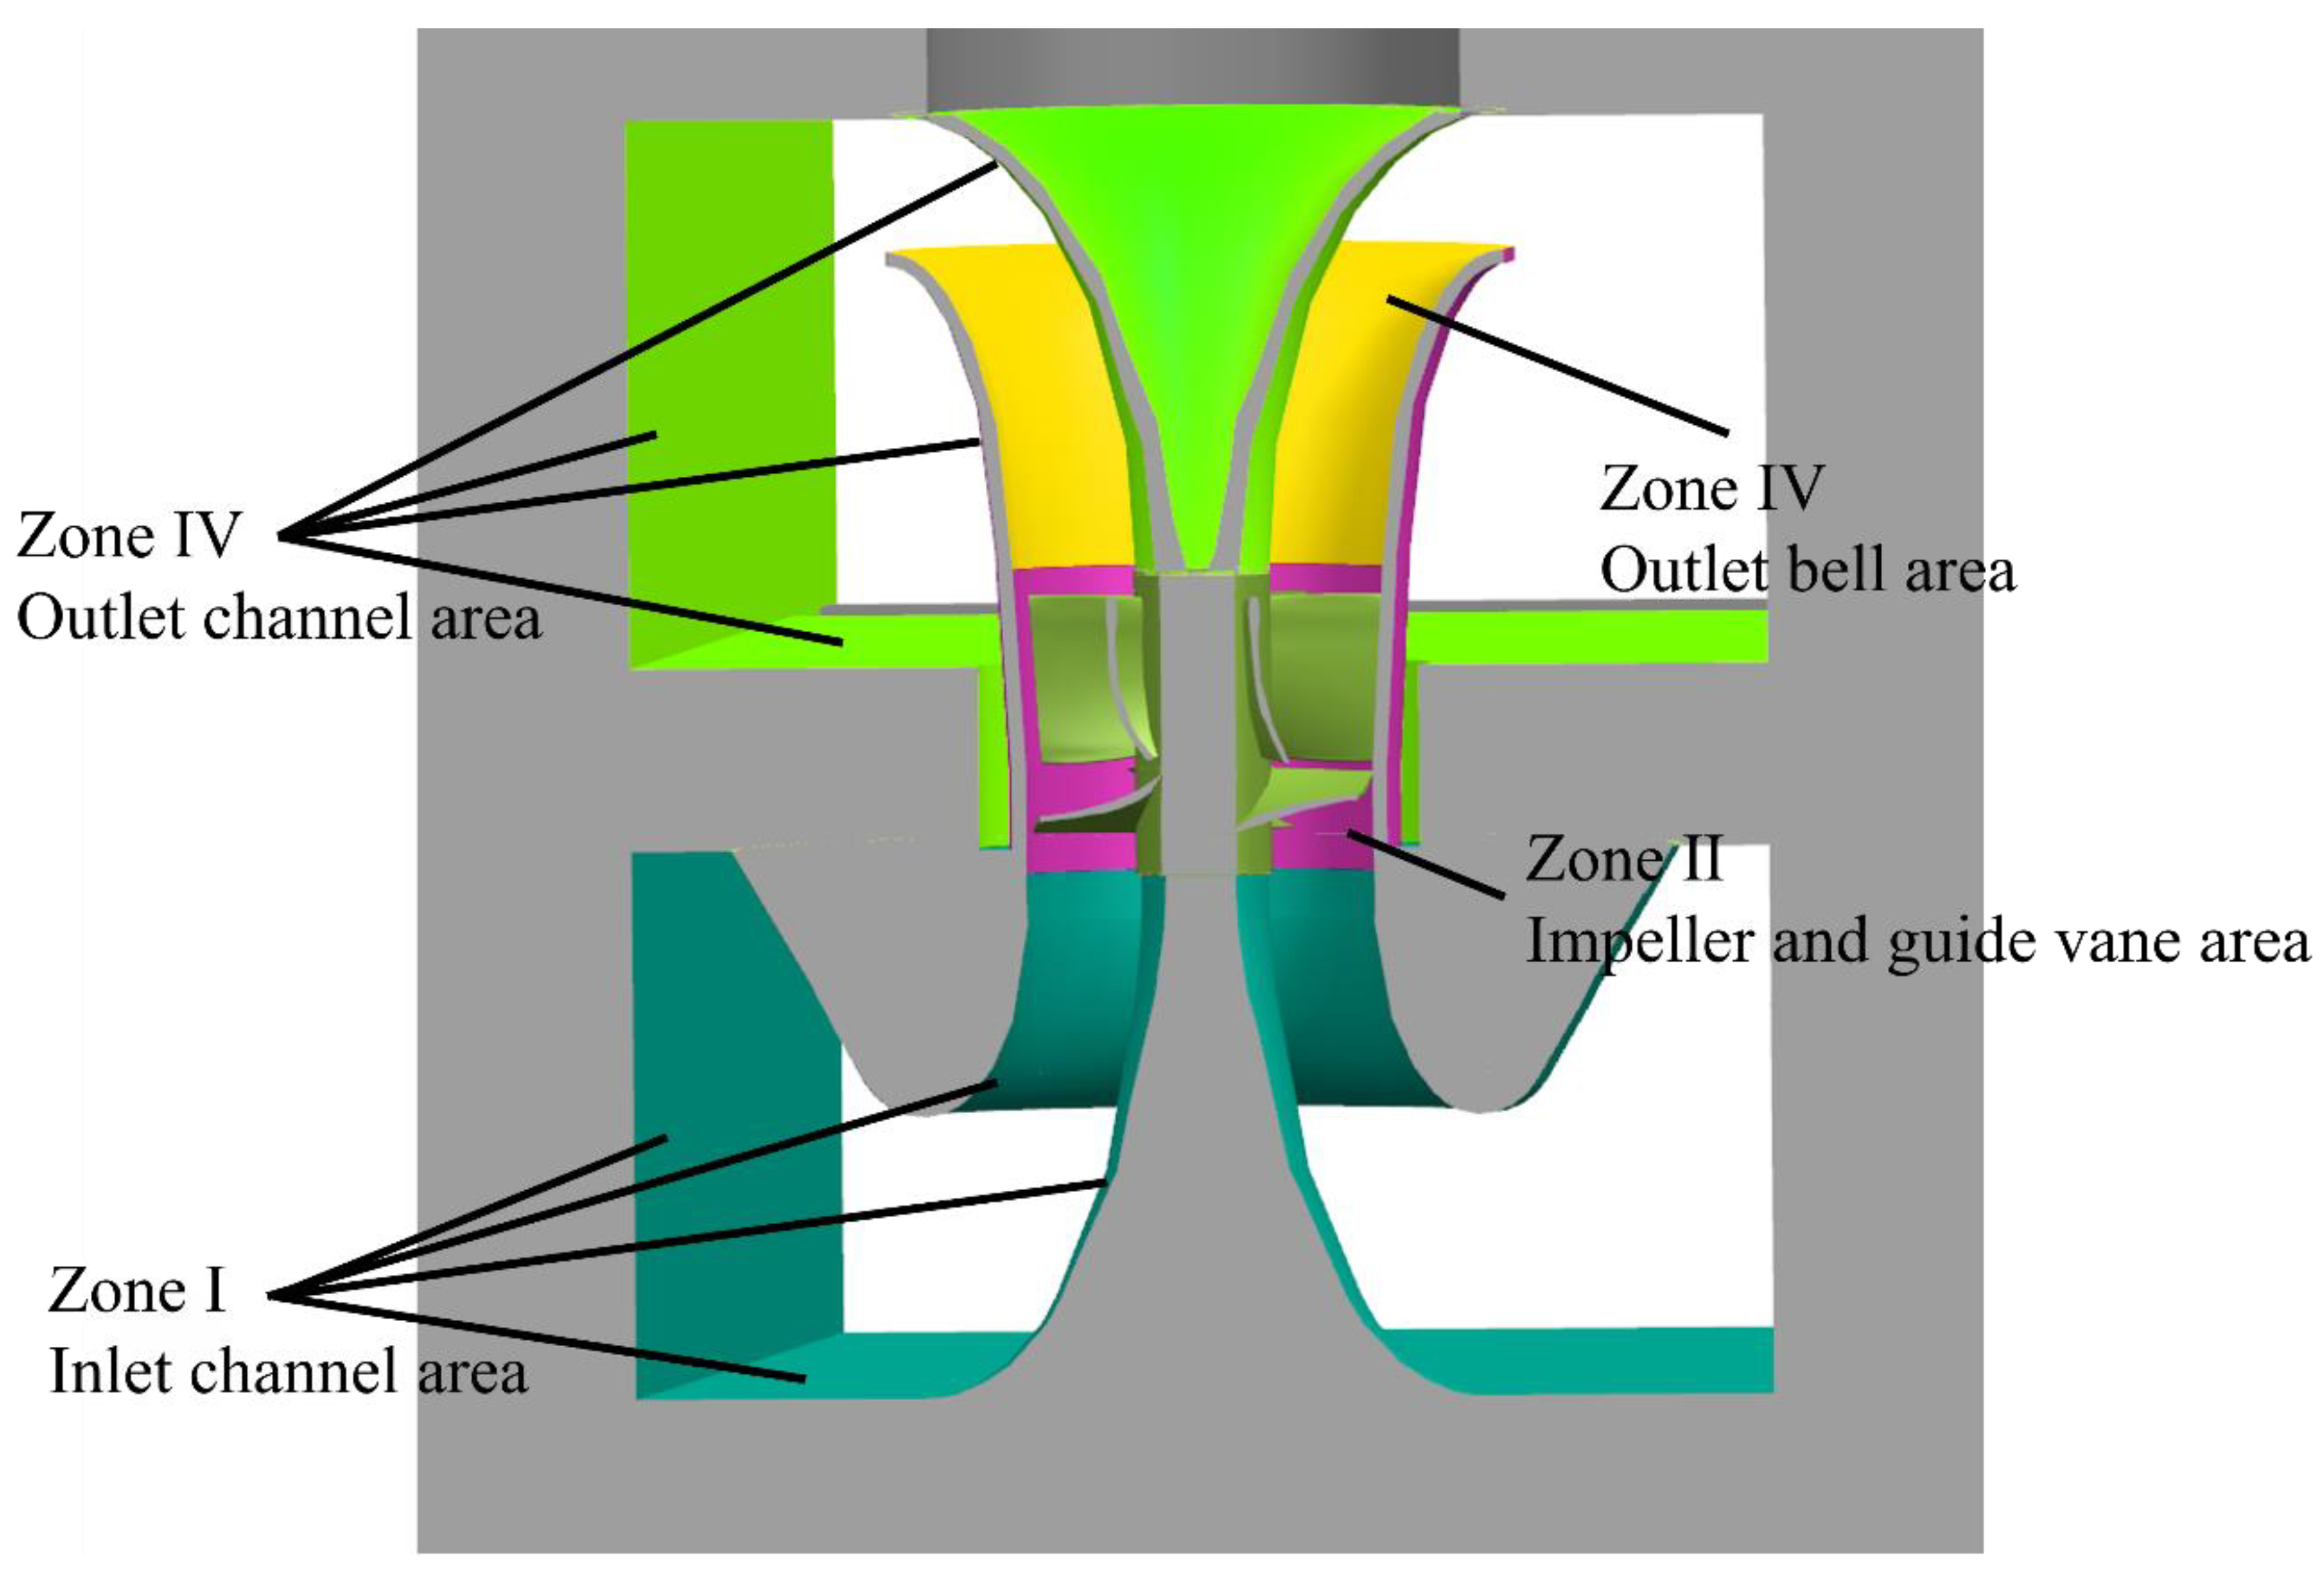
Because the harmonic response calculation can convert the input water pressure pulsation load into a simple harmonic load for calculation, the harmonic response analysis method is used to solve the dynamic characteristics of the structure under the action of water pressure pulsation. Due to the non-uniformity of water pressure fluctuation, according to the pressure distribution of water pressure fluctuation monitoring points, the water pressure fluctuation in the inlet and outlet channel is divided into four areas for zoning loading, as shown in
Figure 12.
The harmonic response analysis method is used to calculate different startup conditions under the design water level. The amplitude of water pressure fluctuation in different parts is different, the phase is the same, and all points reach the amplitude at the same time. See
Table 4 for the amplitude of the water pressure fluctuation loaded in different areas. During the actual operation of the unit, the unit vibration load and water pressure pulsation load act on the structure at the same time. Therefore, the calculation includes water pressure pulsation and unit vibration load.
3.3. Displacement Response of Characteristic Parts of Station Building
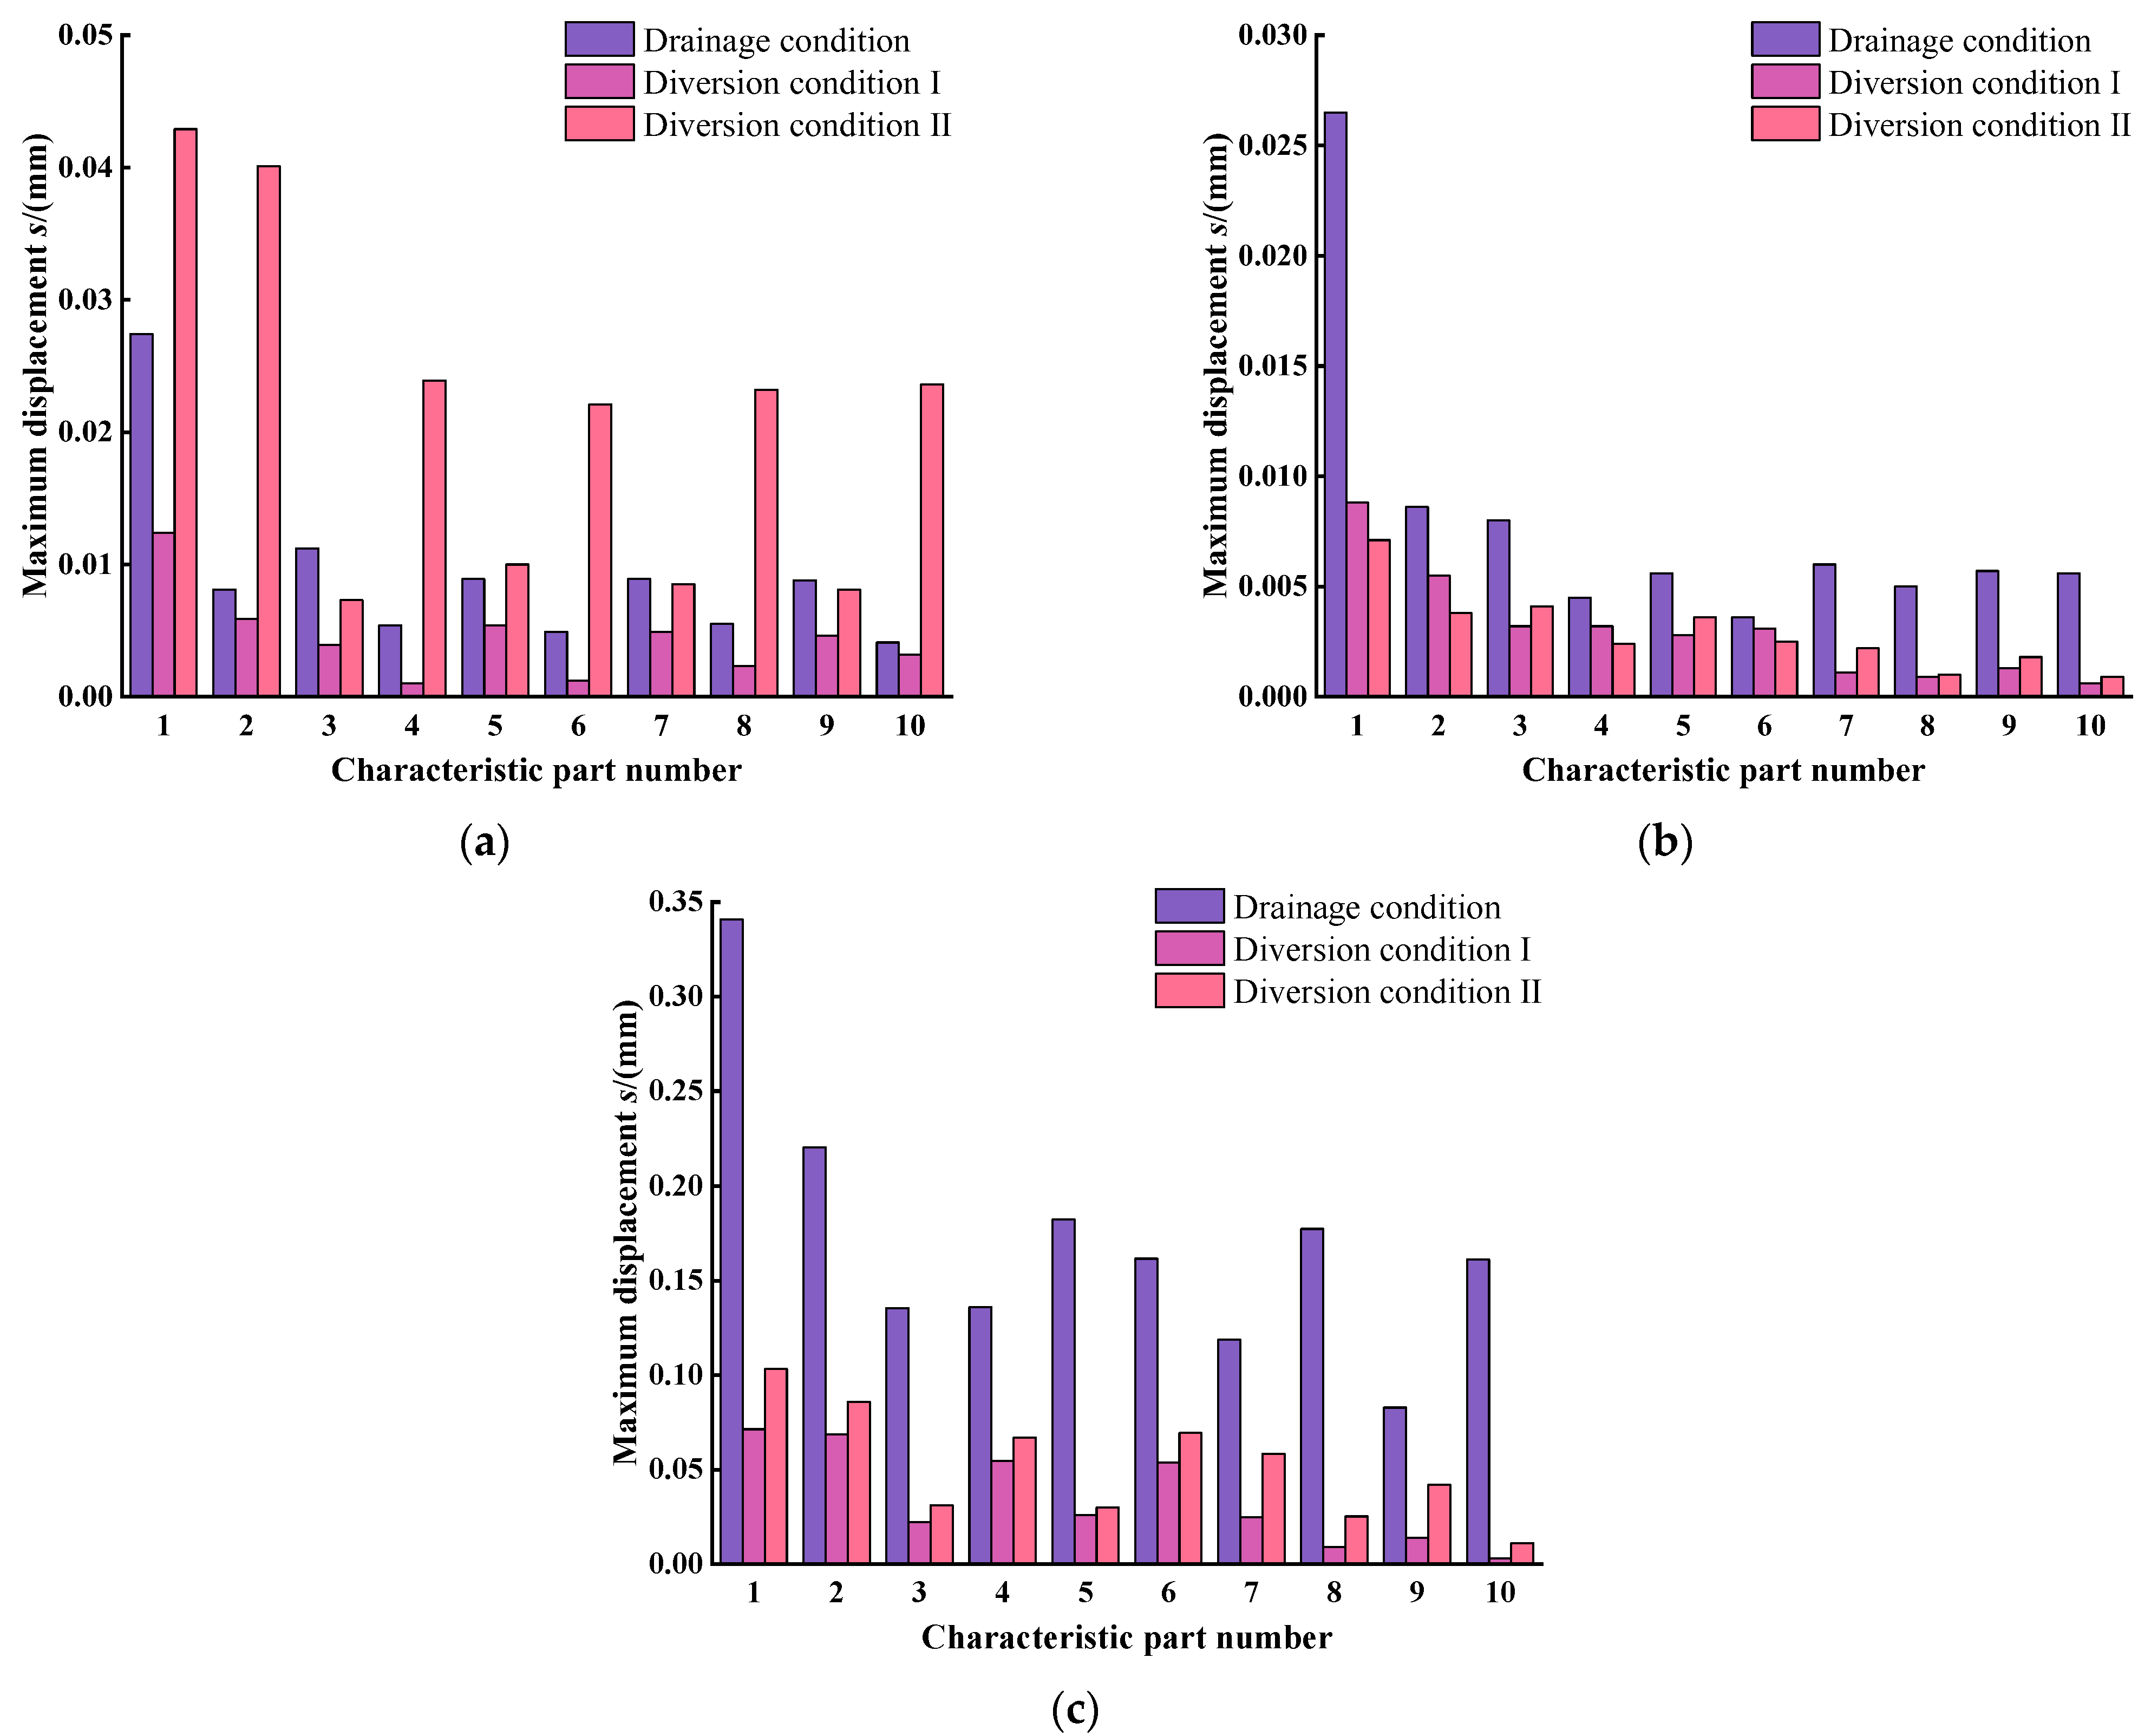
According to the characteristics of two-way inlet and outlet channels, the following 10 characteristic parts were selected for analysis, which are the floor slab of the ground powerhouse, the floor slab of the coupling floor and the bottom plate of outlet channel from unit 1 to unit 4, and are labeled from 1–10. The response of the maximum dynamic displacement and maximum dynamic stress of these characteristic parts of the station building were analyzed. In order to intuitively compare the amplitudes in different directions of different parts, we made the amplitude histogram of different parts under different working conditions under the action of the rated switching frequency, as shown in
Figure 13.
It can be seen from the above figure that comparing the amplitudes in three directions of each part, the station building basically shows the characteristics that the vertical amplitude is greater than the horizontal and vertical axial amplitudes. It shows that the whole station building, and the inside of the channel will not produce large vibration due to the influence of water pressure fluctuation.
Comparing the different operation modes of the station building, it can be seen that the maximum dynamic displacement in each direction under each working condition appears on the floor slab of the ground plant. The amplitudes of each characteristic part of diversion conditions I and II in the longitudinal and vertical directions are relatively close and are less than those in the corresponding direction of drainage conditions, showing different laws in the transverse axis. The amplitude of diversion condition II at each characteristic part is more different, in particular, the amplitude of the bottom plate of the outlet channel is relatively large, which may be because the startup of the intermediate unit has a great impact on the whole station building.
Comparing the amplitudes of different parts, it can be seen that in the vertical axis and horizontal axis, the amplitudes of the bottom plate of the inlet channel and the bottom plate of the outlet channel are larger and smaller in each working condition, which is different from the regularity in the horizontal direction, and the vertical amplitudes of different parts of each working condition do not show a certain regularity. However, on the whole, the change trend of each characteristic part of waterlogging drainage condition and water diversion condition is opposite.
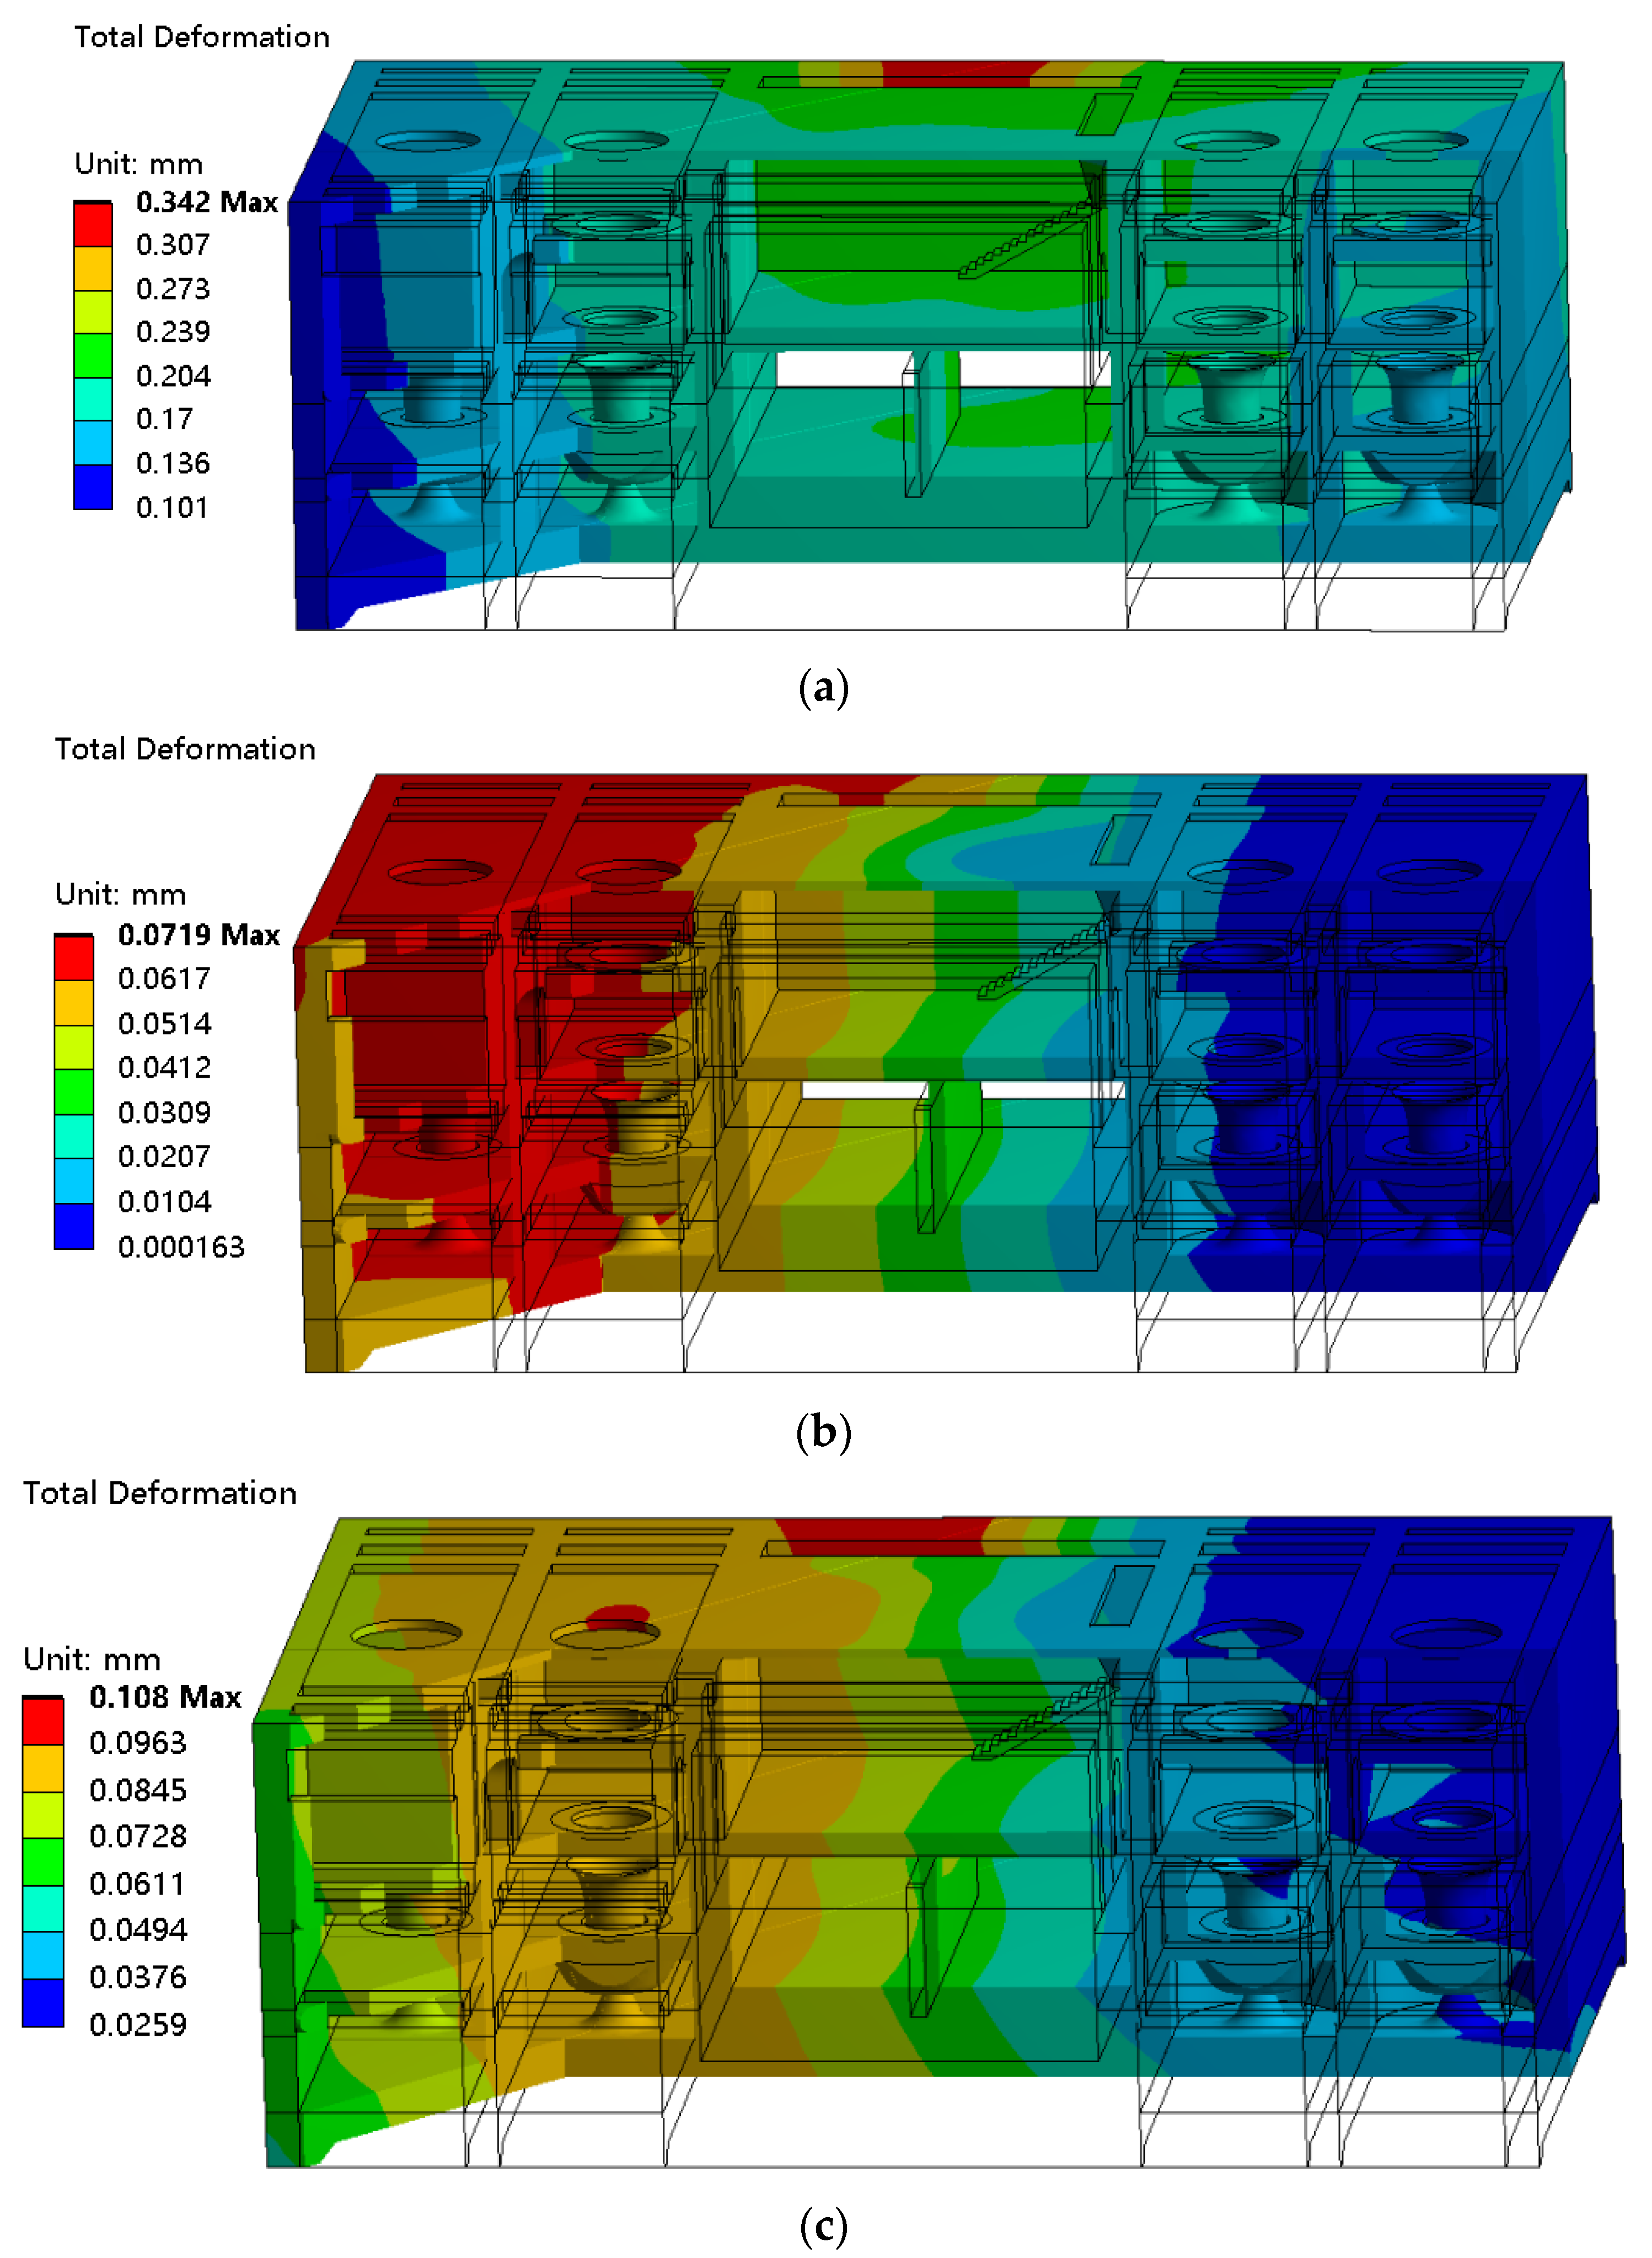
Figure 14 shows the cloud diagram of the total dynamic displacement of the station building structure under various working conditions. It can be seen from the cloud diagram that the overall displacement of the station building shows a symmetrical trend due to the simultaneous operation of four units under waterlogging drainage conditions. The amplitude of the units on both sides is small, and the amplitude of the units in the middle is large. Among them, the maximum dynamic displacement appears on the beam on the outlet side of the sluice, but the minimum dynamic displacement is still greater than the water diversion working condition. By comparing the two water diversion conditions, it can be seen that the overall dynamic displacement of water diversion condition II of operating unit 2 is greater. Therefore, during the water diversion operation of the station building, the best starting condition is that unit 1 is started and unit 2 is shut down for standby.
3.4. Stress Response of Characteristic Parts of Station Building
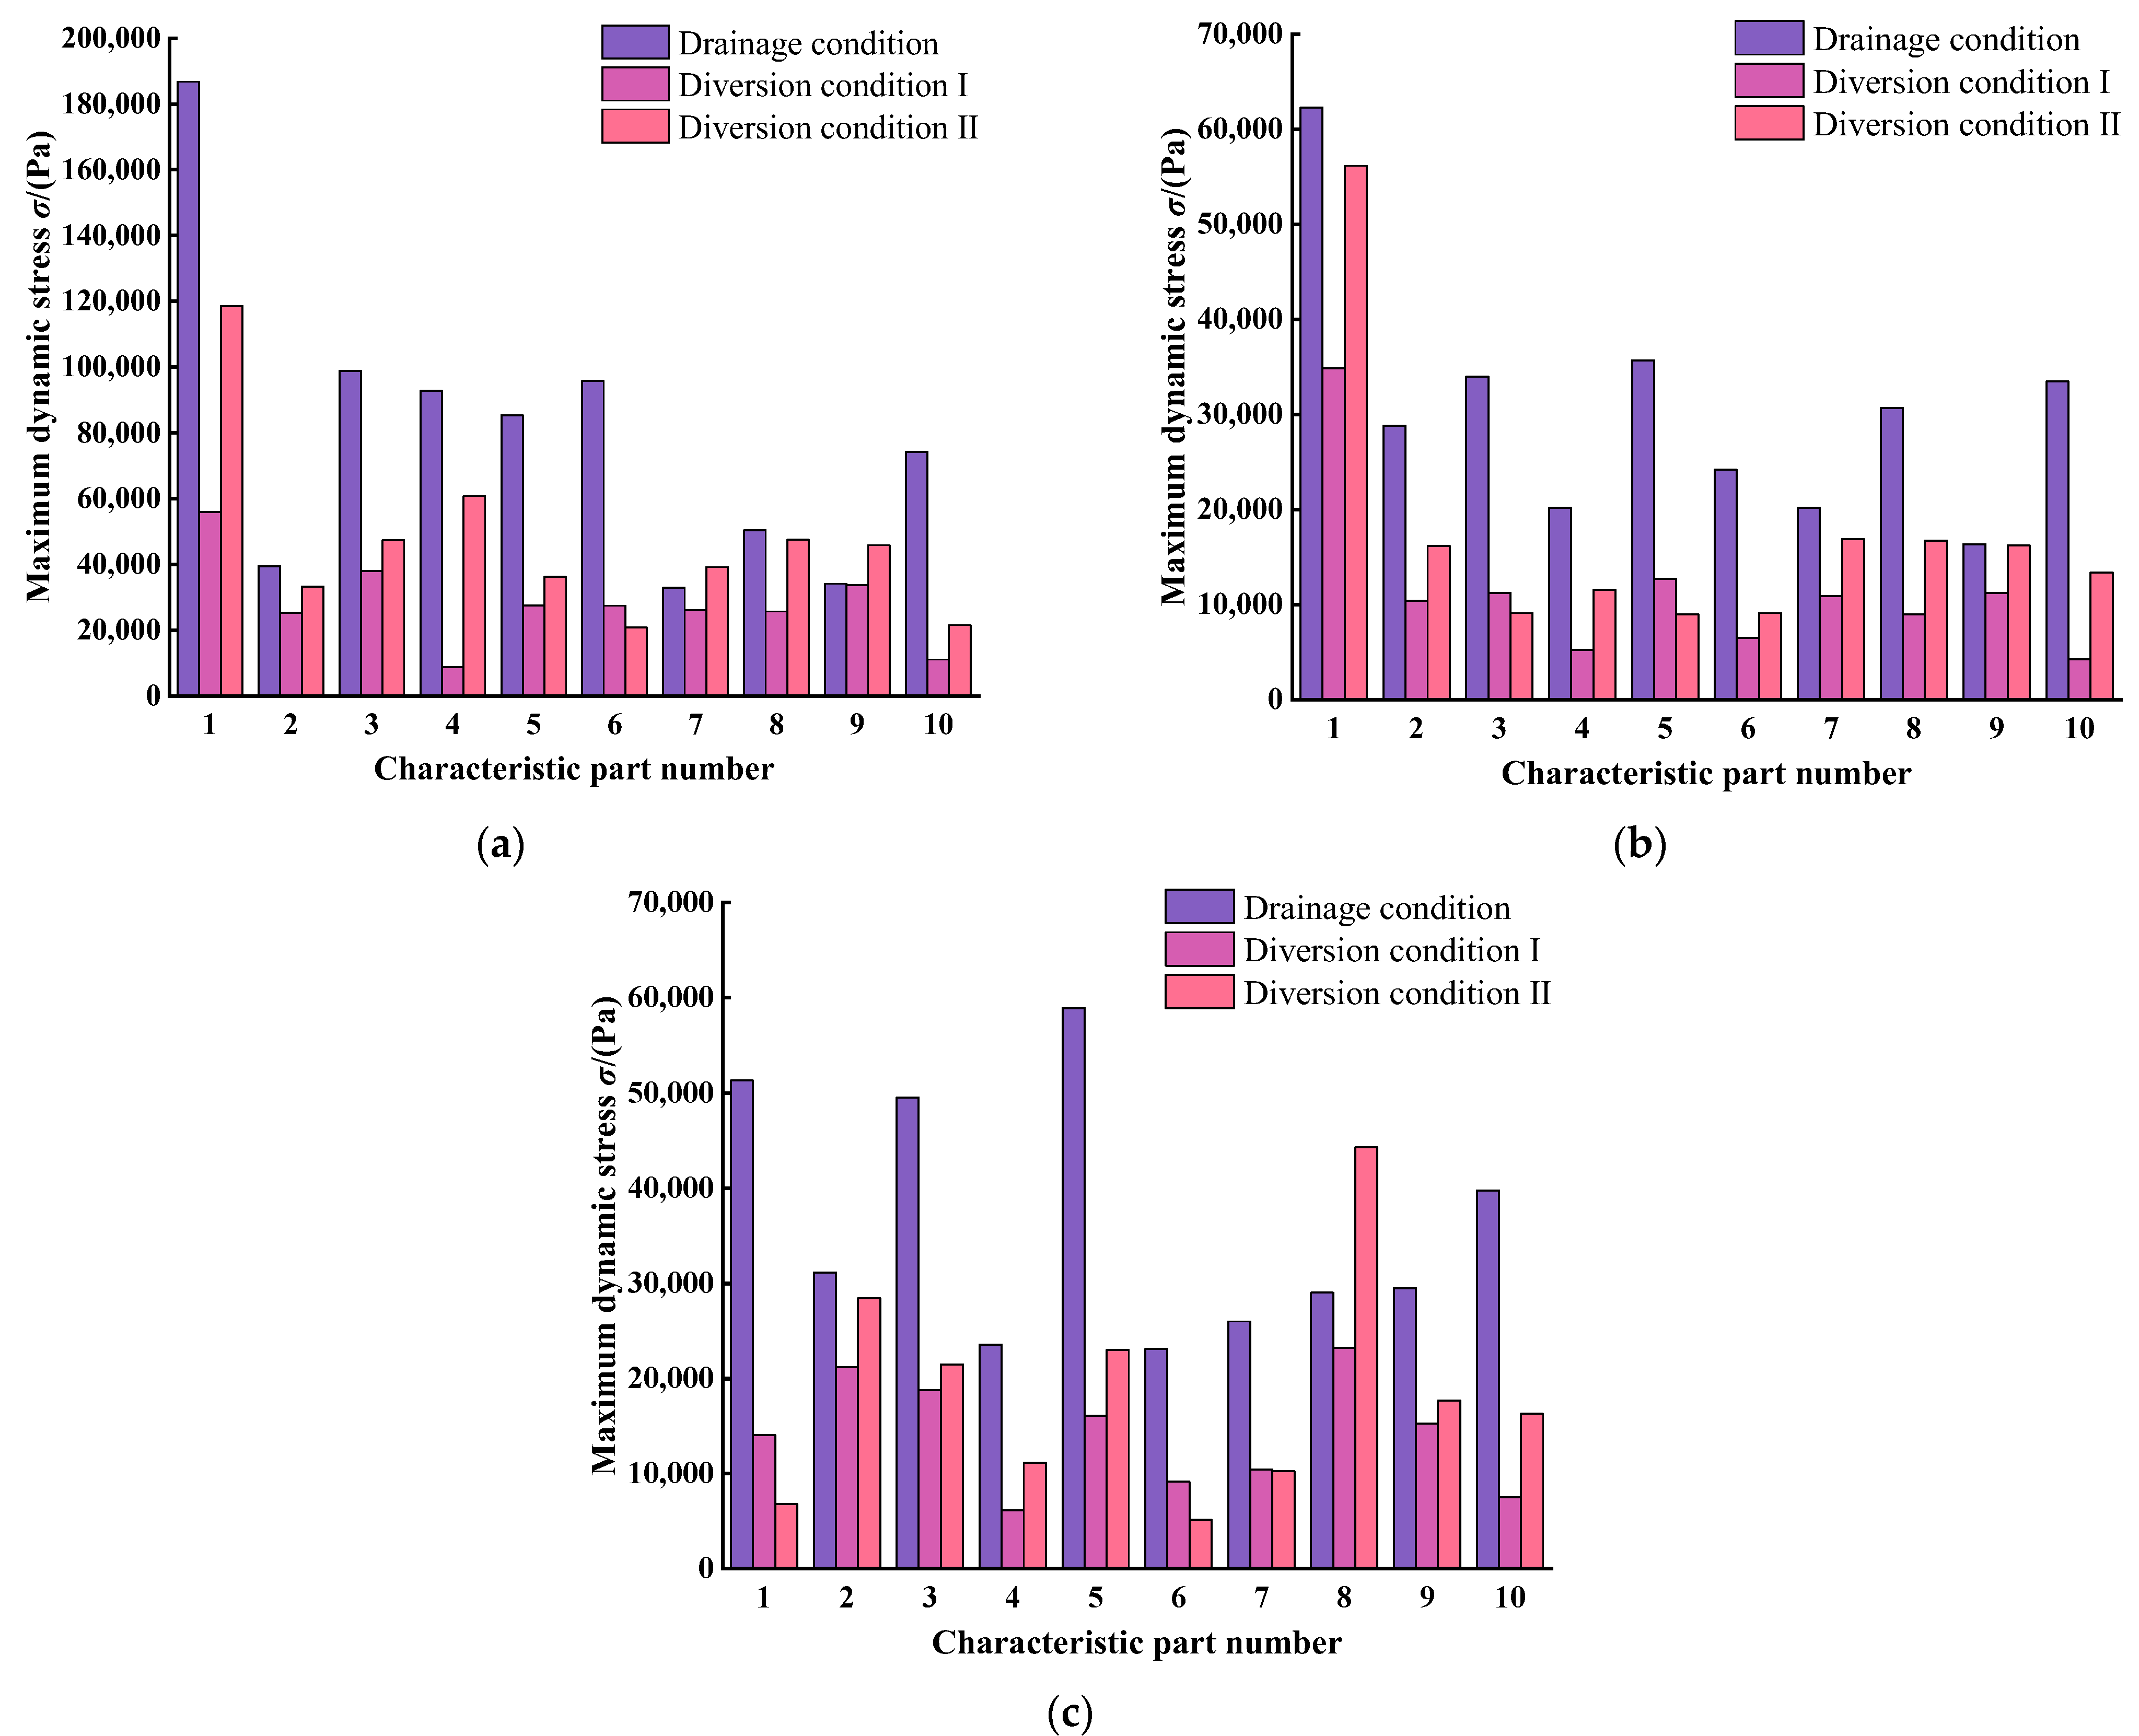
In order to more intuitively see the stress trend of the different parts in all directions, the histogram of maximum dynamic stress at different parts under different working conditions under rated frequency was made, as shown in
Figure 15.
It can be seen from the above figure that the maximum dynamic stress under various working conditions in the transverse axis direction appears on the floor slab of the ground plant, which is consistent with the trend of maximum dynamic displacement. The maximum dynamic stress of each characteristic part of the station building under the three working conditions is low, and the maximum dynamic stress does not exceed 0.187 mpa, which is at a low level, which is consistent with the law of amplitude. By comparing the maximum dynamic stress in each direction, it can be seen that the maximum dynamic stress in the transverse axis direction of different parts is greater than that in the longitudinal axis direction and vertical direction.
Comparing the maximum dynamic stress in each direction under different working conditions, the maximum dynamic stress in most characteristic parts under waterlogging drainage working conditions is at a large value. After removing the special value, the dynamic stress relationship trend of each part is relatively consistent under the two water diversion working conditions.
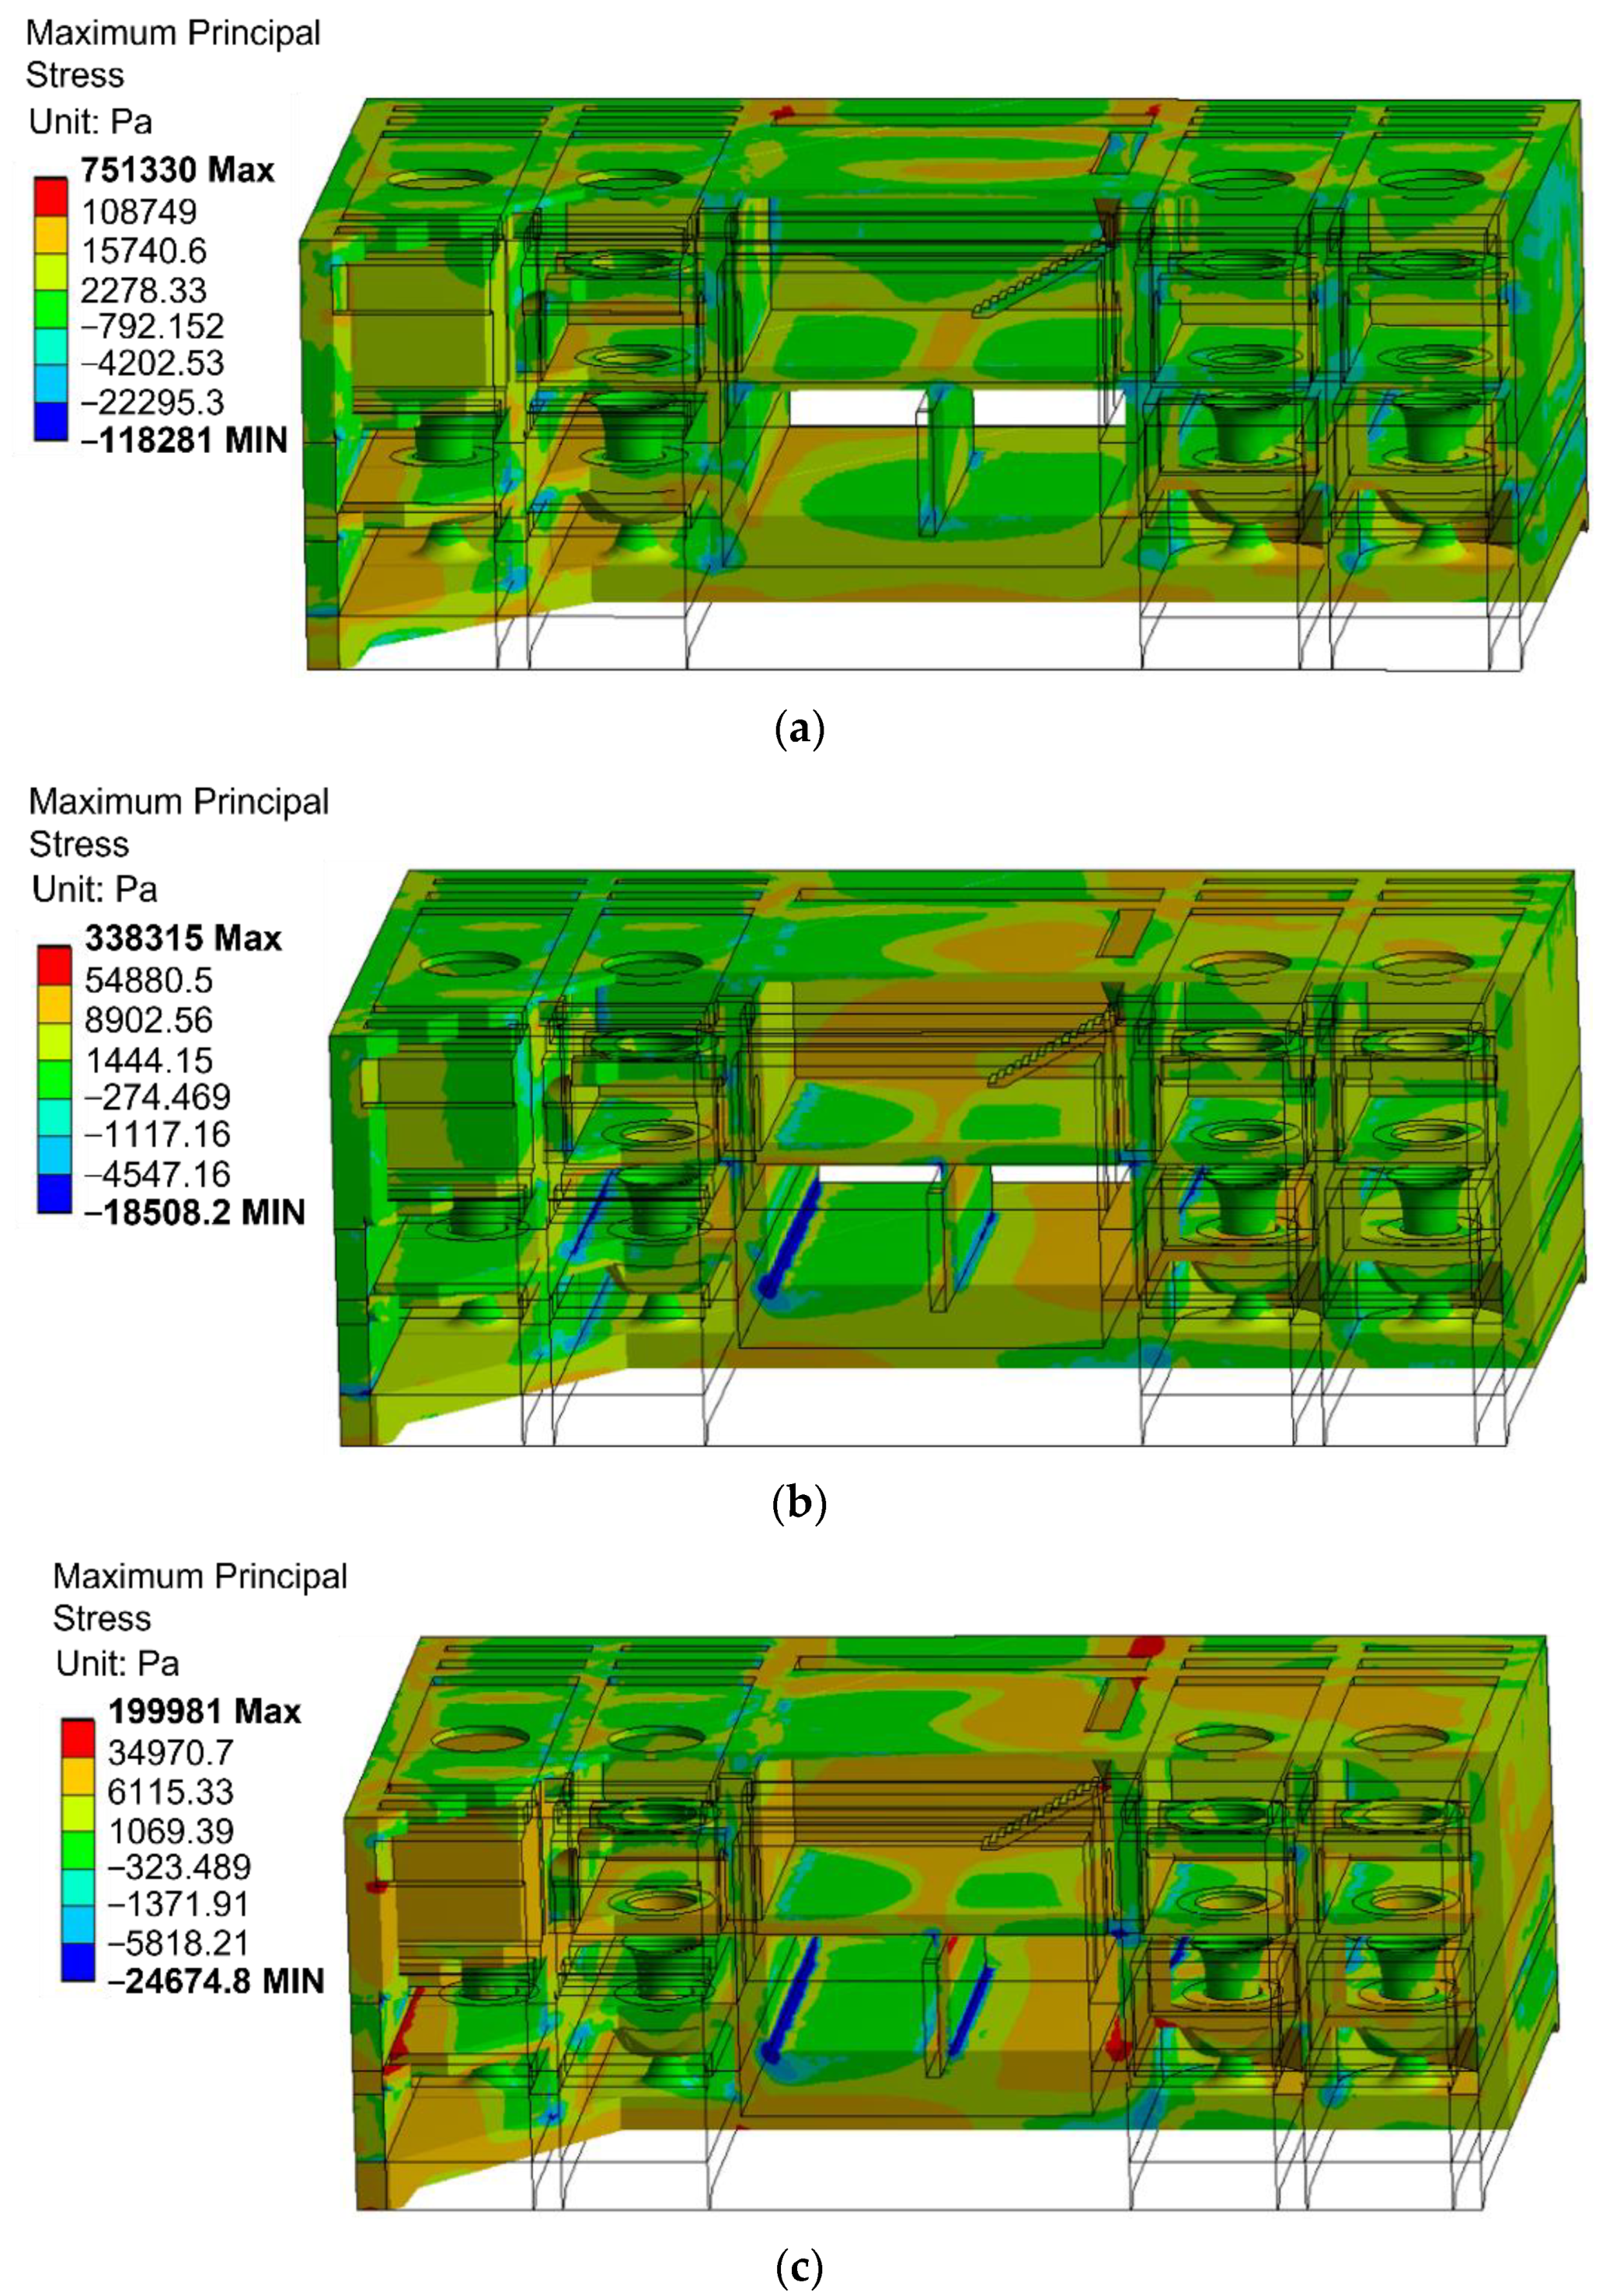
The total dynamic stress nephogram of the station building structure under each working condition is shown in
Figure 16. It can be seen from the nephogram that the maximum total dynamic stress under the drainage working condition is greater than that under the other two working conditions, the stress distribution trend and amplitude trend under the drainage working condition are basically the same, and the dynamic stress of the bottom plate of the inlet and outlet channel is affected by the water pressure pulsation acting on it, which is greater than that of the upper floor slab. Under the two diversion conditions, the dynamic stress of the bottom plate of the inlet channel is greater than that of the bottom plate of the outlet channel. By comparing
Figure 16b,c, it can be seen that the startup of unit 2 has a greater impact on the whole gate station.


