Article

Economic Policy Uncertainty and Energy Prices: Empirical Evidence from Multivariate DCC-GARCH Models

by
Salim Hamza Ringim
1,
Abdulkareem Alhassan
2,
Hasan Güngör
1 and
Festus Victor Bekun
3,4,5,6,*
1
Department of Economics, Eastern Mediterranean University, Via Mersin 10, Famagusta 99628, Turkey
2
Department of Economics, Federal University of Lafia, Lafia 950101, Nigeria
3
Faculty of Economics Administrative and Social Sciences, Istanbul Gelisim University, Istanbul 34310, Turkey
4
Department of Economic Security, South Ural State University, 76, Lenin Aven., 454080 Chelyabinsk, Russia
5
Faculty of Economics and Commerce, The Superior University, Lahore 54000, Pakistan
6
Adnan Kassar School of Business, Lebanese American University, Beirut 1102-2801, Lebanon
*
Author to whom correspondence should be addressed.
Energies 2022, 15(10), 3712; https://doi.org/10.3390/en15103712
Submission received: 10 April 2022 / Revised: 3 May 2022 / Accepted: 4 May 2022 / Published: 18 May 2022
(This article belongs to the Special Issue The Nexus among Sustainable Development Goals and Clean Energies)

Abstract

:
Crude oil and natural gas are crucial to the Russian economy. Therefore, this study examined the interconnections between crude oil price, natural gas price, and Russian economic policy uncertainty (EPU) over the period 1994–2019 using multivariate DCC-MGARCH models. The findings show that there are strong interconnections (co-movement) between the energy prices and EPU in Russia, and that it might be misleading to assume independence or neutrality between the variables. Although Russia is also a crucial player in both the natural gas and the crude oil markets, this study reveals that there is a stronger co-movement of the EPU with gas price than with the oil price. Russia is the largest exporter of natural gas and the second-largest producer; it is plausible that the natural gas price correlates with EPU more than the crude oil price. Further, the correlation between gas price and EPU and the correlation between crude oil price and EPU have similar patterns. Each declines almost in the same period and, equally, increases concurrently. In addition, the results revealed that significant global shocks and crises, such as the 2008 global financial crisis, the 2014–2017 Russian financial crisis, the 9/11 terrorist attack, and the Russo–Ukrainian conflicts, influence the interconnections between the energy prices and Russian EPU.

1. Introduction

Within the past few years, various challenges have arisen that have led to international economic and political uncertainty. These started with the “Arab Spring”, emanating political unrest in the Middle East and globally, and concluded with the election of Donald Trump as the President of the United States, reflecting extensive adjustment of the global status quo. As the world’s population proceeds to expand expeditiously, this adjustment produces economic and political instability, increasing global uncertainty. Representative events are those such as refugees moving from the Middle East to Europe (refugee crises), Russia’s takeover of Crimea. Furthermore, the recent vote for the United Kingdom’s departure from the European Union, or “Brexit,” has raised the level of uncertainty about the future economic policies and the Euro.
Reference [1] formulated an economic policy uncertainty index, using a count of the frequency articles in The Kommersant, a nationwide disseminated daily newspaper focused mainly on politics and economics. This prevalence was computed by the total amount of the articles counted in the same newspaper and same month. Our variables comprised the Russian language equivalent of tax, the central bank, law, expenditures, and policy, and political–institutional terms, such as budget, Duma, and others. To capture the important historical events in Russia, such as Russia’s financial crises, the credit crunch, Ukraine, and Chechnya, Baker at el. constructed some indicators using the daily prevalence computation of newspaper articles within the same month.
The Russian index reacts to political development in Ukraine, Russian military conflicts, the 1998 Russian financial crisis, the “taper tantrum” of 2013 brought about by an anticipated change in US monetary and policy, the collapse of the Lehman Brothers, and other developments. Although the index of Russia is boisterous, manifesting our credence on a single paper, it is proposed that our approach results in vital information even for nations with a high level of regulation of the freedom of the press [1].
Global natural gas consumption has undergone a rapid increase over the last 21 years, the global natural gas consumption in 2018 reached about 3.8 trillion cubic meters [2]. The global natural gas consumption will increase from 120 trillion cubic feet to 203 trillion cubic feet from 2012 to 2040; natural gas is the largest source of primary energy and is a fuel source for industrial and electric sectors [2].
The natural gas market lacks a uniform global pricing, unlike the crude oil market. Nevertheless, the current liberalization of gas market and the advancement in liquidized natural gas (LPG) market has made the gas market approach a common market. There are different types of natural gas pricing globally due to the disintegration of the gas market. Therefore, different price mechanisms are adopted in different parts of the world [3,4]. Oil linkages and oil indexation are the two major oil pricing mechanisms applied for international trade of gas. According to [4], the oil index was replenished by hub prices in the Northeast Europe, United Kingdom, and United States for three decades (1980s, 1990s, and 2010s, respectively).
Russia is the second largest natural gas-producing country in the world. In 2017, Russia’s natural gas production was 755.8 billion cubic meters. The natural gas sector is one of the major sectors of the Russian economy; the Russian government budget and policies rely heavily on the exportation of natural gas and Russia is the largest natural gas exporter in the world [5]. According to the indexMundi, Russian natural gas consumption increased from 420.65 billion cubic meters in 2017 to 431.10 billion cubic meters in 2018, and Russia is the fourth largest natural gas-consuming country in the world. The Russian natural gas proven reserve is about 47.57 cubic meters; Russia owns almost one-fourth of the world’s proven natural gas reserves [6].
Recent developments in the global energy sector have significantly increased the production and consumption of natural gas, this is a result of advancement in modern technology in the sector. These changes reduced natural gas prices worldwide. Natural gas is among the commodities that heavily contributes to the economic growth of Russia, whereas the economic policies made by the government are what shape the economy of the country. This is what motivated us to investigate the relationship between economic policy uncertainty and energy prices.
By concentrating on both volatility and price fluctuation in the natural gas market, we further accentuate the relationship between economic policy uncertainty and the price of natural gas. Although natural gas consumption and the economic growth nexus have received a lot of attention by researchers, to the best of our knowledge, no research has specifically examined the relationship between economic policy uncertainty and natural gas price. We selected Russia as our case study based on the global importance of the country in natural gas production (755.8 billion cubic meters), consumption (431.10 billion cubic meters), and proven reserves (47.57 cubic meters).
With regard to the present literature, the present study seeks to explore the following pertinent research questions: (1) How does the volatility of economic policy uncertainty affect the volatility of natural gas prices in Russia? (2) What is the relationship between economic policy uncertainty and natural gas price in Russia? We, therefore, make use of the EPU index formulated by [1] from January 1990 to December 2018, and employed monthly data for the natural gas price. To this end, the current study extends the body of knowledge in terms of scope for the case of the study area. Additionally, we further make use of the both the univariate and multivariate GARCH models for our analysis i.e., a methodical contribution to the theme under review. The univariate GARCH models are used to examine the volatility characteristics of the variables while the multivariate models are employed to evaluate the dynamic linkages and correlations among the outlined variables; we additionally employ the multivariate generalized autoregressive conditional heteroscedasticity (MGARCH) to examine the volatility spillovers among our variables of interest for robustness for estimates and onward policy construction.
Therefore, this study contributes to the extant literature on the EPU–energy prices nexus in several ways. First, the study evaluates the interdependence between EPU and energy prices in Russia. The literature concerning EPU and the energy market largely focus on the U.S.; hence, this study provides a major contribution by considering the interplay of the prices of the major energy sources—crude oil and natural gas, and the economic policy uncertainty of the major supplier of both commodities and a major player in the world energy market (Russia). Second, this study extends the literature to capture natural gas prices. Previous studies focused on oil and financial markets. Third, the study compared the degree of interconnectedness between crude oil price and Russian EPU, and that of the natural gas price and the EPU. Since Russia is a major supplier of both crude oil and natural gas in the world, it is imperative to measure the relative importance of these two energy prices to the stability of the Russian economy. Fourth, the study also examines the influence of global shocks, such as financial crises and wars, on the interdependence of the energy prices and EPU. Fifth, the study captures the time-varying correlations among the energy prices and the Russian EPU. Sixth, the study applied corrected dynamic common correlated and dynamic common correlated variants of the multivariate generalized autoregressive conditional heteroscedasticity (MGARCH). This makes the findings robust. In addition, the study used monthly data instead of daily data to avoid the problems associated with noisy energy prices data, and the daily news-based EPU index.
The major findings of the current study are that significant global events and crises, such as the global financial crisis, the Russian financial crisis, the 9/11 terrorist attack, and the Russian invasion of Crimea, influence the interconnections between the energy prices and Russian economic policy uncertainty.
The rest of the paper is organized as follows: Section 2 discusses the data and methodology, Section 3 comprises the empirical results and discussion, and Section 4 presents the conclusion.

Literature Review

Economic policy uncertainty is the probability that subsequent policies will differ from present policies and the effect of these variations on microeconomics and macroeconomics activities [1]. Reference [7] reignited the impact of macroeconomics on uncertainty. Alexopoulos and [8,9,10,11] are the most recent studies that investigate the impact of macroeconomics on economic policy uncertainty in the USA. Such studies have focus on the USA; that is, they pay attention to the macroeconomic variables that are affected by economic policy uncertainty. In similar studies, a negative relationship was shown between economic policy uncertainty and stock market return in China [12,13,14,15]. Economic policy uncertainty harms consumers, investors, and corporations, as an increase in economic policy uncertainty distracts the consumption behavior of consumers and decreases the investment pattern of investors and corporations [16,17,18]. In other studies, is recorded that economic policy uncertainty is positively related to high stock volatility and negatively related to return on the stock market [13,19,20]. Economic policy uncertainty and oil price are extensively studied in the literature; ref [21] investigates the effect of economic policy uncertainty and oil price on stock return in a case study of oil and gas firms and reported a negative effect of economic policy uncertainty shock on stock return, and a positive shock of oil price on stock return. A similar study [12] reported a positive interaction between oil price and economic policy uncertainty amid the period of high financial activities. Ref. [22] reported no significant causal relationship between oil price and economic policy uncertainty. In the US economy, high economic policy uncertainty increased the shocks in the oil price [21]. In a similar study, it was discovered that economic policy uncertainty and financial uncertainty in the US did not always affect oil price, but that it was dependent on time [23]. Using the quantile-on-quantile model, ref [24] examined state-dependent spillover impacts of policy uncertainty on currency in the US and identified a significant relationship.
The relationship between energy consumption and economic growth was first examined by studies [25,26,27], among others. Conflicting outcomes have been recorded by these studies; these conflicts led to the formation of four hypotheses: “growth hypothesis” (energy consumption led to economic growth), “neutrality hypothesis” (no relationship) “conservation hypothesos” (economic growth led to energy consumption), and “feedback hypothesis” (energy consumption led to economic growth and economic growth also led to energy consumption).
Reference [28] discovered a positive relationship between natural gas consumption and economic growth in Turkey. In a similar study, ref [29] reported a feedback causality between natural gas consumption and economic growth in Korea. The presence of a feedback relationship was recorded by (Solarin and Shahbaz, 2015) [30] in their study of natural gas consumption and economic growth: the role of foreign direct investment capital formation and trade openness in Malaysia. Another study [31] applied ARDL and Johansen cointegration models in their study of the natural gas consumption and economic growth nexus in Malaysia, and their findings revealed that the economy is not an important predictor of natural gas consumption.
Natural gas consumption is positively related to the economic growth of the GCC countries, in the long term; furthermore, a bidirectional causal relationship exists between natural gas consumption and economic growth [32]. In a similar study, a feedback relationship was found between natural gas consumption and economic growth in OPEC member countries [33]. Reference [34] examined the relationship between natural gas consumption and economic growth in Pakistan, and the results of the study revealed that natural gas consumption is an important predictor of economic growth. In a similar study, ref [35] recorded a positive causality running from natural gas consumption to economic growth in Malaysia.
Natural gas consumption does not improve economic growth in the short term, but natural gas consumption increases economic growth in the long term in 12 European countries included in the study [36]. Reference [37] discovered that natural gas consumption is an important predictor of GDP in Saudi Arabia; further, they reported a non-causal relationship between natural gas consumption and total trade, and the same relation for GDP and total trade. The relationship between natural gas consumption and economic growth in Turkey is examined based on time-variation from 1983 through 2017. The outcome reveals no causal relationship between natural gas consumption and economic growth for the whole period of the study, however, when the study further applied causality estimations for sub-periods, a one-sided causality was discovered running from natural gas consumption to economic growth from 2001 to 2015, 1997–2011, and 1996–2010, and a unidirectional causality running from economic growth to natural gas from 2000 to 2014 [38].
In [39], it was predicted that the volume of natural gas that will be consumed by the residents, commerce, and industries in the United States of America would slightly decrease between 2019 and 2025. They further predicted a slow growth of natural gas consumption (average of 1.2%), and a significant improvement in the natural gas consumption in the power generation sector to about 39% in the year 2025.
Previous studies show that uncertainty plays a significant role in determining oil price changes. According to [40], price volatility is caused by fundamentals and, uncertainty then intensifies the price effect of demand and supply shocks. According to [41], uncertainty determines the decisions of oil producers, which directly affect the oil price. The novel study of [42] was the first research to model prudent demand depends on uncertainty changes. The findings of the research indicate that the crude oil market is significantly affected by the increase in prudent demand for oil that is caused by a high level of uncertainty. Reference [43] investigated the relationship between oil prices and economic policy uncertainty in G7 nations. The findings of the study show that the impact of oil prices on economic policy uncertainty is time-varying. Reference [44] examines the relationship between oil prices and economic policy uncertainty for a panel of global oil importers and exporters. The findings of the study report that oil prices respond negatively to economic policy uncertainty. Reference [45] documents that oil price shocks have a positive impact on economic policy uncertainty, while the effect of economic policy uncertainty on oil price depends on time.
The demand and supply of natural gas, the price of crude oil, and climatic factors are the major factors that affect the natural gas prices [46,47,48]. Reference [49] reports that crude oil price is the major determinant of natural gas price in China.
In [50], a positive and negative asymmetric relationship between economic policy uncertainty and gasoline price for a panel of 18 selected countries over the period of 1998–2017 was discovered. Reference [51] reported that economic policy uncertainty increases volatility in both oil and gas markets in the United States. Reference [52] investigates linear and non-linear causal relationship between economic policy uncertainty and energy prices. The study identified a negative relationship between energy prices and economic policy uncertainty.
This study broadens the previous studies on the dynamic linkages between economic policy uncertainty and the energy prices. The Russian economy heavily relies on natural gas, crude oil, and hydrocarbons; about one-third of the government revenue is generated from natural gas, crude oil, and hydrocarbons, and Russia is the second-largest producer of natural gas in the world and has the highest natural gas proven reserves [53]. Numerous sectors in the economy can be affected by the adjustments in the natural gas market, subsequently altering the economic policy in Russia. Considering the significance of economic policy uncertainty on the consumption and production of natural gas, we therefore anticipate the natural gas price will be affected by economic policy uncertainty.

2. Materials and Methods

Oil prices, gas prices, and economic policy uncertainty are among the most volatile economic series. In this study, we will employ univariate and multivariate GARCH models for our analysis. The univariate GARCH models are used to examine the volatility characteristics of the variables while the multivariate models are employed to evaluate the dynamic linkages and correlations among the variables. Meanwhile, the majority of commodity prices, including oil price and gas prices, are often not stationary (means and variances are not constant), which is contrary to the traditional statistical assumptions of the volatility models. Therefore, in line with [54], we employ augmented Dickey–Fuller (ADF) and Phillips–Perron (PP) unit root test and generated the returns of natural gas and oil prices and the economic policy uncertainty index, which are integrated at order zero (stationary at level). An additional characteristic of commodity pricing is time-dependent volatility clustering, which we considered by employing the univariate and multivariate Generalized Autoregressive Conditional Heteroscedasticity GARCH techniques starting with the ARCH-LM test.

2.1. Univariate GARCH Models

Specifically, we used GARCH and EGARCH to examine the volatility of the variables of interest in this study. Bollerslev [55] developed the GARCH model with the mean and variance equations specified as follows in Equations (1) and (2), respectively.
R t = α 0 + i = 1 p γ i R t i + ε t
θ t 2 = δ 0 + i = 1 p λ i ε t i 2 + j = 1 q γ i θ t j 2
In this study, R t represents the oil price, natural gas price, and economic policy uncertainty, θ t 2 is the conditional variance, and i = 1 p λ i ε t i 2   and j = 1 q γ i θ t j 2 are the ARCH and GARCH terms, respectively. For a stationary series, 0 < i = 1 p λ i + j = 1 q γ i < 1 . When i = 1 p λ i + j = 1 q γ i 1 , the series is slow mean-reverting while i = 1 p λ i + j = 1 q γ i 0 implies that the series is fast mean-reverting.
Additionally, considered in this study are the EGARCH models built by [56] to account for the asymmetric and leverage effects not captured by the GARCH model. This model factored in the possibility of the difference in the effect of positive and negative shocks on the series. While the mean equation remained as Equation (1), we specified the variance equation of the EGARCH model in Equation (3).
ln ( θ t 2 ) = δ 0 + δ 1 ε t i θ t i 2 + φ ε t i θ t i 2 + l n θ t 1 2
The asymmetric effect is captured by the φ . In the presence of an asymmetric effect, φ > 0 implies that the effect of positive shock is greater than the effect of negative shock of the same magnitude. In contrast, φ < 0 implies that the effect of negative shock is greater than the effect of positive shock of equal magnitude. If   φ = 0 , there is no asymmetry in the effect. That is, the effect of positive shock (good news) is the same as the effect of negative shock (bad news) of equal size. Examining the symmetric effect is relevant in this study because of the information-centric nature of oil price, gas price, and the economic policy uncertainty index.

2.2. Multivariate GARCH (MGARCH) Techniques

Several multivariate GARCH (MGARCH) models were developed for the examination of the co-movement among different variables of interest in finance and economics. For example, Bollerslev [55] proposed the constant conditional correlation technique to model the time-invariant conditional correlation matrix. The major defect of the CCC approach is the assumption of constant conditional correlation over time, which is unrealistic for empirical application [57,58]. Thus, separate and independent studies generalized the CCC model to the dynamic conditional correlation GARCH (DCC-GARCH) model. The DCC-GARCH model is outperforms all other variants of GARCH-based models because it measures time-varying effects, which is consistent with lower volatility in the conditional volatility of the variables considered, and provides more accurate conditional variances [57,58,59,60,61,62,63]. It also provides insights on the synchronization and volatility clustering in the commodity markets [64].
Thus, to examine the time-varying volatilities and dynamic linkages between Russian economic policy uncertainty and energy prices (oil and natural gas prices) in this study, we used the dynamic conditional correlation (DCC) in this study.
Supposing we have the returns, r t , of oil price, gas price, and Russian economic policy uncertainty with expected value zero and covariance matrix   H t , we then define the (Engle, 2002) [57] version of the DCC-GARCH model as follows:
y t = μ t + r t r t = H t ε t H t = D t R t D t D t = d i a g h 11 t h n n t = h 11 , t 0 0 0 h 22 , t 0 0 0 h 33 , t R t = d i a g Q t 0.5   Q t d i a g Q t 0.5 .
where H t is the conditional variance matrix, μ t symbolized a vector of expected values of y t , D t represents a matrix of non-constant standard deviation, ε t is a vector of error terms with zero expected value E ( ε t ) = 0 and constant variance, E ( ε t   ε t ) = I , while Q t = ( q i j t ) represents n × n symmetric positive definite matrices (Engle, 2002) [57] of three variables (oil price, natural gas price, and Russian economic policy uncertainty); hence, this is an n × n = 3 × 3
Q t = 1 α β Q ¯ t + α u t 1 u t 1 + β Q t 1   ,   α ,   β > 0
The parameters a   and   b are nonnegative scalar parameters. The model is mean-reverting if α +   β < 1 and integrated if   α +   β = 1 . Q t stands for the unconditional variance between variable i and   j , Q ¯ is the unconditional covariance matrix of   u t , and u t 1 u t 1 denotes the lagged function of the standardized residuals.
The conditional covariance is given as:
h i j , t = q i j , t h i i , t h j j , t q i i , t   q j j , t
where   h i i , t = ω t + γ i ϵ t 1 2 + λ i h i i , t 1 ,   i = 1 ,   n . For the asymmetric version,
Q t = 1 α β Q ¯ t g N ¯ + α u t 1 u t 1 + β Q t 1 + g n t 1 n t 1 ,
where, α +   β + δ g < 1 , δ is the maximum eigenvalue Q ¯ 0.5   N ¯ Q ¯ 0.5 , N ¯ = 1 T t = 1 T g n t n t , n t = I u t < 0   u t ,   I .   i s   k × 1 indicator function that assumes value 1 if the argument is true and zeros, otherwise and ‘∘’ symbolizes the element-wise operator.
The scalar parameters a   and   b account for the effects of the innovation (past shocks) and past dynamic conditional correlations on current dynamic conditional correlations [65].
To ensure robustness, we also employed the corrected dynamic conditional correlation (cDCC) introduced by [66] and improved by [67]. The specification of the corrected cDCC-GARCH model is the same as that of the DCC-GARCH model. However, ref [67] identified that the DCC is asymptotically biased in the estimation of the sample covariance matrix and modified the model accordingly. Thus, this study used both the DCC and cDCC techniques to analyze the time-varying conditional interaction between economic policy uncertainty, natural gas prices, and oil prices.

2.3. Data

The economic policy uncertainty index for Russia is formulated by [1] using the frequency count of articles in the Kommersant, a nationwide disseminated daily newspaper mainly focused on politics and economics. This prevalence was computated by the total amount of the articles counted in the same newspaper and the same month [1]. In this study, we make use of monthly economic policy uncertainty index in the time span from January 1990 to December 2019. The EPU index is available at the EPU website (http://www.policyuncertainty.com/). We obtained the data on the natural gas price and crude oil price from the British Petroleum (BP) Statistical Review of World Energy.

3. Results

Table 1 contains the summarized statistical information about all the three variables and their returns series. The average monthly natural gas spot price (NGPRICE) was about 4 USD per million British thermal units while the average WTI crude oil spot price (OILPRICE) is approximately 52 USD per barrel. The average Russian economic policy uncertainty index (REPU) is about 134, which is above the normalized value (100) of the index ascribed to 1997 considered as a period of relatively low uncertainty [68]. The minimum values of the NGPRICE, OILPRICE, and REPU are 1.43, 11.35, and 12.399, while the maximum values are 13.45, 133.88, and 431.25, respectively. The wide range between the minimum values implies significant fluctuations in all the series over the period. The large standard deviations of the level series particularly for OILPRICE and REPU also indicate volatilities. The standard deviation shows that the REPU was the most volatile, followed by the OILPRICE. Regarding the symmetry and tail behavior of the series, all the level variables are skewed to the right (positive skewness or longer right tail than left tail) while the kurtosis shows that NGPRICE, REPU, and all the return series are heavy-tailed (kurtosis greater than 3) while OILPRICE is light-tailed (kurtosis less than 3). Thus, the skewness and kurtosis indicate that the variables considered in this study are not normally distributed. The Jarque–Bera test statistics, which are significant for all the variables, equally indicate the rejection of the normality of the distributions of the series. The distribution of the series is important for the estimation of the volatility models. Therefore, we estimated all the univariate and multivariate GARCH with the Student’s t distribution instead of the Gaussian (normal) error distribution. We also conducted the ARCH LM, Q-statistics, and Q-squared tests for volatility. All the statistics indicate the presence of volatility effects in all the variables. This implies that the appropriate methodology for the estimation of the models in this study is the volatility models. The correlation coefficients for all pairs of the variables are less than 0.5, indicating the absence of a multicollinearity problem.

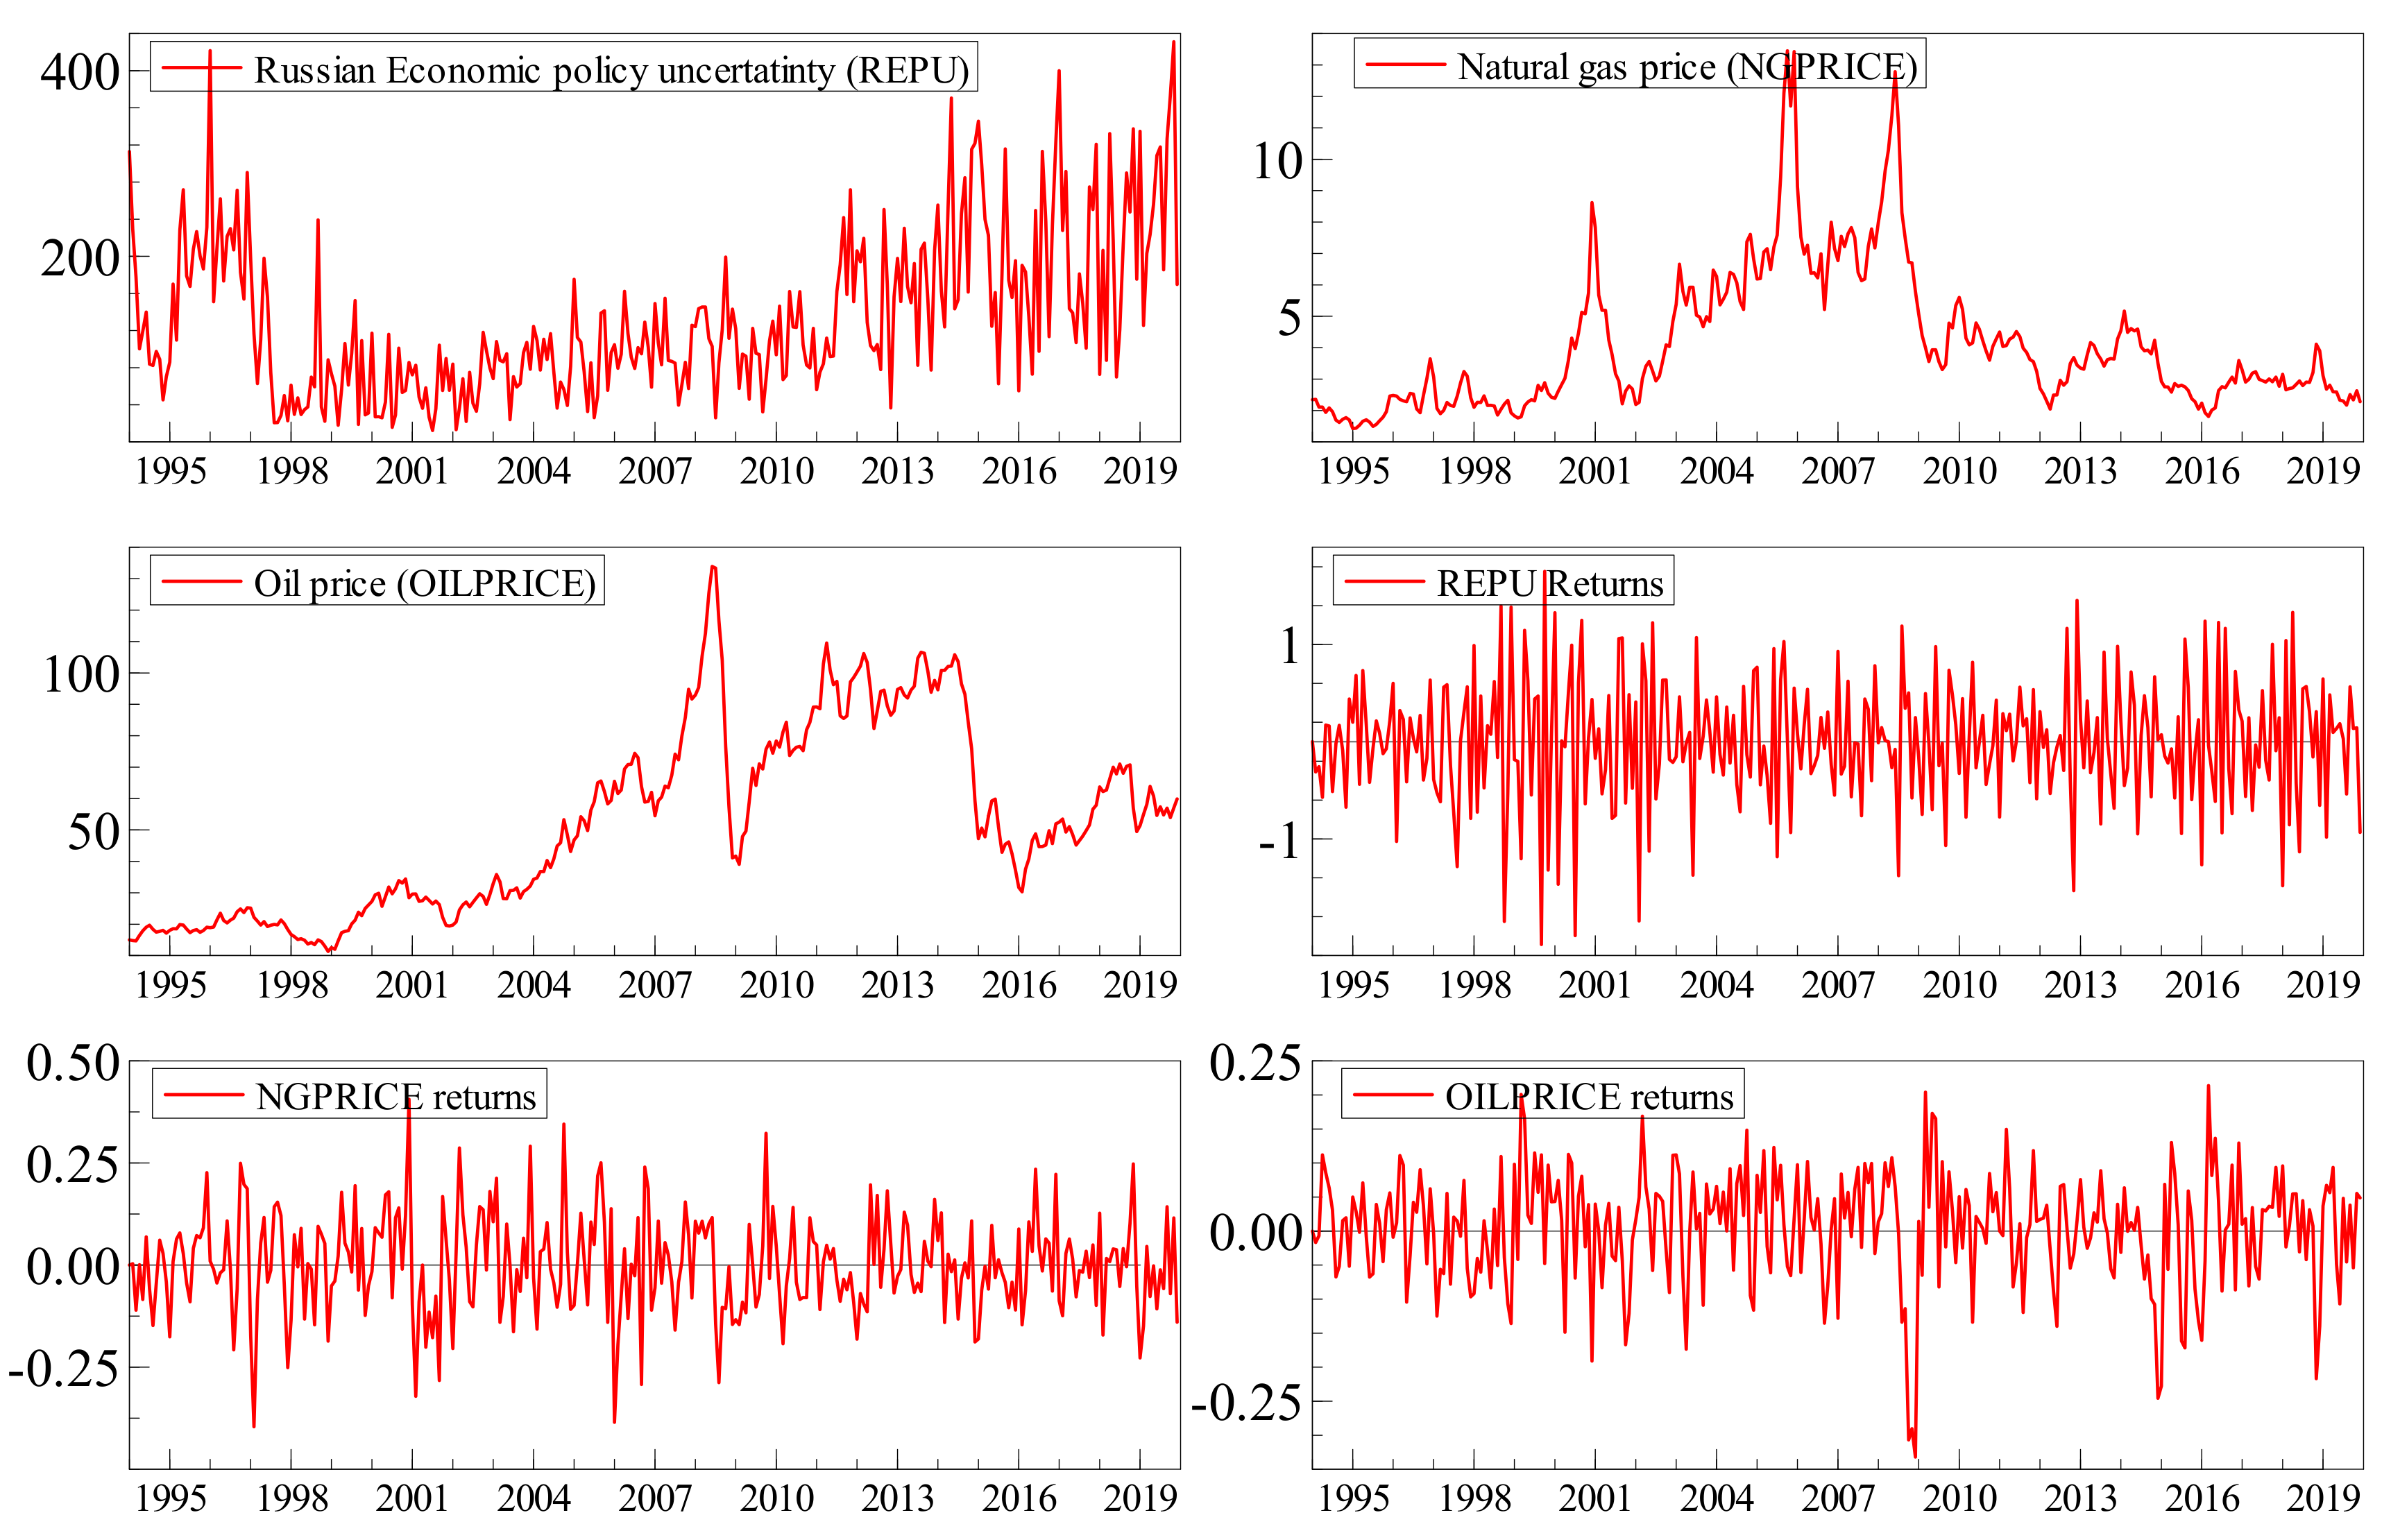
3.1. Dynamics of the Monthly Russian Economic Policy Uncertainty and Energy Prices and Their Returns

The graphical illustration (shown in Figure 1) displays the dynamics of Russian economic policy uncertainty (REPU), energy prices, and their returns over the period 1994–2019 considered in this study. The time series graphs show that all the variables have a trend and fluctuate over the period. In the case of the REPU, the trend and changes reflect major economic and political events in Russia. For instance, the high values of the index between 1995 and 1996 reflect the first Chechen war, fought between December 1994 and August 1996. The period also contains the Russian interbank credit crisis and low natural gas prices. Moreover, the REPU continuously rises from 2014 to 2019. In addition to the Russo–Ukrainian war, which has resulted in western sanctions on Russia, on average, the natural gas and crude oil prices consistently fall during the period (2014–2019). This somewhat indicates the simultaneous movement of the three series. Thus, there is seemingly interdependence in the dynamics of the variables. The graph shows that the returns of the series are mean-reverting and exhibit the presence of volatility clustering. The volatility of the REPU is the highest followed by the OILPRICE volatility. The volatilities, however, concurrently move in clusters during the period. The periods of low volatility follow periods of high volatility in all the series. This signals the interference of the volatilities of the variables, which we examined in this study.

3.2. Stationarity (Unit Root) Test Results

Time series are often non-stationary and follow a trend. As such, the regression estimates of a non-stationary variable on another non-stationary variable(s) are spurious and result in an invalid conclusion. Therefore, it is imperative to examine the stationarity property of the variables before proceeding to the estimations of the regression models. Moreover, the stationarity of the variables is an underlying assumption of the GARCH models. Hence, we conducted augmented Dickey–Fuller (ADF) and Phillips–Perron (PP) unit root tests. Table 2 contains the results of the unit root tests. The results of both the ADF and PP tests indicate that, at the 5% level of significance, the level series of oil price (OILPRICE) and natural gas price (NGPRICE) are not stationary while the Russian economic policy uncertainty index is stationary at levels in all cases (constant only, constant and trend, and none). However, the return series of all the variables are stationary at levels for all cases of the ADF and PP tests. Since some of the level series are not stationary at levels, we used the return series to estimate the volatility models throughout this study.

3.3. Estimates of Univariate Models

We first estimated the symmetric and asymmetric univariate ARMA-GARCH (1, 1) models to evaluate the volatility characteristics of the variables and identify the best techniques for the estimation of the multivariate models. The symmetric and asymmetric GACH models employed are GARCH (1, 1) and exponential GARCH (1, 1) models (EGARCH (1, 1)), respectively. These models are identified to be the best for the modeling of stationary volatile series [56,57]. Table 3 displays the results of the univariate volatility models. The results show that ARMA terms are statistically significant for the RETREPU models, but insignificant for the RNGPRICE and ROILPRICE models. Moreover, the coefficients of the ARCH and GARCH terms are significant for all the symmetric models. This confirms the presence of the ARCH and GARCH effects in all the variables. The sum of the ARCH and GARCH terms is less than one in each model. This shows that the variables are mean-reverting. This means that the effect of shocks on the returns of all variables is temporary. Although Russia is a significant player in both crude oil and natural gas markets, when a shock impacts the variables, the results indicate that oil price reverts to its mean faster than natural gas prices and Russian economic policy uncertainty. This reflects the fact that Russia is the second-largest producer of natural gas and the largest exporter of the product in the world [69]. Hence, when there is a shock, for instance, on the natural gas supply in Russia, the effect on the price lasts longer than the effect of a similar shock on crude oil supply. Moreover, the RETREPU recovers from shock faster than the natural gas price.
When considering the estimates of the asymmetric models, the variables still exhibit slow mean-reversion, and the asymmetric term is statistically significant for all the variables. The estimates indicate that the coefficients of the models for RETREPU and RNGPRICE are positive. This implies the effect of positive shock is greater than the effect of negative shock of the same magnitude. For instance, a boost in the supply of natural gas affects the natural gas price more than a cut in the supply of natural gas. The plausible explanation for the greater effect of the positive supply shock than the negative shock is that the demand for natural gas is inelastic in the short term [70,71,72,73,74]. The demand for natural gas does not necessarily adjust equally with a decrease in supply. At best, demand adjusts with a lower magnitude than the increase in supply. On the other hand, an increase in supply creates a surplus, which leads to a fall in the prices and an increase in demand. Natural gas demanders buy more and reserve more for subsequent use.
Conversely, the parameter estimate of the asymmetric term for the OILPRICE model is negative and highly significant. This implies that the effect of negative shock on the crude oil price is greater than the effect of a positive shock of equal magnitude. That is, for instance, a supply cut in crude oil price affects the price more than å supply increase of the same quantity.
The post estimation ARCH test statistics (F-statistics and nR2) are statistically insignificant for all the models. This shows that all the models capture the ARCH effect and their estimates are statistically valid for policy analysis. We used the Schwarz information criterion (SIC) to choose the best models. The SIC values of the EGARCH models are smaller than their SIC values of the GARCH models for all the variables. Thus, the symmetric models outperformed the symmetric models in this study. This conforms to the findings of [75]. Hence, in the subsequent estimations, we consider the results of the asymmetric models superior to their symmetric counterparts.

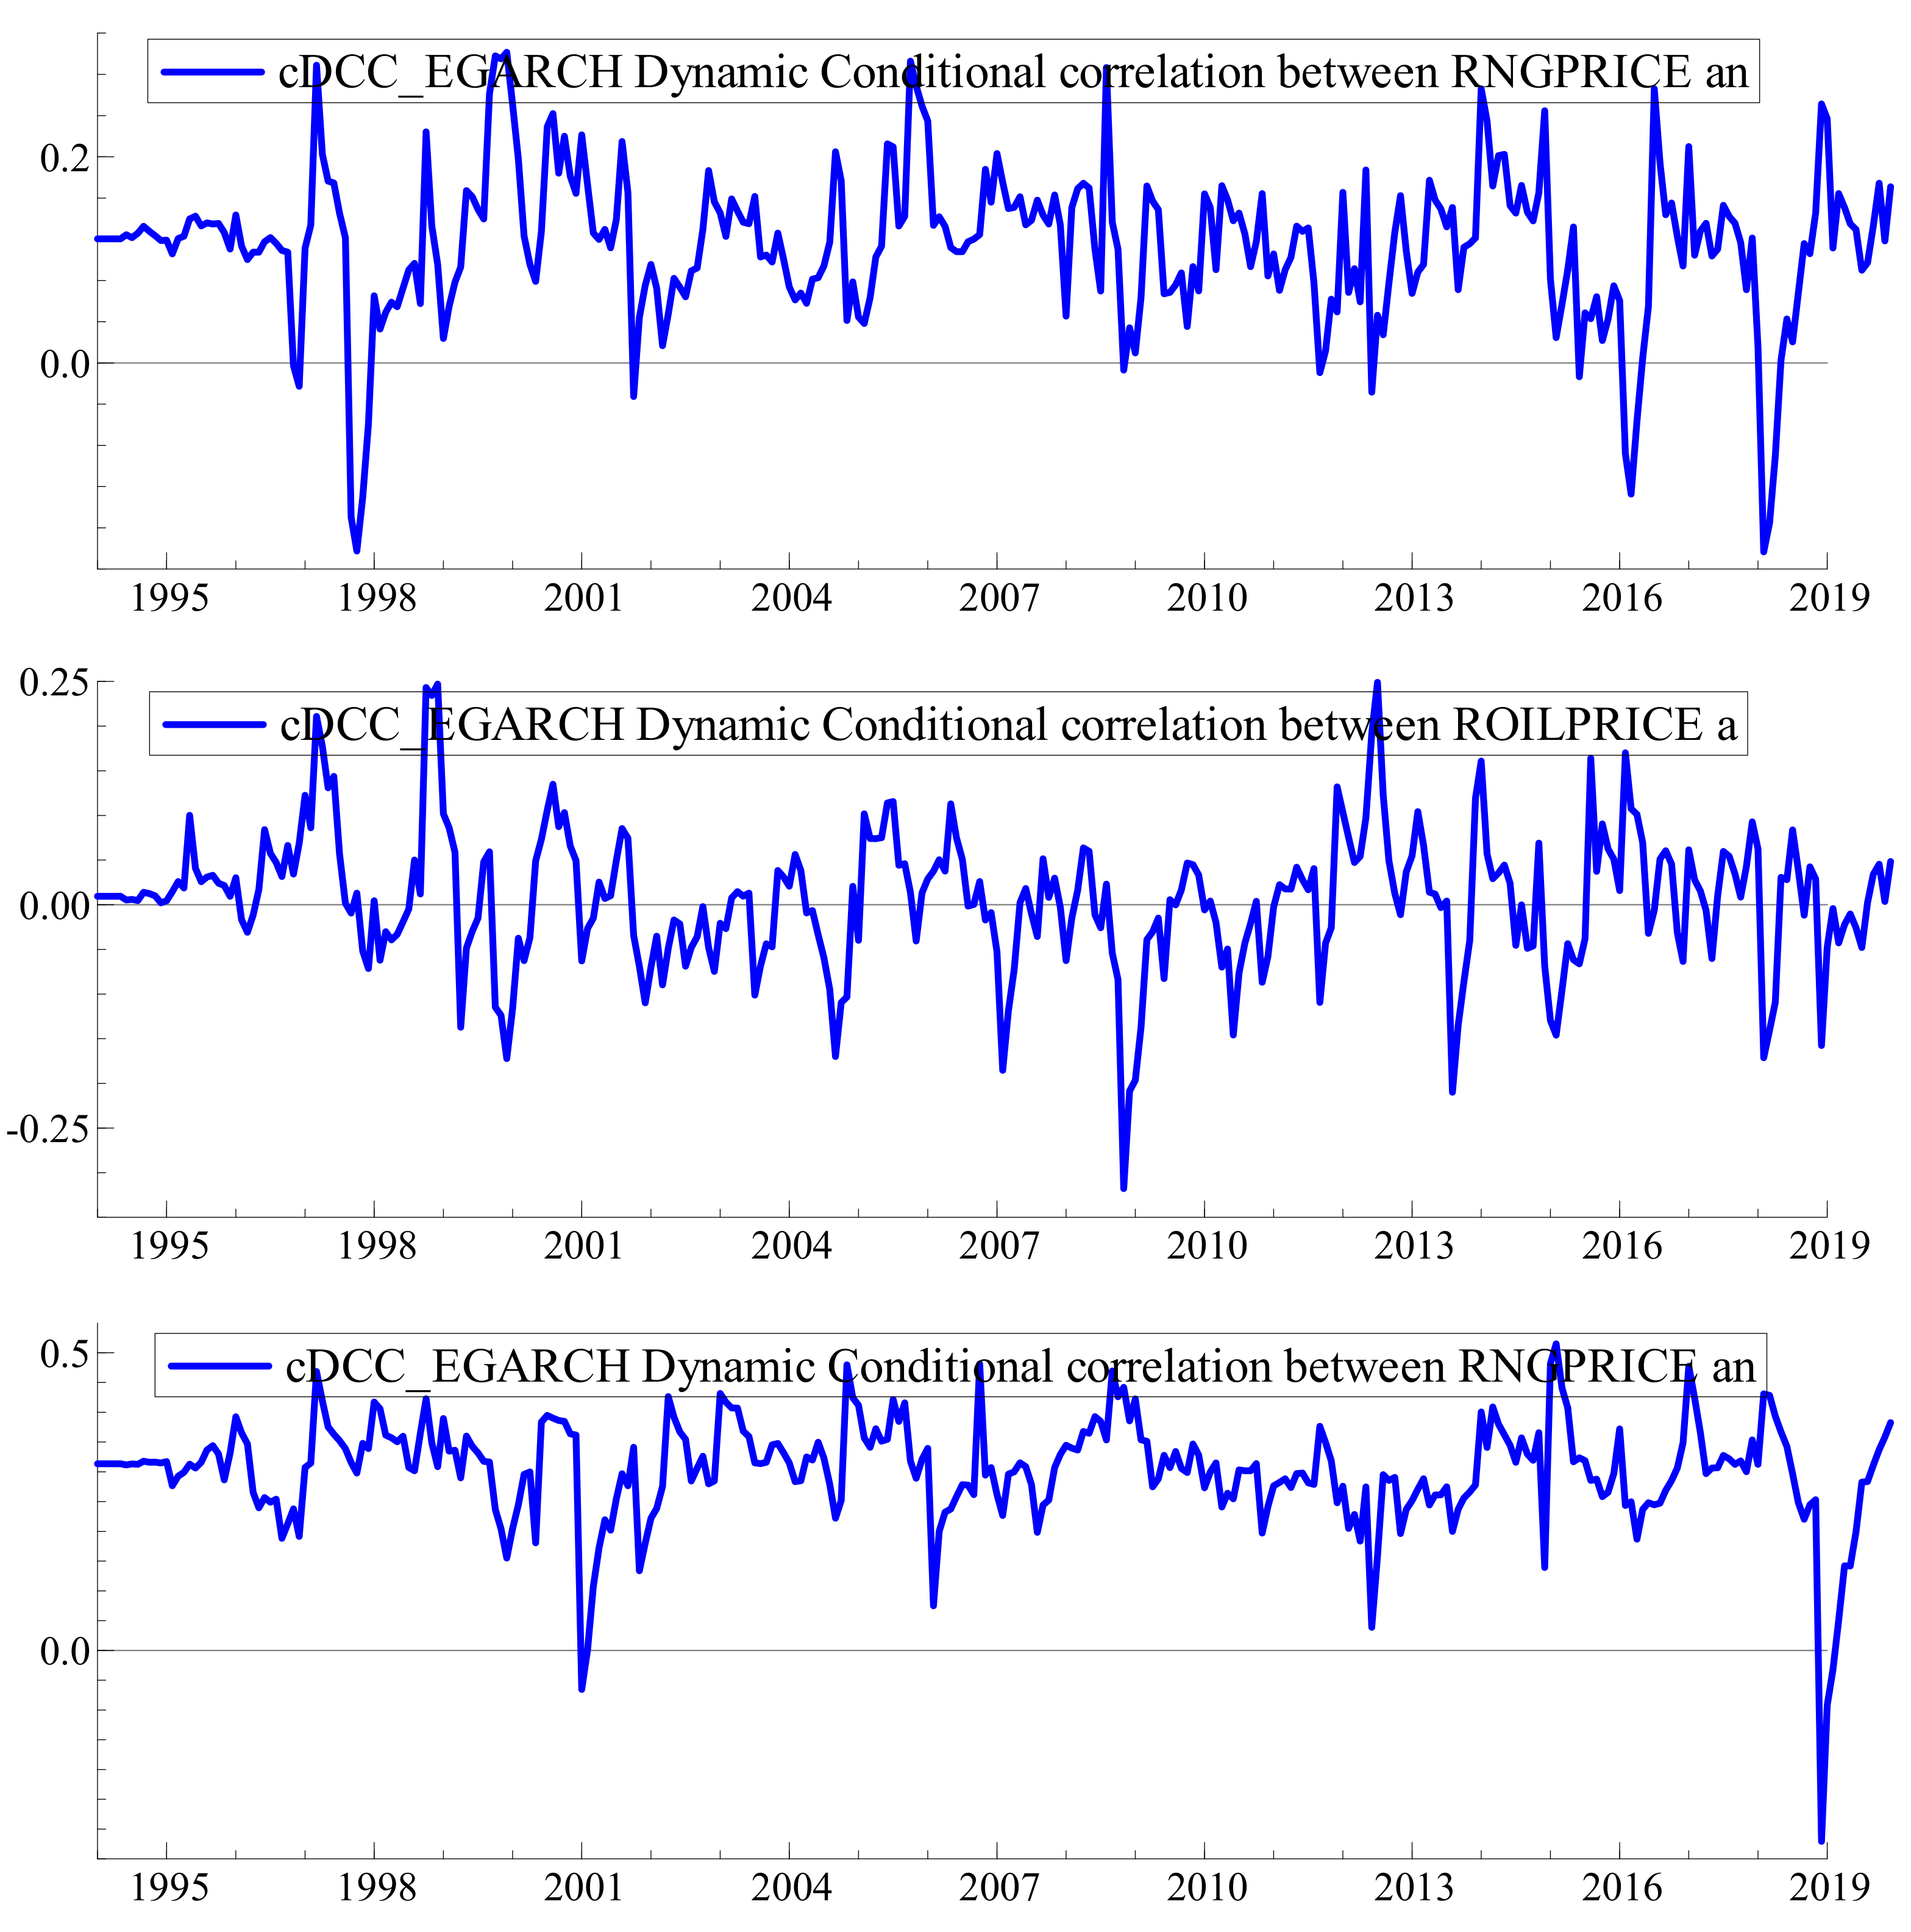
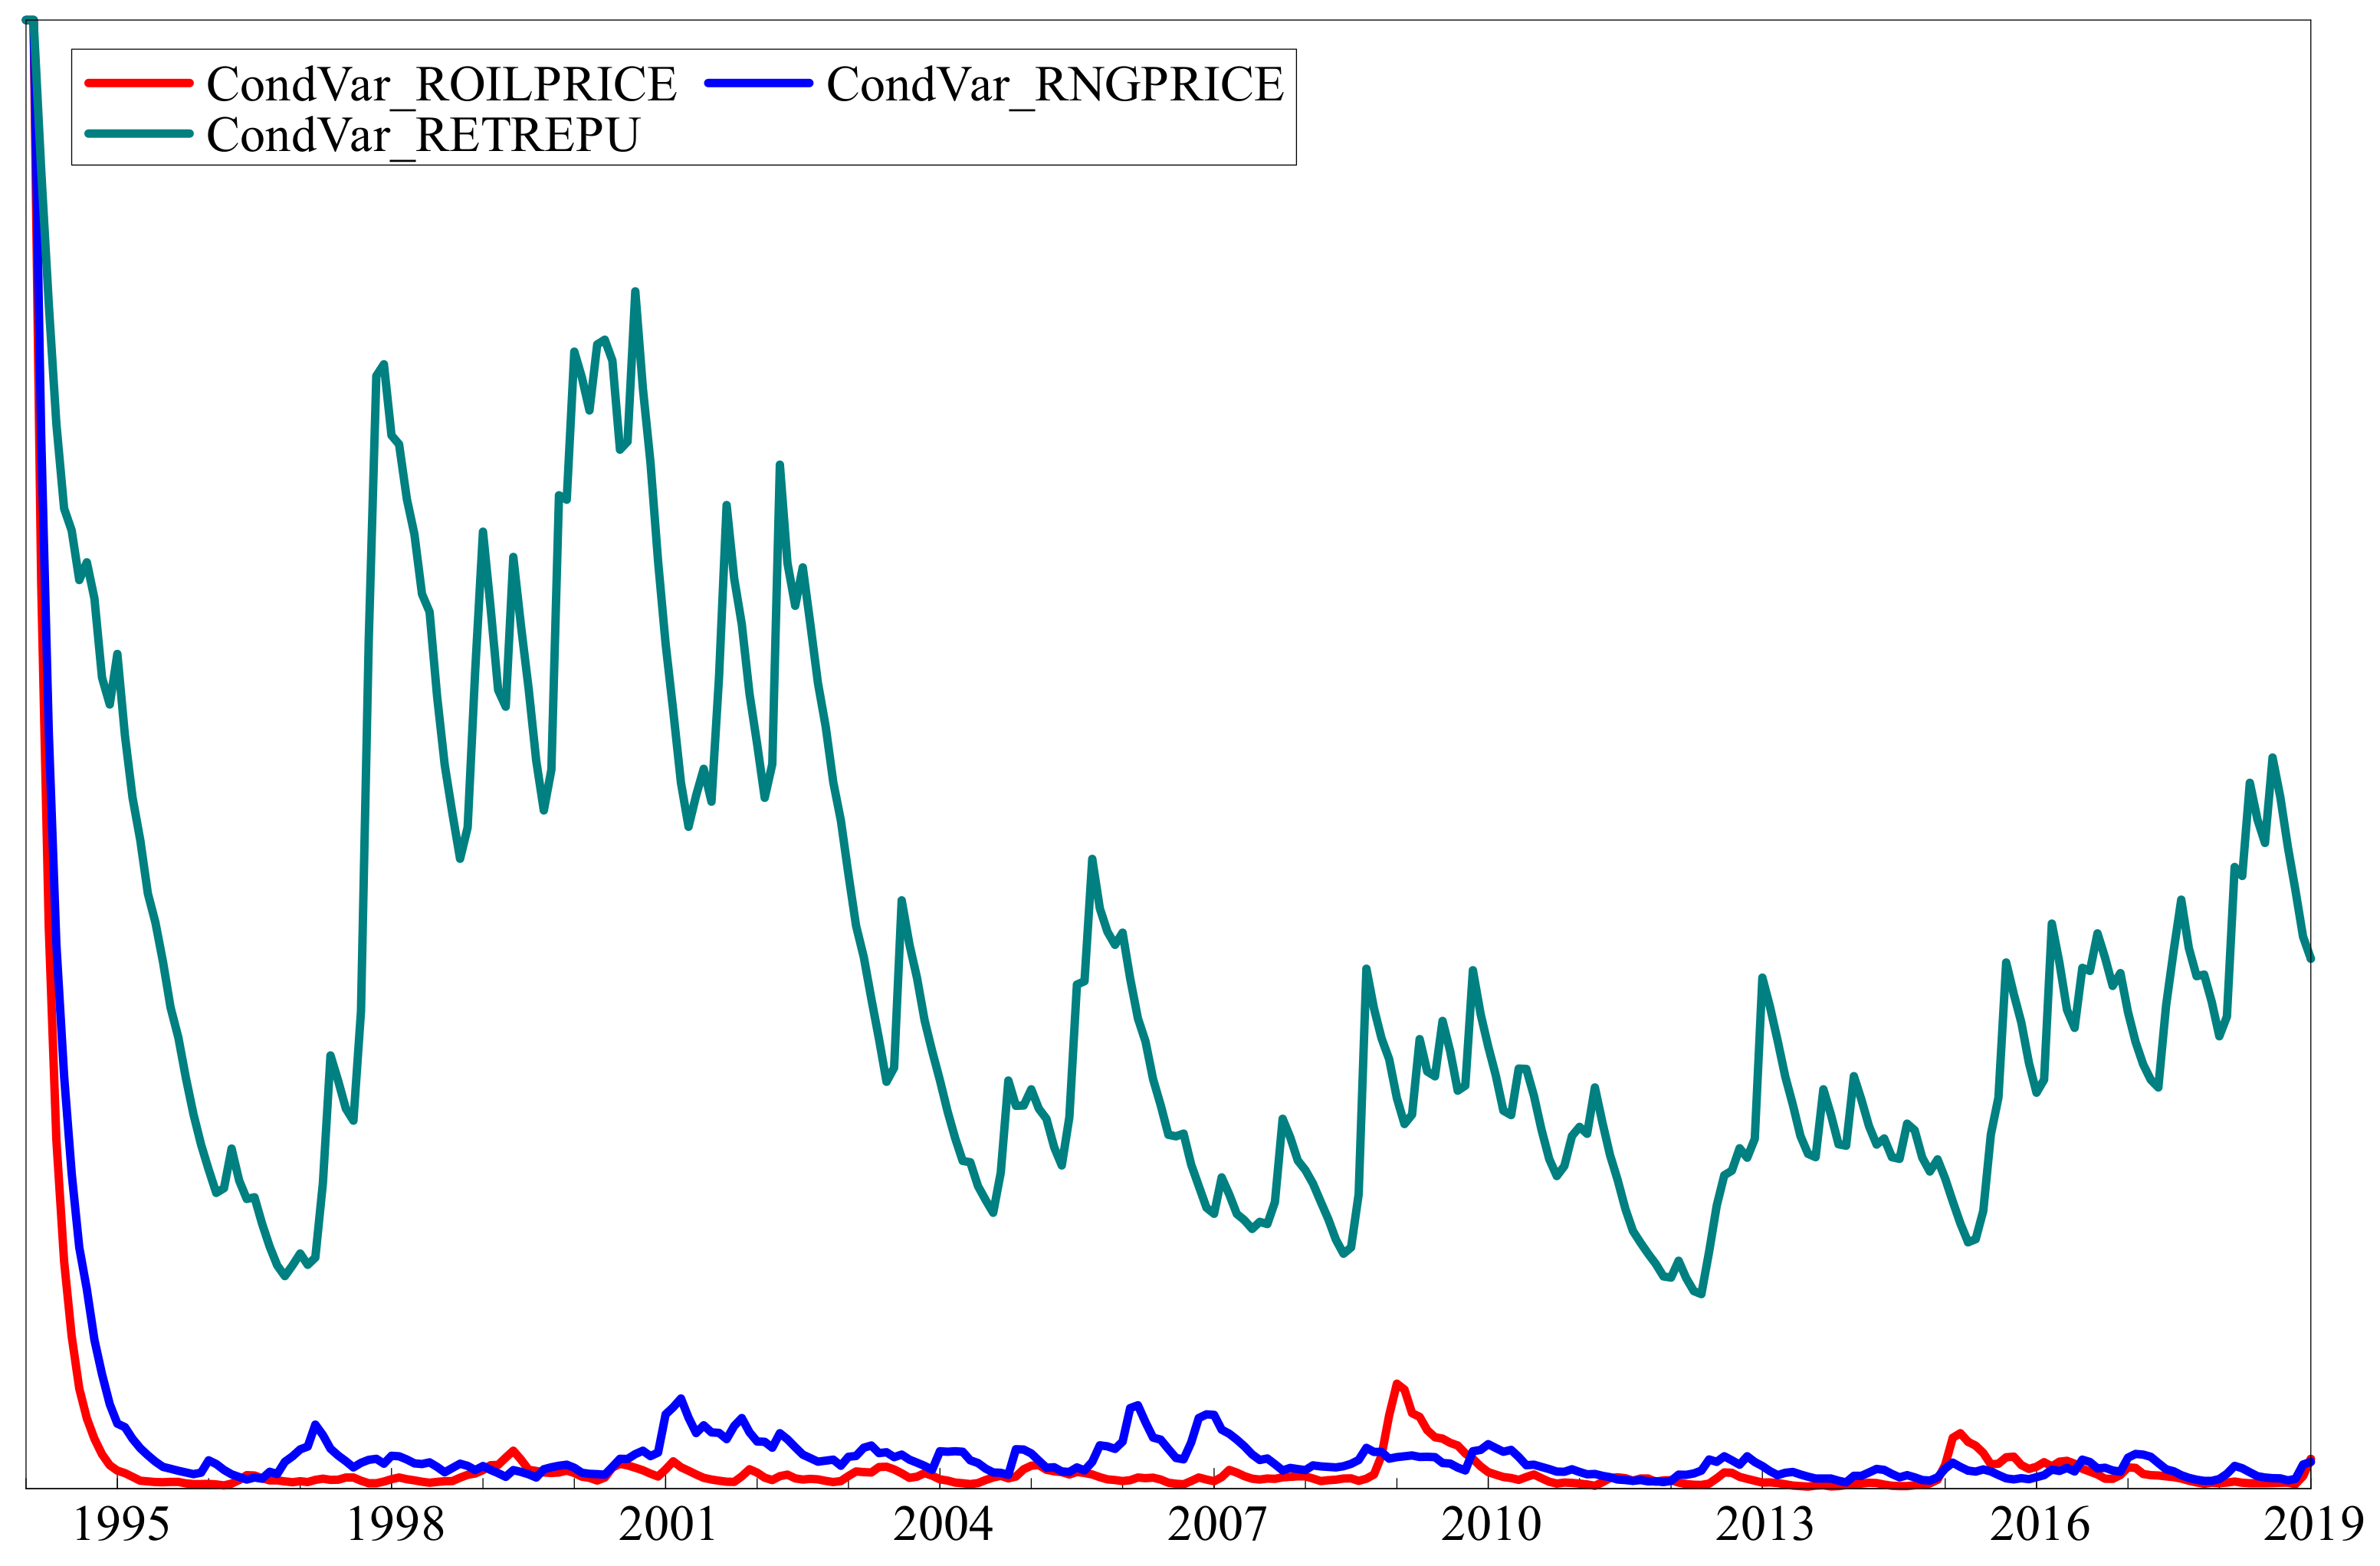
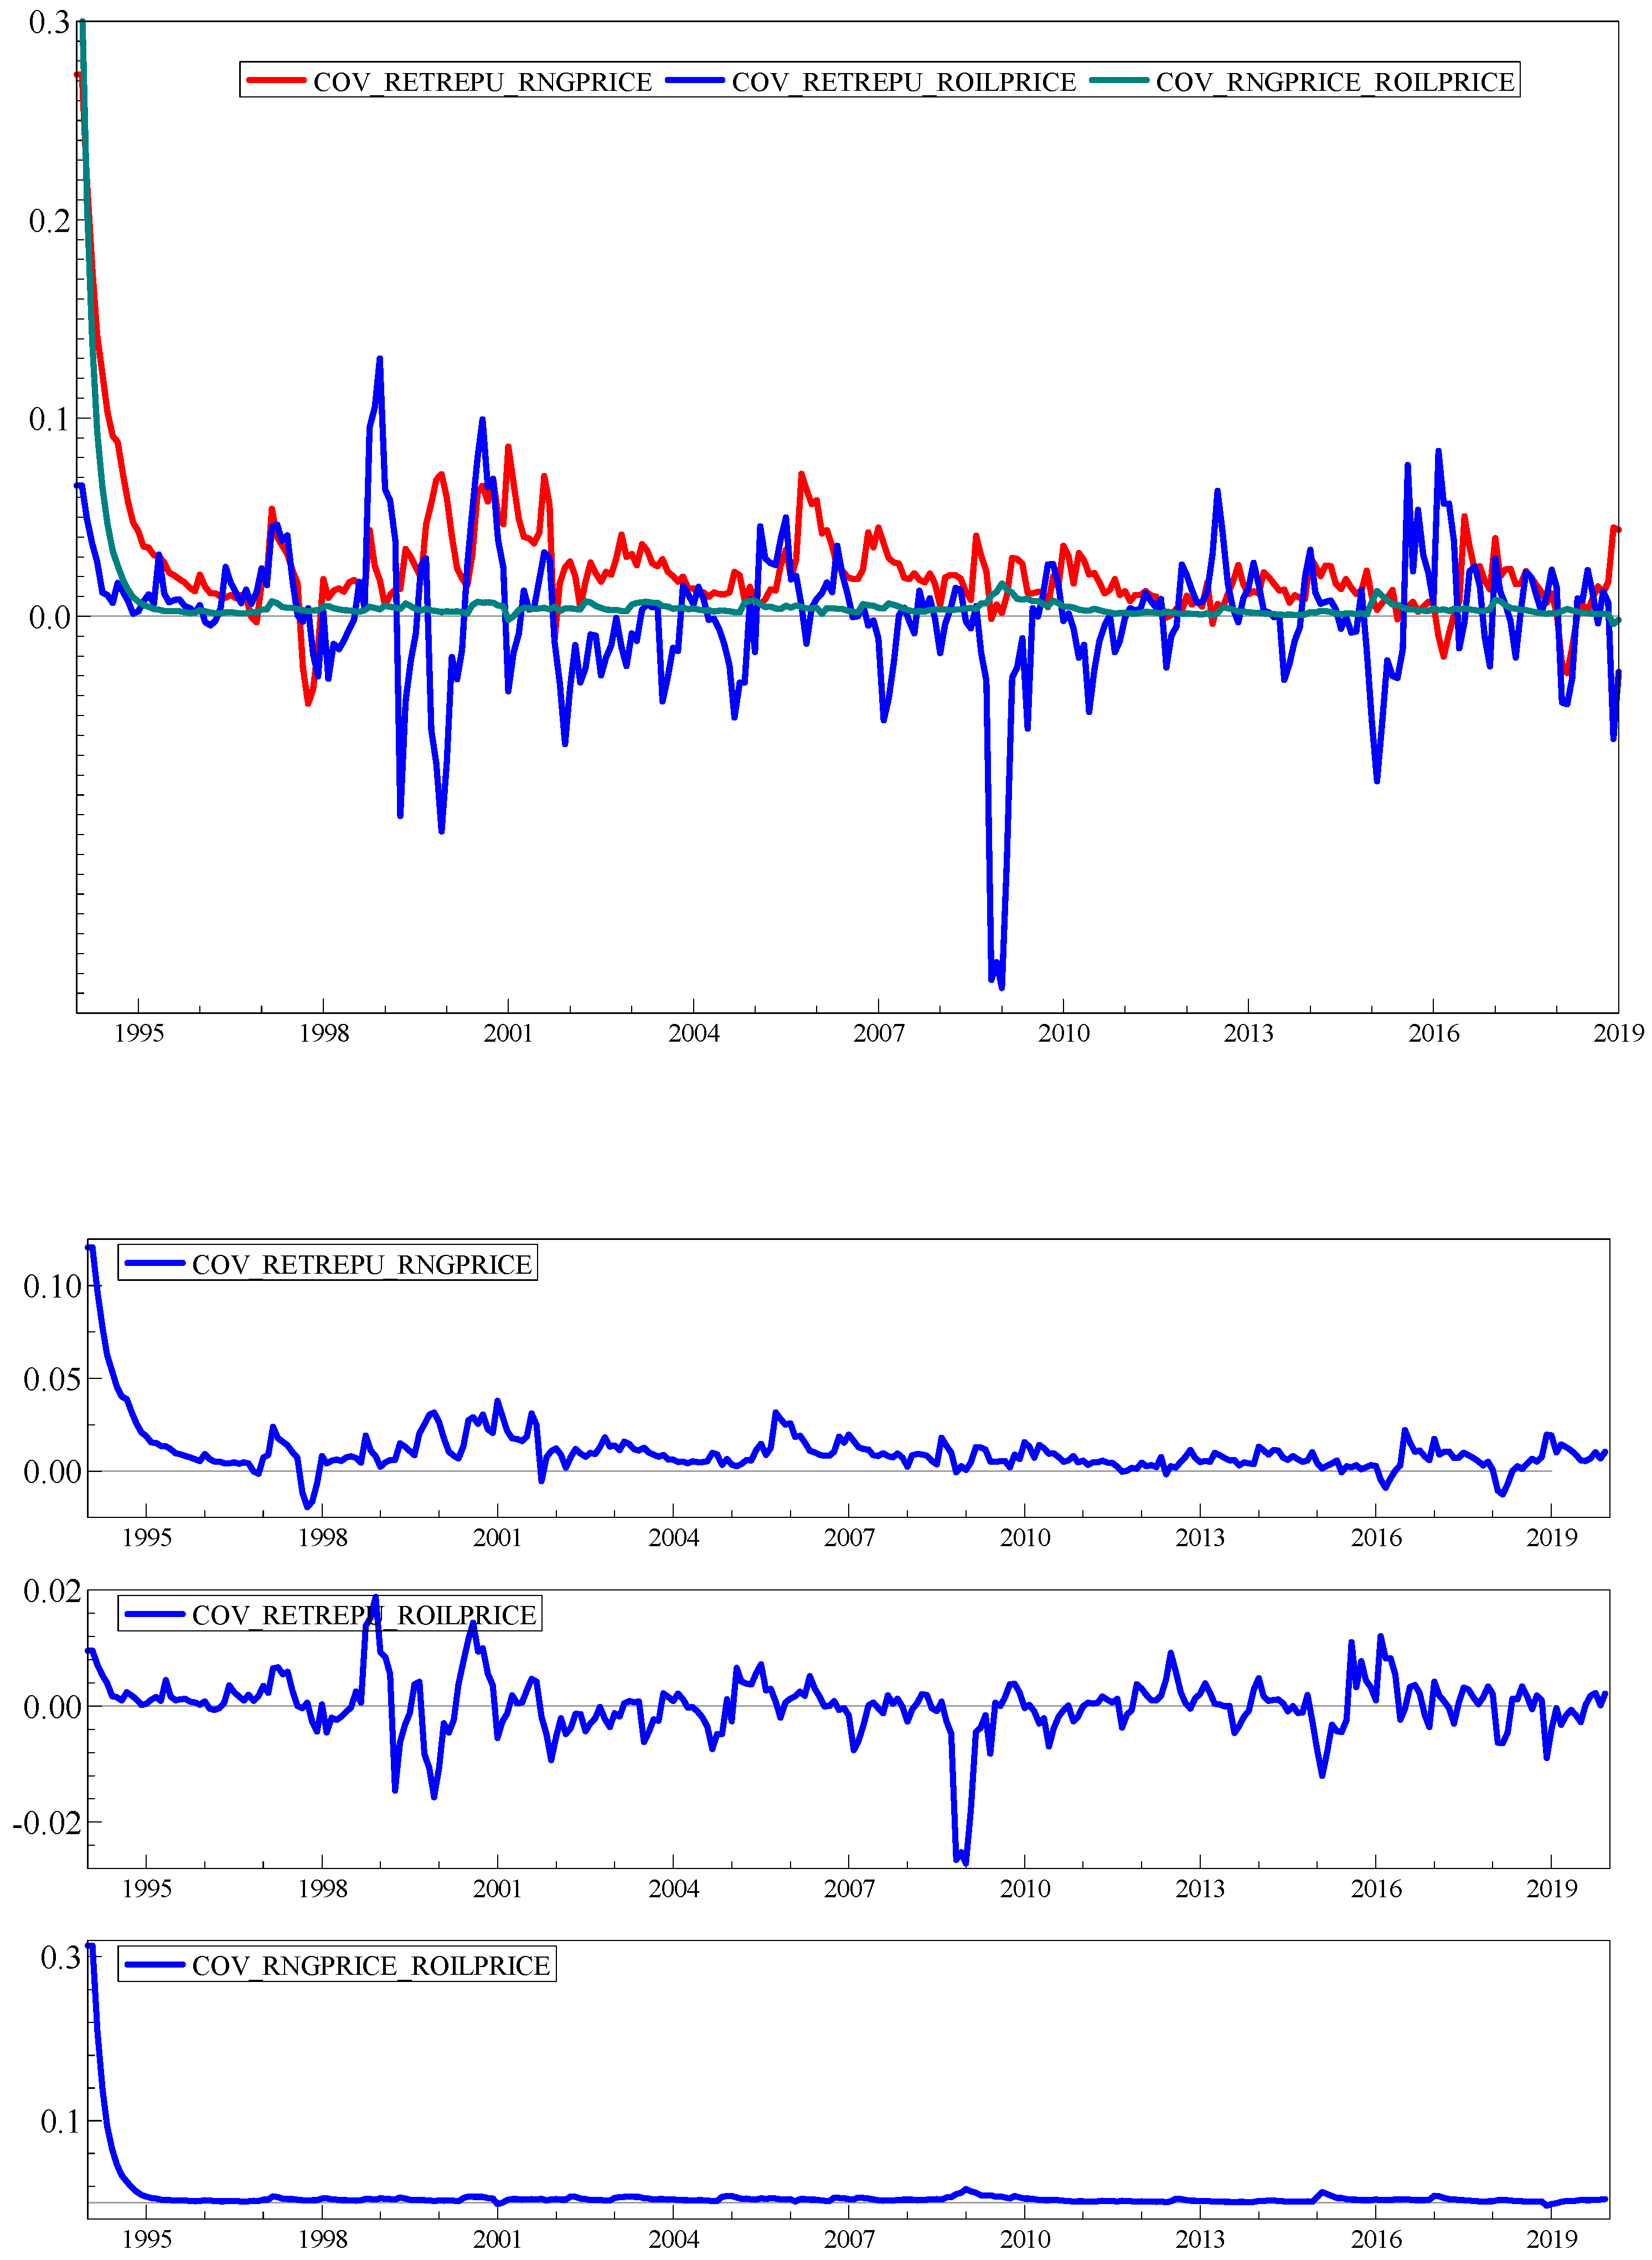
3.4. Results of Multivariate Models

Table 4 reports the parameter estimates of the DCC-MGARCH and the cDCC-MGARCH models. The results indicate that the alpha (α) and beta (β) coefficients are statistically significant for all the models, indicating a dynamic (not constant) conditional correlation between the Russian economic policy uncertainty and energy prices (natural gas and crude oil prices). The rejection of the hypothesis of the constant conditional correlation implies it might be misleading to assume independence or neutrality between the variables. Therefore, there is an interconnection (co-movement) between each pair of energy prices and economic policy uncertainty in Russia. Moreover, the sum of the MGARCH parameters is less than one (α + β < 1) for all the models, implying that the conditional correlations are mean-reverting. Thus, the DCC-MGARCH models are justifiably adequate in capturing the time-varying conditional correlations between the variables. Comparing the models, the log-likelihood values of the cDCC models are less than the log-likelihood of the DCC models, indicating that the cDCC outperforms the DCC models. In addition, the log-likelihood of the asymmetric cDCC model is the smallest. Hence, it is the best model.
The log-likelihood shows that the asymmetric model (cDCC-EGARCH) is the best. As a result, we used the estimates of the asymmetric cDCC (EGARCH-DCC) model to examine the conditional correlations, variances, and covariance of the Russian economic policy uncertainty, natural gas price, and crude oil price. Figure 2 depicts the conditional correlations between the Russian economic policy uncertainty index, natural gas price, and crude oil price. The figure shows that the conditional correlations between the variables are dynamic (time-varying). This means that the conditional correlation sometimes declines sharply and sometimes increases sharply. It alternates between high and low values. For example, the conditional correlation between gas price and economic policy uncertainty dropped significantly around 1998, 2016, and 2019. These years coincide with the period of the Russian financial crisis, the western sanctions against Russia for the Russo–Ukrainian war, and the onset of the coronavirus (COVID-19) pandemic, respectively. Similarly, the correlation between crude oil price and economic policy uncertainty declined hugely during the 2008–2009 global financial crisis and increased during the oil boom period in 2012. Moreover, the conditional correlation between the oil price and the natural gas price dropped sharply in 2001 and 2019. These years indicate two significant global events, the terrorist attack on September 11, 2001, and the onset of the COVID-19 pandemic in 2019. This indicates that, as global commodity prices, the correlation between energy prices is associated with global events. The conditional correlations increase in the years preceding the decrease in the correlations. Furthermore, the correlation between the oil price and natural gas price is the highest, followed by the correlation between natural gas price and economic policy uncertainty. The correlation between crude oil prices and economic policy uncertainty is the lowest. This demonstrates the importance of natural gas to the Russian economic policy agenda. As Russia is the largest exporter and second-largest producer of natural gas, it is plausible that it correlates with policy uncertainty more than the crude oil price. Although Russia is also a crucial player in the crude oil market, there is a higher co-movement of the economic policy uncertainty with the gas price than with the oil price. It is important to add that the correlation between gas price and economic policy uncertainty and the correlation between crude oil price and economic policy uncertainty have similar patterns. Each declines in almost the same period and, equally, increases concurrently.
Figure 3 displays the covariance between the oil price, natural gas price, and the economic policy uncertainty. The graph shows the time-varying nature of the conditional covariance with the covariance between gas price and economic policy uncertainty. The covariance between oil price and economic policy uncertainty notably plummeted in 2008, an indication of the effect of the global financial crisis. The graph also illustrates that covariance between oil prices and gas prices are smooth throughout the period. This demonstrates the close connection between energy prices. Besides, the covariance between gas price and economic policy uncertainty is the highest, depicting the substantial effect of natural gas on Russian economic policy decisions. Similarly, Figure 4 illustrates the conditional volatilities of the three variables. The graphical display portrays the dynamic nature of the conditional volatilities of all the variables. This shows that the conditional volatility of the Russian economic policy volatility is the highest, followed by the natural gas price returns over the period. Therefore, the conditional correlations, volatilities, and covariance are dynamic and depict the interconnectedness of the Russian economic policy uncertainty and energy prices.

4. Conclusions

This study examined the interconnections between Russian economic policy uncertainty and energy prices using DCC-MGARCH models. Both crude oil and natural gas are crucial to the Russian economy. However, it is important to understand the dynamic relationship between energy prices and economic policy uncertainty in the country. Thus, we evaluated the interdependence of crude oil price, natural gas price, and Russian economic policy uncertainty over the period 1994–2019. The energy prices and the economic policy uncertainty are volatile. Thus, we employed volatility models. The preliminary results indicate the mean-reverting volatility of all three variables. However, when there is a shock, for instance, on the natural gas supply in Russia, the effect on the price lasts longer than the effect of a similar shock on crude oil supply. This current study further reveals that there are interconnections (co-movement) between each pair of the energy prices and economic policy uncertainty in Russia. It might be misleading to assume independence or neutrality between the variables. However, the conditional correlation between natural gas price and economic policy uncertainty is greater than the correlation between crude oil price and economic policy uncertainty. Even though Russia is a crucial player in both the natural gas and the crude oil markets, there is higher co-movement of the economic policy uncertainty with gas price than oil price. This demonstrates the importance of natural gas in the Russian economy. Russia is the highest exporter of natural gas and second-largest producer; hence, it is plausible that the natural gas price correlates more closely with economic policy uncertainty than the crude oil price. It is important to add that the correlations between gas price and economic policy uncertainty and the correlation between crude oil price and economic policy uncertainty have similar patterns. Each declined in almost the same period and, equally, increased concurrently. Additionally, the results revealed that significant global events and crises, such as the global financial crisis, the Russian financial crisis, the 9/11 terrorist attack, and the Russo–Ukrainian war, have an influence on the interconnections between the energy prices and Russian economic policy uncertainty. Based on our study’s empirical outcomes, several policy prescriptions for the Russian energy markets and their diverse responses to their volatility or the dwindling oil price should be pursued by appropriate quarters to stabilize both energy prices and minimize economic policies accordingly.
The findings of this study have implications on the Russian energy policies, trade policies, and stabilization policies. With regard to energy policies, the findings show that transition to a green economy, with clean energy sources such as renewables, would not only enhance environmental sustainability, but also boost the stability of the Russian economy.
Regarding trade policies, the findings revealed that Russia needs to prioritize the development of trade on goods and services other than energy resources. This is because huge volumes of trade on crude oil and natural gas create large uncertainties and the instability of the Russian economy due to its vulnerability to global shocks channeled through the energy prices. To reduce vulnerability, alternative sectors should be developed for international trade.
The implication of the findings of this study to stabilization policies is anchored on the fact that both crude oil and natural gas are the major sources of foreign exchange earnings for the development of the Russian economy. Consequently, energy prices affect government finances and monetary policy. Thus, monetary and fiscal policies should be cognizant of the interdependence between the energy prices and the economic policy uncertainty in Russia.
However, our study does not claim to be exhaustive on the theme under review. The incorporation of the post-COVID era, the current (2022) Russo–Ukrainian war, and using alternative advanced econometric settings are interesting extensions of this work.

Author Contributions

Conceptualization, A.A.; methodology, A.A.; software, A.A.; validation, S.H.R.; formal analysis, A.A.; investigation, A.A.; resources, S.H.R.; data curation, S.H.R.; writing—original draft preparation, H.G.; writing—review and editing, H.G.; visualization, H.G.; supervision, F.V.B. All authors have read and agreed to the published version of the manuscript.

Funding

This research did not receive any specific grant from funding agencies in the public, commercial, or not-for-profit sectors.

Data Availability Statement

Data for this study on EPU were sourced from http://www.policyuncertainty.com/. We obtained the data on the natural gas price and crude oil price from the British Petroleum (BP) Statistical Review of World Energy.

Acknowledgments

The authors’ gratitude is extended to the prospective editor(s) and reviewers that will/have spared time to guide toward a successful publication.

Conflicts of Interest

We declare that there are no potential conflicts of interest in the current study in any form.

References

  1. Baker, S.R.; Bloom, N.; Davis, S.J. Measuring economic policy uncertainty. Q. J. Econ. 2016, 131, 1593–1636. [Google Scholar] [CrossRef]
  2. IEA—International Energy Agency. Available online: https://www.iea.org (accessed on 19 March 2022).
  3. Shi, X.; Variam, H.M.P.; Shen, Y. Trans-ASEAN gas pipeline and ASEAN gas market integration: Insights from a scenario analysis. Energy Policy 2019, 132, 83–95. [Google Scholar] [CrossRef]
  4. EIA. Perspectives on the Development of LNG Market Hubs in the Asia Pacific Region; U.S. Energy Information Administration: Washington, DC, USA, 2017.
  5. BP Statistical Review of World Energy 2017. Available online: https://www.connaissancedesenergies.org/sites/default/files/pdf-actualites/bp-statistical-review-of-world-energy-2017-full-report.pdf (accessed on 19 March 2022).
  6. The World Factbook Archives. The World Factbook. 2018. Available online: https://www.cia.gov/the-world-factbook/about/archives (accessed on 19 March 2022).
  7. Bloom, N. The impact of uncertainty shocks. Econometrica 2009, 77, 623–685. [Google Scholar]
  8. Alexopoulos, M.; Cohen, J. Uncertain times, uncertain measures. Univ. Tor. Dep. Econ. Work. Pap. 2009, 352, 8. [Google Scholar]
  9. Baker, S.R.; Bloom, N.; Canes-Wrone, B.; Davis, S.J.; Rodden, J. Why has US policy uncertainty risen since 1960? Am. Econ. Rev. 2014, 104, 56–60. [Google Scholar] [CrossRef] [Green Version]
  10. Caggiano, G.; Castelnuovo, E.; Groshenny, N. Uncertainty Shocks and Unemployment Dynamics: An Analysis of Post-WWII US Recessions; Working Paper; Dipartimento di Scienze Economiche “Marco Fanno”: Padova, Italy, 2013. [Google Scholar]
  11. Leduc, S.; Liu, Z. Uncertainty shocks are aggregate demand shocks. J. Monet. Econ. 2016, 82, 20–35. [Google Scholar] [CrossRef] [Green Version]
  12. Aloui, R.; Gupta, R.; Miller, S.M. Uncertainty and crude oil returns. Energy Econ. 2016, 55, 92–100. [Google Scholar] [CrossRef] [Green Version]
  13. Chang, T.; Chen, W.Y.; Gupta, R.; Nguyen, D.K. Are stock prices related to the political uncertainty index in OECD countries? Evidence from the bootstrap panel causality test. Econ. Syst. 2015, 39, 288–300. [Google Scholar] [CrossRef] [Green Version]
  14. Chen, J.; Jin, F.; Ouyang, G.; Ouyang, J.; Wen, F. Oil price shocks, economic policy uncertainty and industrial economic growth in China. PLoS ONE 2019, 14, e0215397. [Google Scholar] [CrossRef]
  15. Jiang, Y.; Zhou, Z.; Liu, C. Does economic policy uncertainty matter for carbon emission? Evidence from US sector level data. Environ. Sci. Pollut. Res. 2019, 26, 24380–24394. [Google Scholar] [CrossRef]
  16. Converse, N. Uncertainty, capital flows, and maturity mismatch. J. Int. Money Financ. 2018, 88, 260–275. [Google Scholar] [CrossRef]
  17. Handley, K.; Limao, N. Trade and investment under policy uncertainty: Theory and firm evidence. Am. Econ. J. Econ. Policy 2015, 7, 189–222. [Google Scholar] [CrossRef] [Green Version]
  18. Rodrik, D. Policy uncertainty and private investment in developing countries. J. Dev. Econ. 1991, 36, 229–242. [Google Scholar] [CrossRef] [Green Version]
  19. Arouri, M.; Roubaud, D. On the determinants of stock market dynamics in emerging countries: The role of economic policy uncertainty in China and India. Econ. Bull. 2016, 36, 760–770. [Google Scholar]
  20. You, W.; Guo, Y.; Zhu, H.; Tang, Y. Oil price shocks, economic policy uncertainty and industry stock returns in China: Asymmetric effects with quantile regression. Energy Econ. 2017, 68, 1–18. [Google Scholar] [CrossRef]
  21. Kang, W.; Ratti, R.A.; Vespignani, J.L. Oil price shocks and policy uncertainty: New evidence on the effects of US and non-US oil production. Energy Econ. 2017, 66, 536–546. [Google Scholar] [CrossRef] [Green Version]
  22. Reboredo, J.C.; Uddin, G.S. Do financial stress and policy uncertainty have an impact on the energy and metals markets? A quantile regression approach. Int. Rev. Econ. Financ. 2016, 43, 284–298. [Google Scholar] [CrossRef]
  23. Degiannakis, S.; Filis, G.; Panagiotakopoulou, S. Oil price shocks and uncertainty: How stable is their relationship over time? Econ. Model. 2018, 72, 42–53. [Google Scholar] [CrossRef] [Green Version]
  24. Han, L.; Liu, Y.; Yin, L. Uncertainty and currency performance: A quantile-on-quantile approach. North. Am. J. Econ. Financ. 2019, 48, 702–729. [Google Scholar] [CrossRef]
  25. Akarca, A.T.; Long, T.V. On the relationship between energy and GNP: A reexamination. J. Energy Dev. 1980, 5, 326–331. [Google Scholar]
  26. Kraft, J.; Kraft, A. On the relationship between energy and GNP. J. Energy Dev. 1978, 3, 401–403. [Google Scholar]
  27. Proops, J.L. Modelling the energy-output ratio. Energy Econ. 1984, 6, 47–51. [Google Scholar] [CrossRef]
  28. Işik, C. Natural gas consumption and economic growth in Turkey: A bound test approach. Energy Syst. 2010, 1, 441–456. [Google Scholar] [CrossRef]
  29. Lim, H.-J.; Yoo, S.-H. Natural gas consumption and economic growth in Korea: A causality analysis. Energy Sources Part B Econ. Plan. Policy 2012, 7, 169–176. [Google Scholar] [CrossRef]
  30. Solarin, S.A.; Shahbaz, M. Natural gas consumption and economic growth: The role of foreign direct investment, capital formation and trade openness in Malaysia. Renew. Sustain. Energy Rev. 2015, 42, 835–845. [Google Scholar] [CrossRef] [Green Version]
  31. Rafindadi, A.A.; Ozturk, I. Natural gas consumption and economic growth nexus: Is the 10th Malaysian plan attainable within the limits of its resource? Renew. Sustain. Energy Rev. 2015, 49, 1221–1232. [Google Scholar] [CrossRef]
  32. Ozturk, I.; Al-Mulali, U. Natural gas consumption and economic growth nexus: Panel data analysis for GCC countries. Renew. Sustain. Energy Rev. 2015, 51, 998–1003. [Google Scholar] [CrossRef]
  33. Solarin, S.A.; Ozturk, I. The relationship between natural gas consumption and economic growth in OPEC members. Renew. Sustain. Energy Rev. 2016, 58, 1348–1356. [Google Scholar] [CrossRef]
  34. Hassan, M.S.; Tahir, M.N.; Wajid, A.; Mahmood, H.; Farooq, A. Natural gas consumption and economic growth in Pakistan: Production function approach. Glob. Bus. Rev. 2018, 19, 297–310. [Google Scholar] [CrossRef]
  35. Sinaga, O. The dynamic relationship between natural gas and economic growth: Evidence from Indonesia. Int. J. Energy Econ. Policy 2019, 9, 388–394. [Google Scholar] [CrossRef] [Green Version]
  36. Fadiran, G.; Adebusuyi, A.T.; Fadiran, D. Natural gas consumption and economic growth: Evidence from selected natural gas vehicle markets in Europe. Energy 2019, 169, 467–477. [Google Scholar] [CrossRef]
  37. Akadiri, A.C.; Akadiri, S.S.; Gungor, H. The role of natural gas consumption in Saudi Arabia’s output and its implication for trade and environmental quality. Energy Policy 2019, 129, 230–238. [Google Scholar] [CrossRef]
  38. Erdoğan, S.; Gedikli, A.; Kırca, M. A note on time-varying causality between natural gas consumption and economic growth in Turkey. Resour. Policy 2019, 64, 101504. [Google Scholar] [CrossRef]
  39. Liu, W.; Zhang, X.; Fan, J.; Li, Y.; Wang, L. Evaluation of potential for salt cavern gas storage and integration of brine extraction: Cavern utilization, Yangtze River Delta region. Nat. Resour. Res. 2020, 29, 3275–3290. [Google Scholar] [CrossRef]
  40. Van Robays, I. Macroeconomic uncertainty and oil price volatility. Oxf. Bull. Econ. Stat. 2016, 78, 671–693. [Google Scholar] [CrossRef]
  41. Litzenberger, R.H.; Rabinowitz, N. Backwardation in oil futures markets: Theory and empirical evidence. J. Financ. 1995, 50, 1517–1545. [Google Scholar] [CrossRef]
  42. Kilian, L. Not all oil price shocks are alike: Disentangling demand and supply shocks in the crude oil market. Am. Econ. Rev. 2009, 99, 1053–1069. [Google Scholar] [CrossRef] [Green Version]
  43. Hailemariam, A.; Smyth, R.; Zhang, X. Oil prices and economic policy uncertainty: Evidence from a nonparametric panel data model. Energy Econ. 2019, 83, 40–51. [Google Scholar] [CrossRef]
  44. Lin, B.; Bai, R. Oil prices and economic policy uncertainty: Evidence from global, oil importers, and exporters’ perspective. Res. Int. Bus. Financ. 2021, 56, 101357. [Google Scholar] [CrossRef]
  45. Chen, X.; Sun, X.; Li, J. How does economic policy uncertainty react to oil price shocks? A multi-scale perspective. Appl. Econ. Lett. 2020, 27, 188–193. [Google Scholar] [CrossRef]
  46. Caporin, M.; Fontini, F. The long-run oil–natural gas price relationship and the shale gas revolution. Energy Econ. 2017, 64, 511–519. [Google Scholar] [CrossRef] [Green Version]
  47. Ramberg, D.J.; Parsons, J.E. The weak tie between natural gas and oil prices. Energy J. 2012, 33. [Google Scholar] [CrossRef] [Green Version]
  48. Brown, S.P.; Yucel, M.K. What drives natural gas prices? Energy J. 2008, 29, 45–60. [Google Scholar] [CrossRef] [Green Version]
  49. Wang, T.; Zhang, D.; Ji, Q.; Shi, X. Market reforms and determinants of import natural gas prices in China. Energy 2020, 196, 117105. [Google Scholar] [CrossRef]
  50. Olanipekun, I.; Olasehinde-Williams, G.; Akadiri, S.S. Gasoline prices and economic policy uncertainty: What causes what, and why does it matter? Evidence from 18 selected countries. Environ. Sci. Pollut. Res. 2019, 26, 15187–15193. [Google Scholar] [CrossRef] [PubMed]
  51. Scarcioffolo, A.R.; Etienne, X.L. Regime-switching energy price volatility: The role of economic policy uncertainty. Int. Rev. Econ. Financ. 2021, 76, 336–356. [Google Scholar] [CrossRef]
  52. Dash, S.R.; Maitra, D. Do oil and gas prices influence economic policy uncertainty differently: Multi-country evidence using time-frequency approach. Q. Rev. Econ. Financ. 2021, 81, 397–420. [Google Scholar] [CrossRef]
  53. Energy Information Administration 2018. Federal Register Recent Federal Regulation Documents. Justia Regulation Tracker. Available online: https://regulations.justia.com/regulations/fedreg/agencies/energy-information-administration/2018 (accessed on 19 March 2022).
  54. Antonakakis, N.; Chatziantoniou, I.; Filis, G. Dynamic spillovers of oil price shocks and economic policy uncertainty. Energy Econ. 2014, 44, 433–447. [Google Scholar] [CrossRef] [Green Version]
  55. Bollerslev, T. Modelling the coherence in short-run nominal exchange rates: A multivariate generalized ARCH model. Rev. Econ. Stat. 1990, 72, 498–505. [Google Scholar] [CrossRef]
  56. Nelson, D.B. Conditional heteroskedasticity in asset returns: A new approach. Econom. J. Econom. Soc. 1991, 59, 347–370. [Google Scholar] [CrossRef]
  57. Engle, R. Dynamic conditional correlation: A simple class of multivariate generalized autoregressive conditional heteroskedasticity models. J. Bus. Econ. Stat. 2002, 20, 339–350. [Google Scholar] [CrossRef]
  58. Tse, Y.K.; Tsui, A.K.C. A multivariate generalized autoregressive conditional heteroscedasticity model with time-varying correlations. J. Bus. Econ. Stat. 2002, 20, 351–362. [Google Scholar] [CrossRef]
  59. Ali, F.; Jiang, Y.; Sensoy, A. Downside risk in Dow Jones Islamic equity indices: Precious metals and portfolio diversification before and after the COVID-19 bear market. Res. Int. Bus. Financ. 2021, 58, 101502. [Google Scholar] [CrossRef]
  60. Botshekan, M.H.; Takaloo, A.; Abdollahi Poor, M.S. Global Economic Policy Uncertainty (GEPU) and Non-Performing Loans (NPL) in Iran’s Banking System: Dynamic Correlation using the DCC-GARCH Approach. J. Money Econ. 2021, 16, 187–212. [Google Scholar] [CrossRef]
  61. Ghosh, R.; Bagchi, B.; Chatterjee, S. The effect of economic policy uncertainty index on the Indian economy in the wake of COVID-19 pandemic. J. Econ. Adm. Sci. 2022. [Google Scholar] [CrossRef]
  62. Nguyen, T.N.; Phan, T.K.; Nguyen, T.L. Financial contagion during global financial crisis and covid–19 pandemic: The evidence from DCC–GARCH model. Cogent Econ. Financ. 2022, 10, 2051824. [Google Scholar] [CrossRef]
  63. Hung, N.T. Directional spillover effects between BRICS stock markets and economic policy uncertainty. Asia-Pac. Financ. Mark. 2021, 28, 429–448. [Google Scholar] [CrossRef]
  64. Afzal, F.; Haiying, P.; Afzal, F.; Mahmood, A.; Ikram, A. Value-at-risk analysis for measuring stochastic volatility of stock returns: Using GARCH-based dynamic conditional correlation model. SAGE Open 2021, 11, 21582440211005758. [Google Scholar] [CrossRef]
  65. Qian, P.Y.; Diaz, J.F. Volatility integration of global stock markets with the Malaysian stock market: A Multivariate GARCH approach. Malays. J. Econ. Stud. 2017, 54, 83–117. [Google Scholar] [CrossRef] [Green Version]
  66. Aielli, G. Consistent Estimation of Large Scale Dynamic Conditional Correlations; Working Paper, No. 47; Department of Economics, Statistics, Mathematics and Sociology, University of Messina: Messina, Italy, 2008. [Google Scholar]
  67. Aielli, G.P. Dynamic conditional correlation: On properties and estimation. J. Bus. Econ. Stat. 2013, 31, 282–299. [Google Scholar] [CrossRef]
  68. Davis, S.J. An Index of Global Economic Policy Uncertainty; National Bureau of Economic Research: Cambridge, MA, USA, 2016. [Google Scholar]
  69. International Energy Agency Global Energy. CO2 Status Report 2018; International Energy Agency: Paris, France, 2019; p. 562. [Google Scholar]
  70. Alberini, A.; Khymych, O.; Ščasný, M. Estimating Energy Price Elasticities when Salience is High: Residential Natural Gas Demand in Ukraine. 2019. Available online: https://ssrn.com/abstract=3357039 (accessed on 19 March 2022).
  71. Krichene, N. World crude oil and natural gas: A demand and supply model. Energy Econ. 2002, 24, 557–576. [Google Scholar] [CrossRef]
  72. Liddle, B.; Smyth, R.; Zhang, X. Time-varying income and price elasticities for energy demand: Evidence from a middle-income panel. Energy Econ. 2020, 86, 104681. [Google Scholar] [CrossRef]
  73. Liu, B.-C. Natural gas price elasticities: Variations by region and by sector in the USA. Energy Econ. 1983, 5, 195–201. [Google Scholar] [CrossRef]
  74. Rajabi, M.M.; Mousavi, M. Estimating Industrial Natural Gas Demand Elasticities in Selected OECD Countries. Energy Econ. Lett. 2019, 6, 52–65. [Google Scholar] [CrossRef] [Green Version]
  75. Abdulkareem, A.; Abdulkareem, K.A. Analysing oil price-macroeconomic volatility in Nigeria. CBN J. Appl. Stat. 2016, 7, 1. [Google Scholar]
Figure 1. Dynamics of the monthly Russian economic policy uncertainty and energy prices and their returns.
Energies 15 03712 g001
Figure 2. cDCC-EGARCH dynamic conditional correlations between Russian economic policy uncertainty and energy prices.
Energies 15 03712 g002
Figure 3. Conditional covariance of Russian economic policy uncertainty and energy prices.
Energies 15 03712 g003
Figure 4. Conditional volatilities of Russian economic policy uncertainty and energy prices.
Energies 15 03712 g004
Table 1. Descriptive statistics.
StatisticsNGPRICEOILPRICEREPURNGPRICEROILPRICERETREPU
Mean4.06510951.81644133.6251−8.86 × 10−50.004430−0.001961
Median3.33200048.47500109.4615−0.0039310.0148700.000306
Maximum13.45400133.8800431.24700.4063940.2138661.752550
Minimum1.42600011.3500012.39880−0.395570−0.331980−2.085580
Std. Dev.2.21814029.2983785.640580.1189190.0829890.640805
Skewness1.5963810.5153470.9903610.058617−0.727490−0.230170
Kurtosis5.9530502.2183253.5608603.7270844.4587163.424390
Jarque–Bera245.885021.7535155.091697.05113555.182615.096266
Probability0.0000000.0000190.0000000.0294350.0000000.078228
Observation312312312312312312
ARCH test F-stat19.84180
[0.0000]
106.5145
[0.0000]
19.40484
[0.0000]
3.564416
[0.0295]
16.54563
[0.0001]
6.900444
[0.0090]
Q-stat (5)11.249
[0.047]
58.995
[0.000]
25.186
[0.000]
13.952
[0.016]
20.417
[0.001]
39.746
[0.000]
Q-stat (10)33.085
[0.000]
79.183
[0.000]
44.175
[0.000]
39.372
[0.000]
27.316
[0.002]
45.093
[0.000]
Q-square stat (5)54.203
[0.000]
162.03
[0.000]
11.385
[0.044]
5.8527
[0.321]
62.934
[0.000]
16.442
[0.006]
Q-square stat (10)62.140
[0.000]
183.07
[0.000]
35.492
[0.000]
16.965
[0.075]
71.956
[0.000]
28.048
[0.002]
Correlation
VariablesREPUOILPRICENGPRICERETREPURNGPRICEROILPRICE
REPU1.000000
OILPRICE0.1842831.000000
NGPRICE−0.2216940.4269651.000000
RETREPU0.3660660.0197460.0193611.000000
RNGPRICE−0.001555−0.0073100.1277000.0716481.000000
ROILPRICE−0.0632960.0367090.0175970.0145540.2271601.000000
REPU = Russian economic policy uncertainty index, NGPRICE= Hub Natural Gas Spot Price (Dollars per Million British thermal units-Btu), OILPRICE = WTI crude oil spot price. RETREPU, RNGPRICE, and ROILPRICE are the returns of the three variables, respectively. [ ] denotes p-values.
Table 2. Results of unit root tests.
Philips–Perron (PP) Test
At LevelsAt First Difference
VariablesConstant OnlyConstant and TrendNoneConstant OnlyConstant and TrendNone
NGPRICE−2.83 *−2.7921−1.2607−15.207 ***−15.21 ***−15.24 ***
OILPRICE−1.7037−2.1123−0.3741−11.835 ***−11.821 ***−11.849 ***
REPU−10.646 ***−11.982 ***−3.7897 ***−57.925 ***−64.172 ***−58.074 ***
RETREPU−64.686 ***−74.446 ***−64.945 ***−273.68 ***−289.64 ***−275.47 ***
RNGPRICE−14.763 ***−14.769 ***−14.79 ***−218.43 ***−228.63 ***−208.79 ***
ROILPRICE−13.481 ***−13.478 ***−13.478 ***−110.03 ***−109.72 ***−110.36 ***
Augmented Dickey–Fuller (ADF) Test
At LevelsAt First Difference
VariablesConstant OnlyConstant and TrendNoneConstant OnlyConstant and TrendNone
NGPRICE−3.0156 **−2.9825−1.4242−15.211 ***−15.199 ***−15.236 ***
OILPRICE−2.3086−2.7655−0.797−11.959 ***−11.948 ***−11.969 ***
REPU−3.1648 **−4.1277 ***−1.2093−16.859 ***−16.852 ***−16.883 ***
RETREPU−13.333 ***−13.33 ***−13.354 ***−10.902 ***−10.888 ***−10.92 ***
RNGPRICE−14.931 ***−14.929 ***−14.955 ***−14.586 ***−14.562 ***−14.61 ***
ROILPRICE−13.531 ***−13.535 ***−13.521 ***−14.026 ***−14.003 ***−14.049 ***
REPU = Russian economic policy uncertainty index, NGPRICE = Hub Natural Gas Spot Price (Dollars per Million British thermal units-Btu), OILPRICE = WTI crude oil spot price. RETREPU, RNGPRICE, and ROILPRICE are the returns of the three variables respectively, while *, **, and *** denote 10%, 5%, and 1% levels of significance respectively.
Table 3. Estimates of univariate GARCH models.
VariablesRETREPURNGPRICEROILPRICE
GARCH (1 1)EGARCH (1 1)GARCH (1 1)EGARCH (1 1)GARCH (1 1)EGARCH (1 1)
Mean Equation(1)(2)(3)(4)(5)(6)
Constant0.003682 ***
(0.005022)
0.005423 ***
(10.27708)
0.000118
(0.008645)
0.000229
(0.007496)
0.008146
(0.005442)
0.004231
(0.005942)
AR(1)0.228962 ***
(0.071739)
0.888478 ***
(0.028238)
−0.100183
(0.393264)
0.030043
(0.295992)
0.117236
(0.401839)
0.152843
(0.212180)
MA(1)−0.892361 ***
(0.030796)
−0.525341 ***
(0.060544)
0.292273
(0.352461)
0.157007
(0.288022)
0.046553
(0.406734)
0.079883
(0.216916)
Variance Equation
Constant20.76495
(24.18403)
0.274471 ***
(0.036473)
0.000614 **
(0.000271)
−0.162429
(0.097178)
0.001234
(0.000849)
−5.451003
(0.938869)
ARCH (1)0.068362 ***
(0.024425)
−0.082649 **
(0.042059)
0.048252 **
(0.020599)
0.097178
(0.020578)
0.138586 **
(0.064689)
0.034451
(0.143900)
GARCH(1)0.931601 ***
(0.023587)
0.974469 ***
(1.75×10−08)
0.929866 ***
(0.019528)
0.965722 ***
(0.019639)
0.666913 ***
(0.177427)
−0.057089 **
(0.187108)
Asymmetry (1) 0.127181 ***
(0.021918)
0.080962 **
(0.036552)
−0.354448 ***
(0.098668)
Diagnostic Test
SIC1.6295971.616514−1.187886−1.367125−2.146591−2.149523
ARCH Test
F-statistics0.223352
[0.6368]
0.010984
[0.9166]
0.008300
[0.9275]
0.006366
[0.9365]
0.283098
[0.5951]
1.024421
[0.3123]
nR20.224640
[0.6355]
0.011054
[0.9163]
0.008354
[0.9272]
0.006408
[0.9362]
0.284675
[0.5937]
1.027655
[0.3107]
p values are in square brackets [ ], while **, and *** denote 5%, and 1% levels of significance, respectively.
Table 4. Parameter estimates of MGARCH models.
Symmetric Model [GARCH]Asymmetric Model [EGARCH]
VariablesDCC ModelcDCC ModelDCC ModelcDCC Model
RETREPU vs. RNGPRICE0.1189 **
[0.0468]
0.1178 **
[0.0464]
0.1226 *
[0.0613]
0.12048 *
[0.0608]
RETREPU vs. OILPRICE0.0098
[0.8768]
0.011240
[0.8569]
0.0067
[0.9234]
0.009536
[0.8903]
OILPRICE vs. RNGPRICE0.2833 ***
[0.0001]
0.2829 ***
[0.0000]
0.3148 ***
[0.0000]
0.3136 ***
[0.0000]
Alfa (α)0.0470 ***
[0.0002]
0.04603 *
[0.0527]
0.0720 **
[0.0281]
0.0749 **
[0.0331]
Beta (β)0.6008 ***
[0.0001]
0.5726 ***
[0.0013]
0.6236 ***
[0.0000]
0.5966 ***
[0.0000]
Log-likelihood357.135357.057306.769306.755
p values are in square brackets [ ], while *, **, and *** denote 10%, 5%, and 1% levels of significance, respectively.
Publisher’s Note: MDPI stays neutral with regard to jurisdictional claims in published maps and institutional affiliations.

