Article

Impact of Window Frames on Annual Energy Consumption of Residential Buildings and Its Contribution to CO2 Emission Reductions at the City Scale

1
Faculty of Human-Environment Studies, Kyushu University, 744 Motooka Nishi-ku, Fukuoka 819-0395, Japan
2
Department of Architecture, Chungbuk National University, 1 Chungdae-ro, Cheongju 28644, Korea
*
Author to whom correspondence should be addressed.
Energies 2022, 15(10), 3692; https://doi.org/10.3390/en15103692
Submission received: 15 April 2022 / Revised: 14 May 2022 / Accepted: 17 May 2022 / Published: 18 May 2022
(This article belongs to the Topic Building Energy and Environment)

Abstract

:
Windows are among building components that have the strongest effect on thermal load. They play a significant role in heat loss in buildings because they usually have a largely higher thermal conductance than other components of the building envelope. Although many studies have highlighted the relevance of heat transfer through frames and aimed to improve their thermal performance, poorly insulated aluminum frames (thermal conductivity of aluminum is 160 W/m·K, while that of polyvinyl chloride [PVC] is 0.17 W/m·K) are still in use in Japan. Therefore, the U-values of different window frames were calculated, and annual thermal loads were calculated according to the window configurations, including the frame, glazing, and cavity. We focused on standard residential buildings in Japan with a total floor area of 120.6 m2 (two-story building), and the number of newly built houses and the application rate of window configurations in 2019 were surveyed to estimate the CO2 emissions by regions. CO2 emissions were reduced by approximately 3.98–6.58% with the application of PVC frames. Furthermore, CO2 emissions were converted into the amount of CO2 gas absorbed by cedar trees, which cover nearly 18% of the total land area of Japan. In conclusion, analogous to the amount of CO2 gas absorbed by cedar trees, the absorption effect was equivalent to 327,743–564,416 cedar trees. Changing the window frame material can facilitate a significant energy-saving effect as a considerable amount of energy is saved, especially at a city scale.

1. Introduction

A recent publication by the Intergovernmental Panel on Climate Change [1] indicated that the largest growth in carbon emissions originates from electricity generation, transport, industry, and building operations. The building sector accounts for approximately 40% of the total energy consumption in many countries; this indicates the importance of minimizing energy consumption in this industry [2,3].
Windows are typically responsible for a large fraction of heat loss in buildings because of the large differences between their thermal transmittance values (U-value) and other building components [3,4,5,6]. However, windows can contribute to heating via solar energy transmitted through glazing. Window frames cover a relatively small fraction of the entire building’s surface; however, they can be responsible for a major part of heat loss depending on their insulation properties (compared to those of other elements of the building envelope) and solar transmittance [5,6]. However, although significant improvements have been made in designing highly insulating window frames [3,6,7,8,9,10], poorly insulated aluminum frames are still in use in many regions worldwide [11,12]. The thermal conductivity of aluminum is 160 W/m·K, while that of polyvinyl chloride (PVC) is 0.17 W/m·K.
In Japan, as of 2020, the application frequencies of relatively poorly insulated aluminum frames and composite frames (polyvinyl chloride with aluminum) were 10.1% and 67.5%, respectively [13]. The installation rate of PVC frames was 10% in 2013 and increased to 16.5% and 22.5% in 2016 and 2020, respectively [13,14]. This implies that PVC frames have been applied rapidly in the Japanese construction industry in recent years. However, given that PVC frames are applied to more than 50% of buildings in America and Europe [15], the insulation level of window frames in Japan remains low, which attracted our attention. In many countries, including Japan, the thermal performance of window frames can be significantly improved, which warrants additional research. Therefore, it is necessary to quantify the effect of significant efforts to increase the thermal performance of window configurations—an ongoing trend in Japan and around the world—on the annual energy consumption and CO2 emissions in the building sector. In addition, to evaluate the effect of improving the thermal performance of window frames nationwide, the energy-saving effect of window configurations should be quantified at the city scale and not at the scale of single residential buildings.
Although many studies have highlighted the relevance of heat transfer through frames with the aim of improving the thermal performance of frames, research on the impact of a typical frame material (e.g., aluminum frame, PVC frame, and aluminum–PVC composite frame) on the overall thermal performance of residential buildings or its impact on the energy consumption reduction rate at the city scale is lacking. Few studies have evaluated the impact of typical frames on the building’s energy performance [16,17]. Certain investigations have focused on using low-conductivity materials to reduce the thermal transmittance of the frame and minimize the additional heat loss caused by glazing and spacer systems [15]. Appelfeld et al. [6] used three novel designs of thin glass fiber-reinforced polyester frames to calculate the impact of replacing aluminum frames without thermal breaks on the energy consumption of an office building. They found that the optimal design could reduce total energy consumption by 6.5 kWh/m2 per year (almost 20%). However, the window design proposed in their study included the lately developed uncommon frame. Moreover, existing investigations have focused on single buildings; the embodied impacts of typical window frames on the annual energy consumption at the city scale have been overlooked.
The objectives of this study were (1) to identify the impact of differences in the frame material on the heating and cooling energy consumption of residential buildings, (2) quantify the energy-saving impact of the application of highly insulated frames for new residential buildings in various regions in Japan at the city scale, and (3) discuss the feasibility of national countermeasures to minimize the CO2 emission rate by improving the thermal insulation level of window frames.
This paper is structured as follows. In Section 2, the methodology and research process for analyzing the impact of the frame material on the annual energy consumption, heating and cooling, and CO2 emission rates are presented. In Section 3, the simulation configurations used to determine the U-values of the frames and the simulated results are presented. In Section 4, the impact of the window frame on the building’s annual energy consumption and the energy conversion to CO2 emissions at the city scale are analyzed. Finally, Section 5 summarizes the key findings of this study.

2. Methodology

To achieve the goals of sustainability, a multi-disciplinary approach covering a number of features in the whole life cycle assessment phase, which includes the manufacturing phase, use phase, and demolition phase, is required [18]. However, energy consumption on operating accounts for approximately 80–90% of total life cycle energy [19]. Therefore, in this study, energy consumption during the operation stage due to different window frames have been discussed. The thermal properties of window frames based on their material and effect on annual energy consumption and CO2 emissions at the city scale were calculated in three steps: (1) calculation of the U-value of the frame by material, (2) quantification of the annual energy consumption with the application of different window frames, and (3) conversion of the effect of different window frames on energy consumption and CO2 emission rate into the city scale. The three steps of the research methodology are explained in the following subsections.

2.1. Step 1: U-Value of the Frame

In the first step, we calculated the U-values of the frames based on the material. U-values were obtained using a simulation program called THERB for HAM [20], which was originally an unsteady computational simulation tool for evaluating the thermal environment of buildings. This software has been validated through standardized tests in Japan, such as the building energy simulation test procedure [21]. For the user-selectable option, THERB for HAM can simulate highly precise heat transfer through the building envelope using two-dimensional analysis based on the finite element method under unsteady-state conditions. The U-values of the frames were calculated using the method recommended in ISO 10077-2 [22]. The method is based on using a highly insulated panel that substitutes glazing and eliminates the effect of the thermal bridge using the glazing spacer [6,22].

2.2. Step 2: Impact of Window Frame on Building Thermal Load, Energy Consumption, and CO2 Emissions

Based on the U-value of the frame calculated in Step 1, the effect of the material change in the frame on the annual building thermal load was evaluated. THERB for HAM was used to evaluate the thermal load of the target buildings.
The annual thermal load of the target residential building was calculated and converted into energy consumption in terms of electricity and CO2 emission rate to determine the energy-saving effect based on the window configurations. The annual performance factor (APF) was used to convert the thermal load into energy consumption. The power consumption was calculated by dividing the thermal load by APF. APF was set at 5.8, which is the median value of the basic statistics on the sales performance of home appliances [23].
The CO2 emission rate can be calculated by multiplying the power consumption by the CO2 emission factor. For the CO2 emission factor, the values of the local power company by region were sourced from the Ministry of the Environment [24].

2.3. Step 3: Impact of Window Frame on CO2 Emissions at City Scale

To quantify the CO2 emission rates according to the application of window combinations (including glazing, cavity, and frame) by region, data analysis was performed on the application rate of window combinations according to region and the number of newly built houses.
According to energy conservation standards [23], Japan is divided into eight regions. In this study, to analyze the effect of window frame materials on energy saving at the city scale, seven regions with thermal insulation regulations were selected [25]. One city was selected from each of the seven regions; Asahikawa, Sapporo, Morioka, Nagano, Toyama, Tokyo, and Fukuoka were selected as sample cities in regions 1 to 7, respectively.
Table 1 shows the frequency of window frame applications according to region [13] and the number of newly built households (last column) [26] in 2019. Frames can be fabricated using a variety of materials [27], but most installed window frames in Japan are made of aluminum, PVC, and composites of aluminum and PVC [13]. The application frequency of the PVC frame in the cold regions (regions 1 and 2) was approximately 99.00%, as shown in Table 1. However, the nationwide adoption rate of PVC frames in Japan was only 23.47%. The frequency of adoption of aluminum frames in window configuration is still quite high in Japan. In this study, wooden frames were excluded from the analysis because wooden frames are rarely used in houses in Japan [13].
A total of 151,569 newly built residential buildings were investigated in this study. Region 6, which includes cities with high population densities, such as Tokyo, had the highest number of newly built households, accounting for approximately 72.6% of the total.
The number of new households surveyed in this study (151,569) was approximately 17.2% of the total number of newly constructed households in Japan [28]. Therefore, the results of this study represent approximately 17% of the energy consumption of the entire residential building sector in Japan, which has considerable research significance.

3. Simulation for U-Value of the Frame (Step 1)

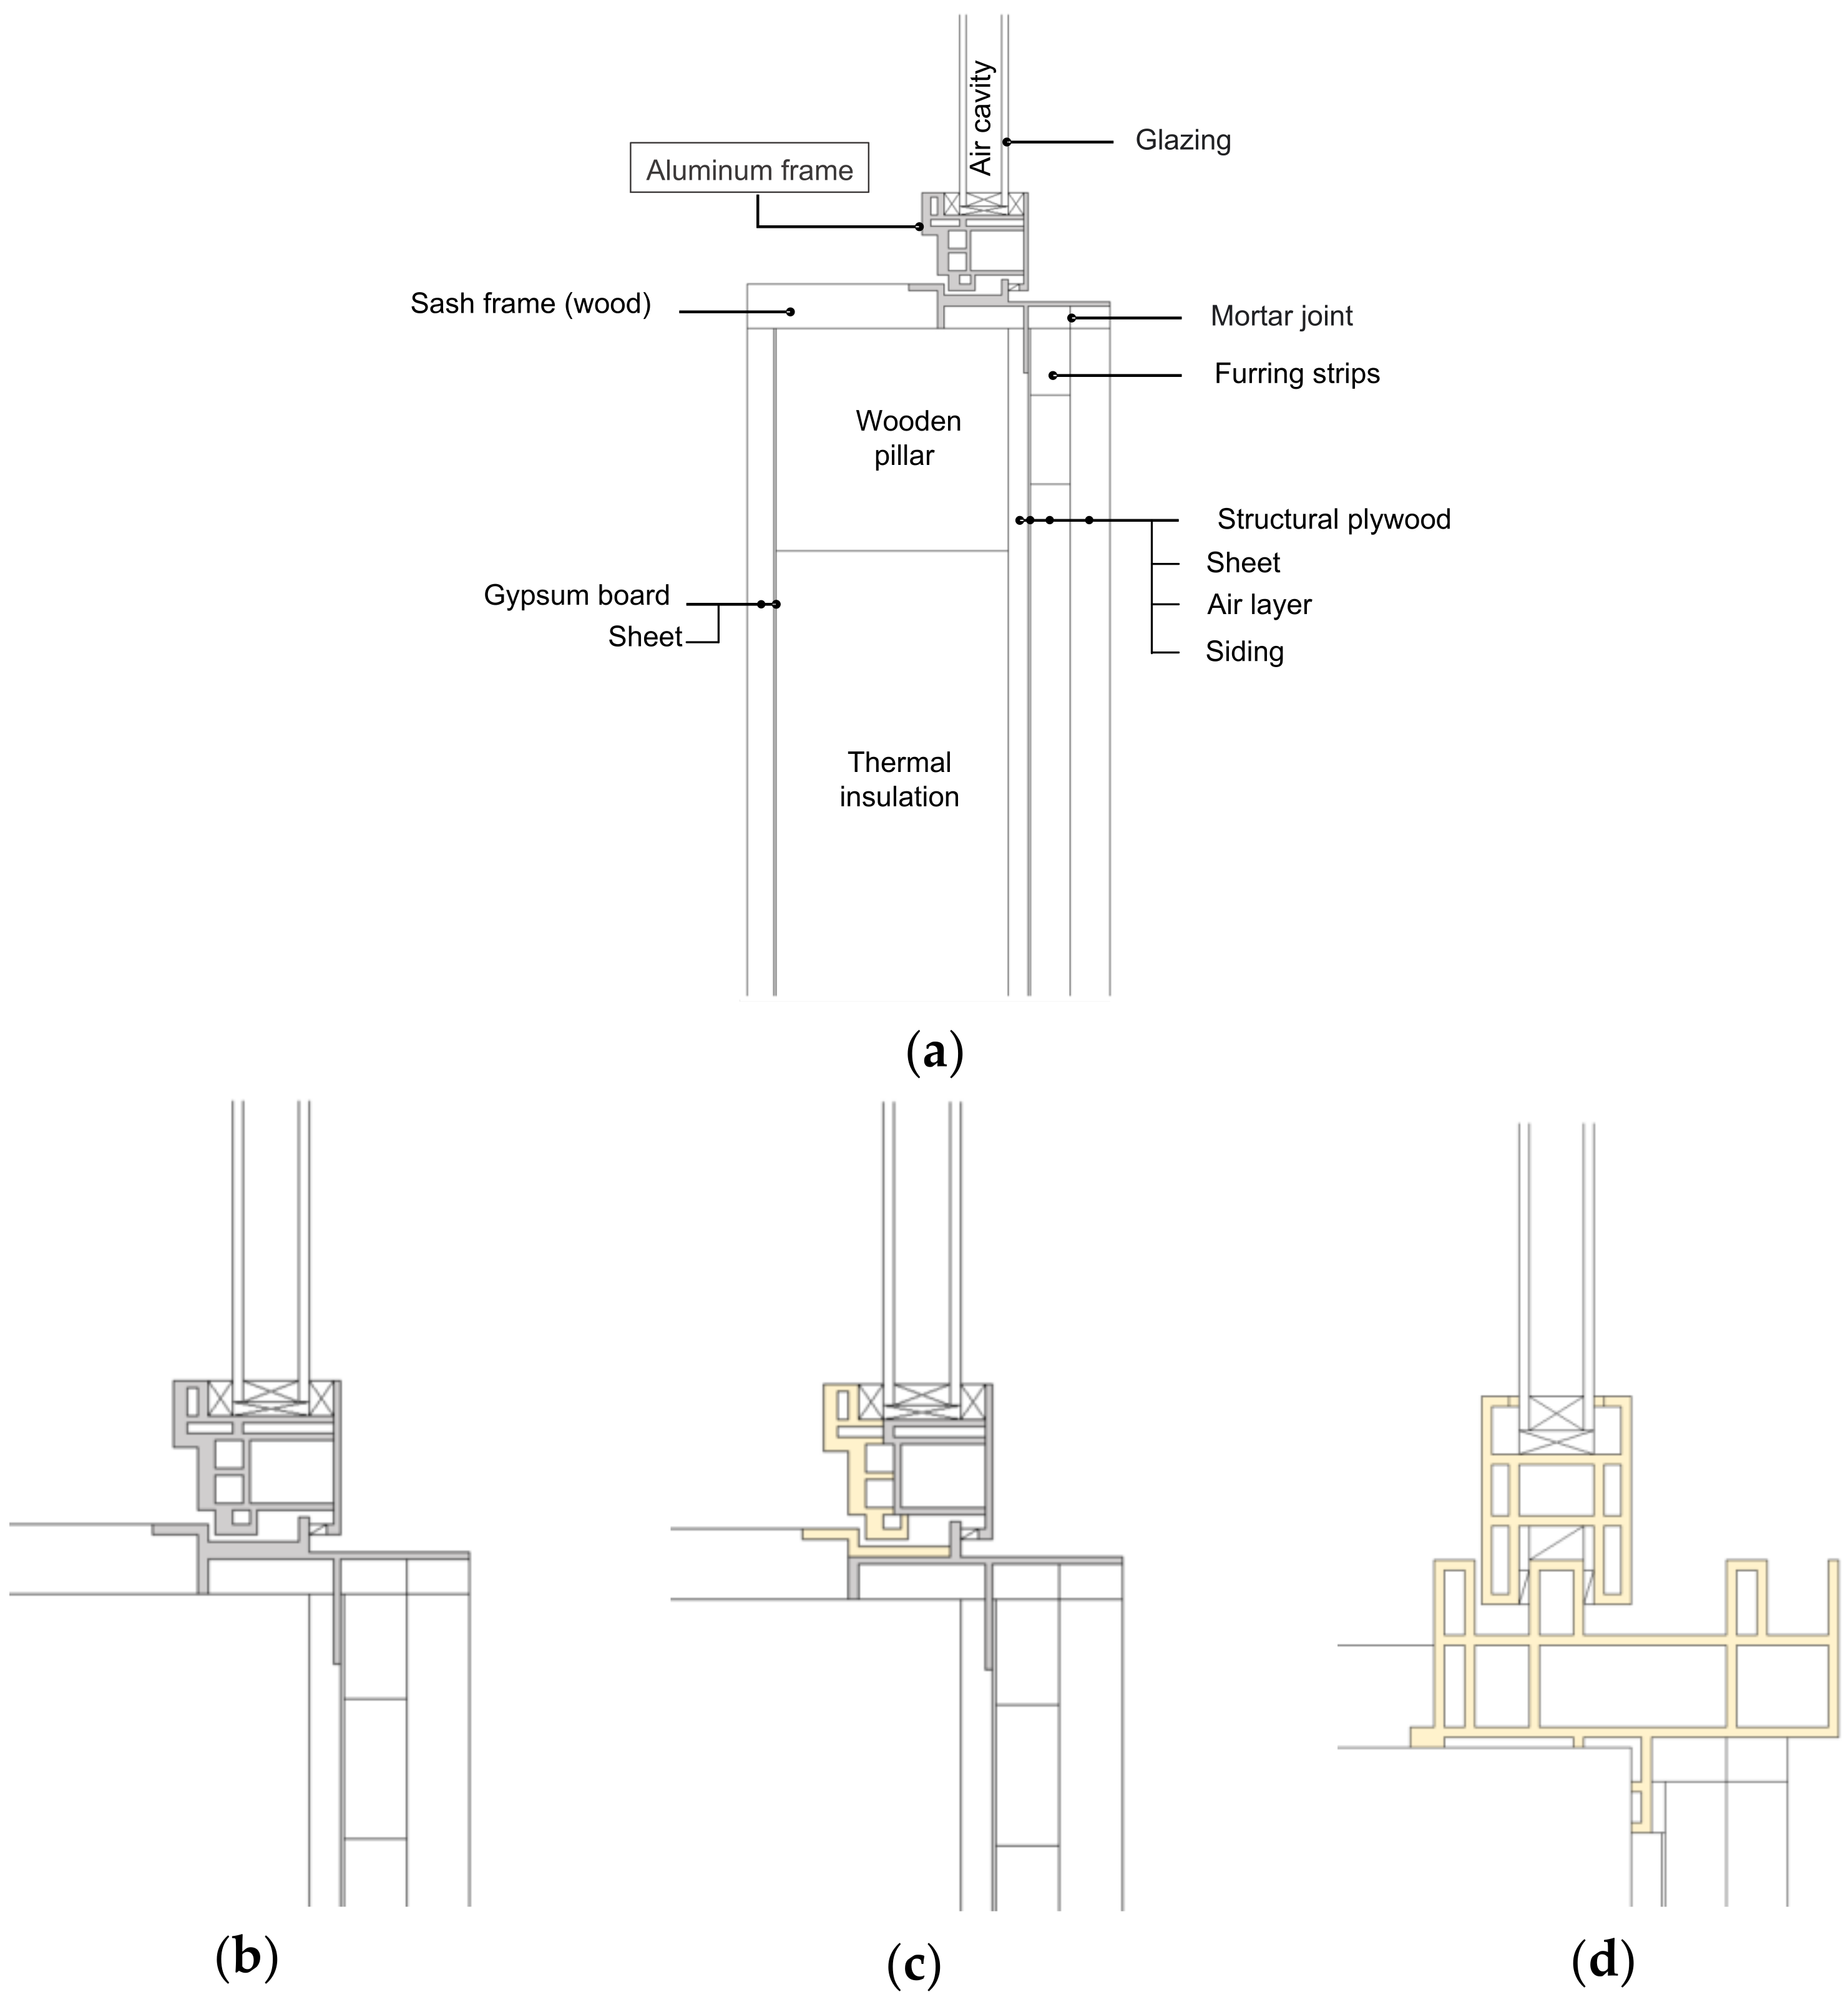
3.1. Description of the Examined Window Configurations

Figure 1 shows a representative cross-section for each window frame. In this study, PVC, composite (PVC and aluminum), and aluminum frames were selected for analysis. The geometry of each frame is that of a typical window frame in Japan. The width of the frame varied depending on the frame material. The width of the PVC frame was 103 mm, and the widths of the composite and aluminum frames were 61 mm.
Glazing was configured in the same manner; the windows were double-glazed with a low-e coating and filled with air to a thickness of 16 mm. The PVC frame was set as white, and the composite and aluminum frames were gray to ensure that solar absorption rates were uniform among the frame materials. The effect of the frame material only on thermal performance was analyzed.

3.2. Simulation Conditions

This section presents the simulation conditions used to calculate the U-values of the frames. The temperature distribution was determined by calculating the two-dimensional heat transfer for the cross-sectional models. The thermal transmittance rates for all frame materials were calculated and compared according to the temperature distribution. The input conditions and material properties were based on ISO 1007-2 [22]. The indoor and outdoor temperatures were fixed at 20 °C and 0 °C, respectively, and the calculation was performed until a steady-state was achieved in the absence of external solar radiation and wind speed. The thermal conductivity of the window cavities was calculated in terms of the equivalent thermal conductivity according to ISO 1007-2 [22]. The thermal conductivity values of the frames were set as 0.17 W/(m·K) for PVC-Hard and 160 W/(m·K) for aluminum. The densities of the frames were set as 1390 kg/m3 for PVC-Hard and 2800 kg/m3 for aluminum.

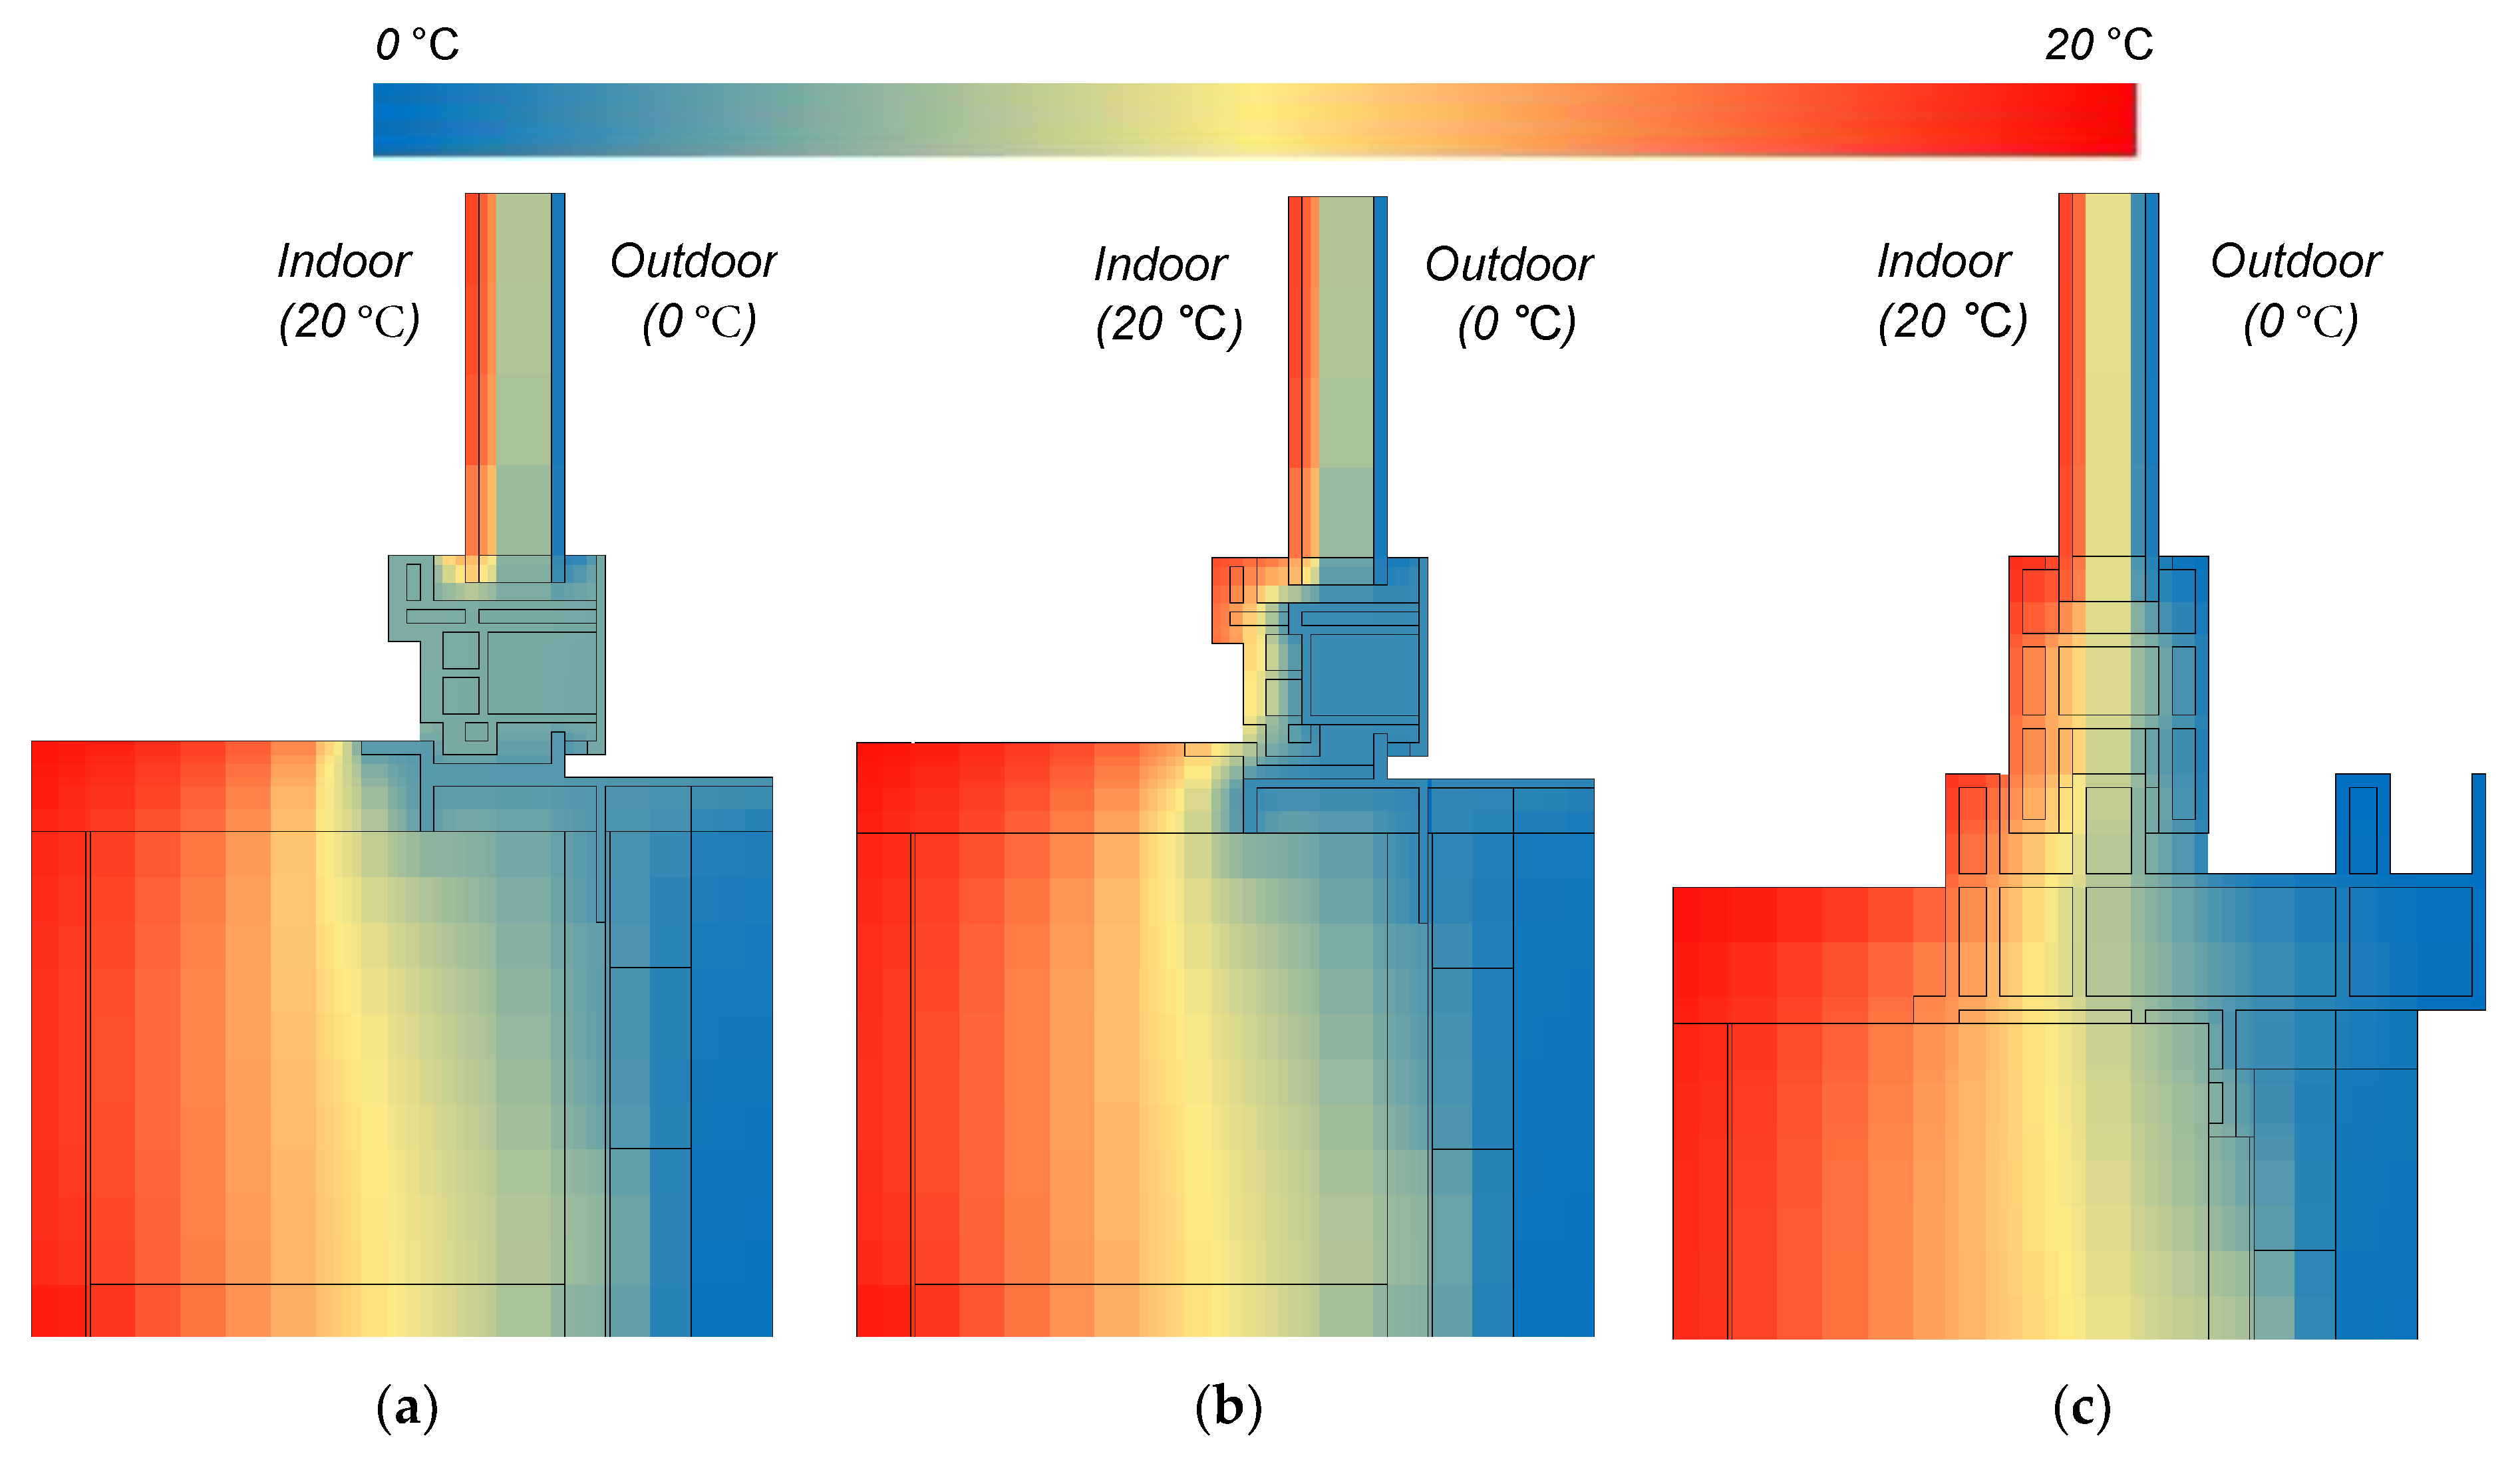
3.3. Simulation Results: U-Value of Frames

Figure 2 shows the calculated temperature distributions for each reference frame. The indoor surface temperature of the frame was maintained at its highest value in the PVC frame (Figure 2c), followed by that of the composite (Figure 2b) and aluminum frames (Figure 2a). Additionally, the temperature distribution of the PVC frame was clearly divided between the indoor and outdoor sectors. However, low temperature values were distributed almost uniformly throughout the aluminum frame. Therefore, the PVC frame exhibits the lowest heat loss due to transmission, and the aluminum frame exhibits the highest heat loss. In conclusion, the thermal conductivity values of the PVC, composite, and aluminum frames were 1.88 W/m2·K, 5.32 W/m2·K, and 8.78 W/m2·K, respectively.

4. Impact of the Window Frame on Annual Building Thermal Load, Energy Consumption, and CO2 Emissions (Steps 2 and 3)

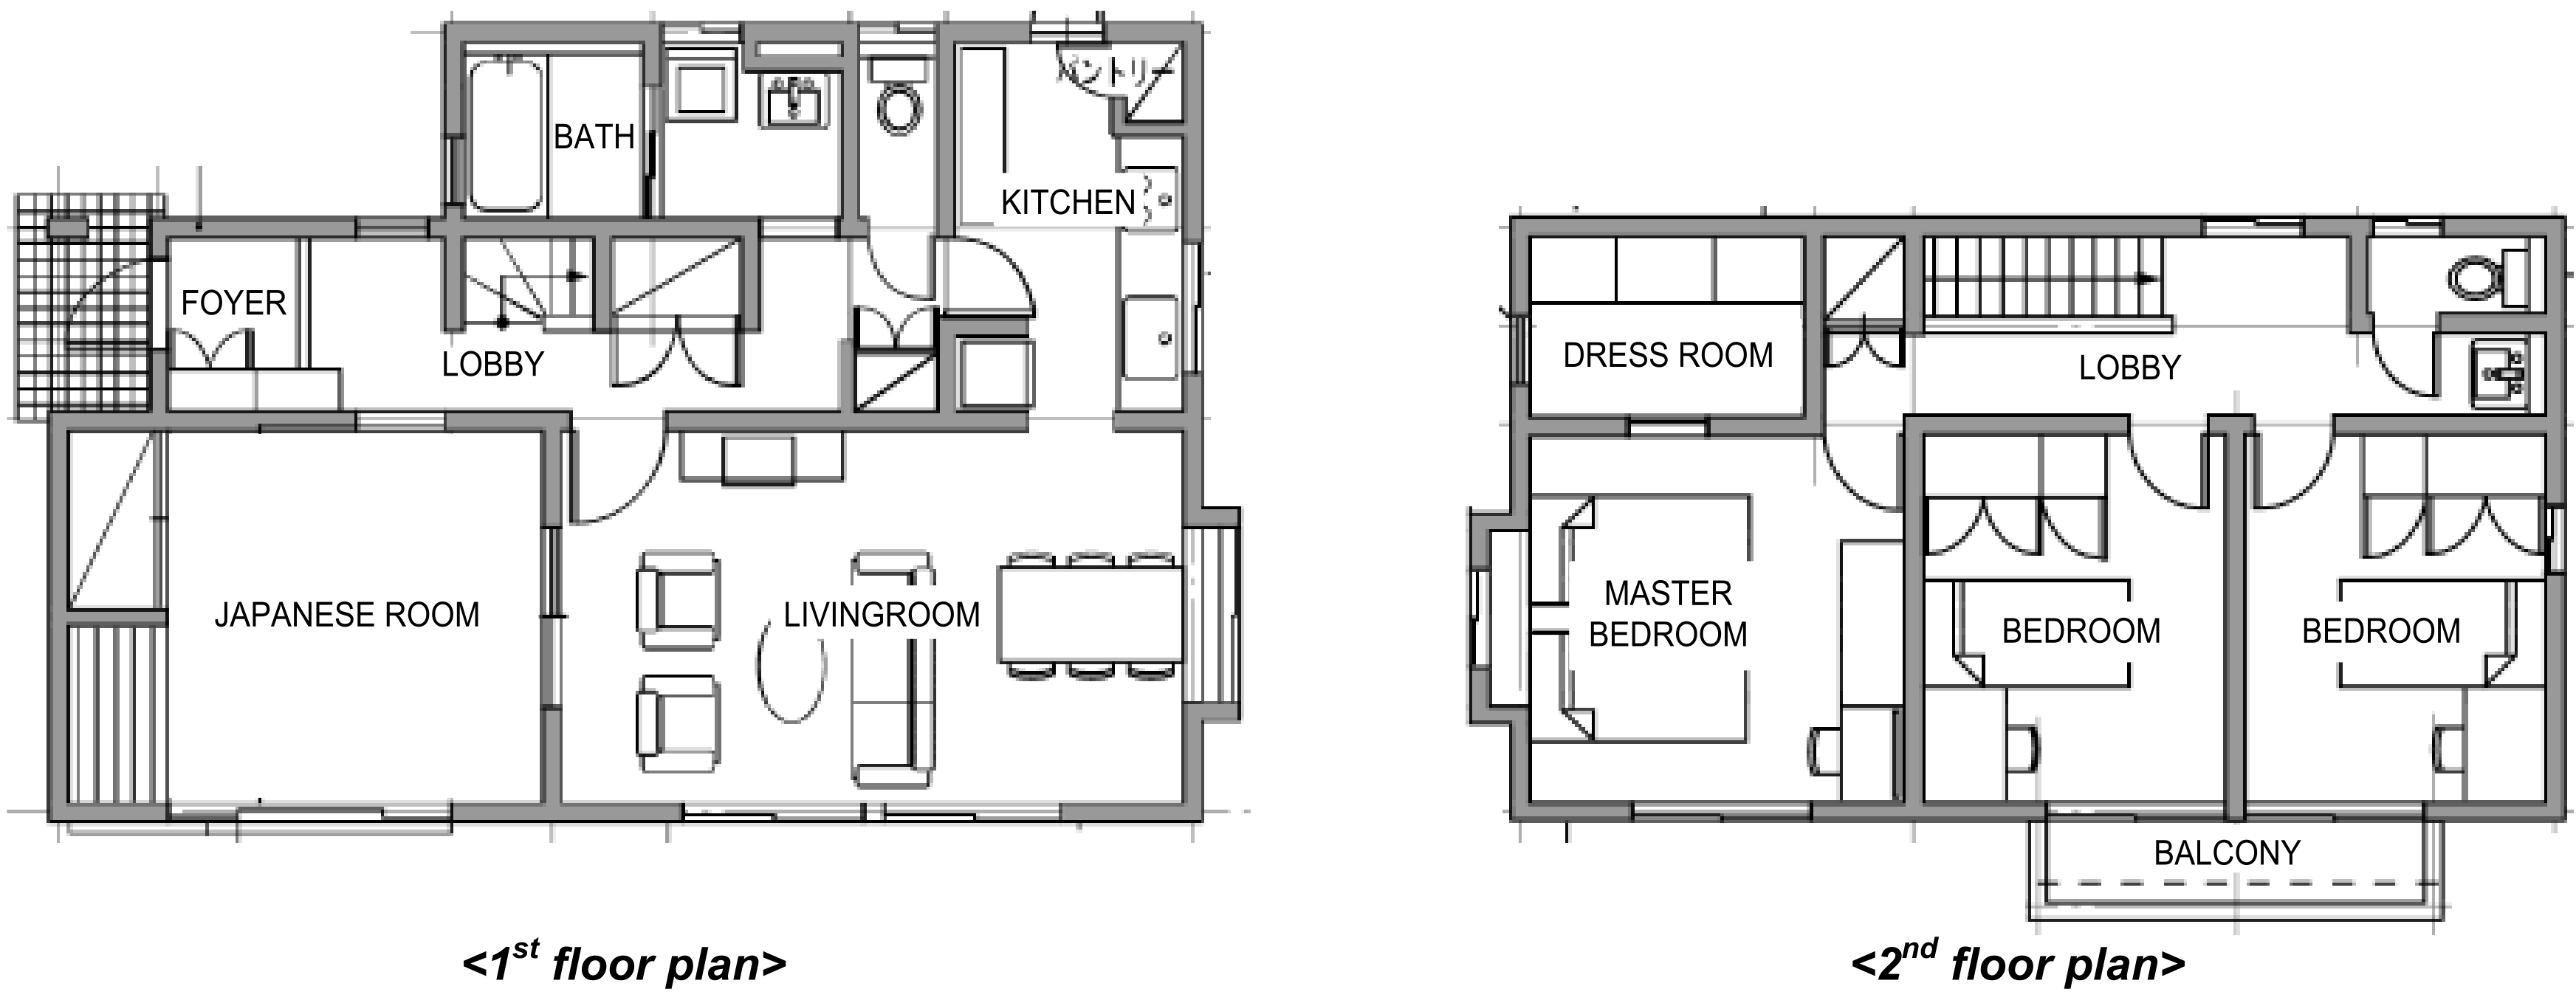
4.1. Description of Reference Building and Window Configurations

To analyze the effect of the frame materials on the annual thermal load, energy consumption, and CO2 emissions, a standard residential building in Japan was selected for analysis. Figure 3 illustrates a prototype of a residential building from the Institute for Building Environment and Energy Conservation (IBEC) [29]. This is a standard two-story building in Japan, with a total floor area of 120.6 m2; that is, 67.9 m2 for the first floor and 52.17 m2 for the second floor [29].
The window-to-wall ratio—the total area of the glazing (window) divided by the total wall area—of the reference building varies according to climatic conditions. The window-to-wall ratio of the reference building for regions 1 and 2 was 14.7%, whereas that for regions 3–7 was 18.9% [29]. The cold area had a relatively small window area. Table 2 lists the thermal performances of the building envelope. The thickness of the thermal insulating material varied according to the energy conservation standard for each region [23].
The main purpose of this study was to analyze the effect of frame materials on energy performance. Therefore, examining the effect of the changes in the frame material under uniform conditions of glazing or air cavity is important. However, in the actual construction market, generally applied glazing specifications differ for each frame material. Therefore, seven different types of window combinations were determined, as shown in Table 3. Table 3 shows the window configurations based on the window frame material, filled-gas-type air cavity, and cavity thickness, with regard to the sales performance of Japanese manufacturers [14]. The application status of each window configuration, according to the region and based on the defined window configuration, is shown in Table 4. In regions 1 and 2, which are cold regions, the application of high-performance windows with PVC frames was approximately 99%. Conversely, in regions 6 and 7, the installation ratio of the aluminum frame, which has a low thermal performance, was approximately 12–15% owing to the relatively warm outdoor conditions. Among the window configurations adopting PVC frames, window type 3, in which cavities are filled by dry air, is not popular in the Japanese market. Nevertheless, this window type was selected to identify the U-value of the window frame based on its material and to analyze the effect of the frame material on the annual building thermal load.

4.2. Simulation Conditions

The calculated U-value of the frame for each material was applied as an input value for the unsteady-state energy analysis simulation to calculate the annual building load, power consumption, and CO2 emission rate for each condition.
Weather data for the standard year of the expanded Automated Meteorological Data Acquisition System [30] were used for weather conditions. In all cases, the internal gain was generated constantly, and sensible heat of 260 W and latent heat of 220 W were set as the internal heat generations from four people in the house. The ventilation rate was set as 0.5 air change rate per hour and heating and cooling systems were operated continuously (27 °C in the cooling season and 20 °C in the heating season). The simulations were conducted for a year, and the simulation time step was 10 min.

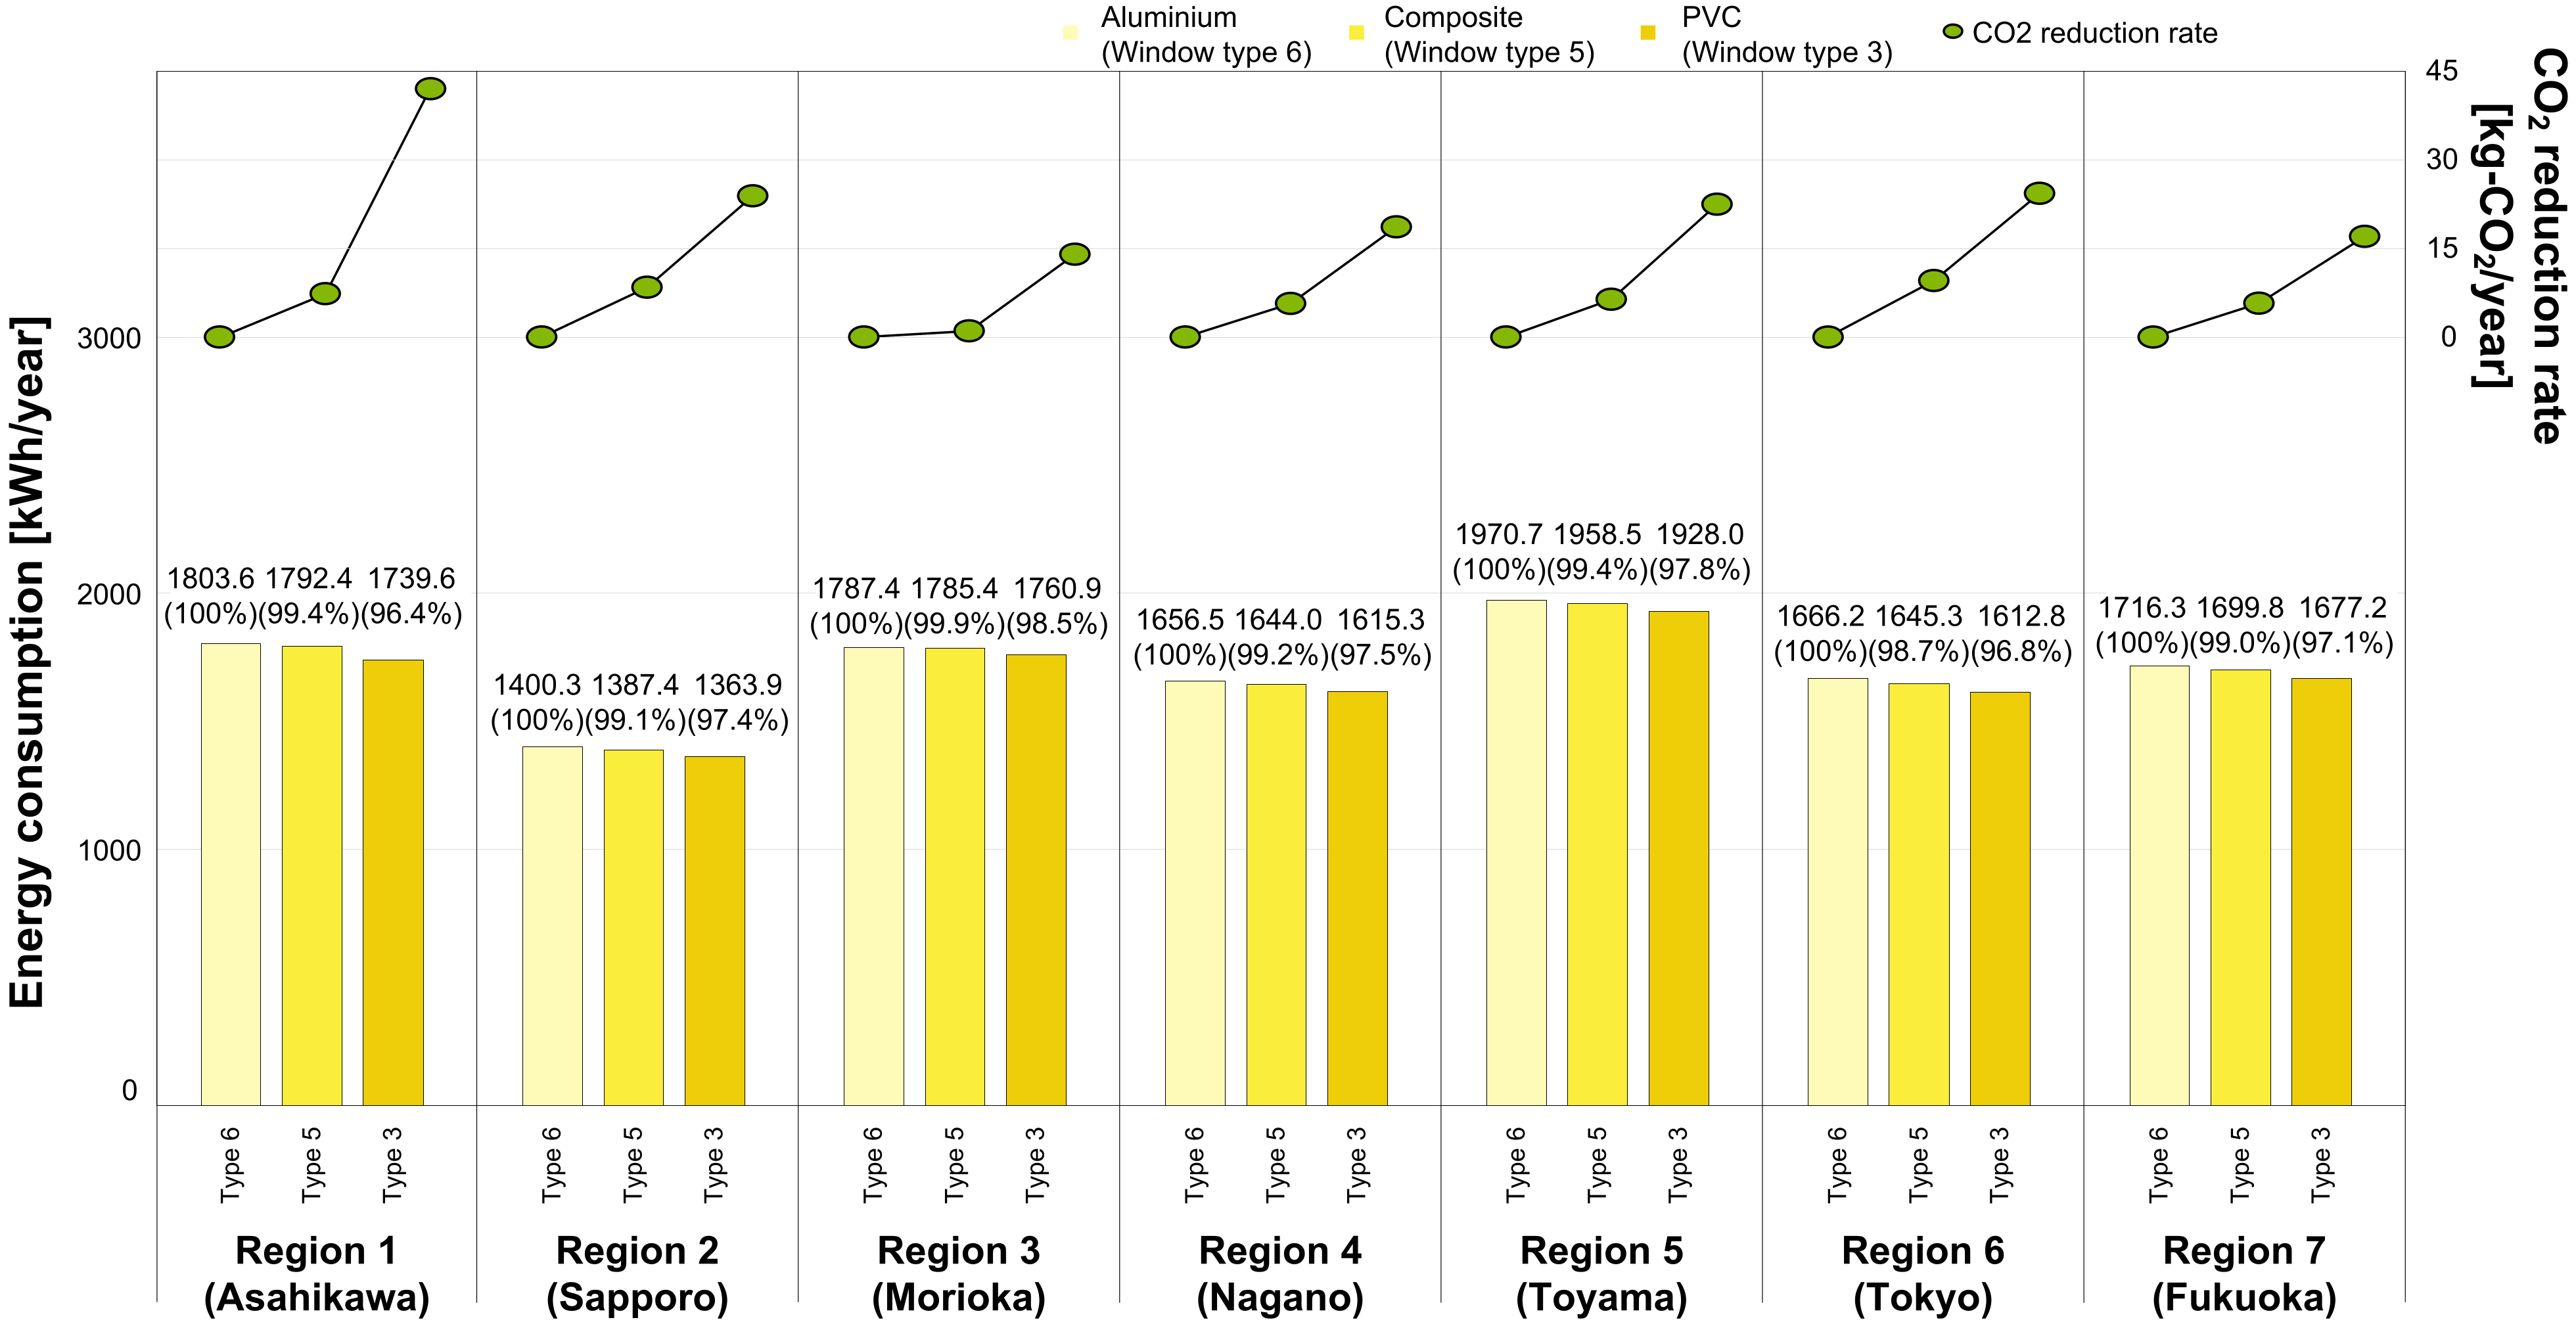
4.3. Simulation Results: Impact of the Window Frame Material on Annual Energy Consumption and CO2 Emissions (Step 2)

The heating, cooling, and total heat loads by region for the seven window configurations are presented in Table 5a–c. In regions 1–2, which are relatively cold regions, the heating load is lower than that of other regions owing to the strengthening of the thermal insulation performance of the building envelope (Table 5a). However, regions 4–7 show higher heating loads than the cold regions despite warm external conditions, owing to the low insulation performance of the buildings. The regions also exhibited a significant reduction in the heating load following an improved thermal performance of the window configurations (window types 1 to 7).
In the case of the cooling load in Table 5b, owing to the high level of thermal insulation of the building envelope, a low level of cooling load was observed in the warm climate regions. The cooling load decreases as the insulation performance of windows is improved in all regions. In cold regions, the cooling load is increased owing to a decrease in the heat transfer rate through the windows, attributable to the improved insulation performance of the window glazing (window types 1 and 2). Owing to the conflicting relationship between the insulation performance and cooling load, the identification of an appropriate insulation level appears to be necessary.
Regarding the annual thermal load in Table 5c, the total load decreased as the insulation performance of the window configurations was strengthened. This tendency was evident in all regions. The window configurations adopting the aluminum frame (window types 6–7) clearly require a higher annual building thermal load than windows adopting PVC frames (window types 1–3).
Figure 4 shows the results of window combinations (window types 3, 5, and 6) where the filled-gas-type air cavity and the thickness of the cavity are uniform, and only the frame material is changed. In this analysis, the net effect of the frame material alone on energy use is observed. The results of the annual energy consumption and CO2 emission reductions for the three window combinations are shown according to region. When changing from an aluminum frame to a composite frame of aluminum and PVC, the annual energy consumption decreased by approximately 0.11–1.26%. On a regional average, the annual energy consumption decreased by approximately 0.75%. In addition, when the frame material was changed from aluminum to PVC, the annual energy consumption according to region decreased by approximately 1.49–3.55%, and on average, by approximately 2.62%.
The energy-saving rates were the highest where the frame material was changed from aluminum to composite (0.6%) and PVC (3.6%) in the coldest region (region 1). Nevertheless, a similar energy-saving effect is expected in regions 2–7 regardless of the external temperature conditions.
The CO2 emission rate was calculated by multiplying power consumption by the CO2 emission factor. Based on the aluminum frame in the coldest region (region 1), the application of the PVC frame and the composite frame reduced the CO2 emission rate by 42.01 kg and 7.36 kg, respectively, yielding the largest reduction among all regions. Furthermore, in a relatively warm region (region 6), when the aluminum frame was replaced with composite and PVC frames, CO2 emission savings of 9.54 kg and 24.3 kg were achieved, respectively.
In summary, depending on the application of the composite frame, the reduction amounts were 1.04–9.54 kg of CO2 per household per year, and 14.02–42.01 kg of CO2 depending on the application of the PVC frame. On average, compared to the installation of aluminum frames, composite and PVC frames showed a reduction of 6.31 kg of CO2 and 23.19 kg of CO2, respectively. Furthermore, CO2 emissions were converted into the amount of CO2 gas absorbed by cedar trees, which are prevalent in Japanese forests and cover nearly 18% of the total land area of Japan [31,32]. The amount of CO2 gas absorbed per year by a single cedar tree is approximately 14 kg of CO2 [33]; therefore, it is possible to reduce the CO2 gas emission equivalent to that absorbed by a single cedar tree by strengthening the thermal insulation performance of the frame. In particular, when the window frame was changed to PVC, a greenhouse gas reduction effect equivalent to the amount of CO2 gas absorbed by 1–3 cedar trees per household for one year was observed; therefore, the effect of changing the window frame material on the annual energy consumption and CO2 emissions throughout the study region was observed to be quite significant.

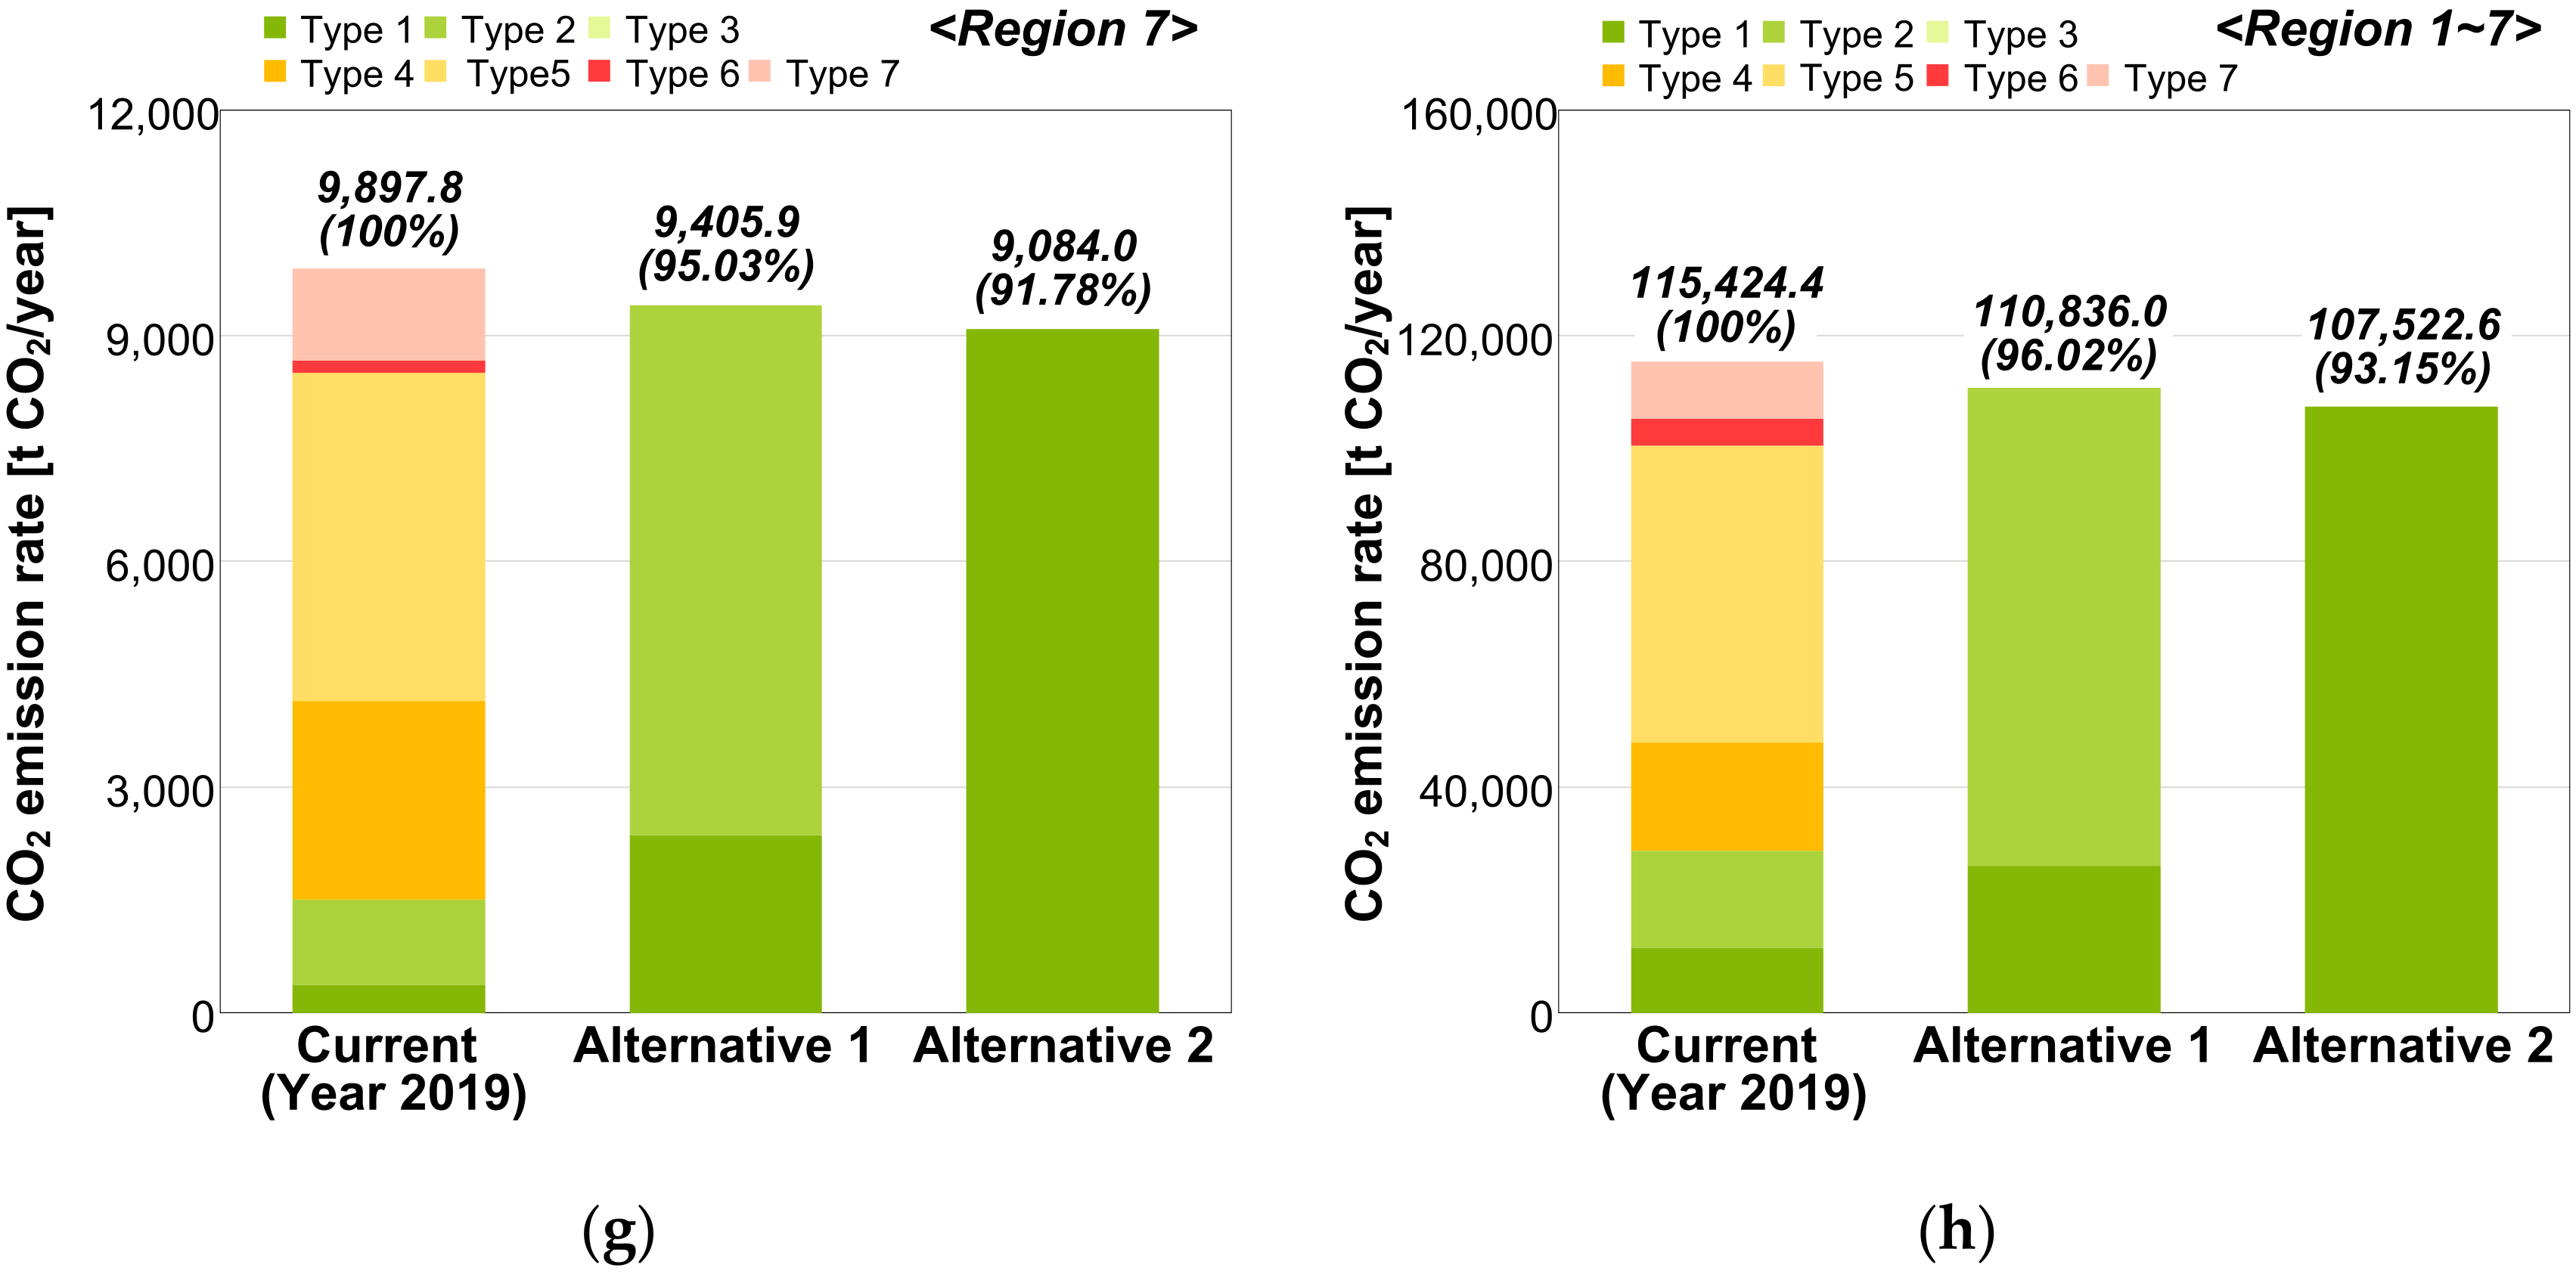
4.4. Simulation Results: Impact of the Window Frame on CO2 Emissions at the City Scale (Step 3)

Figure 5 shows the annual CO2 emissions according to the regions in 2019. Figure 5a–g compare CO2 emissions under three conditions: (1) CO2 emission status of newly built houses in each region as of 2019, (2) an alternative where the window compositions were changed to window types 1 and 2 (Alternative 1), and (3) an alternative where window compositions were all changed to window type 1 (Alternative 2). In Alternative 1, the frequency of window types 1 and 2 was based on the sales ratio of window frame manufacturers in 2019.
CO2 emissions in all regions clearly decreased upon applying Alternatives 1 and 2. In the cold regions, the original PVC frame installation rate was high. Therefore, in regions 1 and 2, the reduction rates were approximately 1.06–17.43 t of CO2 and 6.26–36.50 t of CO2, respectively. In conclusion, in regions 1 and 2, a CO2 reduction effect equivalent to the amount of CO2 absorbed by 76–1245 cedar trees and 448–2607 trees per year can be achieved. In region 2, the reduction exceeded that in region 1 owing to the large number of newly constructed residential buildings. Consequently, the amount of the CO2 emission reduction in cold regions throughout the region accounted for 0.16% and 0.68% following the implementation of Alternatives 1 and 2, respectively (Table 6).
In regions 3–5, the CO2 reduction rates of Alternatives 1 and 2 corresponded to 26.65–65.17 t of CO2 and 87.03–176.92 t of CO2, respectively, corresponding to the amount of CO2 absorbed by 1904 to 12,637 cedar trees per year. Compared to cold regions (regions 1 and 2), the application rate of the aluminum frame was high; therefore, the amount of CO2 reduction due to frame replacement was relatively large. The amount of CO2 reduction in regions 3–5 compared to the reductions throughout the region were approximately 2.91% (Alternative 1) and 4.59% (Alternative 2) (Table 6).
Region 6, which has a relatively high aluminum frame adoption rate, has a high population density and a large number of new buildings; therefore, Alternatives 1 and 2 in region 6 accounted for 86.21% and 84.43% of the reduction rate of the entire region, respectively. In conclusion, as the thermal performance of the frame is improved, an effect equivalent to the CO2 gas absorption effect of approximately 282,558–476,530 cedar trees in Tokyo alone can be achieved. Region 6 includes many cities with a high population density, such as Tokyo and Osaka; therefore, it is expected that PVC frames can significantly contribute to the reduction of greenhouse gas emissions, especially in areas such as region 6, which has a high population density and a large amount of new housing.
In region 7, the hottest region, CO2 emissions of approximately 491.89 CO2 and 813.87 CO2 can be reduced under the conditions of Alternatives 1 and 2, respectively. In conclusion, in region 7, the CO2 absorption is equivalent to 35.135 and 58.133 cedar trees, accounting for a relatively high rate of the total CO2 emission reduction in the area (approximately 10.30–10.72%).
In all of the regions, it was confirmed that CO2 gas emissions could be reduced by approximately 3.98% and 6.85% following the implementation of Alternatives 1 and 2, respectively (Figure 5h), corresponding to CO2 absorption by 327,743 and 564,416 cedar trees, respectively. This confirms that changing the material of the window frame has a significant energy-saving impact, and a considerable amount of energy can be saved at the city scale.

5. Conclusions

This study examined the potential consequences of global warming on the energy performance of window frames in seven cities in Japan. The U-value of window frames was simulated according to the frame material: aluminum, composite (aluminum and PVC), and PVC. This study suggests the energy-saving effect of increasing the thermal performance of window frames at the city scale. The main results of this study are as follows:
(1) The U-values of different window frames were calculated using a two-dimensional simulation, and the heat-loss characteristics of the envelope were analyzed. The U-values of the PVC, composite, and aluminum frames were 1.88 W/m2·K, 5.32 W/m2·K, and 8.78 W/m2·K, respectively.
(2) The impact of the window frame material on only the annual energy consumption varied from approximately 0.11% to 3.55%, depending on the region. On a regional average, the annual energy consumption decreased by approximately 0.75%. Consequently, if the composite frame was used instead of the aluminum frame, the reduction amount was 1.04–9.54 kg of CO2 per household per year. Reductions of 14.02–42.01 kg of CO2 could be achieved following the application of a PVC frame instead of an aluminum frame. When the window frame was changed to PVC, a greenhouse gas reduction effect was observed to be equivalent to the amount of CO2 gas absorbed by 1–3 cedar trees per household for one year.
(3) CO2 gas emissions can be reduced by approximately 3.98–6.85% through the application of PVC frames in seven regions of Japan. If the reduction rate is converted to the amount of CO2 gas absorbed by cedar, the absorption effect corresponds to 327,743 and 564,416 cedar trees. This confirms that changing the material of the window frame has a significant energy-saving impact, and a considerable amount of energy can be saved at the city scale.
(4) Even in areas where PVC frames are already used commonly, the city-level energy-saving effect is proportional to the number of new houses. Tokyo is one such area, and the energy-saving rate in Tokyo accounts for approximately 85% of all examined regions. This necessitates the continuous improvement of the insulation of window configurations, even in regions or countries that have already adopted numerous PVC frames.
The results of this study may provide a basis for predicting the future energy-saving potential of countries targeting the dealumination of windows. In addition, related studies and national policymakers can use our research methods as references. Research studies related to energy-efficient retrofits can refer to the effects of the window configurations reported here.
It is worth noting that this study analyzed only approximately 17.2% of all new housing units in Japan. Therefore, for accurate analysis and practical application, it is necessary to conduct analyses of all new housing units in Japan. This limitation will be addressed in future studies.

Author Contributions

Y.C.: Data curation, Visualization, Investigation, Writing—Original draft preparation. H.L.: Software, Writing—Reviewing and Editing. A.O.: Conceptualization, Methodology, Supervision. All authors have read and agreed to the published version of the manuscript.

Funding

This research received no external funding.

Institutional Review Board Statement

Not applicable.

Informed Consent Statement

Not applicable.

Data Availability Statement

Not applicable.

Acknowledgments

This work was supported by the research grant of the Chungbuk National University in 2021.

Conflicts of Interest

The authors declare no conflict of interest.

References and Note

  1. IPCC. Climate Change 2007: Synthesis Report, Summ. For Policymakers; IPCC: Geneva, Switzerland, 2007. [Google Scholar]
  2. Heydari, A.; Sadati, S.E.; Gharib, M.R. Effects of different window configurations on energy consumption in building: Optimization and economic analysis. J. Build. Eng. 2021, 35, 102099. [Google Scholar] [CrossRef]
  3. De Gastines, M.; Correa, É.; Pattini, A. Heat transfer through window frames in EnergyPlus: Model evaluation and improvement. Adv. Build. Energy Res. 2019, 13, 138–155. [Google Scholar] [CrossRef] [Green Version]
  4. Sinha, A.; Kutnar, A. Carbon Footprint versus Performance of Aluminum, Plastic, and Wood Window Frames from Cradle to Gate. Buildings 2012, 2, 542. [Google Scholar] [CrossRef] [Green Version]
  5. Gustavsen, A.; Jelle, B.P.; Arasteh, D.; Kohler, C. State-of-the-Art Highly Insulating Window Frames–Research and Market Review; Norges Byggforskningsinstitutt: Oslo, Norway, 2007. [Google Scholar]
  6. Appelfeld, D.; Hansen, C.S.; Svendsen, S. Development of a slim window frame made of glass fibre reinforced polyester. Energy Build. 2010, 42, 1918–1925. [Google Scholar] [CrossRef]
  7. Misiopecki, C.; Bouquin, M.; Gustavsen, A.; Jelle, B.P. Thermal modeling and investigation of the most energy-efficient window position. Energy Build. 2018, 158, 1079–1086. [Google Scholar] [CrossRef]
  8. Takada, K.; Hayama, H.; Mori, T.; Kikuta, K. Thermal insulated PVC windows for residential buildings: Feasibility of insulation performance improvement by various elemental technologies. J. Asian Archit. Build. Eng. 2020, 20, 340–355. [Google Scholar] [CrossRef]
  9. Rahman, W.A.W.A.; Sin, L.T.; Rahmat, A.R. Injection moulding simulation analysis of natural fiber composite window frame. J. Mater. Process. Technol. 2008, 197, 22–30. [Google Scholar] [CrossRef]
  10. Khetib, Y.; Alotaibi, A.A.; Alshahri, A.H.; Rawa, M.; Cheraghian, G.; Sharifpur, M. Impact of phase change material on the amount of emission in the double-glazed window frame for different window angles. J. Energy Storage 2021, 44, 103320. [Google Scholar] [CrossRef]
  11. International Energy Agency. Technology Roadmap Energy Efficient Building Envelopes; IEA: Paris, France, 2013. [Google Scholar]
  12. El-Darwish, I.; Gomaa, M. Retrofitting strategy for building envelopes to achieve energy efficiency. Alex. Eng. J. 2017, 56, 579–589. [Google Scholar] [CrossRef] [Green Version]
  13. Survey on the Use of Building Materials for Residential Buildings. 2021. Available online: https://www.jsma.or.jp/ (accessed on 16 May 2022).
  14. Survey on the Use of Building Materials for Residential Buildings. 2013. Available online: https://www.jsma.or.jp/ (accessed on 16 May 2022).
  15. Baldinelli, G.; Lechowska, A.; Bianchi, F.; Schnotale, J. Sensitivity Analysis of Window Frame Components Effect on Thermal Transmittance. Energies 2020, 13, 2957. [Google Scholar] [CrossRef]
  16. Laustsen, J.B.; Svendsen, S. Improved windows for cold climates. In Proceedings of the 7th Nordic Symposium on Building Physics, Reykjavik, Iceland, 13–15 June 2005; pp. 987–994. [Google Scholar]
  17. Zajas, J.; Heiselberg, P. Parametric study and multi objective optimization of window frame geometry. Build. Simul. 2014, 7, 579–593. [Google Scholar] [CrossRef]
  18. Asdrubali, F.; Roncone, M.; Grazieschi, G. Embodied energy and embodied GWP of windows: A critical review. Energies 2021, 14, 3788. [Google Scholar] [CrossRef]
  19. Ramesh, T.; Prakash, R.; Shukla, K.K. Life cycle energy analysis of buildings: An overview. Energy Build. 2010, 42, 1592–1600. [Google Scholar] [CrossRef]
  20. Ozaki, A.; Tsujimaru, T. Prediction of hygrothermal environment of buildings based upon combined simulation of heat and moisture transfer and airflow. In Proceedings of the IBPSA 2005—International Building Performance Simulation Association, Montréal, QC, Canada, 15–18 August 2005. [Google Scholar]
  21. Choi, Y.; Cho, W.; Ozaki, A.; Lee, H. Influence of the moisture driving force of moisture adsorption and desorption on indoor hygrothermal environment and building thermal load. Energy Build. 2021, 253, 111501. [Google Scholar] [CrossRef]
  22. BS EN ISO 10077-2:2017; BSI Standards Publication Thermal Performance of Windows, Doors and Shutters—Calculation of Thermal Transmittance. B.S.I. Standards: London, UK, 2017.
  23. Konisi, T.; Saito, H.; Isikawq, K. Energy Conservation Standards, Inst. Build. Environ. Energy Conserv. Available online: https://www.ibec.or.jp/ee_standard/build_standard.html (accessed on 16 May 2022).
  24. Ministry of the Environment, Japan. CO2 Emission Factor by Electric Power Company. 2020. Available online: https://www.env.go.jp/press/files/jp/115373.pdf (accessed on 16 May 2022).
  25. Area Classification for Energy Saving, Japan. 2020. Available online: https://www.mlit.go.jp/jutakukentiku/shoenehou_assets/img/library/chiikikubun-sinkyuu.pdf (accessed on 16 May 2022).
  26. Number of newly built households by region in Japan, Tokyo, n.d.
  27. ISO 15099:2003; Thermal Performance of Windows, Doors and Shading Devices—Detailed Calculations. International Organization for Standardization (I.S.O.): Geneva, Switzerland, 2003.
  28. Number of Houses Built in Japan; Nomura Research Institute (NRI): Tokyo, Japan, 2020; Available online: https://www.nri.com/jp/news/newsrelease/lst/2020/cc/0609_1 (accessed on 16 May 2022).
  29. Nishizawa, S. Explanation of Energy Consumption Calculation Method in Criteria of Housing Business; Institute for Building Environment and Energy Conservation (IBEC): Tokyo, Japan, 2009; pp. 35–47. [Google Scholar]
  30. Expanded AMeDAS Weather Data, Japan Meteorol. Agency. 2021. Available online: https://www.jma.go.jp/bosai/map.html#5/34.5/137/&elem=temp&contents=amedas&interval=60 (accessed on 16 May 2022).
  31. Uetake, J.; Tobo, Y.; Kobayashi, S.; Tanaka, K.; Watanabe, S.; DeMott, P.J.; Kreidenweis, S.M. Visualization of the seasonal shift of a variety of airborne pollens in western Tokyo. Sci. Total Environ. 2021, 788, 147623. [Google Scholar] [CrossRef] [PubMed]
  32. Yamada, T.; Saito, H.; Fujieda, S. Present state of Japanese cedar pollinosis: The national affliction. J. Allergy Clin. Immunol. 2014, 133, 632–639. [Google Scholar] [CrossRef] [PubMed]
  33. How Much Carbon Dioxide Does the Forest Absorb? Ministry of Agriculture, Forestry and Fisheries: Tokyo, Japan, 2014. Available online: https://www.rinya.maff.go.jp/j/sin_riyou/ondanka/20141113_topics2_2.html (accessed on 16 May 2022).
Figure 1. Cross-section of (a) aluminum frame including wall, (b) aluminum frame, (c) composite frame (aluminum and polyvinyl chloride [PVC]), and (d) PVC frame.
Energies 15 03692 g001
Figure 2. Temperature distribution for each reference frame. PVC, polyvinyl chloride. (a) Aluminum; (b) Composite; (c) PVC.
Energies 15 03692 g002
Figure 3. Floor plan of a reference building.
Energies 15 03692 g003
Figure 4. Annual energy consumption and CO2 reduction rate of window frame according to region. PVC, polyvinyl chloride.
Energies 15 03692 g004
Figure 5. CO2 emission rate by window configurations in (a) region 1, (b) region 2, (c) region 3, (d) region 4, (e) region 5, (f) region 6, (g) region 7, and (h) nationwide.
Energies 15 03692 g005aEnergies 15 03692 g005b
Table 1. Frame application frequency and number of newly built households by region.
RegionFrame Application Frequency by Households
(Number of Households, %)
Sum (Number of Newly Built Households, %)
PVCCompositeAluminumWood
Entire area35,571 (23.47%)97,709 (64.47%)18,155 (11.98%)24 (0.02%)151,569 (100%)
Region 1 (Asahikawa)1495 (99.00%)0 (0.00%)14 (0.90%)2 (0.10%)1510 (100%)
Region 2 (Sapporo)15,839 (99.00%)0 (0.00%)144 (0.90%)6 (0.10%)15,999 (100%)
Region 3 (Morioka)1063 (53.60%)893 (45.00%)26 (1.30%)2 (0.10%)1984 (100%)
Region 4 (Nagano)433 (18.50%)1729 (73.80%)176 (7.50%)5 (0.20%)2343 (100%)
Region 5 (Toyama)1102 (35.50%)1983 (63.90%)19 (0.60%)0 (0.00%)3103 (100%)
Region 6 (Tokyo)12,982 (11.80%)81,195 (73.80%)15,733 (14.30%)10 (0.10%)110,020 (100%)
Region 7 (Fukuoka)2658 (16.00%)11,909 (71.70%)2043 (12.30%)0 (0.00%)16,610 (100%)
Table 2. Description of material parameters.
CategoryLayerThickness [m]Thermal Conductivity [W/(m·K)]Specific Heat [J/(kg·K)]Specific Weight [kg/m3]
Exterior wallGypsum board0.0090.220870.0706.0
Thermal insulation (glass wool) *0.130/0.080/0.0400.045840.056.0
Structural plywood0.0120.1601880.0556.0
Ventilated cavity0.0220.0241005.01.2
Siding0.0150.140760.01110.0
CeilingInterior finishing materials0.0120.1601880.0556.0
Ventilated cavity0.0300.0241005.01.2
Thermal insulation (glass wool) *0.280/0.210/0.0900.050840.056.0
Structural Plywood0.0120.1601880.0556.0
Sheet0.0010.160840.01270.0
Roof finish0.0300.349800.02000.0
FloorPlywood0.0120.1111880.0550.0
Thermal insulation (glass wool) *0.150/0.110/0.0500.045840.056.0
Plywood0.0120.1601880.0556.0
* Thickness of thermal insulation varied according to the region (Regions 1–2/Regions 3–4/Regions 5–7).
Table 3. Description of window configurations. AL, aluminum; PVC, polyvinyl chloride.
ClassificationType of Window
123 *45 *6 *7
FramePVCPVCPVCAL+PVCAL+PVCALAL
GlazingLow-E tripleLow-E doubleLow-E doubleLow-E doubleLow-E doubleLow-E doubleSingle
CavityArgonArgonAirArgonAirAirAir
15 mm × 216 mm16 mm16 mm16 mm16 mm16 mm
* Window specifications used to calculate U-value for each frame material in Section 3.
Table 4. Application frequency or window assembly according to region.
RegionType of WindowSum
123 *45 *6 *7
Region 1 (Asahikawa)881 (58.42%)613 (40.65%)0 (0.00%)0 (0.00%)0 (0.00%)14 (0.93%)0 (0.00%)1508 (100%)
Region 2 (Sapporo)9345 (58.47%)6494 (40.63%)0 (0.00%)0 (0.00%)0 (0.00%)144 (0.90%)0 (0.00%)15,983 (100%)
Region 3 (Morioka)239 (12.06%)824 (41.57%)0 (0.00%)264 (13.32%)629 (31.74%)26 (1.31%)0 (0.00%)1982 (100%)
Region 4 (Nagano)42 (1.80%)391 (16.72%)0 (0.00%)294 (12.57%)1435 (61.38%)176 (7.53%)0 (0.00%)2338 (100%)
Region 5 (Toyama)177 (5.71%)924 (29.79%)0 (0.00%)508 (16.38%)1475 (47.55%)8 (0.26%)10 (0.32%)3102 (100%)
Region 6 (Tokyo)2298 (2.09%)10,684 (9.72%)0 (0.00%)21,029 (19.13%)60,165 (54.74%)5727 (5.21%)10,006 (9.10%)109,909 (100%)
Region 7 (Fukuoka)691 (4.16%)1967 (11.84%)0 (0.00%)4514 (27.17%)7396 (44.52%)276 (1.66%)1767 (10.64%016,611 (100%)
* Window specifications used to calculate U-values for each frame material in Section 3.
Table 5. (a) Annual heating load by window configurations. (b) Annual cooling load by window configurations. (c) Annual total heat load by window configurations.
(a)
RegionAnnual Heating Load [kWh/year]
Window
Type 1
Window
Type 2
Window
Type 3
Window
Type 4
Window
Type 5
Window
Type 6
Window
Type 7
Region 1 (Asahikawa)915.01655.71611.11896.51849.21751.01795.7
Region 2 (Sapporo)695.11221.81183.51301.61259.31169.01296.4
Region 3 (Morioka)869.1883.3872.7880.2867.8828.2916.4
Region 4 (Nagano)2344.82585.02561.82666.02644.02577.03518.4
Region 5 (Toyama)3097.63373.23352.73479.43457.23406.34469.3
Region 6 (Tokyo)4165.34511.14495.24652.94635.24597.95963.1
Region 7 (Fukuoka)4720.45087.15070.25223.45206.35165.36529.1
Energies 15 03692 i001
(b)
RegionAnnual Cooling Load [kWh/year]
Window
Type 1
Window
Type 2
Window
Type 3
Window
Type 4
Window
Type 5
Window
Type 6
Window
Type 7
Region 1 (Asahikawa)8762.18255.68478.48303.08546.68709.910,466.6
Region 2 (Sapporo)7025.26539.36727.06583.26787.76952.78397.5
Region 3 (Morioka)8784.19201.89340.39304.19487.79538.810,905.3
Region 4 Nagano)6582.26689.06806.76729.86891.17030.87484.7
Region 5 (Toyama)7477.77675.57829.47731.47902.08023.68756.8
Region 6 (Tokyo)4705.64742.54859.24779.34907.45066.35325.2
Region 7 (Fukuoka)4420.84492.04599.74533.74652.74789.35118.6
Energies 15 03692 i002
(c)
RegionAnnual Total Heat Load [kWh/year]
Window
Type 1
Window
Type 2
Window
Type 3
Window
Type 4
Window
Type 5
Window
Type 6
Window
Type 7
Region 1 (Asahikawa)9677.19911.210,089.510,199.510,395.810,460.912,262.3
Region 2 (Sapporo)7720.37761.07910.57884.88047.08121.79693.9
Region 3 (Morioka)9653.210,085.010,213.010,184.310,355.510,367.011,821.7
Region 4 (Nagano)8927.09274.09368.69395.89535.19607.811,003.1
Region 5 (Toyama)10,575.311,048.611,182.111,210.811,359.211,429.913,226.1
Region 6 (Tokyo)8870.99253.69354.49432.29542.69664.211,288.4
Region 7 (Fukuoka)9141.29579.19669.99757.19859.09954.611,647.7
Energies 15 03692 i003
Table 6. CO2 reduction rate according to alternative window configurations.
RegionAlternative 1Alternative 2
CO2 Reduction Rate [t CO2]Frequency of CO2 Reduction Rate [%]CO2 Reduction Rate [t CO2]Frequency of CO2 Reduction Rate [%]
Region 1 (Asahikawa)1.060.02%17.430.22%
Region 2 (Sapporo)6.260.14%36.500.46%
Region 3 (Morioka)26.650.58%87.031.10%
Region 4 (Nagano)41.560.91%98.661.25%
Region 5 (Toyama)65.171.42%176.922.24%
Region 6 (Tokyo)3955.8186.21%6671.4284.43%
Region 7 (Fukuoka)491.8910.72%813.8710.30%
Sum4588.41100%7901.82100%
Publisher’s Note: MDPI stays neutral with regard to jurisdictional claims in published maps and institutional affiliations.

