Abstract
Two-stroke engines have higher power density than traditional four-stroke engines, and therefore are suitable for engine downsizing. In this work, a four-stroke single-cylinder diesel engine is modified for two-stroke operation, and the combustion system is designed and optimized using a 3D simulation. Three different combustion chamber profiles and injection spray angles are compared to determine an optimized combustion system. The engine test results show that the two-stroke engine equipped with the newly designed combustion system is able to achieve the same effective power output at a much lower speed than the original four-stroke engine, as well as obtain a better indicated thermal efficiency. This indicates that the poppet-valve two-stroke engine could be an effective technical approach for engine downsizing.
1. Introduction
Compared with four-stroke engines, two-stroke engines have the advantages of compact structure, low torque fluctuation, and high power density [1,2,3,4,5]. Due to the rapid development of fluid dynamics computation and structural reliability analysis methods in recent years, the shortcomings of two-stroke engines, such as poor emissions and low durability, have been effectively improved [6,7,8,9,10,11]. This provides an effective means engine downsizing, which can effectively reduce engine weight, friction loss, heat transfer loss and pump loss, making it possible to achieve good fuel economy.
Pugnali et al. [12] conducted a simulation study on the application of the Miller cycle in a poppet-valve two-stroke gasoline engine, and found that employing the Miller cycle made it possible to achieve higher thermal efficiency than the baseline with no valve timing adjustment. When adopting variable valve timing, direct injection, and an intake booster in the two-stroke engine, the effective torque increased by 63% under the same maximum combustion pressure limit.
AVL List GmbH designed a two-stroke diesel engine with a uniflow scavenge manner, and optimized the port geometry, fuel supply system, and supercharging system. The test results showed that the two-stroke diesel engine had a far better performance in terms of noise and vibration than automotive four-stroke diesel engines from the same period [13].
Zhang [14] adopted advanced combustion methods such as spark ignition (SI) and controlled auto-ignition combustion (CAI) in a two-/four-stroke single-cylinder gasoline engine in order to study combustion and emissions under operating conditions of 1500 rpm and 3.6 bar IMEP for four-stroke operation and 1.8 bar IMEP for two-stroke operation. The results showed that the four-stroke CAI mode and the exhaust valve reopening CAI mode had better fuel economy and lower NOx emissions. The two-stroke CAI model reduced specific fuel consumption by 29% compared to four-stroke operation under the same IMEP conditions. Therefore, this two-stroke mode allows small GDI engines to achieve better power performance and fuel economy.
Enrico Mattarelli [15] defined the main geometric parameters of an opposition-piston (OP) engine rated at 270 kW and 3200 rpm on the basis of 1D-3D CFD simulation. An innovative combustion system was developed on the basis of further CFD analysis. The numerical results showed that the braking efficiency of the optimized 2-S OP diesel engine at full load was 10% higher than that of equivalent traditional four-stroke engines, while the peak pressure in the cylinder and the turbine inlet temperature were reduced.
Although the technology of two-stroke diesel engines has made great progress, the problems of difficulty starting in low temperature and low thermal efficiency under partial load conditions have not yet been effectively solved.
For the above-mentioned reasons, a variable two-/four-stroke engine concept was proposed in which the engine can be freely switched between the two-stroke mode and the four-stroke mode using an innovative variable valve actuation system. The four-stroke operating mode is adopted under starting and partial load conditions, and the two-stroke mode is switched to at low-speed torque and during rated power operations, thereby improving the overall performance of the engine. However, the two-stroke operation has problems including large scavenging loss and insufficient combustion; it is, therefore, necessary to carefully organize the scavenging process and combustion process in order to obtain better performances.
In the previous work, a four-stroke single-cylinder diesel engine was modified to achieve two-stroke operation by designing a suitable two-stroke cam profile, adjusting the valve timing, and changing the frequency of fuel injection. To solve the issue of large air pumping losses when running in the two-stroke mode of the single-cylinder engine, the intake port was changed from a horizontal entrance to a vertical entrance, the cylinder head bottom was changed from a flat structure to a pent-roof configuration, and the intake valves were tilted by 15° to the centerline of the cylinder. As a result, a very strong tumbling flow, rotating in a line perpendicular to the cylinder centerline, was produced in the cylinder, leading to a dramatic reduction in the fresh air short-cut loss and a significant increase in scavenging efficiency [16].
To optimize the spray, mixing and combustion processes of the two-stroke diesel engine, studies on nozzle protrusion, nozzle hole, advance injection timing, and combustion chamber configuration are necessary. These parameters should be matched with airflow movement to improve combustion performance and thermal efficiency. In this paper, optimization of the combustion chamber and the spray angle is conducted by means of 3D simulation. Then, the optimized combustion chamber is experimentally verified on the two-stroke engine test bench.
2. Experimental and Simulation Details
This paper designs three different combustion chamber geometries with three different injector oil bundle angles. The performance of the combustion system is analyzed and optimized. A two-stroke valve engine model is built for the prediction of engine performance, and the performance is verified using a test bench.
2.1. Setting of Research Parameters
A schematic diagram of the combustion chamber geometry is shown in Figure 1. By adjusting the chamber diameter Dk, the chamber depth H, the boss depth h, the bowl diameter d, and the chamber width Dl, different combustion chamber schemes with a compression ratio of 14 are obtained. Table 1 shows three combustion chambers, corresponding to an open combustion chamber (Dk > Dl), a straight combustion chamber (Dk = Dl), and a re-entry combustion chamber (Dk < Dl).
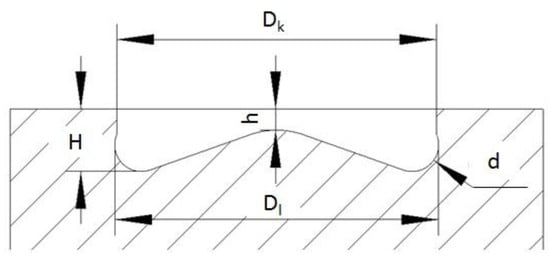
Figure 1.
Geometric parameters of the combustion chamber.

Table 1.
Comparison of the geometric parameters of combustion chambers.
The rated speed of the original four-stroke diesel engine is 4200 rpm, the rated power is 92 kW, and the valves can be separated from the cams at speeds exceeding 5200 rpm. Therefore, a speed of 2500 rpm and a power of 92 kW are set as the rated point for two-stroke operation mode. The effect of the three combustion chambers combined with the three different spray angles (146°, 150° and 160°) on the fuel–air mixing and combustion process are investigated using a three-dimensional simulation. The initial conditions and boundaries required for the three-dimensional simulation were obtained from a one-dimensional simulation, and the peak fire pressure is limited to 22 MPa. The nozzle protrusion height is adjusted to ensure the relative position of the fuel spray and the combustion chamber central boss. The fuel injection rate is shown in Figure 2, and was obtained using a spray test bench.
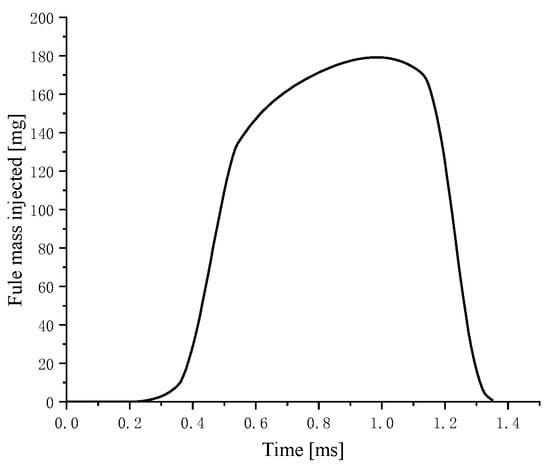
Figure 2.
The fuel injection rate @2500 rpm, 1800 bar, 0.78 ms.
2.2. Simulation Models
In the current work, the investigation of different combustion systems is based on the AVL-FIRE. The simulation interval extends from the opening of the intake valves until the closing of the exhaust valves, and the intake and exhaust ports are not included in the model. Figure 3 shows the model of the reverse tumble combustion system.
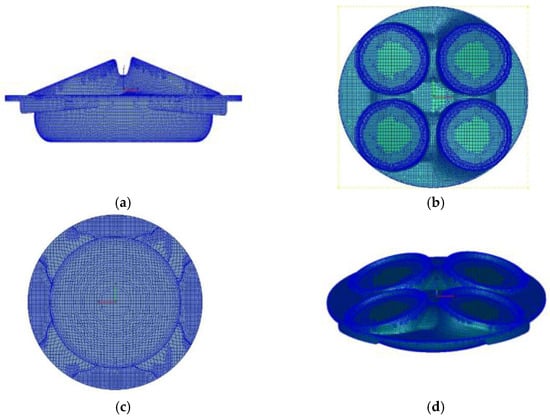
Figure 3.
Computation mesh of the tumble combustion system. (a) Front view; (b) Vertical view; (c) Bottom view; (d) 3D simulation model mesh.
To ensure the accuracy of the calculations, the spray model was selected on the basis of spray test data from a constant volume chamber, and the combustion model was selected on the basis of the cylinder pressure curve and the heat release rate curve, since the atomization and mixing processes are critically important for the combustion characteristics [17]. The spray model calibration was based on the AVL-FIRE software. The spray was calculated in a cuboid model of 50 mm × 50 mm × 100 mm. The basic grid size was 4 mm. Grid refinement was used in the spray column dense area near the nozzle, and the grid size was 0.75 mm. The total number of grids was 176,682. k-ε and Amsden-O’Rourke were chosen for the turbulent model and the wall model, respectively. In the simulation calculation process of the spray and combustion process, the break-up model and evaporation model had the greatest impact on the calculation results. The parameters of the model were determined by calibration. The simulation model settings are shown in Table 2.
Table 2.
The selected simulation model.
The start time of the spray is 0 s. The initial time step is 5 × 10⁻⁶ s, and the subsequent number of time steps is 50. The convergence tolerance is 1 × 10⁻⁴, and other values are the defaults shown in Table 3.
Table 3.
Time step of simulation.
2.3. Experimental Setup
A single-cylinder test bench was built to verify the performance of the poppet-valve two-stroke diesel engine. The system components are shown in Table 4. The schematic diagram of the test bench is shown in Figure 4. Ordinary diesel (0#) was used in this test, with a freezing point of 273 K. Its physical and chemical properties are shown in Table 5.
Table 4.
Test system components.
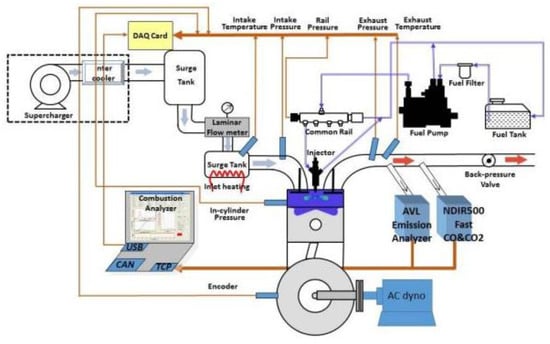
Figure 4.
Schematic diagram of the single-cylinder test system.
Table 5.
Properties of 0# diesel.
3. Results and Discussion
3.1. Calibration of the Model
3.1.1. Determination of the Parameters of the Spray Breakup Model
Low ambient temperature and pressure, described in Table 6, were selected for spray break-up model validation.
Table 6.
Test to calibrate operating parameters.
In the WAVE model, C2 is the break-up time parameter, which affects the break-up time and length. Therefore, C2 has a great effect on the liquid penetration length, and is the main parameter of the WAVE model. C2 is given by:
where is the spray break-up time scale, s, D is the droplet diameter, mm, is the maximum growth rate of the droplet surface wave, and the is the maximum wavelength of the droplet surface wave, mm [18].
The C2 value decreases with increasing ambient temperature, and can be determined on the basis of the ambient temperature by applying the formula . As shown in Table 7, high ambient temperature and low ambient temperature were selected to calculate the C2 value.
Table 7.
Setting of experimental parameters.
Case 1:
A comparison of the liquid penetration lengths obtained on the basis of the simulated and experimental results is shown in Figure 5. It can be seen that the simulated liquid penetration length is in good agreement with experimental value, and the relative error is within 10% of the allowable error angle except for the initial period and a handful of other points.
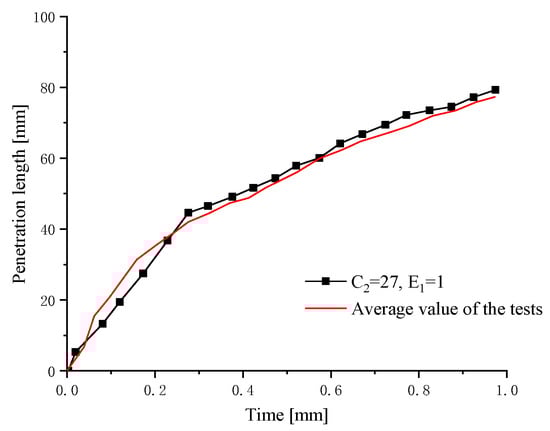
Figure 5.
Comparison of the liquid penetration length between the simulated and experimental results for Case 1.
A comparison of the vapor penetration lengths obtained on the basis of the simulated and experimental data is shown in Figure 6. It can be seen that the simulated vapor penetration length is in good agreement with the experimental values, and the relative error is within 5% of the allowable error angle except for the initial spray and a few individual points.
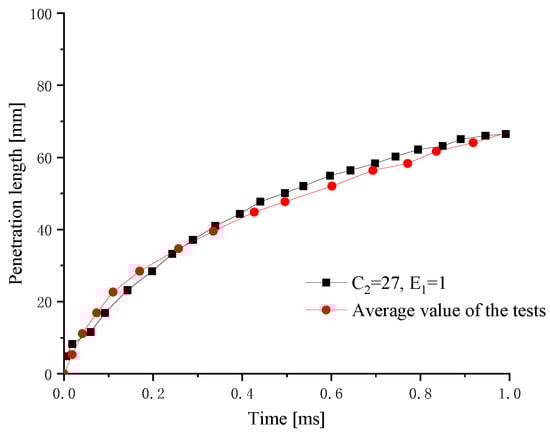
Figure 6.
Comparison of the vapor penetration length between the simulated and experimental results for Case 1.
A comparison of the spray shape at 0.9 ms is shown in Figure 7, and the simulated results are basically consistent with the experimental results.
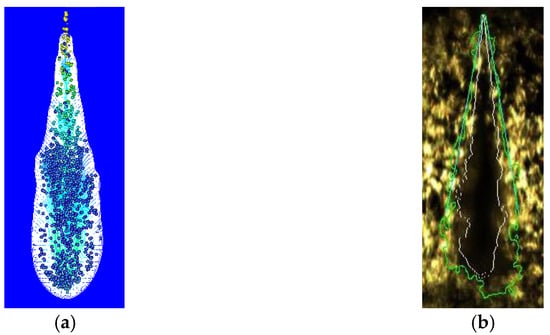
Figure 7.
Comparison of the spray shape at 0.9 ms for Case 1. (a) Liquid- and vapor-phase spray of simulation; (b) Liquid- and vapor-phase spray of experiments.
Case 2:
A comparison of the liquid penetration lengths obtained on the basis of the simulated and experimental results are shown in Figure 8. Due to the low ambient temperature, it can be considered to be in a cold state, and the evaporation and gasification can be ignored. It can be seen that the simulated vapor penetration length is in good agreement with the experimental value. The relative error after 0.2 ms is within 5% of what was expected for the initial spray points, and it meets the requirements of subsequent engineering simulation analysis.
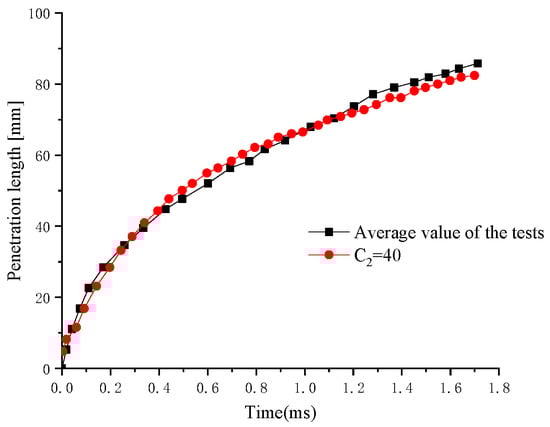
Figure 8.
Comparison of the liquid penetration lengths between the simulated and experimental results for Case 2.
A comparison of the spray shape at 0.9 ms is shown in Figure 9, with both showing good similarities.
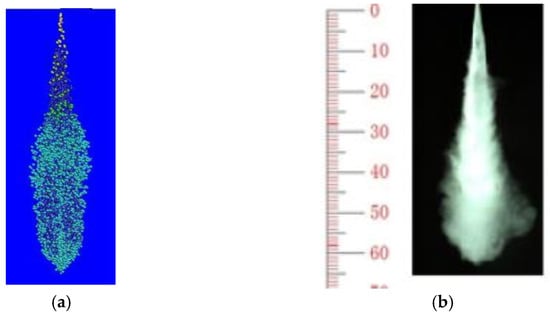
Figure 9.
Comparison of the spray shape at 0.9 ms for Case 2. (a) Liquid-phase spray of simulation; (b) Liquid-phase spray of experiments.
On the basis of the comparison of the liquid penetration lengths, vapor penetration lengths, and spray shapes in high and low ambient temperatures, it can be seen that the simulated results are in good agreement with the experimental results. The WAVE model and the parameters of the model are able to meet the requirement of the subsequent engineering simulation analysis.
3.1.2. Determination of the Parameters of the Evaporation Model
After selection of the Dukowicz model, the main parameters E1 and E2 need to be set. E1 represents the heat transfer of evaporation, and E2 represents the mass transfer of evaporation.
According to the ambient temperature, E1 is determined. When the ambient temperature is less than 700 K, E1 is set to 1. When the ambient temperature is greater than 700 K, E1 is calculated by fitting the formula E1 = 6.0977ln(T) − 37.954. The validation value of E1 is 1.
For the validation of the evaporation model, a high ambient temperature was selected, as shown in Table 8.
Table 8.
Setting of experimental parameters.
Figure 10 shows a comparison of liquid penetration lengths between the simulated and the experimental data. It can be seen that the relative error of the liquid penetration length is within the allowable range.
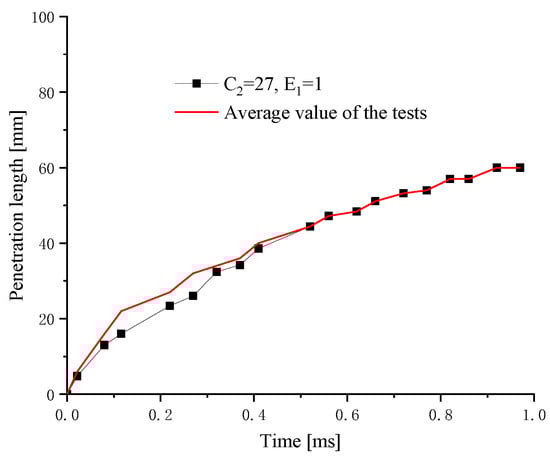
Figure 10.
Comparison of liquid penetration length between the simulated and experimental results.
Figure 11 shows a comparison of the vapor penetration lengths, and it can be seen that the simulated liquid penetration length is in good agreement with the experimental data.
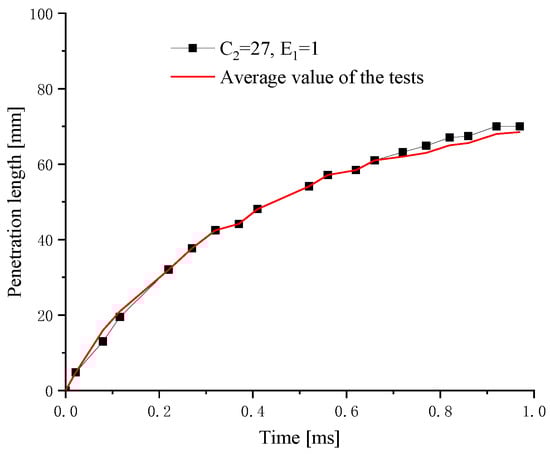
Figure 11.
Comparison of the vapor penetration length between the simulated and experimental results.
On the basis of the comparison between the liquid penetration length, the liquid penetration length, and the spray shape, the simulated results can be said to be in good agreement with the experimental results. The evaporation model and the setting of the parameters meet the requirements of the subsequent engineering simulation analysis.
3.1.3. Calibration of the Combustion Model
The calibration was conducted at a speed of 2500 rpm and a power of 46 kW. The cylinder pressure curves and instantaneous heat release rate curves of the simulation and experiment are shown in Figure 12. Both curves present high consistency. The crank angle of the peak fire pressure for both the simulation and the experiment appear at 6.5 °CA ATDC. The peak fire pressure from the experiment is 121.9 bar, and the simulated value is 123.5 bar. The overall agreement of the instantaneous heat release rate curve shows the good reliability of this simulation.
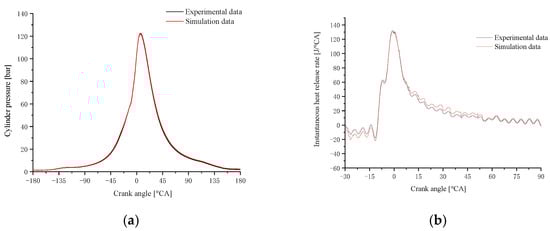
Figure 12.
Comparison of in-cylinder pressure and Instantaneous heat release rate between the simulation and experiment. (a) Cylinder pressure; (b) Instantaneous heat release rate.
3.2. The Effect of Spray Angle on Combustion Characteristics
In accordance with the calibration, the parameters of the combustion model are set as shown in Table 9.
Table 9.
Parameters of the combustion system.
A comparison of the combustion performance of the three combustion chamber schemes is shown in Table 6. As shown in Table 10, the peak fire pressure always appears after 10 °CA ATDC, and 50% integrated heat release always appear within 20 °CA ATDC, which are all within a reasonable range. The three combustion chamber geometries combined with spray angles of 160° all achieve high levels of indicated work. Compared to the spray angle of 146°, the indicated work increases by 10%, and the peak pressure is only about 15 MPa, which meets the design requirements.
Table 10.
Comparison of combustion performance of the three combustion systems.
A comparison of the cylinder pressure between the three combustion chambers combined with three different spray angles is shown in Figure 13. It can be seen that the pressure of F1 J160 during the expansion stage is significantly higher than the other eight curves. The right picture shows a comparison of the in-cylinder pressure between the three chambers matched with a spray angle of 160°. It can be found that the area enclosed by the curves of the F1 J160 is significantly greater than that for F3 J160.
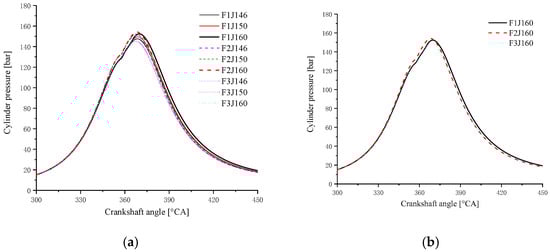
Figure 13.
Comparison of the in-cylinder pressure between three combustion chambers combined with different spray angles. (a) Three chambers combined with spray angles of 160°, 150° and 145°; (b) Three chambers combined with a spray angle of 160°.
The instantaneous heat release of the three combustion chambers when combined with three spray angles is shown in Figure 14. It can be seen that the heat release near the TDC of F1 J160 is relatively higher, and is able to last for the longest time.
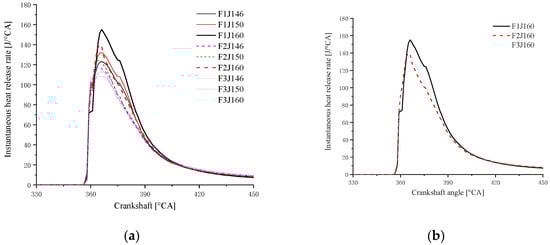
Figure 14.
The instantaneous heat release of the three combustion chambers combined with three spray angles. (a) Three chambers combined with spray angles of 160°, 150° and 145°; (b) Three chambers combined with a spray angle of 160°.
The comparison of cumulative heat release curves of three different combustion chamber schemes matching different oil bundle interangular orifice schemes is shown in Figure 15. It can be seen that the cumulative heat release curve of scheme F1 J160 rises faster and the final cumulative heat release is the largest. It is shown that scheme F1J160 has the highest indicating power and the highest corresponding thermal efficiency under the premise of a certain amount of circulating oil.
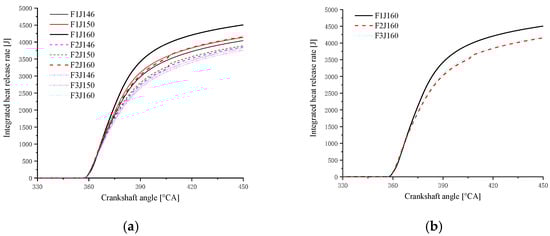
Figure 15.
The integrated heat release of the three combustion chambers combined with three spray angles. (a) Three chambers combined with spray angles of 160°, 150° and 145°; (b) Three chambers combined with a spray angle of 160°.
Three-dimensional cloud images of the in-cylinder process are used to compare and investigate the F1 combustion chamber in combination with three spray angles in order to explain the above conclusions.
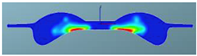
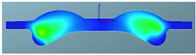
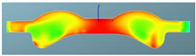
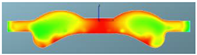
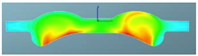
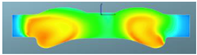
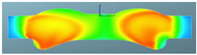
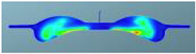
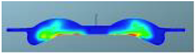
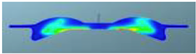
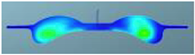
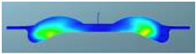
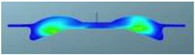
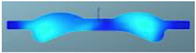
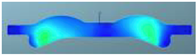
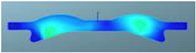
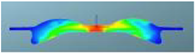
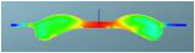
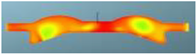
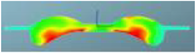
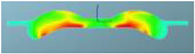
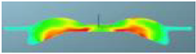
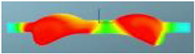
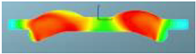
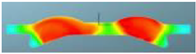
A comparison of the in-cylinder equivalence ratio distribution for the F1 combustion chamber combined with three different spray angles is shown in Table 11. It can be seen that there is an obvious over-rich mixture above the combustion chamber boss with spray angles of 146° and 150°, which indicates that there is a phenomenon of wetting in this area and the evaporation and mixing processes are slow. With the spray angle of 160°, the over-rich mixture above the boss disappears, and the distribution of the fuel–air mixture is more homogeneous. Near TDC, the amount of over-rich mixture above the boss with a spray angle of 160° is significantly lower than with spray angles of 146° and 150°, and the spray area also increases. After 380 °CA, with increasing spray angle, the expansion of fuel–air mixing in the radial direction accelerates, and the peripheral air in the combustion chamber utilization is higher. The high compression ratio achieved by reducing the chamber volume combined with the wider spray angle can improve the fuel–air mixing and combustion processes.
Table 11.
Comparison of the equivalence ratio distribution for the F1 combustion chamber combined with three spray angles.
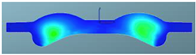
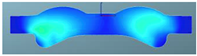
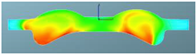
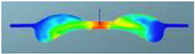
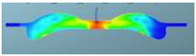
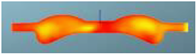
The nephograms of the combustion reaction rate of the F1 combustion chamber matches with different spray angles under different crank angles are shown in Table 12. It can be seen from the nephogram at 355 °CA that the sprays are in the initial stage of evaporation and diffusion, and there are no obvious phenomena of combustion reactions in the three matched schemes. At the TDC, obvious combustion reactions occur in the cylinders of the three schemes, but for the scheme matched with a spray angle of 160°, in the combustion chamber of which the combustion reaction area is the largest, there is a yellow area that symbolizes a more intense reaction. It can be seen at 380 °CA that with increasing spray angle, the reaction rate accelerates in the cylinder, the reaction becomes faster, with a larger red area in the radial direction of the combustion chamber, and the air utilization rate becomes higher in the peripheral area far from the cylinder center. After reaching 400 °CA, the combustion reaction is basically in the late stage, and the three schemes are unanimous. The red area almost fills the cylinder, and the combustion reaction is more sufficient in the combustion chamber. This is confirmed by the distribution of the equivalent ratio in the cylinder, indicating that the preparation rate of the mixture is faster in the scheme with a spray angle of 160°.
Table 12.
Comparison of the combustion reaction rate of the F1 combustion chamber matched with different spray angles.
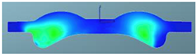
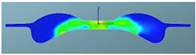
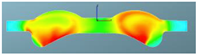
The nephograms of the temperature field for the three different spray angles in F1 combustion chamber are shown in Table 13, demonstrating a trend that is consistent with the nephograms of combustion reaction rate: at 355 °CA, the sprays are in the early stage of evaporation and diffusion, and the local temperature is low and without significant difference due to evaporation. At the top dead center, a high-temperature area appears in the middle of the combustion chamber, and a large green area with a combustion temperature reaching up to 1700 K represents a more accelerated reaction in the scheme with a spray angle of 160°. After reaching 380 °CA, with increasing spray angle, the mixing progress accelerates, and the combustion reaction becomes faster. The resulting red high-temperature area is larger than in the other two schemes, indicating that the combustion reaction is more sufficient.
Table 13.
Comparison of the temperature field for three different spray angles in F1 combustion chamber.
3.3. Influence of Combustion Chamber Profile on Combustion Characteristics
After determining the 160° spray angle to be the best solution, under the constraint of the peak fire pressure of 22 MPa in the cylinder, the comprehensive performance indicators of the three combustion chamber profiles were further optimized by dynamically adjusting the fuel injection timing. After adjusting the fuel injection timing to 24 °CA BTDC, the performance parameters of the engine corresponding to the three combustion chamber profiles were compared, as shown in Table 14. It can be seen that the F1 combustion chamber profile has an indicated power of 92.8 kW, which is 7.1 kW higher than the F2 scheme’s 85.7 kW, an increase of 8%. In addition, the indicated power of F1 is 5.2 kW higher than the F3 scheme’s 87.6 kW, representing an increase of 6%. The integrated heat release of the F1 scheme reaches 5181 J, which is 400 J higher than the integrated heat release of the F2 scheme of 4781 J, representing an increase of about 8%, and 290 J higher than the integrated heat release of the F3 scheme of 4891 J, representing an increase of about 6%. The peak pressure in-cylinder of the three combustion chamber profile schemes is basically from 20 to 21 MPa, and the temperature is about 1000 °C at the time of EVO. The F1 combustion chamber represents a better choice on the basis of a comprehensive comparison of combustion performance.
Table 14.
Comparison of engine performance parameters of three combustion chamber schemes matched with a 160° spray angle injector.
A comparison of the in-cylinder pressure curves of the three combustion chamber profiles is shown in Figure 16. It can be clearly seen from the figure that the highest combustion pressure generated by the combustion of the F1 scheme is higher, and the pressure curve is maintained at a higher level throughout the expansion progress. The F2 scheme is slightly better than the F3 scheme, but the difference in the cylinder pressure curve is not obvious. The instantaneous heat release rate curves corresponding to the three combustion chamber schemes are shown in Figure 17. It can be seen that the F1 scheme has a higher peak value near the TDC and the high-intensity heat release time is maintained for longer. The heat release curve of the F2 scheme is in the middle of the three, and the F3 scheme is at the bottom. A comparison of the integrated heat release rate curves of the three combustion chamber schemes is shown in Figure 18. It can be seen from the figure that the F1 scheme rises faster first and maintains the highest level until the end. A comparison of the in-cylinder temperature curves of the three combustion chamber schemes is shown in Figure 19. It can be seen that the in-cylinder temperature curve is at the highest level from the point at which the F1 scheme begins to release heat, and this continues until the point at which EVO occurs. The in-cylinder temperatures of the three are different, but they gradually converge, which means a better efficiency due to a better mixing progress and reasonable combustion progress in the F1 scheme.
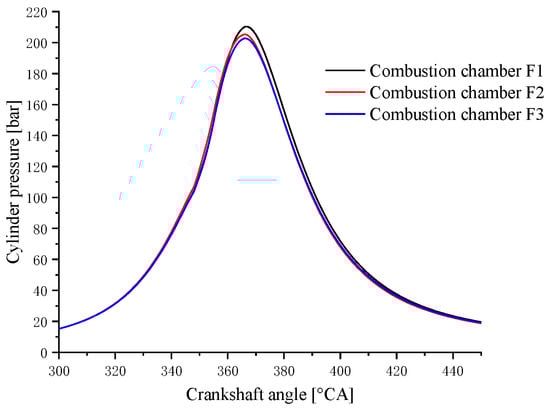
Figure 16.
Comparison of cylinder pressure curves of three combustion chamber schemes matched with the 160° spray angle injector.
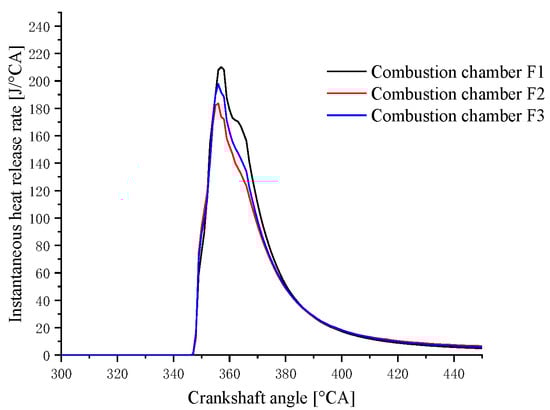
Figure 17.
Comparison of the instantaneous heat release rate curves of the three combustion chamber schemes matched with the 160° spray angle injector.
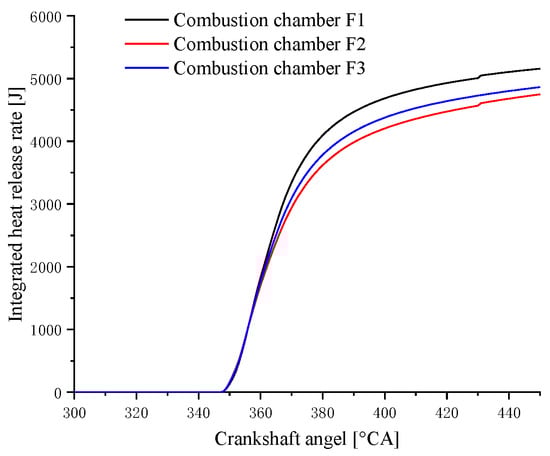
Figure 18.
Comparison of integrated heat release rate curves of three combustion chamber schemes matched with the 160° spray angle injector.
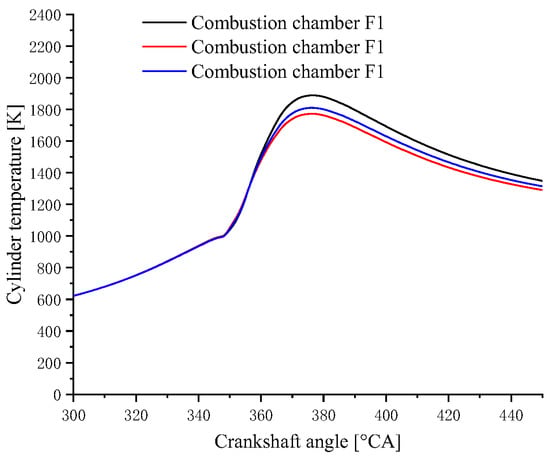
Figure 19.
Comparison of cylinder temperature curves of three combustion chamber schemes matched with the 160° spray angle injector.
The advantages of the F1 scheme compared with the cylinder process of the F2 and F3 schemes are analyzed below on the basis of nephograms at different times in the cylinder.
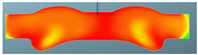
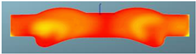
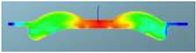
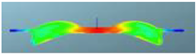
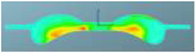
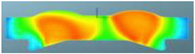
The fuel and gas equivalence ratios corresponding to the three combustion chamber schemes at different crankshaft angles are shown in Table 15. It can be seen that after 355 °CA, the corresponding nephograms of the three combustion chamber profiles begin to show obvious differences. The fuel–air equivalence ratio of the F1 scheme is higher, in the region of 0.8–1.2, and the rich fuel region is smaller, which indicates that the combustion chamber cooperates with the air movement in the cylinder in the F1 scheme, which can strengthen the formation of the mixture near the TDC and promote the diffusion of the mixture in the radial direction in the combustion chamber.
Table 15.
Comparison of the fuel–air equivalent ratio of three combustion chamber schemes matched with the 160° spray angle injector.
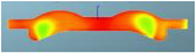
A comparison of the combustion reaction nephograms for the three combustion chamber schemes is shown in Table 16, on the basis of which it can be seen that at 350 °CA, the combustion reaction has already started in the central area of the combustion chamber, but the reaction area in which a high-intensity reaction is taking place, marked in red color, is slightly smaller in the F1 scheme than in the two schemes F2 and F3. When the reaction develops to 355 °CA and TDC, there is little difference in terms of the corresponding reaction area and the reaction intensity of three combustion chamber profile schemes. However, at 380 °CA, the F1 scheme almost becomes a red area, with higher intensity throughout the entire combustion chamber, and there are still green areas with lower reaction intensities in the F2 scheme and the F3 scheme; after 400 °CA, the reaction area and the intensity are basically same in the three schemes. This shows that the combustion process is relatively concentrated in the cylinder of the F1 scheme, which also confirms that the mixture shown in Table 12 is more homogeneous in the F1 combustion chamber.
Table 16.
Comparison of combustion reaction nephograms of the three combustion chambers with 160° spray angle injector.
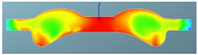
A comparison of the cylinder temperature nephograms of the three combustion chamber schemes is shown in Table 17. It can be seen from the figure at 350 °CA that the combustion reactions in the central area of the three combustion chamber schemes have all started, but the green area in the F1 scheme is slightly smaller than that of the other two schemes, and the low-temperature blue area caused by the evaporation of the front end of the spray is relatively obvious, which confirms the combustion reaction nephogram in the cylinder. This is consistent with the research results of Bang-Quan He [19]. The combustion temperature of the mixed gas in the thick mixing zone is relatively high. When the reaction process develops to 355 °CA and the top dead center, the high-temperature area and the intensity of the combustion reaction are not much different between the three combustion chamber schemes. After 380 °CA, the F1 scheme is almost a red high-temperature area, with high intensity throughout the entire combustion chamber, but the F2 scheme and the F3 scheme also have a local low-intensity green area, indicating that the F1 scheme has a more sufficient combustion reaction and concentrated heat release progress.
Table 17.
Comparison of cylinder temperature nephograms of the three combustion chamber schemes matched with 160° spray angle injector.
In summary, the F1 combustion chamber scheme is better able to match the air movement in the cylinder, effectively promote the fuel and gas mixing process and the utilization of the peripheral air of the combustion chamber, and concentrate the heat release process, which is more conducive to the utilization of fuel energy.
3.4. Engine Performance Verification
It is concluded in this paper that the combustion performance of the F1 combustion chamber and the 160° spray angle scheme is the best. Therefore, the combustor and injector of the two-stroke engine and the four-stroke engine used for the verification test employed this scheme. Based on the modified single-cylinder test bench, two-stroke performance tests were carried out. A comparison between the two-stroke calibration point test data and the original four-stroke calibration point test data and the corresponding heat release rate is presented in Table 18 and Figure 20 and Figure 21:
Table 18.
Engine test data.
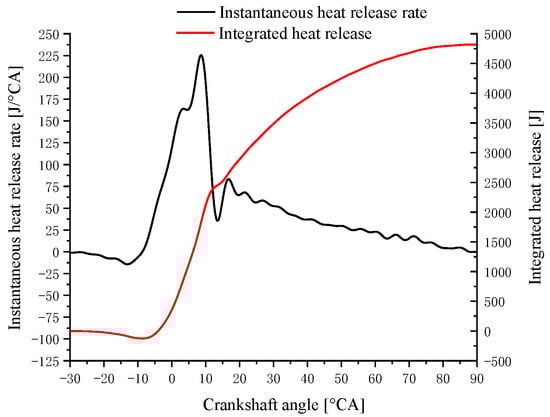
Figure 20.
Heat release rate in the two-stroke mode at 2500 rpm, 92 kW.
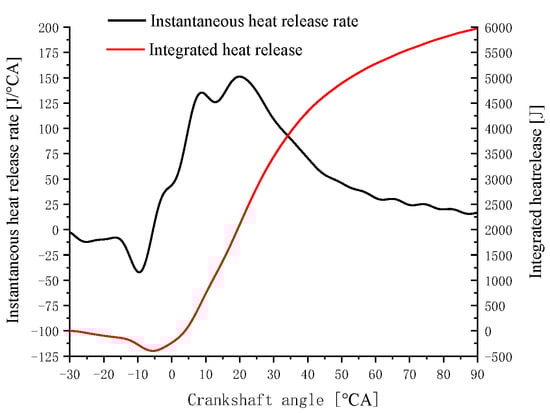
Figure 21.
Heat release rate in the original four-stroke mode at 4200 rpm, 92 kW.
A comparison of the performance data at rated operation for the poppet-valve two-stroke working mode and the original four-stroke mode is shown in Table 15. It can be seen from the comparative test data that the two-stroke working mode is able to achieve the same effective power output at 2500 rpm as that achieved by the four-stroke mode at 4200 rpm, and the peak pressure in-cylinder is basically the same level. With respect to the exhaust temperature, since a large amount of fresh air is discharged along with the exhaust gas in the previous cycle during the scavenging process of the two-stroke diesel engine, and there is a flow of fresh air directly into the exhaust pipe, the exhaust temperature at the rated point of the two-stroke operating mode is much lower than that of the four-stroke mode. In the table, the fuel consumption rate of the two-stroke rated point is better than that of the four-stroke working mode, mainly because the single-cylinder test bench uses an external compressor to supply air, and the power consumption of the scavenging loss and the scavenging pump loss are not considered. In addition, with the improved degree of engine strengthening, the heat transfer loss and air exchange loss of the engine increase synchronously, and under the same effective power output condition, in the four-stroke working mode, the speed of the piston and the crankshaft is much higher than that in the two-stroke mode, resulting in a substantial increase in frictional losses; therefore, there is no longer a thermal efficiency advantage.
4. Conclusions
In this work, a 3D combustion simulation model was built, in which the spray sub-model WAVE and the heat release sub-model ECFM-3Z were chosen and calibrated using test data acquired from a constant volume chamber test system and a single-cylinder engine test bench. Then, the combustion performance of the three different combustion chambers and three different spray angle schemes was compared and analyzed using both simulation and the engine test bench. The following conclusions were drawn:
- The corresponding thermal efficiency of the three schemes of combustion chamber shape was the highest when matched with the orifice scheme with a 160° spray angle. Under the premise of a certain amount of circulating fuel, all three of these combustion chambers were able to achieve their maximum indicated power when matched with the orifice scheme with a 160° spray angle, compared to being matched with a 150° or 146° spray angle injector. This shows that by reducing the volume of the combustion chamber and increasing the compression ratio, matching with the larger spray angle is more conducive to improving the mixing process of fuel and gas in-cylinder and accelerating the combustion heat release process.
- The effects of different chamber profiles (open, straight and re-entry) and spray angles on air–fuel equivalent ratio field, fuel burning rate, and engine performance were studied. After careful analysis and optimization, an open chamber profile F1 was determined. The F1 combustion chamber scheme was better able to match the movement of air in-cylinder and effectively promote the mixing process of fuel and gas and the utilization of the peripheral air in the combustion chamber. The mixture formed in the F1 combustion chamber was more uniform, and the heat release process in-cylinder was concentrated, which is more conducive to the utilization of energy.
- A single-cylinder test bench was built, and a two-stroke calibration point performance test was carried out. Under the same mechanical load limit, the two-stroke mode achieves the same power output at 2500 rpm as the four-stroke mode at 4200 rpm with a 7.5% reduction in specific fuel consumption. This indicates that the two-stroke working mode is able to achieve the same effective power output at a lower speed, and has a higher indicated thermal efficiency, which can be used as one of the important measures for the downsizing of diesel engines.
Author Contributions
Y.L. (Yaozong Li) wrote the main body of the paper. H.W. and L.Z. revised the paper. Y.L. (Yanli Liu), Y.Q., W.L., J.L., H.B., C.H. and Y.L. (Yang Li) performed the experiments. All authors have read and agreed to the published version of the manuscript.
Funding
This research was funded by the National Natural Science Foundation of China (Grant No. 52176098).
Institutional Review Board Statement
Not applicable.
Informed Consent Statement
Not applicable.
Data Availability Statement
Not applicable.
Acknowledgments
This work is supported by the National Natural Science Foundation of China (Grant No. 52176098). Any opinions, findings, and conclusions or recommendations expressed in this publication are those of the authors and do not necessarily reflect the views of the National Science Foundation.
Conflicts of Interest
The authors declare no conflict of interest.
Abbreviations
| OP | opposition piston |
| CFD | computational fluid dynamics |
| NOx | nitric oxide metabolite |
| SI | spark ignition |
| CAI | controlled auto-ignition combustion |
| HCCI | homogeneous compression combustion |
| rpm | revolutions per minute |
| GDI | gasoline direct injection |
| TDC | top dead center |
| BTDC | before top dead center |
| ATDC | after top dead centre |
| BDC | bottom dead center |
| BBDC | before bottom dead centre |
| ABDC | after bottom dead centre |
| BMEP | brake mean effective pressure |
| IMEP | indicated mean effective pressure |
| IVO | intake valve opening |
| IVC | intake valve closing |
| EVO | exhaust valve opening |
| EVC | exhaust valve closing |
| CA | crank angle |
| BSFC | brake specific fuel consumption |
| AI5 | crank angle of 5% of integrated heat release |
| AI50 | crank angle of 50% of integrated heat release |
| AI90 | crank angle of 90% of integrated heat release |
| CD | cycle duration |
| PMEP | pumping mean effective pressure |
References
- Tribotte, P.; Ravet, F.; Dugue, V.; Obernesser, P.; Quechon, N.; Benajes, J.; Novella, R.; De Lima, D. Two Strokes Diesel Engine—Promising Solution to Reduce CO2 Emissions. Procedia Soc. Behav. Sci. 2012, 48, 2295–2314. [Google Scholar] [CrossRef] [Green Version]
- Heywood, J.B.; Sher, E. Two-Stroke Cycle Engine: Its Development, Operation and Design; Routledge: New York, NY, USA, 1999; ISBN 978-1-560-32831-5. [Google Scholar]
- Flint, M.; Pirault, J.P. Opposed Piston Engines: Evolution, Use, and Future Applications; SAE International: Warrendale, PA, USA, 2009; ISBN 978-0768018004. [Google Scholar]
- Michael, A.W.; James, M.C.; Simon, J.; Hawkes, M.; Raimond, J. Indicated Cycle Efficiency Improvements of a 4-Stroke, High Compression Ratio, S.I., Opposed-piston, Sleeve-Valve Engine Using Highly Delayed Spark Timing for Knock Mitigation; SAE Technical Paper 2012-01-0378; SAE International: Warrendale, PA, USA, 2012. [Google Scholar] [CrossRef]
- Brojo, F.; Santos, A.; Gregorio, J. Computational Analysis of the Scavenging of a Two-stroke Opposed Piston Diesel Engine. In Proceedings of the World Congress on Engineering 2010 WCE, Hong Kong, China, 30 June–2 July 2010. [Google Scholar]
- Wei, H.; Chen, X.; Wang, G.; Zhou, L.; An, S.; Shu, G. Effect of swirl flow on spray and combustion characteristics with heavy fuel oil under two-stroke marine engine relevant conditions. Appl. Therm. Eng. Des. Processes Equip. Econ. 2017, 124, 302–314. [Google Scholar] [CrossRef]
- Osborne, R.J.; Stokes, J.; Lake, T.H. Development of a Two-Stroke/Four-Stroke Switching Gasoline Engine—The 2/4SIGHT Concept; SAE Technical Paper 2005-01-1137; SAE International: Warrendale, PA, USA, 2015. [Google Scholar] [CrossRef]
- Herold, R.; Wahl, M.; Regner, G.; Lemke, J.; Foster, D.E. Thermodynamic Benefits of Opposed-Piston Two-Stroke Engines; SAE Technical Paper 2011-01-2216; SAE International: Warrendale, PA, USA, 2011. [Google Scholar] [CrossRef] [Green Version]
- Regner, G.; Herold, R.E.; Wahl, M.H.; Dion, E.; Redon, F.; Johnson, D.; Callahan, B.J.; McIntyre, S. The Achates Power Opposed-Piston Two-Stroke Engine: Performance and Emissions Results in a Medium-Duty Application. SAE Int. J. Engines 2011, 4, 2726–2735. [Google Scholar] [CrossRef]
- Regner, G.; Johnson, D.; Koszewnik, J.; Dion, E.; Redon, F.; Fromm, L. Modernizing the Opposed Piston, Two Stroke Engine for Clean, Efficient Transportation; SAE Technical Paper 2013-26-0114; The Automotive Research Association of India: Pune, India, 2013. [Google Scholar] [CrossRef] [Green Version]
- Redon, F.; Kalebjian, C.; Kessler, J.; Rakovec, N.; Headley, J.; Regner, G.; Koszewnik, J. Meeting Stringent 2025 Emissions and Fuel Efficiency Regulations with an Opposed-Piston, Light-Duty Diesel Engine; SAE Technical Paper 2014-01-1187; SAE International: Warrendale, PA, USA, 2014. [Google Scholar] [CrossRef] [Green Version]
- Pugnali, L.; Chen, R. Feasibility study of Operating 2-stroke Miller Cycles on a 4-stroke Platform through Variable Valve Train; SAE Technical Paper 2015-01-1974; SAE International: Warrendale, PA, USA, 2015. [Google Scholar] [CrossRef] [Green Version]
- Knoll, R. AVL Two-Stroke Diesel Engine; SAE Technical Paper 981038; SAE International: Warrendale, PA, USA, 1998. [Google Scholar] [CrossRef]
- Zhang, Y.; Zhao, H. Investigation of combustion, performance and emission characteristics of 2-stroke and 4-stroke spark ignition and CAI/HCCI operations in a DI gasoline. Appl. Energy 2014, 130, 244–255. [Google Scholar] [CrossRef] [Green Version]
- Mattarelli, E.; Cantore, G.; Rinaldini, C.A.; Savioli, T. Combustion System Development of an Opposed Piston 2-Stroke Diesel Engine. Energy Procedia 2017, 126, 1003–1010. [Google Scholar] [CrossRef] [Green Version]
- Li, Y.; Li, X.; Shi, Z.; Li, Y.; Wang, Z.; Liu, W.; Liu, Y. Development of a reverse-loop scavenged poppet-valve 2-stroke diesel engine for down speed and performance comparisons with its 4-stroke baseline. Fuel 2022, 322, 124199. [Google Scholar] [CrossRef]
- Wu, H.; Zhang, Z.; Zhu, D.; Ai, Y.; Li, X. Spray entrainment coefficient modeling for high injection pressure based on entrainment velocity and force analysis. ASME J. Fluids Eng. 2022, 144, 101402. [Google Scholar] [CrossRef]
- Reitz, R.D. Modeling Atomization Processes in High-Pressure Vaporizing Sprays. At. Spray Technol. 1987, 3, 309–337. [Google Scholar]
- He, B.-Q.; Lin, C.-L.; Li, X.; Wang, X.; Zhao, H.; Zhang, Y. Numerical study of the mixture formation and stratified-flame-induced auto-ignition (SFI) combustion processes in a poppet-valve two-stroke direct injection gasoline engine. Appl. Therm. Eng. 2019, 152, 654–665. [Google Scholar] [CrossRef]


Publisher’s Note: MDPI stays neutral with regard to jurisdictional claims in published maps and institutional affiliations. |
© 2022 by the authors. Licensee MDPI, Basel, Switzerland. This article is an open access article distributed under the terms and conditions of the Creative Commons Attribution (CC BY) license (https://creativecommons.org/licenses/by/4.0/).