Article

Improved Method for Testing Integrity Loss of Wells with Sustained Casing Pressure

by
Mohammad Kazemi
1,* and
Andrew K. Wojtanowicz
2,*
1
Department of Physics and Engineering, Slippery Rock University, Slippery Rock, PA 16057, USA
2
Craft & Hawkins Department of Petroleum Engineering, Louisiana State University, Baton Rouge, LA 70803, USA
*
Authors to whom correspondence should be addressed.
Energies 2022, 15(10), 3632; https://doi.org/10.3390/en15103632
Submission received: 1 April 2022 / Revised: 5 May 2022 / Accepted: 10 May 2022 / Published: 16 May 2022

Abstract

:
The pressure bleed-down/build-up (B/B) testing is enforced by the Bureau of Safty and Environmental Enforcement (BSEE) regulations in the US for gas-leaking wells with recurrent casing head annular pressure dubbed “Sustained Casing Pressure” (SCP). The bleed down test involves bleeding the pressure with a needle valve. Once the pressure reached to zero or stabilized, the valve is closedand a 24-h pressure monitoring starts. Analysis of the tests mandated by regulations involves merely a qualitative assessment of the low or high level of environmental risk measured by leak size. A quantitative analysis—based on mathematical models—has been already proposed and used for sizing cement leaks but the models give ambiguous results due to oversimplifying assumptions of the cement leak system and disregard for the testing procedure. This work addresses shortcomings of the current B/B testing and analysis methods by approaching the testing procedure as a source of useful information about the system of annular well leakage. We demonstrate that using a mathematical model for globally matching all stages of the B/B test data would prioritize the pressure bleed-down stage over the buildup stage thus making the latter stage mostly irrelevant in providing information on the whole gas migration system. We verify the hypothesis that a stage-wise analysis would improve the results by separately considering three stages of the B/B test: pressure bleed down, constant flow (steady-state), and pressure buildup, and, then, comparatively reconciling values of the system parameters. The stage-by-stage approach is feasible because—as shown by the sensitivity analysis—each stage is controlled mostly by a single parameter. Also presented is the development of an improved procedure for performing the B-B test. The study shows that the operational parameters controlled by the test operator—duration and size of the needle valve opening, and pressure recording time step, might significantly change values of the test output—the minimum bleed down, and the maximum 24-h buildup pressures. It is also found that the zero bleed-down pressure does not necessarily indicate that the leak is small as it also depends upon the length and properties of the annular fluid column above the cement top.

1. Introduction

The pressure at the casing head of a well that rebuilds even after the bleed down is called Sustained Casing Pressure (SCP) [1]. By definition, SCP is not imposed by the operator or caused by temperature fluctuations. The main cause of SCP is a leaking cement sheath through which the gas flows through the annulus from a high-pressure formation. A column of mud may exist in the annulus on top of the cement sheath. The gas percolates through this column and accumulates at the casing head causing excess pressure at the surface.
In the US, Mineral Management Service—presently the Bureau of Safety and Environmental Enforcement (BSEE)—established regulations to address sustained casing pressure in oil and gas wells (BSEE 30 CFR Part 250, 2011). They developed the rules for managing SCP and established criteria to monitor and test these wells.
The B/B test begins with the pressure bleed-down stage when the casing head pressure is vented out through a half-inch valve. Once the pressure drops to zero or stabilizes at a certain value the needle valve is closed so the pressure rebuilds for 24 h. Most typical plots of B/B tests are depictedin Figure 1 for the case when the annular gas leak is large (Figure 1a) or small (Figure 1b). If the leak is large buildup pressure would stabilize at its initial value in 24 h. In case of small leak, ther would be slow pressure buildup with more than 24 h needed for pressure stabilization.
American Petroleum Institute (API) [2] published simplified diagnostic criteria for B/B test analysis published in API RP-90 and 10 CFR 250 Subpart E. The criteria only consider if the pressure would bleed down to zero and rebuild to its initial value within 24 h time period. As shown in Figure 2, when the pressure bleeds down to zero and builds back up slowly to a low valuewithin 24 h the rate of gas leak is small and the environmental risk of breaching the pressure containment barrier is considered acceptable. Moreover, a gas leak is considered large when the pressure drops to zero and rebuilds quickly (within 24 h). In case when pressure does not bleed to zero and quckly rebuilds the leak rate is high and so is the environmental risk of the containment failure.
In addition to pressure, API also recommends measuring and recording the amount of fluid recovered during the B/B test. In all, the API approach is mostly qualitative without offering a specific method for sizing the gas leak value. Moreover, API does not have a specific protocal for the B/B testing and the testing procedure depends on the operator. (API RP-90, 2006).
Quantitative analysis of B/B tests has been developed by modifying the mathematical models proposed by Xu et al. in 2001, 2003, and 2017 [3,4,5,6]. The model developed by Xu et al. (2001) [4] assumes a Newtonian fluid in the annulus and gas flow is modeled based on this assumption. As a result of such an assumption, the gas is not trapped in the annular fluid sothe fluid’s compressibility remains constant.The gas migration time through the annular fluid is also ignored. Once the gas reaches the top of the annulus, the gas accumulates and forms a gas chamber (below the casing head and above the fluid level). The model calculates the gas chamber pressure at each time step using an analytical formula. The effect of well and formation parameters including the formation pressure, cement leak conductivity (generalized as cement permeability), mud compressibility, and casing gas chamber on SCP buildup pressure can be evaluated using the model. The 2001 Xu model produced oversimplified predictions.
In 2002, Xu et al. [3] modified their model by considering the two-phase gas flow in a non-Newtonian (power-law) fluid. A transient gas flow in the leaking cement was assumed and coupled with the flow in the annular fluid. In the modified model, the pressure bleed-down stage of the B/B test is represented separately from the build-up stage. The unknown parameters of the system are the size of the gas chamber, high-pressure formation depth and pressure, annular fluid compressibility, and the permeability of the leaking cement. These parameters are found using a trial and error process. The bleed-down and buildup model matching are separated from each other. The improved model was also used to identify typical patterns of the B-B test pressure change by matching data from SCP field testing [5]. Matching all parameters together in this analysis method causes ambiguity in the obtained unknown parameters.
The 2001 build-up model was utilized by Huerta et al. [7] to determine the gas source pressure, cement permeability, and depth for two fields with CO2 leakage issues. The annular fluid was assumed to be Newtonian and therefore the gas entrapment was ignored. This assumption can significantly alter the pressure buildup stage analysis as the mud compressibility notably affects the gas chamber pressure. From known values of the length of Newtonian annular fluid and stabilized casing head pressure, the gas source pressure was calculated hydrostatically. The computations required making educated guesses about the depth of the gas source. The best match between the field pressure buildup data and the model was obtained by iterating the cement permeability. The best match comes from repeated guessing. The best match determines the values of the gas source depth and cement failure severity (permeability). Another assumption made in Huerta’s et al. [7] study was that the gas chamber did not exist at the start of the buildup stage (zero volume). It was assumed that the gas chamber forms by compressing the annular fluid. This assumption may not be accurate as the free fluid level in the annulus is usually unknown and must be determined by analyzing the B/B test.
Another similar study to Huerta et al. [7] is the work of Tao et al. [8]. They used the same hydrostatical method as Huerta [7] (discussed above) to determine the source pressure with the assumption of free gas mud column. The annular fluid compressibility was determined using its correlations with density. The cement top depth, pressure buildup history, and mud density were used to determine the depth of the high-pressure formation and permeability of the cement. The permeability determined from Tao’s [8] study was very small as the pressure buildup happened over 400 days while the B/B test pressure buildup data is for 24 h. The Monte-Carlo simulations were performed to determine the cement permeability for assumed boundary values of depth. Similar to Heurta [7], the best model fit to pressure buildup history provides the values of gas source depth and effective permeability.
Zhu et al. [9] confirmed the Xu [5] model by using the model and applying it to once SCP field B/B test. They did not discuss the fitting method or the number of unknown parameters in their simulations.
Another form of SCP study with a focus on the maximum air emission rates (MER) in the case of a failed casing due to SCP was performed by Kinik et al. [10]. Since the casing was considered failed, atmospheric pressure was assumed at the casing head. The gas flows linearly through the cement column reaching a stagnant Newtonian annular fluid. A two-phase flow of gas and water occurs in this column of fluid reaching the surface with atmospheric pressure. The two-phase flow in the annular fluid was modeled using Caetao et al.’s [11] mechanistic model which provides the criteria for flow regime transitions and pressure gradients. As the gas bubbles percolate through the annular fluid, their volume increases especially in the top section of the mud column which results in liquid unloading. This liquid unloading is considered in Kinik’s model by computing the gas and mud total volume at each time step and comparing it with the annulus volume. Kinik’s model is different from other SCP models as it assumes that the cement permeability, initial volume of the gas chamber, and the gas source formation pressure are known from the B/B test analysis. Therefore, the model is suitable for open annulus testing.
In our more recent study (Yao et al. [12]) we quantified the environmental risk of air pollution due to SCP by introducing two metrics to be determined from the B/B test: maximum downhole rate of gas leakage at the top of the cement sheath column (TOC), and the potential annual rate of atmospheric gas emission from leaking well with failed casing head. The second metric considers a two-phase flow in the fluid column above TOC. We also proposed threshold maximum values for the two metrics—adopted from the oil industry standards for downhole safety valves (maximum 15 scf/min downhole gas rate across the leaking cement), and from the regulatory limits for venting volatile organic compounds (6 tons per year annual gas emission).In our study, we verified the new metrics by analyzing field data from B/B testing of 19 wells. In the analysis, we used an in-house B/B test simulator to match all data from the entire test for each well, i.e., pressure bleed-down and pressure buildup. The approach quantifies the severity of the gas leaks using the proposed metrics of environmental risk.
The results showed that 15.8% of wells exceeded the maximum downhole gas rate threshold and 26.3% of wells failed the annual gas emissions threshold. Moreover, values of the new metrics for the SCP wells that could be bled down to zero pressure were mostly smaller than the maximum threshold values indicating no need for the pressure buildup stage in such wells. It was concluded that the 24-h pressure build-up stage of the B/B test did not uniquely correlate with the risk metrics and, therefore, would not qualify as a unique measure of cement integrity. The conclusion seems questionable since it would disregard the physical effect of gas migration in the column of liquid above TOC. A more reasonable explanation comes from a hypothesis that globally matching all B/B test data would prioritize the pressure bleed-down stage over the buildup stage thus making the latter stage mostly irrelevant in providing information about the whole gas migration system. Therefore, the B/B test stages should be analyzed comparatively to remove ambiguity resulting from each of them alone.
In this work, we would verify the above hypothesis and evaluate the quality of information discerned from the B/B testing as a solution to the inverse problem, i.e., finding four parameters of the leaking well system including the compressibility and the length of the mud column and the permeability and length of the cement sheath. Using the analysis of variance and multivariate regression methods we identify significant parameters controlling each of three stages of the B/B test: pressure bleed-down, stabilization, and buildup. If the significance varies, then a stage-by-stage analysis of the 3-stage test would be more accurate than the presently—practiced method of matching all data from the two-stage testing. To properly represent the effect of gas migration in the liquid above TOC, we would improve the hydraulics of the B/B test simulator to consider a column of the yield-power-law fluid (Herschel-Bulkley) instead of the power-law (or Newtonian) fluid used in the previous models. A stage-by-stage interpretation approach is used to analyze three stages of B-B tests—pressure bleed-down, constant flow, and pressure build-up stage. The study would also include a sensitivity analysis of the three stages to identify the most important parameters affecting each stage of the test. Finally, a new procedure for B/B testing is proposed.
Finally, we would assess the procedure of B/B testing by considering three operational parameters (bleeding rate and time, and pressure recording time step). We demonstrate a significant effect of the parameters on the well response that may cause misinterpretation of test results—a premature closure of the bleed valve eliminates the pressure stabilization stage and deforms the pressure buildup causing erroneous cement leak size determination.

2. Parameters Affecting the B/B Test Results

System parameters are the parameters that are not in the control of the operator and are related to the properties of cement column, mud column, gas chamber, and gas source formation. The system response to the B-B test is a function of four annular system parameters. These parameters are unknown and hard to obtain.
Operational parameters include parameters that are in control of the operator and have a significant effect on pressure curves and consequently on B-B test analysis. The operation of a B-B test needs the operator to decide about these parameters that are controllable. A wrong decision about these parameters misleads the interpretation of these tests.
At first, we perform the sensitivity analysis of the system parameters on each stage of the B/B test. This will allow us to perform a stage-by-stage analysis of the tests. Then, we study the effect of the operational parameters on the B/B test pressure curves and develop the testing protocols.

3. Sensitivity Analysis of System Parameters

In order to perform the sensitivity analyses, we need to identify different annulus configurations. Typical well completion includes cementing the annulus between two consecutive casings and the pressure gauge on all annuli should read zero.
Depending on failure type, different gas flow paths (Figure 3) may result as follow:
  • Flow through the liquid column only
If the casing failure happens to be at the annulus A casing shoe, the gas will flow through the liquid existing in annulus A. This annulus doesn’t have cement and hence, the only medium for gas to flow is liquid contained in this annulus.
2.
Flow through the cement only
Typically two possible configurations exist for an annulus (except annulus A); cemented to the top and an annulus containing a liquid column above the cement. In case the annulus cemented to the top, the only path for gas flow would be through leaking cement.
3.
Flow through both cement and liquid
In the case where both the cement and annular fluid columns exist, the fluid permeates through the leaking cement and then flows through the annular fluid to reach the casing head.
Figure 3. potential leak paths resulting in SCP.
Energies 15 03632 g003
In an annulus containing a cement column and the mud column above it, the important parameters are gas source formation pressure (pf) and depth (Df), cement permeability (k), trapped gas concentration in mud (Fgt), the initial volume of the gas chamber (Vgci).
B - B   test   result = f p f , D f , k , V gci , F gt
In annulus cemented to the surface, the interpretation of the B-B test includes determining these unknown values which are source formation pressure and depth, and cement sheath leak rate (k).
B - B   test   result = f V gci , p f , D f , k
where Pf is the gas source formation pressure, k is the cement permeability, Vgc is the constant gas chamber volume, and Df is the formation depth.
In annulus A, where only the mud column exists, the important parameters are the initial volume of the gas chamber, and trapped gas concentration in mud.
B - B   test   result = f p f , D f , V gc , F gt
The sensitivity analysis is performed for the general annulus configuration (annulus containing both liquid and cement columns) by utilizing the multiple linear regression and a two-level factorial design. The procedure for the sensitivity analysis starts with selecting the lower and upper bound of each factor. The mathematical model is then used to determine the casing head pressure responses for those two levels. The linear relationship between the selected factor and the pressure response is then determined using the F-test. The importance of each factor to change the casing head pressure is eventually determined by performing the t-test.
Table 1 demonstrates the 4 independent variables assumed in this work that affects the casing pressure (dependent variable) during the B/B test. A complete factorial design was used in this study which results in 24 = 16 pressure bleed-down and buildup simulation runs.
The multiple regression model is
P csg = β 0 + β 1 P f + β 2 k + β 3 F gt + β 4 V gci + ε
The regression coefficients (βj, j = 0, 1, 2, 3, and 4) are computed using the least square method that minimizes the sum of the squares of the errors. The linear regression model suffices in determining the important parameters affecting the dependent variable while a higher-order regression model would provide a more accurate description of the system.
Of four parameters that were tested only the initial volume of the gas chamber and trapped gas concentration in the mud had a significant effect on pressure bleed down (Table 2). The trapped gas concentration is a function of the annular fluid yield point and can be determined independently as will be shown in this paper. Although the effect of formation pressure and cement permeability is observed in longer bleed downs, the only dominating parameter affecting the bleed-down stage is the volume of the gas chamber.
As shown in Table 3, it is found that the buildup stage is mainly affected by the conductivity of the cement column (k), gas source pressure (pf), and compressibility of the mud column (cm). In addition to these, the volume of the gas chamber also plays important role in build-up, however; this parameter will be fixed and known after simulating the bleed down. Figure 4 shows different stages of the B-B test and different parameters affecting each stage.
Sensitivity analysis demonstrates that a stage-by-stage analysis can be performed since each stage of the B/B test is not a function of all unknown parameters.

4. Casing Pressure Test Analysis Method

The new analysis method starts by investigating the bleed-down stage and is followed by evaluating the constant flow and build-up stages. Each annulus configuration is separately analyzed and the methods are offered for determining each parameter of interest.

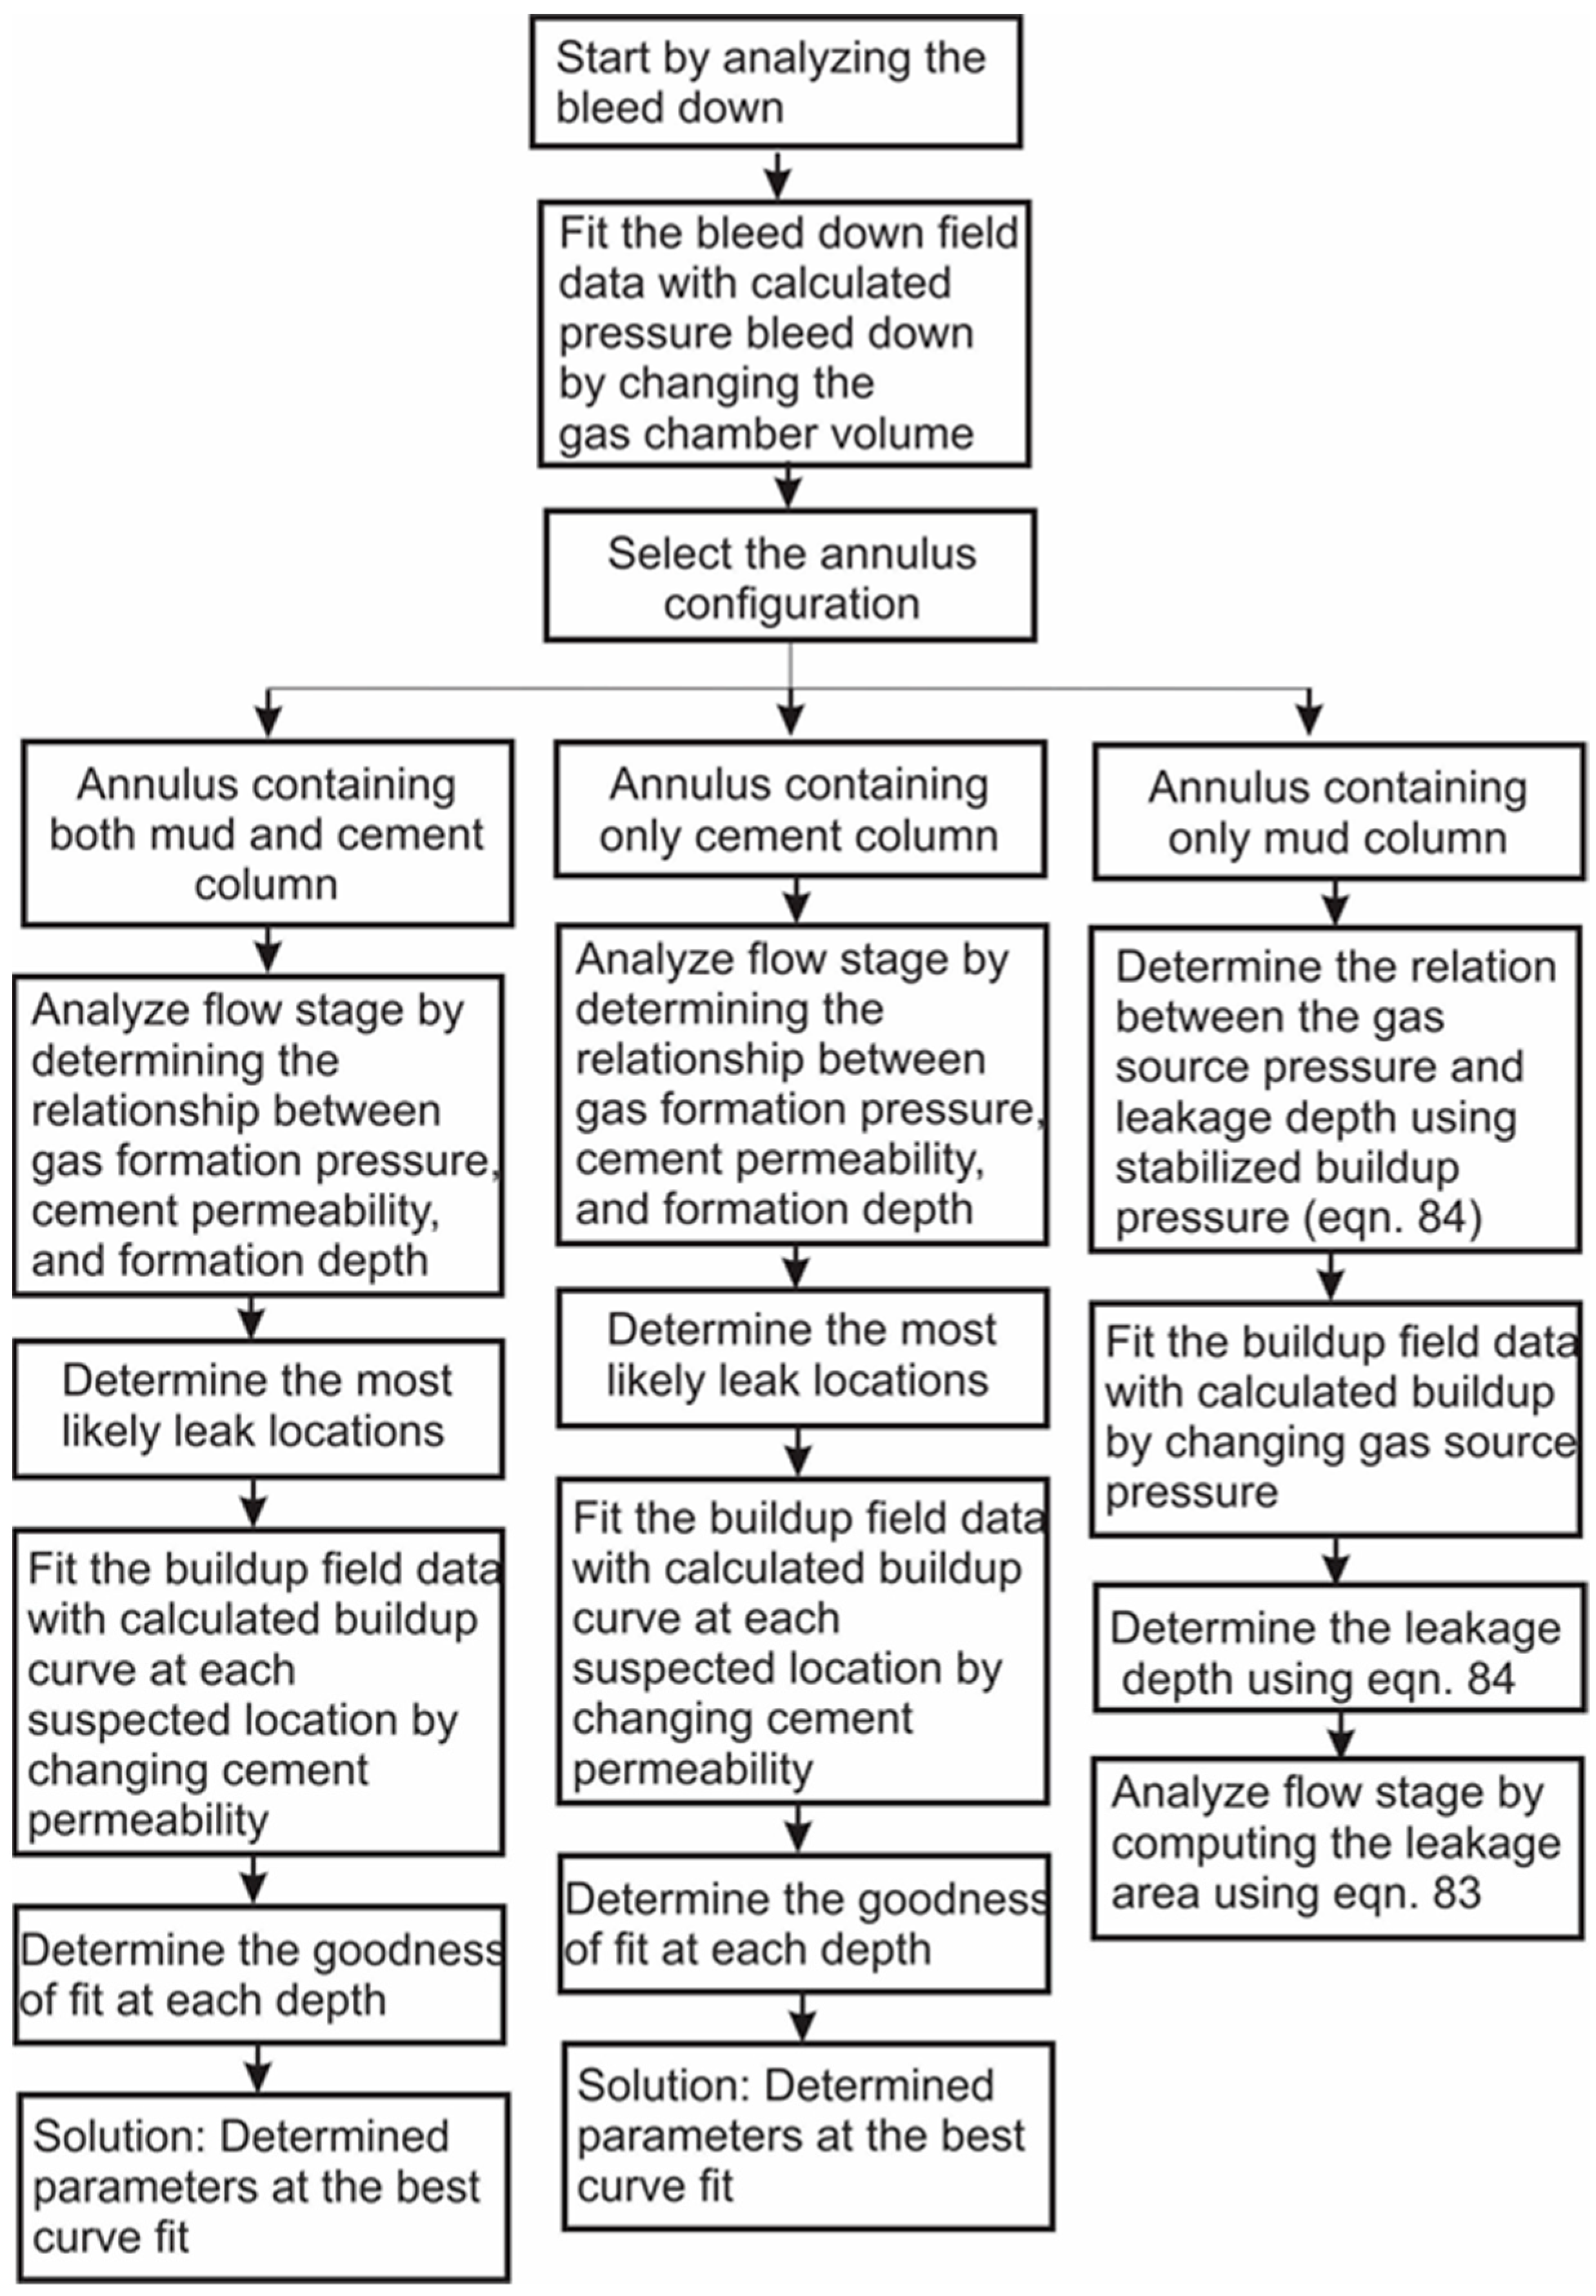
4.1. Analysis of Pressure Bleed Down Stage

It should be mentioned that the bleed-down analysis will be the same for all three annulus configurations; however, the analysis of the flow stage and build-up stage will be different depending on the annulus configuration. Hence, the bleed-down analysis is not separated for different annulus configurations. As mentioned earlier, the bleed-down stage in the current model is affected mostly by the initial gas chamber volume and trapped gas concentration in the annular fluid. The trapped gas concentration is representative of annular fluid compressibility and can be determined independently from other parameters using the correlation derived by Johnston et al. [13] as follow,
10 4 F gt = 0.25 τ y 2 + 2 τ y 7 10 14
where τy is the annular fluid yield point.
Figure 4. Different stages of the B-B test with the important parameters affecting each stage (adapted with permission from Kazemi et. al, SPE, 2014 [14]).
Energies 15 03632 g004
Therefore, analyzing the bleed-down stage will include fitting the calculated bleed-down curve to the field bleed-down test with the volume of the gas chamber as the fitting parameter. The procedure is such that the known system parameters (well geometry, liquid column properties) will be used as input to the model. Since the only parameters affecting bleed-down are initial gas chamber volume, dummy values will be used for unknown system parameters such as cement permeability, gas source pressure, and leak depth. The calculated bleed-down curve from the model will be matched by the actual bleed-down data (from the SCP well) by iterating on the initial gas chamber volume (Figure 5). Once the match is obtained, the gas chamber volume is determined.

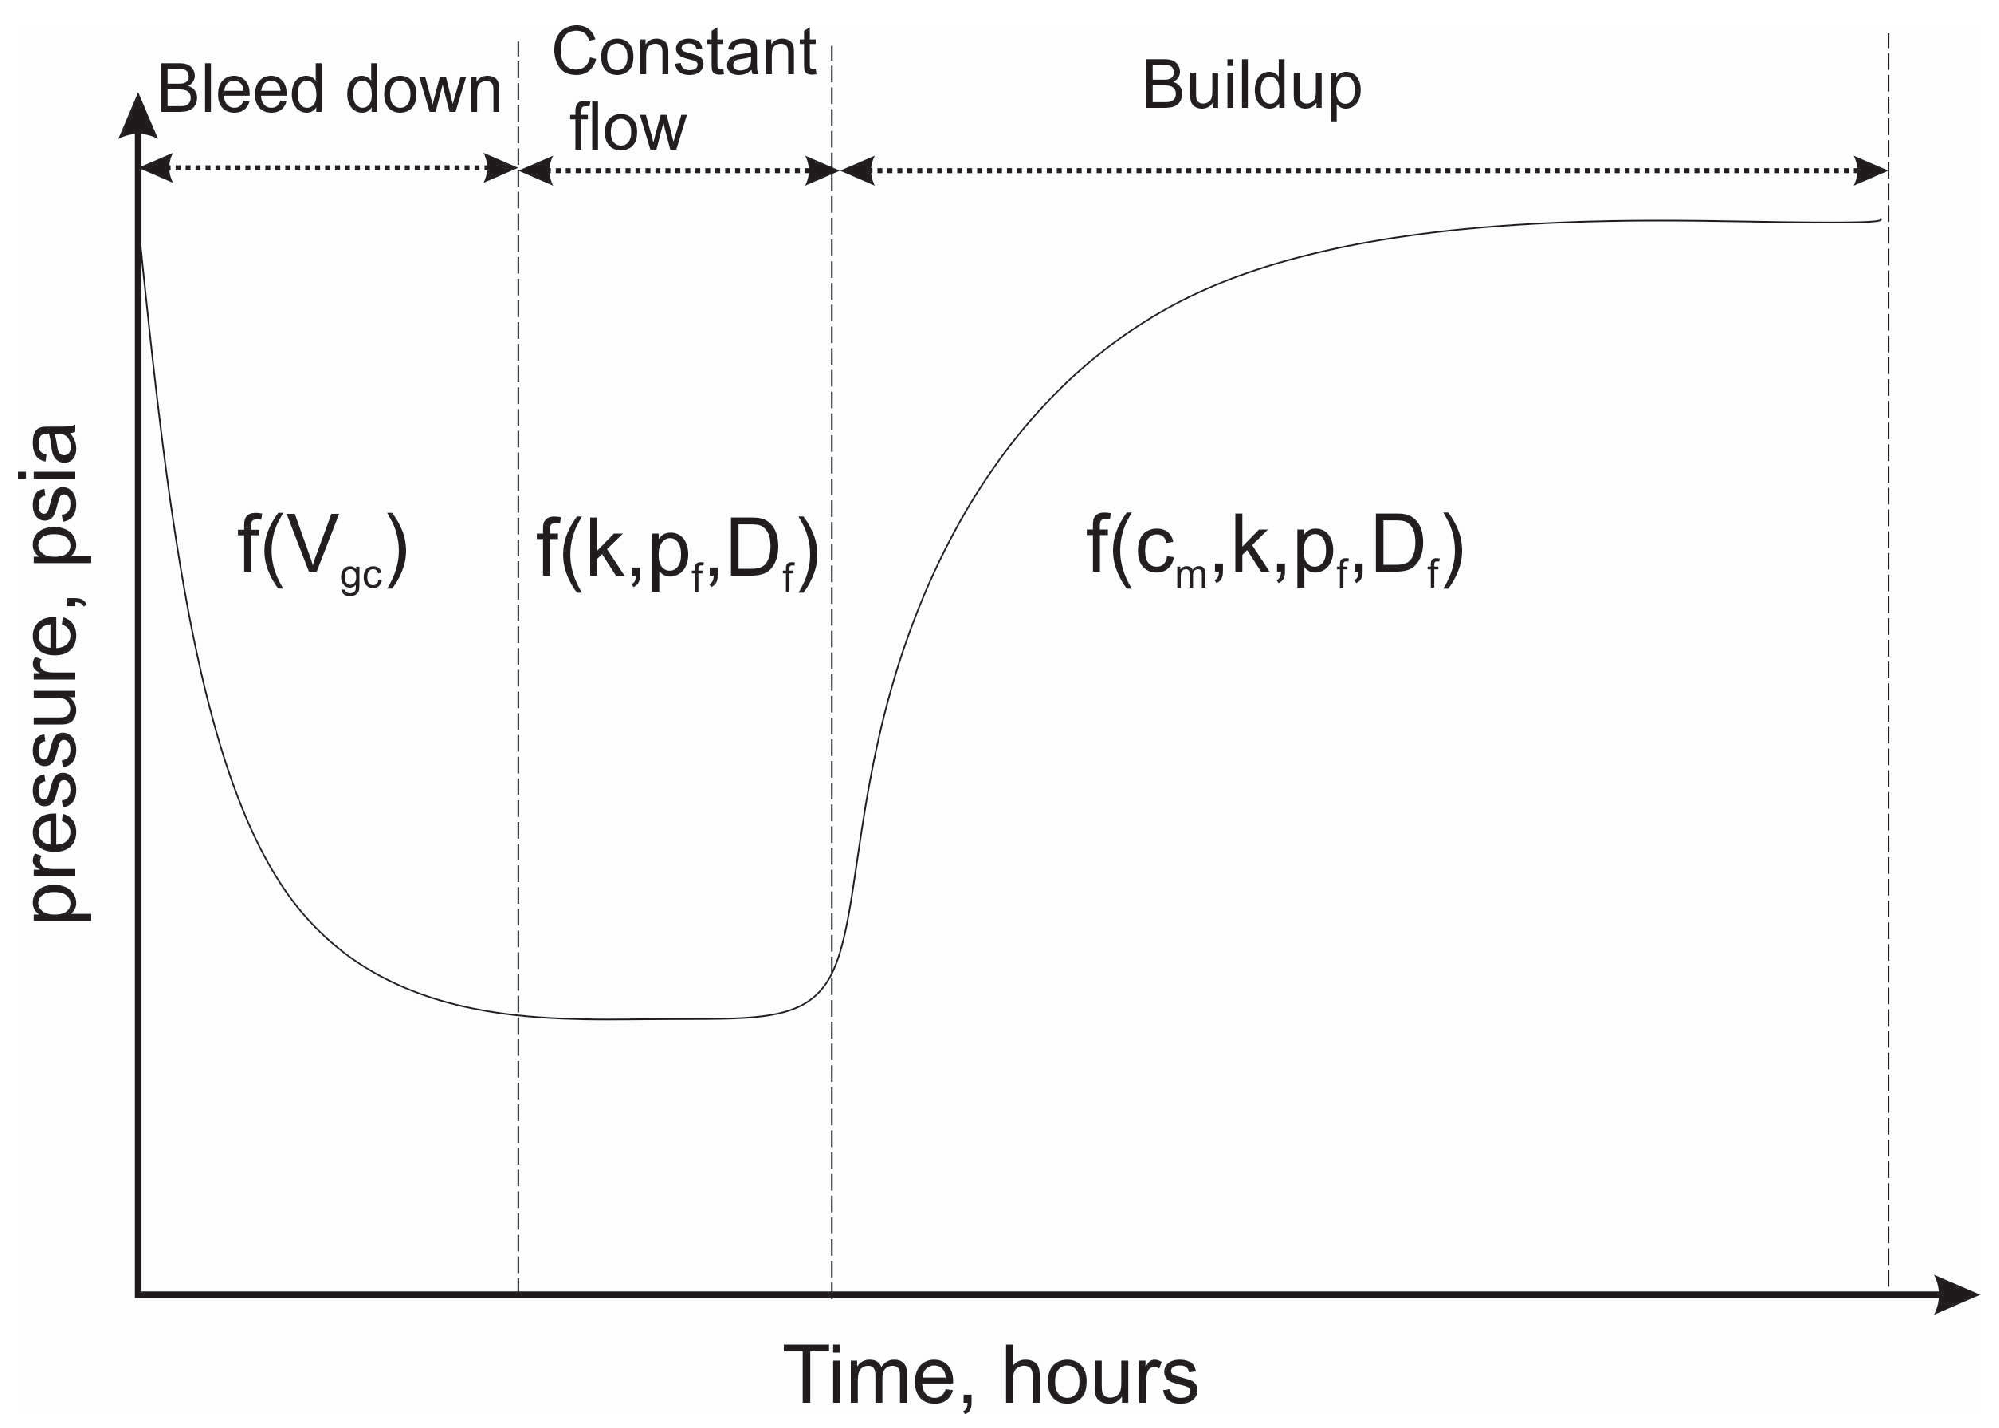
4.2. Analysis of Constant Flow Stage

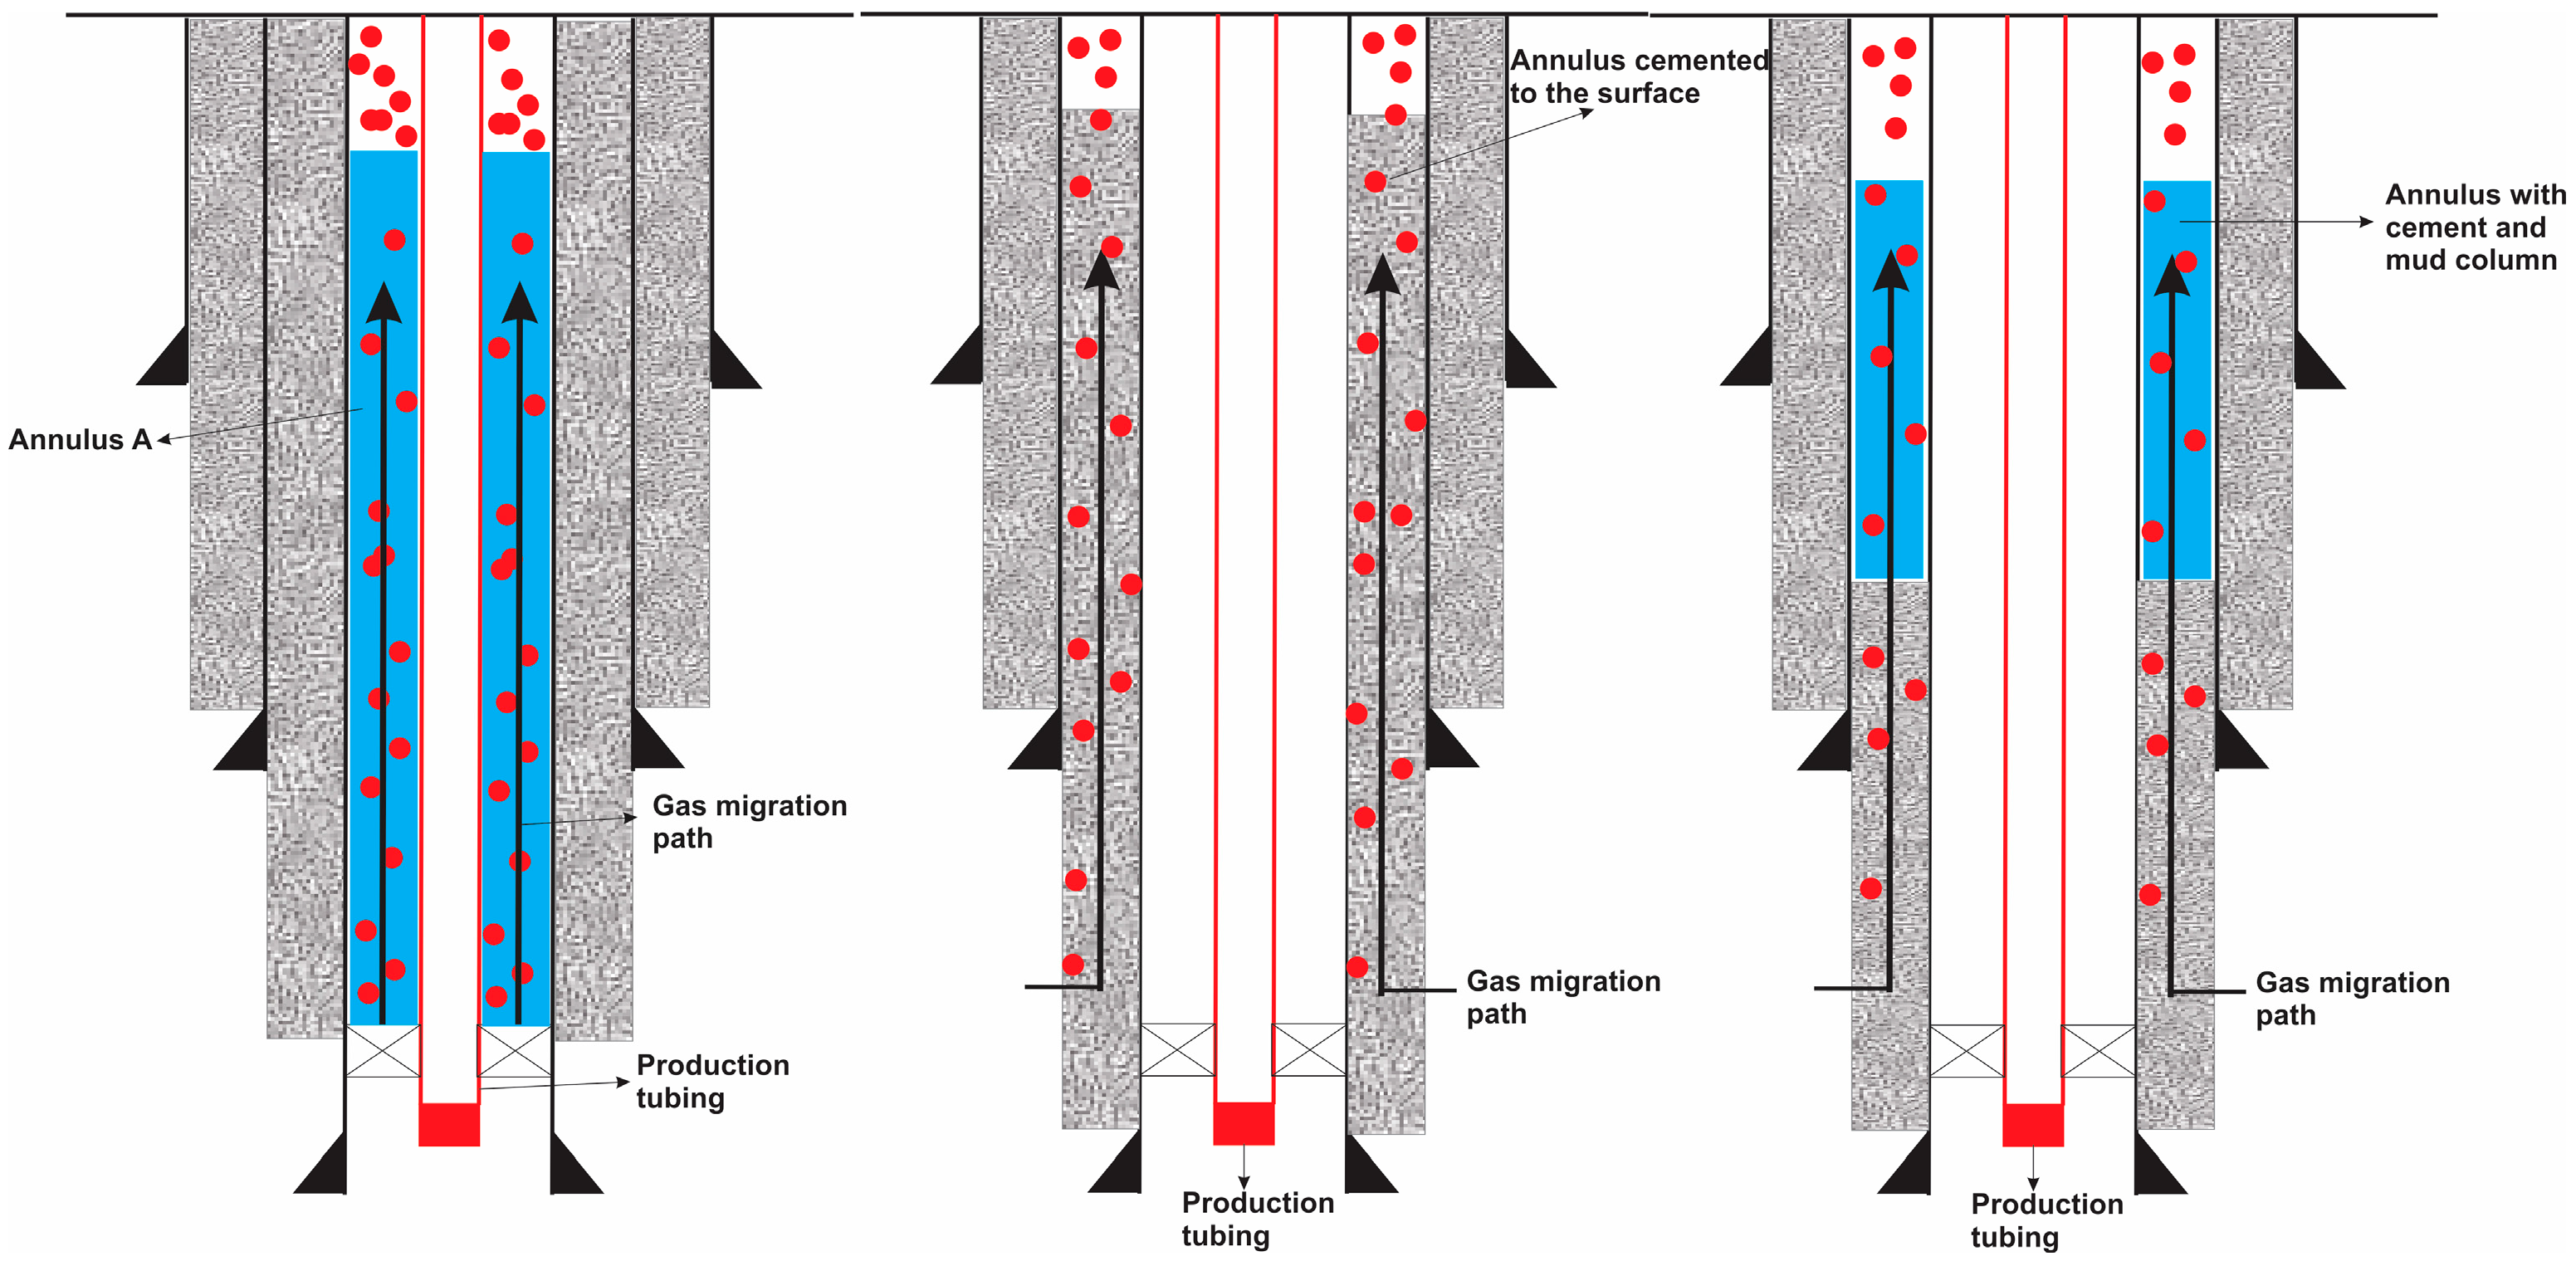
4.2.1. Annulus with Liquid Column above Cement Top

The flow stage is the period in which constant pressure is observed at the casing head at the end of pressure bleed down. During this stage, a steady-state flow is expected in both liquid and cement columns. Since the pressure and flow rate are known and constant at the wellhead, the pressure at the cement-liquid column interface can be determined as follow
p c = p cf + ρ m gL mc
where pc is the pressure at the cement/liquid interface, pcf is the constant casing head pressure in the flow stage, and Lmc is the length of the liquid column. The gas flow rate at the interface is known (using the mathematical model) since the pressure and flow rate at the casing head are known. The steady-state linear gas flow in the porous medium can be written as (Al-Hussainy et al. [15]),
m p f = m p c + 0.003164 kAT sc p sc T ws D f q g
where,
  • k = cement effective permeability, md
  • Df = cement length, ft
  • Tws = cement top temperature, °F
  • A = Annulus area, ft2
  • pf = formation pressure, psi
This equation reduces the problem’s degree of freedom by one by relating the cement permeability to the formation depth, and the gas source formation pressure.
k = f p f , D f

4.2.2. Annulus Cemented to the Top

Equation (6) can be applied to annuluses cemented to the top; however, the interface pressure (pc) will be equal to constant casing head pressure during the flow stage. Thus, Equation (6) can be rewritten as follow:
m p f = m p cf + 0.003164 kAT sc p sc T ws D f q gin
where qgin is the gas rate entering the gas chamber and can be calculated using the mass balance relation as follow,
m in m out = m c
where min is the gas mass entering the gas chamber, mout is the gas mass bleeding out, and mc is the constant mass inside the gas chamber.
m in = ρ g q gin t
and,
m out = ρ g q gout t
where qgout is the gas flow rate through the needle valve and should be recorded by the operator. The constant mass of gas in the annulus is determined from the equation of state as follow,
m c = p cf V gc M w zRT
in which pcf is the constant flow pressure at the casing head. Substituting Equations (10)–(12) into Equation (9) we have,
q gin = 1 ρ g t q gout ρ g t + p cf V gci M w zRT ws
As mentioned above, this equation reduces the problem’s degree of freedom by one by relating the cement permeability to the formation depth, and the gas source formation pressure.

4.2.3. Annulus Containing Only Liquid Column

During the flow stage the pressure at the casing head, gas void fraction in the liquid column, and the gas injection rate at the gas-liquid interface are constant and known (using the mathematical model). Hence, the subcritical gas flow rate at the leak point can be described by the gas source pressure, and leak area as follows (Takács [16]):
q scg = 155.5 C d Ap 1 2 g k h k h 1 F du 2 k F du k + 1 k γ g T 1
where,
  • qscg = gas flow rate at standard conditions (14.7 psia and 60 °F), Mscf/day
  • Cd = discharge coefficient = 0.865
  • A = area of opening, sq in.
  • p1= source pressure, psia
  • p2 = pressure in mud column at the leakage depth, psia
  • g = acceleration of gravity, ft/sec2
  • kh = ratio of specific heats, dimensionless
  • T1 = temperature in mud column at the leakage depth, °R
  • Fdu = ratio of downstream pressure to upstream pressure, consistent units, Fdu = Fcf if Fdu < Fcf and Fdu = p2/p1 if Fdu > Fcf
  • Fcf = critical flow pressure ratio = ( 2 k + 1 ) k k 1
Equation (14) describes a relation between the gas source pressure, leakage area, and the gas flow rate at the leakage point. Once the gas source pressure is known from buildup, the leakage area can be determined using Equation (14).

4.3. Analysis of Pressure Build up Stage

4.3.1. Annulus Containing Both Cement and Mud Columns

Results of sensitivity analysis showed that the important parameters affecting the buildup stage are gas source formation pressure, cement permeability, formation depth, and liquid column compressibility. The only known parameter is liquid column compressibility and the other three parameters are unknown. Equation (6) relates the formation pressure to cement permeability and formation depth. Hence, the system of equations contains two relations (buildup stage and flow stage) and three unknowns (k, pf, Df).
Solving the system of equations requires the elimination of one of the unknown parameters. To do so, based on the well design, the most likely locations of the leak will be determined. The formation pressure is then related to the cement permeability using Equation (6) (flow stage analysis). At each leaking depth, the cement permeability will be fitted to the actual pressure history. Among the selected depths, the best fit will be chosen to be the solution for the system. A similar method has been used by Huerta et al. [7]. Figure 6 shows a complete flowchart for analysis of the B-B tests.

4.3.2. Annulus Cemented to the Top

Equation (8) can be used to relate the gas source pressure to the cement permeability and formation depth. The same method described in the previous section will be used for the annulus cemented to the top. The most likely locations of the leak will be determined. At each location, Equation (8) relates the gas source pressure to the cement permeability. Having Equation (8) at each depth, only one unknown parameter (cement permeability) will remain for buildup. Therefore, the buildup simulator result will be matched to the actual field buildup test with cement permeability as an unknown fitting parameter. The leak location at which the best fit is acquired will be selected as the solution.

4.3.3. Annulus Containing Only Liquid Column

Analysis of buildup for this type of annulus configuration includes determining the gas source location and pressure. The gas source pressure can be related to the source depth using the maximum buildup pressure.
p f = p max + ρ m gL f
where pmax is the maximum stabilized buildup pressure and Lf is the distance between the top of the mud column and the leakage point. Once this relation is established, the buildup simulator result will be matched with the field buildup pressure history with the gas source formation as a fitting parameter. Once the fitting is acquired, the depth at which the leak occurred can be determined using Equation (15). Figure 6 summarizes a step-by-step analysis of the B-B test.

5. Field Validation of Annular Gas Migration Model with Data from Well 19

The analysis method is verified with SCP data from Well 19 located in the Gulf of Mexico. Figure 7 shows the bleed-down/build-up field test results of the well. The twelve minutes bleed down was followed by 24 h build-up. Table 4 shows input data of the annular gas migration model for this well. A stage-by-stage analysis described earlier is used to evaluate the cement leak size and the gas source pressure.

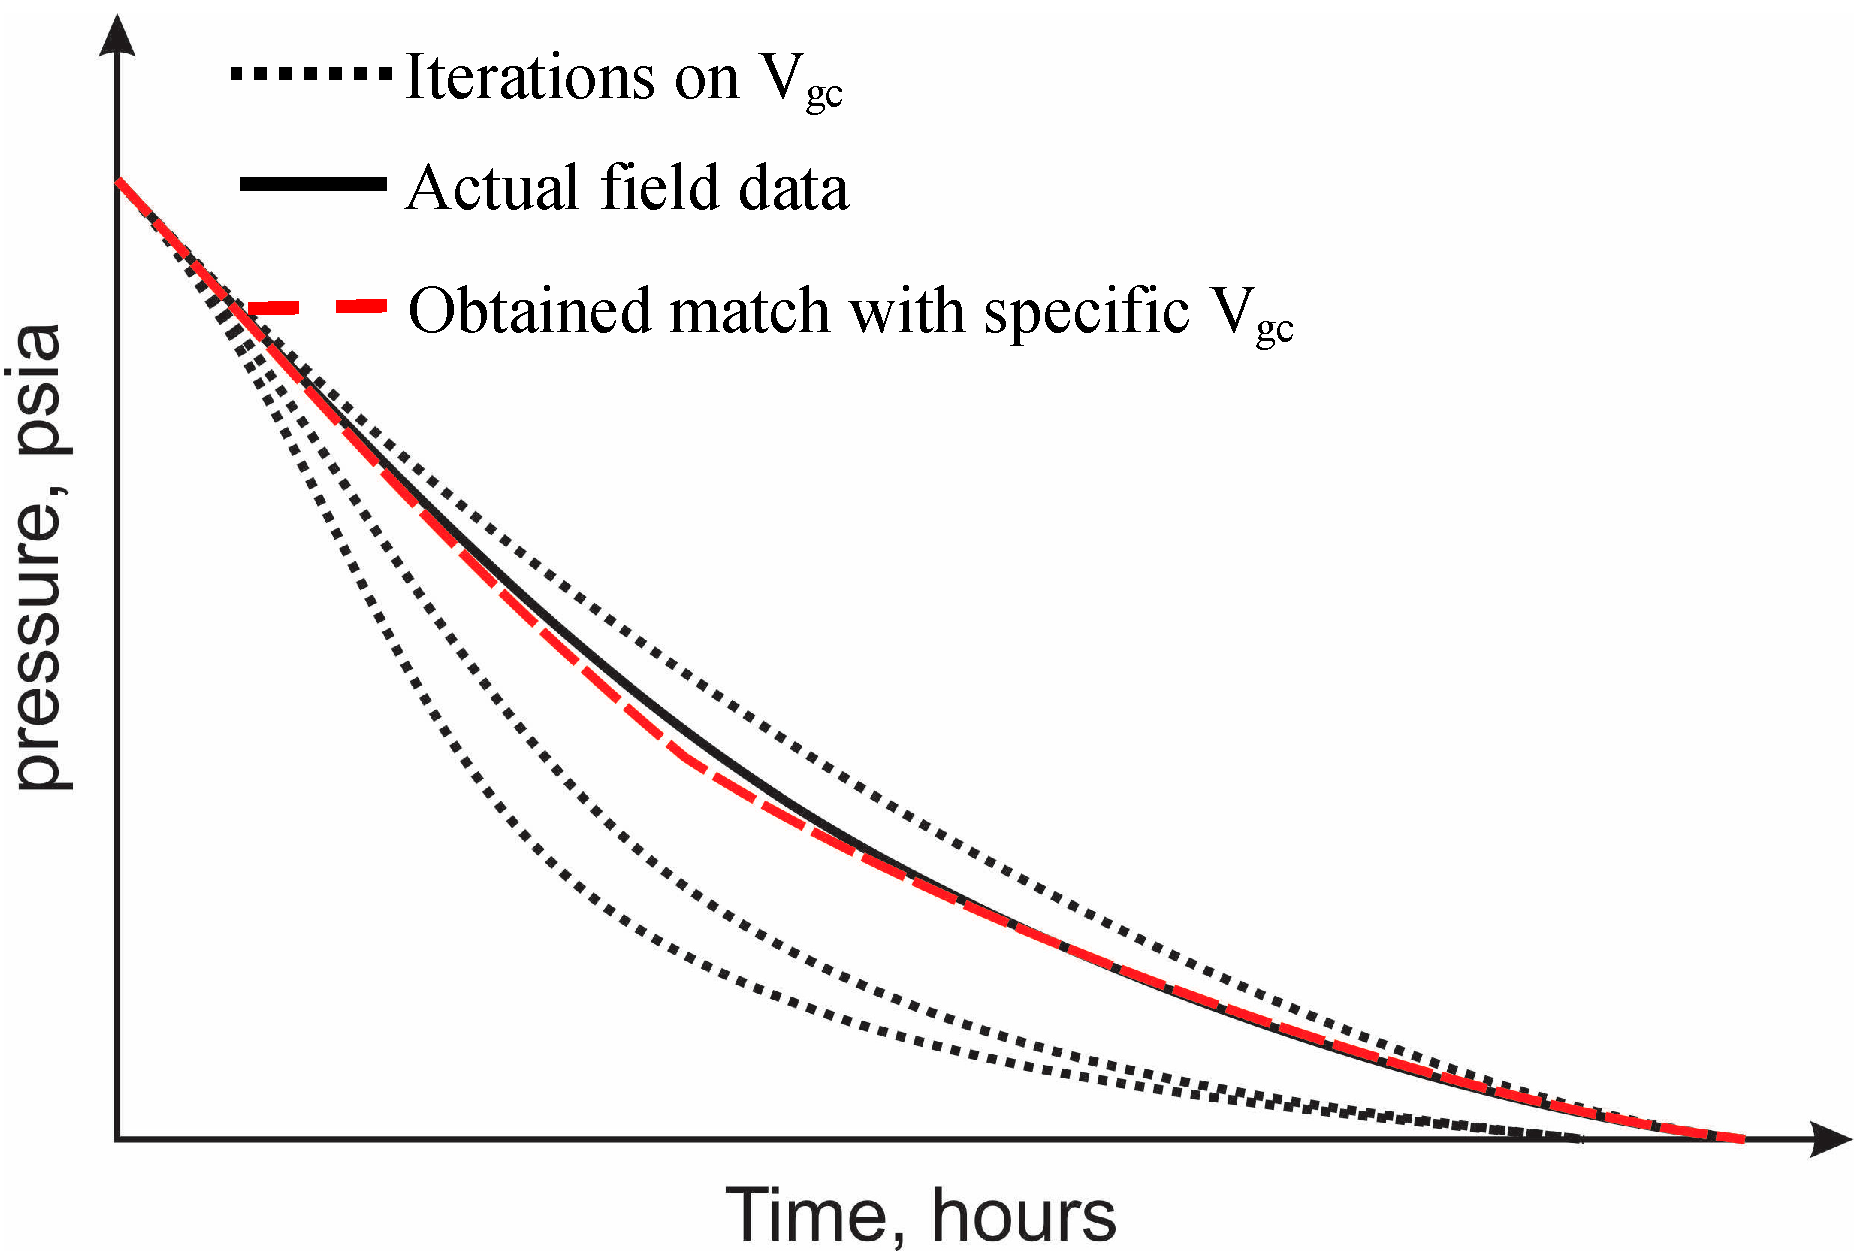
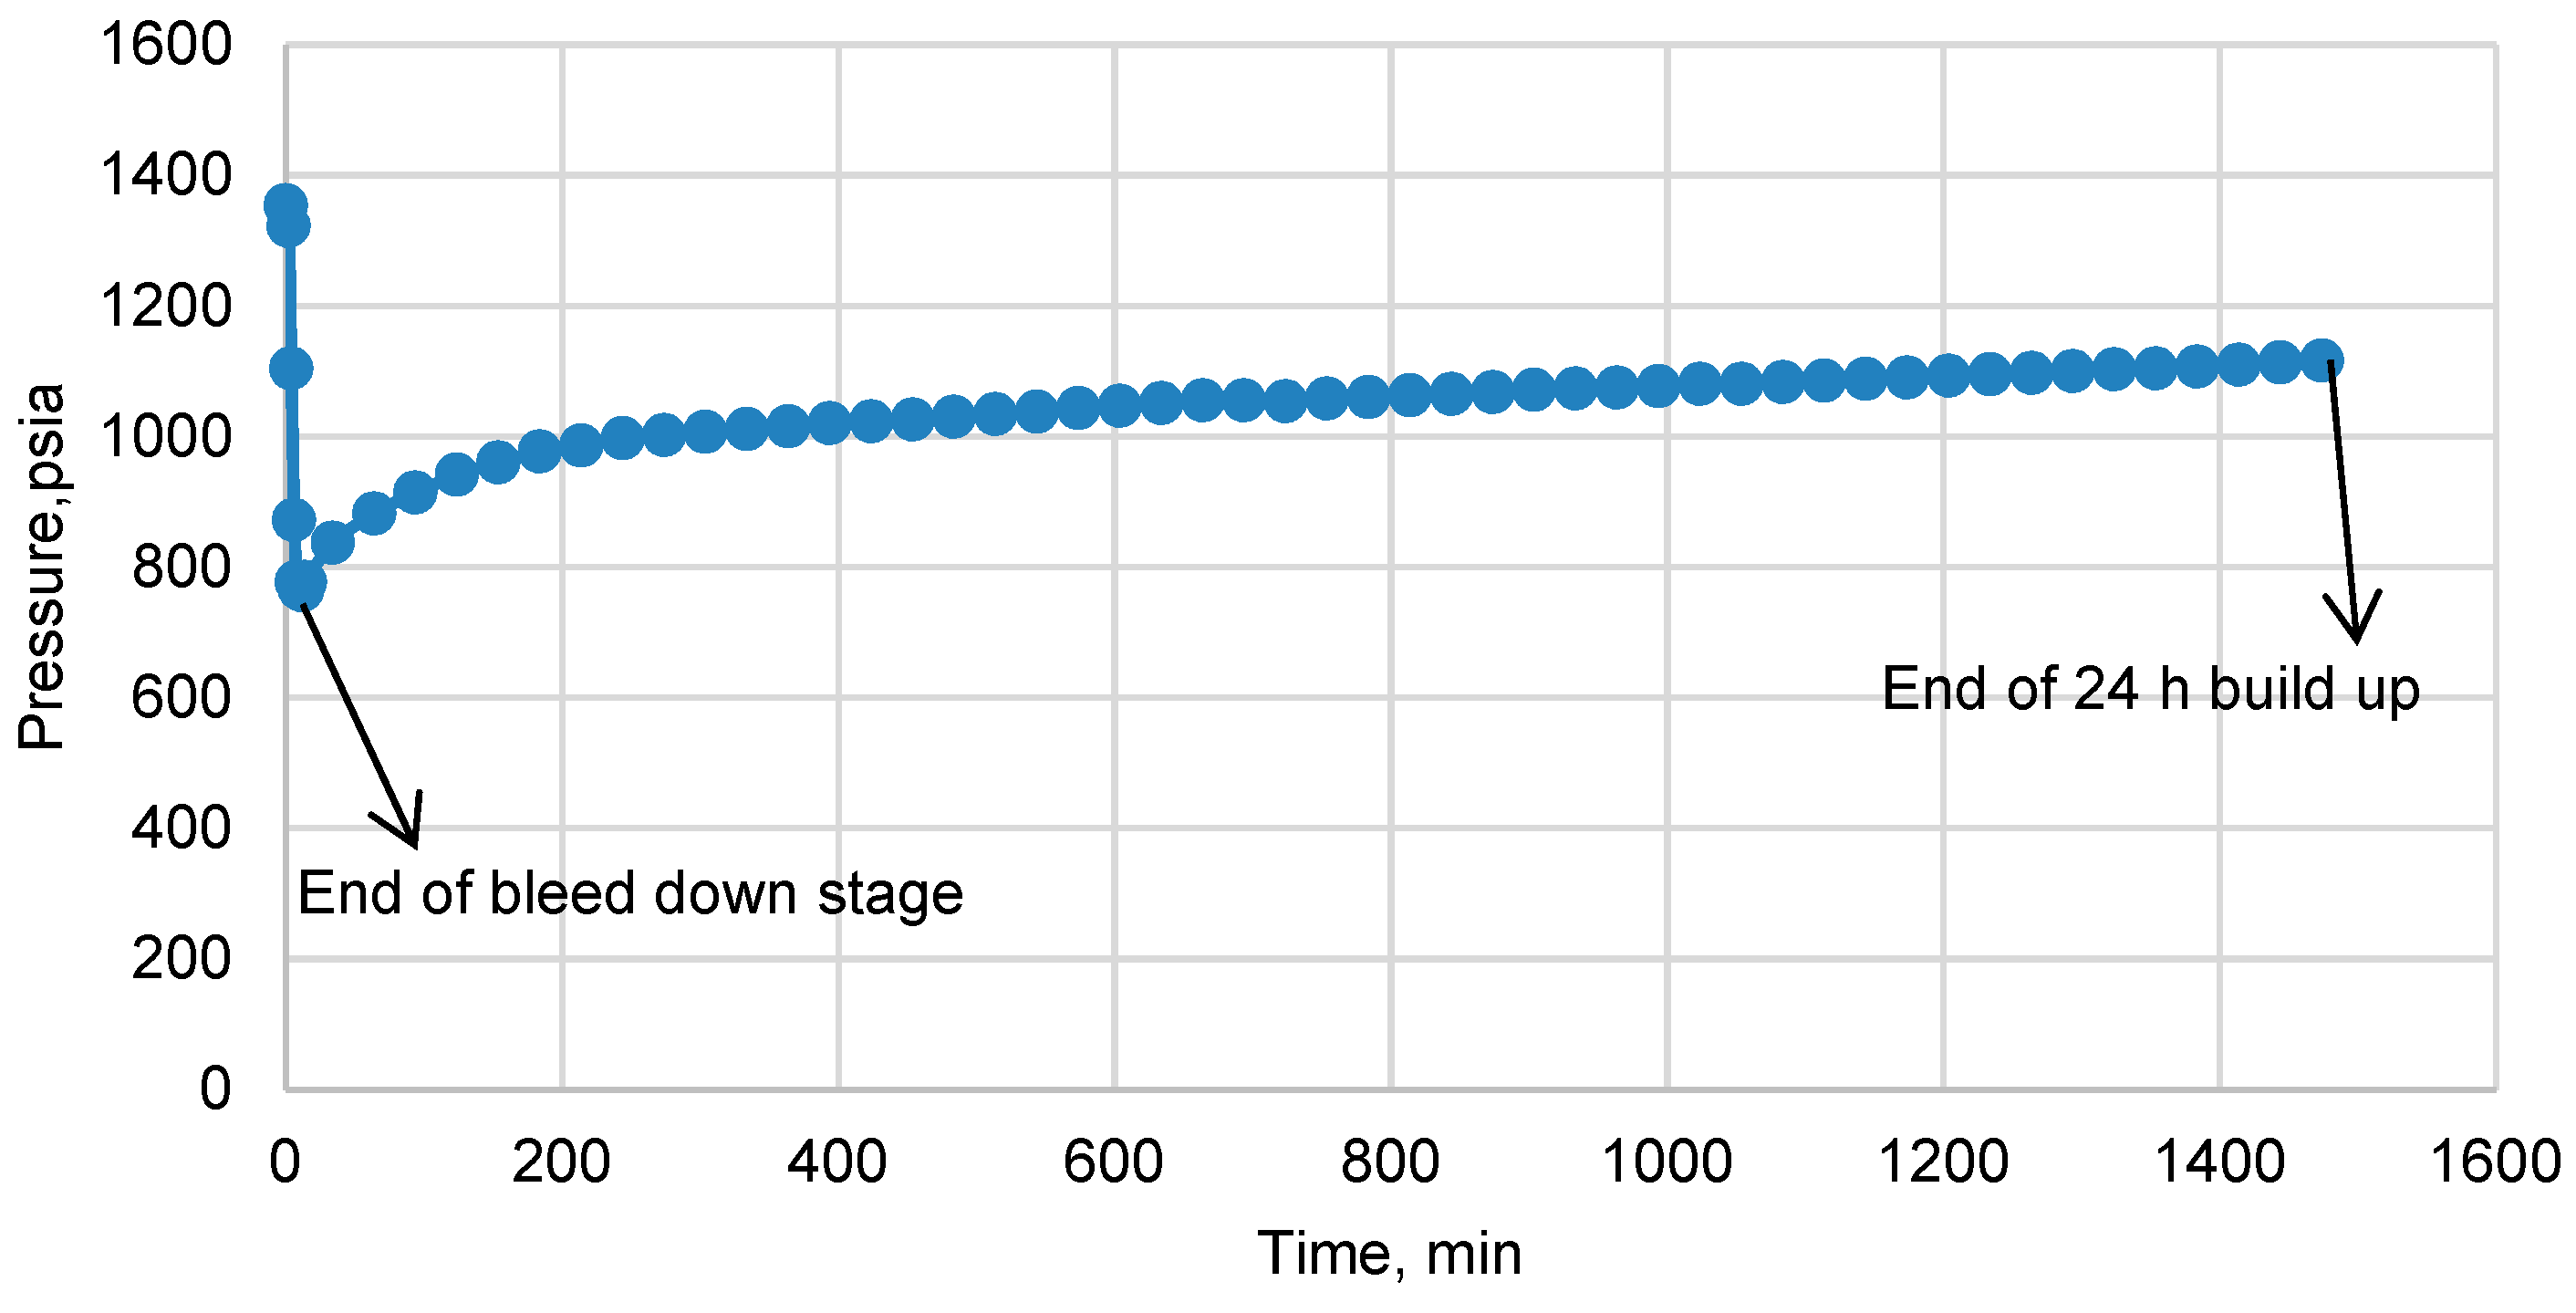
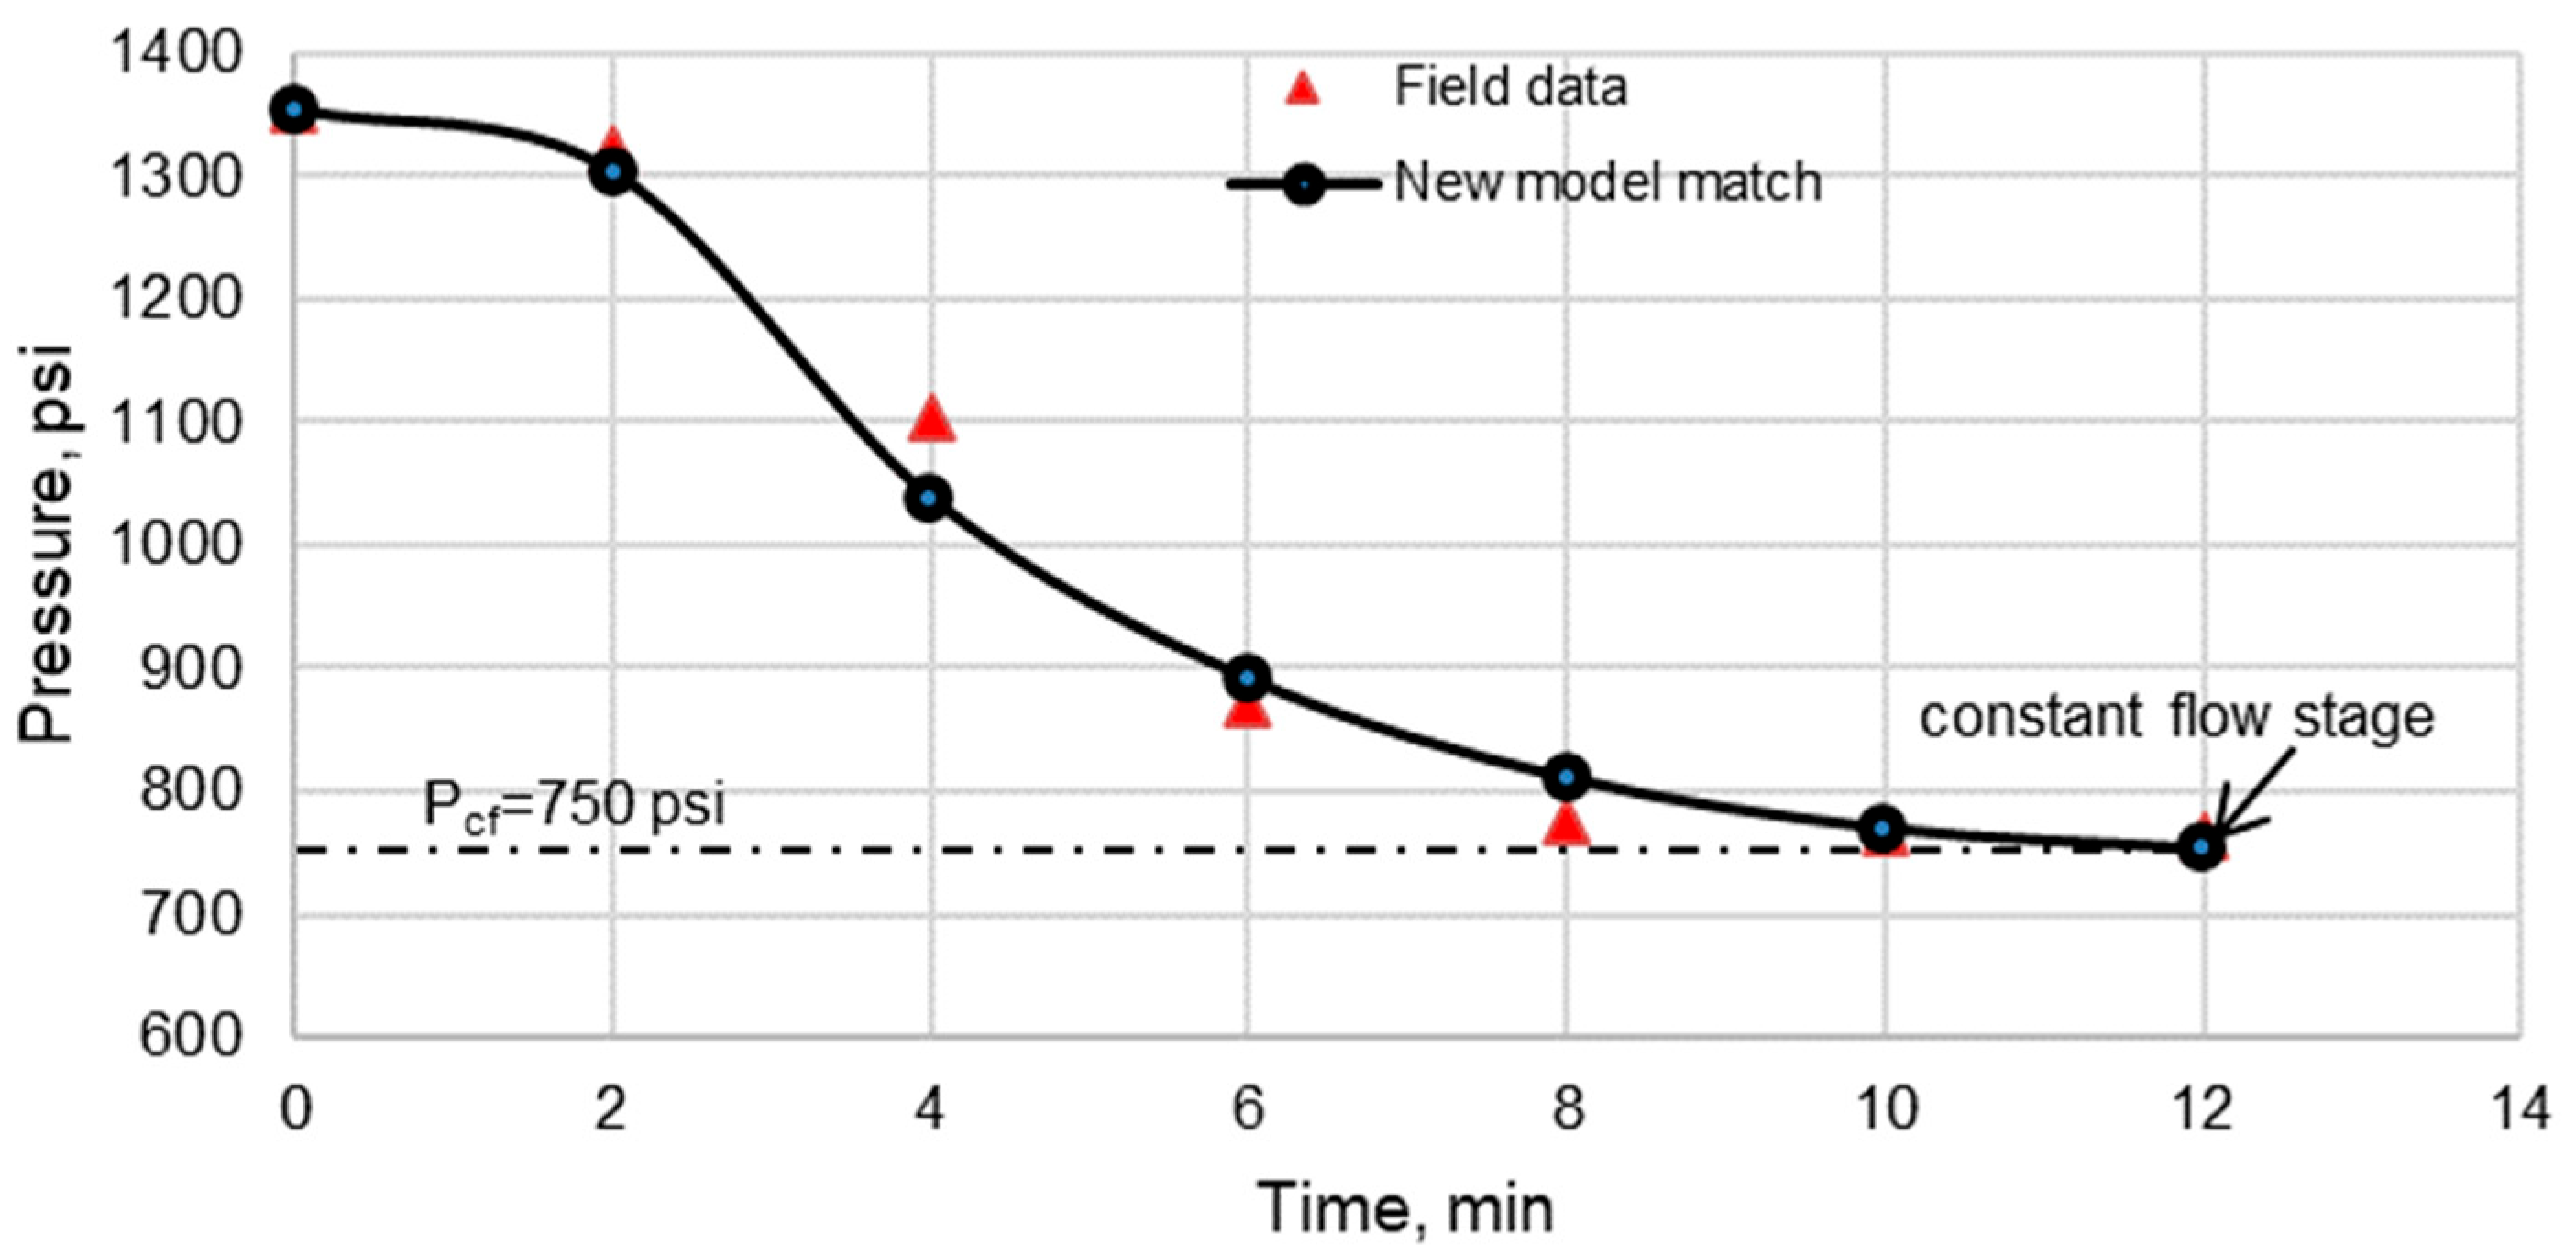
5.1. Analysis of Bleed-Down Stage

The bleed-down curve calculated from the model is matched by iterating on the initial gas chamber volume. Figure 8 shows the match obtained using both models. The gas chamber length is determined to be 22 ft with the new model.

5.2. Analysis of Constant Flow Stage

The flow stage of well 19 is also shown in Figure 8. The constant flow pressure is determined to be 750 psi. Using Equation (5) the cement/liquid interface pressure is calculated and the relation between the cement permeability, leak depth, and gas source pressure can be established as follow:
m P f = m P cf + 2 10 8 k L c
The possible leak location is determined to be at the casing shoe (Lc = 598 ft). Hence a relation is found between the cement permeability and gas source pressure. This relation will be used in the simulation of the build-up stage to determine the leak size.

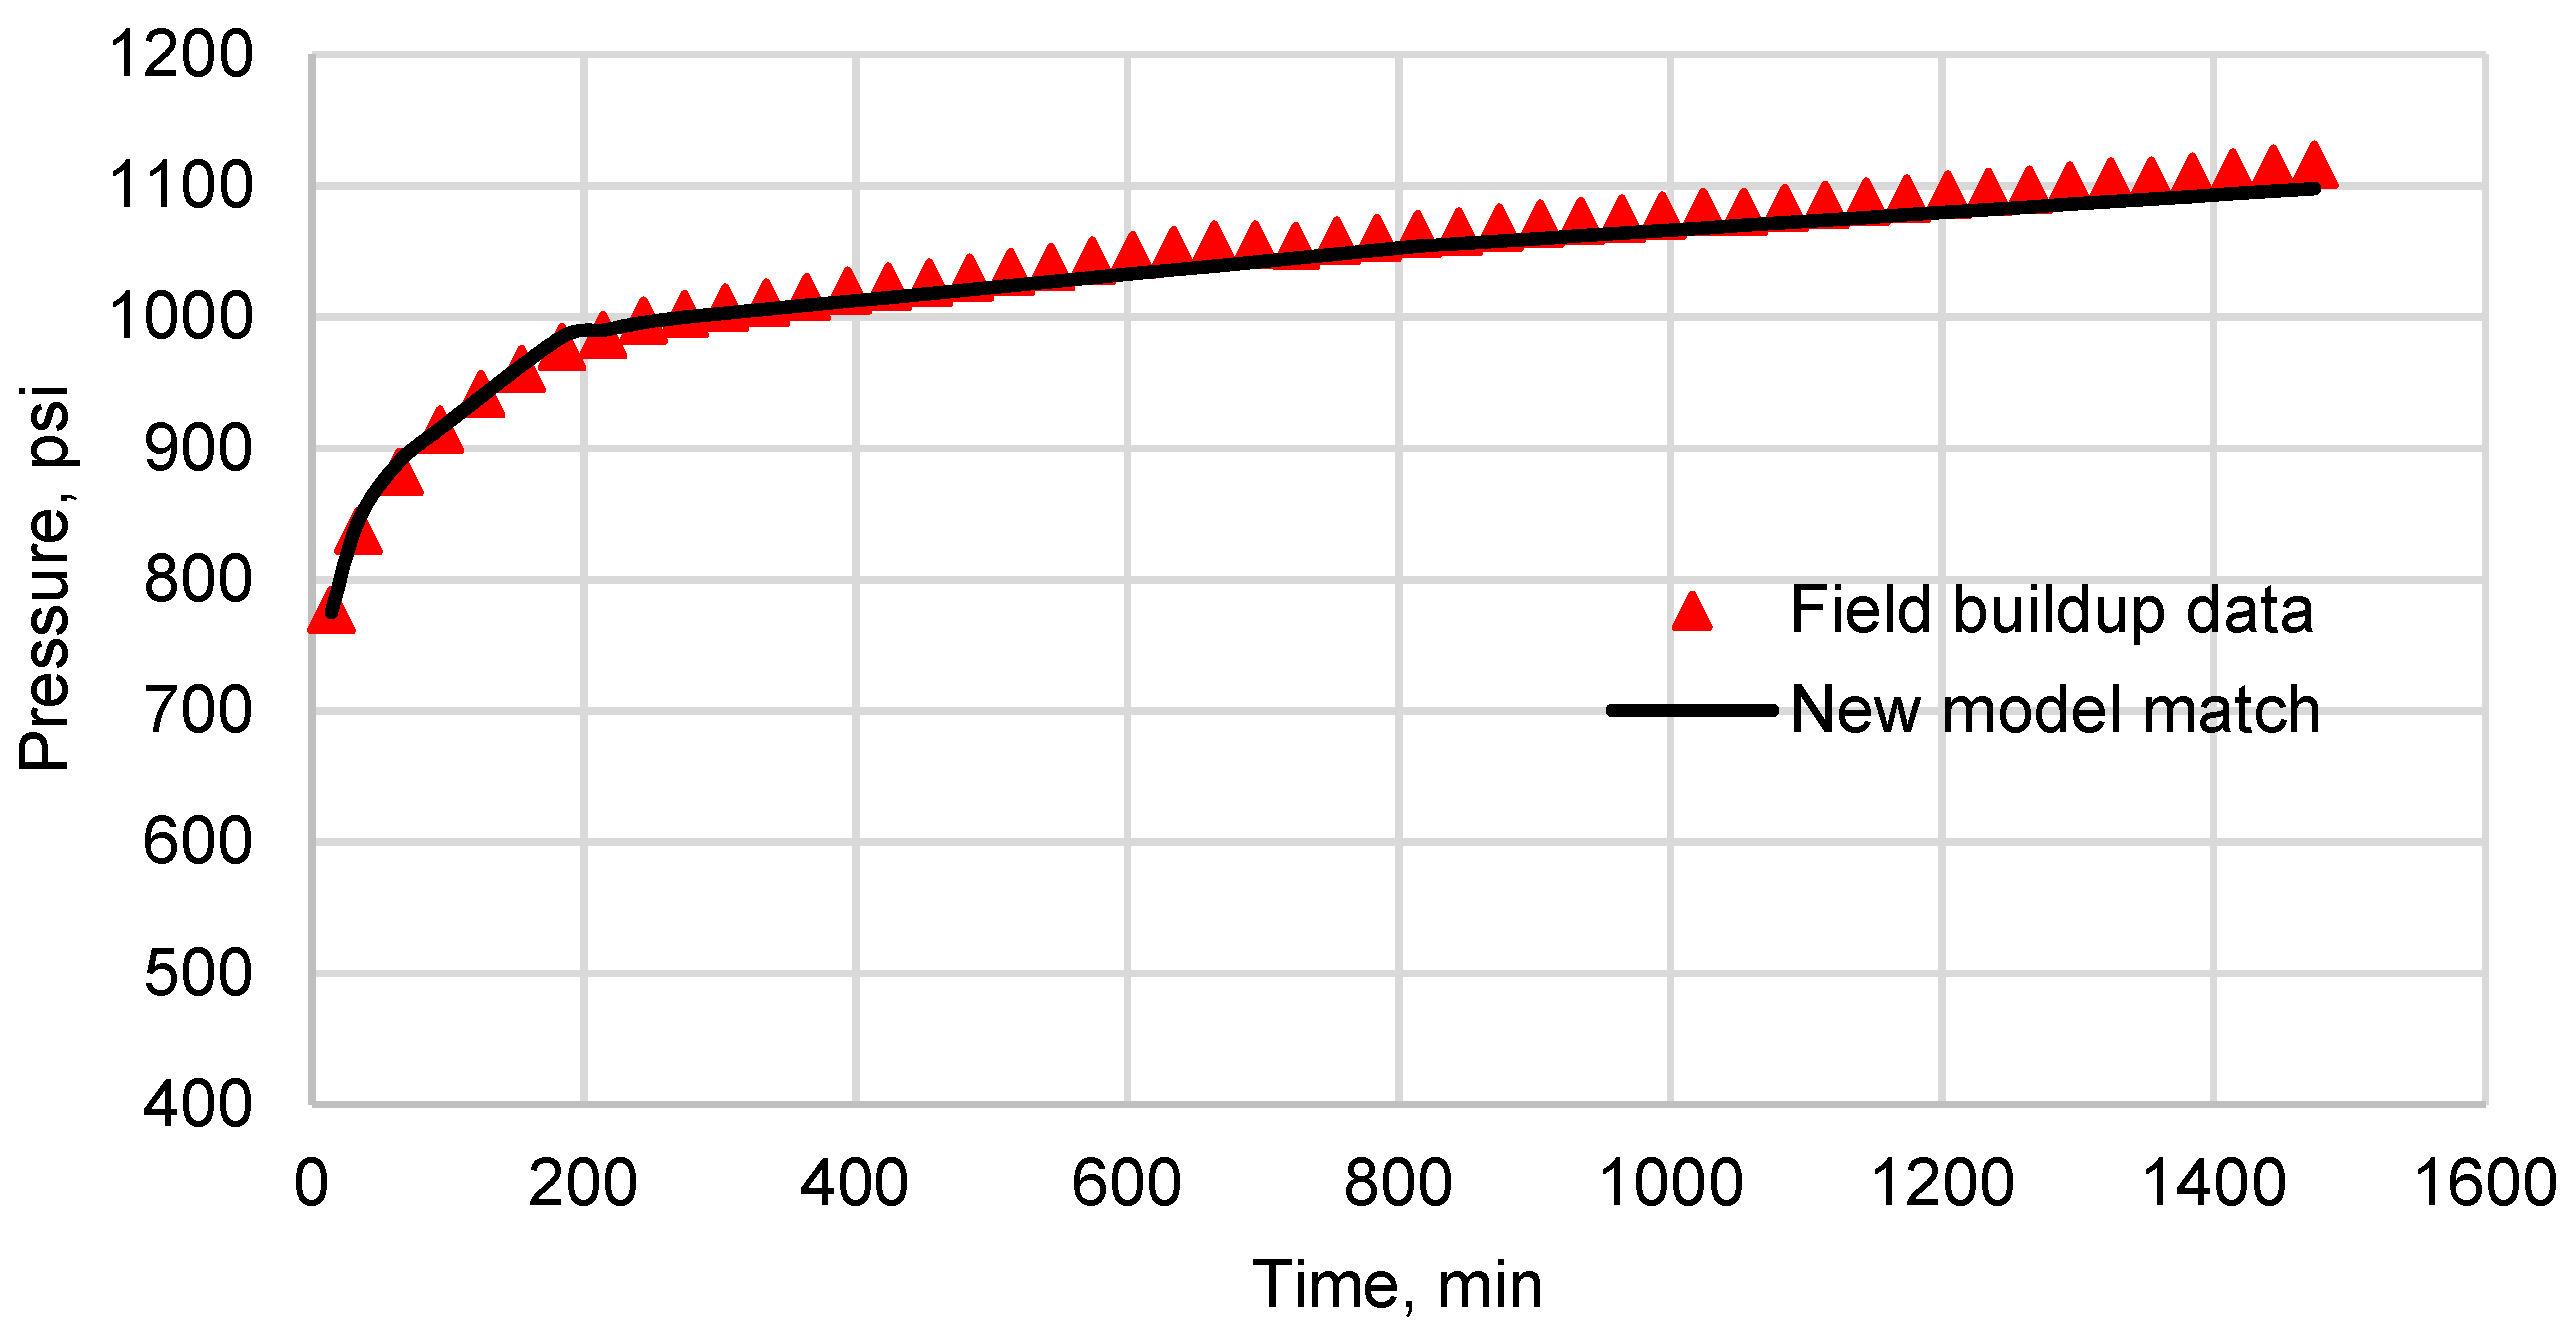
5.3. Analysis of Build-Up Stage

Once the relation between the cement permeability and gas source pressure is found, the buildup curve resulting from the model can be matched to the field buildup test by iterating on cement permeability (leak size). Once the match is obtained, the cement permeability is determined, and therefore, using Equation (15), the gas source pressure can be computed. Figure 9 shows the match obtained using the new model for the build-up stage. The permeability of the cement is determined to be 40 md.

5.3.1. Operational Principles of Diagnostic Testing

Performing the diagnostic test needs the operator to establish a procedure for conducting B/B tests. However, there is not a well-defined procedure for operating a B/B test, making the interpretation of the performed tests difficult. In this part, principles of correct operation of the B-B test are established by studying the effect of each parameter on minimum bleed down pressure and maximum build up pressure. These two parameters are selected since the current evaluation of the B-B test is performed according to these parameters. As defined earlier, operational parameters include parameters that are in control of the operator and have a significant effect on pressure curves and consequently on B-B test analysis. A wrong decision about these parameters misleads the interpretation of these tests. The operational parameters are described as follows:

Valve Opening (VO%)

The valve opening percentage describes the ratio of the number of turns that are open to flow to the total number of turns for a specific valve. Valve opening controls the bleed-down operation. The more the valve opening percentage, the faster the bleed down will be.

Opening Duration (Δtbo)

Opening duration is described as the time that the valve is open or bleed down duration. Deciding about the opening duration is important to find the minimum bleed-down pressure.

Pressure Logging Time Step Size

The casing head pressure can be recorded continuously or discretely. Pressure logging time step size is the time between two successive pressure data points. This parameter is important, especially in bleed-down, where the duration of the stage is not long in most cases.

6. Minimum Bleed Down Pressure

According to the current evaluation of the B-B test (API RP-90), if the casing head pressure bleeds to zero during bleed down the leak rate is considered small; however, several operational parameters may change the shape of the bleed-down curve leading to misinterpretation of these tests.

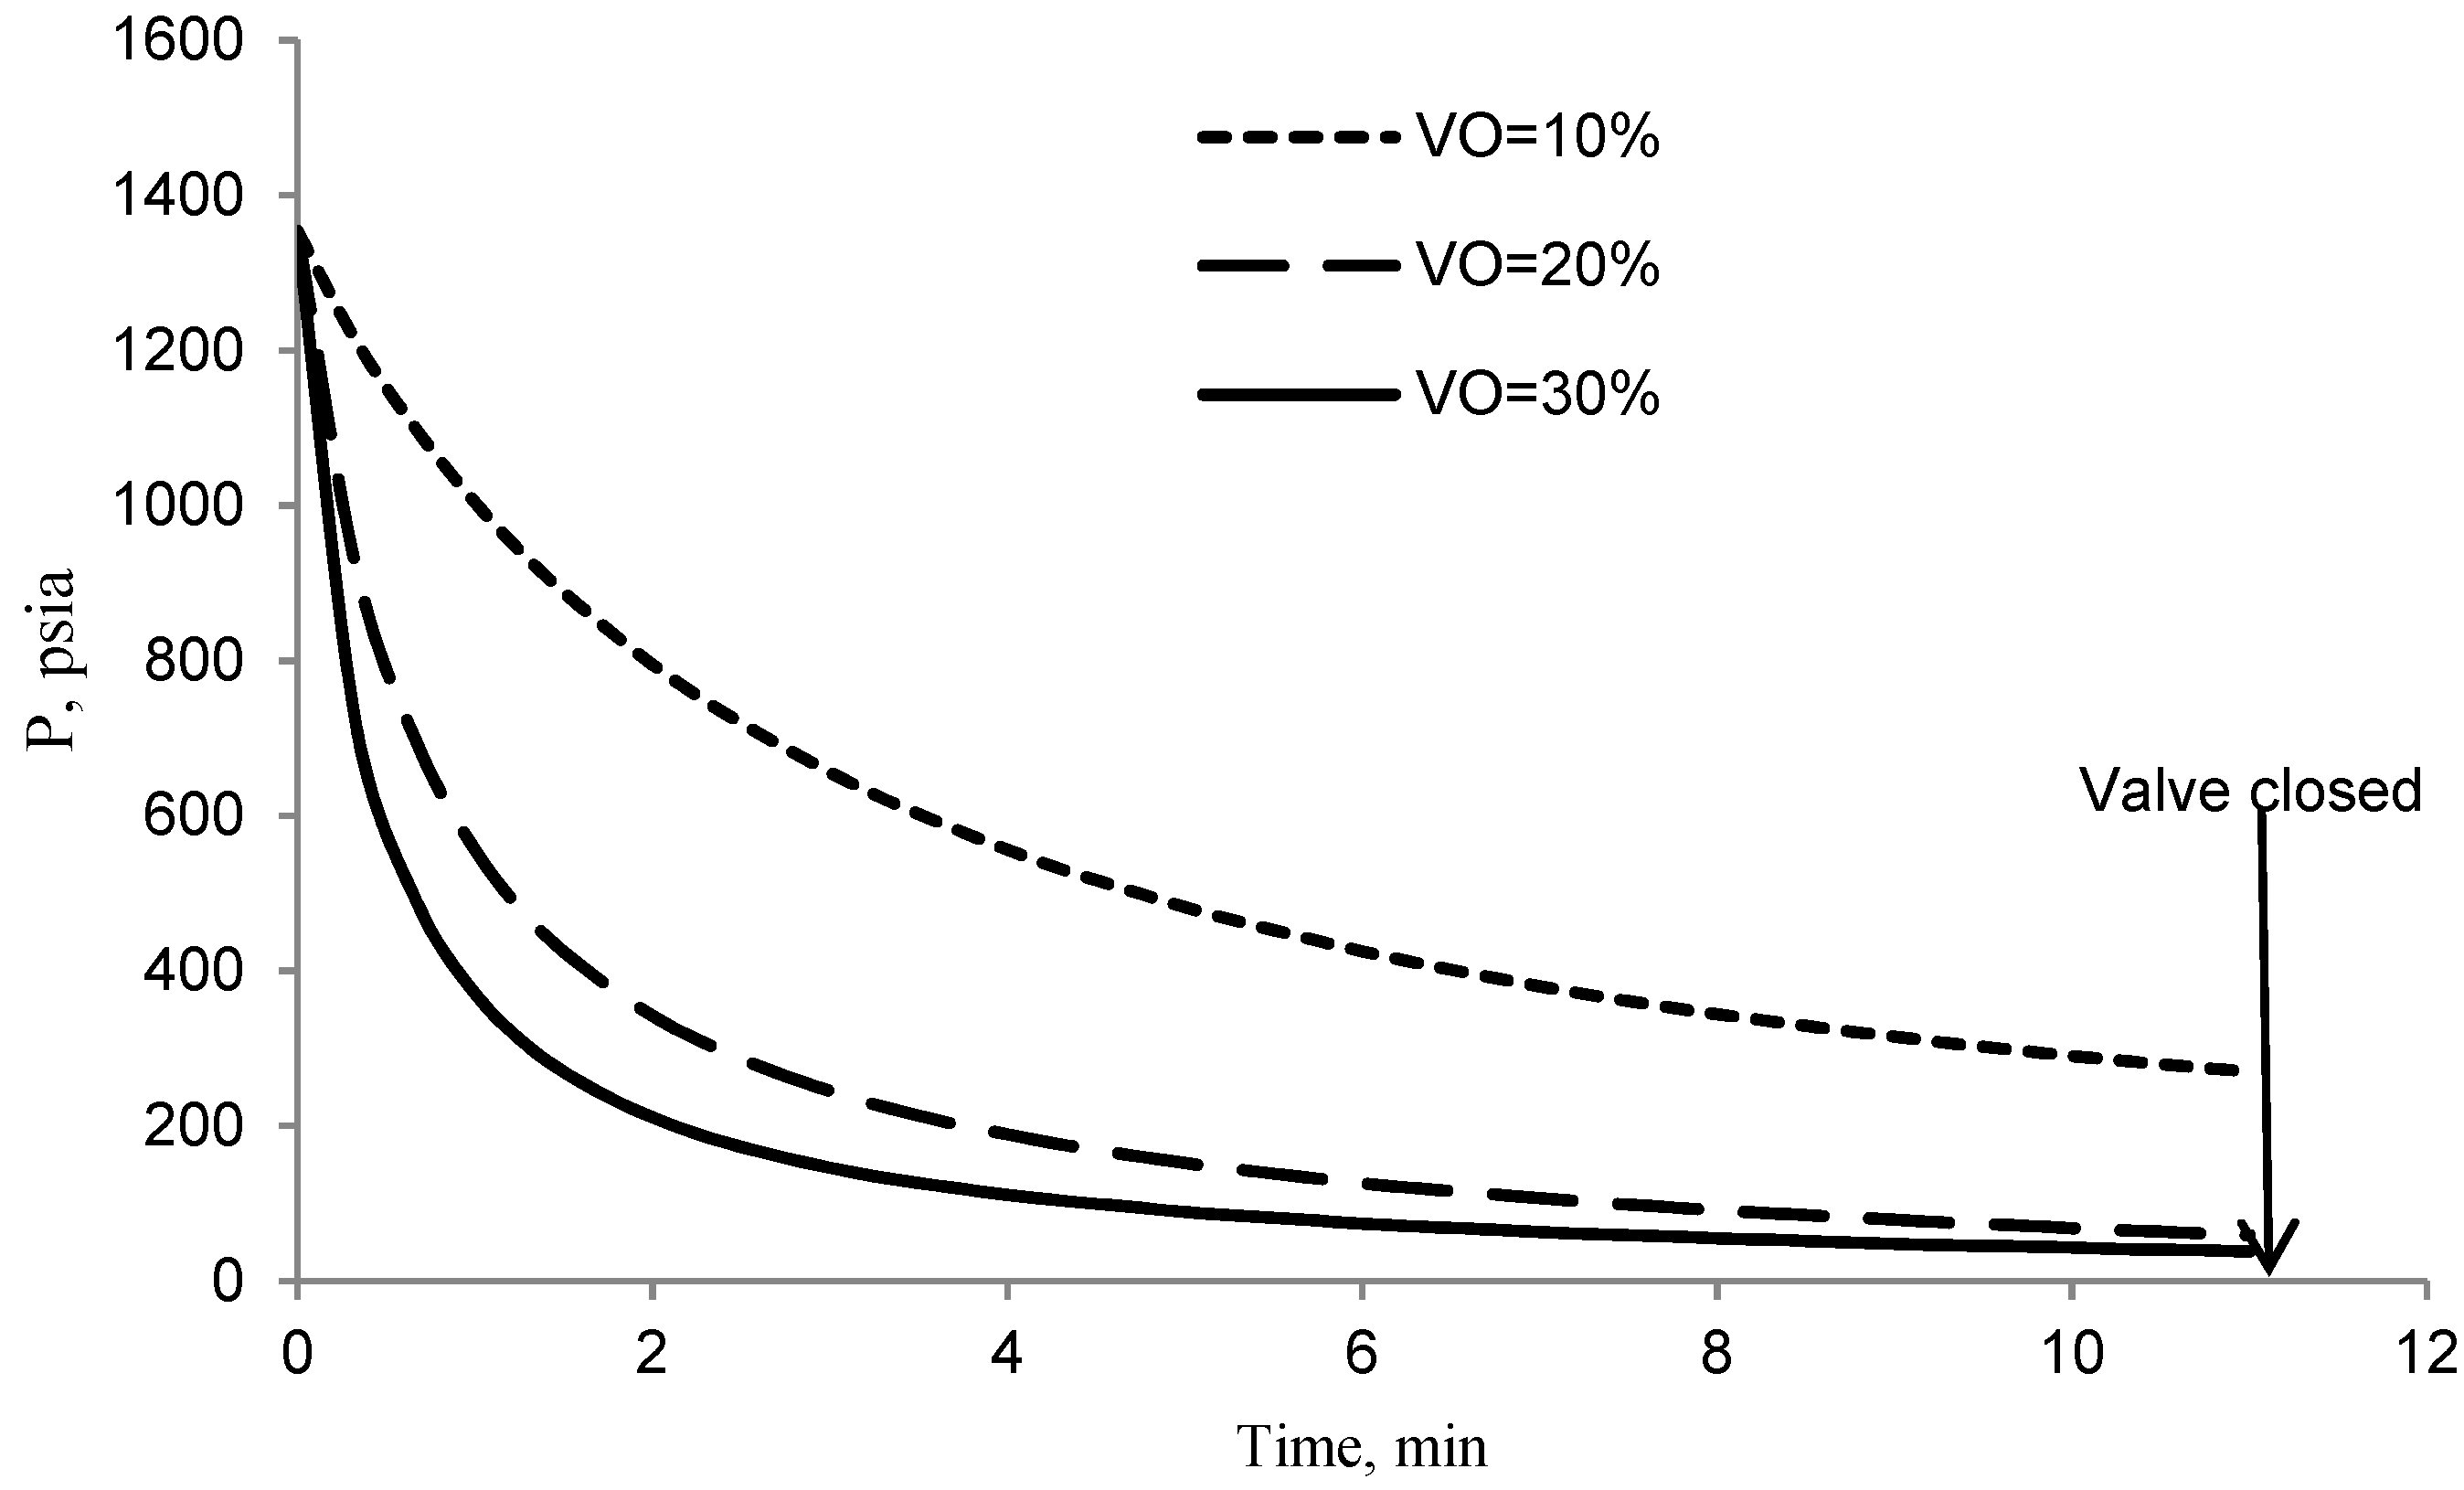
6.1. Effect of Valve Opening

Figure 10 shows the response of the described system to various valve opening percentages. It can be observed that at the valve closure the minimum bleed down pressure may not be reached if the valve opening percentage is not large enough.
By having a 30% valve opening the system reaches the minimum pressure after 11 min in comparison with 10% valve opening that it takes 20 min. Table 5 shows the effective bleed-down time for three different valve opening percentages. It is recommended that the valve be opened as wide as possible without removing any liquid from the annulus. In this way, the minimum bleed-down pressure can be achieved faster. The valve opening percentage shall be recorded by the operator to avoid misinterpretation of the tests.

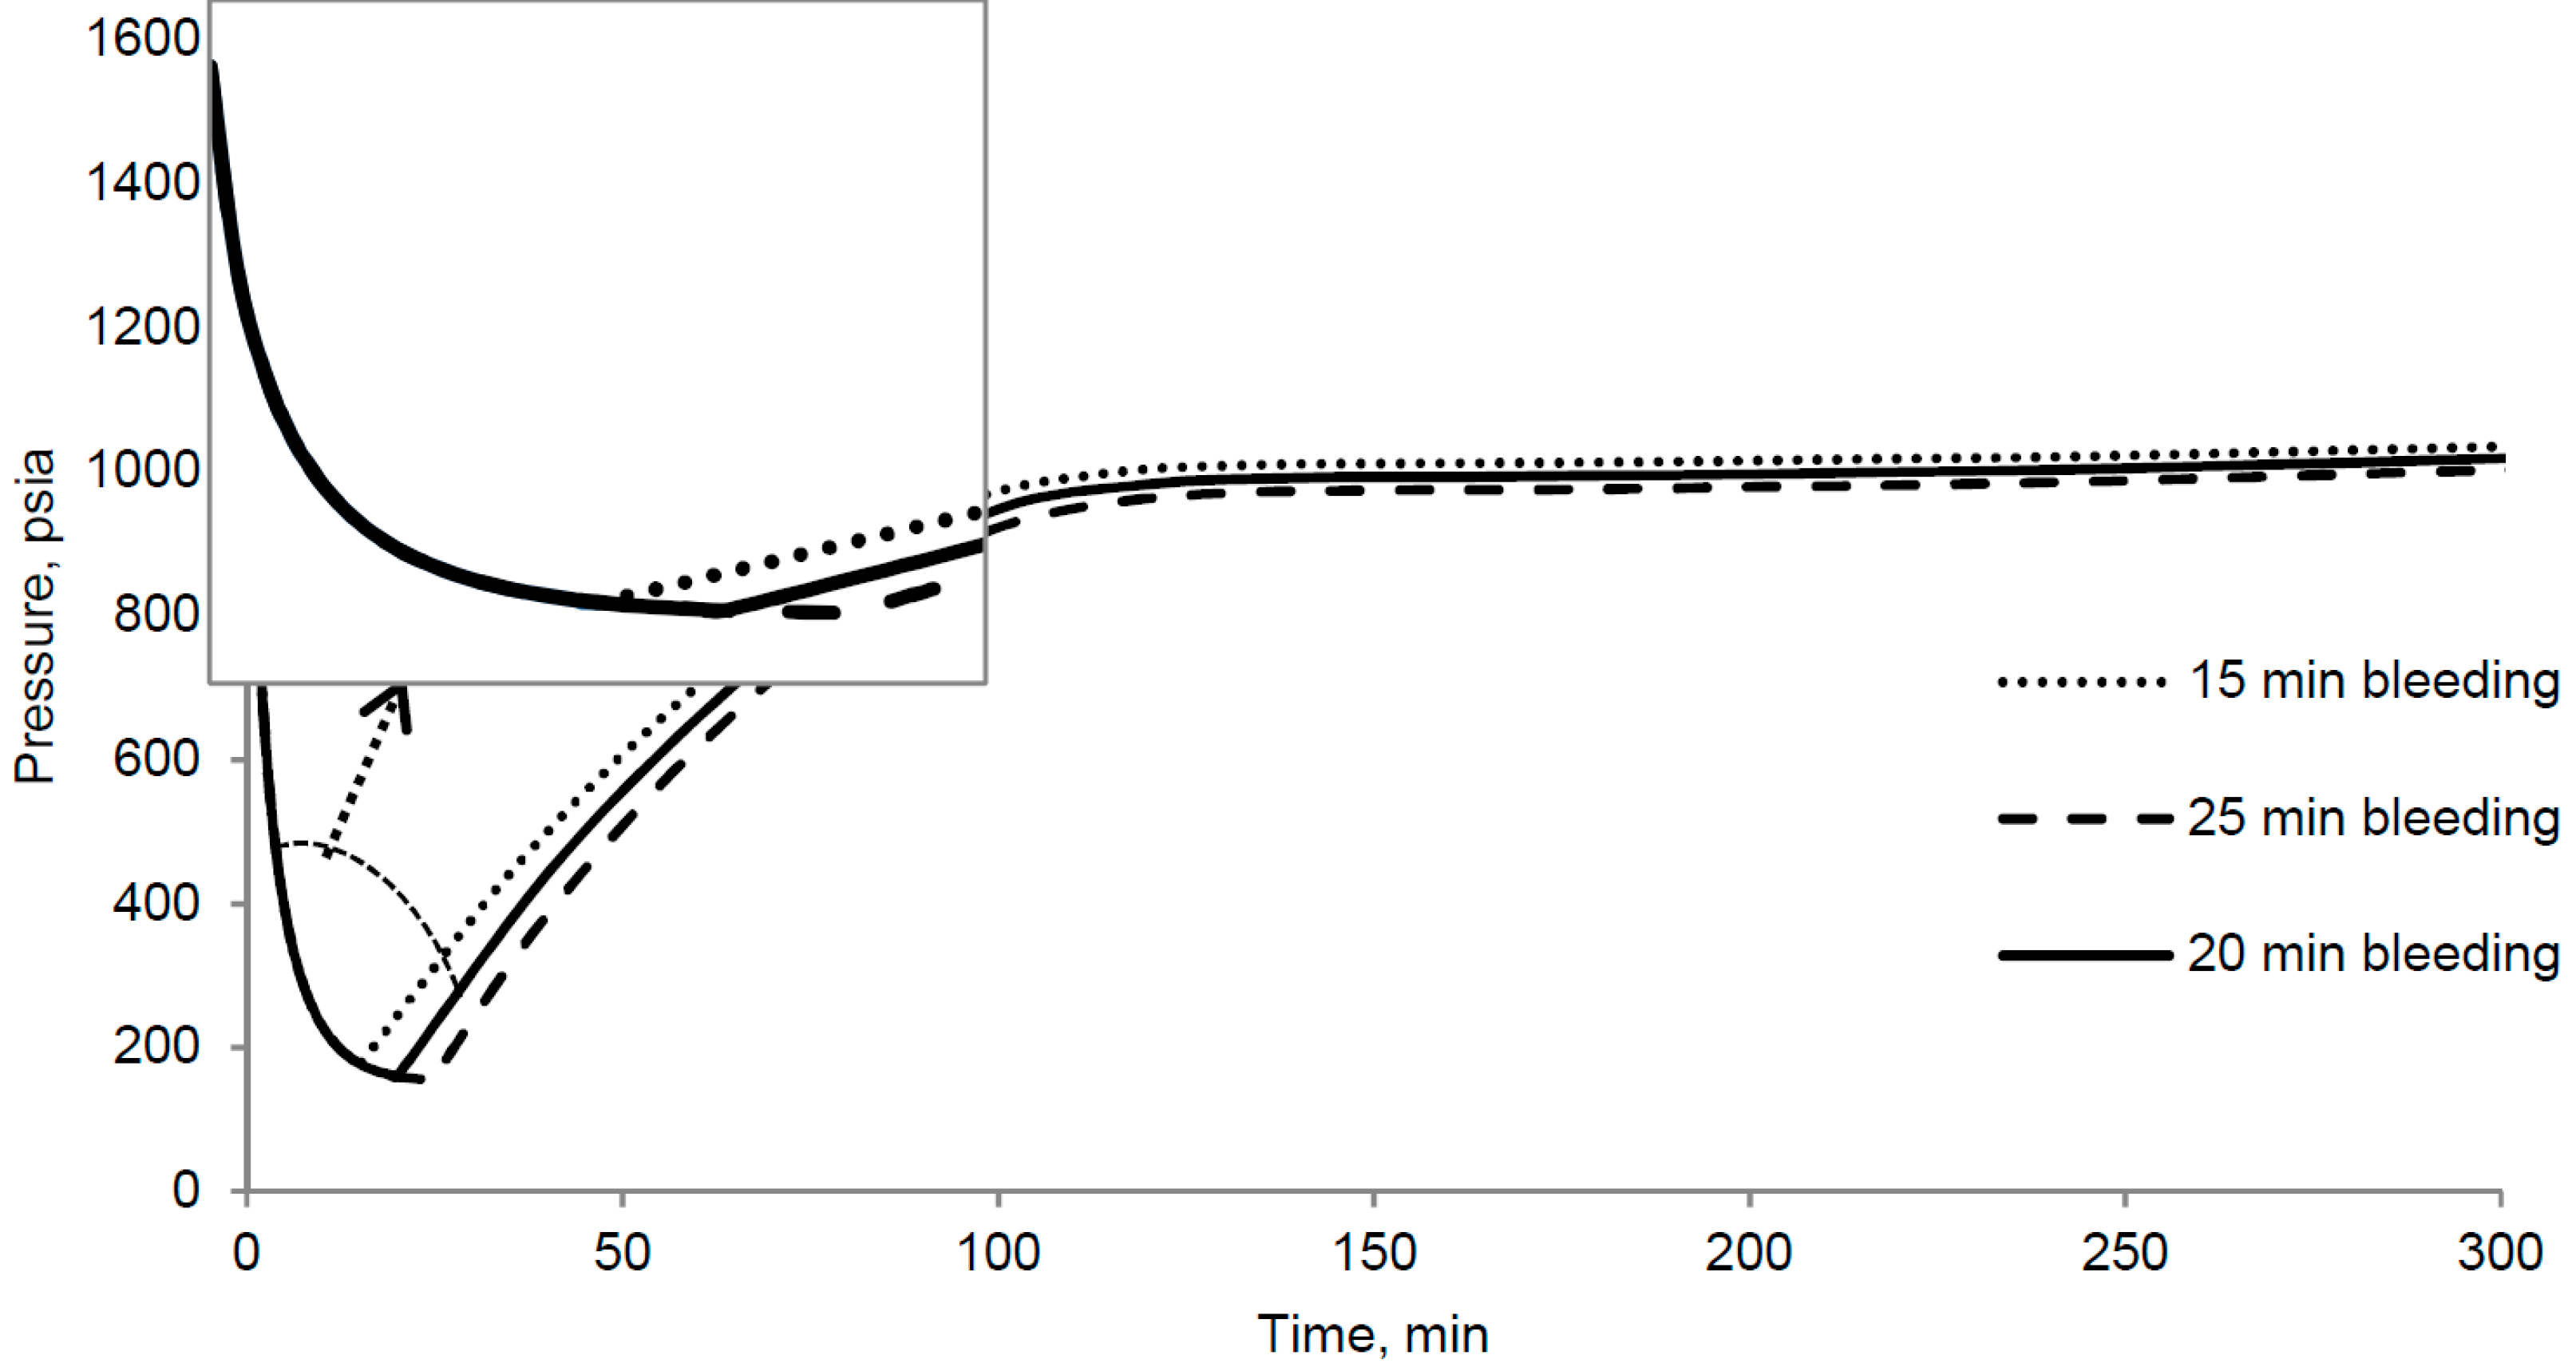
6.2. Effect of Bleed-Down Time

According to the API RP 90 standard, if the pressure at the casing head reaches zero, the leak rate is considered small. However, this may be inaccurate in case we have non-Newtonian fluid in the liquid column. Figure 11 shows the simulation of a bleed-down test in which the pressure bleeds to zero and stays at zero for 30 min. The valve is left open and suddenly after 30 min the pressure starts to increase and stabilizes at a pressure approximately equal to 200 psi despite the valve is open as shown in Figure 11.
This phenomenon can be described by observing the gas migration in the liquid column. Gas cannot be trapped in Newtonian fluids whereas it can be stopped and trapped in non-Newtonian fluids due to their yield stress. In this situation, the buoyancy of the gas bubble cannot overcome the yield stress of non-Newtonian fluid. As a result, the liquid column containing non-Newtonian fluids is much more compressible compared to that of Newtonian fluids. In this situation, the gas invasion into the liquid column does not change the casing head pressure significantly, but only causes compression of the liquid column for a period of time. Hence, bleeding to zero does not always indicate that the cement leak is small, but it may show that the liquid column contains a large volume fraction of gas trapped in it.

7. Maximum Build Up Pressure

Maximum build-up pressure in 24 h is important to determine the cement leak rate and evaluate the cement in the annulus.

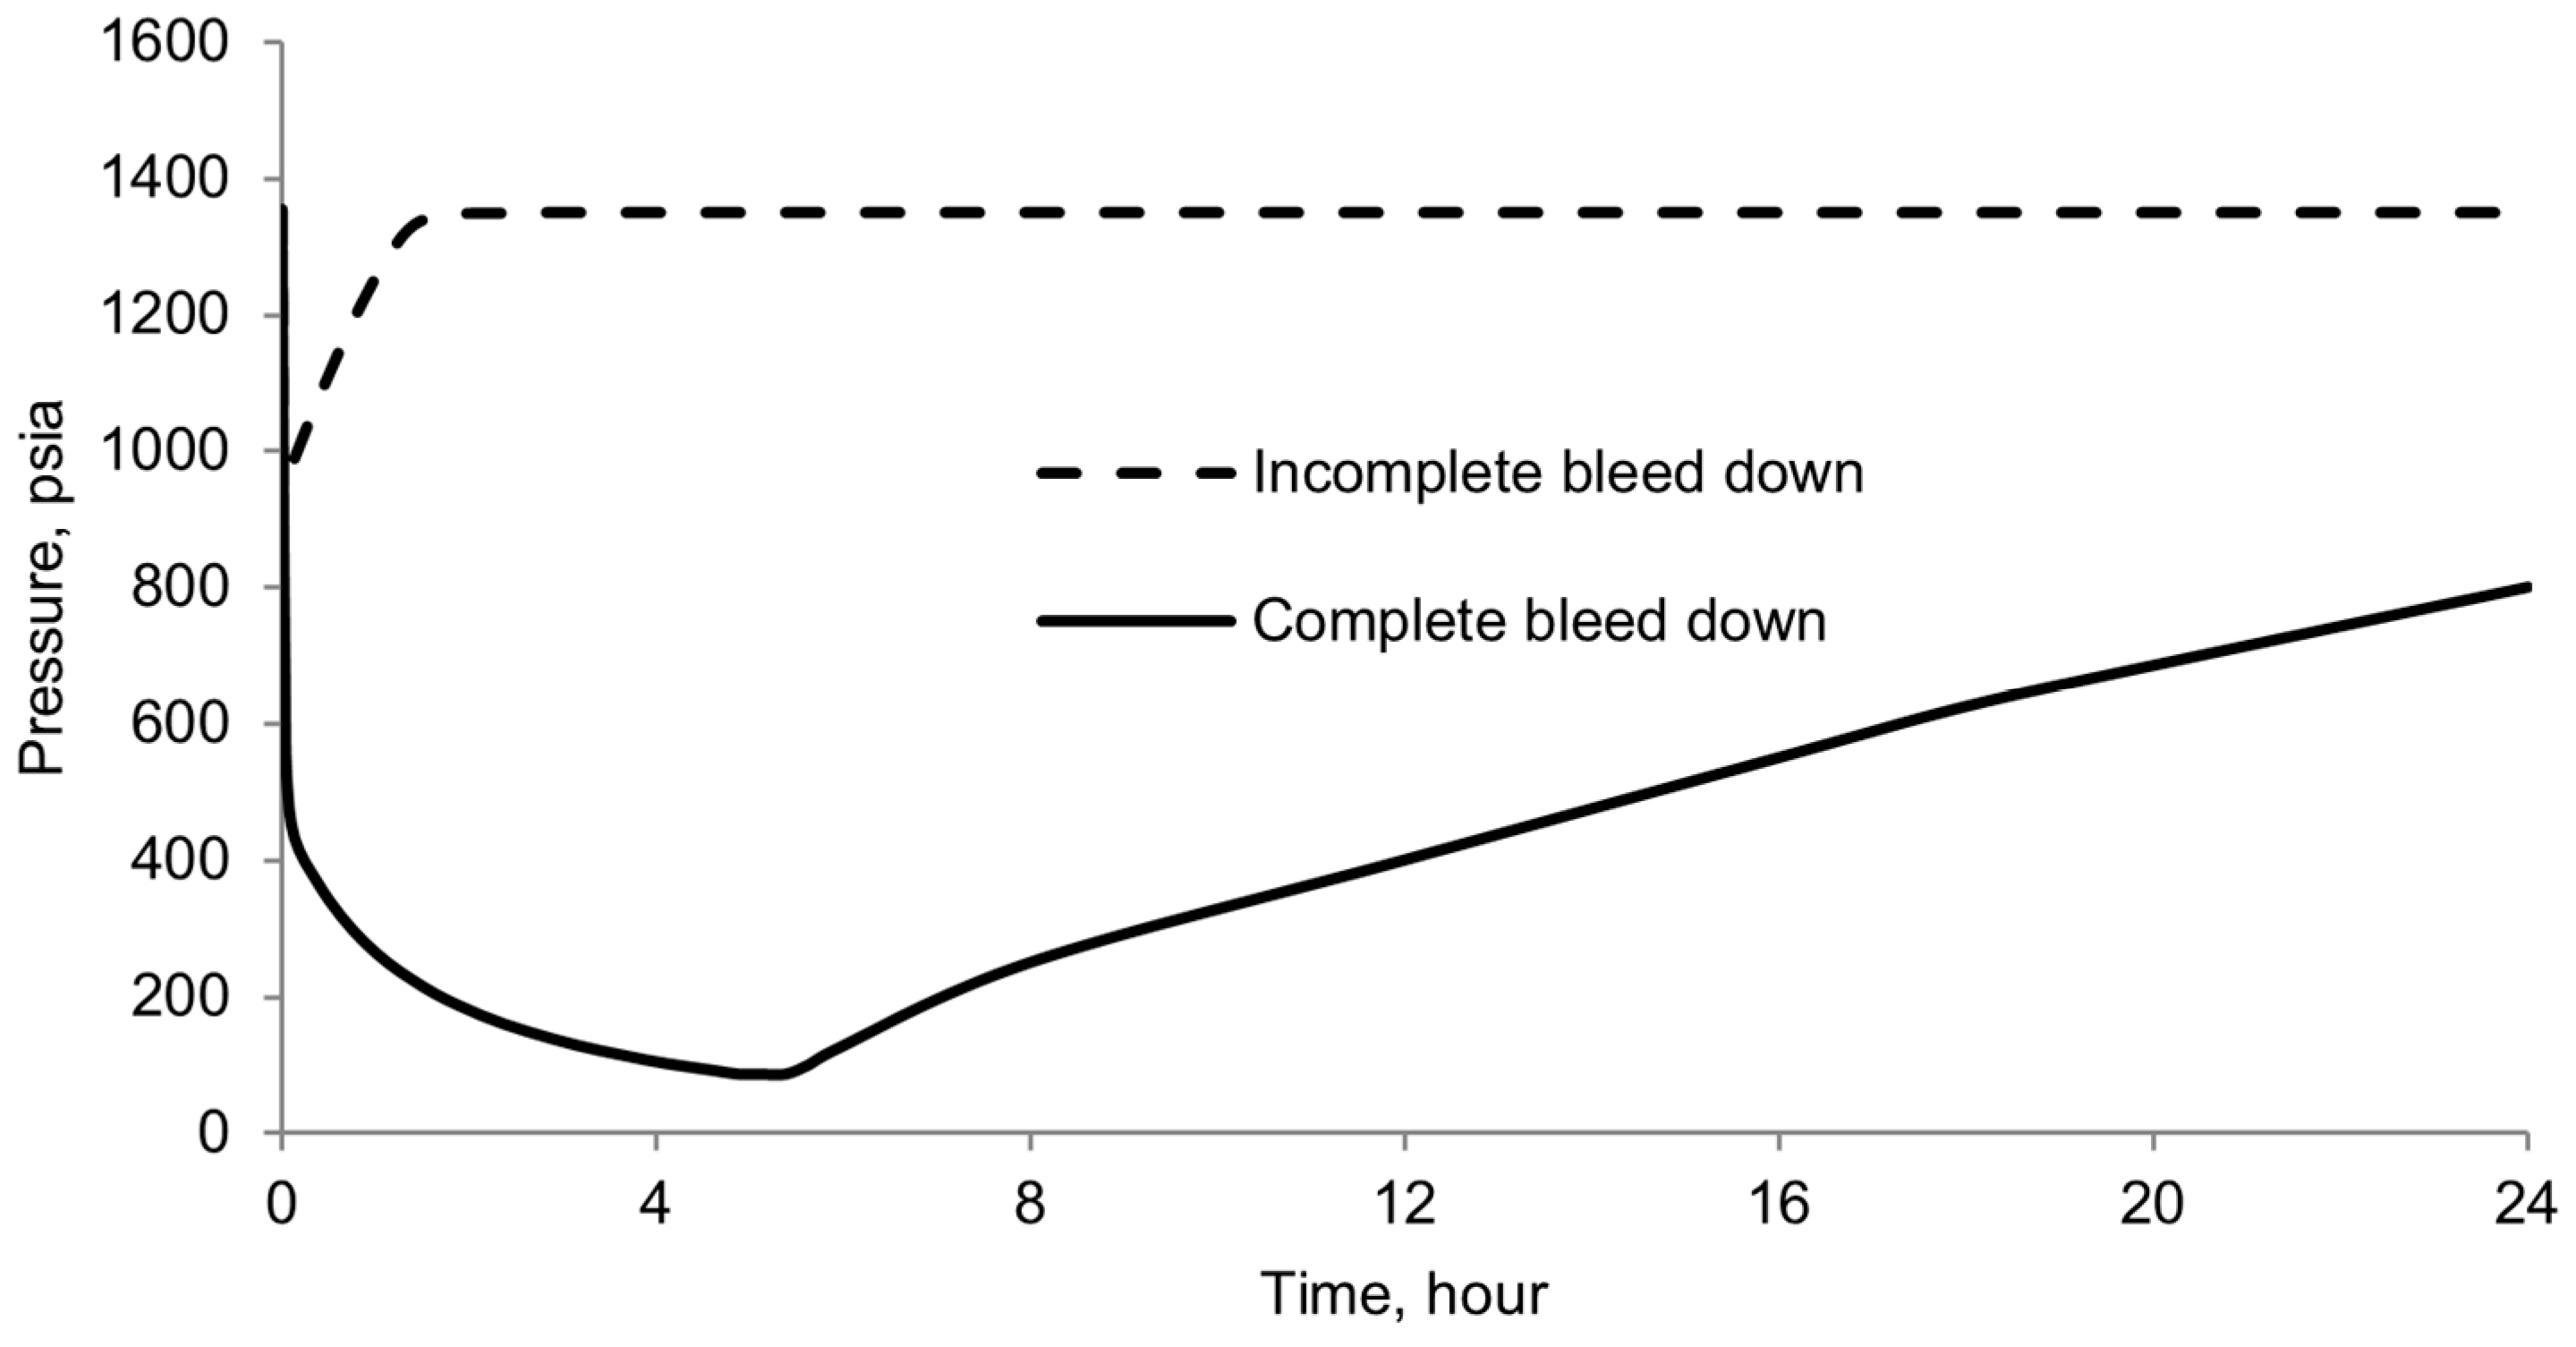
7.1. Valve Closing Time Dilemma, the Effect of Bleed-Down Time

As discussed earlier, valve closing time (Δtbo) is one of the operational parameters but what is the right decision about opening duration in B-B testing? This question can be answered by looking at the parameter that needed to be found. There is a dilemma in closing the valve. The maximum buildup pressure is observed by early closing of the valve while it does not demonstrate the minimum bleed-down pressure (Figure 12). On the other hand, the minimum bleed-down pressure can be observed by the late closing of the valve while it does not show the maximum buildup pressure. Therefore, if the parameter of interest is the minimum bleed-down pressure, the valve should be left open until that pressure is reached. On the other hand, if the maximum buildup pressure is needed, the valve should be closed early so that the pressure reaches its maximum within 24 h. In conclusion, the B-B test should be repeated depending on the system parameter that is needed.

7.2. Valve Closed at Steady-State

Steady-state flow is confirmed when there is no more change in pressure. Figure 13 shows the simulation of a complete B-B test. The valve is closed after the steady-state flow is reached. It can be observed that the response of the system is the same if we close the valve at any time after the steady-state is reached. The reason is that the system is in equilibrium during the steady-state period, so closing the valve at any time after the steady-state is reached would result in the same response of the system. Hence, it is recommended to close the valve once the steady-state condition is reached after the bleed down.

8. Effect of Pressure Logging Time Step Size

Usually, bleed-down processes are much faster than the buildup processes. The bleed-down duration may range from several seconds to several hours depending on the severity of SCP in well. The pressure logging time step would be important to find the minimum bleed-down pressure that an SCP well can reach. Small time steps also improve the bleed-down curve which helps in matching the field tests with simulation results for interpretation purposes. Figure 14 shows a field B-B test on well APTA 31. A bleed-down test followed by a buildup test and another bleed-down can be observed. Each bleed-down test only includes two data points which show that the pressure logging time step is large. It is not clear if the minimum bleed-down pressure is reached. In addition to that, fitting the data with the simulation would result in an imprecise evaluation of the test.

9. Conclusions

Results of this study show that the response of the well’s leakage system may be controlled by operational parameters or it may be due to system parameters. Typical response patterns have been studied using simulated B/B test data. The patterns have been also verified with results from a field test, The following specific conclusions can be drawn from this study:
  • A stage-by-stage analysis method is developed using the mathematical model of SCP.
  • The ambiguity of the previous analysis methods is mostly resolved by the new approach.
  • Testing protocols are developed and the following results are achieved:
    • Valve opening percentage is a critical parameter for analysis of the pressure bleed-down time (Δtbo). As the opening percentage increases the bleed down duration increases. A 100% valve opening would make instant pressure reduction impossible to analyze. By having a 30% valve opening the system reaches the minimum pressure after 11 min in comparison with a 10% valve opening that takes 20 min.
    • Closing the valve before the steady-state flow is reached could help to find the maximum build-up pressure in 24 h but would also invalidate the analysis of the remaining stages. Hence, the operator shall not close the valve earlier before a steady state is reached. The operator shall leave the needle valve open until a steady-state flow stage is reached in order to see the minimum bleed-down pressure.
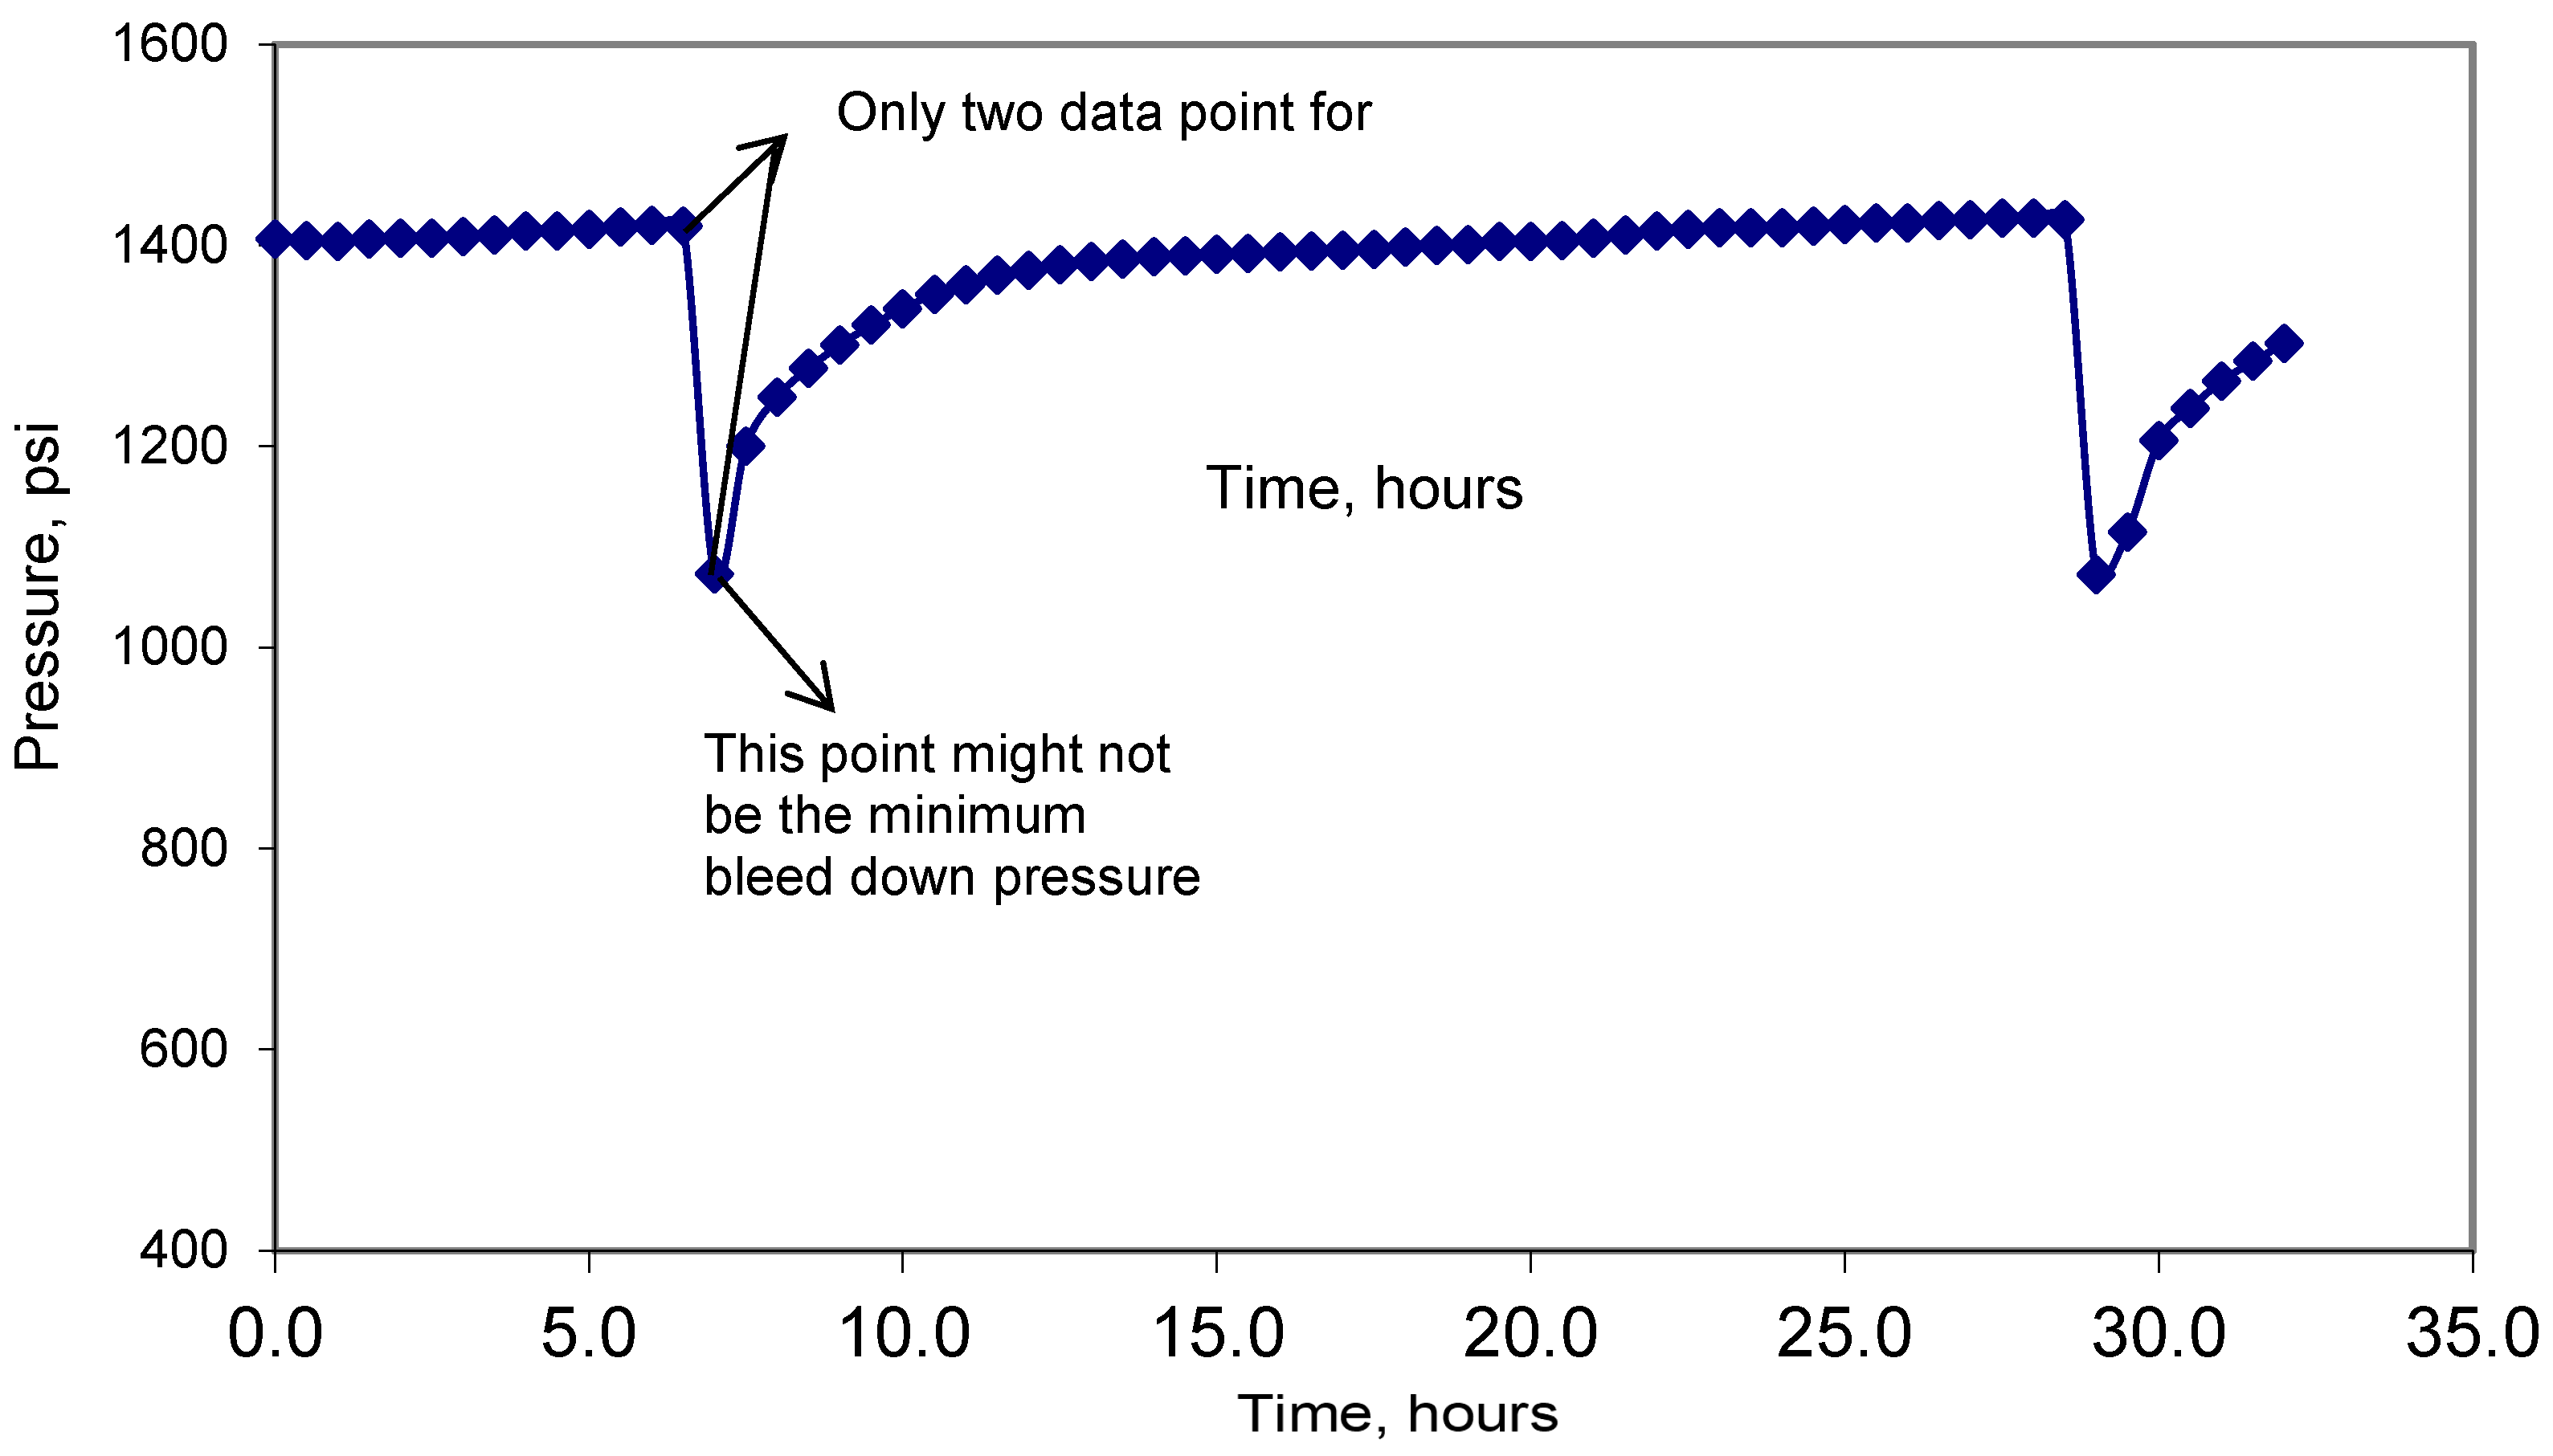
    • It is found that the 24-h limit for the B/B test pressure buildup may be insufficient for finding the value of the minimum bleed-down and maximum buildup pressures in some cases.
    • Once the steady-state flow is reached, the valve may be closed at any time. It has been found that the system response was the same disregarding the duration of the steady-state stage.
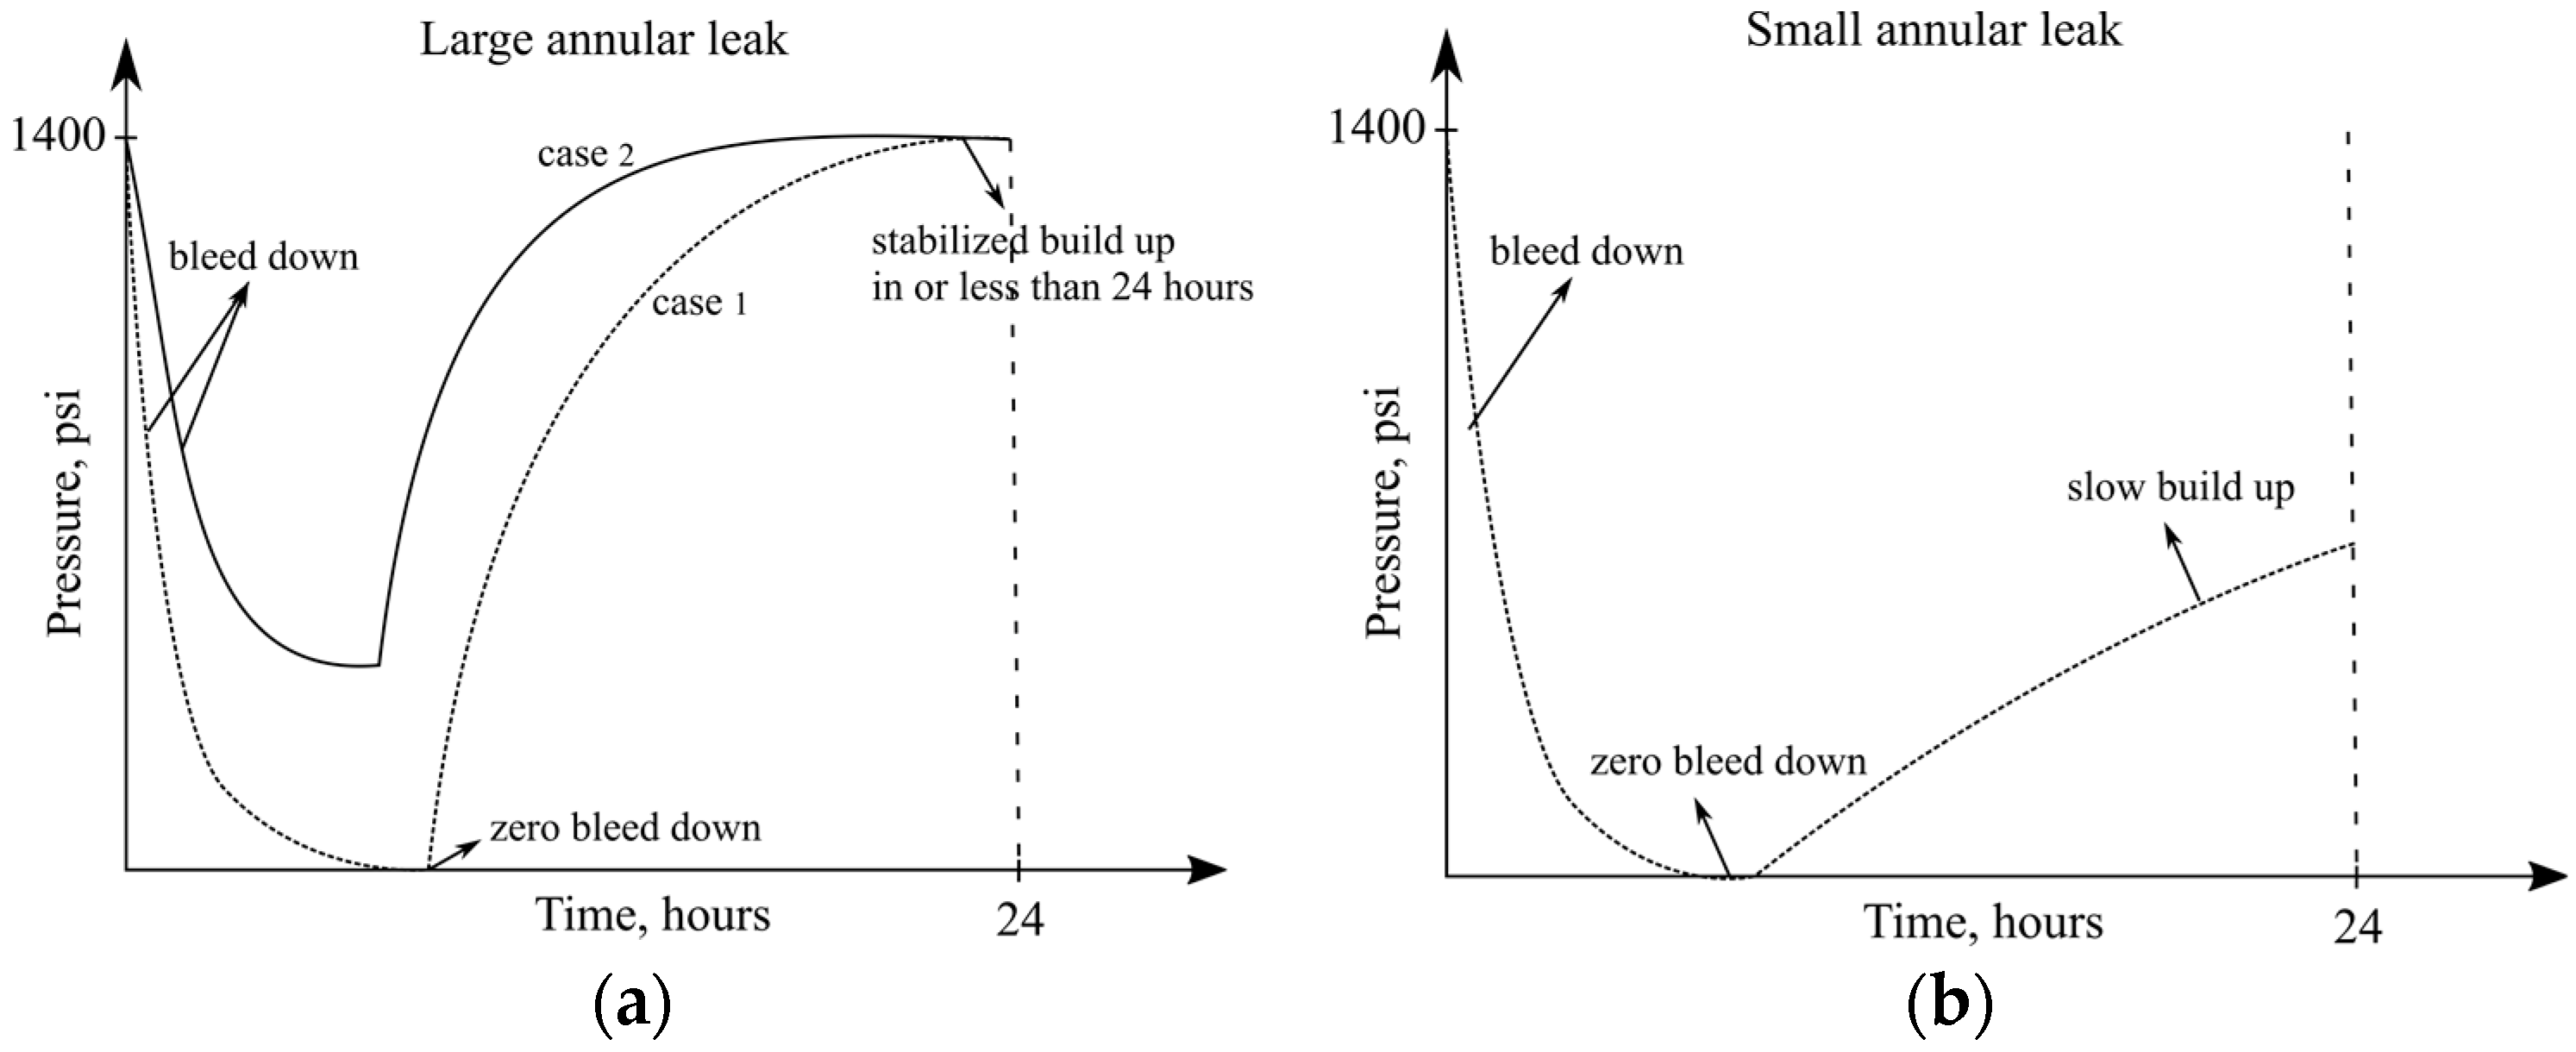
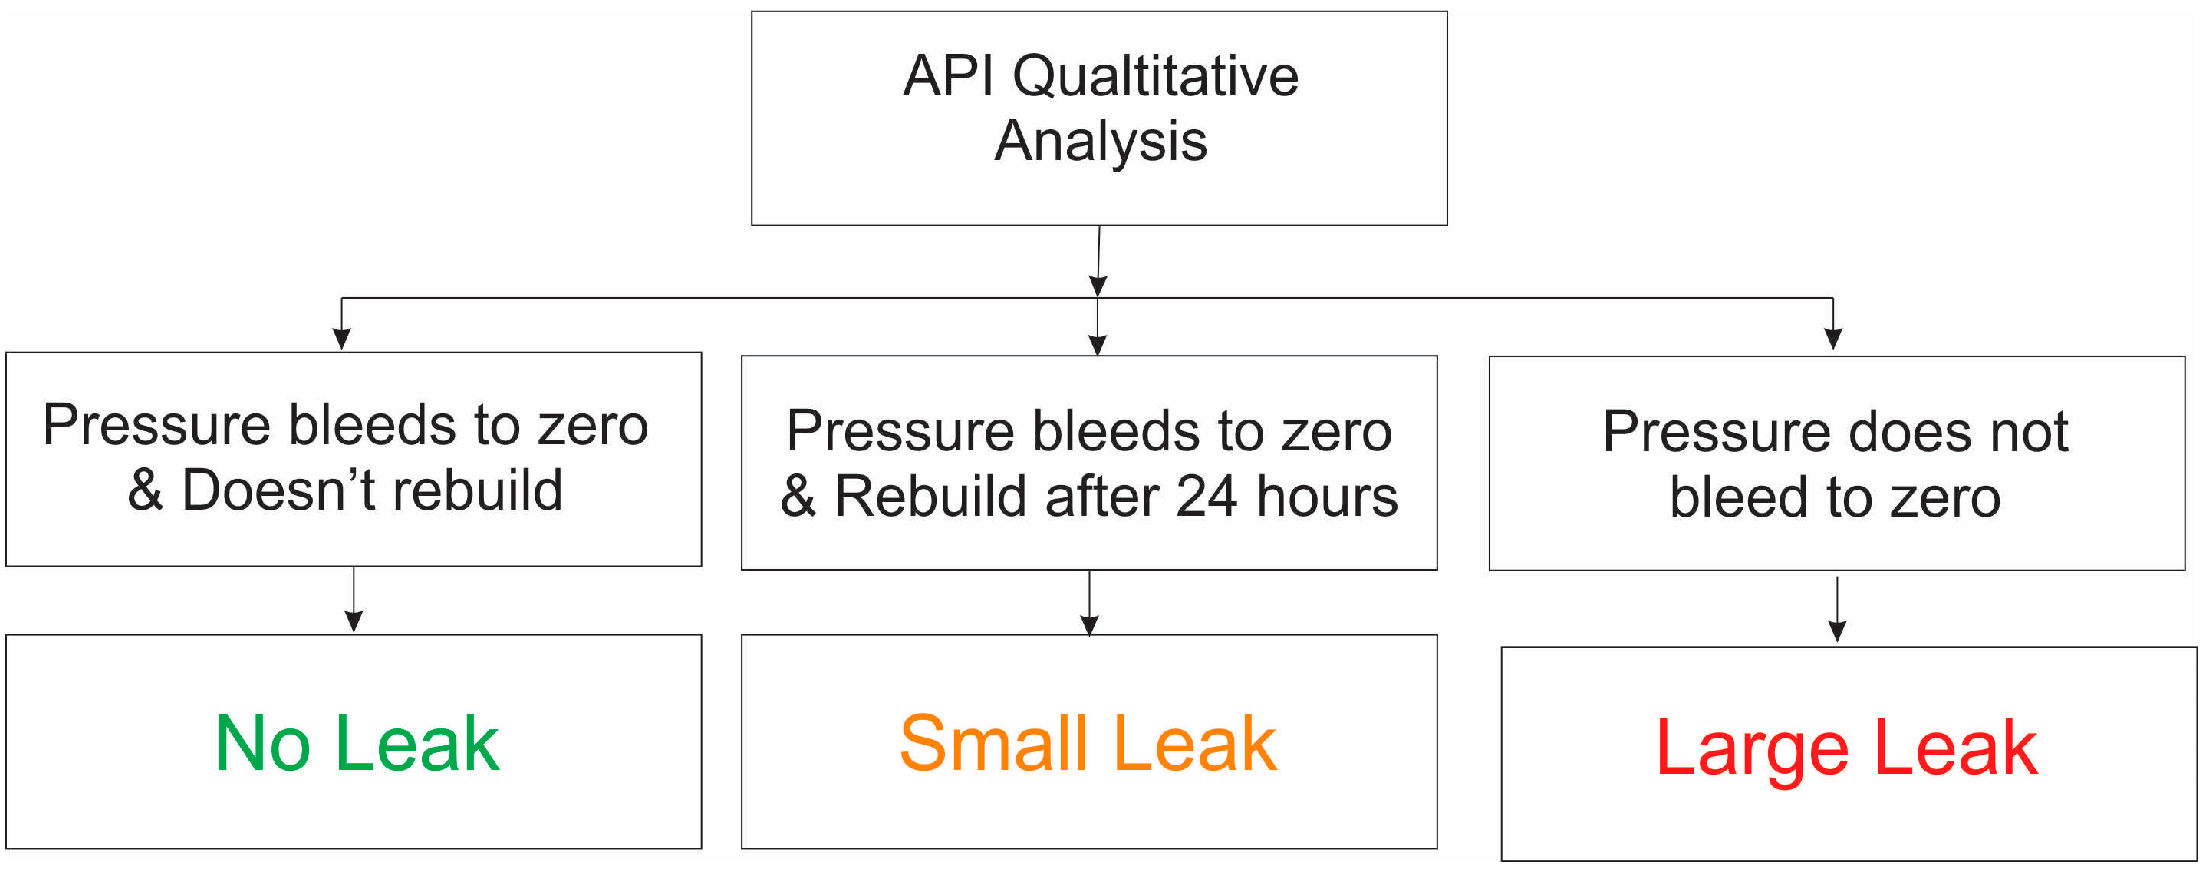
    • Bleeding down casing pressure to zero does not necessarily prove that the cement leak is small as it may result from a long column of viscous fluid in the well’s annulus.
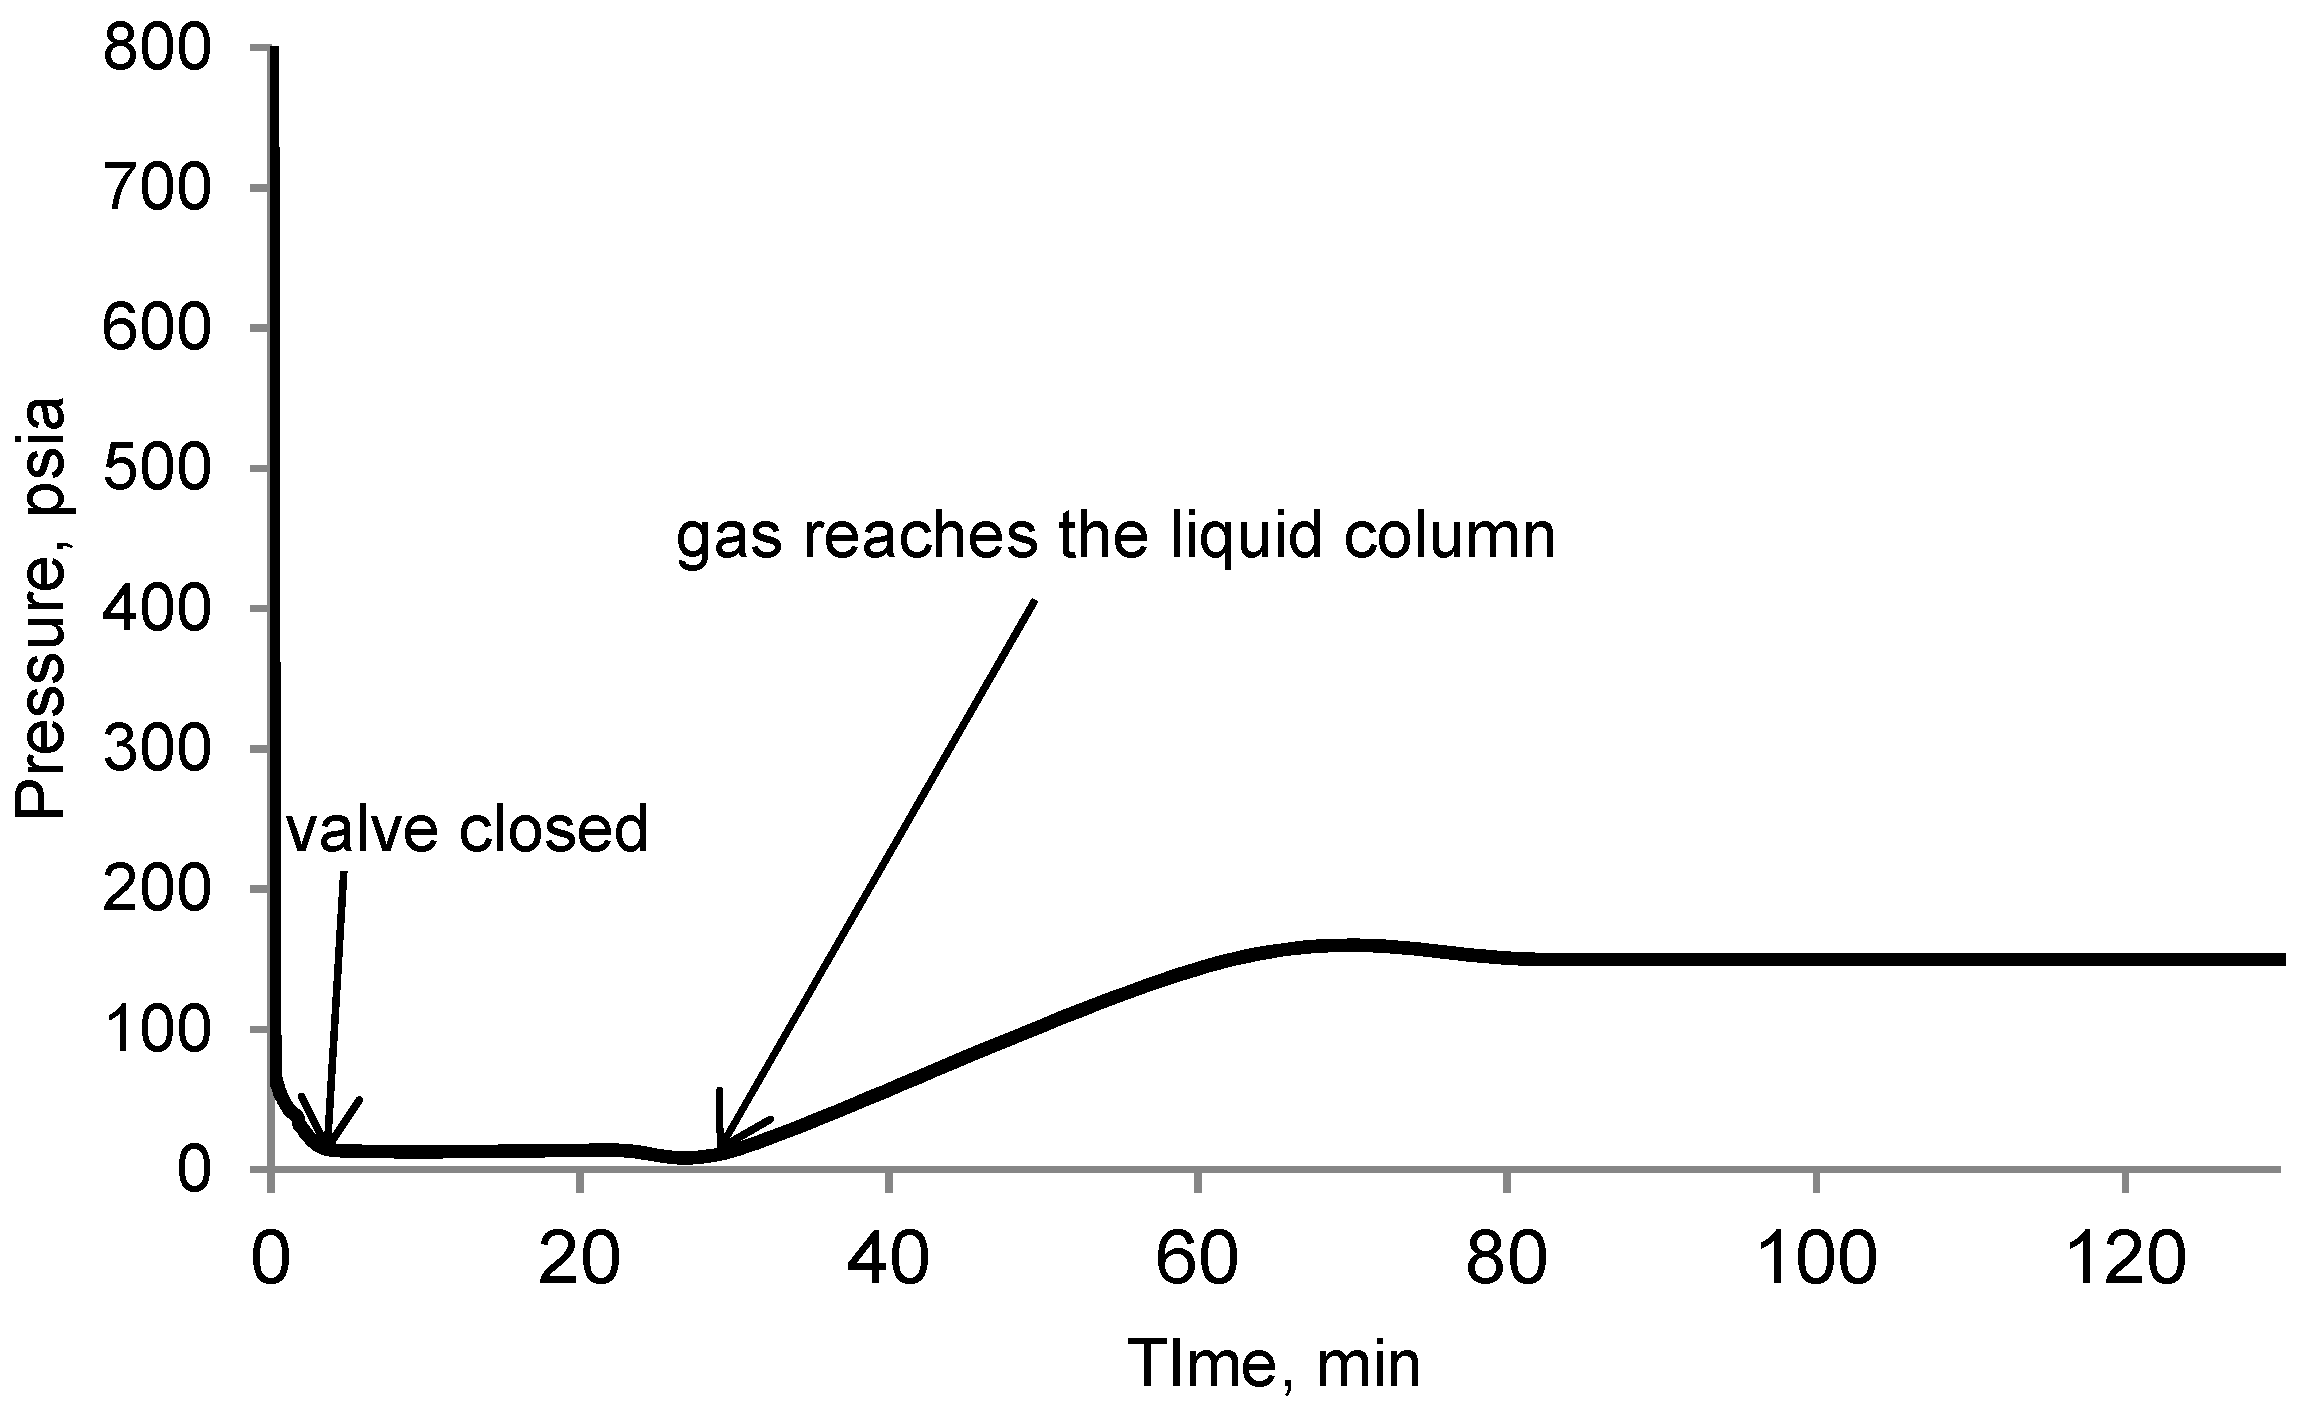
    • Pressure bleed-down processes are fast compared with pressure build-up. The pressure logging time step for the bleed down should be smaller to make the stage analysis easier by having more data points. The new analysis method has been verified with the B/B test data from a GOM well. The pressure bleed-down stage analysis detected a 22-foot long column gas chamber above the free level of the annular liquid column below the casing head. The constant-flow stage analysis defined a relationship between leak size (cement permeability), and gas source depth and pressure. The relationship has been further resolved by analyzing the pressure build-up stage giving the value of cement leak permeability 40 md.

Author Contributions

Conceptualization, A.K.W., M.K.; methodology, A.K.W., M.K.; software, M.K.; validation, A.K.W., M.K.; formal analysis, A.K.W., M.K.; investigation, A.K.W., M.K.; resources, A.K.W.; data curation, M.K.; writing—original draft preparation, M.K.; writing—review and editing, A.K.W., M.K.; visualization, M.K.; supervision, A.K.W.; project administration, A.K.W.; funding acquisition, A.K.W. All authors have read and agreed to the published version of the manuscript.

Funding

This research received no external funding.

Institutional Review Board Statement

Not applicable.

Informed Consent Statement

Not applicable.

Acknowledgments

The authors would like to express their gratitude to the Shell Oil Company for founding the Joined Industry Program (JIP) at LSU, Sustained Casing Pressure Initiative, that provided financial support for this project.

Conflicts of Interest

The authors declare no conflict of interest.

Nomenclature

A [in2]area
Cddischarge coefficient
Cm [1/psi]liquid column compressibility
Df [ft]SCP source depth
Fcfcritical flow pressure ratio
Fduratio of downstream pressure to upstream pressure
Fgt [ft3]trapped volume fraction of gas in liquid
g [ft/sec2]gravitational acceleration
k [md]cement permeability
khratio of specific heats
Lc [ft]Length of cement column
Lmc [ft]liquid column length
min [lb]mass of gas entering the gas chamber
mout [lb]mass of gas leaving to atmosphere
Mw [lb/mol]gas molar mass
pc [psi]pressure at the cement/liquid interface
pcf [psi]casing head pressure during constant flow stage
Pcsg [psi]casing head pressure
pf [psi]SCP source pressure
psc [psi]pressure at standard condition
qg [Mscf/day]gas flow rate at cement/liquid interface
qgin [Mscf/day]gas flow rate at liquid/gas chamber interface
qgout [Mscf/day]gas flow rate at the needle valve
R [psi.ft3/mol.R] gas constant
Tsc [R]temperature at standart condition
Tws [R]cement top temperature
Vgci [ft3]initial gas chamber volume
VOvalve opening percentage
zgas compressibility factor
Greek
βiregression coefficeints
τy [lb/100 ft2]yield stress
Conversion Factors
Field UnitsSI Units
1 in20.00064516 m2
1 psi6894.76 pa
1 ft0.3048 m
1 ft30.0283168 m3
1 md9.869233 × 10−16 m2
1 lb0.453592 kg
1 mscf/day28.316846592 m3/day
1 Rankine0.555556 Kelvin

References

  1. Bourgoyne, A.; Scott, S.; Regg, J. Sustained Casing Pressure in Offshore Producing Wells. In Proceedings of the Offshore Technology Conference, Houston, TX, USA, 3–6 May 1999. [Google Scholar]
  2. API. API RP 90: Annular Casing Pressure Management for Offshore Wells, 1st ed.; National Archives and Records Administration: College Park, MD, USA, 2006. [Google Scholar]
  3. Xu, R. Analysis of Diagnostic Testing of Sustained Casing Pressure in Wells. Ph.D. Thesis, Louisiana State University, Baton Rouge, LA, USA, 2002. [Google Scholar]
  4. Xu, R.; Wojtanowicz, A.K. Diagnosis of sustained casing pressure from bleed-off/buildup testing patterns. In Proceedings of the SPE Production and Operations Symposium, Oklahoma City, OK, USA, 24–27 March 2001. [Google Scholar]
  5. Xu, R.; Wojtanowicz, A. Diagnostic Testing of Wells With Sustained Casing Pressure-An Analytical Approach. In Proceedings of the Canadian International Petroleum Conference, Calgary, AB, Canada, 10–12 June 2003. [Google Scholar]
  6. Xu, R.; Wojtanowicz, A. Pressure Buildup Test Analysis in Wells with Sustained Casing Pressure. J. Nat. Gas Sci. Eng. 2017, 38, 608–620. [Google Scholar] [CrossRef]
  7. Huerta, N.J.; Checkai, D.; Bryant, S.L. Utilizing sustained casing pressure analog to provide parameters to study CO2 leakage rates along a wellbore. In Proceedings of the SPE International Conference on CO2 Capture Storage and Utilization, San Diego, CA, USA, 2–4 November 2009; Society of Petroleum Engineers: Richardson, TX, USA, 2009. [Google Scholar]
  8. Tao, Q.; Checkai, D.; Huerta, N.J.; Bryant, S.L. Model to predict CO2 leakage rates along a wellbore. In Proceedings of the SPE Annual Technical Conference and Exhibition, Florence, Italy, 19–22 September 2010. [Google Scholar]
  9. Zhu, H.; Lin, Y.; Zeng, D.; Zhang, D.; Wang, F. Calculation analysis of sustained casing pressure in gas wells. Pet. Sci. 2012, 9, 66–74. [Google Scholar] [CrossRef] [Green Version]
  10. Kinik, K.; Wojtanowicz, A.K. Identifying environmental risk of sustained casing pressure. In Proceedings of the SPE Americas E&P Health Safety Security and Environmental Conference, Houston, TX, USA, 21–23 March 2011. [Google Scholar]
  11. Caetano, E.F.; Shoham, O.; Brill, J.P. Upward Vertical Two-Phase Flow Through an Annulus—Part I: Single-Phase Friction Factor, Taylor Bubble Rise Velocity, and Flow Pattern Prediction. J. Energy Resour. Technol. 1992, 114, 1. [Google Scholar] [CrossRef]
  12. Yao, T.; Wojtanowicz, A. Criteria and risk of integrity loss for wells with sustained casing pressure. AGH Drill. Oil Gas 2017, 34, 639–654. [Google Scholar] [CrossRef] [Green Version]
  13. Johnson, A.; Rezmer-Cooper, I.; Bailey, T.; McCann, D. Gas migration: Fast, slow or stopped. In Proceedings of the SPE/IADC Drilling Conference, Amsterdam, The Netherlands, 28 February–2 March 1995. [Google Scholar]
  14. Kazemi, M.; Wojtanowicz, A.K. Development of improved testing procedure for wells with sustained casing pressure. In Proceedings of the SPE Annual Technical Conference and Exhibition, Amsterdam, The Netherlands, 27–29 October 2014; OnePetro: Richardson, TX, USA, 2014. [Google Scholar]
  15. Al-Hussainy, R.; Ramey, H.J.; Crawford, P.B. The flow of real gases through porous media. J. Pet. Technol. 1966, 18, 624–636. [Google Scholar] [CrossRef]
  16. Takács, G. Gas Lift: Manual; PennWell Books: Tulsa, OK, USA, 2005. [Google Scholar]
Figure 1. (a) Large leak Case 1 (long column of viscous fluid)—casing pressure bleeds down to zero; Case 2—non-zero pressure bleed down; Pressure rebuilds quickly for both cases (b) Small leak; pressure bleeds down to zero and the build-up rate is small.
Energies 15 03632 g001
Figure 2. API qualitative analysis of leak size in wells with SCP (adapted with permission from Kazemi et al., SPE, 2014).
Energies 15 03632 g002
Figure 5. Fitting the field data bleed down test with simulation results by iterating on initial gas chamber volume.
Energies 15 03632 g005
Figure 6. Flow chart describing the analysis method for different annulus configurations.
Energies 15 03632 g006
Figure 7. SCP bleed down and build up test for well # 19 (adapted with permission from Kazemi et. al, SPE, 2014).
Energies 15 03632 g007
Figure 8. The mathematical model of SCP is matched to the bleed dowwn field data by iterating on initial gas chamber volume.
Energies 15 03632 g008
Figure 9. Field build up test is matched with mathematical model.
Energies 15 03632 g009
Figure 10. Valve opening controls the bleed down time.
Energies 15 03632 g010
Figure 11. The casing pressure stays zero even when the valve is closed.
Energies 15 03632 g011
Figure 12. Minimum bleed down pressure can be achieved by leaving the valve open more; maximum build up pressure can be found by closing the valve earlier.
Energies 15 03632 g012
Figure 13. The valve can be closed at any time after the steady state is reached.
Energies 15 03632 g013
Figure 14. Casing pressure test results of well APTA-31.
Energies 15 03632 g014
Table 1. Low and high values for five parameters affecting buildup and bleed-down.
FactorsUnitsFeasible Range
Pfpsi5000 to 7000
kmd-ft21.1 to 50
Fg 0 to 0.009
Vgcgal900 to 9000
Table 2. Sensitivity analysis result for the bleed down.
VariableParameter EstimatesStandard Errort ValuePr > |t|
Intercept0.406140.0174323.3<0.0001
Pf0.005740.017430.330.7443
k0.000586790.017430.030.9734
Fgt−0.092250.0175−5.27<0.0001
Vgci−0.184170.0175−10.52<0.0001
Table 3. Sensitivity analysis result for the build up.
VariableParameter EstimatesStandard Errort ValuePr > |t|
Intercept495.8941532.9638115.04<0.0001
Pf77.7066532.963812.360.0262
k97.7308532.963812.960.0064
Fg79.8094833.09542.410.0232
Vgc−194.4969833.0954−5.88<0.0001
Table 4. System properties as input to the mathematical model (Adapted with permission from Kazemi et. al, SPE, 2014 [14]).
SystemPropertiesUnitWell 19
AnnulusInner diameterin9.95
Outer diameterin7.625
CementLengthft598
FormationGuessed Depthft5447
GasSpecific gravity 0.71
LiquidConsistency indexeq cp285.64
Flow behavior index 0.8
Yield pointlb/100 ft210
Densityppg11
Table 5. As the valve opening percentage increases, the effective bleed-down time decreases.
Δtbo (min)VO%
1130
1320
2010
Publisher’s Note: MDPI stays neutral with regard to jurisdictional claims in published maps and institutional affiliations.

