Article

Fabrication and Performance of Micro-Tubular Solid Oxide Cells

1
College of Aeronautics and Engineering, Kent State University, Kent, OH 44242, USA
2
Department of Engineering Technology, Kent State University at Tuscarawas, New Philadelphia, OH 44663, USA
*
Author to whom correspondence should be addressed.
Energies 2022, 15(10), 3536; https://doi.org/10.3390/en15103536
Submission received: 31 March 2022 / Revised: 3 May 2022 / Accepted: 10 May 2022 / Published: 12 May 2022

Abstract

:
Solid Oxide Cells (SOC) are the kind of electrochemical devices that provide reversible, dual mode operation, where electricity is generated in a fuel cell mode and fuel is produced in an electrolysis mode. Our current work encompasses the design, fabrication, and performance analysis of a micro-tubular reversible SOC that is prepared through a single dip-coating technique with multiple dips using conventional materials. Electrochemical impedance and current-voltage responses were monitored from 700 to 800 °C. Maximum power densities of the cell achieved at 800, 750, and 700 °C, was 690, 546, and 418 mW cm−2, respectively. The reversible, dual mode operation of the SOC was evaluated by operating the cell using 50% H2O/H2 and ambient air. Accordingly, when the SOC was operated in the electrolysis mode at 1.3 V (the thermo-neutral voltage for steam electrolysis), current densities of −311, −487 and −684 mA cm−2 at 700, 750 and 800 °C, respectively, were observed. Hydrogen production rate was determined based on the current developed in the cell during the electrolysis operation. The stability of the cell was further evaluated by performing multiple transitions between fuel cell mode and electrolysis mode at 700 °C for a period of 500 h. In the stability test, the cell current decreased from 353 mA cm−2 to 243 mA cm−2 in the fuel cell mode operation at 0.7 V, while the same decreased from −250 mA cm−2 to −115 mA cm−2 in the electrolysis operation at 1.3 V.

1. Introduction

Solid Oxide Cells (SOCs) are the kind of electrochemical devices that have reversible, dual modes of operation, such that, in one mode, the SOC operates in a solid oxide fuel cell (SOFC) mode, and, in another mode, the SOC operates in a solid oxide electrolysis cell (SOEC) mode. That is, the SOFC mode converts fuel into electricity and heat, whereas the SOEC mode generates fuel from the electrolysis of water by utilizing electricity and heat. From a thermodynamic view, the energy demand for the endothermic water splitting reaction can be partially obtained from the heat generated within the cell. While the dual mode operation of SOCs provides several advantages, the technology enabling the reversible operation of the SOC still remains at the research and development stage and the stability over the long term is still a challenge [1,2,3]. Since a compact and lightweight fuel cell design is highly sought after for the facilitation of large-scale commercialization of SOC systems for use in portable and transportation applications, considerable efforts have been made to develop novel and cost-effective methods of creating lightweight and compact reversible SOCs [4,5,6,7,8,9].
Among the SOC designs, micro tubular solid oxide cells (MT-SOCs) have attracted strong interest due to their high tolerance to thermal-cycling, quick start-up ability, high power density over unit volume and robust portable characteristics [10,11,12]. However, the fabrication process of MT-SOCs is challenging, where different ceramic layers, with dissimilar compositions and properties, are placed over a cylindrical support. To complete cell fabrication, numerous sintering processes have to be accomplished at various temperatures and atmospheres. Particularly, extrusion, isostatic pressing and 3D printing methods are common to fabricate the support layer [13,14], whereas dip-coating, electrochemical vapor deposition, pulsed laser deposition and air plasma spray techniques are used to fabricate multilayers on the fuel electrode support [10,15]. In comparison to other fabrication methods, the dip-coating process is fast and easily controllable, while, at the same time, it offers a low-cost method to prepare thin films. Commonly dip-coating is used for the thin electrolyte layer coating on tubular supports [13,15,16], but very few researchers have used dip-coating to fabricate the entire cell [11,17,18,19,20]. To date, substantial progress has been made towards the development, fabrication and durability of the MT-SOFC at an industrial scale, However, MT-SOEC is still in the research and development stage. Reversible MT-SOC is garnering the attention and research in progress at a laboratory scale. Even though the operation of the SOCs is reversible, the degree of performance degradation over time differs significantly when tested under fuel cell mode, as compared to the electrolysis mode [1,2,7]. For example, the work of Hagen et al. [21] suggested that under fuel cell mode, the cell is reasonably stable over extended time at a high current density of −1–2 A cm−2. However, under electrolysis mode, the stability of the cell is limited to a lower current density value (at 0.25 A cm−2).
The focus of the present work is to develop cost-effective, lightweight MT-SOCs using our unique fabrication technique and evaluate their durability when cycled between their two reversible modes. In this work, we used a single dip-coating technique with multiple dips to develop the full cell structure, extending from the fuel electrode support tube to the oxygen electrode. This cell development procedure is capable of producing SOCs with flexible size, and can rapidly improve to meet the needs of research and development, as well as of industrial manufacturing. So far, very limited literature is available for fabrication of the complete cells by a single dip-coating technique and no report was found on testing such an MT-SOC in reversible mode for an extended period. This is the first time an entire MT-SOC has been developed using a single cost-effective fabrication technique which was successfully tested under reversible operation for more than 500 h.

2. Materials and Methods

2.1. Cell Fabrication

The fabricated cells utilized Ni-Yttria Stabilized Zirconia (Ni-3YSZ), Ni-Scandia-Stabilized Zirconia (ScSZ), Samaria-Doped Ceria (SDC) and Lanthanum Strontium Cobalt Ferrite (LSCF) to form the fuel electrode support, the fuel electrode functional layer, the electrolyte, the oxygen electrode protective layer, and the oxygen electrode, respectively. The fuel electrode-supported SOC was fabricated using a multiple dip coating process [11]. The dip-coating inks for individual layers were developed using ethyl alcohol and toluene as the solvents. To form the fuel electrode support layer, coarse NiO (NiO-C, Fuel Cell Materials, Lewis Center, OH, USA) and 3YSZ (Tosoh Corporation, Shunan-shi, Yamaguchi, Japan) powders were mixed in a 65/35 wt%. For the pore formers, 8 wt% PMMA and 5 wt% cellulose was used. Furthermore, 7 wt% Polyvinyl Butyral (PVB; B-98, Tape Casting Warehouse) was used as a binder, 3 wt% Hypermer KD-1 (Tape Casting Warehouse, Morrisville, PA, USA) was used as a dispersant, and dioctyl phthalate (DOP; Sigma Aldrich, St. Louis, MO, USA) at 3 wt% was used as a plasticizer. The same solvents, binder, and plasticizers were used to prepare the slurries for other functional layers. The details of mixing procedures and solid pretreatments for preparation of dip-coating inks are as follows. The slurries of individual layers (fuel electrode support, fuel electrode functional layer, electrolyte, oxygen electrode protective layer and oxygen electrode) were prepared by dispersing the ceramic powders in a binary ethyl alcohol and toluene (ratio of ethyl alcohol/toluene: 50/50 wt%) solvent along with 3 wt% of Hypermer KD-1 as the dispersant. The concentration of solid in the ink, with respect to the total ink weight, was 20% for electrolyte ink; whereas for the fuel electrode support, fuel electrode functional layer and oxygen electrode, it was 60%. The mixture of the ceramic powder and solvent, along with the dispersant, were ball milled for two hours. Subsequently, an appropriate amount of binder, plasticizer and pore former were added to the mixture and the overall mixture was ball milled for 24 h. Note that the pore former was added only for the fuel electrode support, to achieve and control the required porosity.
The targeted thicknesses of the fuel electrode support, the fuel electrode functional layer, the electrolyte, the protective layer, and the oxygen electrode layer were 400 µm, 15 µm, 10 µm, 2 µm, and 20 µm, respectively. To obtain the preferred thicknesses, the dip-coating process was repeated 14 times for the fuel electrode support, 2 times for the fuel electrode functional layer, 6 times for the electrolyte, 2 times for the protective layer, and 4 times for the oxygen electrode. Each dip coating was followed by drying in air for 10 min prior to other dip coating. The speed of dipping, dwelling time, and speed of pulling were maintained at 6 mm/s, 5 s, and 1.5 mm/s, respectively. For the fabrication of the fuel electrode support tube, the dip coated green layer, on a highly purified carbon rod, was fired in air in a box furnace. The firing profile was configured such that the temperature was ramped to 450 °C at a heating rate of 0.5 °C/min, whereupon it was held at 450 °C for 1 h. Next, the temperature was raised to 1000 °C at 1 °C per min and held for 1 h, after which the furnace was cooled to room temperature at a rate of 3 °C/min. The pre-firing temperature of the fuel electrode functional layer was the same as that of the support layer. The electrolyte was coated over the pre-fired fuel electrode functional layer and was sintered at 1400 °C for 3 h. Prior to electrolyte sintering, the green electrolyte coated tube was subjected to isothermal heating at 450 °C for 1 h. The protective layer and oxygen electrode layer were then successfully dip coated onto the co-sintered half cells. The protective layer was sintered at 1300 °C for 2 h, whereas the oxygen electrode layer was fired at 1100 °C for 1 h. The selected temperature profiles for firing individual layers are based on the observations of our previous work [11,22]. Table 1 summarizes the conditions for the fabrication of SOC layers.

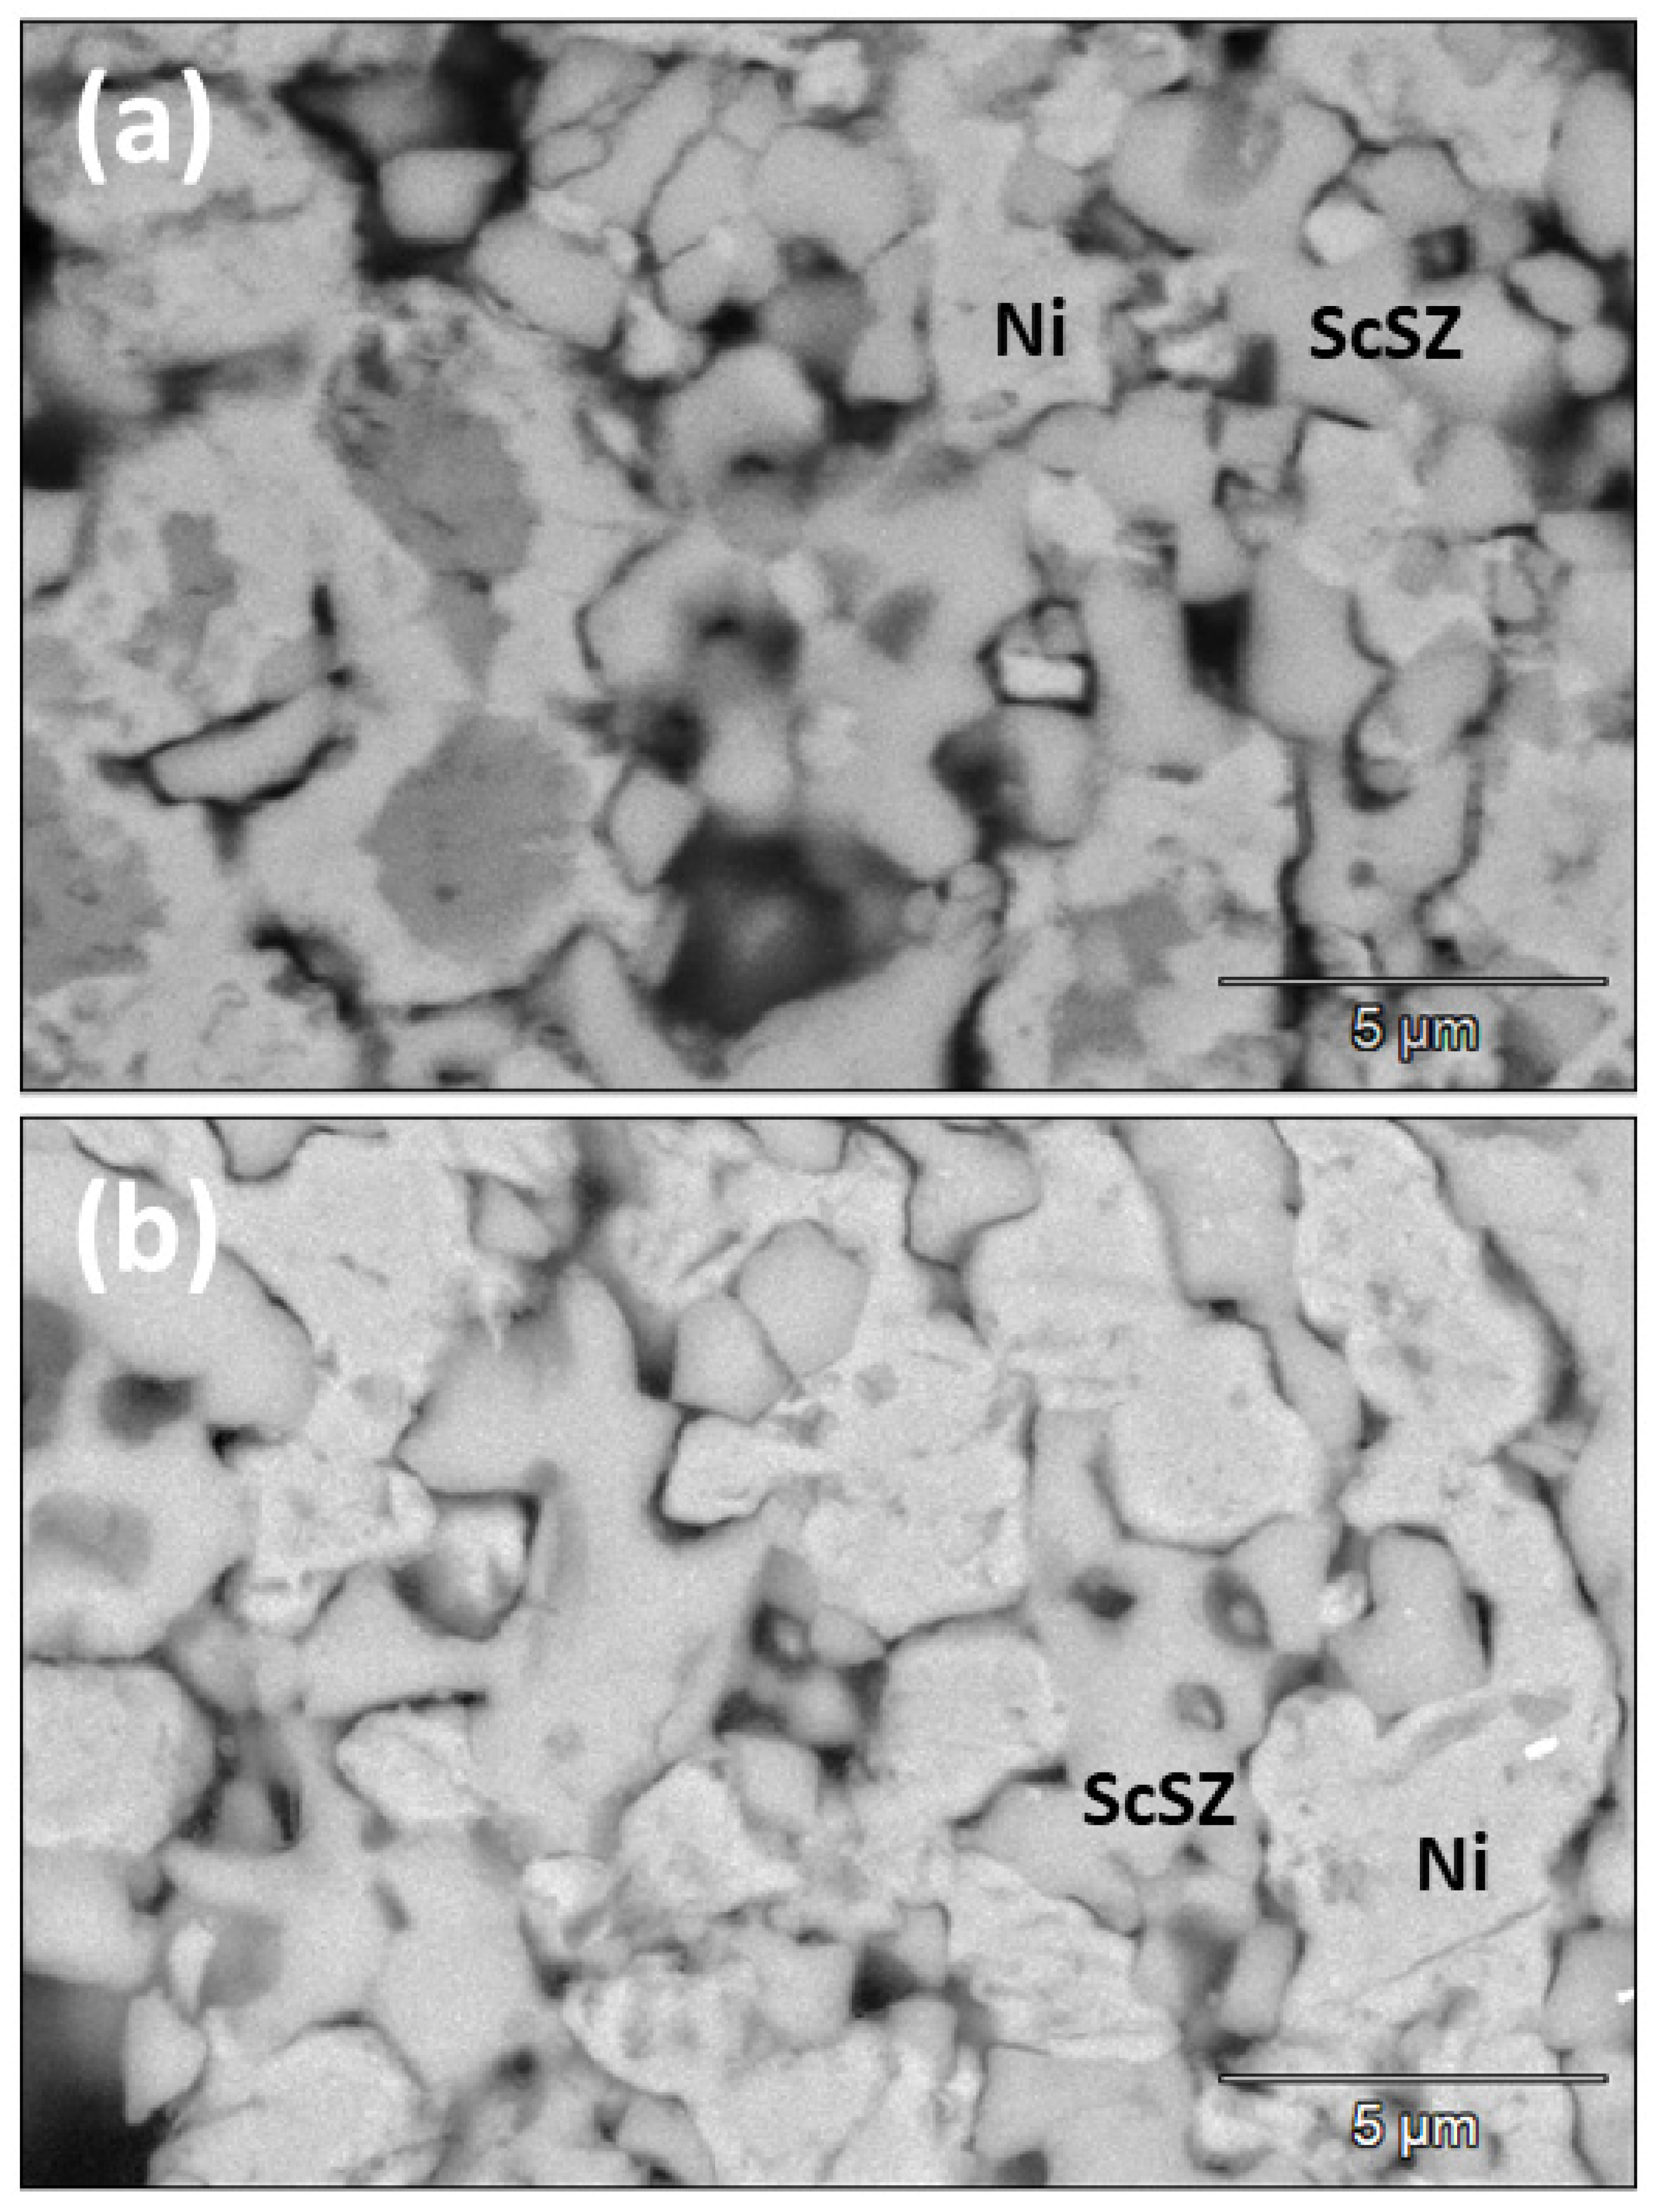
2.2. Microstructural Characterizations

The open porosity of the fuel electrode support, fuel electrode functional layer, and oxygen electrode were determined by the Archimedes’ method using deionized water as a displacement liquid.
Open   porosity   = W S W D W S W I
where WS is the saturated weight of the sample tube in air, WD is the dry weight of the tube in air, and WI is the immersed weight of the tube in deionized water. The samples were boiled in deionized water until they were completely saturated. Note that the porosity of the fuel electrode functional layer and the oxygen electrode was determined by preparing separate single-layer tubes and sintering them at their respective sintering temperatures. Furthermore, the fuel electrode support and functional layer tubes were reduced in H2 prior to the porosity measurements. The microstructure of the fuel electrode support tubes and the complete cells were examined with a scanning electron microscope Apreo 2 FEI/SEM (Thermo Fisher Scientific, Waltham, MA, USA).

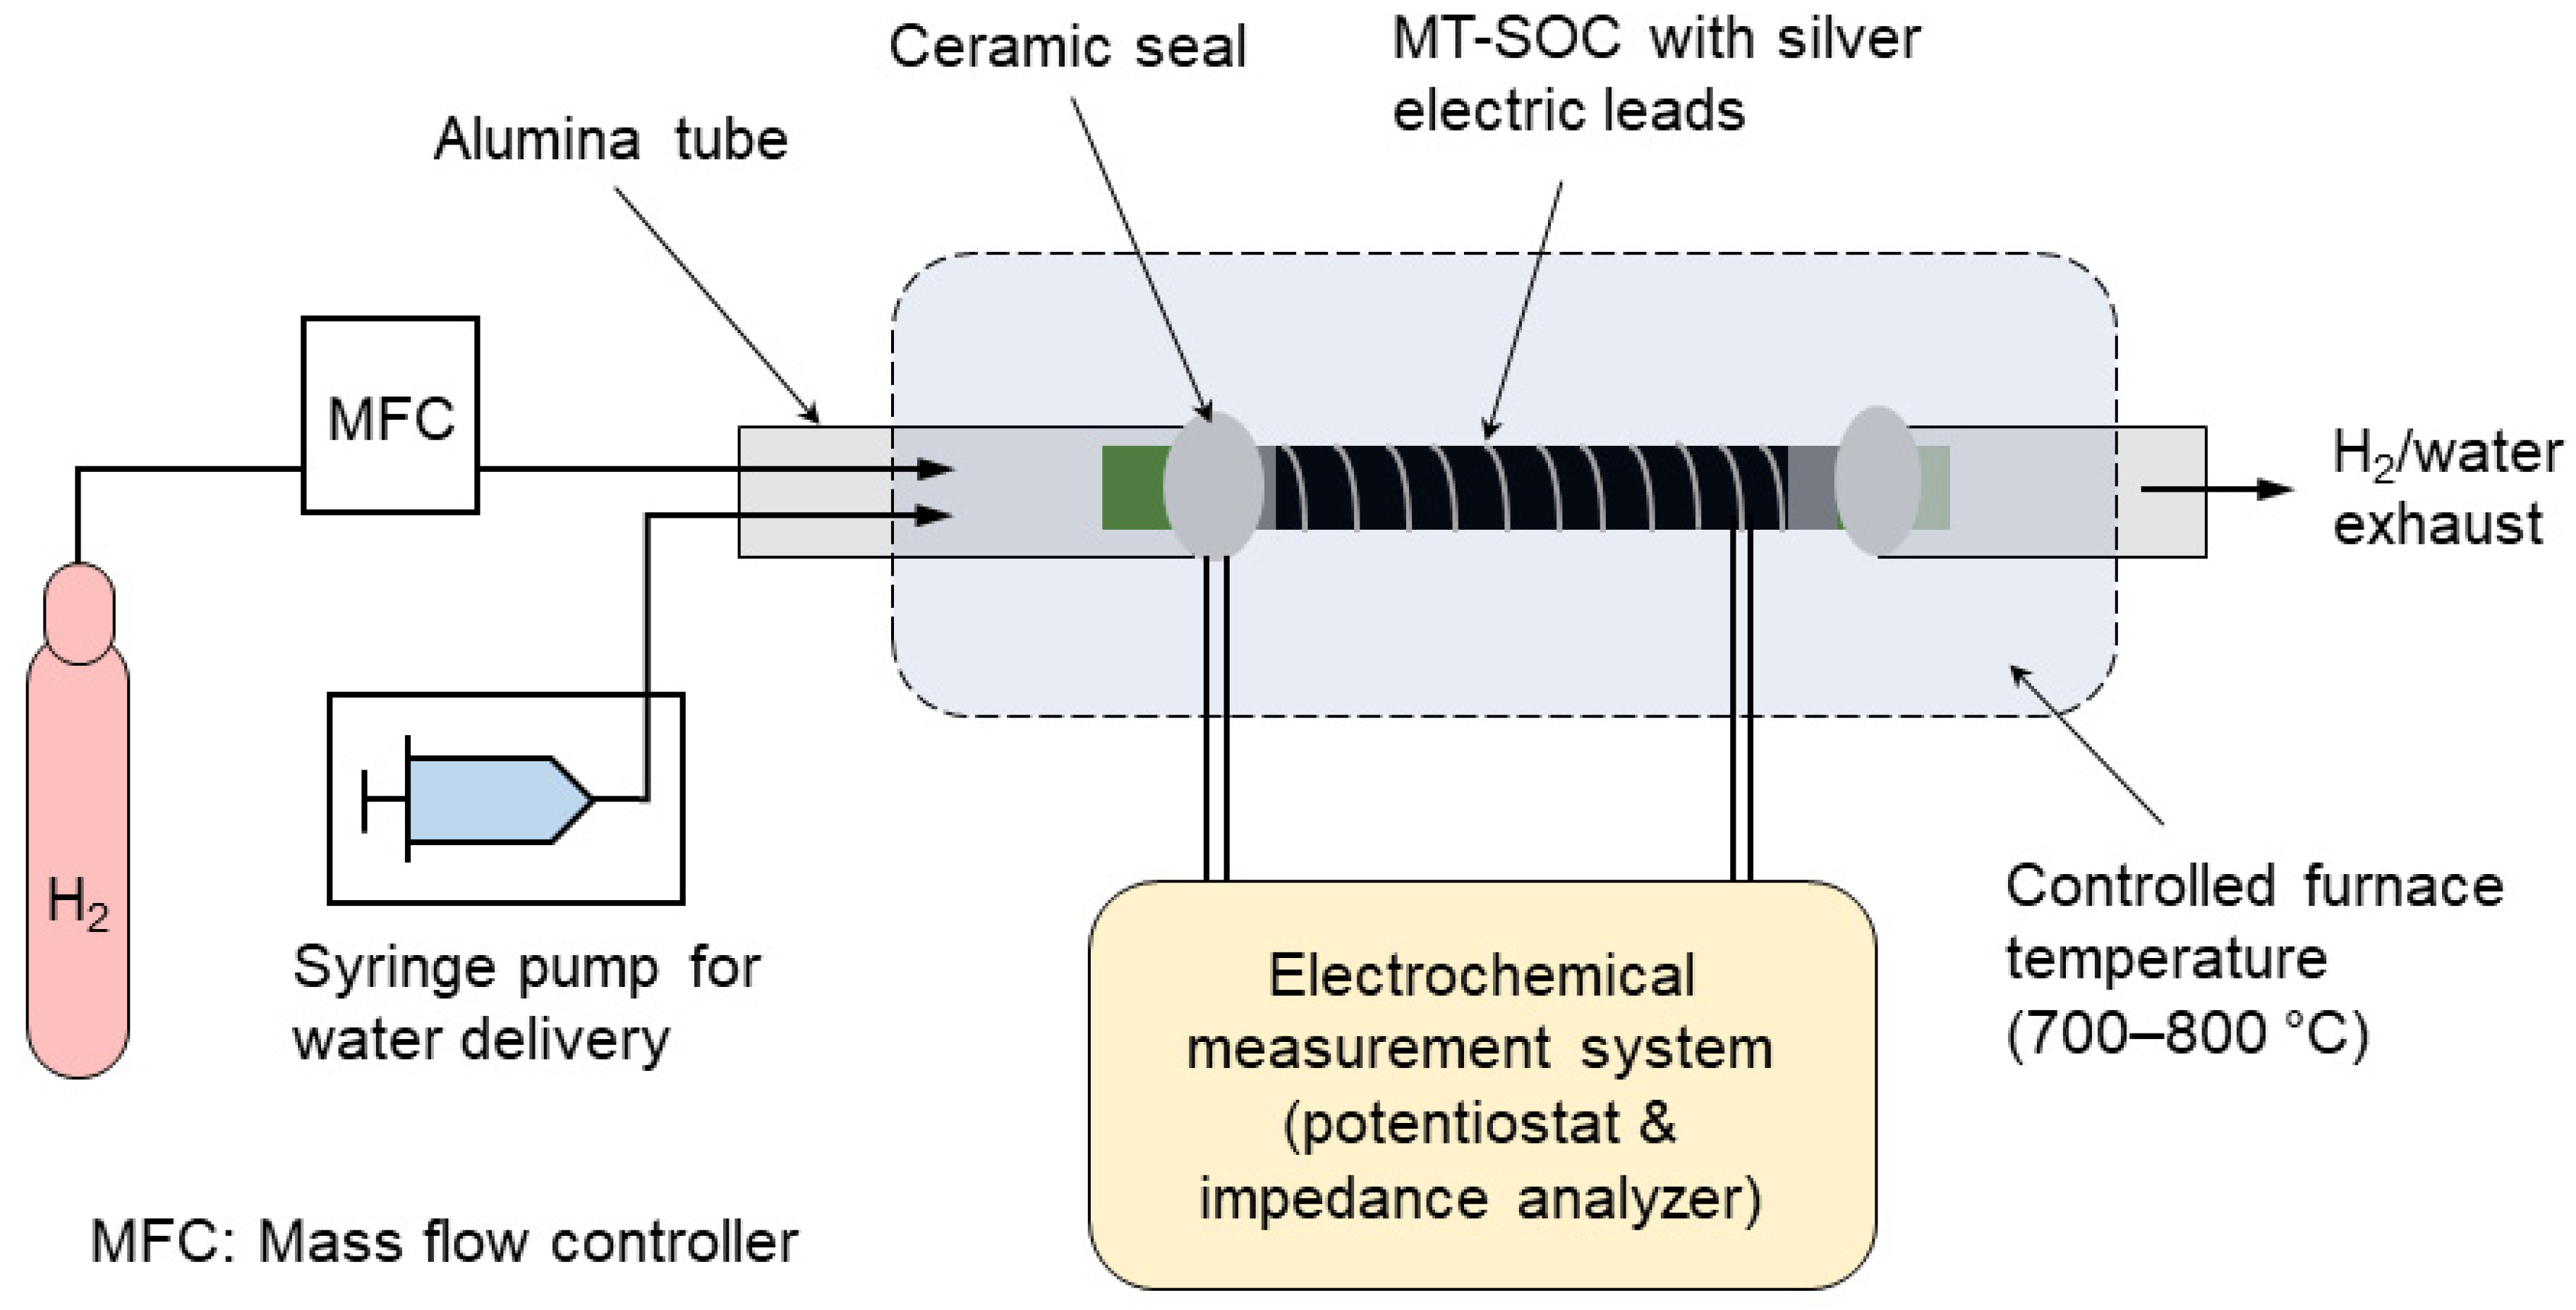
2.3. Electrochemical Testing and Characterizations

The setup used for the electrochemical testing of single cells is shown in Figure 1. To conduct the electrochemical measurements, the MT-SOC was placed at a constant temperature zone of a split-tube furnace. Prior to this, the fuel cell was connected to dense alumina tubes of suitable sizes to provide both the delivery of fuel and steam and the exhaust of water and fuel. To obtain a gastight seal, a ceramic adhesive (ResbondTM 989, Cotronics, New York, NY, USA) was used to connect the fuel cell and alumina tubes. Electrochemical characterizations of the cell were carried out between 700 and 800 °C and the temperature ramp rate of the furnace was set to 3 °C/min. Prior to the fuel cell performance testing, the NiO of the fuel electrode support tube was reduced to Ni at 700 °C by flowing hydrogen at a rate of 100 mL/min for 2 h. For fuel cell measurements, dry H2 was used as the fuel, whereas for electrolysis measurements, 50% H2O/H2 was supplied to the fuel electrode. A controlled amount of water was delivered to the cell using a syringe infusion pump. During fuel cell and electrolysis measurements, the oxygen electrode was exposed to ambient air. Again, for all the electrochemical studies, the hydrogen flow rate was maintained at 100 mL/min. Electrochemical performance of the MT-SOCs was evaluated using an Autolab PGSTAT302N, (Metrohm Autolab B. V., (Utrecht, The Netherlands) that was equipped with a frequency response analyzer (FRA) and a 20 Amp current booster. The impedance measurements were conducted using a four-probe method, under OCV conditions, by applying an AC amplitude of 10 mV over a 100 kHz–10 mHz frequency range. Silver wire (0.25 mm diameter) was utilized as a current collector from both the electrodes. After completion of the tests, and as the cooling process of the fuel cell was performed, a protection gas (H2 or N2) was supplied continuously to the fuel electrode to prevent re-oxidation of Ni.

3. Results and Discussion

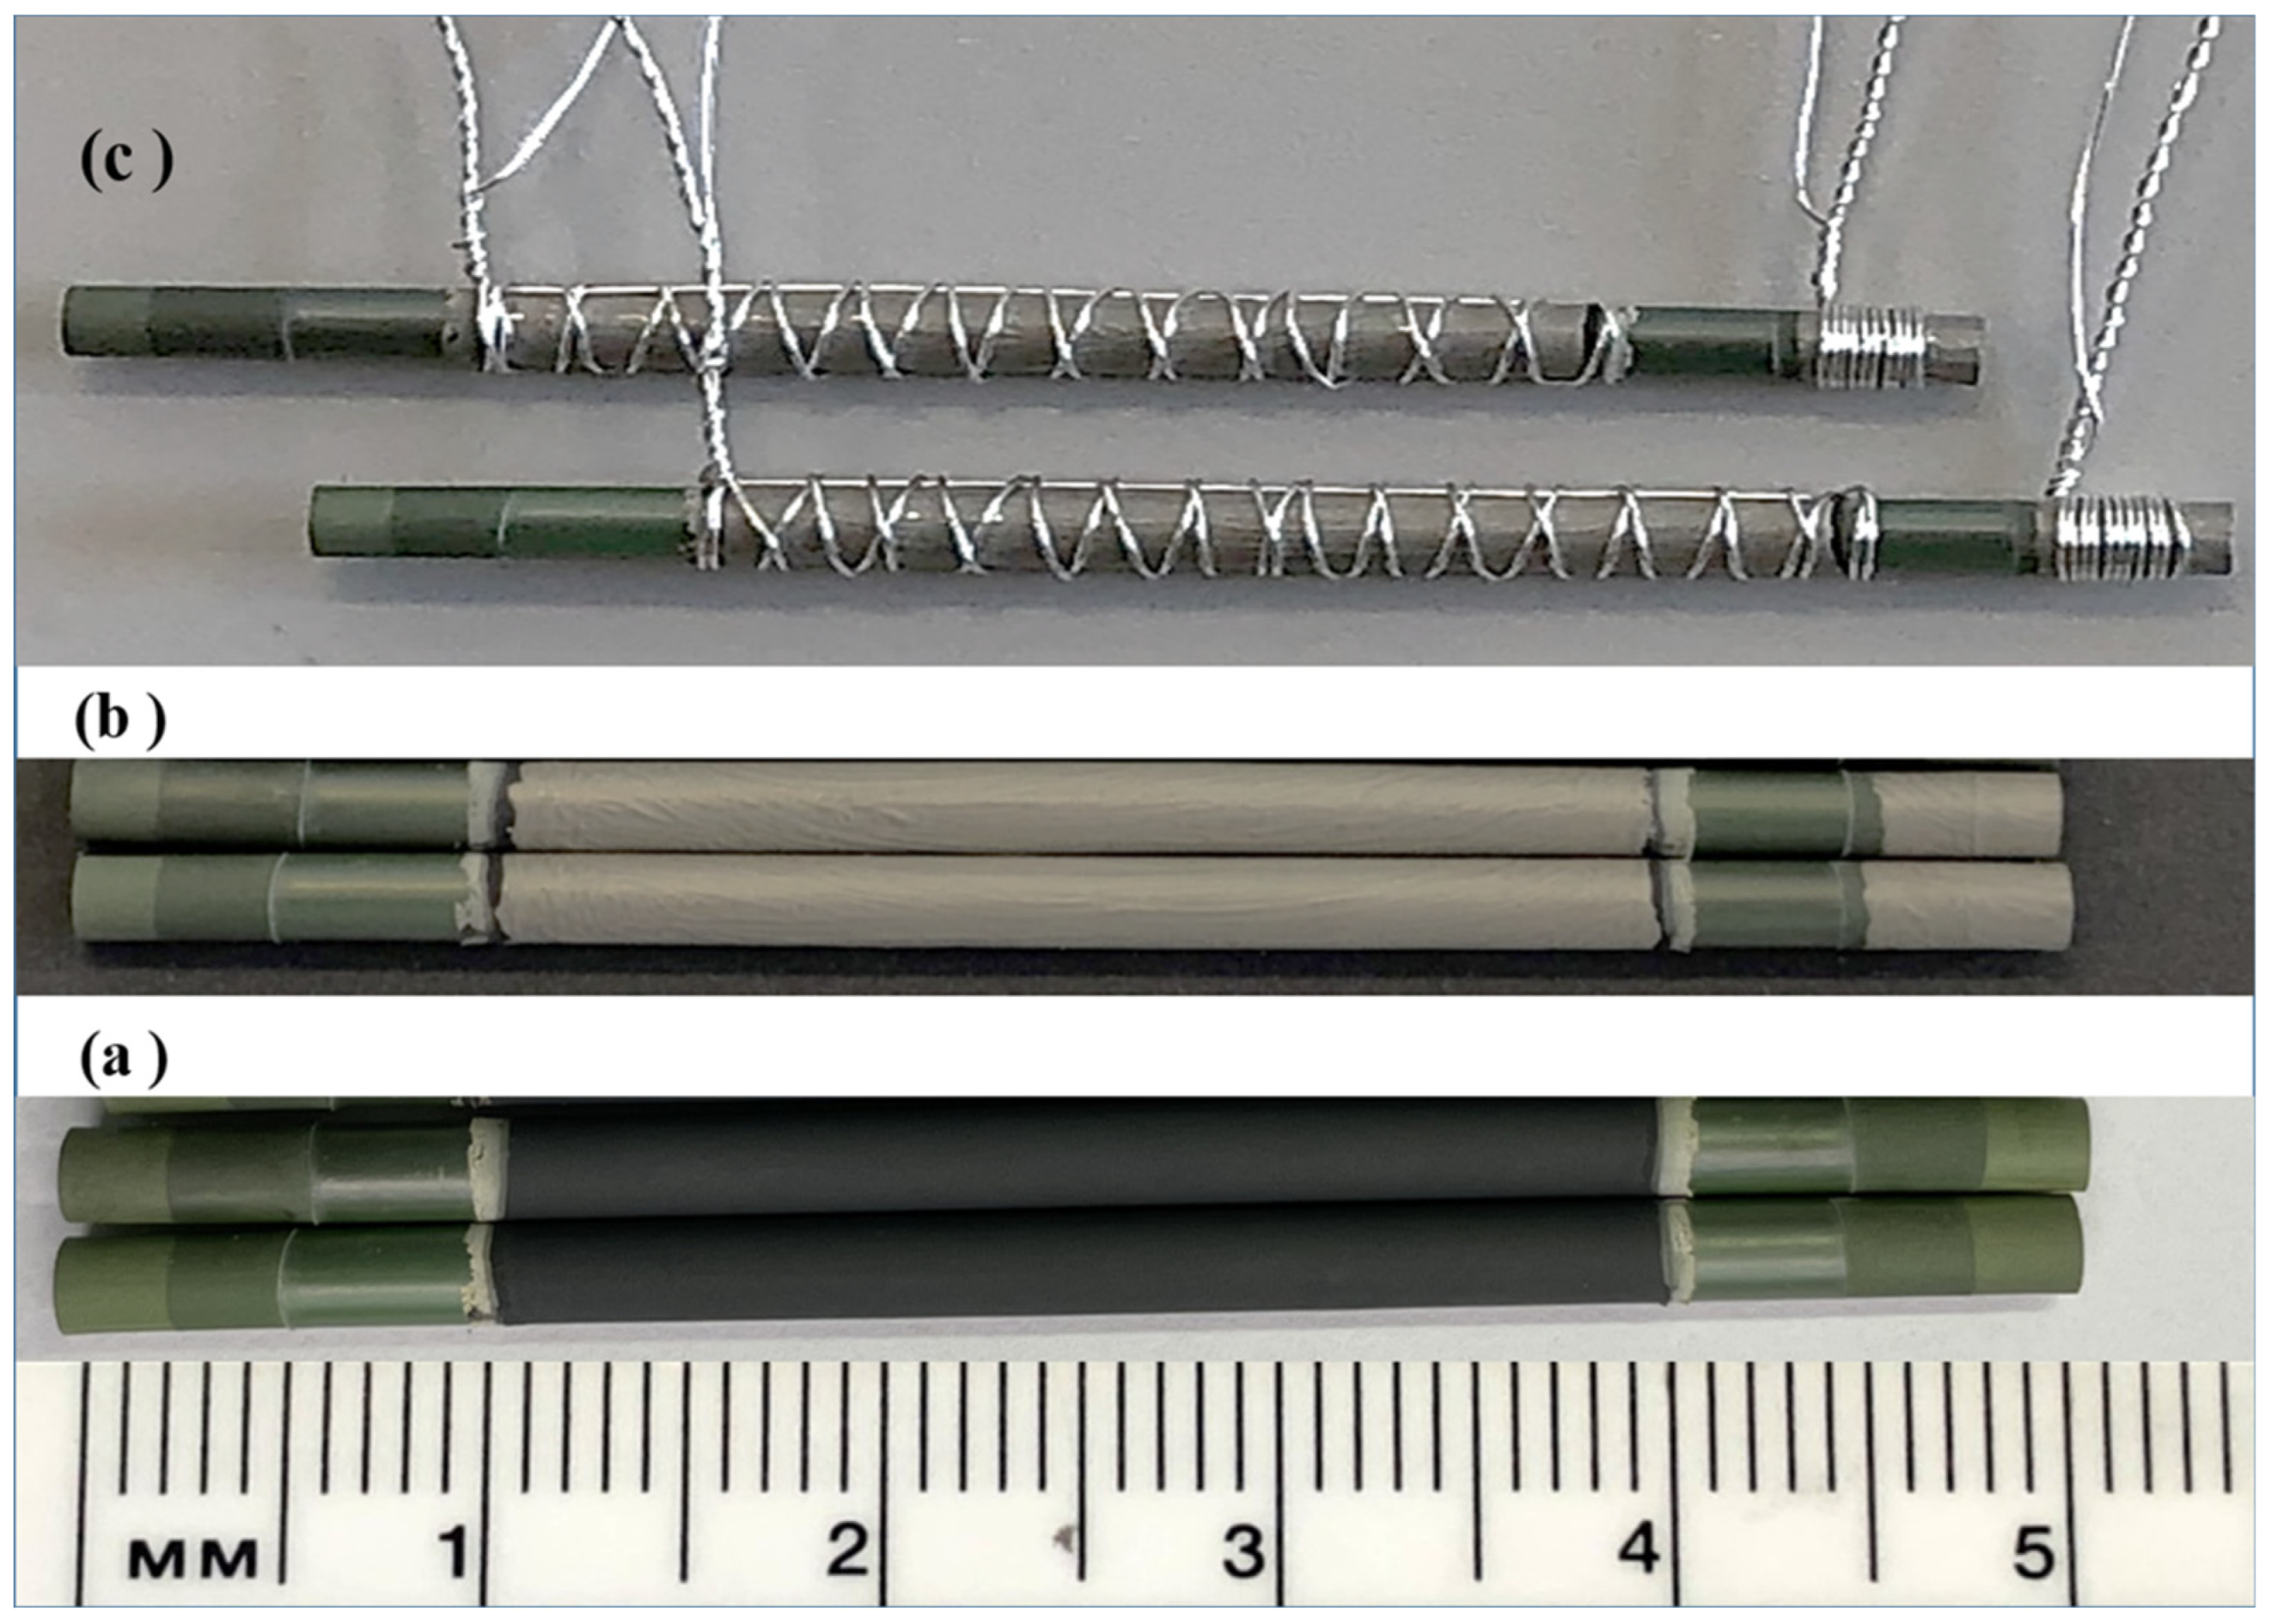
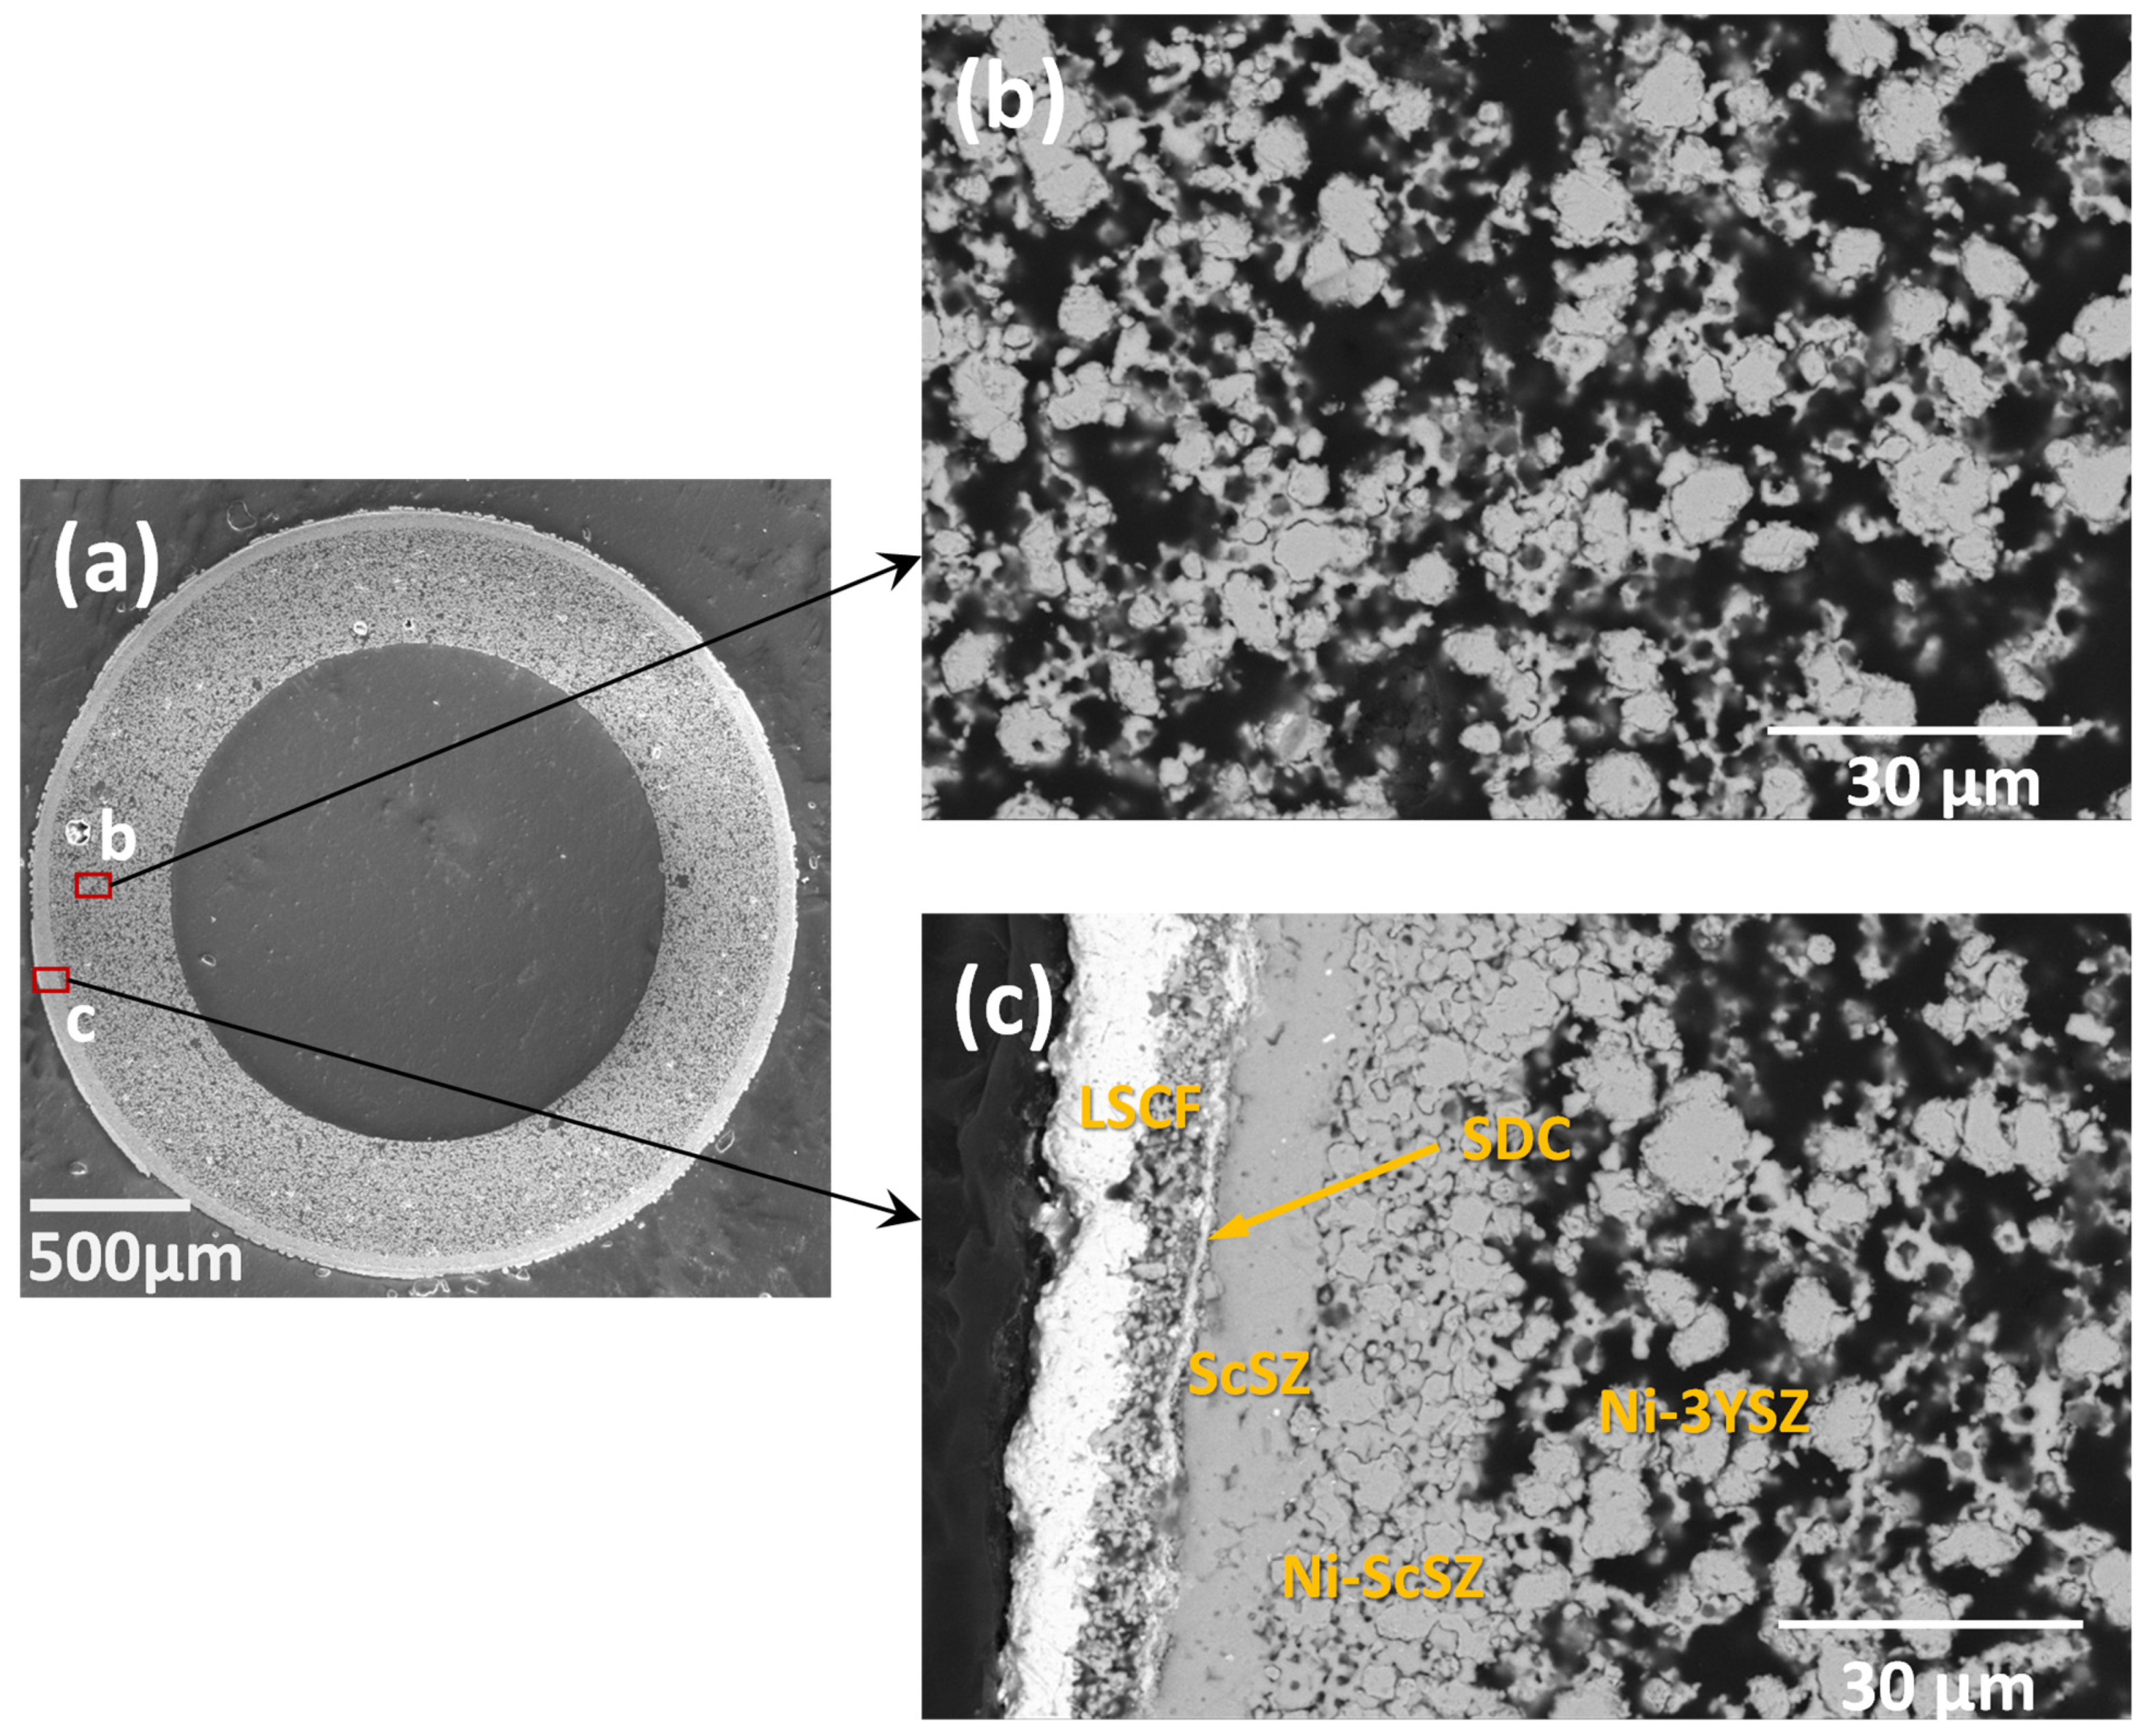
3.1. MT-SOC Fabrication

Some important considerations in the design of lightweight MT-SOCs include: (1) microstructure control in the fuel electrode support and fuel electrode functional layer. It should be noted that the targeted porosity for our design of the fuel electrode support after reduction was 60 volume percent. This high porosity was to reduce fuel gas diffusion resistance and was achieved by introducing polymethyl methacrylate (PMMA) and cellulose-based pore former to the fuel electrode support. (2) A 2-mm diameter cell design was selected to achieve a high electrode surface area per unit volume. (3) The wall thickness of the support tube was maintained at around 400 µm to allow sufficient cell handling strength, while maintaining reduced cell weight. Due to its higher mechanical strength Ni-3YSZ was preferred to form the fuel electrode support over the relatively low strength of traditional Ni-8YSZ-based supports [23].
During the development of the fuel cell, the temperature profiles that were utilized for pre-firing and sintering of the individual cell layers were based on our previous work [18]. In order to suppress crack formation within the samples, due to the gases produced during the pore-former and binder burn-out events, a low heating rate of 0.5 °C min−1 was used during the temperature rise from room temperature to 450 °C. The slow heating allowed the generated gases to escape through open pores that were created by firing, without increasing the pressure inside the layers. At 450 °C, the temperature was held for 1 h to ensure complete removal of any organic materials, whereupon the support was pre-fired at 1000 °C for 1 h. The optimized oxygen electrode firing temperature generated an adherent layer to the protective layer, yet it had sufficient porosity to allow effective air passages to be formed towards the electrolyte. The microscopic observation of the fuel electrode support indicated that the defect-free layer attained a certain level of surface roughness. The surface roughness of the fuel electrode support layer was due to the pores that were generated during the fabrication process. Coating a thin functional layer on the fuel electrode support is a known practice to avoid the effects of surface roughness, which, in turn, is able to improve the performance of an SOC by increasing the active sites for electrochemical reaction. During the electrolyte sintering process, the observed linear shrinkage of the half cells was ~17%, leading to a dense electrolyte free of defects. The determined porosities from the Archimedes method of the fuel electrode support, fuel electrode functional layer and oxygen electrode were 62%, 18% and 38%, respectively. Figure 2 shows the completed and test ready MT-SOCs with silver wires wrapped around their electrodes for current collection. The cells had an outer diameter of 2 mm and total length of 45 mm with an oxygen electrode length of 23 mm. The effective surface area per cell was 1.44 cm2.
Since Ni-3YSZ was utilized as the fuel electrode support, the mechanical strength of the fabricated cells was expected to be higher than that of cells containing Ni-8YSZ support. During thermal cycling, 3YSZ restrains a softening martensitic phase transformation of Ni and hinders crack growth, effectively enhancing its strength [2,23,24,25]. The strength of NiO–3YSZ remains nearly independent of temperature when cooled from sintering. This is due to its higher thermal expansion coefficient and a resultant higher compressive residual stress in the NiO-3YSZ microstructure, as compared to 3YSZ. This makes grain growth sluggish during the sintering of 3YSZ, resulting in the formation of smaller grains—one of the reasons why 3YSZ maintains its strength [23]. However, the poor chemical stability of 3YSZ in moist atmosphere, and its tendency for spontaneous phase transformation between 100 and 200 °C, can lead to a breakup of the zirconia phase [26]. Therefore, 3YSZ requires dry atmosphere protection during its thermal cycling.
Figure 3a shows the cross-sectional image of a micro-tubular cell after the reduction of the fuel electrode in H2. The thickness of the fuel electrode support was ~400 µm. As seen from Figure 3b, the fuel electrode support is highly porous. Figure 3c displays a close-up view of the cell where the constituent layers of the cell, such as the fuel electrode functional layer, electrolyte, protective layer, oxygen electrode and silver current collector layer, are apparent. From the SEM image, the achieved thicknesses of the fuel electrode functional layer, electrolyte, protective layer and oxygen electrode were ~18 µm, ~10 µm, ~2 µm, and ~18 µm, respectively. It is apparent that the electrolyte layer was dense and well-adhered to the fuel electrode functional layer. Although a few isolated closed pores were noticed in the electrolyte, this does not affect the gas tightness of the electrolyte layer. The pores in the fuel electrode support were formed during the burning of the pore formers and these pores allowed rapid gas diffusion. The microstructure of the fuel electrode functional layer is smoother, with smaller pores and particles which offer more sites for electrochemical reaction.

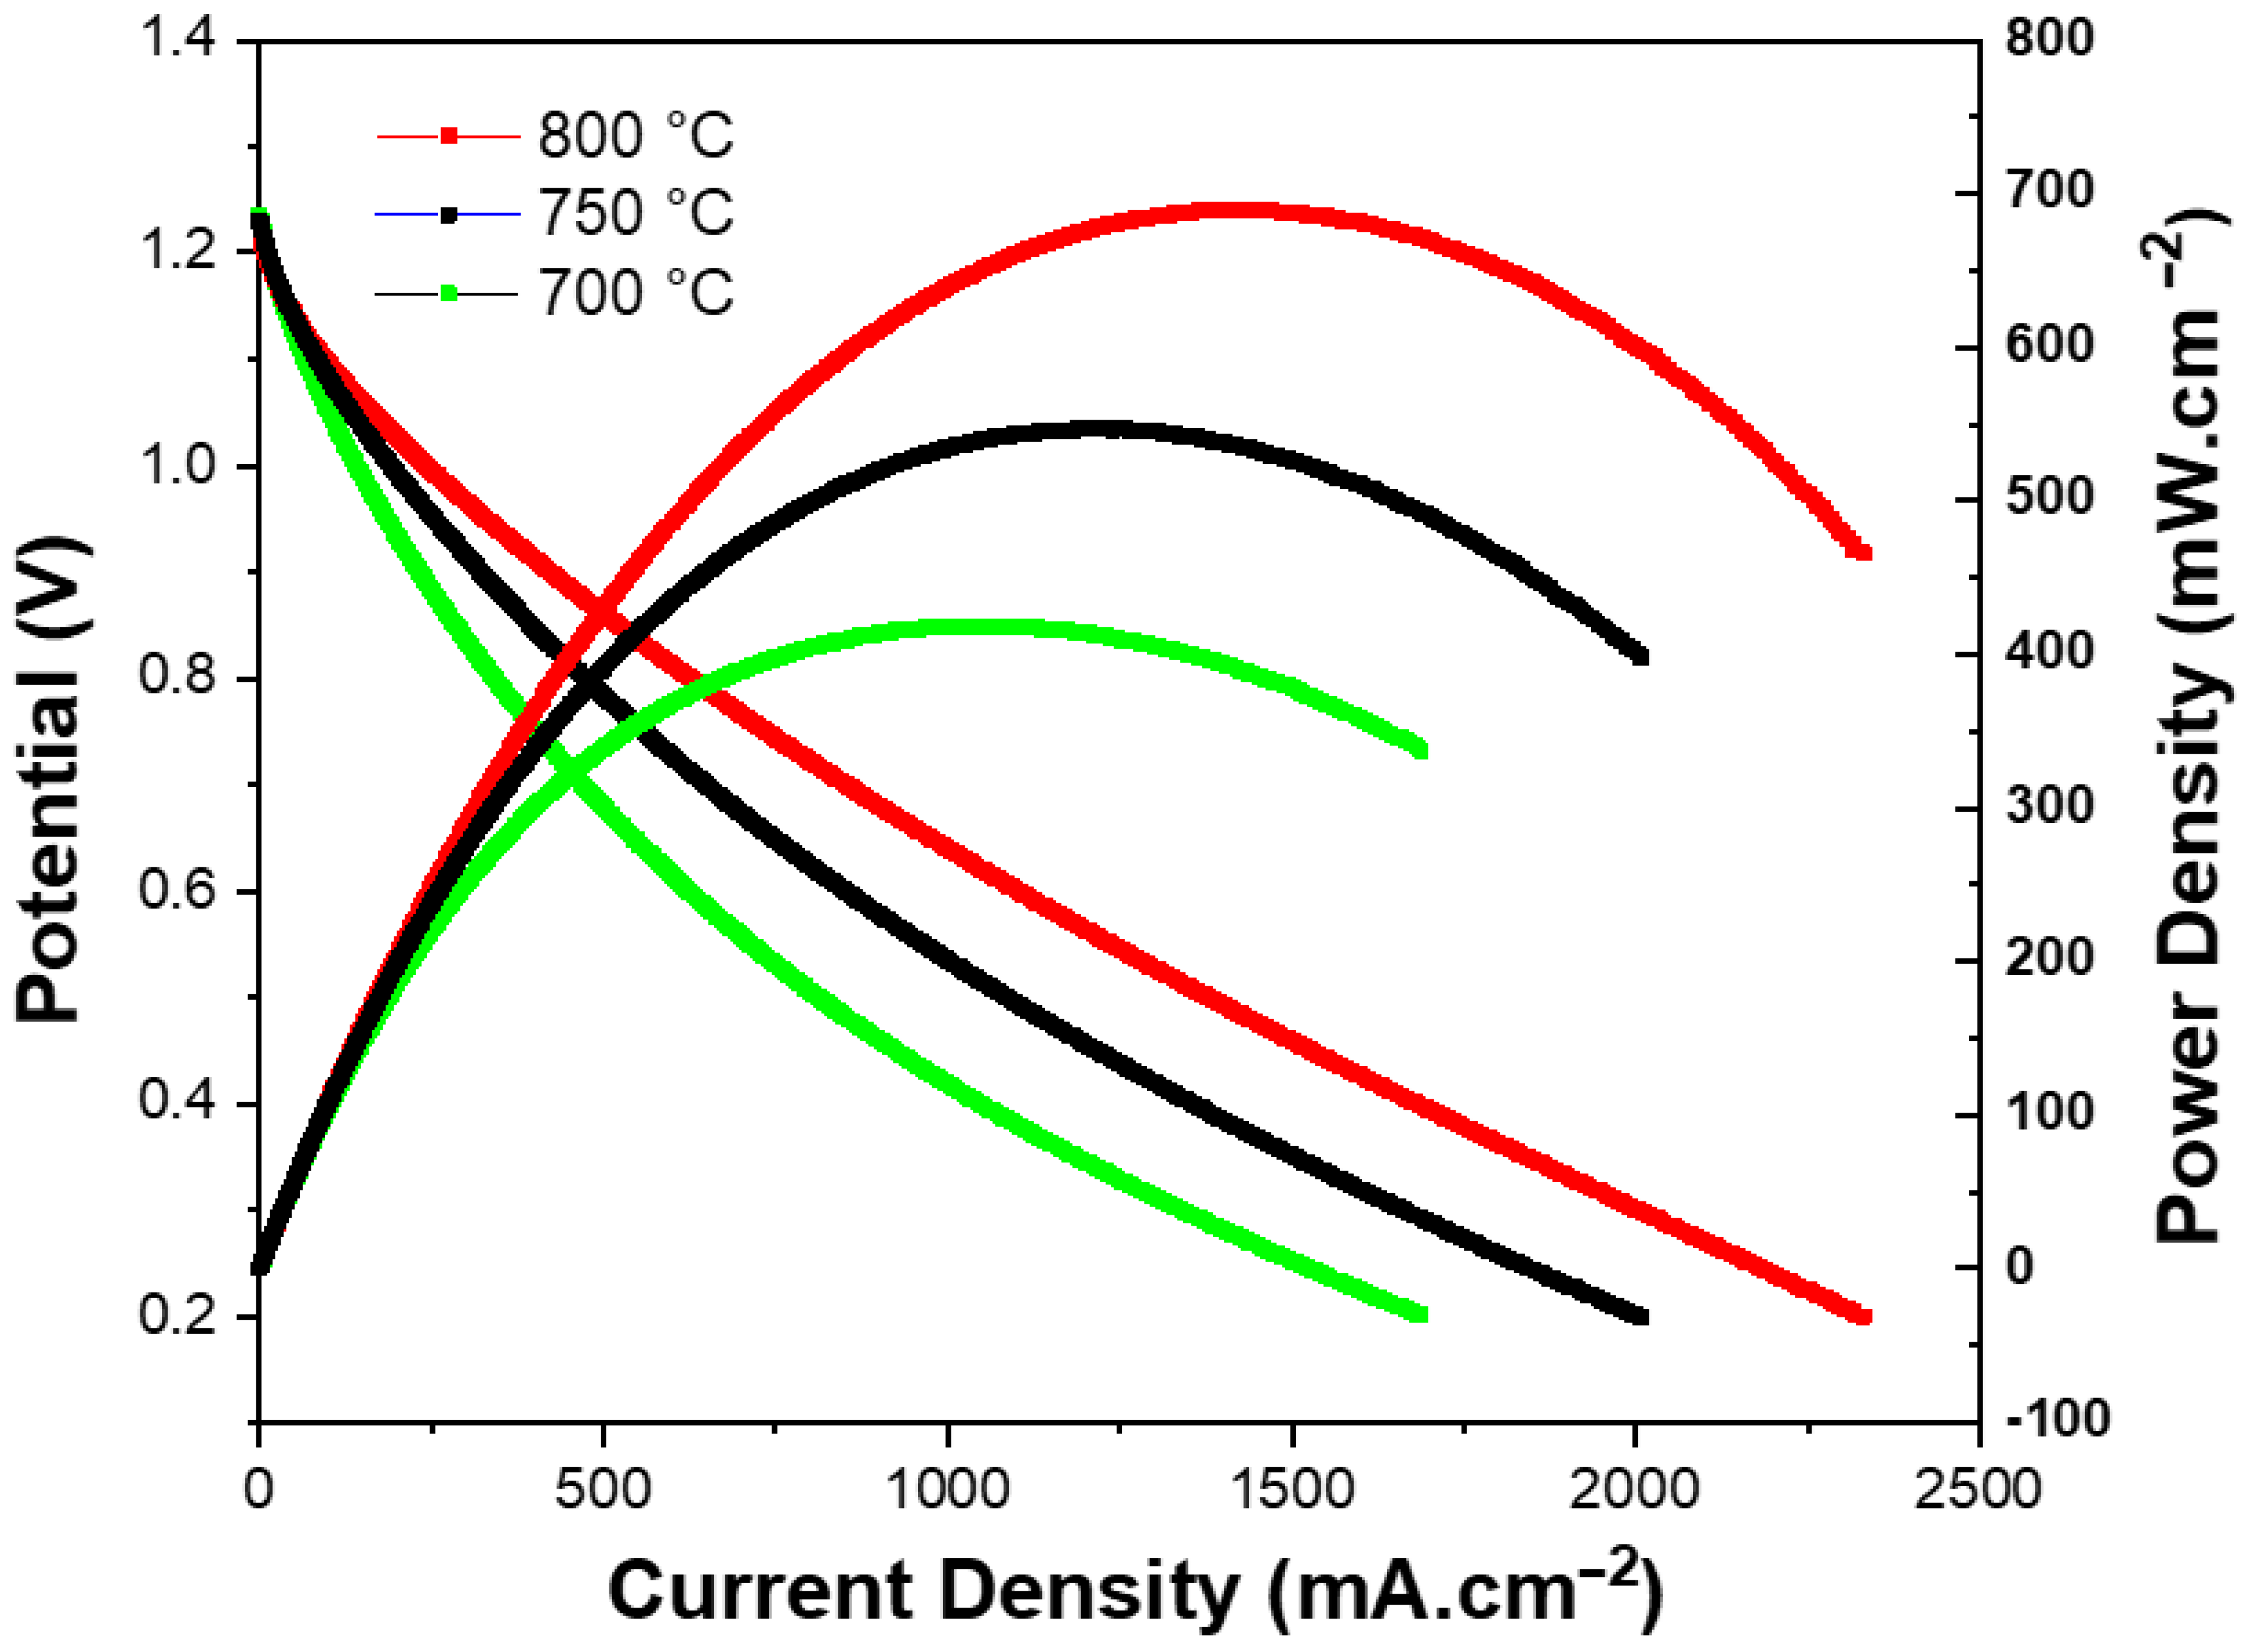
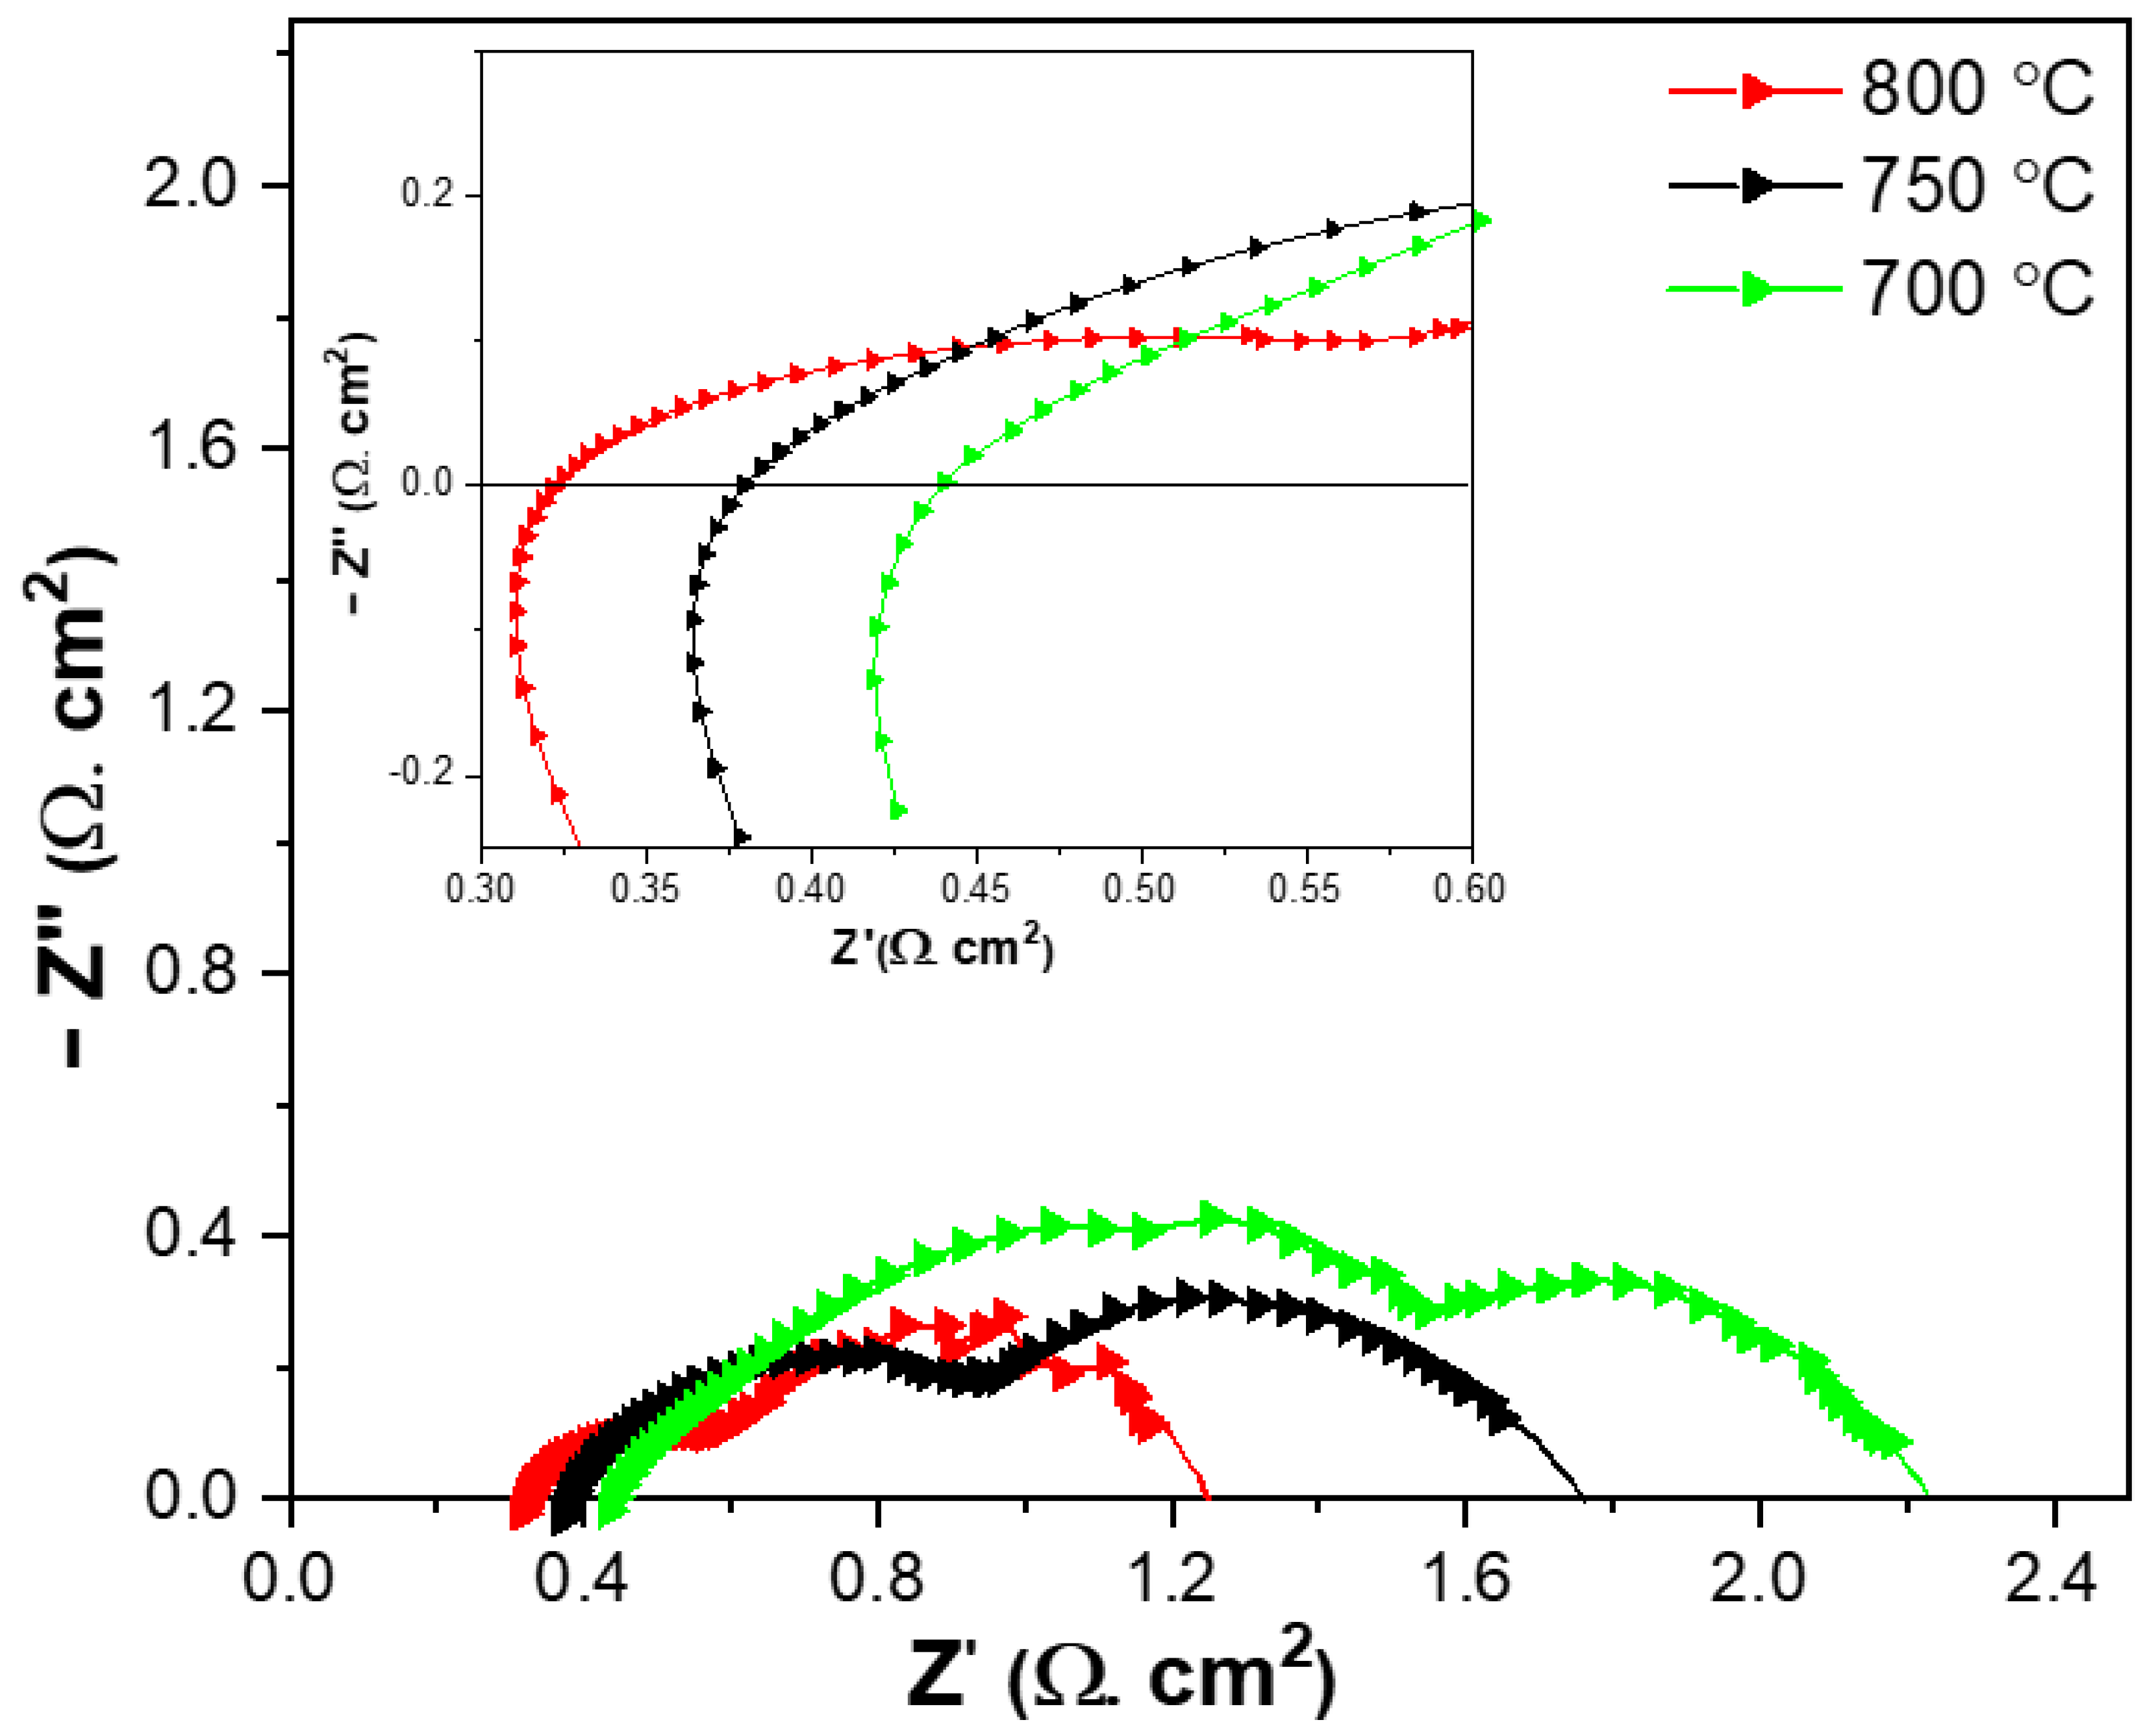
3.2. Electrochemical Performance

Before the electrochemical measurements, the fuel electrode was subjected to full reduction at 700 °C for two hours. Open circuit voltage (OCV) was monitored, until its stabilization around 1.15 to 1.16 V. After this, electrochemical measurements were performed. The Nyquist plots in Figure 4 were obtained from electrochemical impedance spectroscopy (EIS), under OCV conditions, at a temperature range of 700 °C to 800 °C. The observed total resistance from the EIS is a combination of ohmic resistance and electrode polarization resistance. The ohmic resistance was derived from a high frequency intercept, while the polarization resistance was derived from the difference between the real axis intercepts of low frequency and high frequency on Nyquist plots. The inset image in Figure 4 presents the ohmic resistances (high frequency intercept) at different temperatures, with each presenting a combination of resistances to electronic/ionic conduction through the constituent layers of electrodes, electrolyte and current collectors. The obtained ohmic resistances and polarization resistances were respectively 0.32 and 0.93 Ω cm2 at 800 °C, 0.38 and 1.38 Ω cm2 at 750 °C, and 0.44 and 1.80 Ω cm2 at 700 °C. The higher ohmic and polarization resistances at lower temperatures were attributed to the decreased ionic conductivity of the electrolyte and the decreased electrochemical activity of the electrodes, respectively.
Figure 5 exhibits the current-voltage (IV) and current-power (IP) characteristics of the MT-SOC within a 700–800 °C window using hydrogen as fuel and atmospheric air as an oxidant. The maximum power densities attained at 800, 750, and 700 °C were 690, 546, and 418 mW cm−2, respectively. As the temperature of the cell increased, the total resistance of the cell decreased, and the maximum power density of the cell increased as well. The OCVs were around 1.16 V, which is in agreement with theoretical values, thus indicating an impermeable electrolyte and good sealing between the fuel and oxidant sides. Table 2 summarizes the characteristics and performances of some of the MT-SOFCs tested by different groups [17,27,28,29,30,31,32,33,34]. Due to the higher electrical conductivity of ScSZ over YSZ, performance of the cells with the ScSZ-based electrolyte were better than those of the YSZ-based electrolyte. Also, cells with a thinner electrolyte have better performance than cells with thicker electrolyte.
As seen from Table 2, at 800 °C performance of our cell is comparable to that of the observed performance of Suzuki et al. [32], where 10 µm ScSZ was the electrolyte. This indicates that one can use an easy and cost-effective dip coating technique to develop the entire cell without any compromise in cell performance. Fabrication of the fuel electrode support using dip coating allowed us to easily fine tune anode support porosity, which offers potential for easy and fast delivery of fuel to the triple phase boundary. Also, development of other coating layers on the support by dip-coating has better interfacial contacts, which is another basic factor for a better performing cell.

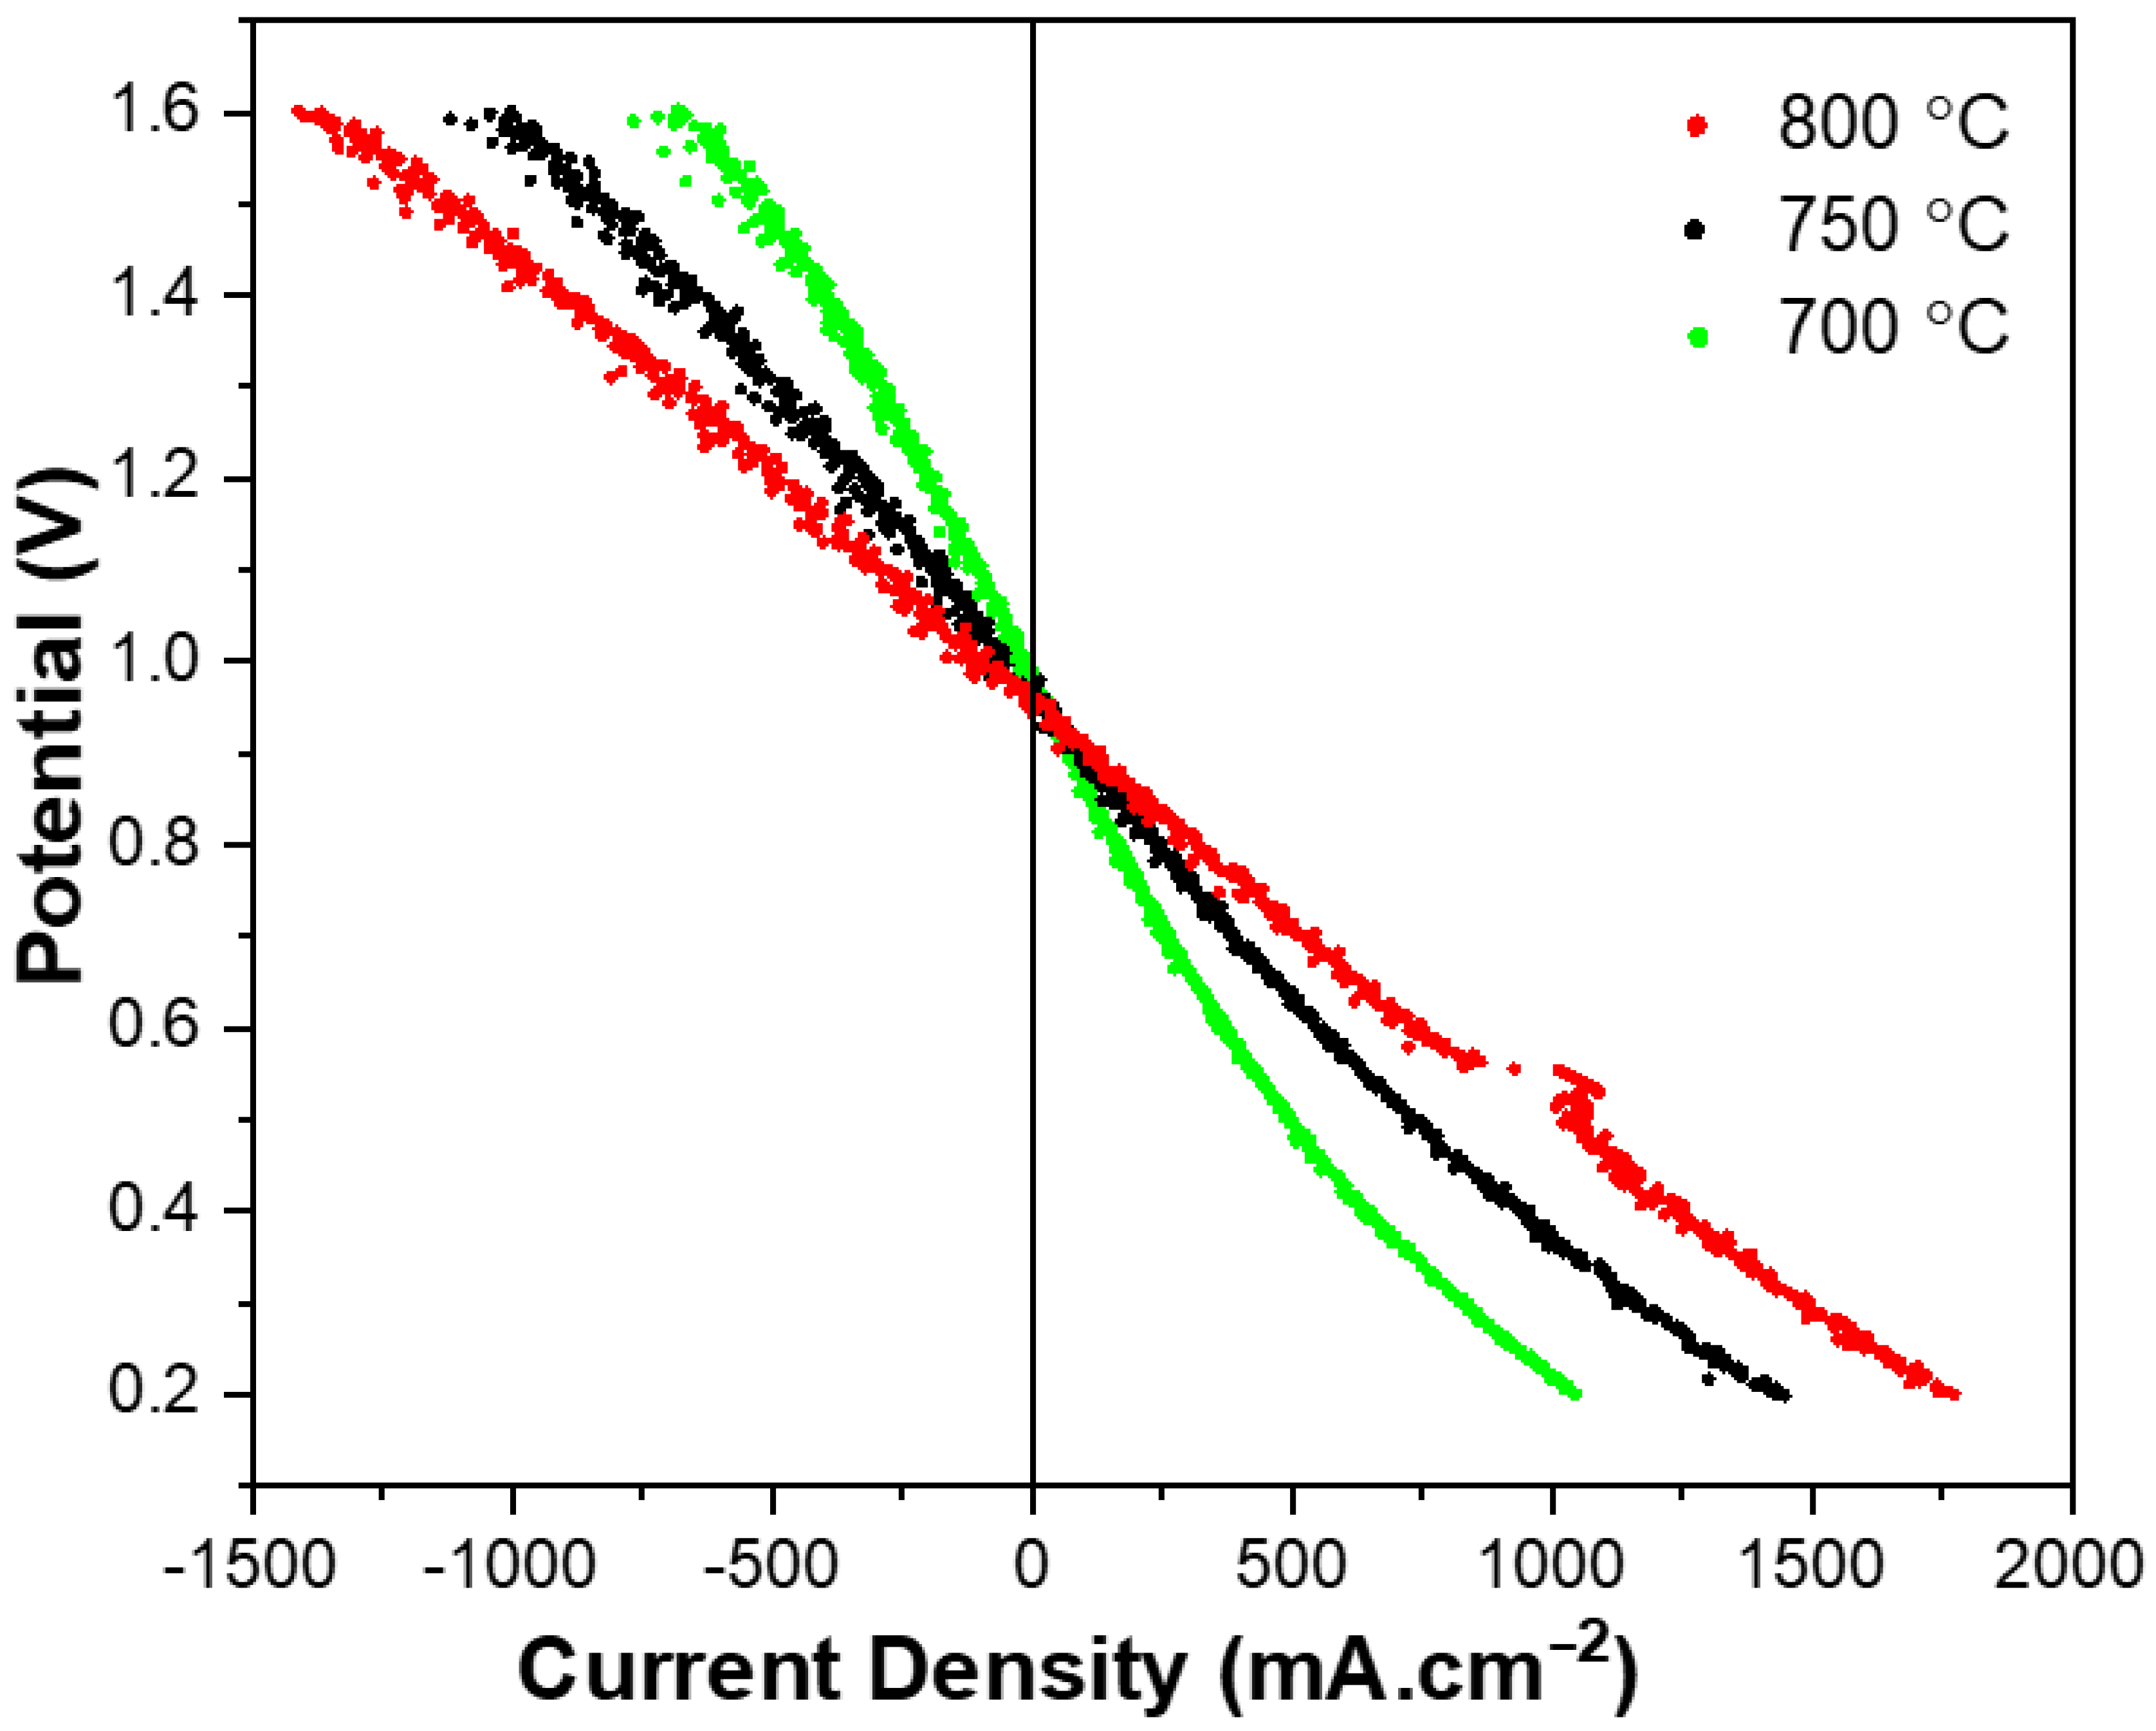
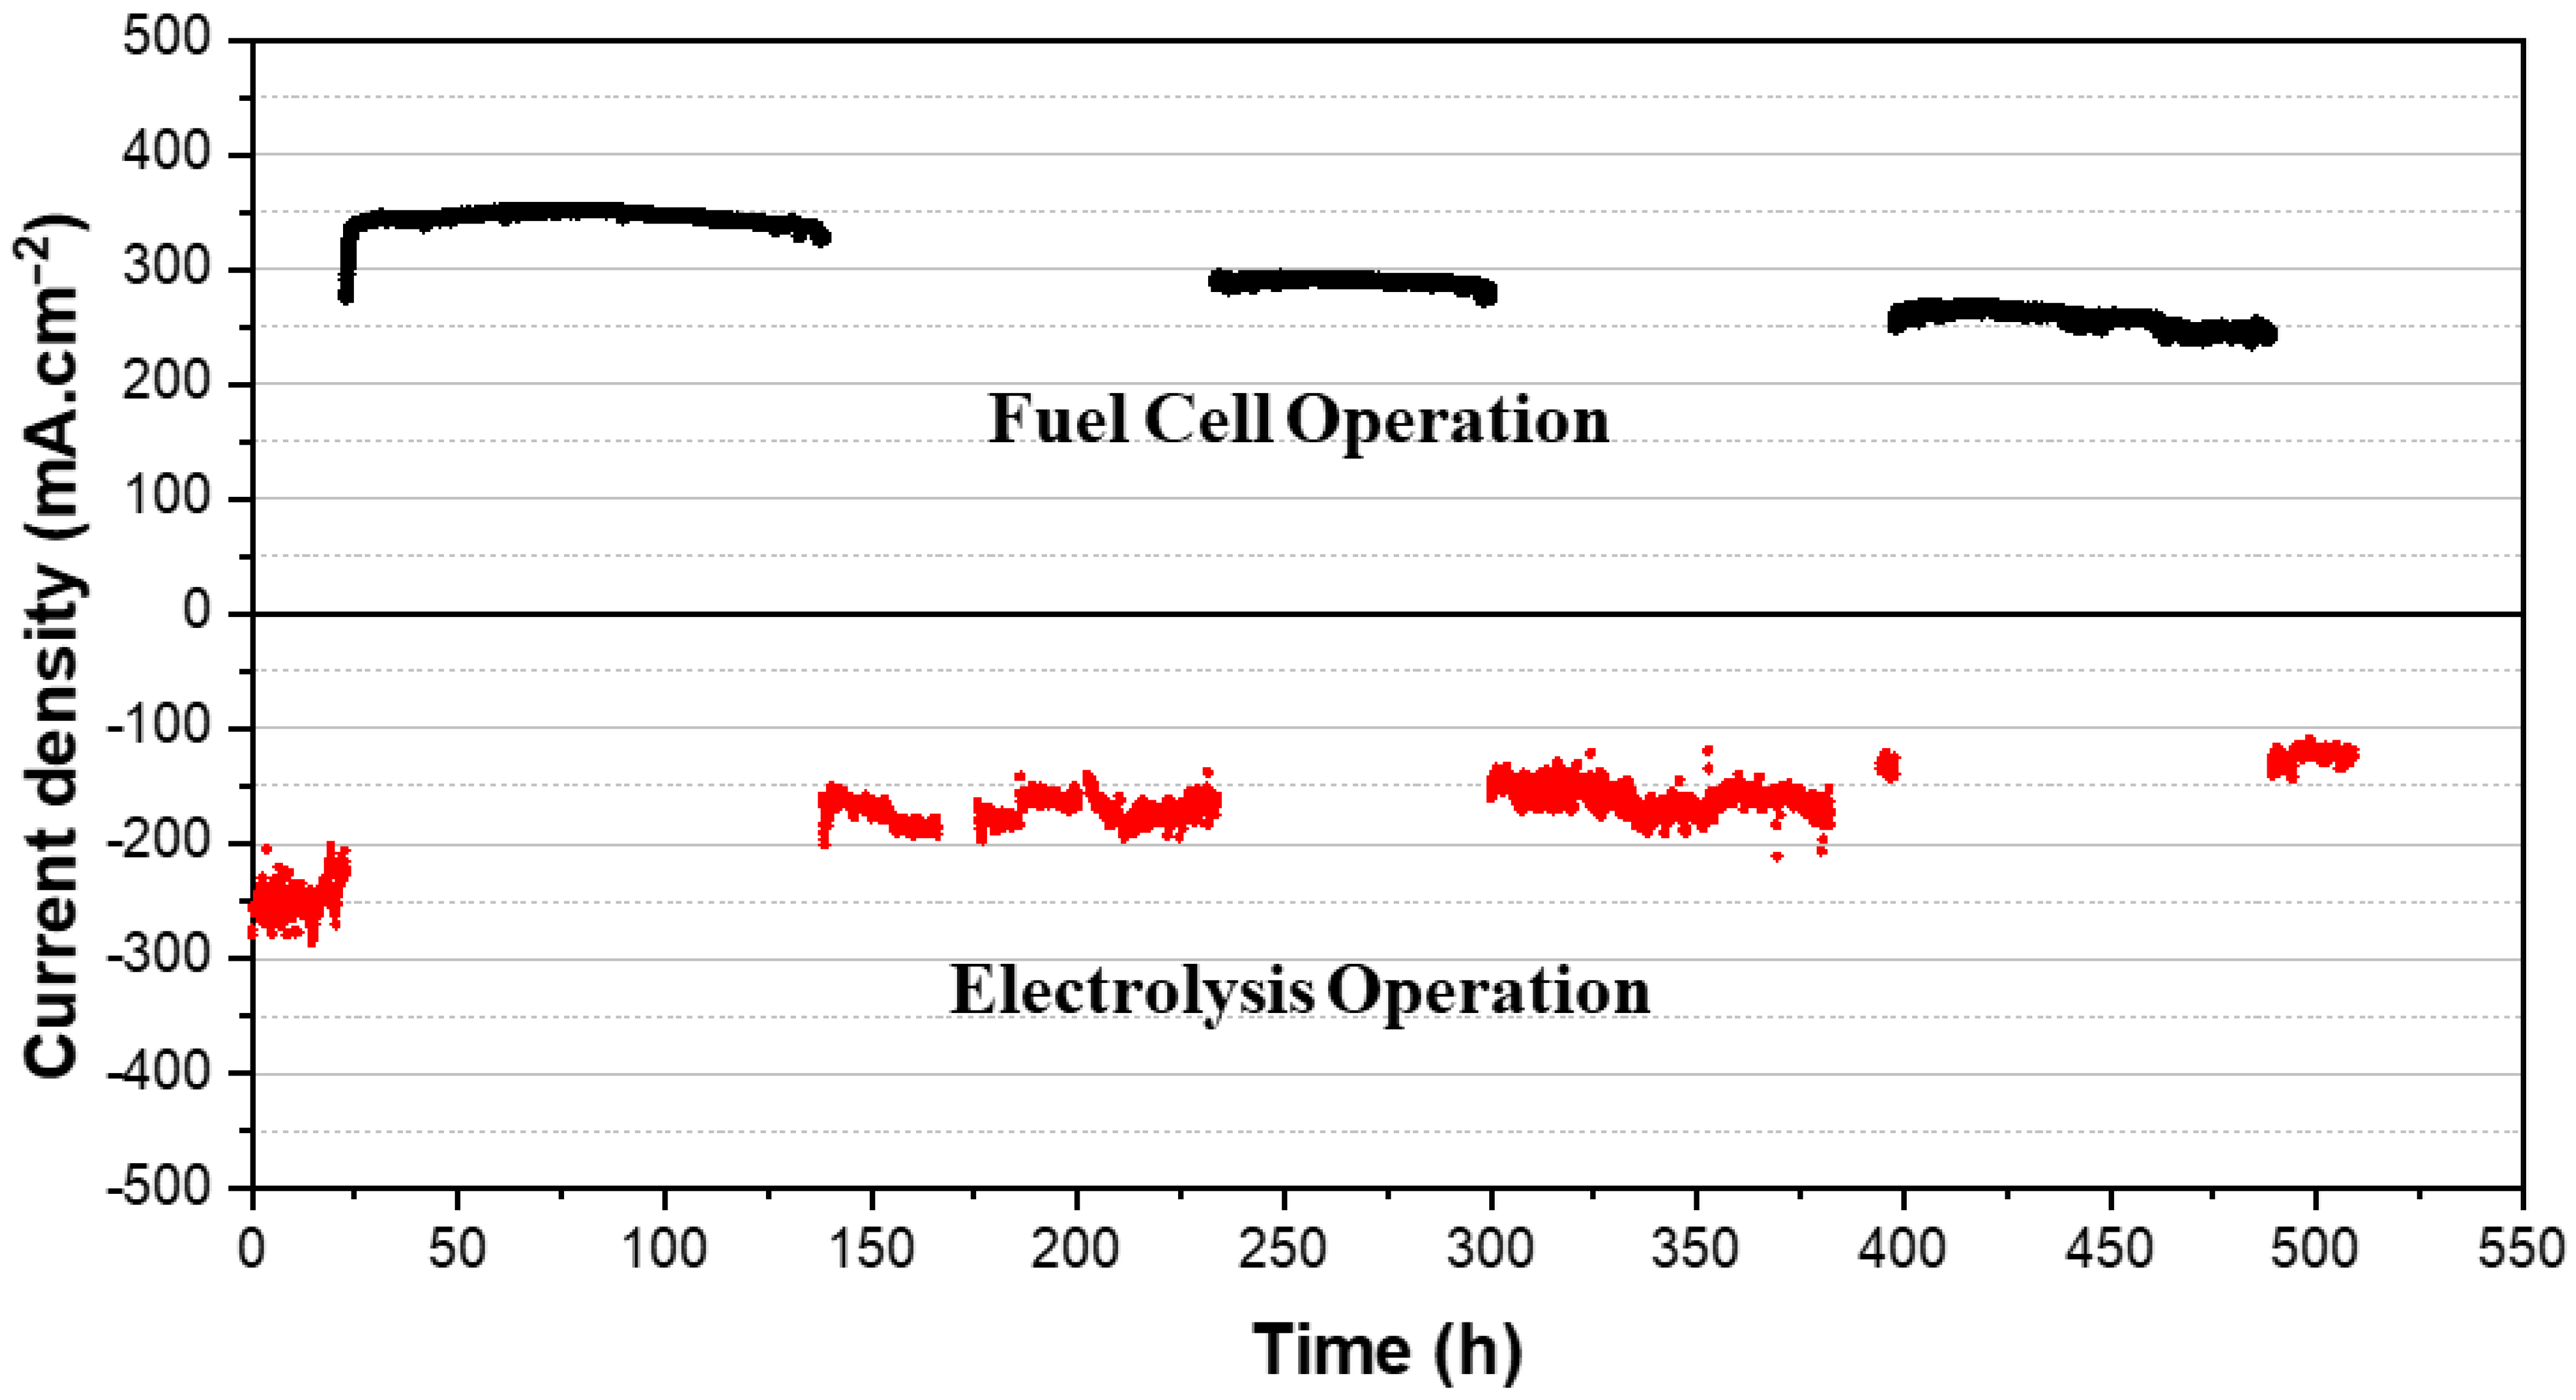
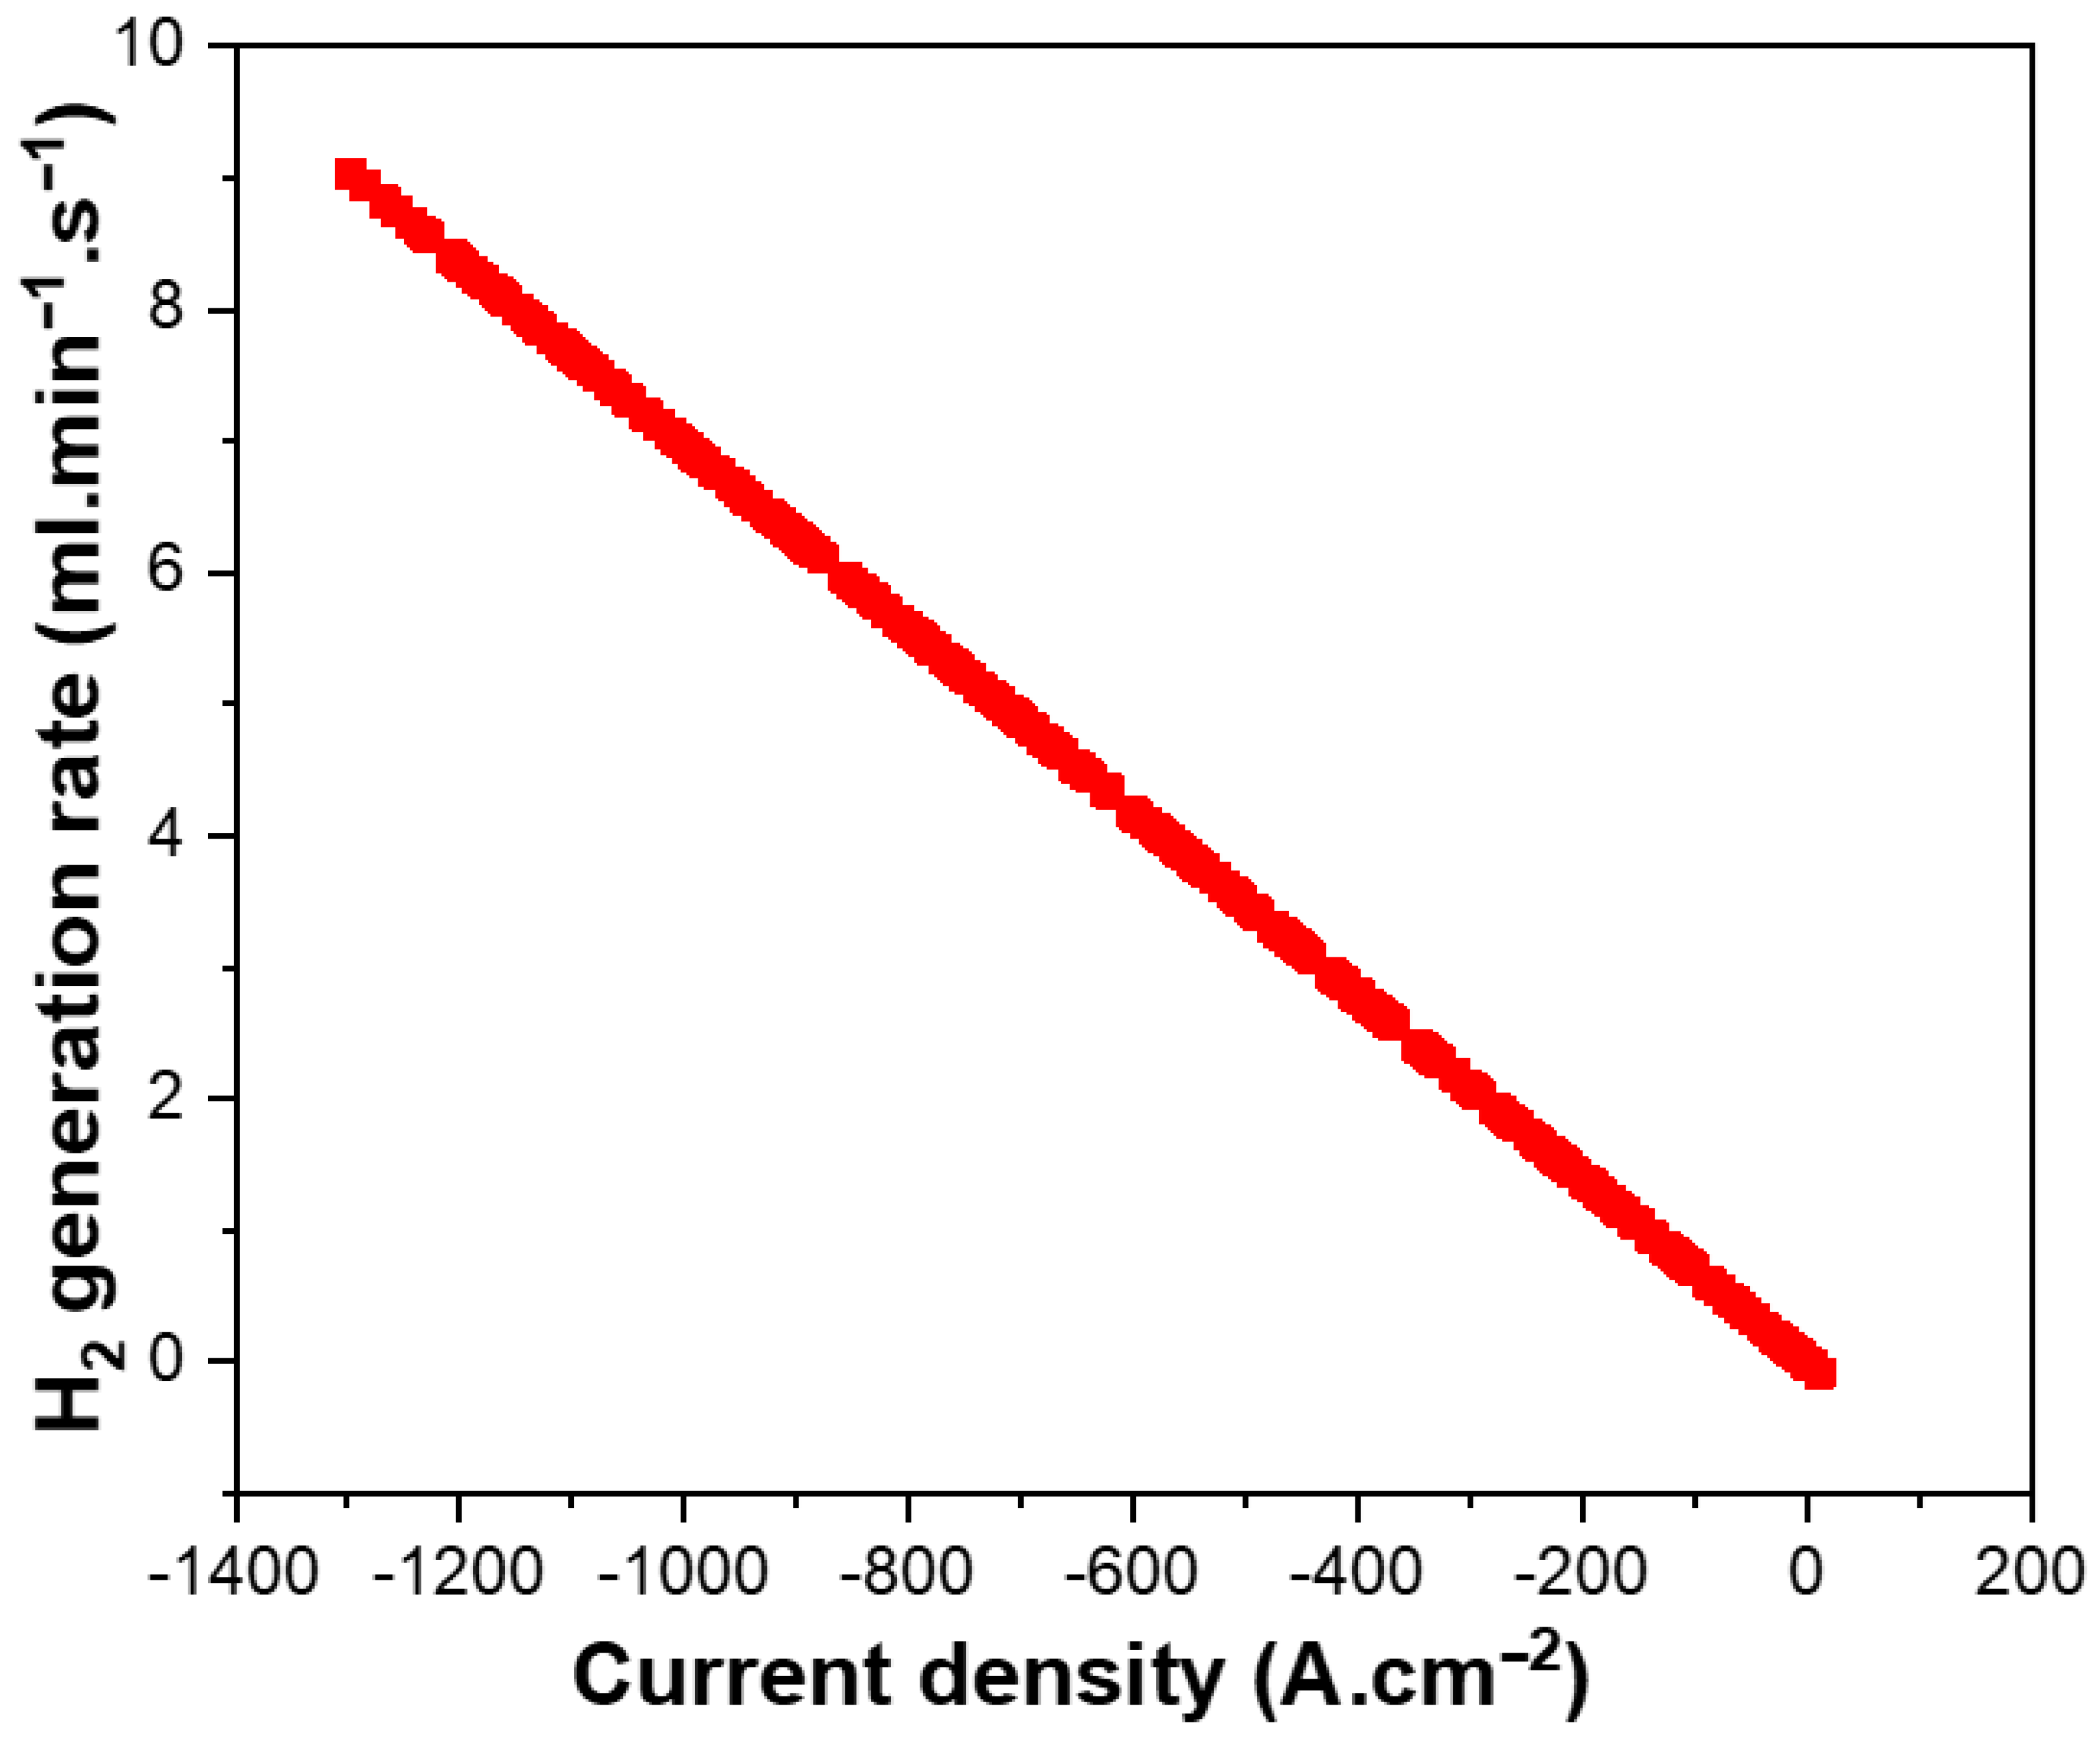
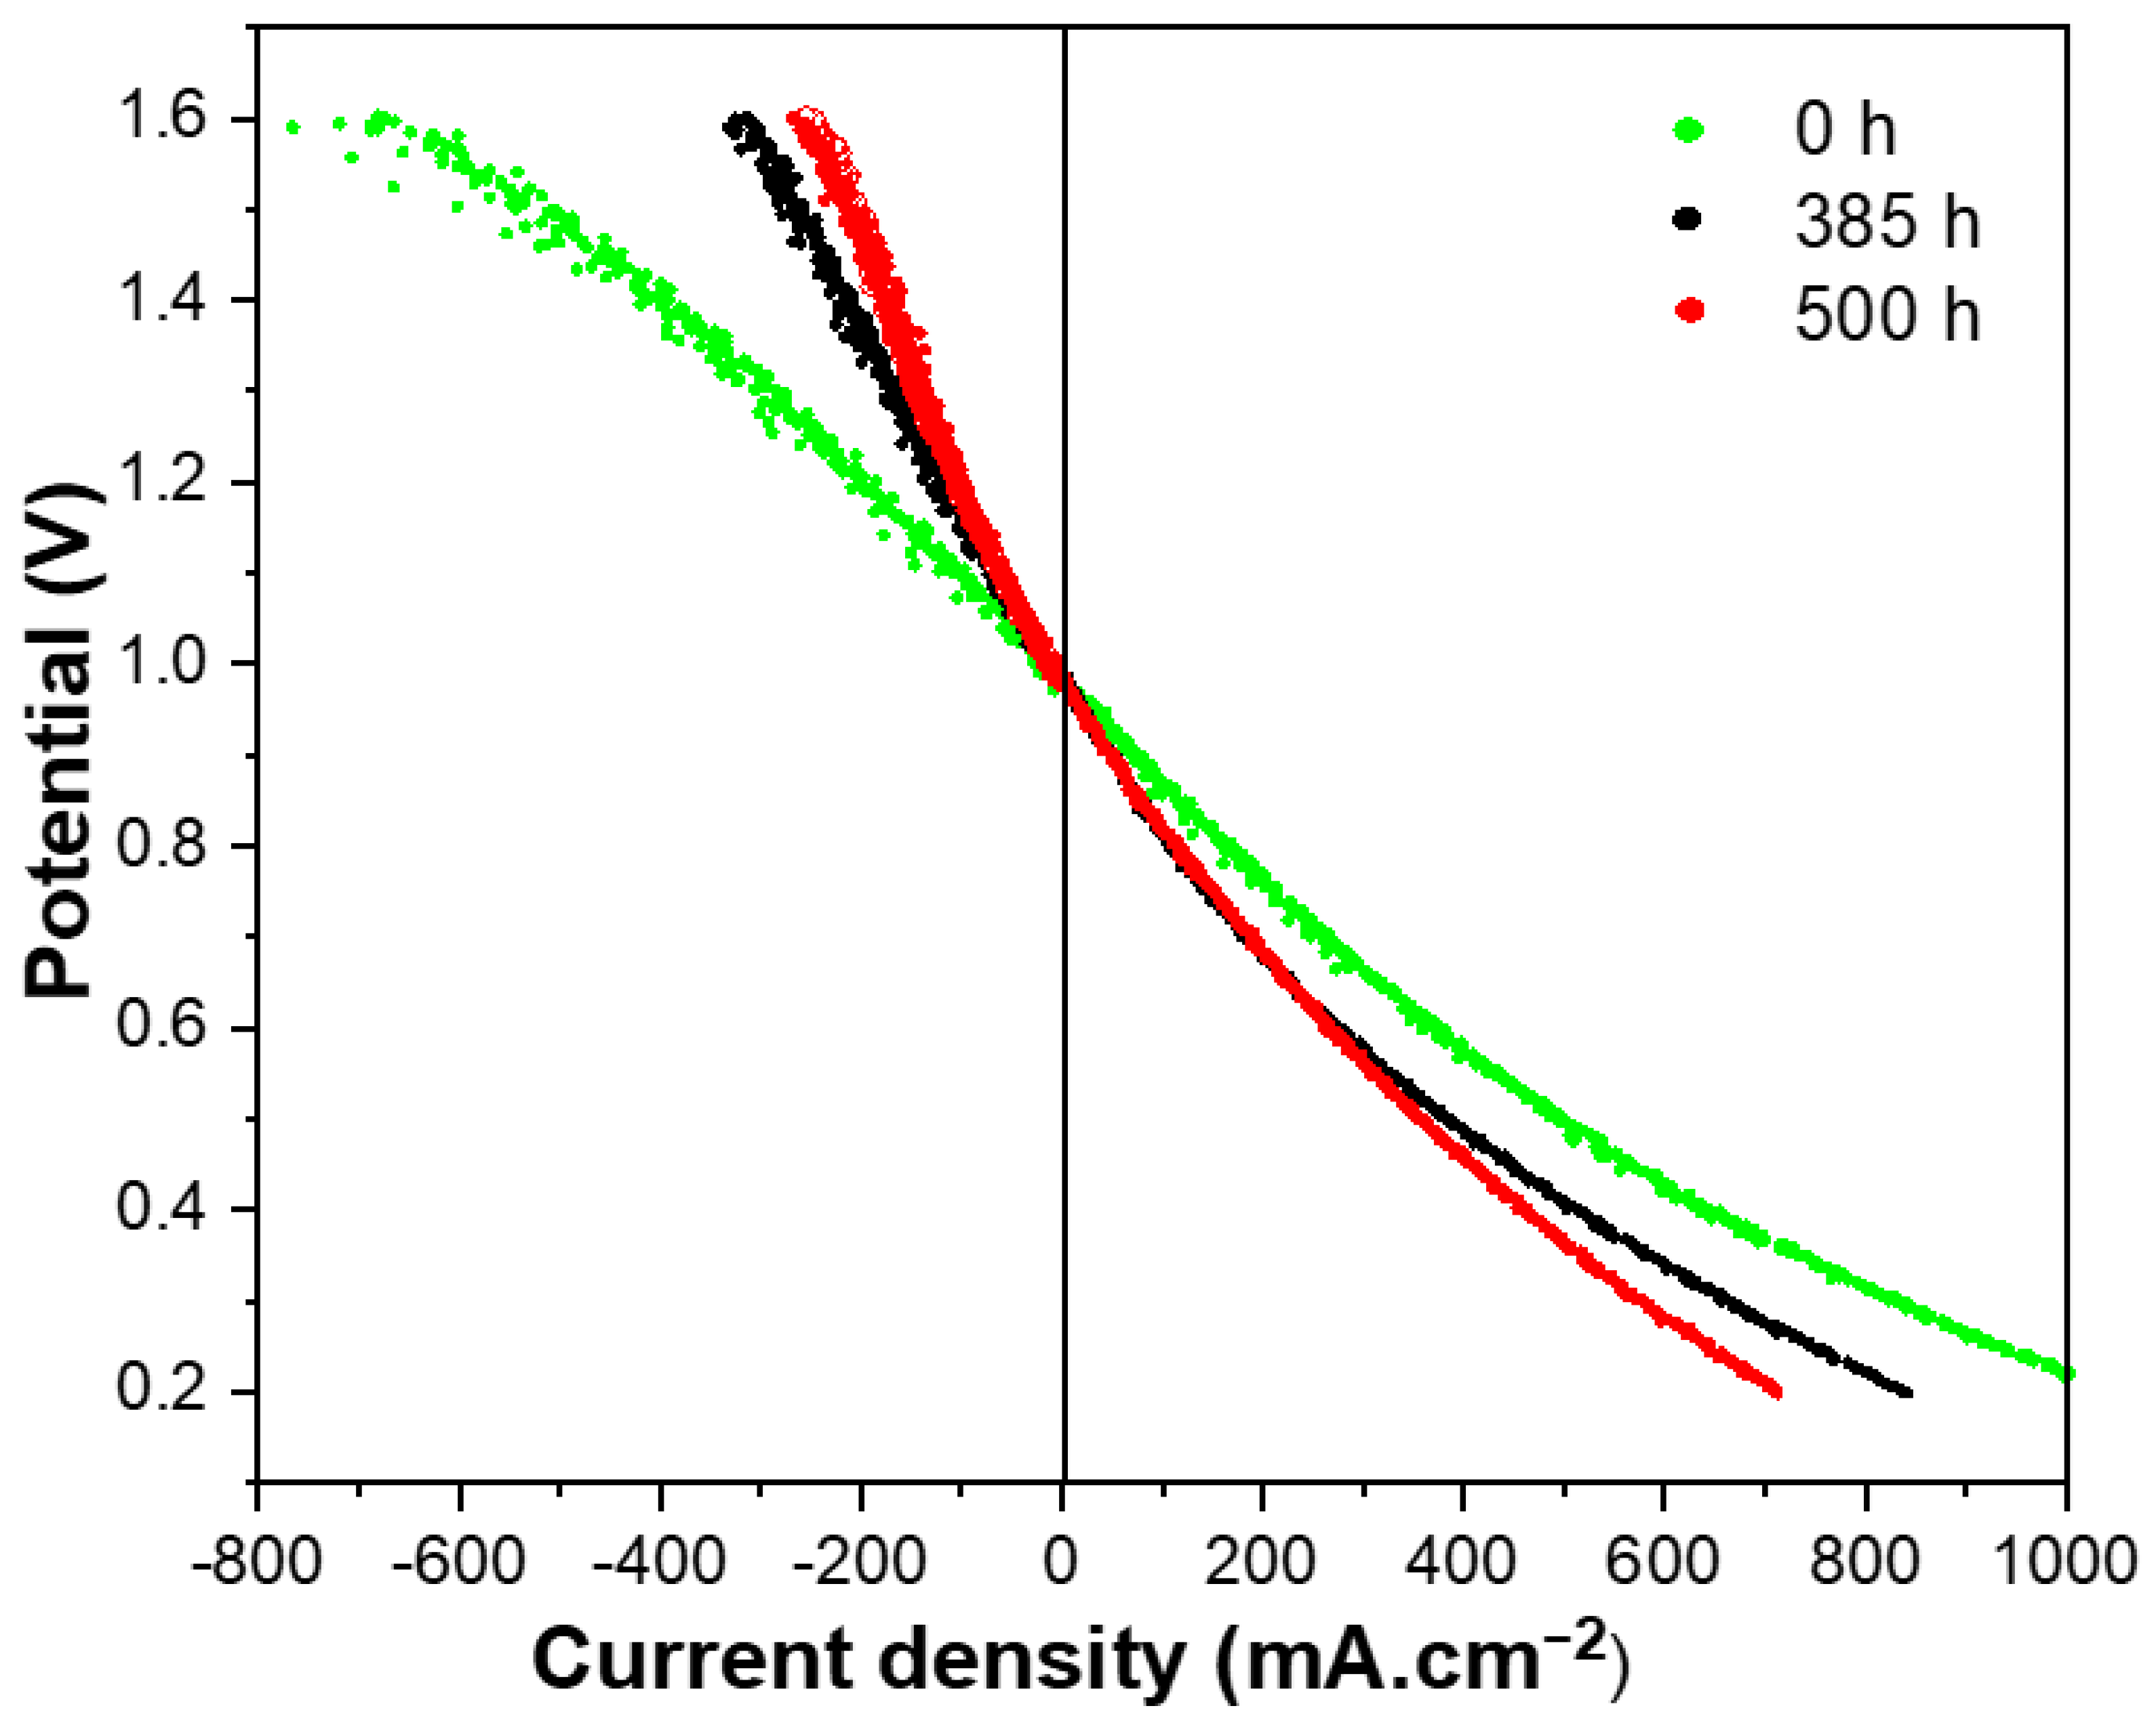
3.3. Reversible Operation

To demonstrate the dual functional capabilities of our MT-SOC, we operated the cell in reversible mode (i.e., fuel cell mode and electrolysis mode) using 50% H2O/H2 as the feed gas to the fuel electrode. Figure 6 exhibits the current-voltage characteristics of the MT-SOC operating in reversible mode, in a temperature range of 700 °C to 800 °C. In electrolysis mode, at 1.3 V (the thermo-neutral voltage for steam electrolysis), current densities of −311, −487 and −684 mA cm−2 were obtained at 700, 750 and 800 °C, respectively.
Water electrolysis using MT–SOC is the focus of the fuel cell community [35,36,37,38]. Laguna-Bercero et al. [39] reported reversible MT-SOC using Ni–YSZ/YSZ/LSM–YSZ cells at 850 °C under 70%H2O/15% H2/15% N2, where a current density of −1 A cm−2 was observed at 1.3 V. Hashimoto et al. [40] performed SOEC experiments using ScSZr electrolyte-based MT-SOFC under 18% steam. The cell exhibited modest performance of −0.1 A cm−2 at 700 °C at an operation voltage of 1.37 V. SOEC study by Wang et al. [36], on a Ni-ScSZ/ScSZ/GDC/LSCF cell delivered reasonable performances at 650 °C, under 36% steam (1.32 V at −0.57 A cm−2). Similarly, performances of MT-SOC with a novel asymmetric porous hydrogen electrode by Yang et al. [41] indicated that when the MT-SOC was operated in fuel cell mode, maximum power densities of 0.54, 0.71 and 1.25 W/cm2 were obtained at 800 °C, 850 °C and 900 °C, respectively. On the other hand, when the MT-SOC functioned in electrolysis mode at 900 °C, current densities of 0.68 A/cm2 and 2.57 A/cm2, were obtained at the applied voltage of 1.3 V, and at 30 and 80 vol.% humidity, respectively. Performance of our cell is moderate under electrolysis mode and falls in the range of performance data observed in the literature. Though the performance is moderate, the results reflect that a simple and a cost-effective technique can be used to fabricate MT-SOCs with reversible, dual mode operation capability.
Hydrogen production rate was determined based on the cell current developed from the electrolysis cell [42]. Assuming 100% Faradic efficiency, the estimated hydrogen generated is presented in Figure 7. The rate of hydrogen production was calculated based on the applied electric current at 800 °C by invoking the following expression:
Δ N H 2 = I 2 F
where I is the cell current, and F is the Faraday constant (F = 96,485 C mol−1). The hydrogen production rate varied linearly with generated electric current, in accordance with Faraday’s Law, suggesting that hydrogen production is proportional to the cell current generated. Eventually, we converted the hydrogen production rate from a molar to a volumetric rate by employing the ideal gas equation under standard temperature and pressure conditions [42].

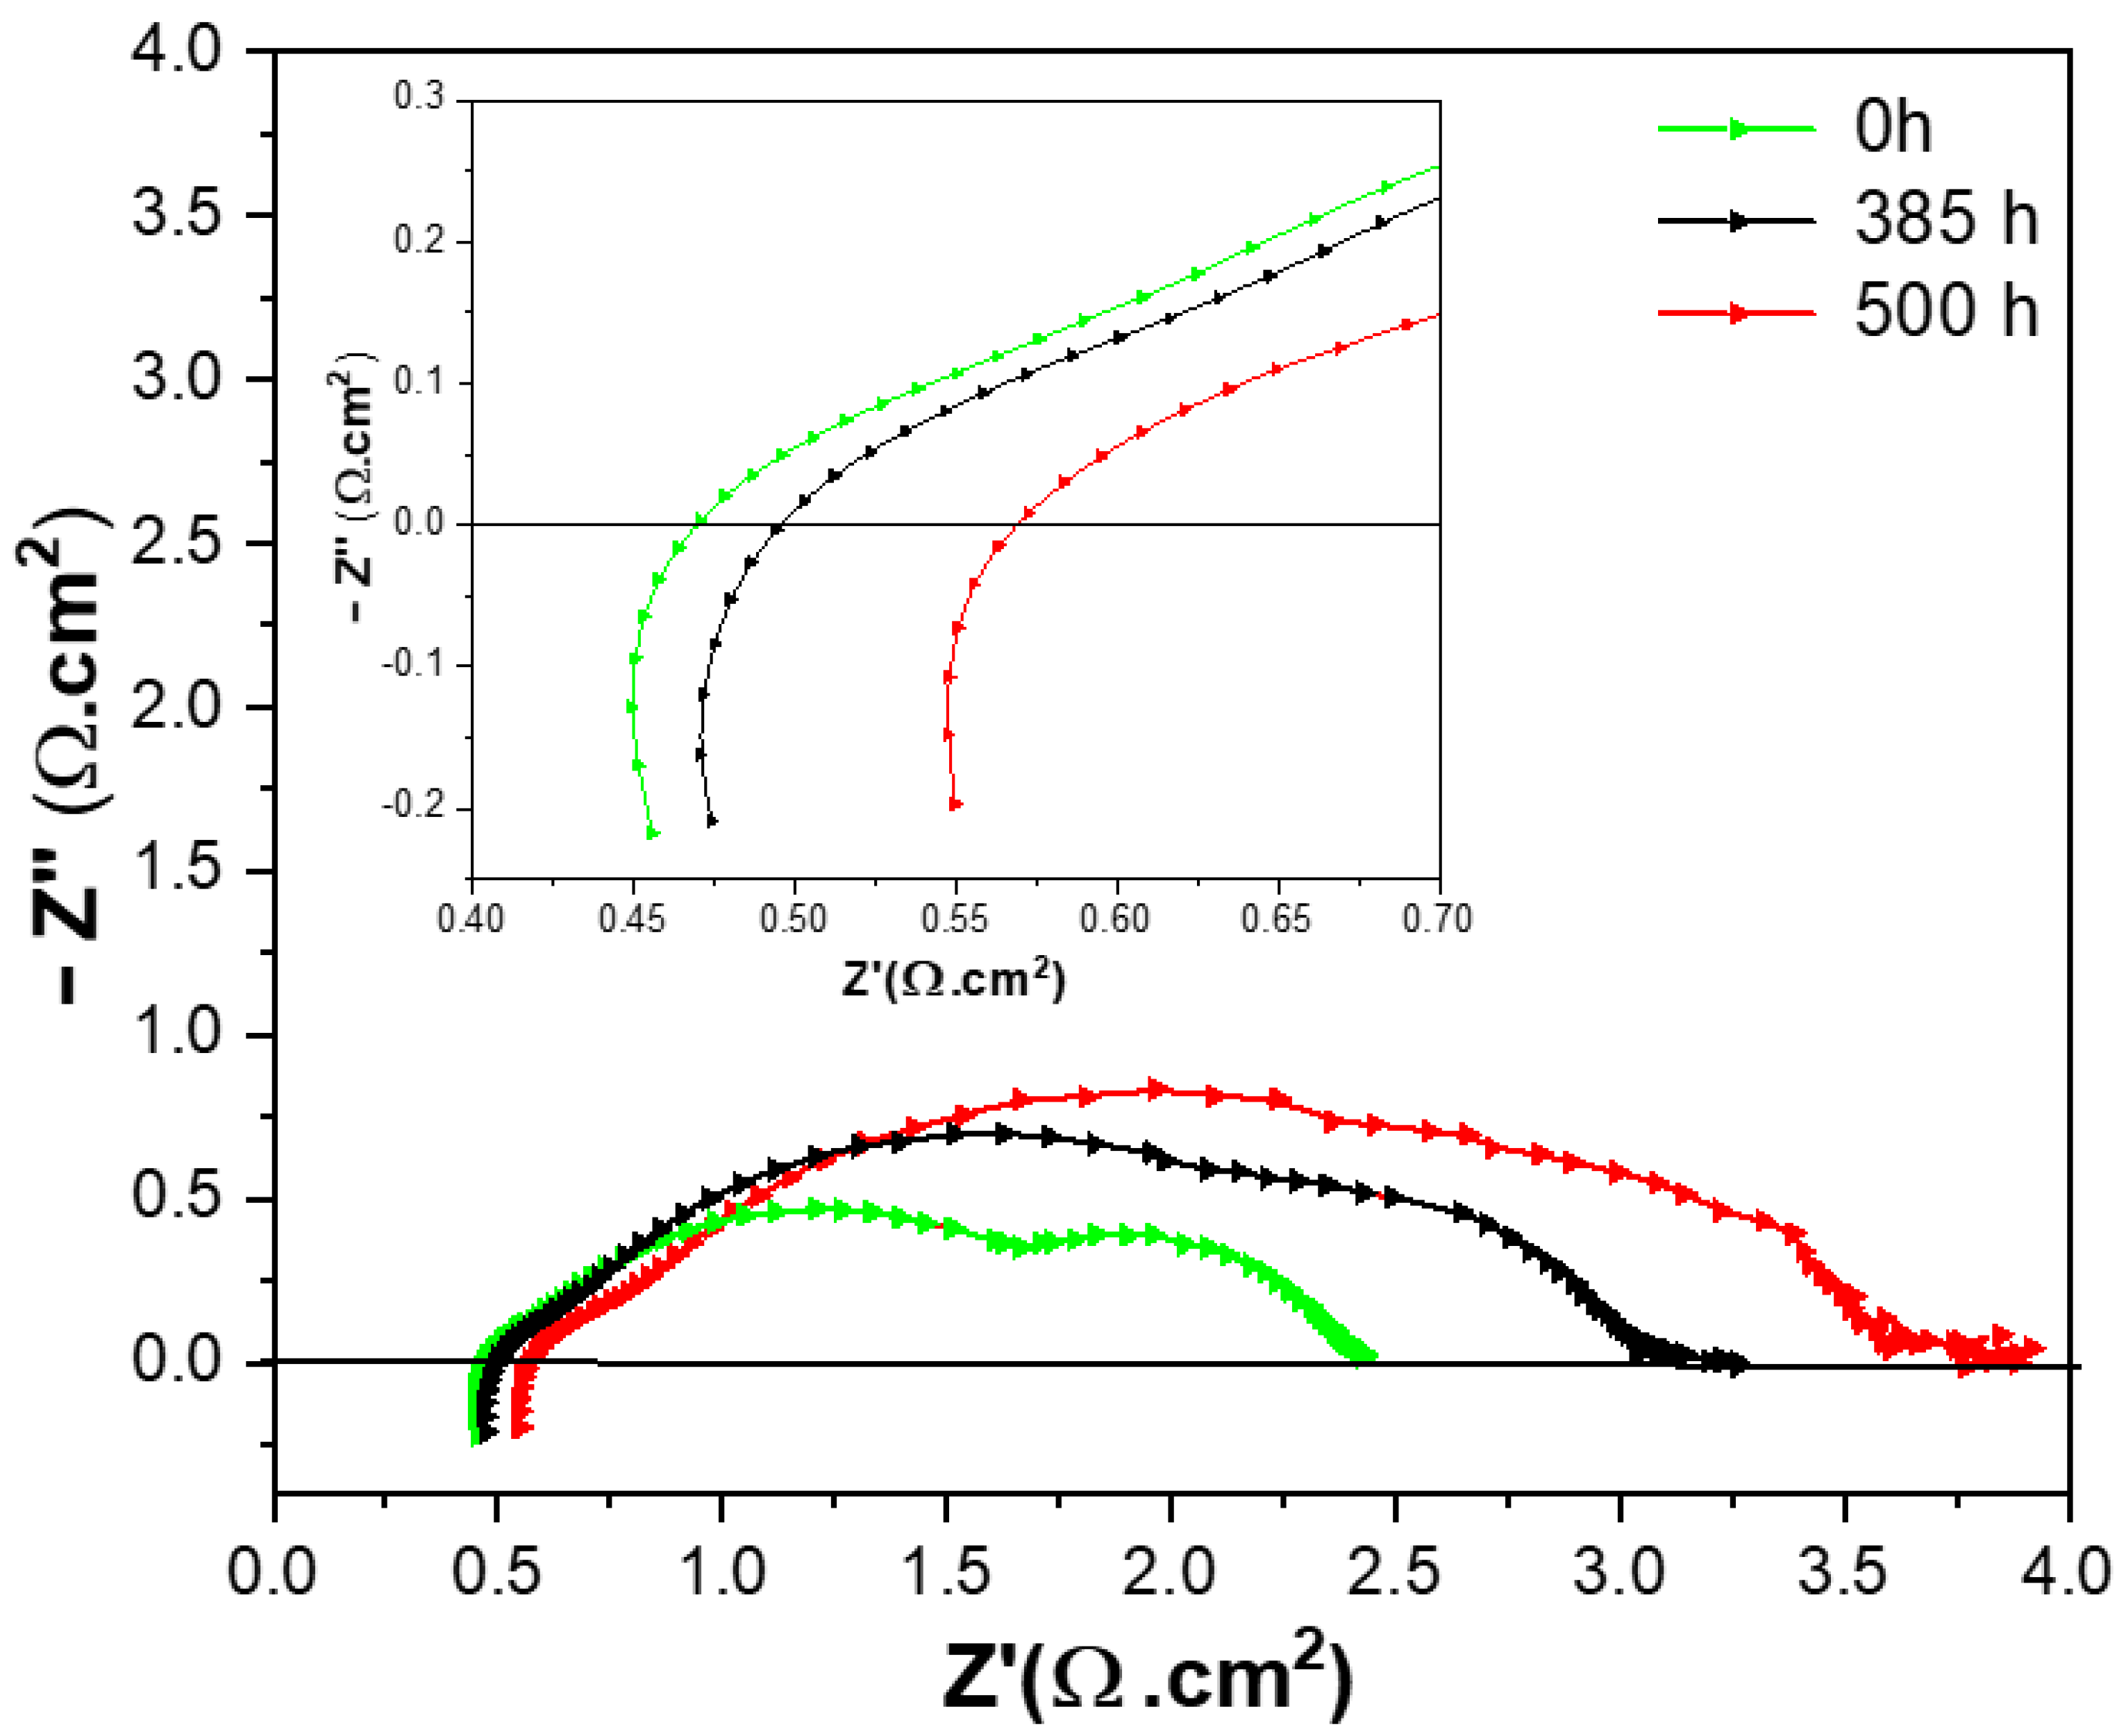
3.4. Durability and Stability Evaluation

To evaluate the durability and the stability of the cell, it was operated at 700 °C while the 2 reversible modes were cycled. In particular, reversible operation was conducted at an applied voltage of 0.7 V during fuel cell mode, and 1.3 V during electrolysis mode. As shown in Figure 8, at the beginning of the fuel cell mode operation, cell current was 353 mA cm−2, and over a period of 500 h, the current decreased to 243 mA cm−2. Similarly, at the beginning of the electrolysis mode, the resulting current was −250 mA cm−2 and over the period of the 500 h, the current increased to −115 mA cm−2. The rate of degradation when the cell was operating in electrolysis mode was approximately 50%, whereas the degradation that occurred when the cell was operated in fuel cell mode was almost 31%. These degradation effects are evident when analyzing both the variation of IV curves (under SOFC and SOEC modes), and cell impedance as a function of time (Figure 9 and Figure 10). Figure 9 shows the corresponding Nyquist plots of the cell at OCV at 0, 385 and 500 h. It is evident from Figure 9 that the increase in polarization resistance is the major contributor to cell degradation, while the increase in ohmic resistance contributed by a smaller degree. During this time, the ohmic resistance in the high frequency range increased from about 0.45 Ω cm2 at the 0th hour to 0.55 Ω cm2 at 500th hour. This increase of 0.1 Ω cm2 can be associated with the increase in contact resistance between the electrodes and the current collector, or it could be due to a possible partial oxidation of Ni in the Ni/YSZ support. Moreover, a substantial increase of the overall impedance from 2.4 Ω cm2 to 3.7 Ω cm2 was observed. This corresponds to an increase in the overall polarization impedance from 1.95 Ω cm2 after the 0th h to 2.72 Ω cm2 after 385th h and 3.15 Ω cm2 after 500th h. The steepest change can be observed during the I–V characterization measurements (Figure 10). These changes can be attributed to an increase of the polarization resistances of the oxygen and fuel electrodes. However, comparison of the microstructure of functional layers before and after the test, shown in Figure 11, indicated grain coarsening of the Ni-YSZ particles of the fuel electrode. This may lead to a decrease of electrochemical activity of the fuel electrode, due to the reduction of the triple phase boundary. Furthermore, the results of the impedance spectra are in good agreement with the slope of the I-V curves, the area-specific resistances of the cell. As observed in Figure 10, the slopes of the electrolysis curves are much higher than those of the fuel cell curves, which is an indication that the degradation rate is much higher when the cell operates in electrolysis mode than its operation in fuel cell mode.
Other likely reasons for the observed cell degradation and failures include: (1) for Ni–YSZ supported cells, the support becomes soft during reduction, allowing rapid crack development in the composite structure [26]. During long-term reversible operation of the cell, water acts as an influencing factor to reduce the stability of the Ni–YSZ-based support further [24,43,44,45]. Additionally, prior reports [46,47] suggest that during solid oxide cell operation there is a possibility of formation of zirconia and NiO based nanoparticles. At the beginning of the long-term test, these nanoparticles may activate the cell and contribute to the enhancement of cell performance. However, over the long term, they block the Ni and the stabilized zirconia contact, thus resulting in a reduction of H2O. Moreover, a continued oxidation of Ni can irreversibly damage the fuel electrode. This is especially the case if the reduction–oxidation (redox) of Ni occurs repeatedly, causing the cermet to be mechanically destroyed because of the large volume difference between Ni and NiO [48].

4. Conclusions

We fabricated cost-effective, lightweight MT-SOCs successfully and tested their performance during reversible, dual mode operation—the fuel cell mode and the electrolysis mode for 500 uninterrupted hours. This is the first time that the durability of the MT-SOC, developed in its entirety using the single low-cost fabrication technique, was tested for such prolonged duration. During the reversible operation, the cell degradation rate was much higher in the electrolysis mode than in the fuel cell mode. There is suggestive evidence that the coarsening of the Ni particles of the fuel electrode is one of the reasons for the faster degradation of the SOC, leading to a decrease in the electrochemical activity of the electrode through the reduction of the triple phase boundary. Additionally, the possibility of formation of zirconia and NiO-based nanoparticles during the electrolysis operation is due to the fact that, over a long term, the operation can partly block the Ni-ScSZ contact, and contribute towards cell degradation. Based on these results, the goal of our future efforts is to minimize the degradation rate observed in the current study.

Author Contributions

Conceptualization, Y.D.; Methodology, Y.D., S.K.S. and D.P.; Software, Y.D. and H.F.; Validation, Y.D., S.K.S. and D.P.; Formal Analysis, S.K.S.; Investigation, S.K.S. and I.S.; Resources, Y.D.; Data Curation, S.K.S.; Writing—Original Draft Preparation S.K.S.; Writing—Review and Editing, S.K.S., Y.D., D.P., I.S., H.F.; Visualizaion, S.K.S. and Y.D.; Supervision, S.K.S., I.S. and Y.D.; Project Administration, Y.D.; Funding Acquisition, Y.D. All authors have read and agreed to the published version of the manuscript.

Funding

This research received no external funding.

Institutional Review Board Statement

Not Applicable.

Informed Consent Statement

Not Applicable.

Data Availability Statement

Not Applicable.

Acknowledgments

The SEM images were obtained at the SEM lab of the Characterization Facility of the Advanced Materials and Liquid Crystal Institute, Kent State University.

Conflicts of Interest

The authors declare no conflict of interest.

References

  1. Mogensen, M.; Jensen, S.H.; Hauch, A.; Chorkendorff, I.; Jacobsen, T. Performance of reversible solid oxide cells—A review. In Proceeding European Solid Oxide Fuel Cell (SOFC) Forum; Citeseer: State College, PA, USA, 2006; p. 301. [Google Scholar]
  2. Mogensen, M.B.; Chen, M.; Frandsen, H.L.; Graves, C.; Hansen, J.B.; Hansen, K.V.; Hauch, A.; Jacobsen, T.; Jensen, S.H.; Skafte, T.L.; et al. Reversible solid-oxide cells for clean and sustainable energy. Clean Energy 2019, 3, 175–201. [Google Scholar] [CrossRef]
  3. Myung, J.H.; Neagu, D.; Miller, D.N.; Irvine, J.T. Switching on electrocatalytic activity in solid oxide cells. Nature 2016, 537, 528–531. [Google Scholar] [CrossRef] [PubMed] [Green Version]
  4. De la Torre García, R. Production of Micro-Tubular Solid Oxide Fuel Cells. Ph.D. Thesis, University of Trento, Trento, Italy, 2011. [Google Scholar]
  5. Suzuki, T.; Funahashi, Y.; Yamaguchi, T.; Fujishiro, Y.; Awano, M. Design and fabrication of lightweight, submillimeter tubular solid oxide fuel cells. Electrochem. Solid-State Lett. 2007, 10, A177. [Google Scholar] [CrossRef]
  6. Ghezel-Ayagh, H. Solid oxide cell technology for supply, recovery, and storage energy. ECS Trans. 2021, 103, 17. [Google Scholar] [CrossRef]
  7. Orera, V.M.; Laguna-Bercero, M.A.; Larrea, A. Fabrication methods and performance in fuel cell and steam electrolysis operation modes of small tubular solid oxide fuel cells: A review. Front. Energy Res. 2014, 2, 22. [Google Scholar] [CrossRef] [Green Version]
  8. Preininger, M.; Stoeckl, B.; Subotić, V.; Hochenauer, C. Characterization and performance study of commercially available solid oxide cell stacks for an autonomous system. Energy Convers. Manag. 2020, 203, 112215. [Google Scholar] [CrossRef]
  9. Pandiyan, A.; Uthayakumar, A.; Subrayan, R.; Cha, S.W.; Krishna Moorthy, S.B. Review of solid oxide electrolysis cells: A clean energy strategy for hydrogen generation. Nanomater. Energy 2019, 8, 2–22. [Google Scholar] [CrossRef]
  10. Jamil, S.M.; Othman, M.H.D.; Rahman, M.A.; Jaafar, J.; Ismail, A.F.; Li, K. Recent fabrication techniques for micro-tubular solid oxide fuel cell support: A review. J. Eur. Ceram. Soc. 2015, 35, 1–22. [Google Scholar] [CrossRef]
  11. Panthi, D.; Tsutsumi, A. A novel multistep dip-coating method for the fabrication of anode-supported microtubular solid oxide fuel cells. J. Solid State Electrochem. 2014, 18, 1899–1905. [Google Scholar] [CrossRef]
  12. Panthi, D.; Hedayat, N.; Woodson, T.; Emley, B.J.; Du, Y. Tubular solid oxide fuel cells fabricated by a novel freeze casting method. J. Am. Ceram. Soc. 2020, 103, 878–888. [Google Scholar] [CrossRef]
  13. Sammes, N.; Du, Y. Fabrication and Characterization of Tubular Solid Oxide Fuel Cells. Int. J. Appl. Ceram. Technol. 2007, 4, 89–102. [Google Scholar] [CrossRef]
  14. Zakaria, Z.; Awang Mat, Z.; Abu Hassan, S.H.; Boon Kar, Y. A review of solid oxide fuel cell component fabrication methods toward lowering temperature. Int. J. Energy Res. 2020, 44, 594–611. [Google Scholar] [CrossRef]
  15. Tietz, F.; Buchkremer, H.P.; Stöver, D. Components manufacturing for solid oxide fuel cells. Solid State Ion. 2002, 152, 373–381. [Google Scholar] [CrossRef]
  16. Monzon, H.; Laguna-Bercero, M. Highly stable microtubular cells for portable solid oxide fuel cell applications. Electrochim. Acta 2016, 222, 1622–1627. [Google Scholar] [CrossRef] [Green Version]
  17. Liu, R.Z.; Wang, S.R.; Huang, B.; Zhao, C.H.; Li, J.L.; Wang, Z.R.; Wen, Z.Y.; Wen, T.L. Dip-coating and co-sintering technologies for fabricating tubular solid oxide fuel cells. J. Solid State Electrochem. 2009, 13, 1905–1911. [Google Scholar] [CrossRef]
  18. Panthi, D.; Choi, B.; Du, Y.; Tsutsumi, A. Lowering the co-sintering temperature of cathode electrolyte bilayers for micro-tubular solid oxide fuel cells. Ceram. Int. 2017, 43, 10698–10707. [Google Scholar] [CrossRef]
  19. Panthi, D.; Choi, B.; Tsutsumi, A. Fabrication and evaluation of a micro-tubular solid oxide fuel cell with an inert support using scandia-stabilized zirconia electrolyte. J. Electrochem. Soc. 2015, 162, F1555–F1560. [Google Scholar] [CrossRef] [Green Version]
  20. Hedayat, N.; Panthi, D.; Du, Y. Fabrication of anode-supported microtubular solid oxide fuel cells by sequential dip-coating and reduced sintering steps. Electrochim. Acta 2017, 258, 694–702. [Google Scholar] [CrossRef]
  21. Hagen, A.; Menon, M.; Rasmousse, S.; Larsen, P.H.; Barfod, R.; Henriksen, P.V. Properties and performance of SOFCs produced on a pre-pilot plant scale. In Proceedings of the Sixth European SOFC Forum, Luzerne, Switzerland, 28 June–2 July 2004; Volume 2, pp. 930–939. [Google Scholar]
  22. Hedayat, N.; Panthi, D.; Du, Y. Fabrication of tubular solid oxide fuel cells by solvent-assisted lamination and co-firing a rolled multilayer tape cast. Int. J. Appl. Ceram. Technol. 2018, 15, 307–314. [Google Scholar] [CrossRef]
  23. Khajavi, P. Improving the Mechanical Properties and Stability of Solid Oxide Fuel and Electrolysis Cells. Ph.D. Thesis, Technical University of Denmark, Kongens Lyngby, Denmark, 2018. [Google Scholar]
  24. Ni, D.W.; Charlas, B.; Kwok, K.; Molla, T.T.; Hendriksen, P.V.; Frandsen, H.L. Influence of temperature and atmosphere on the strength and elastic modulus of solid oxide fuel cell anode supports. J. Power Sources 2016, 311, 1–12. [Google Scholar] [CrossRef] [Green Version]
  25. Chevalier, J.; Gremillard, L.; Virkar, A.V.; Clarke, D.R. The tetragonal-monoclinic transformation in zirconia: Lessons learned and future trends. J. Am. Ceram. Soc. 2009, 92, 1901–1920. [Google Scholar] [CrossRef]
  26. Frandsen, H.L.; Makowska, M.; Greco, F.; Chatzichristodoulou, C.; Ni, D.W.; Curran, D.J.; Strobl, M.; Kuhn, L.T.; Hendriksen, P.V. Accelerated creep in solid oxide fuel cell anode supports during reduction. J. Power Sources 2016, 323, 78–89. [Google Scholar] [CrossRef] [Green Version]
  27. Laguna-Bercero, M.A.; Campana, R.; Larrea, A.; Kilner, J.A.; Orera, V.M. Performance and aging of microtubular YSZ-based solid oxide regenerative fuel cells. Fuel Cells 2011, 11, 116–123. [Google Scholar] [CrossRef] [Green Version]
  28. Campana, R.; Merino, R.I.; Larrea, A.; Villarreal, I.; Orera, V.M. Fabrication, electrochemical characterization and thermal cycling of anode supported microtubular solid oxide fuel cells. J. Power Sources 2009, 192, 120–125. [Google Scholar] [CrossRef]
  29. Monzón, H.; Laguna-Bercero, M.A.; Larrea, A.; Arias, B.I.; Várez, A.; Levenfeld, B. Design of industrially scalable microtubular solid oxide fuel cells based on an extruded support. Int. J. Hydrogen Energy 2014, 39, 5470–5476. [Google Scholar] [CrossRef] [Green Version]
  30. Suzuki, T.; Hasan, Z.; Funahashi, Y.; Yamaguchi, T.; Fujishiro, Y.; Awano, M. Impact of anode microstructure on solid oxide fuel cells. Science 2009, 325, 852–855. [Google Scholar] [CrossRef]
  31. Suzuki, T.; Hasan, Z.; Yamaguchi, T.; Fujishiro, Y.; Awano, M.; Sammes, N. Fabrication of micro-tubular solid oxide fuel cells with a single-grain thick yttria stabilized zirconia electrolyte. J. Power Sources 2010, 195, 7825–7828. [Google Scholar] [CrossRef]
  32. Suzuki, T.; Sugihara, S.; Hamamoto, K.; Yamaguchi, T.; Fujishiro, Y. Energy efficiency of a microtubular solid-oxide fuel cell. J. Power Sources 2011, 196, 5485–5489. [Google Scholar] [CrossRef]
  33. Sarkar, P.; Yamarte, L.; Rho, H.; Johanson, L. Anode-supported tubular micro-solid oxide fuel cell. Int. J. Appl. Ceram. Technol. 2007, 4, 103–108. [Google Scholar] [CrossRef]
  34. Dhir, A.; Kendall, K. Microtubular SOFC anode optimisation for direct use on methane. J. Power Sources 2008, 181, 297–303. [Google Scholar] [CrossRef]
  35. Kato, T.; Sakaki, N.; Negishi, A.; Honda, T.; Nguyen, L.; Tanaka, Y. Development of tubular solid oxide electrolysis cells for hydrogen production. ECS Trans. 2009, 25, 1015. [Google Scholar] [CrossRef]
  36. Wang, Z.; Mori, M.; Araki, T. Steam electrolysis performance of intermediate-temperature solid oxide electrolysis cell and efficiency of hydrogen production system at 300 Nm3 h-1. Int. J. Hydrogen Energy 2010, 35, 4451–4458. [Google Scholar] [CrossRef]
  37. Jin, C.; Yang, C.H.; Chen, F.L. Novel micro-tubular high temperature solid oxide electrolysis cells. ECS Trans. 2011, 35, 2987–2995. [Google Scholar] [CrossRef]
  38. Shao, L.; Qian, J.; Ye, X.; Wen, T. Optimization of the electrode-supported tubular solid oxide cells for application on fuel cell and steam electrolysis. Int. J. Hydrogen Energy 2013, 38, 4272–4280. [Google Scholar] [CrossRef]
  39. Laguna-Bercero, M.A.; Campana, R.; Larrea, A.; Kilner, J.A.; Orera, V.M. Steam electrolysis using a microtubular solid oxide fuel cell. J. Electrochem. Soc. 2010, 6, B852–B855. [Google Scholar] [CrossRef] [Green Version]
  40. Hashimoto, S.; Liu, Y.; Mori, M.; Funahashi, Y.; Fujishiro, Y. Study of steam electrolysis using a microtubular ceramic reactor. Int. J. Hydrogen Energy 2009, 34, 1159–1165. [Google Scholar] [CrossRef]
  41. Yang, C.; Jin, C.; Chen, F. Performances of micro-tubular solid oxide cell with novel asymmetric porous hydrogen electrode. Electrochim. Acta 2010, 56, 80–84. [Google Scholar] [CrossRef]
  42. Duffy, M.; Harrison, K.; Sheahen, T. Measurement of Hydrogen Production Rate Based on Dew Point Temperatures: Independent Review; NREL/MP-150-42237; U.S. Department of Energy Hydrogen Program: Golden, CO, USA, 2007.
  43. Goutianos, S.; Frandsen, H.L.; Sørensen, B.F. Fracture properties of nickel-based anodes for solid oxide fuel cells. J. Eur. Ceram. Soc. 2010, 30, 3173–3179. [Google Scholar] [CrossRef]
  44. Boccaccini, D.N.; Frandsen, H.L.; Soprani, S.; Cannio, M.; Klemensø, T.; Gil, V.; Hendriksen, P.V. Influence of porosity on mechanical properties of tetragonal stabilized zirconia. J. Eur. Ceram. Soc. 2018, 38, 1720–1735. [Google Scholar] [CrossRef] [Green Version]
  45. Fleischhauer, F.; Bermejo, R.; Danzer, R.; Mai, A.; Graule, T.; Kuebler, J. High temperature mechanical properties of zirconia tapes used for electrolyte supported solid oxide fuel cells. J. Power Sources 2015, 273, 237–243. [Google Scholar] [CrossRef]
  46. Chen, M.; Sun, X.; Chatzichristodoulou, C.; Koch, S.; Hendriksen, P.V.; Mogensen, M.B. Thermoneutral operation of solid oxide electrolysis cells in potentiostatic mode. ECS Trans. 2017, 78, 3077. [Google Scholar] [CrossRef] [Green Version]
  47. Ahlgren, E.; Poulsen, F.W. Thermoelectric power of YSZ. Solid State Ion. 1994, 70, 528–532. [Google Scholar] [CrossRef]
  48. Sammes, N.M.; Du, Y. The mechanical properties of tubular solid oxide fuel cells. J. Mater. Sci. 2003, 38, 4811–4816. [Google Scholar] [CrossRef]
Figure 1. Schematics of the electrochemical testing setup.
Energies 15 03536 g001
Figure 2. Photograph of MT-SOCs prepared by dip-coating: (a) completed MT-SOCs (b) completed MT-SOCs with silver current collection layer, (c) completed MT-SOCs having silver wires wrapped around silver current collection layer.
Energies 15 03536 g002
Figure 3. (a) A cross-sectional image of the micro-tubular cell after reduction, (b) the fuel electrode support layer, (c) a close-up view of various layers of the micro-tubular cell.
Energies 15 03536 g003
Figure 4. Nyquist plots under OCV conditions at different temperatures.
Energies 15 03536 g004
Figure 5. Power generation performance of a single MT-SOC in the temperature range of 700 °C to 800 °C.
Energies 15 03536 g005
Figure 6. Current-Voltage characteristics of the MT-SOC operating in reversible mode, in a temperature range of 700 °C to 800 °C.
Energies 15 03536 g006
Figure 7. Hydrogen production rate based on cell current.
Energies 15 03536 g007
Figure 8. Stability test at 700 °C under reversible mode.
Energies 15 03536 g008
Figure 9. Impedance spectra of the cell at 700 °C and at various operation times over long-term operation (0 h, 385 h, and 500 h).
Energies 15 03536 g009
Figure 10. Performance under SOFC and SOEC modes with 50% humidified H2 at the beginning of long-term operation (t = 0 h), at t = 385 h, and at t = 500 h of operation.
Energies 15 03536 g010
Figure 11. Ni-ScSZ particles of the fuel electrode functional layer (a) before the stability test and (b) after the stability test, showing the coarsening of the Ni particles.
Energies 15 03536 g011
Table 1. Summarized conditions for the fabrication of SOC layers.
Individual LayersMaterialsTargeted Thickness/µmNo. of DipsFiring Temperature/°C and Duration of Firing
fuel electrode support layerNiO/3YSZ (65/35 wt%)400141000/1 h
fuel electrode functional layerNiO/ScSZ (60/40 wt%)1511000/1 h
electrolyteScSZ1061400/3 h
oxygen electrode protective layerSDC261300/2 h
oxygen electrode LSCF2021100/1 h
Table 2. Performance summary of fuel electrode supported MT-SOFC.
RefCellMaximum Performance
This workFuel support electrode: Ni-ScSZ, dip-coating, Fuel support electrode
+ Fuel support electrode functional layer
Electrolyte: ScSZ, 10 µm
Oxygen electrode: SDC/LSCF 20 µm
690 mW cm−2,
800 °C
Liu et al. [17] Fuel support electrode: Ni–YSZ, 500–600 µm
Electrolyte: ScSZ, 10 µm
Oxygen electrode: ScSZ–LSM/LSM, 70 µm
240 mW cm−2,
800 °C
Monzón et al. [29]Fuel support electrode: Ni–YSZ, Extrusion, 700 µm
Electrolyte: YSZ, Dip-coating, 20 µm
Oxygen electrode: LSM–YSZ/LSM, dip-coating 30–50 µm
600 mW cm−2,
850 °C
Suzuki et al. [30]Fuel support electrode: Ni–ScSZ, Extrusion, 400 µm
Electrolyte: ScSZ, Dip-coating, 3 µm
Oxygen electrode: GDC/LSCF–GDC, 6 µm, dip-coating
800 mW cm−2,
600 °C
Suzuki et al. [31]Fuel support electrode: Ni–YSZ, Extrusion
Electrolyte: YSZ; Dip-coating, <1 µm
Oxygen electrode: GDC/LSCF–GDC, Dip-coating, 6 µm
300 mW cm−2,
600 °C
Suzuki et al. [32]Fuel support electrode: Ni–YSZ, Extrusion
Electrolyte: Ni–ScSZ/ScSZ, Dip-coating, 10 µm
Oxygen electrode: GDC/LSCF–GDC, Dip-coating, 6 µm
600 mW cm−2,
780 °C
Sarkar et al. [33]Fuel support electrode: Ni–YSZ, Fuel support electrode + Fuel support functional electrode
Electrolyte: YSZ <10 µm
Oxygen electrode: YSZ–LSM/LSM
190 mW cm−2,
800 °C
Dhir and Kendall [34]Fuel support electrode: Ni–YSZ, Extrusion 300 µm
Electrolyte: YSZ, 15 µm
Oxygen electrode: LSM
350 mW cm−2, 800 °C
Publisher’s Note: MDPI stays neutral with regard to jurisdictional claims in published maps and institutional affiliations.

