Abstract
The operation data of a tunnel boring machine (TBM) reflects its geological conditions and working status, which can provide critical references and essential information for TBM designers and operators. However, in practice, operation data may get corrupted due to equipment failures or data management errors. Moreover, the working state of a TBM system usually changes, which results in patterns of operation data that vary comparatively. This paper proposes a denoising approach to process the corrupted data. This approach is combined with low-rank matrix recovery (LRMR) and sparse representation (SR) theory. The classical LRMR model requires that the noise must be sparse, but the sparsity of noise cannot be fully guaranteed. In the proposed model, a weighted nuclear norm is utilized to enhance the sparsity of sparse components, and a constraint of condition number is applied to ensure the stability of the model solution. The approach is coupled with a fuzzy c-means algorithm (FCM) to find the natural partitioning using the TBM operation data as input. The performances of the proposed approach are illustrated through an application to the Shenzhen metro. Experimental results show that the proposed approach performs well in corrupted TBM data denoising. The different excavation status of the TBM recognition accuracy is improved remarkably after denoising.
1. Introduction
Tunnel boring machine (TBM), as an important complex engineering system, have been widely used in various forms of tunnel construction, such as in metros, railways, highways, etc. With the application of cyber-physical systems and sensing technologies, massive amounts of operation data have been measured and recorded, which can reflect TBM conditions and working status and promotes the development of data-driven design, analysis, and control of TBM [1,2,3]. However, the TBM used in mixed ground conditions faces many challenges, such as geological hazards, instrument damage, instability of the excavation face, and change in working state, which may result in noise and data pattern changes. These disturbances cannot be fully avoided in the construction process and seriously reduce the quality and reliability of data, so it is necessary to develop approaches and techniques to remove the noises from recorded TBM parameters and identify the different excavation states of the TBM.
In recent years, data denoising technology has received tremendous attention, with researchers proposing a series of effective methods [4,5,6]. The common methods of data denoising for data preprocessing include traditional filtering denoising [7,8], wavelet transform (WT) denoising [9,10], and empirical mode decomposition (EMD) denoising [11,12]. The filtering denoising methods, such as median filtering denoising [13], Kalman filtering [14] and Winer filtering [15], are rarely used in TBM data denoising due to the lack of prior knowledge of noise statistical characteristics. With respect to tunneling data denoising, Zhang and Liu [16] calculated the Mahalanobis distance at first, and removed the data outside of the p90 percentile, before finally employing the DB4 wavelet with two-layer decomposition and soft thresholding to denoise the operation data. As a solution, Zhou and Xu [17] also utilized the wavelet transform to remove noise before building a dynamic predictive model of TBM data. However, the pre-divided temporal frequency features and the linear non-adaptive transformation of the WT limit its application ability in nonlinear TBM systems. EMD decompose the signal into a finite number of intrinsic mode functions (IMFs), which has been successfully used in data denoising in various fields such as seismic data [18], electrochemical data [19], and global navigation satellite system (GNSS) position data [20]. Unfortunately, the true physical processes could be obscured by the disruption of a given signal, when the signal contains intermittent processes [21].
In general, there are various kinds of noise in TBM operation data during the tunneling process, and the aforementioned methods are potentially restricted for particularly noisy operation data. As a matter of a fact, some attributes of TBM operational data are highly correlated. In addition, the parameters correlation can effectively boost the denoising results. Rank minimization is a common method for exploring the correlation, and some well-performed denoising methods based on low-rank matrix recovery (LRMR) have been proposed. For instance, Li and Wang [22] proposed an effective sparse representation model for image fusion and denoising, which decomposes noisy images into two different components and exploits a weight nuclear norm sparse regularization term to avoid corruption by noises. With respect to hyperspectral image denoising, Zhao and Yang [23] utilized the local and global redundancy and correlation (RAC) in spatial and spectral domains jointly because it is has particularly global and local RAC in spatial and spectral dimensions. As a solution, Gomes and Costa [24] employed low-rank tensor approximation to denoise data in R-D sensor array processing problems. However, most methods mentioned above are mostly used for computer vision applications. The literature survey showed that the LRMR method has not yet been used in tunneling data denoising.
In this article, a new denoising approach based on LRMR is proposed for TBM data preprocessing. The robust principal component analysis (RPCA) [25] is a typical LRMR framework, which allows two facts that the high correlation of matrix can be captured by low-rank prior, meanwhile the noise possesses sparse characteristics. In fact, the robustness of RPCA is demonstrated by assuming that noise is sparse, regardless of noise intensity. However, the sparsity of noise cannot be fully guaranteed, due to the complexity of the noise sources in the tunneling data. In order to break the above hurdle, the weighted nuclear norm is utilized to improve the ability of the model in sparse decomposition. The weighted nuclear norm can also reduce the influence of singular values in the process of nuclear norms approximate to low-rank matrix. Besides this, we employ a Forbenius-2 norm to improve the stability of model solutions. The proposed LRMR model is a jointly nonconvex problem, and we introduce the inexact augmented Lagrange multiplier (IALM) [26] technique and an alternating minimization strategy to solve it.
Since there are different operation states of the TBM system, the patterns of operation vary greatly as well. It necessary to partition the data into different parts based on characteristics to better help the design and analysis for TBM designers and operators. In recent years, data clustering methods have been developed and widely used in the field of engineering for the partition of operation data. Generally, these methods can be grouped into two categories, hard clustering methods and fuzzy clustering methods. Different from hard clustering, fuzzy clustering methods allows data to belong to multiple clusters with varying degrees of membership. Thus, we utilize the fuzzy c-means algorithm (FCM) [27] to classify the TBM operation status. By doing so, we can make a reasonable partitioning of the TBM operation data.
Our main contributions are as follows:
- (1)
- A new non-convex low-rank approximation that utilizes the weighted nuclear norm and Forbenius norm is introduced for TBM denoising. This method can avoid the deficiencies of RPCA. To the best of the authors’ knowledge, the RPCA model has not yet been used in tunneling data denoising.
- (2)
- An efficient optimization framework based on IALM and alternating minimization is designed to minimize the non-convex proposed model. Experimental results with real-world datasets from a tunnel in China illustrate that the proposed method performs well.
2. Proposed Approach
2.1. Preliminary
Assume that the observed data matrix can be decomposed into a low-rank matrix and a sparse matrix accounting for both small Gaussian noise and large scale outliers , so that .
To determine and , the RPCA algorithm aims to solve the minimization problem, which can be described as follows:
where is a trade-off parameter, which is a balance of the relative contribution between the rank of matrix and the norm of matrix . It is obvious that the optimization problem in (1) is highly non-convex for all matrix variables simultaneously, it cannot be solved directly using the existing methods. By replacing the norm with the norm, and the rank with the nuclear norm, then the problem can be relaxed into the following surrogate:
where is the nuclear norm defined as , is the i-th singular value of , is the norm, which can be calculated as the sum of the absolute values in matrix . In the last decades, many effective methods have been proposed for solving the optimization problem of (2). Specifically, the optimization problem (2) can be effectively solved by the alternating direction method (ADM) algorithm [28] or the inexact augmented Lagrange multipliers (IALM) algorithm [26].
2.2. Denoising Method
In this paper, a data denoising method guided by RPCA is proposed. As analyzed above, TBM data denoising aims to reconstruct clean data from its noisy measurement , where is low rank and the noise is sparse. In practice, the sparsity of noise cannot be fully guaranteed, due to the complexity of the noise sources in the TBM operation data. Moreover, the nuclear norm minimization (NNM)-being a low-rank matrix treats different rank components equally, which may result in severe shrinkage of the underlying information [29]. Hence, we introduce a weighted nuclear norm, which assigns different weights to different singular values, to regularize the . Thus, we can reformulate the objective function (2) as:
where is the weighted nuclear norm defined as [30], is the i-th weight assigned to . In Equation (3), different singular values are differently in the weighted nuclear norm, which is very beneficial to reduce the influence of singular values in the process of nuclear norm approximation of matrix rank.
However, during noise removal, the stability and sparsity of the model solution cannot be guaranteed [30]. As we know, the condition number is an effective measure of the stability of a linear system. From an optimization point of view, the Forbenius norm is conducive to dealing with the problem of matrix inversion when it is ill-conditioned. Thus, we introduce the Forbenius norm constraint on the , through which we force the stability of the matrix to be restored. Then, the above optimization problem (3) can be re-described as:
where is a regularization parameter and it is used to adjust the role of in the denoising model.
2.3. Optimization and Algorithm
In this section, we provide a detailed description of solving optimization problem (4). In the present paper, the inexact augmented Lagrange multiplier (IALM) [26] technique is used to solve the optimization problem (4). For further optimization, we first need to determine the value of weight . According to the literature [31], the weighted term should be inversely proportional to the weighted term. The algorithm steps of weight updating is shown in Algorithm 1.
| Algorithm 1 Algorithm for update weight |
| Input: Initial and and and maximum number of . |
| Initialize: , |
| while not reach do |
|
|
| end while if the maximum number of has been reached. |
| Output: |
Then, we write its IALM form as follows:
where is the Lagrange multiplier matrix, and is the penalty parameter. We introduce an auxiliary variable and relax (5) into the following problem:
where and . To facilitate the optimization, the optimization problem (6) can be rewritten as:
For each of the five matrices , , , and to be solved in problem (7), the cost function is convex with respect to one and fixed others. We use an alternating minimization strategy to solve the problem (7).
- (1)
- Updating
When we update matrix , we fix , , and . Thus, the problem is reduced to:
Obviously, this is a typical minimization problem which can effectively be solved by the iterative shrinkage algorithm (ISA) [32] or the fast iterative shrinkage thresholding (FIST) [33]. By introducing the shrinkage operator [34], the solution is:
- (2)
- Updating
Similarly, when we update , we assume that , , and are all fixed. So (7) can be reformulated as:
which is an ordinary least squares problem, we can obtain the following closed-form solution:
- (3)
- Updating
To update , we keep the other variables fixed. By removing irrelevant items from the objective function (7), can be obtained by solving:
Problem (12) is a weighted nuclear norm minimization that can be found using the method developed in [35]. By introducing the singular value thresholding [36], and the solution is:
- (4)
- Updating and
Similarly, fixing other variables, the Lagrange multiplier matrices and can be updated by solving:
We have closed-form solutions:
A detailed optimization produce of problem (7) is provided in Algorithm 2.
| Algorithm 2 Data Denoising Algorithm |
| Input: Initial and parameter . |
| Initialize: , , |
| while not converged do |
|
|
|
|
| end while |
| Output: and |
A detailed flowchart of the proposed denoising method is described in Figure 1.
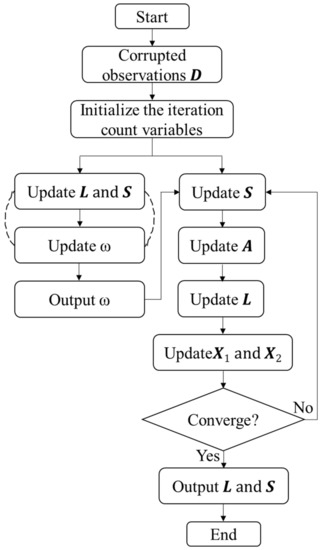
Figure 1.
Flowchart of the proposed denoising method.
3. Engineering Application on the Operation Data Analysis of TBM
3.1. Project Review
In this subsection, the proposed method is applied to denoising a real operation dataset from a TBM. The TBM operational data used for analysis in this study belong to a tunnel in Shenzhen, China (as shown in Figure 2). The length of the main tunnel is 2000 m and its diameter is 6.4 m. The ground surface elevation ranges from 0.2–5.8 m, and the depth of the tunnel floor from the ground surface ranges from 11.8–25.4 m. From the ground surface to the tunnel floor, various geological layers, such as clay, sand, and rock, are unevenly distributed, as shown in Figure 3. During the TBM excavation process, an earth pressure balance (EPB) shield TBM is used, as show in Figure 4. The basic equipment parameters are listed in Table 1. This TBM system consists of a cutterhead, chamber, screw conveyor, tail skin and other auxiliary subsystems, which have a diameter of 6.2 m and a total mass of over 500,000 kg. During the tunneling process, the operational and state data of the TBM was recorded by a PLC, which was further read by an industrial computer at regular intervals and stored in the database. Thus, the fresh data in the database are added to in batches during the tunneling process. The collected operation dataset represents the operational information and status parameters along the length of tunnel, which contains about 53 attributes that were continuously measured with a frequency of 1 Hz. Some key attributes are listed in Abbreviations. In the process of dynamic cutterhead torque prediction, the data come in batches. As can be seen from Figure 5, the tunneling data contain extremely large values and extremely small values far from the general level of numerical values. The data acquisition process of TBM is inevitably corrupted by background noise and interference induced by the measuring system. The raw data must be denoised. In addition, the geological properties in tunnels are greatly different from each other, which results in considerable variation in the TBM operating state during tunneling. Two operational datasets of this tunnel are used to validate the denoising algorithm, in which the geological conditions are unlabeled and unknown.
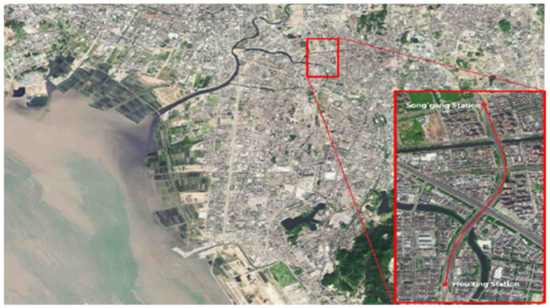
Figure 2.
Schematic diagram of research area.
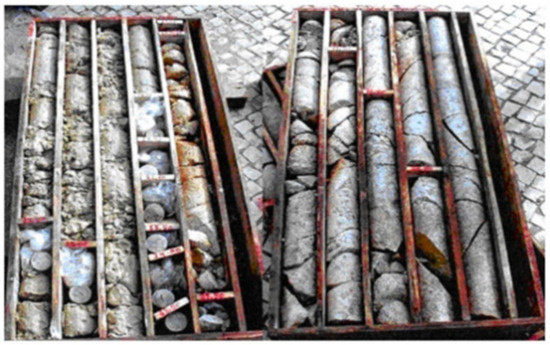
Figure 3.
Geological sampling results of the tunnel.
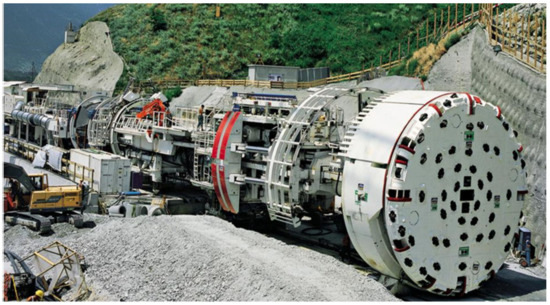
Figure 4.
The earth pressure balance shield TBM used.

Table 1.
Basic parameters of the TBM used.
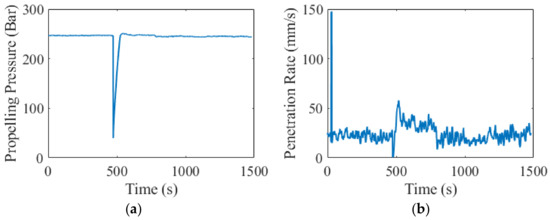
Figure 5.
Some attributes with outliers: (a) propelling pressure and (b) penetration rate.
3.2. Datasets and Experimental Setup
Two datasets of sequence data are used to evaluate the effectiveness of the proposed denoising approach. Some attributes whose values are constant or barely changing should be eliminated first. Then, we eliminated the attributes which are detected independently and have no correlation like temperature with other attributes with the assistance of TBM operators and managers. The two selected datasets have different durations and contain different numbers of attributes, and the details of datasets used in the experiments are described in Table 2.
Table 2.
Details of datasets used in the experiments.
The proposed approach is compared with other denoising methods to prove its effectiveness. These competing methods include hard threshold (HT) denoising [9], soft threshold (ST) denoising [10], and variational mode decomposition (VMD) denoising [37]. The rate mean-square error (RMSE) and mean absolute error (MAE) are used to quantitatively evaluate the quality of a denoised result. The MSE equation is defined as:
where represents the desired output corresponding to the input, represents the value obtained by the denoising approach, and represents the number of samples.
The MAE is defined as:
The lower the MSE and the MAE are, the better the quality of the denoising validity is.
The FCM algorithm is applied to partition original data and denoised data. The original parameter settings of FCM are preferred. In this paper, the clustering performance is evaluated in terms of the partition coefficient (PC) [38,39,40] and partition entropy (PE) [41,42]. The partition coefficient is calculated as follows:
The higher the PC is, the better the quality of the cluster validity is.
The partition entropy is defined by:
The lower the PE is, the better the quality of the cluster validity is.
The numerical experiments were performed on a computer with an Intel Core i7-10700 CPU at 3.8 GHz, 32 G RAM.
3.3. Data Denoising Results and Discussion
To examine the denoising performance of our approach with published approaches, we run experiments using three typical schemes, and compare the visual effects and objective evaluations. The wavelet basis function applied in HT denoising and ST denoising is Daubechies 6 (Db6) which comes from the Daubechies wavelet family. Since the wavelet transform has some limitations in the denoising of high-dimensional data, and VMD can only decompose one-dimensional data at one time, we analyze the penetration rate of dataset 1 and the rotation speed of the cutterhead of dataset 2. The penetration rate (V) and rotation speed of the cutterhead (RC) are both important reference attributes for TBM designers and operators in design, analysis, and control of TBM.
For visual comparison, the real values and denoised values with these models are provided in Figure 6 and Figure 7. It can be seen that the HT method and ST method cannot eliminate outliers, which is not conducive to subsequent data analysis. We also tested other wavelet basis functions, and most of them failed to eliminate outliers. The ST method can eliminate noise more precisely than the HT method and avoid local jitter after denoising. Both the VMD method and the proposed method can reduce the influence of outliers on the dataset. Moreover, due to the proposed method considering the correlation between other attributes, it has a reasonable approximation to the outliers. Although the denoising data obtained by VMD looks smoother than other methods, some local trends have changed, as can be seen from two figures. The tunneling data are characterized by weak periodicity and the change in local trend is very unfavorable.
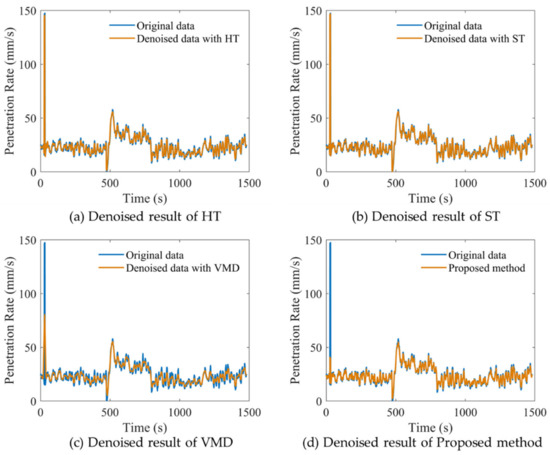
Figure 6.
Comparisons between real and denoised data for dataset 1.
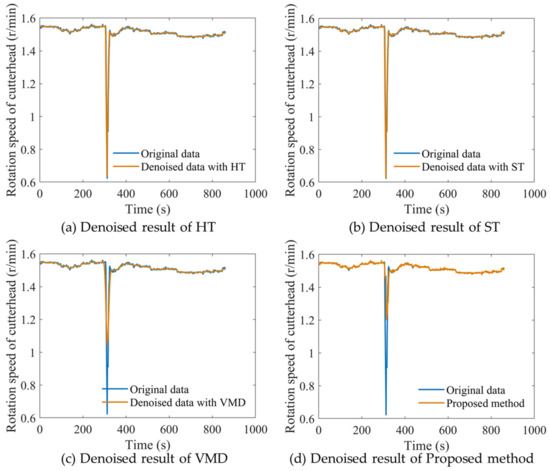
Figure 7.
Comparisons between real and denoised data for dataset 2.
The quantitative results of the RMSE and MAE for different denoising results are listed in Table 3. The part of the sequence containing outliers was deleted to evaluate the denoising performance. Of course, this result does not mean that the performance of other denoising methods is not good, but they may not be suitable for data denoising of TBM data.
Table 3.
Denoising performance comparison of different methods.
In fact, our method can denoise data for all attributes in the dataset. In order to further demonstrate the denoising performance of the proposed method, the real values and denoised values of other attributes are provided in Figure 8.
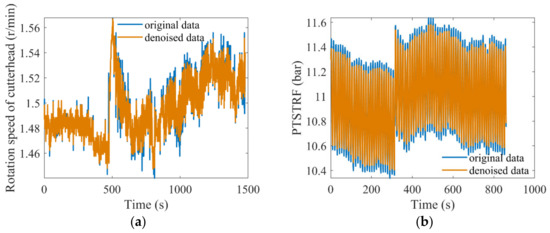
Figure 8.
Denoising results of proposed method: (a) rotation speed of cutterhead and (b) pressure of tail skin system at top right front.
3.4. Data Clustering Results and Discussion
In real world applications, in-suit engineering data contain noise and outliers, and that are disturbances for clustering methods. As a well-known method, FCM is applied to cluster data in unsupervised learning. In this framework, the distance metric is utilized, but the existence of outliers has a bad effect on the division of clusters. The proposed denoising method can provide a reasonable approximation to outliers by considering the relationship between different attributes. In order to verify data denoising that can improve clustering accuracy, clustering experiments are carried out on the original data set and the denoised data set, respectively. Since the clear cluster number of the dataset was unknown, five groups of experiments with cluster numbers of 4, 5, 6, 7, 8 were carried out, respectively.
The clustering comparisons of TBM operational data before and after the proposed approach denoising is shown in Table 4 and Table 5. It can be seen that the clustering performance of the denoising data is obviously better than that of the original data, which indicates the effectiveness of data denoising for helping the TBM data clustering task. For dataset 1, the mean PC and PE values of no-denoising data are 0.882 and 0.366. After data denoising using the proposed method, the mean PC value increases to 0.890, and the mean PE value drops to 0.341, respectively. For dataset 2, the mean PC value increased from 0.836 to 0.864, and the mean PE value decreased from 0.456 to 0.384. Moreover, it is observed that all cluster validity indexes achieve the best results when the cluster is 4.
Table 4.
Clustering performance comparison of different datasets for Dataset 1.
Table 5.
Clustering performance comparison of different datasets for Dataset 2.
4. Conclusions
In this paper, a new denoising approach was proposed for TBM in mixed ground conditions. According to the results, it can be concluded that the improved LRMR model is effective in eliminating noise and outliers of TBM, and can improve the accuracy of data clustering. In fact, there are various kinds of noise in TBM operation data during the tunneling process, and some attributes of TBM operational data are highly correlated. It novel to attempt to eliminate the noise between shield data by considering the correlation between parameters. Rank minimization is a common method for exploring correlation, and our research is constructed under the RPCA framework. To overcome the difficulty that the sparsity of noise cannot be fully guaranteed, the weighted nuclear norm is utilized to improve the ability of the model in sparse decomposition. Besides this, we employ a Forbenius norm to improve the stability of model solutions. The proposed LRMR model is a jointly nonconvex problem, we introduce the IALM technique and an alternating minimization strategy to solve it. The existence of outliers and noise will affect the clustering accuracy because most clustering methods use distance to measure the relationship between different clusters. By comparing the clustering performance of original data and denoised data, the clustering accuracy of the denoised data is obviously improved. However, there still exist some issues we have not discussed. In future, it would be an interesting and helpful task to simultaneously achieve noise suppression and accurately cluster in noisy TBM data clustering.
Author Contributions
Conceptualization, Y.W.; methodology, Y.W.; software, Y.W.; validation, Y.W.; formal analysis, Y.W. and Y.P.; investigation, X.S.; resources, X.S. and W.S.; data curation, Y.P.; writing—original draft preparation, Y.W.; writing—review and editing, Y.W. and X.S.; visualization, Y.W. and Y.P.; supervision, X.S. and W.S.; project administration, X.S.; funding acquisition, X.S. All authors have read and agreed to the published version of the manuscript.
Funding
This research was funded by the National Key R&D Program of China (Grant No. 2018YFB1702502) and the National Natural Science Foundation of China (Grant No. 52075068).
Institutional Review Board Statement
Not applicable.
Informed Consent Statement
Not applicable.
Data Availability Statement
Not applicable.
Conflicts of Interest
The authors declare no conflict of interest.
Abbreviations
| Abbreviation | Attribute and Unit |
| RC | Rotation speed of cutterhead (r/min) |
| FP | Propelling pressure (bar) |
| FPA | Pressure of A group of hydraulic cylinders (bar) |
| FPB | Pressure of B group of hydraulic cylinders (bar) |
| FPC | Pressure of C group of hydraulic cylinders (bar) |
| FPD | Pressure of D group of hydraulic cylinders (bar) |
| PEB | Pressure of equipment bridge (bar) |
| PAS | Pressure of articulation system (bar) |
| PTSTRF | Pressure of tail skin system at top right front (bar) |
| PTSRF | Pressure of tail skin system at right front (bar) |
| PTSBRF | Pressure of tail skin system at bottom right front (bar) |
| PTSTLF | Pressure of tail skin system at top left front (bar) |
| PTSRB | Pressure of tail skin system at top right back (bar) |
| PTSBLF | Pressure of tail skin system at right front (bar) |
| PTSBRB | Pressure of tail skin system at bottom right back (bar) |
| PTSTLB | Pressure of tail skin system at top left back (bar) |
| PSCP | Pressure of screw conveyor pump (bar) |
| PCTL | Pressure of chamber at top left (bar) |
| PCT | Pressure of chamber at top (bar) |
| PCBL | Pressure of chamber at bottom left (bar) |
| PCTR | Pressure of chamber at top right (bar) |
| PB | Pressure of bentonite (bar) |
| GPTL | Grout pressure at top left (bar) |
| GPTR | Grout pressure at top right (bar) |
| GPBL | Grout pressure at bottom left (bar) |
| PTSLF | Pressure of tail skin system at left font (bar) |
| PTSBLF | Pressure of tail skin system at bottom left front (bar) |
| PTSLB | Pressure of tail skin system at left back (bar) |
| PTSBLB | Pressure of tail skin system at bottom left back (bar) |
| BPSS | Bentonite pressure of shield shell (bar) |
| PSCF | Pressure of screw conveyor at front (bar) |
| SA | Displacement of A group of thrust cylinders (mm) |
| SB | Displacement of B group of thrust cylinders (mm) |
| SC | Displacement of C group of thrust cylinders (mm) |
| SD | Displacement of D group of thrust cylinders (mm) |
| SATR | Displacement of articulated system at top right (mm) |
| SABR | Displacement of articulated system at bottom right (mm) |
| SATL | Displacement of articulated system at top left (mm) |
| SABL | Displacement of articulated system at bottom left (mm) |
| F | Thrust of cutterhead (kN) |
| V | Penetration rate (mm/s) |
References
- Pang, Y.; Shi, M.; Zhang, L.; Sun, W.; Song, X. A multivariate time series segmentation algorithm for analyzing the operating statuses of tunnel boring machines. Knowl.-Based Syst. 2022, 242, 108362. [Google Scholar] [CrossRef]
- Song, X.; Shi, M.; Wu, J.; Sun, W. A new fuzzy c-means clustering-based time series segmentation approach and its application on tunnel boring machine analysis. Mech. Syst. Signal. Process. 2019, 133, 106279. [Google Scholar] [CrossRef]
- Shi, M.; Zhang, T.; Zhang, L.; Sun, W.; Song, X. A fuzzy c-means algorithm based on the relationship among attributes of data and its application in tunnel boring machine. Knowl.-Based Syst. 2020, 191, 105229. [Google Scholar] [CrossRef]
- Oropeza, V.; Sacchi, M. Simultaneous seismic data denoising and reconstruction via multichannel singular spectrum analysis. Geophysics 2011, 76, 25–32. [Google Scholar] [CrossRef]
- Sendur, L.; Selesnick, I.W. Bivariate shrinkage functions for wavelet-based denoising exploiting interscale dependency. IEEE Trans. Signal Process. 2022, 50, 2744–2756. [Google Scholar] [CrossRef] [Green Version]
- He, Q.; Wang, X.; Zhou, Q. Vibration Sensor Data Denoising Using a Time-Frequency Manifold for Machinery Fault Diagnosis. Sensors 2013, 14, 382–402. [Google Scholar] [CrossRef] [Green Version]
- Zhang, M.; Gunturk, B.K. Multiresolution bilateral filtering for image denoising. IEEE Trans. Image Process. 2008, 17, 2324–2333. [Google Scholar] [CrossRef] [Green Version]
- Zheng, Y.; Fu, H.; Au, O.K.C.; Tai, C.L. Bilateral normal filtering for mesh denoising. IEEE Trans. Vis. Comput. Graph. 2010, 17, 1521–1530. [Google Scholar] [CrossRef]
- Zhang, S.; Zhang, H.; Liu, H. An improved EMD-based hard thresholding denoising algorithm. Comput. Meas. Control 2014, 22, 3659–3661. [Google Scholar]
- Donoho, D.L. De-noising by soft-thresholding. IEEE Trans. Inf. Theory 2002, 41, 613–627. [Google Scholar] [CrossRef] [Green Version]
- Huang, N.E.; Shen, Z.; Long, S.R.; Wu, M.C.; Snin, H.H.; Zheng, Q.; Yem, N.C.; Tung, C.C.; Liu, H.H. The empirical mode decomposition and the Hubert spectrum for nonlinear and non-stationary time series analysis. Proc. R. Soc. A Math. Phys. Eng. 1998, 454, 903–995. [Google Scholar] [CrossRef]
- Rilling, G.; Flandrin, P.; Goncalves, P. On empirical mode decomposition and its algorithms. IEEE-EURASIP Workshop Nonlinear Signal Image Process. 2003, 3, 8–11. [Google Scholar]
- Chen, T.; Ma, K.K.; Chen, L.H. Tri-state median filter for image denoising. IEEE Trans. Image Process. 1999, 8, 1834–1838. [Google Scholar] [CrossRef] [Green Version]
- Simon, D. Kalman filtering. Embed. Syst. Program. 2001, 14, 72–79. [Google Scholar]
- Kazubek, M. Wavelet domain image denoising by thresholding and Wiener filtering. IEEE Signal Proc. Lett. 2003, 10, 324–326. [Google Scholar] [CrossRef]
- Zhang, Q.; Liu, Z.; Tan, J. Prediction of geological conditions for a tunnel boring machine using big operational data. Autom. Constr. 2019, 100, 73–83. [Google Scholar] [CrossRef]
- Zhou, C.; Xu, H.; Ding, L.; Wei, L.; Zhou, Y. Dynamic prediction for attitude and position in shield tunneling: A deep learning method. Autom. Constr. 2019, 105, 102840. [Google Scholar] [CrossRef]
- Zhang, S.; Li, Y. Seismic exploration desert noise suppression based on complete ensemble empirical mode decomposition with adaptive noise. J. Appl. Geophys. 2020, 180, 104055. [Google Scholar] [CrossRef]
- Yaslan, Y.; Bican, B. Empirical mode decomposition based denoising method with support vector regression for time series prediction: A case study for electricity load forecasting. Meas. J. Int. Meas. Confed. 2017, 103, 52–61. [Google Scholar] [CrossRef]
- Zhang, S.; Liu, K.; Liu, Q.; Zhang, C.; Zhang, Q.; Nan, Y. Tide variation monitoring based improved GNSS-MR by empirical mode decomposition. Adv. Space Res. 2019, 63, 3333–3345. [Google Scholar] [CrossRef]
- Li, Y.; Xu, C.; Yi, L.; Fang, R. A data-driven approach for denoising GNSS position time series. J. Geod. 2018, 92, 905–922. [Google Scholar] [CrossRef]
- Li, H.; Wang, Y.; Yang, Z.; Wang, R.; Li, X.; Tao, D. Discriminative dictionary learning-based multiple component decomposition for detail-preserving noisy image fusion. IEEE Trans. Instrum. Meas. 2019, 69, 1082–1102. [Google Scholar] [CrossRef]
- Zhao, Y.; Yang, J. Hyperspectral image denoising via sparse representation and low-rank constraint. IEEE Trans. Geosci. Remote Sens. 2015, 53, 296–308. [Google Scholar] [CrossRef]
- Gomes, P.R.B.; da Costa, J.P.C.L.; de Almeida, A.L.F.; De Sousa, R.T. Tensor-based multiple denoising via successive spatial smoothing, low-rank approximation and reconstruction for r-d sensor array processing. Digit Signal Process. 2019, 89, 1–7. [Google Scholar] [CrossRef]
- Candes, E.; Li, X.; Ma, Y.; Wright, J. Robust principal component analysis? J. ACM 2011, 58, 1–37. [Google Scholar] [CrossRef]
- Peng, Y.; Ganesh, A.; Wright, J. RASL: Robust alignment by sparse and low-rank decomposition for linearly correlated images. IEEE Trans. Pattern Anal. Mach. Intell. 2012, 34, 2233–2246. [Google Scholar] [CrossRef]
- Bezdek, J.C. Objective function clustering. In Pattern Recognition with Fuzzy Objective Function Algorithms; Plenum Press: New York, NY, USA, 1981. [Google Scholar]
- Lin, Z.; Chen, M.; Ma, Y. The augmented Lagrange multiplier method for exact recovery of corrupted low-rank matrices. Technical Report UILU-ENG-09-2215, UIUC. arXiv 2009, arXiv:1009.5055. [Google Scholar]
- Gu, S.; Zhang, L.; Zuo, W.; Feng, X. Weighted nuclear norm minimization with application to image denoising. In Proceedings of the 2014 IEEE Conference on Computer Vision and Pattern Recognition, Columbus, OH, USA, 23–28 June 2014; pp. 2862–2869. [Google Scholar]
- Zou, H.; Zhang, H. On the adaptive elastic-net with a diverging number of parameters. Ann. Stat. 2009, 37, 1733–1751. [Google Scholar] [CrossRef] [Green Version]
- Afonso, M.V.; Bioucas-Dias, J.M.; Figueriredo, M. Fast image recovery using variable splitting and constrained optimization. IEEE Trans. Image Process. 2010, 19, 2345–2356. [Google Scholar] [CrossRef] [PubMed] [Green Version]
- Daubechies, I.; Defrise, M.; De, M. An iterative thresholding algorithm for linear inverse problems with a sparsity constraint. Commun. Pure Appl. Math. 2004, 57, 1413–1457. [Google Scholar] [CrossRef] [Green Version]
- Beck, A.; Teboulle, M. A fast iterative shrinkage-thresholding algorithm for linear inverse problems. SIAM J. Imaging Sci. 2009, 2, 183–202. [Google Scholar] [CrossRef] [Green Version]
- Zhuang, L.; Gao, H.; Lin, Z.; Ma, Y.; Zhang, X.; Yu, N. Non-negative low rank and sparse graph for semi-supervised learning. In Proceedings of the 2012 IEEE Conference on Computer Vision and Pattern Recognition, Providence, RI, USA, 16–21 June 2012; pp. 2328–2335. [Google Scholar]
- Zhang, Z.; Ganesh, A.; Liang, X.; Yi, M. TILT: Transform-invariant low-rank textures. Int. J. Comput. Vision 2012, 99, 1–24. [Google Scholar] [CrossRef]
- Cai, J.F.; Candès, E.J.; Shen, Z. A singular value thresh-olding algorithm for matrix completion. SIAM J. Optimiz. 2010, 20, 1956–1982. [Google Scholar] [CrossRef]
- Dragomiretskiy, K.; Zosso, D. Variational Mode Decomposition. IEEE Trans. Signal. Process. 2013, 62, 531–544. [Google Scholar] [CrossRef]
- Hathaway, R.J.; Bezdek, V. Optimization of clustering criteria by reformulation. IEEE Trans. Fuzzy Syst. 1995, 3, 241–245. [Google Scholar] [CrossRef]
- Pratama, M.; Lu, J.; Zhang, G. Evolving type-2 fuzzy classifier. IEEE Trans. Fuzzy Syst. 2016, 24, 574–589. [Google Scholar] [CrossRef]
- Trauwaert, E. On the meaning of dunns partition coefficient for fuzzy clusters. Fuzzy Sets Syst. 1988, 25, 217–242. [Google Scholar] [CrossRef]
- Bezdek, J.C. Cluster validity with fuzzy sets. J. Cybernet. 1974, 3, 58–73. [Google Scholar] [CrossRef]
- Wu, K.L.; Yang, M.S. A cluster validity index for fuzzy clustering. Pattern Recogn. Lett. 2005, 26, 1275–1291. [Google Scholar] [CrossRef]
Publisher’s Note: MDPI stays neutral with regard to jurisdictional claims in published maps and institutional affiliations. |
© 2022 by the authors. Licensee MDPI, Basel, Switzerland. This article is an open access article distributed under the terms and conditions of the Creative Commons Attribution (CC BY) license (https://creativecommons.org/licenses/by/4.0/).