
Restructuring of the Coal Mining Industry and the Challenges of Energy Transition in Poland (1990–2020)


Abstract
1. Introduction
1.1. Restructuring and Structural Changes
1.2. Restructuring of Coal Mining in Europe
1.3. Poland’s Energy Transition and Its Implications
- the process of adapting Polish law to the legislation of the European Union as part of pre-accession negotiations (since 1998) [55],
1.4. Identified Research Deficits
1.5. Research Problem, Goals and Properties of Research
- Measure the impact of key factors on the financial condition of coal mining companies,
- Aggregate the partial determinants of this financial condition as a basis for assessing the financial risk to a going concern (barometer),
- Gauge the impact of restructuring programs on organisational and structural changes in coal mining companies,
- Identify and measure the interdependence between structural changes and the effectiveness of coal mining companies’ operations,
- Identify and measure the impact on production volume of changes in the structure of energy generation.
2. Materials and Methods
3. Results
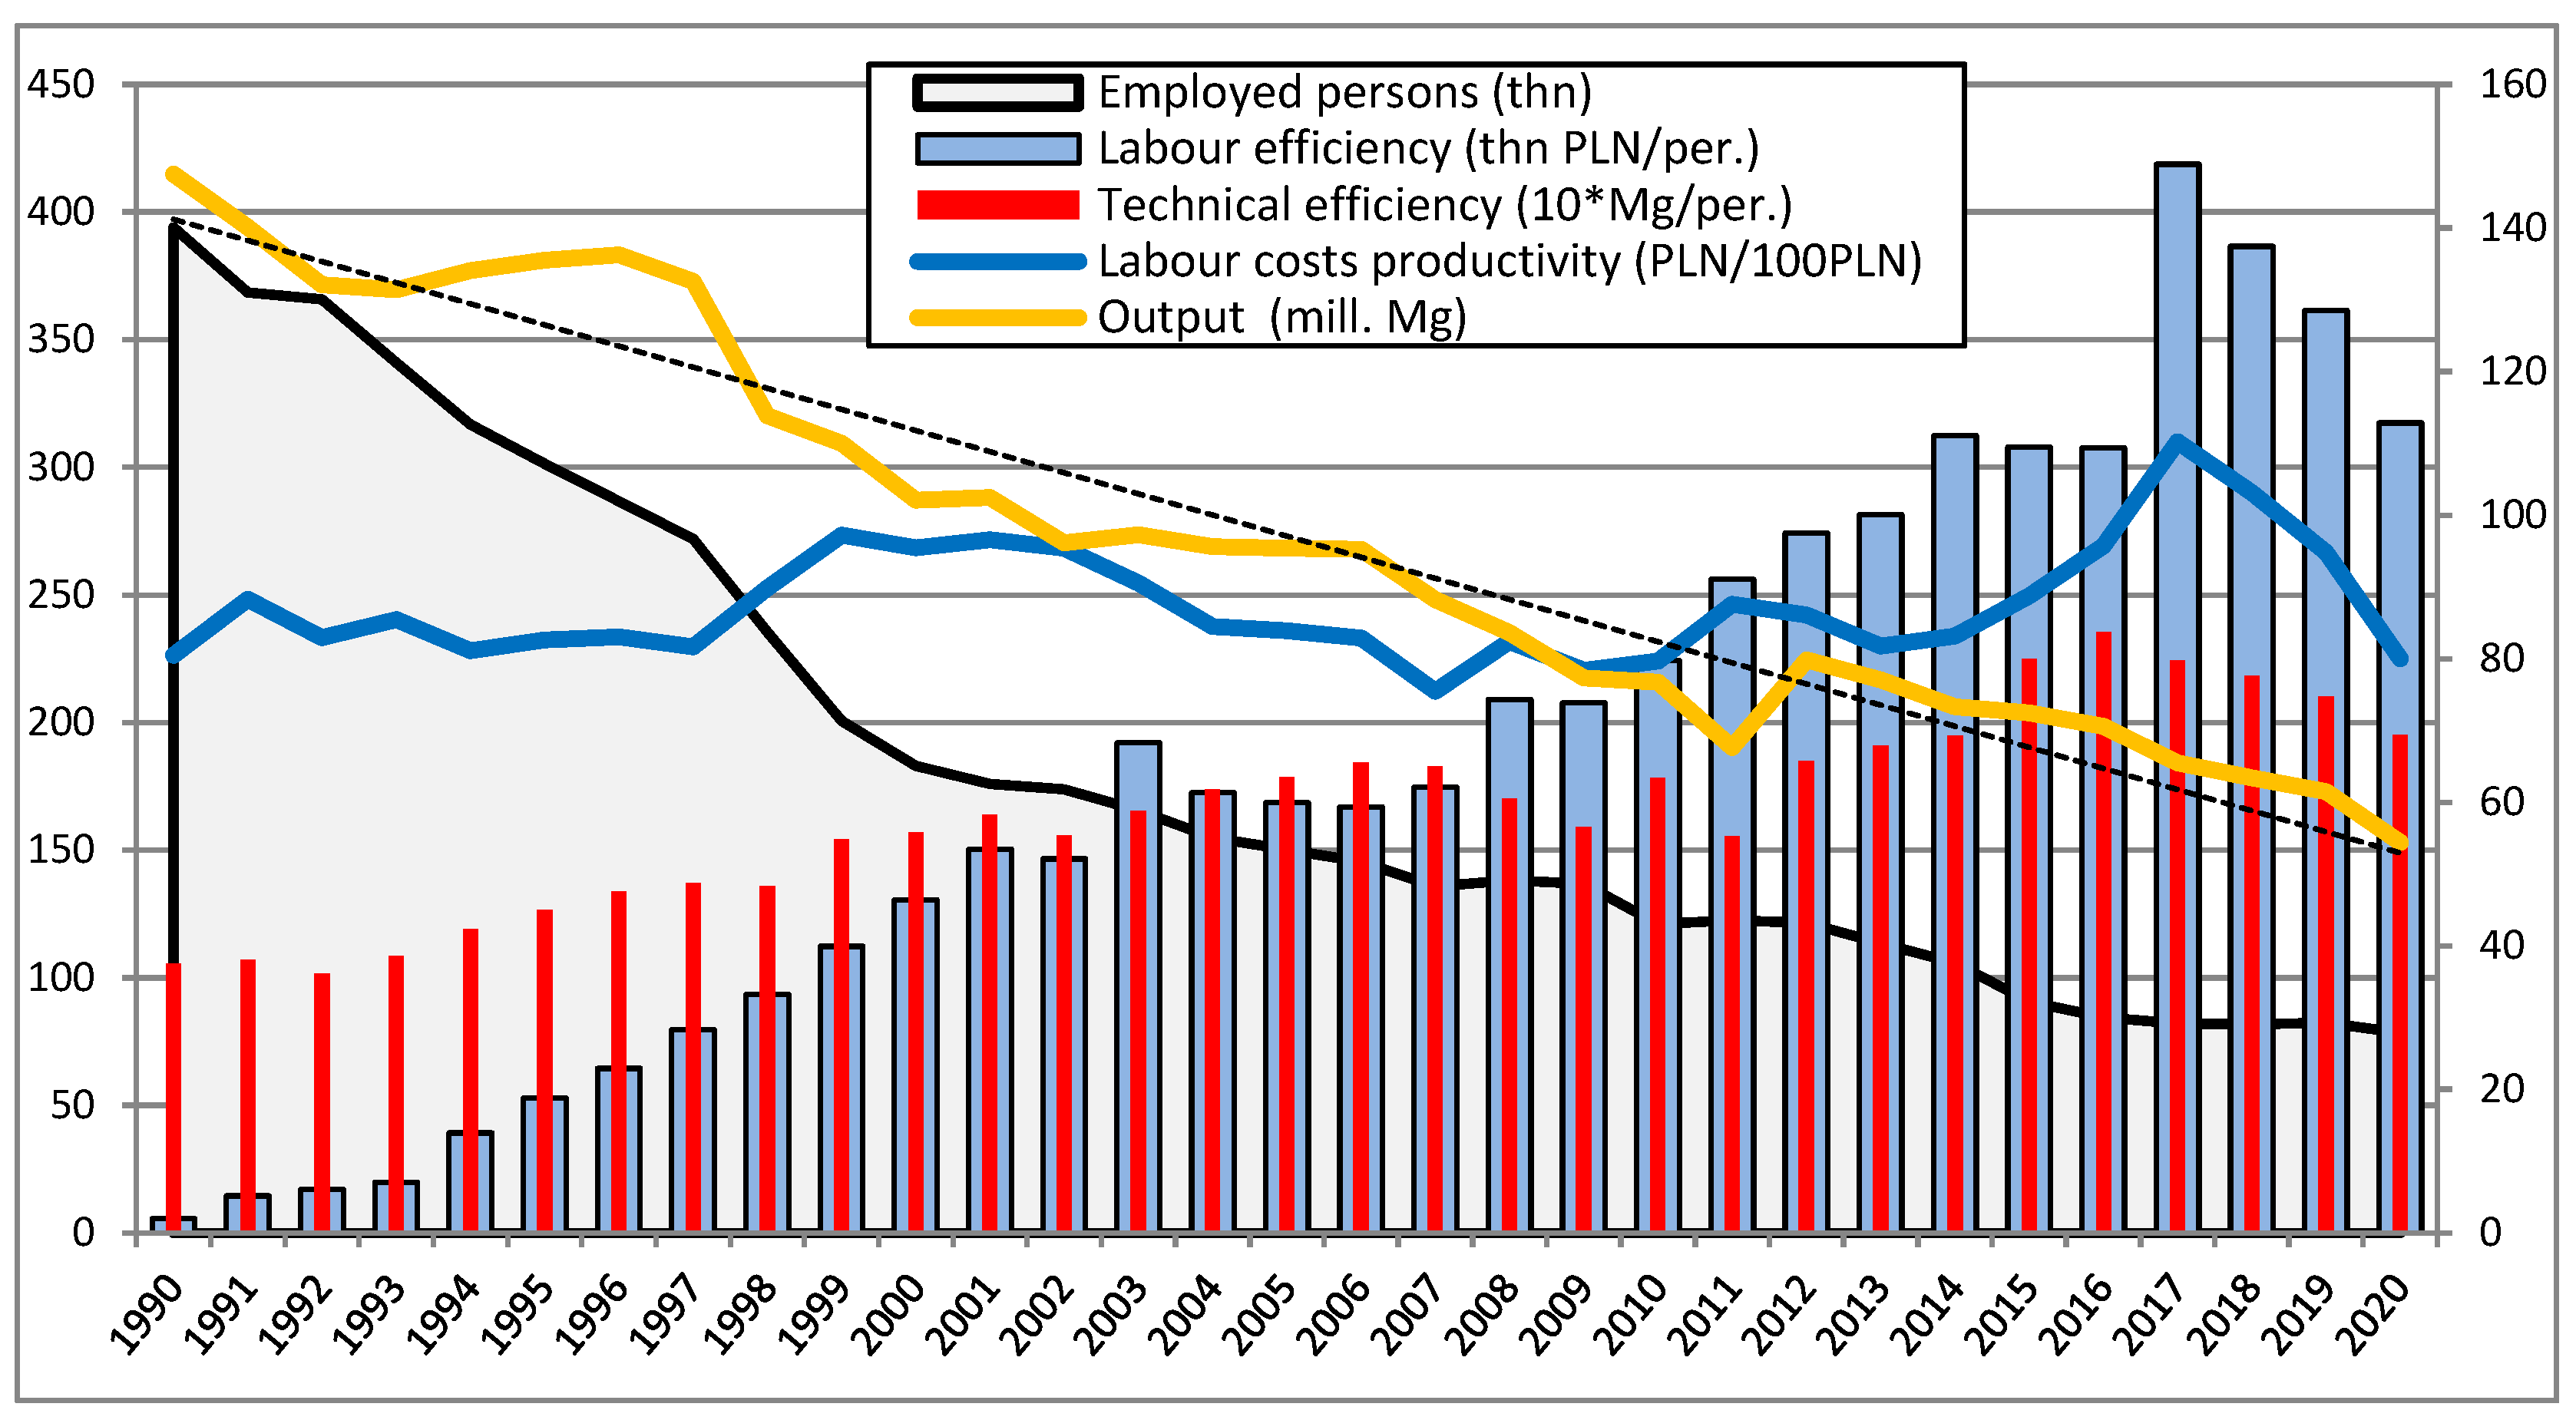
3.1. Extent to Which the Goals of Coal Mining Restructuring Programs in Poland Have Been Achieved
- delays in organisational changes, in particular in the expected closure of mines in the first years of implementing such changes (1990–1994),
- generous redundancy packages, in particular in the form of financial incentives, which encouraged miners to change profession or take advantage of special mining leaves,
- an inadequate workforce due to an aging mining population and earlier job cuts,
- no investment-intensive policy aimed at upgrading machinery, supporting manual labour and promoting technical efficiency.
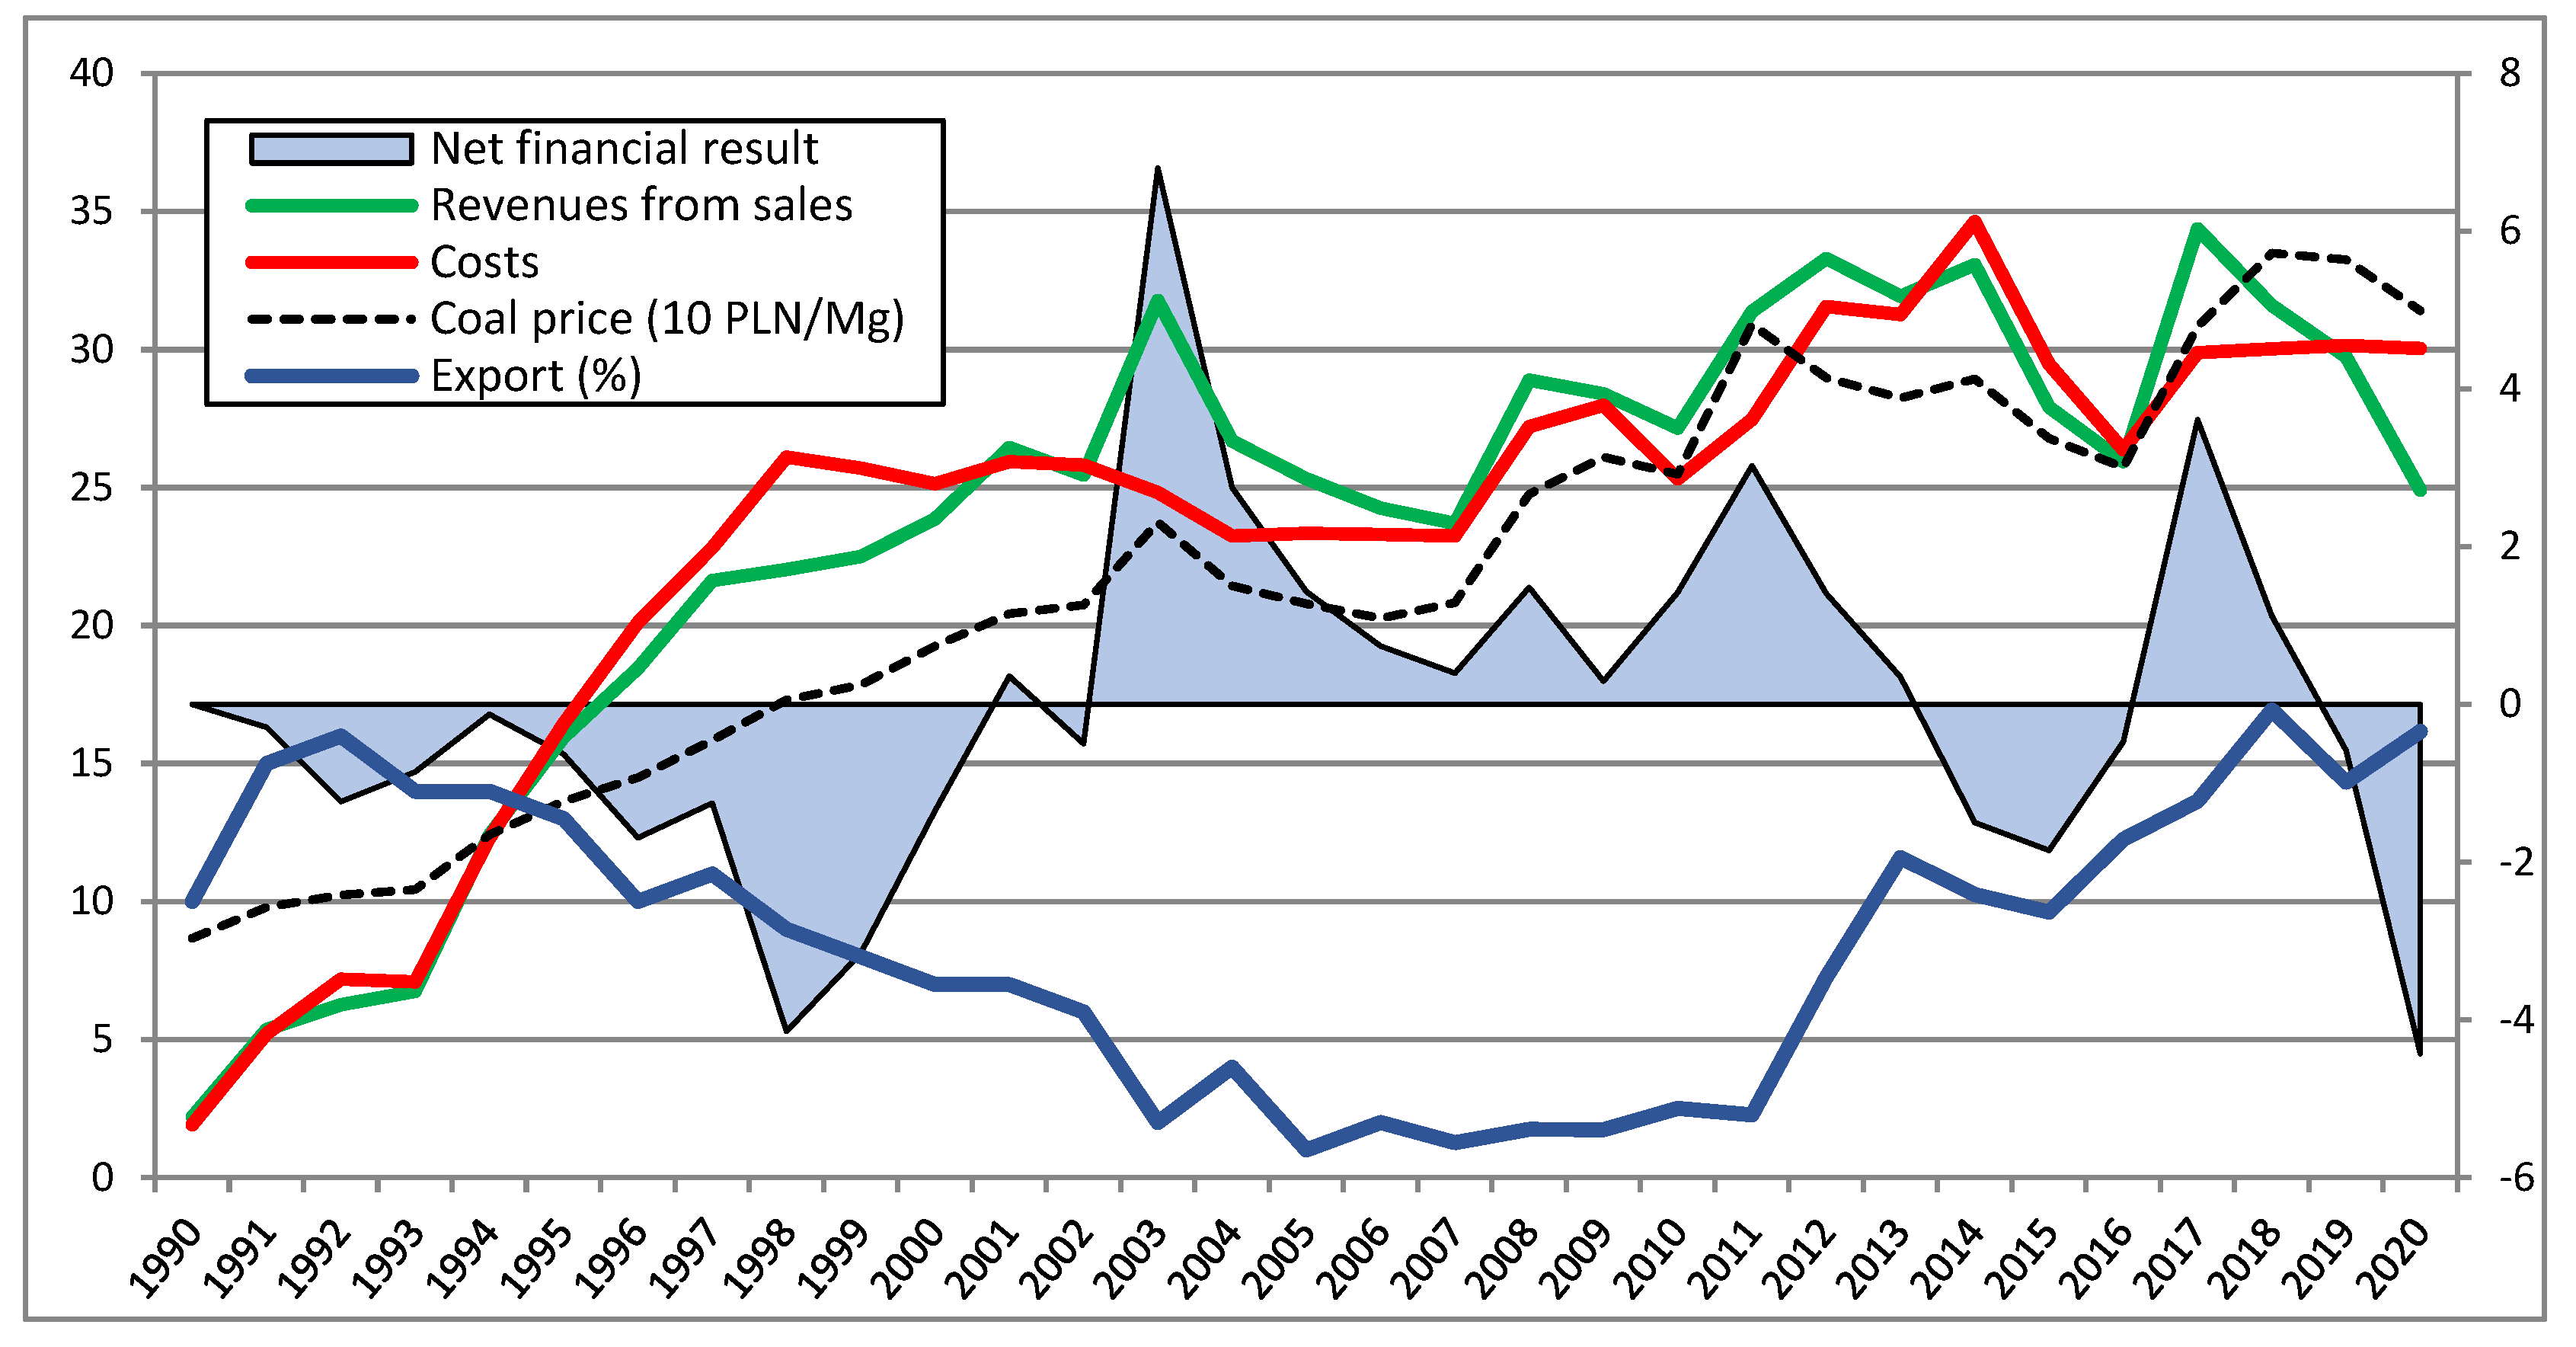
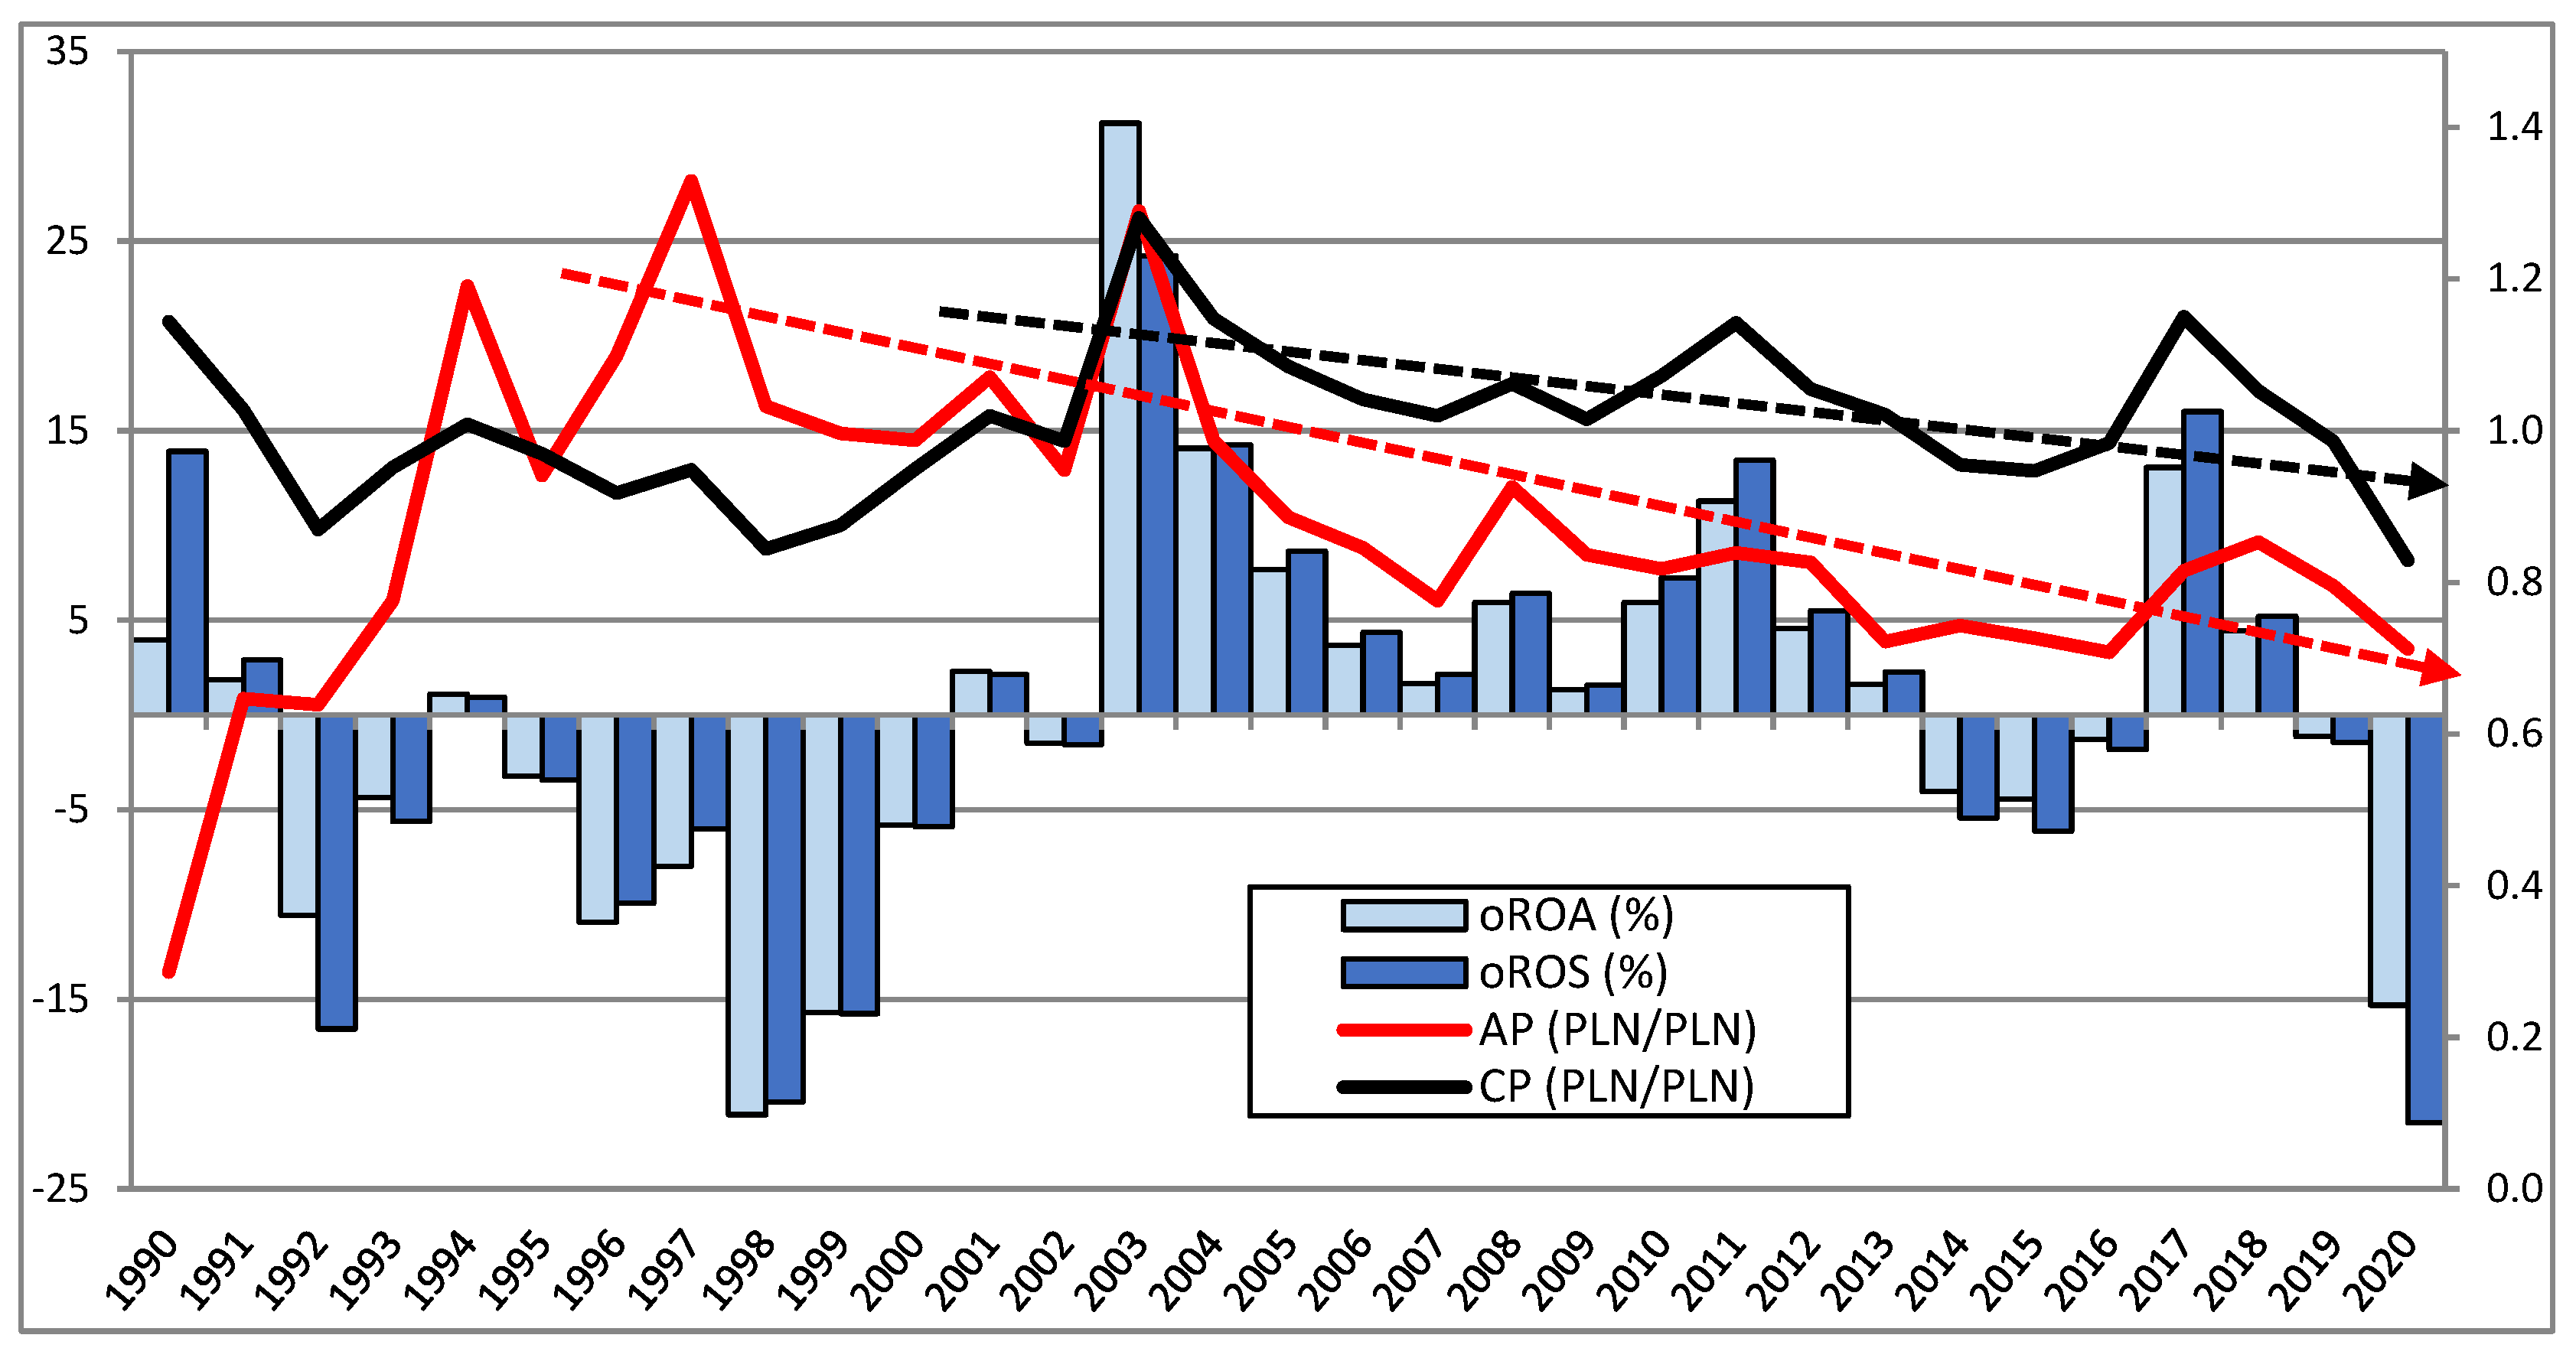
3.2. Assessment of the Results of Coal Mining Enterprises
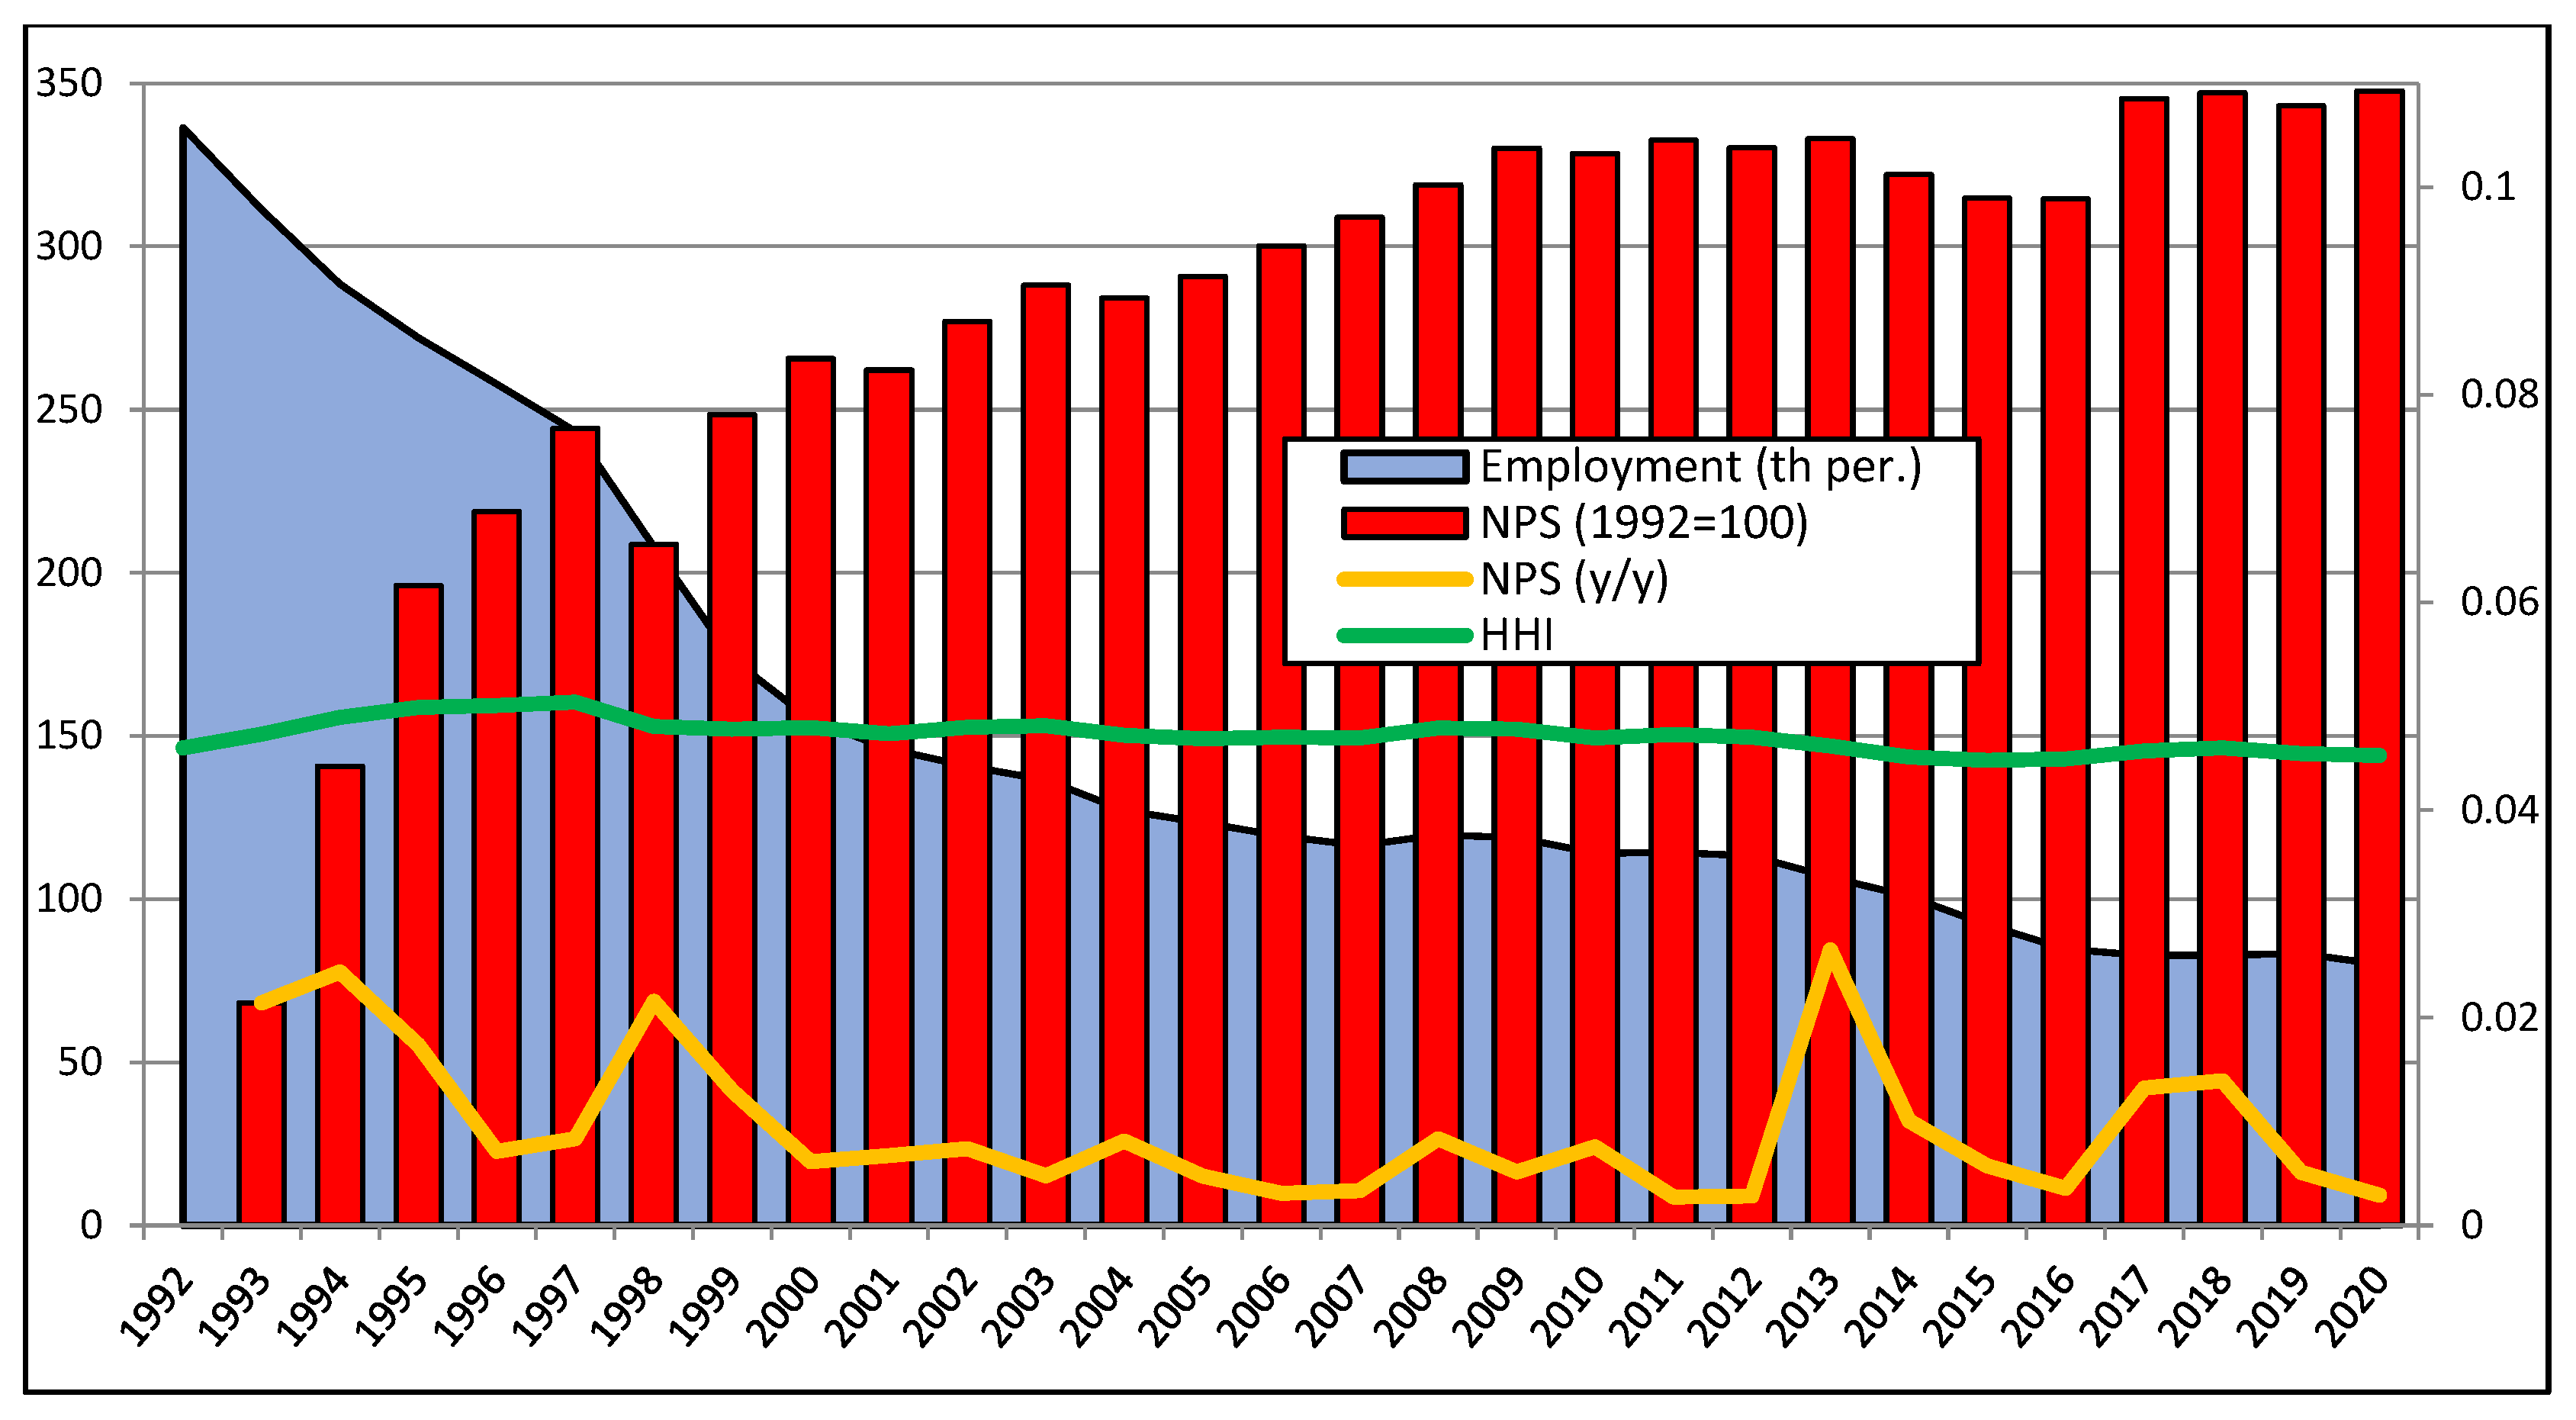
3.3. Assessment of the Structural Changes of Coal Mining Enterprises
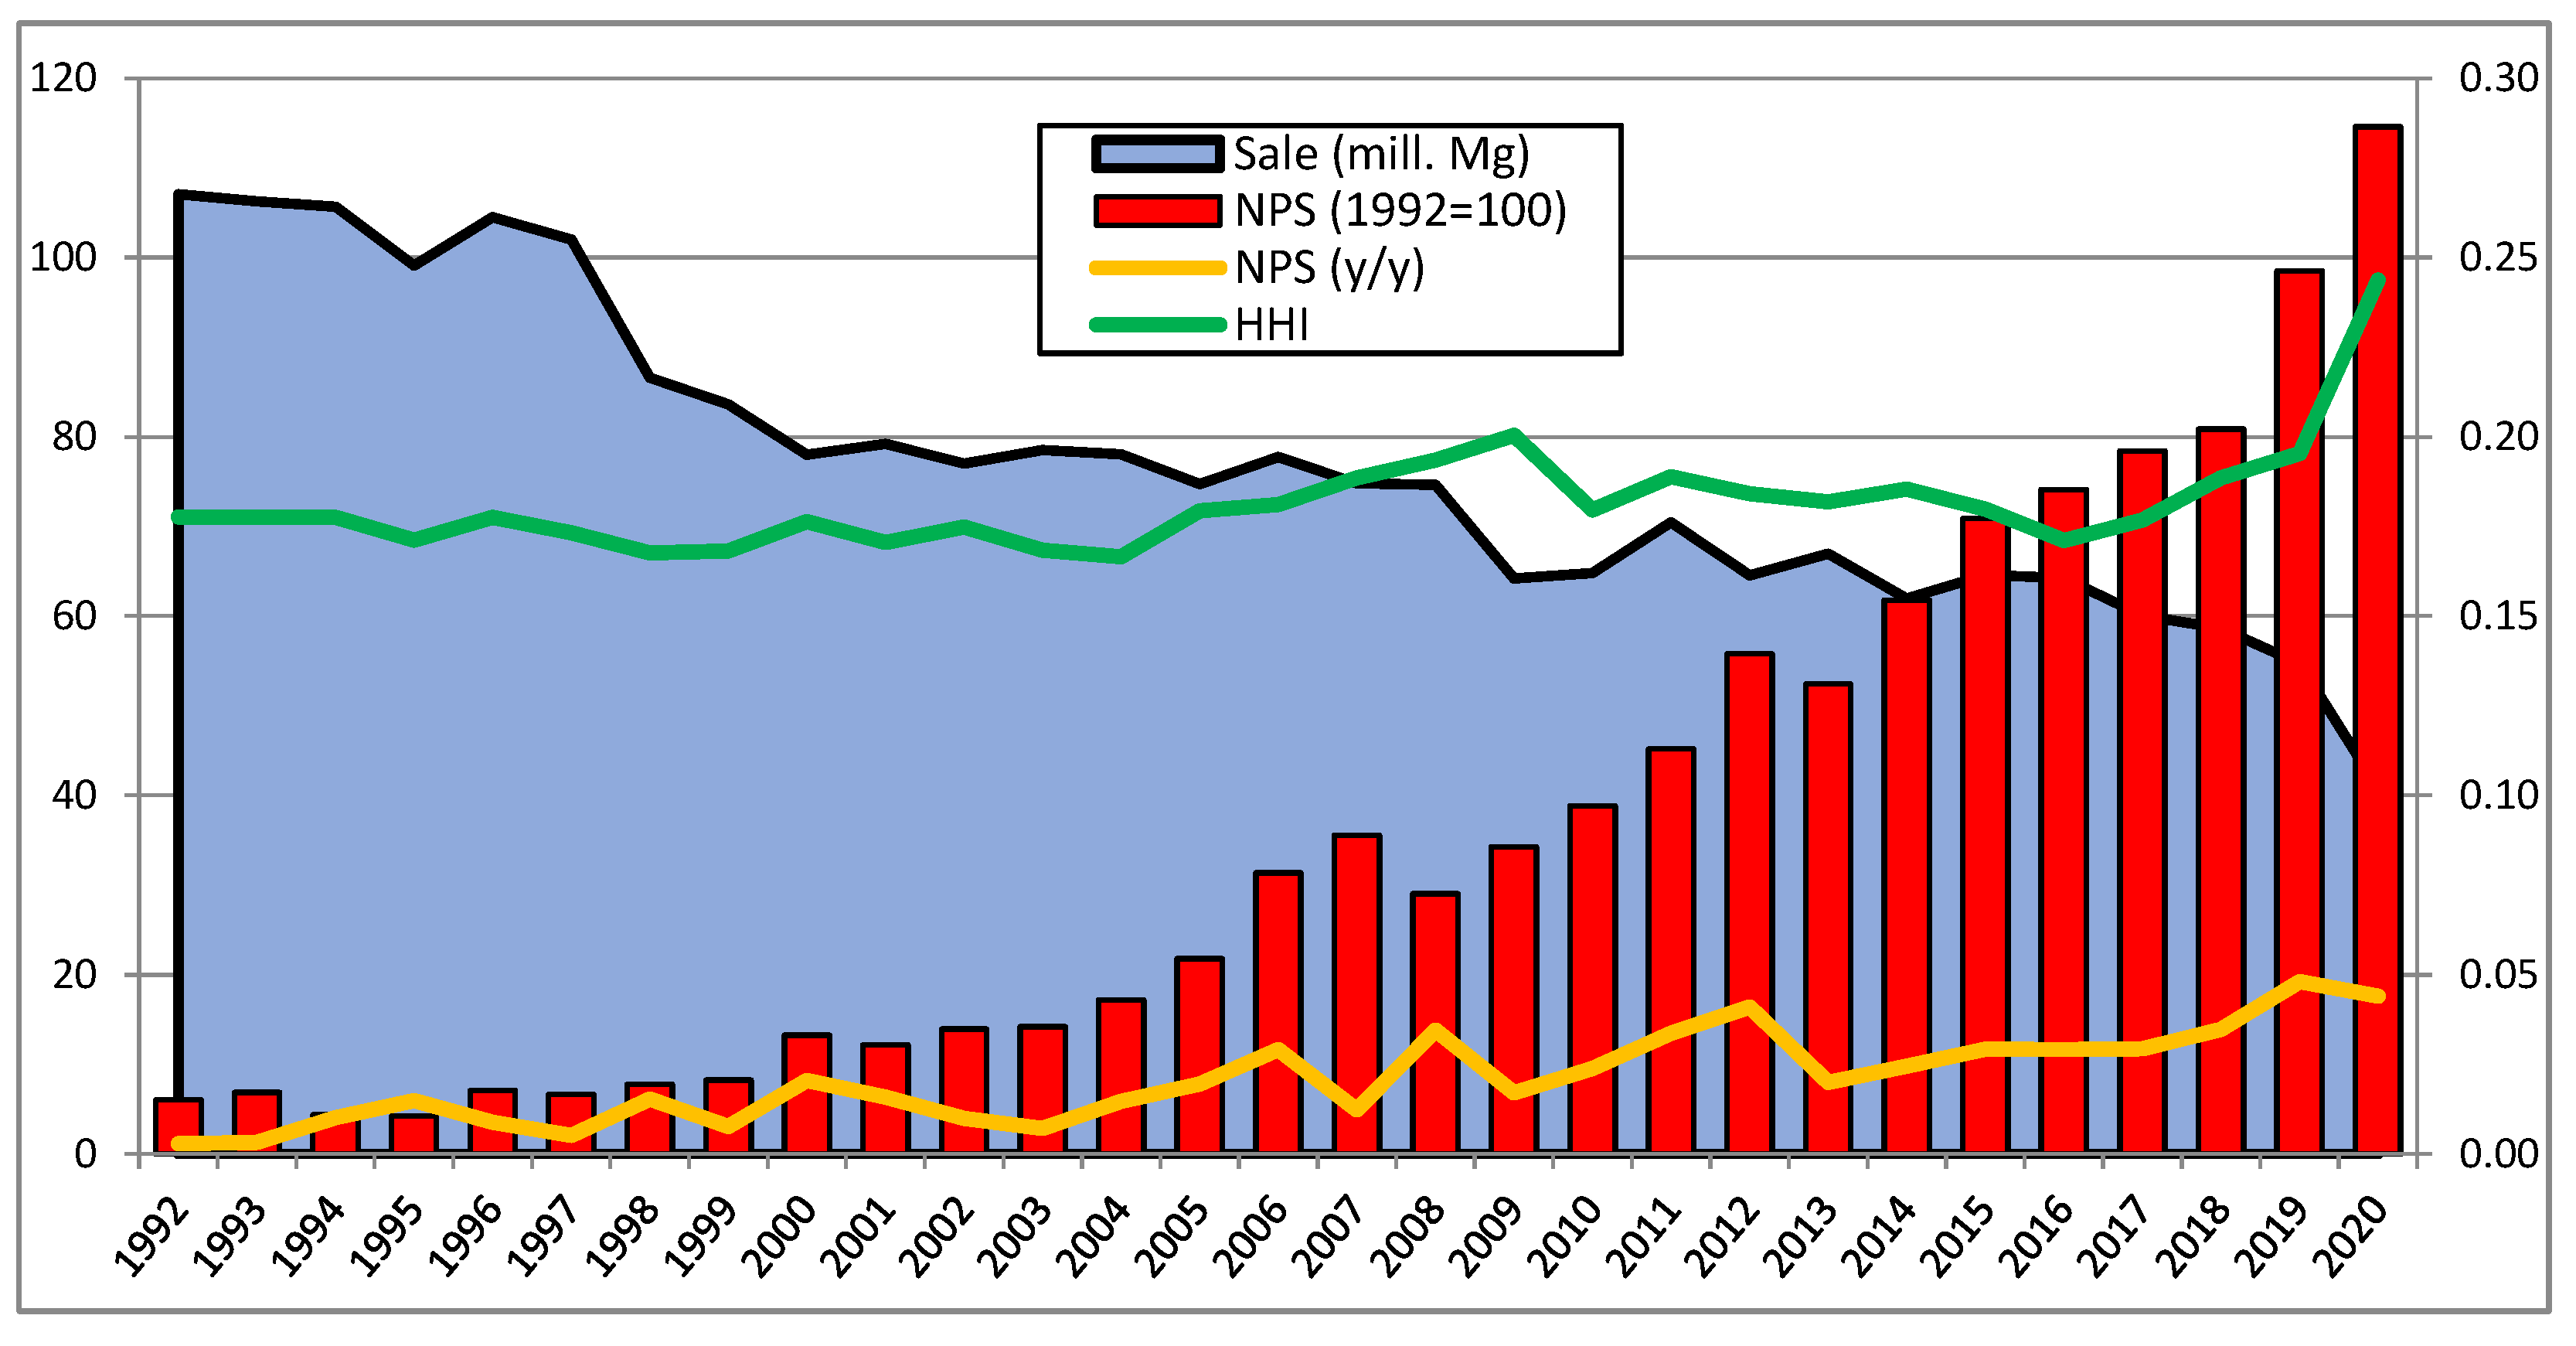
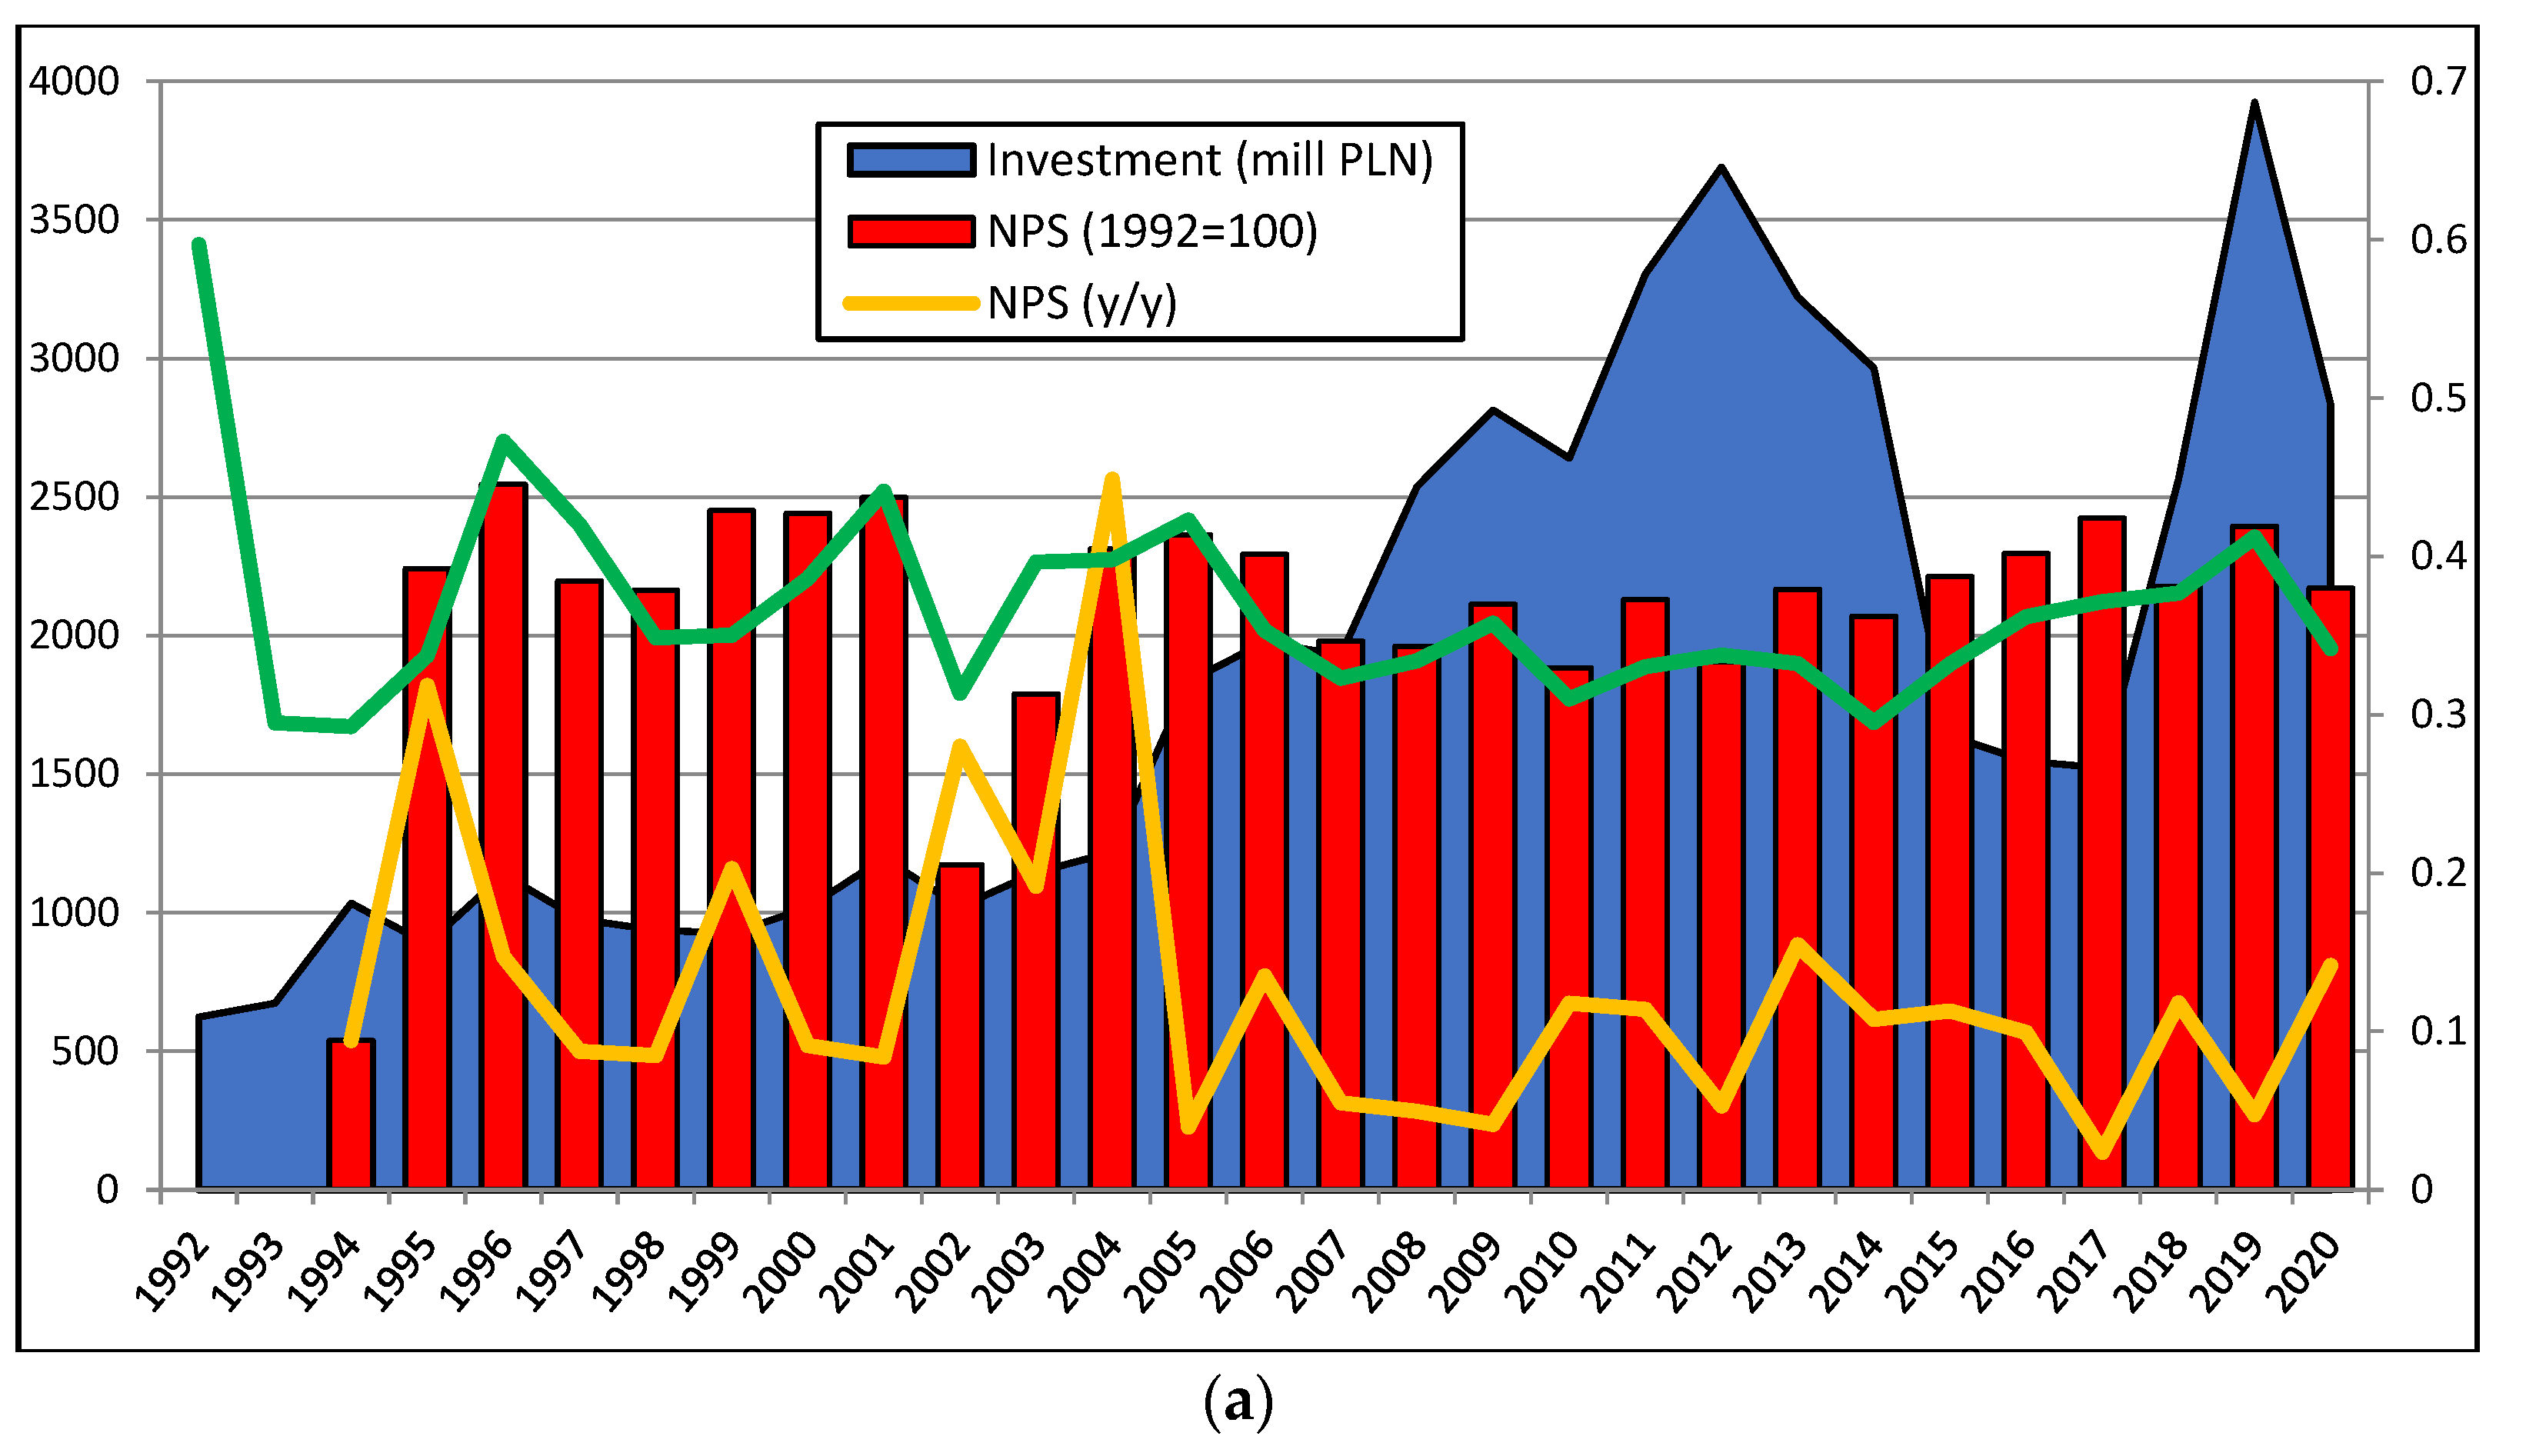
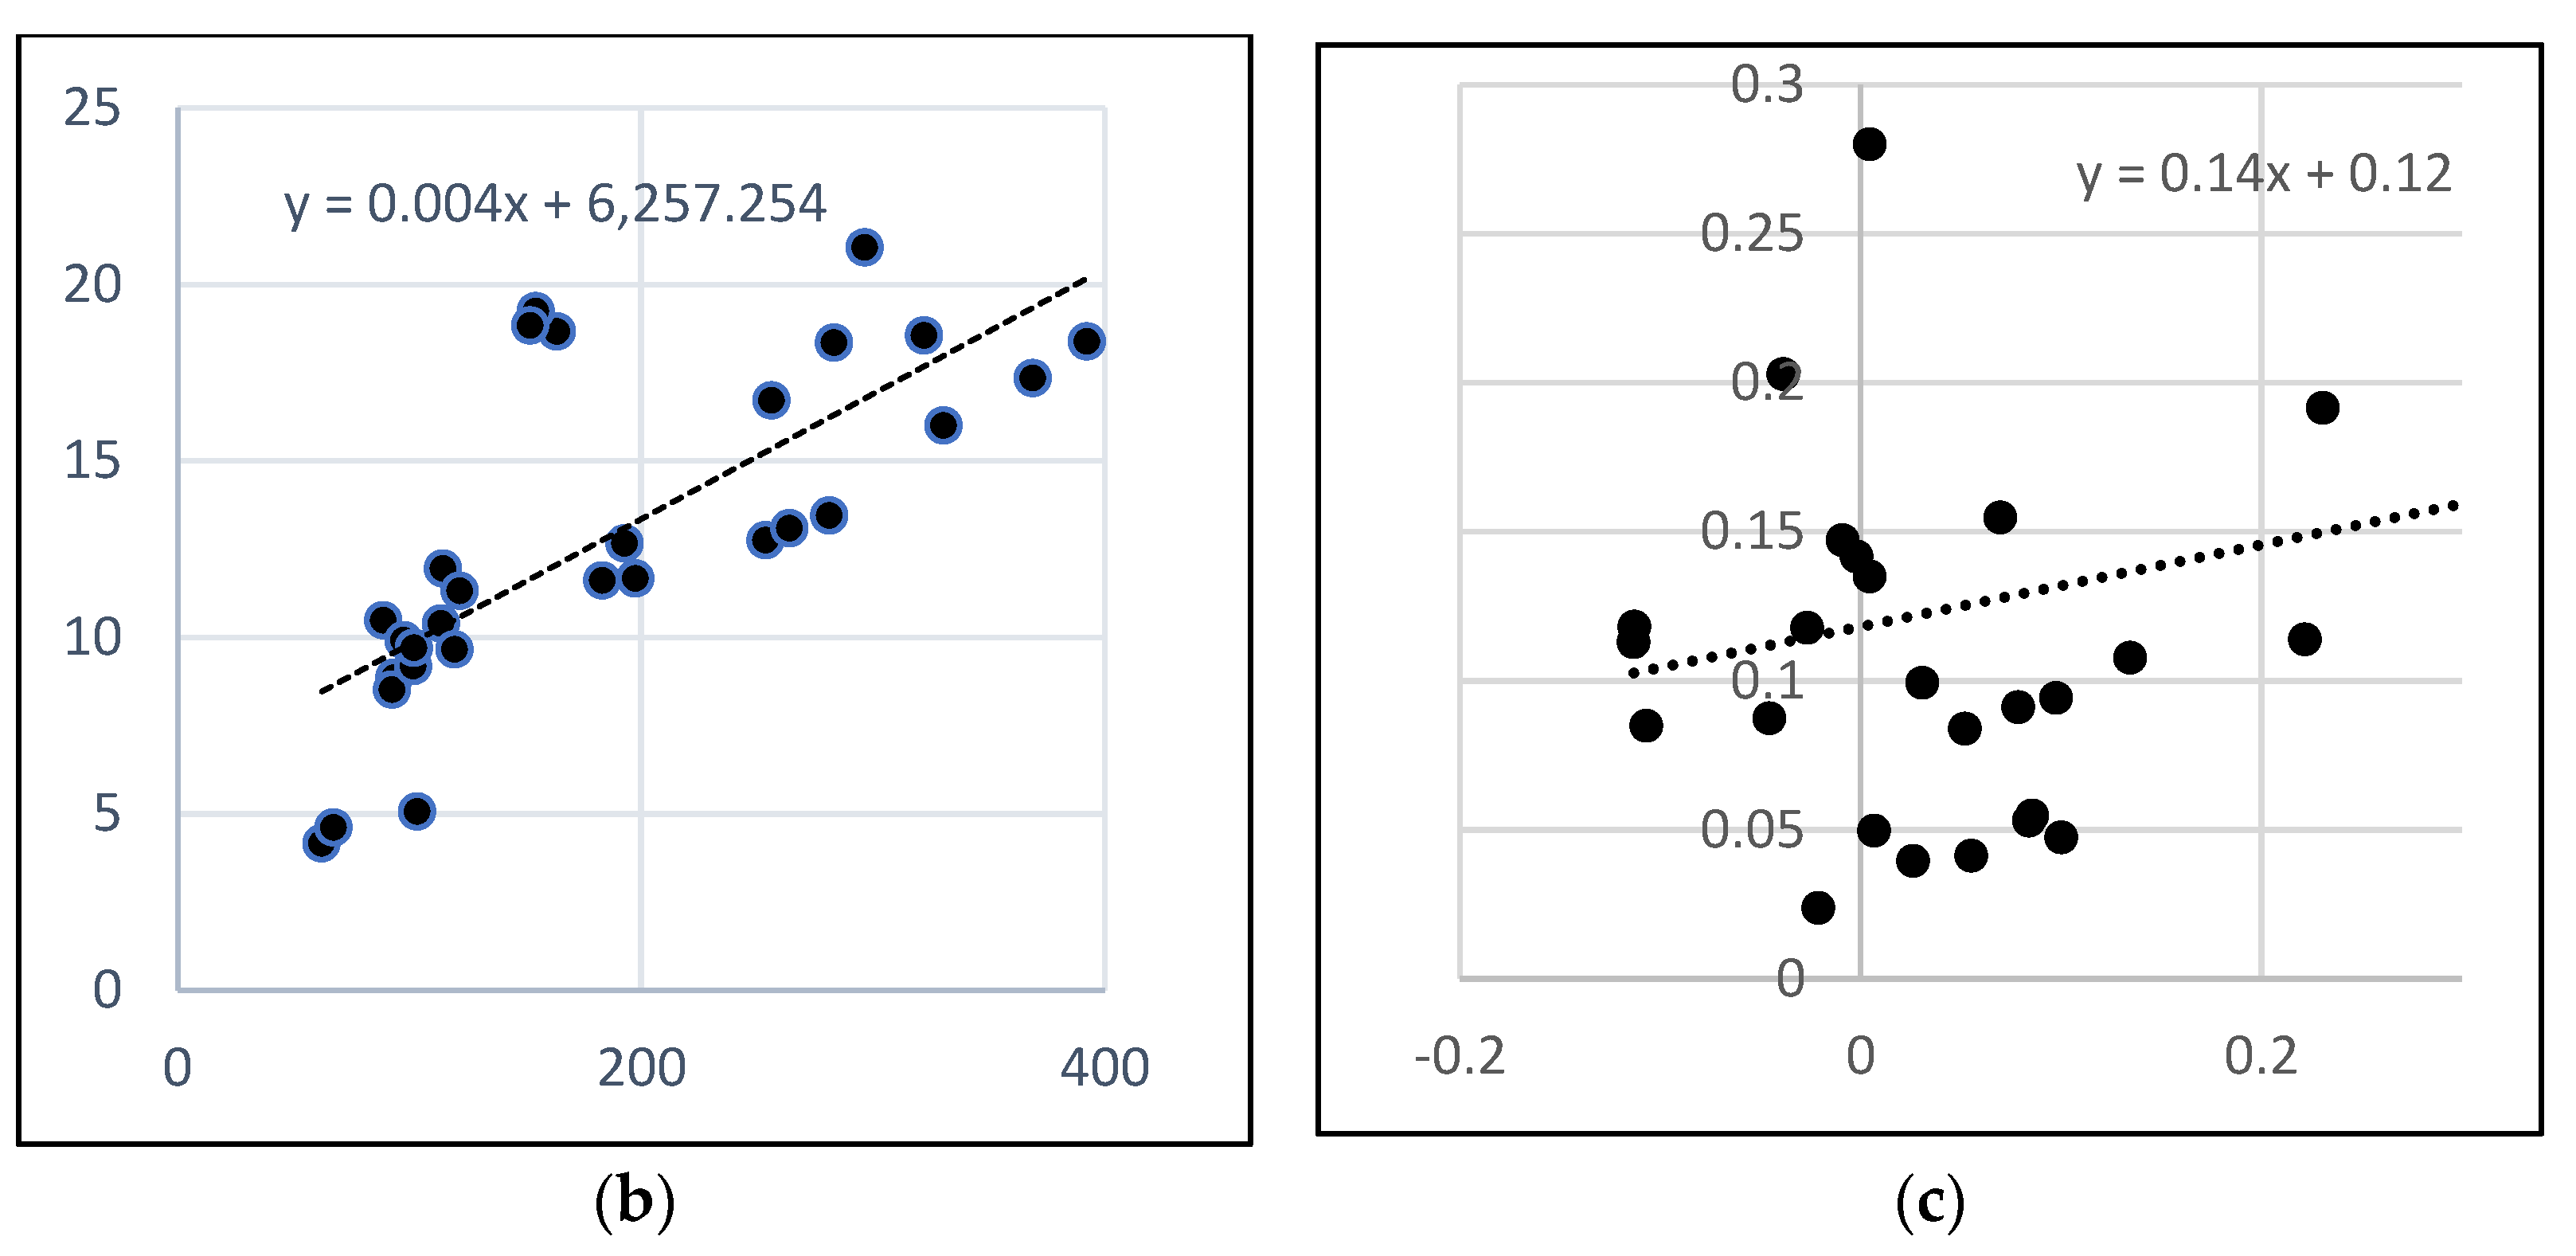
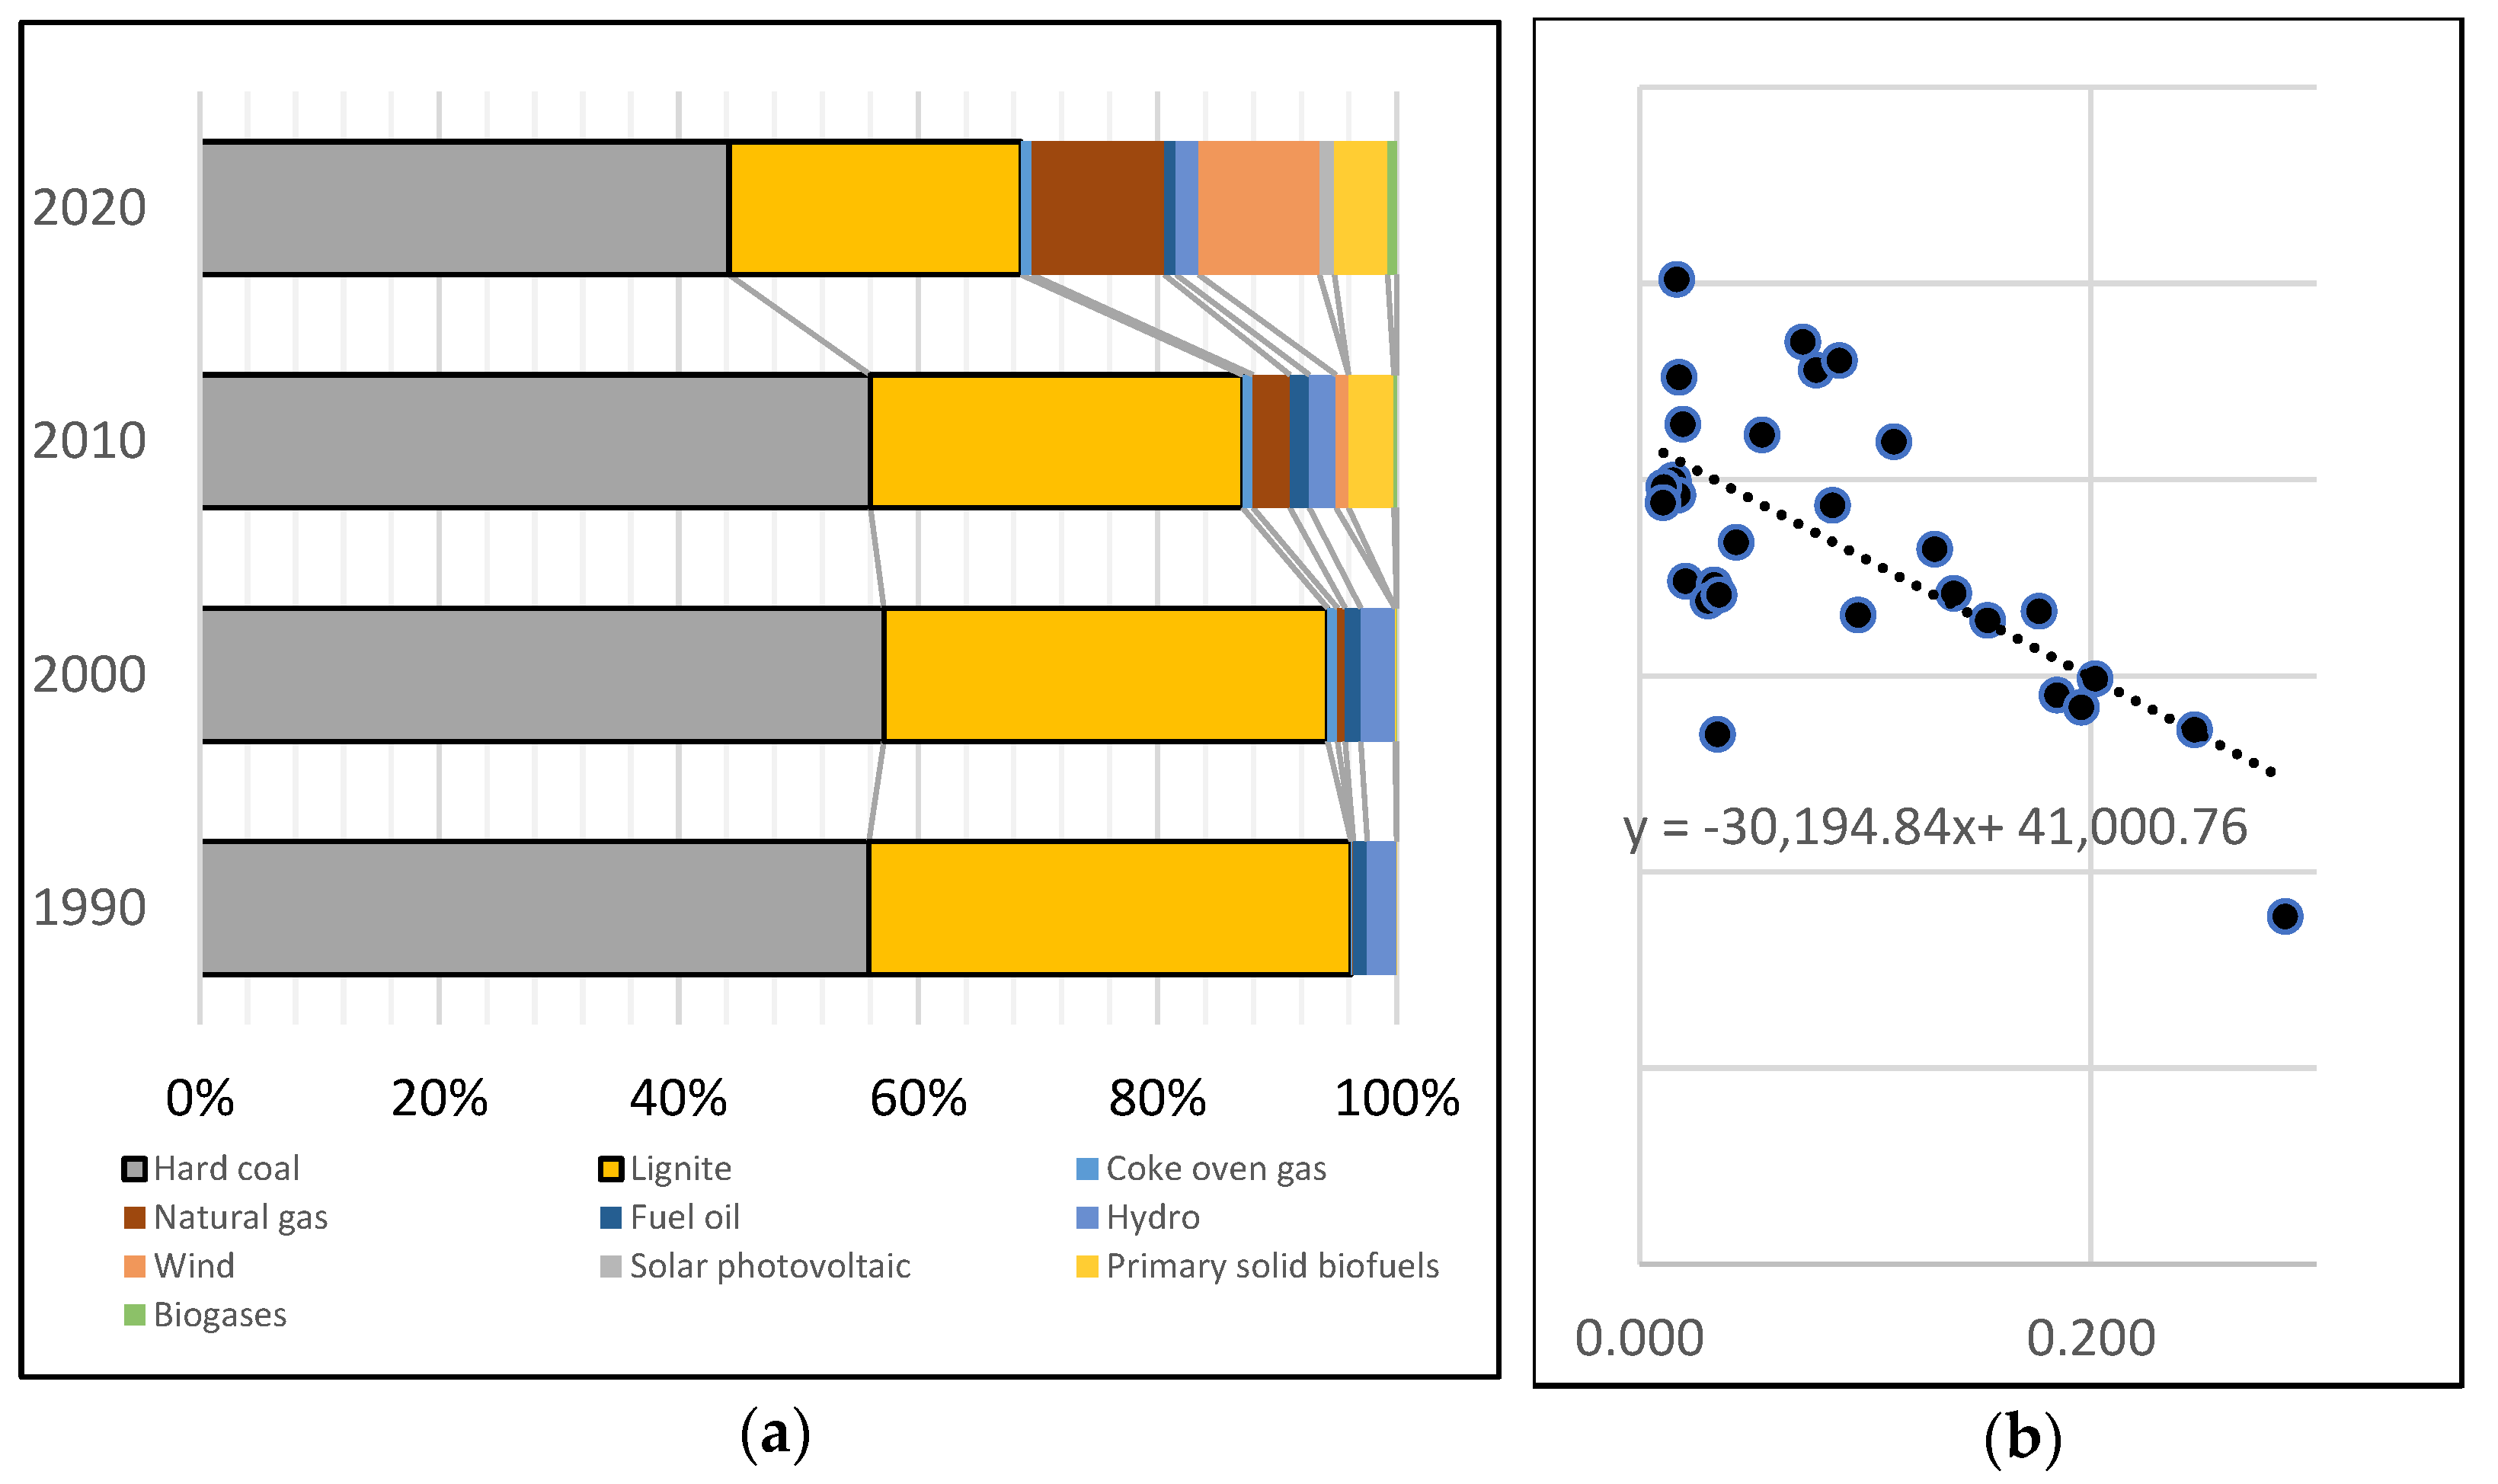
3.4. Assessment of Changes in the Structure of Electricity Generation vs. Hard Coal Mining
- 1992–2002—a very strong and negative correlation (r = −0.89, R2 = 0.79) with production volume and a strong and negative correlation with sales of steam coal (r = −0.67, R2 = 0.45);
- 2003–2008—a strong and positive correlation with production volume (r = 0.80, R2 = 0.64) and a very strong and positive correlation with steam coal sales volume (r = 0.93, R2 = 0.87);
- 2009–2020—a very strong and negative correlation with production volume (r = −0.93, R2 = 0.88) and a strong and negative correlation with sales of steam coal (r = −0.90, R2 = 0.81).
4. Discussion
- the current state of hard coal resources will, with rational management (without embarking on the exploitation of new deposits), ensure its supply up to 2049 [161],
- the current difficult financial state of the mining industry poses a serious barrier to, if not makes impossible, the implementation of the necessary development investments that would ensure an adequate supply of raw materials in the future [162].
- The restructuring activities carried out during this period did not bring the expected results, as is evidenced by the poor condition of mining enterprises [163].
- None of the 1992–1997 programs were fully successful, and most did not live up to the hopes placed in them [164,165] because of the inconsistent implementation of restructuring programs. Makieła [166] tried to prove it earlier but limited his research only to the analysis of the magnitude differentiation of only three measures, without attempting a comprehensive evaluation.
- The main methods used to reduce employment were natural redundancy, restrictions on admissions and, to a small extent, retirement incentives (early retirement, retraining courses, relocations, etc.), which was also noted in the research conducted by Bluszcz [169], which pointed out the lack of employment alternatives elsewhere.
- The absence of major changes in employment structures and fixed assets indicates a lack of any decisive policy or ongoing modernisation of these structures. Earlier, Gumiński [170] and Grzybek [171] tried to assess it, but they did not use any statistical evaluation analysis tools with features of coherence.
- A strong and negative correlation was observed between changes in the form and structure of fixed assets and the volume of mining output, with no improvement in the operating efficiency of mining enterprises. The lack of any correlation between the structure of assets and productivity and employment structure clearly indicates that the restructuring measures implemented during this period had no economic effect.
- The failure to achieve the desired changes was a consequence of exogenous processes, namely the task of creating legal and environmental regulations as well as the fact that political pressures did not take into account the economic conditions in which mining enterprises functioned [39].
- Since 2007, the authorities have abandoned the idea of setting coal output and sales targets due to their inconsistency with market trends and the objectives of energy policy [172]. No effective measures were taken in a timely manner to adjust mining enterprises to the changing market situation, which was also confirmed in the studies conducted by Turek & Jelonek-Kowalska [173]. This was due to a number of factors, including geopolitical [174], economic [175] and social [176] factors.
- The cut-back in mining operations and coal output came as a result of the need to abruptly adapt to the declining need for coal, which was only to a small extent caused by the energy transition, and shrinking demand for steam coal. Gumiński, Karbownik and Włodarski [91] came to a similar conclusion, but they did not take into account the analysis of interdependencies carried out in this article.
- Although, as was shown in the research, an important element of the above restructuring programs was ensuring the country’s energy security, especially given the insufficient capacity provided by alternative energy sources [177,178,179], this security has not been adequately guaranteed. This was pointed out by Kaliski et al. [180] in their research, but they did not attempt to indicate the direction of policy changes, which in the current situation is of key importance for Poland.
- an assessment of the effectiveness of the use of lignite for power generation to date and the prospects for maintaining it,
- identification of determinants and barriers for the development of renewable energy sources,
- an assessment of the economically justifiable life of coal-fired power and heat generation sources given the need for energy security,
- evaluation of the limits of the efficiency (upgrades and creation of new ones) of energy generation sources as a relation of effects and expenditures (with the considered use of non-parametric methods: DEA or FDH),
- selection of energy generation sources for the mix as a relativisation of their efficiency to the energy security factor.
- removal of regulatory barriers to the development of wind and solar power generation (e.g., reduction of the minimum distance of windmills from buildings, return to net metering, not just net billing);
- government investments into the expansion and upgrade of electricity grid infrastructure, which is a bottleneck for RES development;
- acceleration of design work and investment contracts for the construction of a nuclear power plant, which is a stable source of energy demand coverage in the face of the significant amplitude of fluctuations inherent in RES;
- upgrading of coal-powered generating units in large power plants using new, already available technologies that reduce the burden on the environment and the amount of emission fees;
- use of accumulated funds from the sale of the EU ETS and their increase using government subsidies for the purpose of accelerating the development of RES and “leapfrogging” the hitherto planned natural gas phase;
- setting new targets and activities in the field of the restructuring of hard coal and lignite mining resulting from (following) the developed new energy policy (increase in efficiency, new technologies, intensification of structural reconstruction), based on the optimisation of the energy mix and the context of energy security.
5. Conclusions
Author Contributions
Funding
Institutional Review Board Statement
Informed Consent Statement
Data Availability Statement
Conflicts of Interest
Appendix A
- resources: fixed and total assets, accumulated depreciation, inventories, receivables, short-term liabilities, number of employees, net working capital,
- flows: revenues from sales, operating and total costs, net operating and financial results, investment expenditures, depreciation, export sales,
- rates of use:
- −
- general financial standing: ACSR asset-capital structure ratio,
- −
- debt: STDR—short-term debt ratio, TDR—total debt ratio,
- −
- static liquidity and solvency: CLR—current liquidity ratio, QLR—quick liquidity ratio, SR—solvency ratio,
- −
- dynamic liquidity: SCER—sales cash efficiency ratio, CFCR—cash flow coverage ratio,
- −
- working capital management: IC—inventories cycle, RC—receivables cycle, STLC—short-term liabilities cycle, NWCC—net working capital cycle,
- −
- profitability: oROS—operating return on sales, oROA—operating return on assets, ROE—return on equity, VAM—value-added margin,
- efficiency and effectiveness: LE—labour effectiveness, LP—labor productivity, AP—assets productivity, CP—cost productivity, AR—fixed asset renewal.
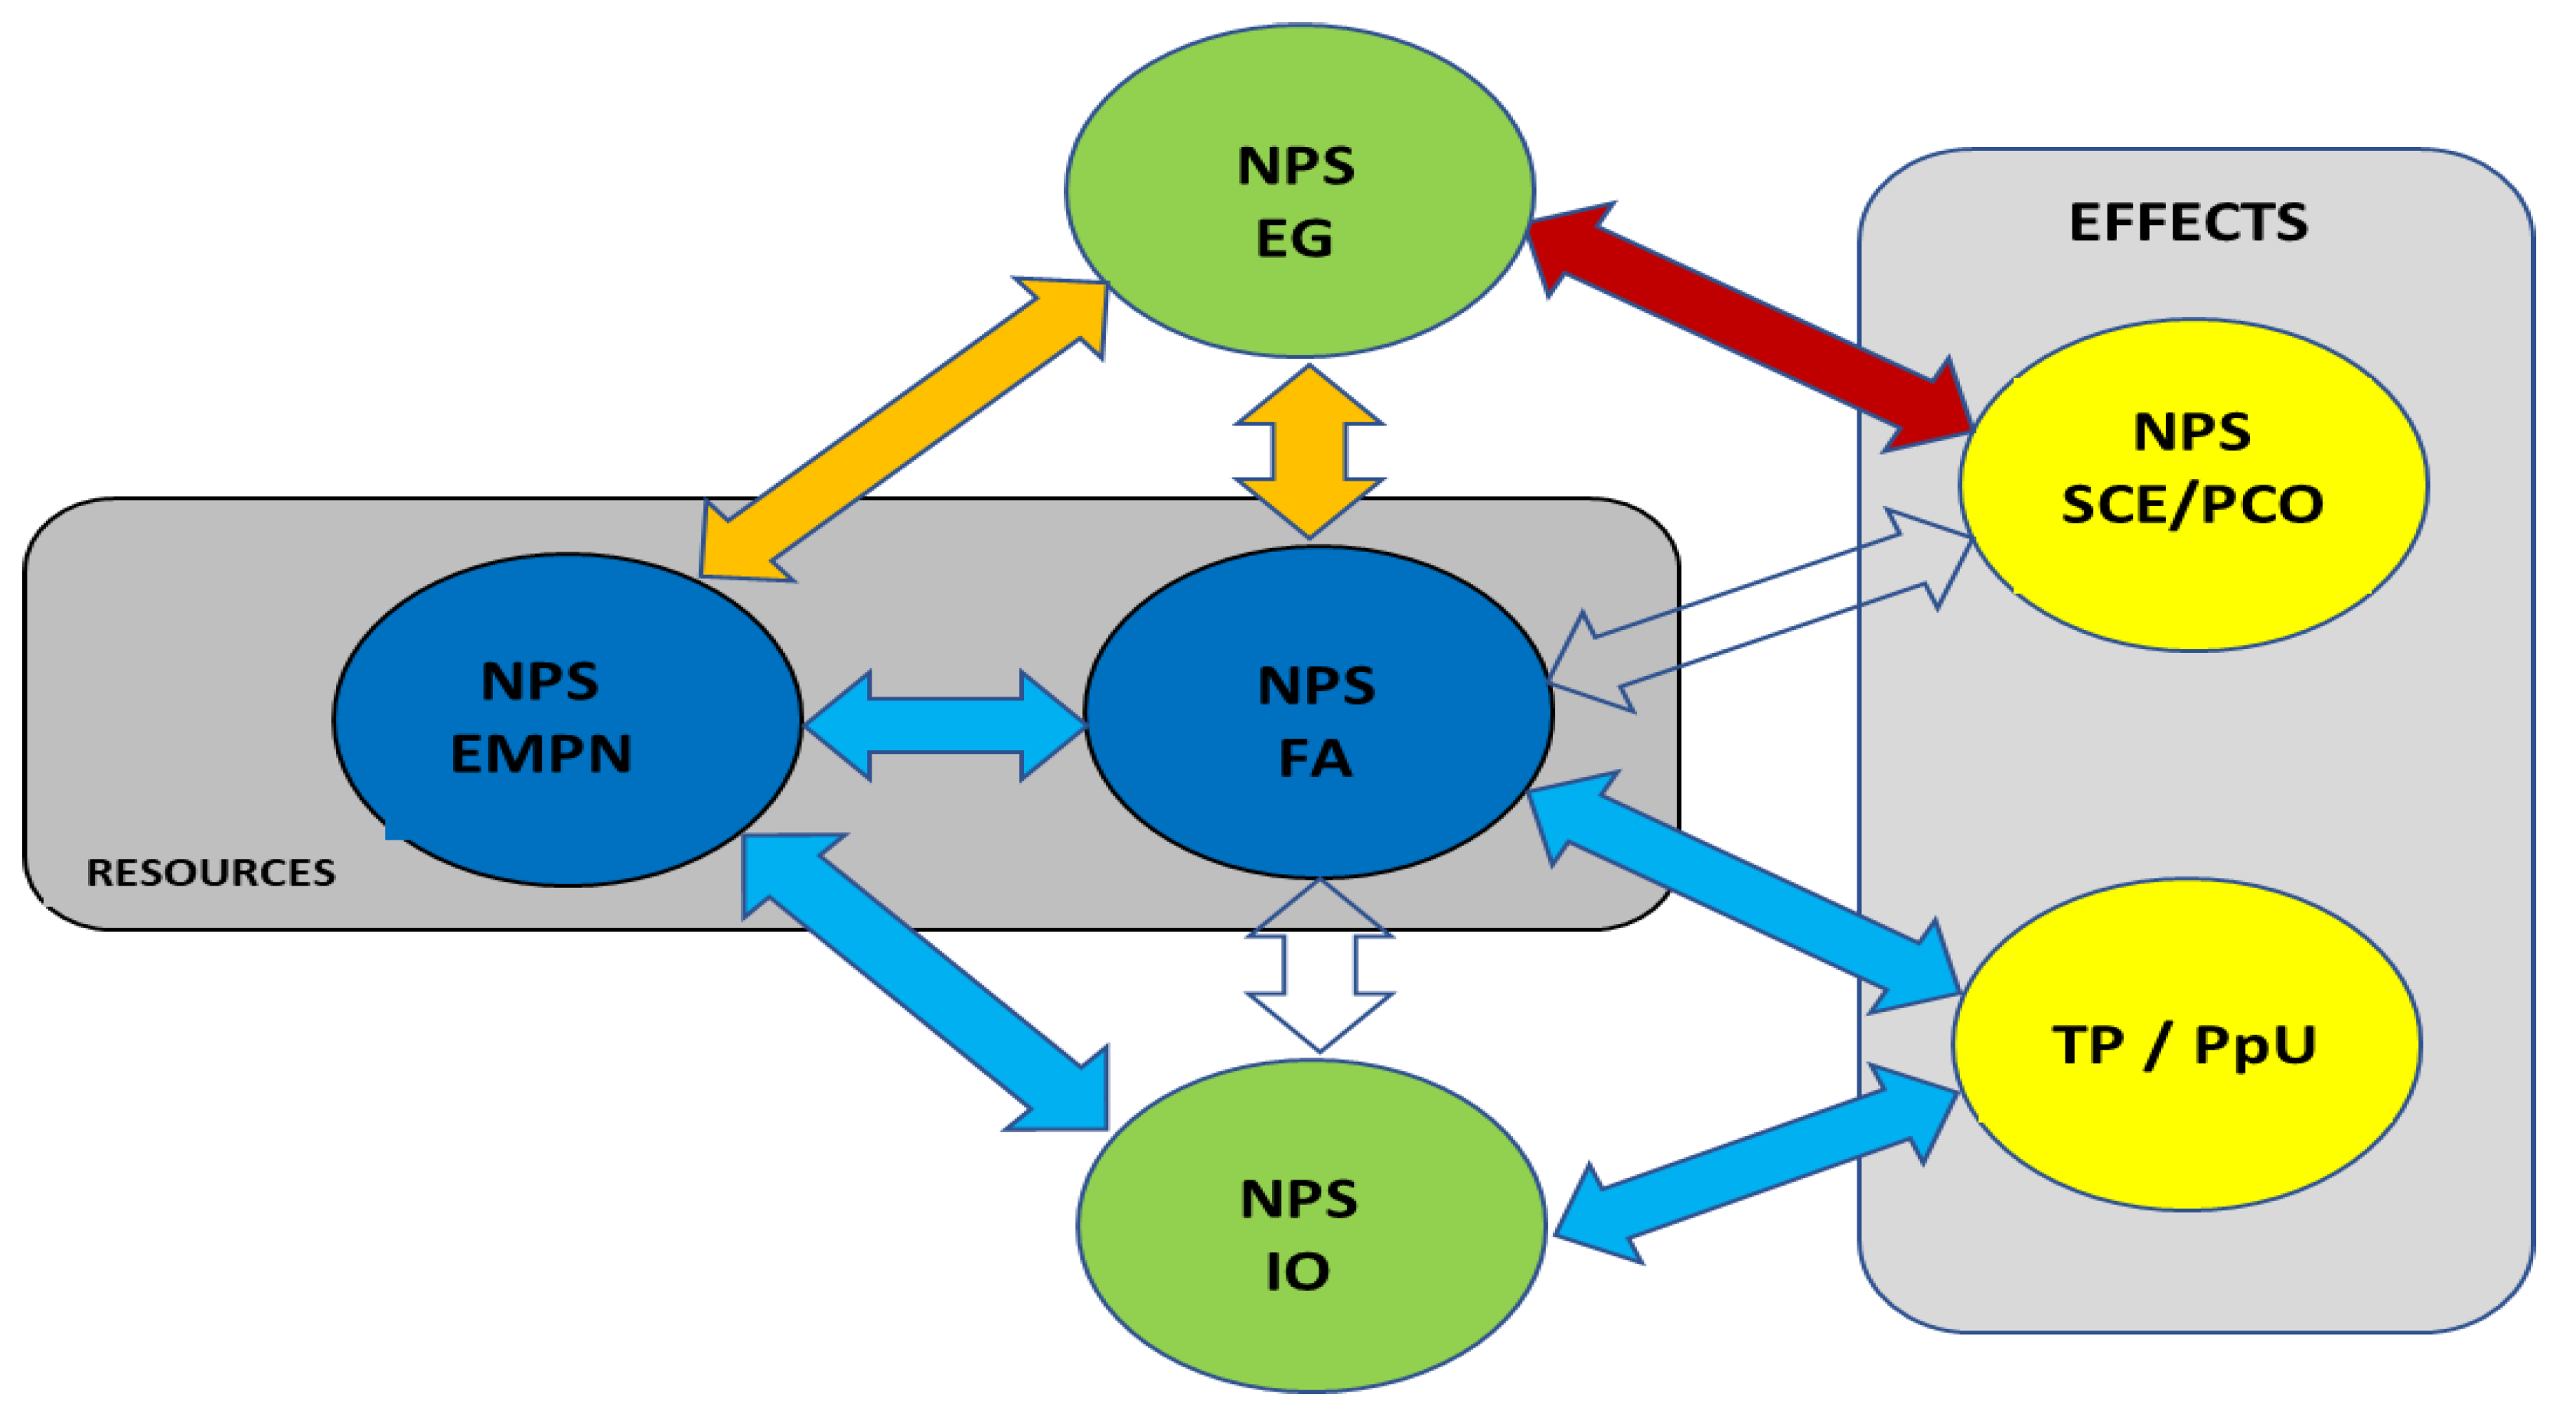
- resources: fixed assets, employment, hard coal production,
- flows: hard coal sales, investment outlays, electricity generation.
- rates of use:
- −
- fixed assets FA,
- −
- employment EMPN,
- −
- investment outlays IO,
- −
- total productivity TP,
- −
- productivity per underground worker PpU,
- −
- energy generation EG,
- −
- power coal mining PCM,
- −
- sale of energy coal SCE.
Appendix B
- Program I—Restrukturyzacja górnictwa węgla kamiennego w Polsce (Hard coal mining restructuring in Poland)—the implementation of the first stage in 1993, within the financial capacity of the state)—realizacja pierwszego etapu w 1993 roku w ramach możliwości finansowych państwa (przyjęty przez Radę Ministrów w dniu 15 marca 1993 roku.
- Program II—Program powstrzymania upadłości górnictwa węgla kamiennego w Polsce (The program to stop the bankruptcy of hard coal mining in Poland) (realizacja w okresie 15.07–31.12.1993 roku) przekazany Komitetowi Ekonomicznemu Rady Ministrów w dniu 2 sierpnia 1993 roku.
- Program III—Restrukturyzacja górnictwa węgla kamiennego. Część II. Program dla realizacji II etapu w okresie 1994–1995 roku (Hard coal mining restructuring. Part II. Program for the implementation of the 2nd stage in the period 1994–1995) zaakceptowany przez Komitet Ekonomiczny Rady Ministrów w dniu 18 lutego 1994 roku.
- Program IV—Górnictwo węgla kamiennego, polityka państwa i sektora na lata 1996–2000. Program dostosowania górnictwa węgla kamiennego do warunków gospodarki rynkowej i międzynarodowej konkurencji (Hard coal mining, state and sector policy for 1996–2000. Program of adjusting the hard coal mining to the conditions of the market economy and international competition) przyjęty przez Radę Ministrów w dniu 30 kwietnia 1996 roku.
- Program V—Reforma górnictwa węgla kamiennego w Polsce w latach 1998–2002 (The reform of hard coal mining in Poland in 1998–2002) przyjęta przez Radę Ministrów w dniu 30 czerwca 1998 roku wraz z Korektę rządowego programu Reforma górnictwa węgla kamiennego w Polsce w latach 1998–2002 (The reform of hard coal mining in Poland in 1998–2002) przyjęta przez Radę Ministrów w dniu 21 grudnia 1999 roku.
- Program VI—Program restrukturyzacji górnictwa węgla kamiennego w Polsce w latach 2003–2006 z wykorzystaniem ustaw antykryzysowych i zainicjowaniem prywatyzacji niektórych kopalń (Hard coal mining restructuring program in Poland in the years 2003–2006 with the use of anti-crisis acts and initiation of privatization of some mines) przyjęty przez Radę Ministrów w dniu 20 listopada 2002 roku (z korektami wynikającymi z Porozumienia strony rządowej ze stroną związkową z dnia 11 grudnia 2002 roku oraz korektami wynikającymi ze stanu prawnego sektora na dzień 10 stycznia 2003 roku), przyjęty przez Radę Ministrów w dniu 28 stycznia 2003 roku.
- Program VII—Restrukturyzacja górnictwa węgla kamiennego w latach 2004–2006 oraz strategia na lata 2007–2010 (Hard coal mining restructuring in 2004–2006 and the strategy for 2007–2010) przyjęta przez Radę Ministrów w dniu 27 kwietnia 2004 roku.
- Program VIII—Strategia działalności górnictwa węgla kamiennego w Polsce w latach 2007–2015 (Strategy of hard coal mining activity in Poland in the years 2007–2015) przyjęta przez Radę Ministrów w dniu 31 lipca 2007 roku wraz z Korektą programu rządowego przyjętą przez Radę Ministrów w dniu 24 lipca 2009 roku.
- Program IX—Program dla sektora górnictwa węgla kamiennego w Polsce do 2030 roku (Program for the hard coal mining sector in Poland until 2030) przyjęty przez Radę Ministrów w dniu 23 stycznia 2018 roku.
Appendix C

| 1992 | 1993 | 1994 | 1995 | 1996 | 1997 | 1998 | 1999 | 2000 | 2001 | 2002 | 2003 | 2004 | 2005 | 2006 | 2007 | 2008 | 2009 | 2010 | 2011 | 2012 | 2013 | 2014 | 2015 | 2016 | 2017 | 2018 | 2019 | 2020 |
|---|---|---|---|---|---|---|---|---|---|---|---|---|---|---|---|---|---|---|---|---|---|---|---|---|---|---|---|---|
| 0.000 | 0.021 | 0.044 | 0.062 | 0.069 | 0.077 | 0.066 | 0.078 | 0.084 | 0.082 | 0.087 | 0.091 | 0.089 | 0.091 | 0.094 | 0.097 | 0.100 | 0.104 | 0.103 | 0.105 | 0.104 | 0.105 | 0.101 | 0.099 | 0.099 | 0.109 | 0.109 | 0.108 | 0.109 |
| 0.021 | 0.000 | 0.024 | 0.041 | 0.048 | 0.056 | 0.046 | 0.058 | 0.064 | 0.063 | 0.067 | 0.071 | 0.070 | 0.072 | 0.075 | 0.077 | 0.081 | 0.084 | 0.084 | 0.085 | 0.084 | 0.087 | 0.093 | 0.095 | 0.093 | 0.095 | 0.093 | 0.097 | 0.100 |
| 0.044 | 0.024 | 0.000 | 0.017 | 0.024 | 0.033 | 0.027 | 0.040 | 0.044 | 0.048 | 0.048 | 0.050 | 0.057 | 0.061 | 0.063 | 0.066 | 0.061 | 0.065 | 0.072 | 0.070 | 0.072 | 0.080 | 0.086 | 0.087 | 0.086 | 0.088 | 0.086 | 0.090 | 0.092 |
| 0.062 | 0.041 | 0.017 | 0.000 | 0.007 | 0.015 | 0.021 | 0.034 | 0.038 | 0.043 | 0.042 | 0.044 | 0.051 | 0.056 | 0.057 | 0.060 | 0.055 | 0.059 | 0.066 | 0.064 | 0.066 | 0.072 | 0.080 | 0.082 | 0.080 | 0.081 | 0.080 | 0.084 | 0.087 |
| 0.069 | 0.048 | 0.024 | 0.007 | 0.000 | 0.008 | 0.020 | 0.029 | 0.033 | 0.038 | 0.037 | 0.039 | 0.046 | 0.051 | 0.052 | 0.055 | 0.050 | 0.054 | 0.061 | 0.059 | 0.061 | 0.067 | 0.075 | 0.076 | 0.075 | 0.076 | 0.075 | 0.079 | 0.082 |
| 0.077 | 0.056 | 0.033 | 0.015 | 0.008 | 0.000 | 0.022 | 0.024 | 0.028 | 0.033 | 0.032 | 0.034 | 0.041 | 0.046 | 0.047 | 0.050 | 0.045 | 0.049 | 0.056 | 0.054 | 0.056 | 0.063 | 0.070 | 0.072 | 0.070 | 0.071 | 0.070 | 0.074 | 0.077 |
| 0.066 | 0.046 | 0.027 | 0.021 | 0.020 | 0.022 | 0.000 | 0.013 | 0.018 | 0.021 | 0.021 | 0.025 | 0.030 | 0.034 | 0.036 | 0.039 | 0.035 | 0.039 | 0.045 | 0.043 | 0.045 | 0.054 | 0.060 | 0.061 | 0.059 | 0.062 | 0.059 | 0.063 | 0.065 |
| 0.078 | 0.058 | 0.040 | 0.034 | 0.029 | 0.024 | 0.013 | 0.000 | 0.006 | 0.008 | 0.011 | 0.016 | 0.019 | 0.024 | 0.025 | 0.028 | 0.025 | 0.030 | 0.034 | 0.033 | 0.033 | 0.045 | 0.051 | 0.052 | 0.048 | 0.053 | 0.046 | 0.050 | 0.052 |
| 0.084 | 0.064 | 0.044 | 0.038 | 0.033 | 0.028 | 0.018 | 0.006 | 0.000 | 0.007 | 0.005 | 0.009 | 0.014 | 0.019 | 0.020 | 0.023 | 0.019 | 0.024 | 0.029 | 0.029 | 0.029 | 0.043 | 0.049 | 0.050 | 0.047 | 0.051 | 0.045 | 0.048 | 0.049 |
| 0.082 | 0.063 | 0.048 | 0.043 | 0.038 | 0.033 | 0.021 | 0.008 | 0.007 | 0.000 | 0.007 | 0.011 | 0.011 | 0.015 | 0.017 | 0.019 | 0.021 | 0.026 | 0.025 | 0.025 | 0.025 | 0.041 | 0.047 | 0.048 | 0.045 | 0.049 | 0.043 | 0.046 | 0.047 |
| 0.087 | 0.067 | 0.048 | 0.042 | 0.037 | 0.032 | 0.021 | 0.011 | 0.005 | 0.007 | 0.000 | 0.005 | 0.009 | 0.014 | 0.015 | 0.018 | 0.014 | 0.019 | 0.024 | 0.024 | 0.024 | 0.041 | 0.047 | 0.048 | 0.044 | 0.049 | 0.042 | 0.045 | 0.047 |
| 0.091 | 0.071 | 0.050 | 0.044 | 0.039 | 0.034 | 0.025 | 0.016 | 0.009 | 0.011 | 0.005 | 0.000 | 0.008 | 0.012 | 0.013 | 0.016 | 0.011 | 0.016 | 0.022 | 0.020 | 0.022 | 0.041 | 0.047 | 0.048 | 0.045 | 0.049 | 0.042 | 0.046 | 0.047 |
| 0.089 | 0.070 | 0.057 | 0.051 | 0.046 | 0.041 | 0.030 | 0.019 | 0.014 | 0.011 | 0.009 | 0.008 | 0.000 | 0.005 | 0.006 | 0.009 | 0.012 | 0.016 | 0.015 | 0.016 | 0.015 | 0.036 | 0.042 | 0.043 | 0.040 | 0.045 | 0.037 | 0.041 | 0.042 |
| 0.091 | 0.072 | 0.061 | 0.056 | 0.051 | 0.046 | 0.034 | 0.024 | 0.019 | 0.015 | 0.014 | 0.012 | 0.005 | 0.000 | 0.003 | 0.006 | 0.011 | 0.014 | 0.012 | 0.014 | 0.012 | 0.033 | 0.039 | 0.040 | 0.037 | 0.042 | 0.034 | 0.038 | 0.039 |
| 0.094 | 0.075 | 0.063 | 0.057 | 0.052 | 0.047 | 0.036 | 0.025 | 0.020 | 0.017 | 0.015 | 0.013 | 0.006 | 0.003 | 0.000 | 0.003 | 0.008 | 0.011 | 0.009 | 0.011 | 0.009 | 0.033 | 0.039 | 0.040 | 0.037 | 0.041 | 0.034 | 0.037 | 0.039 |
| 0.097 | 0.077 | 0.066 | 0.060 | 0.055 | 0.050 | 0.039 | 0.028 | 0.023 | 0.019 | 0.018 | 0.016 | 0.009 | 0.006 | 0.003 | 0.000 | 0.008 | 0.009 | 0.006 | 0.009 | 0.007 | 0.031 | 0.037 | 0.038 | 0.034 | 0.039 | 0.032 | 0.035 | 0.037 |
| 0.100 | 0.081 | 0.061 | 0.055 | 0.050 | 0.045 | 0.035 | 0.025 | 0.019 | 0.021 | 0.014 | 0.011 | 0.012 | 0.011 | 0.008 | 0.008 | 0.000 | 0.005 | 0.011 | 0.010 | 0.011 | 0.035 | 0.042 | 0.043 | 0.039 | 0.043 | 0.036 | 0.039 | 0.041 |
| 0.104 | 0.084 | 0.065 | 0.059 | 0.054 | 0.049 | 0.039 | 0.030 | 0.024 | 0.026 | 0.019 | 0.016 | 0.016 | 0.014 | 0.011 | 0.009 | 0.005 | 0.000 | 0.008 | 0.006 | 0.008 | 0.034 | 0.043 | 0.044 | 0.041 | 0.041 | 0.034 | 0.037 | 0.039 |
| 0.103 | 0.084 | 0.072 | 0.066 | 0.061 | 0.056 | 0.045 | 0.034 | 0.029 | 0.025 | 0.024 | 0.022 | 0.015 | 0.012 | 0.009 | 0.006 | 0.011 | 0.008 | 0.000 | 0.003 | 0.001 | 0.027 | 0.035 | 0.037 | 0.033 | 0.034 | 0.027 | 0.030 | 0.032 |
| 0.105 | 0.085 | 0.070 | 0.064 | 0.059 | 0.054 | 0.043 | 0.033 | 0.029 | 0.025 | 0.024 | 0.020 | 0.016 | 0.014 | 0.011 | 0.009 | 0.010 | 0.006 | 0.003 | 0.000 | 0.003 | 0.029 | 0.038 | 0.039 | 0.036 | 0.036 | 0.028 | 0.032 | 0.033 |
| 0.104 | 0.084 | 0.072 | 0.066 | 0.061 | 0.056 | 0.045 | 0.033 | 0.029 | 0.025 | 0.024 | 0.022 | 0.015 | 0.012 | 0.009 | 0.007 | 0.011 | 0.008 | 0.001 | 0.003 | 0.000 | 0.027 | 0.035 | 0.036 | 0.033 | 0.033 | 0.026 | 0.030 | 0.031 |
| 0.105 | 0.087 | 0.080 | 0.072 | 0.067 | 0.063 | 0.054 | 0.045 | 0.043 | 0.041 | 0.041 | 0.041 | 0.036 | 0.033 | 0.033 | 0.031 | 0.035 | 0.034 | 0.027 | 0.029 | 0.027 | 0.000 | 0.010 | 0.013 | 0.014 | 0.009 | 0.013 | 0.015 | 0.017 |
| 0.101 | 0.093 | 0.086 | 0.080 | 0.075 | 0.070 | 0.060 | 0.051 | 0.049 | 0.047 | 0.047 | 0.047 | 0.042 | 0.039 | 0.039 | 0.037 | 0.042 | 0.043 | 0.035 | 0.038 | 0.035 | 0.010 | 0.000 | 0.006 | 0.007 | 0.008 | 0.017 | 0.013 | 0.015 |
| 0.099 | 0.095 | 0.087 | 0.082 | 0.076 | 0.072 | 0.061 | 0.052 | 0.050 | 0.048 | 0.048 | 0.048 | 0.043 | 0.040 | 0.040 | 0.038 | 0.043 | 0.044 | 0.037 | 0.039 | 0.036 | 0.013 | 0.006 | 0.000 | 0.004 | 0.012 | 0.016 | 0.011 | 0.013 |
| 0.099 | 0.093 | 0.086 | 0.080 | 0.075 | 0.070 | 0.059 | 0.048 | 0.047 | 0.045 | 0.044 | 0.045 | 0.040 | 0.037 | 0.037 | 0.034 | 0.039 | 0.041 | 0.033 | 0.036 | 0.033 | 0.014 | 0.007 | 0.004 | 0.000 | 0.013 | 0.013 | 0.009 | 0.011 |
| 0.109 | 0.095 | 0.088 | 0.081 | 0.076 | 0.071 | 0.062 | 0.053 | 0.051 | 0.049 | 0.049 | 0.049 | 0.045 | 0.042 | 0.041 | 0.039 | 0.043 | 0.041 | 0.034 | 0.036 | 0.033 | 0.009 | 0.008 | 0.012 | 0.013 | 0.000 | 0.014 | 0.012 | 0.015 |
| 0.109 | 0.093 | 0.086 | 0.080 | 0.075 | 0.070 | 0.059 | 0.046 | 0.045 | 0.043 | 0.042 | 0.042 | 0.037 | 0.034 | 0.034 | 0.032 | 0.036 | 0.034 | 0.027 | 0.028 | 0.026 | 0.013 | 0.017 | 0.016 | 0.013 | 0.014 | 0.000 | 0.005 | 0.007 |
| 0.108 | 0.097 | 0.090 | 0.084 | 0.079 | 0.074 | 0.063 | 0.050 | 0.048 | 0.046 | 0.045 | 0.046 | 0.041 | 0.038 | 0.037 | 0.035 | 0.039 | 0.037 | 0.030 | 0.032 | 0.030 | 0.015 | 0.013 | 0.011 | 0.009 | 0.012 | 0.005 | 0.000 | 0.003 |
| 0.109 | 0.100 | 0.092 | 0.087 | 0.082 | 0.077 | 0.065 | 0.052 | 0.049 | 0.047 | 0.047 | 0.047 | 0.042 | 0.039 | 0.039 | 0.037 | 0.041 | 0.039 | 0.032 | 0.033 | 0.031 | 0.017 | 0.015 | 0.013 | 0.011 | 0.015 | 0.007 | 0.003 | 0.000 |
| 1993 | 1994 | 1995 | 1996 | 1997 | 1998 | 1999 | 2000 | 2001 | 2002 | 2003 | 2004 | 2005 | 2006 | 2007 | 2008 | 2009 | 2010 | 2011 | 2012 | 2013 | 2014 | 2015 | 2016 | 2017 | 2018 | 2019 | 2020 |
|---|---|---|---|---|---|---|---|---|---|---|---|---|---|---|---|---|---|---|---|---|---|---|---|---|---|---|---|
| 0.000 | 0.094 | 0.392 | 0.446 | 0.385 | 0.379 | 0.429 | 0.427 | 0.437 | 0.205 | 0.313 | 0.405 | 0.414 | 0.401 | 0.346 | 0.343 | 0.370 | 0.330 | 0.373 | 0.333 | 0.379 | 0.362 | 0.387 | 0.402 | 0.424 | 0.381 | 0.419 | 0.380 |
| 0.094 | 0.000 | 0.318 | 0.387 | 0.312 | 0.284 | 0.335 | 0.333 | 0.343 | 0.175 | 0.283 | 0.310 | 0.319 | 0.307 | 0.252 | 0.249 | 0.275 | 0.270 | 0.278 | 0.239 | 0.320 | 0.303 | 0.328 | 0.308 | 0.330 | 0.287 | 0.325 | 0.286 |
| 0.392 | 0.318 | 0.000 | 0.147 | 0.164 | 0.139 | 0.285 | 0.230 | 0.272 | 0.432 | 0.547 | 0.253 | 0.252 | 0.293 | 0.322 | 0.320 | 0.323 | 0.412 | 0.298 | 0.306 | 0.433 | 0.475 | 0.419 | 0.347 | 0.352 | 0.279 | 0.279 | 0.344 |
| 0.446 | 0.387 | 0.147 | 0.000 | 0.087 | 0.144 | 0.313 | 0.243 | 0.214 | 0.460 | 0.575 | 0.238 | 0.200 | 0.322 | 0.350 | 0.348 | 0.351 | 0.440 | 0.326 | 0.334 | 0.461 | 0.503 | 0.447 | 0.375 | 0.381 | 0.302 | 0.255 | 0.372 |
| 0.385 | 0.312 | 0.164 | 0.087 | 0.000 | 0.085 | 0.249 | 0.182 | 0.140 | 0.373 | 0.488 | 0.150 | 0.113 | 0.234 | 0.263 | 0.261 | 0.263 | 0.353 | 0.239 | 0.247 | 0.373 | 0.416 | 0.359 | 0.287 | 0.293 | 0.215 | 0.168 | 0.284 |
| 0.379 | 0.284 | 0.139 | 0.144 | 0.085 | 0.000 | 0.203 | 0.135 | 0.158 | 0.316 | 0.446 | 0.118 | 0.123 | 0.177 | 0.206 | 0.204 | 0.207 | 0.296 | 0.182 | 0.190 | 0.317 | 0.359 | 0.303 | 0.231 | 0.236 | 0.158 | 0.140 | 0.228 |
| 0.429 | 0.335 | 0.285 | 0.313 | 0.249 | 0.203 | 0.000 | 0.091 | 0.167 | 0.288 | 0.480 | 0.145 | 0.174 | 0.076 | 0.090 | 0.128 | 0.129 | 0.138 | 0.113 | 0.156 | 0.147 | 0.197 | 0.133 | 0.063 | 0.068 | 0.154 | 0.160 | 0.059 |
| 0.427 | 0.333 | 0.230 | 0.243 | 0.182 | 0.135 | 0.091 | 0.000 | 0.084 | 0.291 | 0.483 | 0.062 | 0.091 | 0.084 | 0.108 | 0.121 | 0.108 | 0.212 | 0.123 | 0.138 | 0.224 | 0.288 | 0.219 | 0.132 | 0.138 | 0.081 | 0.078 | 0.129 |
| 0.437 | 0.343 | 0.272 | 0.214 | 0.140 | 0.158 | 0.167 | 0.084 | 0.000 | 0.280 | 0.470 | 0.043 | 0.034 | 0.132 | 0.167 | 0.156 | 0.144 | 0.260 | 0.160 | 0.145 | 0.272 | 0.336 | 0.267 | 0.168 | 0.180 | 0.094 | 0.046 | 0.177 |
| 0.205 | 0.175 | 0.432 | 0.460 | 0.373 | 0.316 | 0.288 | 0.291 | 0.280 | 0.000 | 0.192 | 0.257 | 0.264 | 0.240 | 0.198 | 0.182 | 0.208 | 0.165 | 0.211 | 0.172 | 0.210 | 0.194 | 0.218 | 0.240 | 0.263 | 0.220 | 0.258 | 0.230 |
| 0.313 | 0.283 | 0.547 | 0.575 | 0.488 | 0.446 | 0.480 | 0.483 | 0.470 | 0.192 | 0.000 | 0.449 | 0.456 | 0.431 | 0.390 | 0.367 | 0.393 | 0.350 | 0.396 | 0.357 | 0.388 | 0.302 | 0.402 | 0.425 | 0.448 | 0.404 | 0.443 | 0.422 |
| 0.405 | 0.310 | 0.253 | 0.238 | 0.150 | 0.118 | 0.145 | 0.062 | 0.043 | 0.257 | 0.449 | 0.000 | 0.040 | 0.101 | 0.125 | 0.124 | 0.113 | 0.228 | 0.129 | 0.116 | 0.241 | 0.304 | 0.235 | 0.137 | 0.148 | 0.064 | 0.025 | 0.136 |
| 0.414 | 0.319 | 0.252 | 0.200 | 0.113 | 0.123 | 0.174 | 0.091 | 0.034 | 0.264 | 0.456 | 0.040 | 0.000 | 0.135 | 0.160 | 0.159 | 0.150 | 0.262 | 0.163 | 0.148 | 0.275 | 0.338 | 0.269 | 0.175 | 0.182 | 0.102 | 0.055 | 0.172 |
| 0.401 | 0.307 | 0.293 | 0.322 | 0.234 | 0.177 | 0.076 | 0.084 | 0.132 | 0.240 | 0.431 | 0.101 | 0.135 | 0.000 | 0.055 | 0.067 | 0.053 | 0.127 | 0.065 | 0.081 | 0.140 | 0.203 | 0.134 | 0.053 | 0.062 | 0.077 | 0.094 | 0.063 |
| 0.346 | 0.252 | 0.322 | 0.350 | 0.263 | 0.206 | 0.090 | 0.108 | 0.167 | 0.198 | 0.390 | 0.125 | 0.160 | 0.055 | 0.000 | 0.050 | 0.049 | 0.103 | 0.053 | 0.082 | 0.116 | 0.180 | 0.113 | 0.069 | 0.085 | 0.085 | 0.132 | 0.054 |
| 0.343 | 0.249 | 0.320 | 0.348 | 0.261 | 0.204 | 0.128 | 0.121 | 0.156 | 0.182 | 0.367 | 0.124 | 0.159 | 0.067 | 0.050 | 0.000 | 0.041 | 0.104 | 0.030 | 0.032 | 0.130 | 0.180 | 0.138 | 0.084 | 0.102 | 0.063 | 0.110 | 0.102 |
| 0.370 | 0.275 | 0.323 | 0.351 | 0.263 | 0.207 | 0.129 | 0.108 | 0.144 | 0.208 | 0.393 | 0.113 | 0.150 | 0.053 | 0.049 | 0.041 | 0.000 | 0.118 | 0.044 | 0.055 | 0.129 | 0.198 | 0.132 | 0.070 | 0.086 | 0.050 | 0.098 | 0.091 |
| 0.330 | 0.270 | 0.412 | 0.440 | 0.353 | 0.296 | 0.138 | 0.212 | 0.260 | 0.165 | 0.350 | 0.228 | 0.262 | 0.127 | 0.103 | 0.104 | 0.118 | 0.000 | 0.114 | 0.114 | 0.058 | 0.081 | 0.058 | 0.108 | 0.119 | 0.166 | 0.213 | 0.104 |
| 0.373 | 0.278 | 0.298 | 0.326 | 0.239 | 0.182 | 0.113 | 0.123 | 0.160 | 0.211 | 0.396 | 0.129 | 0.163 | 0.065 | 0.053 | 0.030 | 0.044 | 0.114 | 0.000 | 0.053 | 0.135 | 0.181 | 0.124 | 0.086 | 0.100 | 0.067 | 0.114 | 0.105 |
| 0.333 | 0.239 | 0.306 | 0.334 | 0.247 | 0.190 | 0.156 | 0.138 | 0.145 | 0.172 | 0.357 | 0.116 | 0.148 | 0.081 | 0.082 | 0.032 | 0.055 | 0.114 | 0.053 | 0.000 | 0.155 | 0.193 | 0.163 | 0.116 | 0.130 | 0.071 | 0.111 | 0.134 |
| 0.379 | 0.320 | 0.433 | 0.461 | 0.373 | 0.317 | 0.147 | 0.224 | 0.272 | 0.210 | 0.388 | 0.241 | 0.275 | 0.140 | 0.116 | 0.130 | 0.129 | 0.058 | 0.135 | 0.155 | 0.000 | 0.108 | 0.014 | 0.105 | 0.097 | 0.179 | 0.226 | 0.104 |
| 0.362 | 0.303 | 0.475 | 0.503 | 0.416 | 0.359 | 0.197 | 0.288 | 0.336 | 0.194 | 0.302 | 0.304 | 0.338 | 0.203 | 0.180 | 0.180 | 0.198 | 0.081 | 0.181 | 0.193 | 0.108 | 0.000 | 0.113 | 0.168 | 0.180 | 0.242 | 0.290 | 0.168 |
| 0.387 | 0.328 | 0.419 | 0.447 | 0.359 | 0.303 | 0.133 | 0.219 | 0.267 | 0.218 | 0.402 | 0.235 | 0.269 | 0.134 | 0.113 | 0.138 | 0.132 | 0.058 | 0.124 | 0.163 | 0.014 | 0.113 | 0.000 | 0.099 | 0.091 | 0.173 | 0.220 | 0.099 |
| 0.402 | 0.308 | 0.347 | 0.375 | 0.287 | 0.231 | 0.063 | 0.132 | 0.168 | 0.240 | 0.425 | 0.137 | 0.175 | 0.053 | 0.069 | 0.084 | 0.070 | 0.108 | 0.086 | 0.116 | 0.105 | 0.168 | 0.099 | 0.000 | 0.024 | 0.094 | 0.121 | 0.025 |
| 0.424 | 0.330 | 0.352 | 0.381 | 0.293 | 0.236 | 0.068 | 0.138 | 0.180 | 0.263 | 0.448 | 0.148 | 0.182 | 0.062 | 0.085 | 0.102 | 0.086 | 0.119 | 0.100 | 0.130 | 0.097 | 0.180 | 0.091 | 0.024 | 0.000 | 0.118 | 0.133 | 0.044 |
| 0.381 | 0.287 | 0.279 | 0.302 | 0.215 | 0.158 | 0.154 | 0.081 | 0.094 | 0.220 | 0.404 | 0.064 | 0.102 | 0.077 | 0.085 | 0.063 | 0.050 | 0.166 | 0.067 | 0.071 | 0.179 | 0.242 | 0.173 | 0.094 | 0.118 | 0.000 | 0.047 | 0.116 |
| 0.419 | 0.325 | 0.279 | 0.255 | 0.168 | 0.140 | 0.160 | 0.078 | 0.046 | 0.258 | 0.443 | 0.025 | 0.055 | 0.094 | 0.132 | 0.110 | 0.098 | 0.213 | 0.114 | 0.111 | 0.226 | 0.290 | 0.220 | 0.121 | 0.133 | 0.047 | 0.000 | 0.142 |
| 0.380 | 0.286 | 0.344 | 0.372 | 0.284 | 0.228 | 0.059 | 0.129 | 0.177 | 0.230 | 0.422 | 0.136 | 0.172 | 0.063 | 0.054 | 0.102 | 0.091 | 0.104 | 0.105 | 0.134 | 0.104 | 0.168 | 0.099 | 0.025 | 0.044 | 0.116 | 0.142 | 0.000 |
| 1992 | 1993 | 1994 | 1995 | 1996 | 1997 | 1998 | 1999 | 2000 | 2001 | 2002 | 2003 | 2004 | 2005 | 2006 | 2007 | 2008 | 2009 | 2010 | 2011 | 2012 | 2013 | 2014 | 2015 | 2016 | 2017 | 2018 | 2019 | 2020 |
|---|---|---|---|---|---|---|---|---|---|---|---|---|---|---|---|---|---|---|---|---|---|---|---|---|---|---|---|---|
| 0.000 | 0.001 | 0.003 | 0.035 | 0.042 | 0.078 | 0.133 | 0.103 | 0.111 | 0.107 | 0.071 | 0.156 | 0.196 | 0.226 | 0.218 | 0.255 | 0.242 | 0.293 | 0.250 | 0.258 | 0.269 | 0.251 | 0.280 | 0.257 | 0.234 | 0.256 | 0.297 | 0.317 | 0.396 |
| 0.001 | 0.000 | 0.004 | 0.035 | 0.042 | 0.079 | 0.133 | 0.104 | 0.112 | 0.107 | 0.072 | 0.156 | 0.197 | 0.226 | 0.218 | 0.255 | 0.242 | 0.294 | 0.250 | 0.259 | 0.269 | 0.252 | 0.281 | 0.258 | 0.235 | 0.256 | 0.297 | 0.318 | 0.397 |
| 0.003 | 0.004 | 0.000 | 0.032 | 0.039 | 0.075 | 0.130 | 0.100 | 0.109 | 0.104 | 0.069 | 0.153 | 0.193 | 0.223 | 0.215 | 0.252 | 0.238 | 0.290 | 0.247 | 0.255 | 0.266 | 0.248 | 0.278 | 0.254 | 0.232 | 0.253 | 0.294 | 0.315 | 0.393 |
| 0.035 | 0.035 | 0.032 | 0.000 | 0.028 | 0.050 | 0.105 | 0.075 | 0.081 | 0.072 | 0.043 | 0.129 | 0.166 | 0.195 | 0.186 | 0.220 | 0.214 | 0.265 | 0.215 | 0.230 | 0.234 | 0.217 | 0.246 | 0.222 | 0.200 | 0.221 | 0.262 | 0.283 | 0.368 |
| 0.042 | 0.042 | 0.039 | 0.028 | 0.000 | 0.045 | 0.108 | 0.064 | 0.097 | 0.089 | 0.059 | 0.145 | 0.178 | 0.204 | 0.196 | 0.233 | 0.213 | 0.252 | 0.228 | 0.235 | 0.247 | 0.229 | 0.259 | 0.235 | 0.213 | 0.234 | 0.275 | 0.296 | 0.355 |
| 0.078 | 0.079 | 0.075 | 0.050 | 0.045 | 0.000 | 0.062 | 0.025 | 0.055 | 0.046 | 0.022 | 0.104 | 0.135 | 0.159 | 0.151 | 0.188 | 0.168 | 0.215 | 0.183 | 0.189 | 0.202 | 0.184 | 0.213 | 0.190 | 0.167 | 0.189 | 0.230 | 0.250 | 0.318 |
| 0.133 | 0.133 | 0.130 | 0.105 | 0.108 | 0.062 | 0.000 | 0.045 | 0.035 | 0.036 | 0.076 | 0.064 | 0.083 | 0.099 | 0.095 | 0.129 | 0.119 | 0.161 | 0.120 | 0.127 | 0.140 | 0.122 | 0.151 | 0.128 | 0.105 | 0.127 | 0.167 | 0.188 | 0.264 |
| 0.103 | 0.104 | 0.100 | 0.075 | 0.064 | 0.025 | 0.045 | 0.000 | 0.058 | 0.047 | 0.047 | 0.107 | 0.126 | 0.141 | 0.138 | 0.171 | 0.158 | 0.190 | 0.164 | 0.171 | 0.183 | 0.166 | 0.195 | 0.172 | 0.149 | 0.170 | 0.211 | 0.232 | 0.293 |
| 0.111 | 0.112 | 0.109 | 0.081 | 0.097 | 0.055 | 0.035 | 0.058 | 0.000 | 0.017 | 0.047 | 0.050 | 0.092 | 0.120 | 0.111 | 0.146 | 0.139 | 0.191 | 0.140 | 0.155 | 0.160 | 0.142 | 0.171 | 0.148 | 0.125 | 0.147 | 0.187 | 0.208 | 0.293 |
| 0.107 | 0.107 | 0.104 | 0.072 | 0.089 | 0.046 | 0.036 | 0.047 | 0.017 | 0.000 | 0.041 | 0.062 | 0.099 | 0.128 | 0.120 | 0.151 | 0.148 | 0.197 | 0.145 | 0.162 | 0.162 | 0.144 | 0.173 | 0.150 | 0.127 | 0.149 | 0.190 | 0.210 | 0.300 |
| 0.071 | 0.072 | 0.069 | 0.043 | 0.059 | 0.022 | 0.076 | 0.047 | 0.047 | 0.041 | 0.000 | 0.086 | 0.132 | 0.167 | 0.158 | 0.189 | 0.185 | 0.237 | 0.185 | 0.202 | 0.203 | 0.185 | 0.214 | 0.191 | 0.168 | 0.190 | 0.231 | 0.251 | 0.340 |
| 0.156 | 0.156 | 0.153 | 0.129 | 0.145 | 0.104 | 0.064 | 0.107 | 0.050 | 0.062 | 0.086 | 0.000 | 0.055 | 0.118 | 0.113 | 0.142 | 0.143 | 0.200 | 0.145 | 0.164 | 0.163 | 0.139 | 0.157 | 0.136 | 0.110 | 0.140 | 0.178 | 0.193 | 0.299 |
| 0.196 | 0.197 | 0.193 | 0.166 | 0.178 | 0.135 | 0.083 | 0.126 | 0.092 | 0.099 | 0.132 | 0.055 | 0.000 | 0.066 | 0.061 | 0.090 | 0.091 | 0.148 | 0.093 | 0.111 | 0.110 | 0.087 | 0.105 | 0.084 | 0.058 | 0.088 | 0.126 | 0.141 | 0.247 |
| 0.226 | 0.226 | 0.223 | 0.195 | 0.204 | 0.159 | 0.099 | 0.141 | 0.120 | 0.128 | 0.167 | 0.118 | 0.066 | 0.000 | 0.009 | 0.036 | 0.033 | 0.083 | 0.032 | 0.046 | 0.053 | 0.034 | 0.063 | 0.042 | 0.039 | 0.040 | 0.080 | 0.101 | 0.182 |
| 0.218 | 0.218 | 0.215 | 0.186 | 0.196 | 0.151 | 0.095 | 0.138 | 0.111 | 0.120 | 0.158 | 0.113 | 0.061 | 0.009 | 0.000 | 0.040 | 0.033 | 0.088 | 0.037 | 0.051 | 0.058 | 0.038 | 0.068 | 0.046 | 0.044 | 0.044 | 0.085 | 0.105 | 0.187 |
| 0.255 | 0.255 | 0.252 | 0.220 | 0.233 | 0.188 | 0.129 | 0.171 | 0.146 | 0.151 | 0.189 | 0.142 | 0.090 | 0.036 | 0.040 | 0.000 | 0.028 | 0.058 | 0.027 | 0.021 | 0.026 | 0.017 | 0.030 | 0.026 | 0.050 | 0.030 | 0.045 | 0.066 | 0.157 |
| 0.242 | 0.242 | 0.238 | 0.214 | 0.213 | 0.168 | 0.119 | 0.158 | 0.139 | 0.148 | 0.185 | 0.143 | 0.091 | 0.033 | 0.033 | 0.028 | 0.000 | 0.058 | 0.044 | 0.030 | 0.052 | 0.041 | 0.058 | 0.054 | 0.057 | 0.057 | 0.065 | 0.086 | 0.157 |
| 0.293 | 0.294 | 0.290 | 0.265 | 0.252 | 0.215 | 0.161 | 0.190 | 0.191 | 0.197 | 0.237 | 0.200 | 0.148 | 0.083 | 0.088 | 0.058 | 0.058 | 0.000 | 0.056 | 0.037 | 0.045 | 0.064 | 0.069 | 0.069 | 0.091 | 0.072 | 0.063 | 0.072 | 0.103 |
| 0.250 | 0.250 | 0.247 | 0.215 | 0.228 | 0.183 | 0.120 | 0.164 | 0.140 | 0.145 | 0.185 | 0.145 | 0.093 | 0.032 | 0.037 | 0.027 | 0.044 | 0.056 | 0.000 | 0.023 | 0.024 | 0.014 | 0.043 | 0.023 | 0.037 | 0.024 | 0.048 | 0.071 | 0.155 |
| 0.258 | 0.259 | 0.255 | 0.230 | 0.235 | 0.189 | 0.127 | 0.171 | 0.155 | 0.162 | 0.202 | 0.164 | 0.111 | 0.046 | 0.051 | 0.021 | 0.030 | 0.037 | 0.023 | 0.000 | 0.022 | 0.031 | 0.042 | 0.037 | 0.058 | 0.039 | 0.041 | 0.065 | 0.138 |
| 0.269 | 0.269 | 0.266 | 0.234 | 0.247 | 0.202 | 0.140 | 0.183 | 0.160 | 0.162 | 0.203 | 0.163 | 0.110 | 0.053 | 0.058 | 0.026 | 0.052 | 0.045 | 0.024 | 0.022 | 0.000 | 0.028 | 0.030 | 0.033 | 0.055 | 0.036 | 0.033 | 0.057 | 0.139 |
| 0.251 | 0.252 | 0.248 | 0.217 | 0.229 | 0.184 | 0.122 | 0.166 | 0.142 | 0.144 | 0.185 | 0.139 | 0.087 | 0.034 | 0.038 | 0.017 | 0.041 | 0.064 | 0.014 | 0.031 | 0.028 | 0.000 | 0.030 | 0.013 | 0.035 | 0.016 | 0.047 | 0.067 | 0.160 |
| 0.280 | 0.281 | 0.278 | 0.246 | 0.259 | 0.213 | 0.151 | 0.195 | 0.171 | 0.173 | 0.214 | 0.157 | 0.105 | 0.063 | 0.068 | 0.030 | 0.058 | 0.069 | 0.043 | 0.042 | 0.030 | 0.030 | 0.000 | 0.023 | 0.052 | 0.030 | 0.023 | 0.038 | 0.145 |
| 0.257 | 0.258 | 0.254 | 0.222 | 0.235 | 0.190 | 0.128 | 0.172 | 0.148 | 0.150 | 0.191 | 0.136 | 0.084 | 0.042 | 0.046 | 0.026 | 0.054 | 0.069 | 0.023 | 0.037 | 0.033 | 0.013 | 0.023 | 0.000 | 0.030 | 0.011 | 0.043 | 0.060 | 0.166 |
| 0.234 | 0.235 | 0.232 | 0.200 | 0.213 | 0.167 | 0.105 | 0.149 | 0.125 | 0.127 | 0.168 | 0.110 | 0.058 | 0.039 | 0.044 | 0.050 | 0.057 | 0.091 | 0.037 | 0.058 | 0.055 | 0.035 | 0.052 | 0.030 | 0.000 | 0.032 | 0.068 | 0.083 | 0.191 |
| 0.256 | 0.256 | 0.253 | 0.221 | 0.234 | 0.189 | 0.127 | 0.170 | 0.147 | 0.149 | 0.190 | 0.140 | 0.088 | 0.040 | 0.044 | 0.030 | 0.057 | 0.072 | 0.024 | 0.039 | 0.036 | 0.016 | 0.030 | 0.011 | 0.032 | 0.000 | 0.047 | 0.064 | 0.161 |
| 0.297 | 0.297 | 0.294 | 0.262 | 0.275 | 0.230 | 0.167 | 0.211 | 0.187 | 0.190 | 0.231 | 0.178 | 0.126 | 0.080 | 0.085 | 0.045 | 0.065 | 0.063 | 0.048 | 0.041 | 0.033 | 0.047 | 0.023 | 0.043 | 0.068 | 0.047 | 0.000 | 0.025 | 0.141 |
| 0.317 | 0.318 | 0.315 | 0.283 | 0.296 | 0.250 | 0.188 | 0.232 | 0.208 | 0.210 | 0.251 | 0.193 | 0.141 | 0.101 | 0.105 | 0.066 | 0.086 | 0.072 | 0.071 | 0.065 | 0.057 | 0.067 | 0.038 | 0.060 | 0.083 | 0.064 | 0.025 | 0.000 | 0.147 |
| 0.396 | 0.397 | 0.393 | 0.368 | 0.355 | 0.318 | 0.264 | 0.293 | 0.293 | 0.300 | 0.340 | 0.299 | 0.247 | 0.182 | 0.187 | 0.157 | 0.157 | 0.103 | 0.155 | 0.138 | 0.139 | 0.160 | 0.145 | 0.166 | 0.191 | 0.161 | 0.141 | 0.147 | 0.000 |
| 2004 | 2005 | 2006 | 2007 | 2008 | 2009 | 2010 | 2011 | 2012 | 2013 | 2014 | 2015 | 2016 | 2017 | 2018 | 2019 | 2020 |
|---|---|---|---|---|---|---|---|---|---|---|---|---|---|---|---|---|
| 0.000 | 0.013 | 0.027 | 0.006 | 0.024 | 0.052 | 0.057 | 0.060 | 0.076 | 0.071 | 0.074 | 0.063 | 0.058 | 0.073 | 0.014 | 0.043 | 0.046 |
| 0.013 | 0.000 | 0.015 | 0.015 | 0.013 | 0.040 | 0.046 | 0.048 | 0.065 | 0.060 | 0.063 | 0.056 | 0.058 | 0.072 | 0.017 | 0.030 | 0.034 |
| 0.027 | 0.015 | 0.000 | 0.029 | 0.009 | 0.026 | 0.032 | 0.034 | 0.051 | 0.046 | 0.058 | 0.056 | 0.059 | 0.072 | 0.031 | 0.016 | 0.019 |
| 0.006 | 0.015 | 0.029 | 0.000 | 0.022 | 0.049 | 0.056 | 0.059 | 0.075 | 0.070 | 0.075 | 0.064 | 0.061 | 0.078 | 0.010 | 0.044 | 0.047 |
| 0.024 | 0.013 | 0.009 | 0.022 | 0.000 | 0.028 | 0.036 | 0.038 | 0.055 | 0.050 | 0.061 | 0.059 | 0.062 | 0.079 | 0.025 | 0.025 | 0.028 |
| 0.052 | 0.040 | 0.026 | 0.049 | 0.028 | 0.000 | 0.008 | 0.012 | 0.027 | 0.022 | 0.061 | 0.059 | 0.062 | 0.080 | 0.051 | 0.026 | 0.020 |
| 0.057 | 0.046 | 0.032 | 0.056 | 0.036 | 0.008 | 0.000 | 0.009 | 0.019 | 0.014 | 0.059 | 0.058 | 0.064 | 0.082 | 0.053 | 0.030 | 0.024 |
| 0.060 | 0.048 | 0.034 | 0.059 | 0.038 | 0.012 | 0.009 | 0.000 | 0.016 | 0.011 | 0.059 | 0.059 | 0.071 | 0.091 | 0.051 | 0.032 | 0.027 |
| 0.076 | 0.065 | 0.051 | 0.075 | 0.055 | 0.027 | 0.019 | 0.016 | 0.000 | 0.007 | 0.064 | 0.069 | 0.083 | 0.096 | 0.067 | 0.048 | 0.043 |
| 0.071 | 0.060 | 0.046 | 0.070 | 0.050 | 0.022 | 0.014 | 0.011 | 0.007 | 0.000 | 0.059 | 0.064 | 0.078 | 0.095 | 0.062 | 0.043 | 0.038 |
| 0.074 | 0.063 | 0.058 | 0.075 | 0.061 | 0.061 | 0.059 | 0.059 | 0.064 | 0.059 | 0.000 | 0.011 | 0.023 | 0.039 | 0.067 | 0.059 | 0.060 |
| 0.063 | 0.056 | 0.056 | 0.064 | 0.059 | 0.059 | 0.058 | 0.059 | 0.069 | 0.064 | 0.011 | 0.000 | 0.014 | 0.032 | 0.058 | 0.058 | 0.058 |
| 0.058 | 0.058 | 0.059 | 0.061 | 0.062 | 0.062 | 0.064 | 0.071 | 0.083 | 0.078 | 0.023 | 0.014 | 0.000 | 0.019 | 0.068 | 0.061 | 0.061 |
| 0.073 | 0.072 | 0.072 | 0.078 | 0.079 | 0.080 | 0.082 | 0.091 | 0.096 | 0.095 | 0.039 | 0.032 | 0.019 | 0.000 | 0.087 | 0.068 | 0.069 |
| 0.014 | 0.017 | 0.031 | 0.010 | 0.025 | 0.051 | 0.053 | 0.051 | 0.067 | 0.062 | 0.067 | 0.058 | 0.068 | 0.087 | 0.000 | 0.045 | 0.048 |
| 0.043 | 0.030 | 0.016 | 0.044 | 0.025 | 0.026 | 0.030 | 0.032 | 0.048 | 0.043 | 0.059 | 0.058 | 0.061 | 0.068 | 0.045 | 0.000 | 0.007 |
| 0.046 | 0.034 | 0.019 | 0.047 | 0.028 | 0.020 | 0.024 | 0.027 | 0.043 | 0.038 | 0.060 | 0.058 | 0.061 | 0.069 | 0.048 | 0.007 | 0.000 |
| 1990 | 1991 | 1992 | 1993 | 1994 | 1995 | 1996 | 1997 | 1998 | 1999 | 2000 | 2001 | 2002 | 2003 | 2004 | 2005 | 2006 | 2007 | 2008 | 2009 | 2010 | 2011 | 2012 | 2013 | 2014 | 2015 | 2016 | 2017 | 2018 | 2019 | 2020 |
|---|---|---|---|---|---|---|---|---|---|---|---|---|---|---|---|---|---|---|---|---|---|---|---|---|---|---|---|---|---|---|
| 0.000 | 0.013 | 0.015 | 0.017 | 0.011 | 0.011 | 0.018 | 0.017 | 0.019 | 0.021 | 0.033 | 0.030 | 0.035 | 0.035 | 0.043 | 0.054 | 0.078 | 0.089 | 0.073 | 0.086 | 0.097 | 0.113 | 0.139 | 0.131 | 0.154 | 0.177 | 0.185 | 0.196 | 0.202 | 0.246 | 0.286 |
| 0.013 | 0.000 | 0.003 | 0.005 | 0.009 | 0.022 | 0.028 | 0.026 | 0.021 | 0.027 | 0.045 | 0.039 | 0.045 | 0.049 | 0.051 | 0.065 | 0.090 | 0.100 | 0.079 | 0.089 | 0.109 | 0.113 | 0.139 | 0.131 | 0.155 | 0.178 | 0.186 | 0.197 | 0.204 | 0.247 | 0.287 |
| 0.015 | 0.003 | 0.000 | 0.003 | 0.008 | 0.021 | 0.028 | 0.027 | 0.021 | 0.027 | 0.045 | 0.038 | 0.044 | 0.050 | 0.052 | 0.067 | 0.092 | 0.102 | 0.081 | 0.091 | 0.110 | 0.113 | 0.139 | 0.130 | 0.154 | 0.177 | 0.185 | 0.196 | 0.202 | 0.246 | 0.286 |
| 0.017 | 0.005 | 0.003 | 0.000 | 0.010 | 0.024 | 0.030 | 0.029 | 0.023 | 0.029 | 0.047 | 0.040 | 0.047 | 0.052 | 0.054 | 0.069 | 0.093 | 0.104 | 0.083 | 0.092 | 0.112 | 0.112 | 0.139 | 0.131 | 0.154 | 0.177 | 0.185 | 0.197 | 0.203 | 0.247 | 0.286 |
| 0.011 | 0.009 | 0.008 | 0.010 | 0.000 | 0.015 | 0.022 | 0.021 | 0.014 | 0.020 | 0.037 | 0.030 | 0.038 | 0.043 | 0.046 | 0.061 | 0.086 | 0.096 | 0.075 | 0.085 | 0.104 | 0.110 | 0.137 | 0.129 | 0.152 | 0.174 | 0.182 | 0.194 | 0.200 | 0.244 | 0.284 |
| 0.011 | 0.022 | 0.021 | 0.024 | 0.015 | 0.000 | 0.009 | 0.009 | 0.015 | 0.013 | 0.024 | 0.023 | 0.028 | 0.030 | 0.039 | 0.051 | 0.073 | 0.083 | 0.069 | 0.082 | 0.093 | 0.109 | 0.135 | 0.127 | 0.150 | 0.173 | 0.182 | 0.192 | 0.198 | 0.242 | 0.282 |
| 0.018 | 0.028 | 0.028 | 0.030 | 0.022 | 0.009 | 0.000 | 0.005 | 0.018 | 0.013 | 0.017 | 0.021 | 0.025 | 0.026 | 0.035 | 0.047 | 0.064 | 0.075 | 0.065 | 0.078 | 0.089 | 0.105 | 0.132 | 0.124 | 0.148 | 0.170 | 0.178 | 0.190 | 0.196 | 0.240 | 0.280 |
| 0.017 | 0.026 | 0.027 | 0.029 | 0.021 | 0.009 | 0.005 | 0.000 | 0.015 | 0.010 | 0.019 | 0.019 | 0.023 | 0.024 | 0.033 | 0.047 | 0.067 | 0.076 | 0.063 | 0.077 | 0.087 | 0.103 | 0.131 | 0.123 | 0.147 | 0.169 | 0.176 | 0.189 | 0.195 | 0.239 | 0.279 |
| 0.019 | 0.021 | 0.021 | 0.023 | 0.014 | 0.015 | 0.018 | 0.015 | 0.000 | 0.008 | 0.028 | 0.020 | 0.029 | 0.034 | 0.037 | 0.054 | 0.077 | 0.086 | 0.065 | 0.075 | 0.094 | 0.101 | 0.129 | 0.121 | 0.145 | 0.167 | 0.175 | 0.188 | 0.195 | 0.239 | 0.278 |
| 0.021 | 0.027 | 0.027 | 0.029 | 0.020 | 0.013 | 0.013 | 0.010 | 0.008 | 0.000 | 0.020 | 0.013 | 0.022 | 0.026 | 0.029 | 0.047 | 0.070 | 0.079 | 0.059 | 0.073 | 0.087 | 0.099 | 0.127 | 0.119 | 0.142 | 0.165 | 0.173 | 0.186 | 0.192 | 0.236 | 0.275 |
| 0.033 | 0.045 | 0.045 | 0.047 | 0.037 | 0.024 | 0.017 | 0.019 | 0.028 | 0.020 | 0.000 | 0.016 | 0.015 | 0.016 | 0.027 | 0.041 | 0.052 | 0.061 | 0.056 | 0.071 | 0.080 | 0.097 | 0.125 | 0.116 | 0.139 | 0.161 | 0.169 | 0.182 | 0.188 | 0.232 | 0.272 |
| 0.030 | 0.039 | 0.038 | 0.040 | 0.030 | 0.023 | 0.021 | 0.019 | 0.020 | 0.013 | 0.016 | 0.000 | 0.010 | 0.014 | 0.019 | 0.037 | 0.060 | 0.069 | 0.049 | 0.063 | 0.076 | 0.092 | 0.120 | 0.111 | 0.135 | 0.156 | 0.164 | 0.177 | 0.183 | 0.227 | 0.267 |
| 0.035 | 0.045 | 0.044 | 0.047 | 0.038 | 0.028 | 0.025 | 0.023 | 0.029 | 0.022 | 0.015 | 0.010 | 0.000 | 0.007 | 0.013 | 0.028 | 0.051 | 0.061 | 0.043 | 0.057 | 0.068 | 0.086 | 0.114 | 0.105 | 0.128 | 0.151 | 0.159 | 0.171 | 0.177 | 0.221 | 0.261 |
| 0.035 | 0.049 | 0.050 | 0.052 | 0.043 | 0.030 | 0.026 | 0.024 | 0.034 | 0.026 | 0.016 | 0.014 | 0.007 | 0.000 | 0.015 | 0.029 | 0.046 | 0.055 | 0.041 | 0.056 | 0.065 | 0.085 | 0.113 | 0.104 | 0.127 | 0.149 | 0.157 | 0.169 | 0.176 | 0.220 | 0.260 |
| 0.043 | 0.051 | 0.052 | 0.054 | 0.046 | 0.039 | 0.035 | 0.033 | 0.037 | 0.029 | 0.027 | 0.019 | 0.013 | 0.015 | 0.000 | 0.020 | 0.042 | 0.053 | 0.033 | 0.047 | 0.061 | 0.076 | 0.104 | 0.096 | 0.119 | 0.141 | 0.150 | 0.162 | 0.169 | 0.213 | 0.252 |
| 0.054 | 0.065 | 0.067 | 0.069 | 0.061 | 0.051 | 0.047 | 0.047 | 0.054 | 0.047 | 0.041 | 0.037 | 0.028 | 0.029 | 0.020 | 0.000 | 0.029 | 0.041 | 0.022 | 0.034 | 0.047 | 0.062 | 0.091 | 0.083 | 0.106 | 0.129 | 0.137 | 0.150 | 0.157 | 0.201 | 0.240 |
| 0.078 | 0.090 | 0.092 | 0.093 | 0.086 | 0.073 | 0.064 | 0.067 | 0.077 | 0.070 | 0.052 | 0.060 | 0.051 | 0.046 | 0.042 | 0.029 | 0.000 | 0.012 | 0.031 | 0.034 | 0.046 | 0.062 | 0.093 | 0.093 | 0.111 | 0.129 | 0.137 | 0.150 | 0.156 | 0.201 | 0.239 |
| 0.089 | 0.100 | 0.102 | 0.104 | 0.096 | 0.083 | 0.075 | 0.076 | 0.086 | 0.079 | 0.061 | 0.069 | 0.061 | 0.055 | 0.053 | 0.041 | 0.012 | 0.000 | 0.035 | 0.038 | 0.039 | 0.056 | 0.096 | 0.096 | 0.115 | 0.123 | 0.130 | 0.143 | 0.150 | 0.194 | 0.233 |
| 0.073 | 0.079 | 0.081 | 0.083 | 0.075 | 0.069 | 0.065 | 0.063 | 0.065 | 0.059 | 0.056 | 0.049 | 0.043 | 0.041 | 0.033 | 0.022 | 0.031 | 0.035 | 0.000 | 0.017 | 0.034 | 0.044 | 0.072 | 0.064 | 0.088 | 0.111 | 0.119 | 0.132 | 0.138 | 0.183 | 0.223 |
| 0.086 | 0.089 | 0.091 | 0.092 | 0.085 | 0.082 | 0.078 | 0.077 | 0.075 | 0.073 | 0.071 | 0.063 | 0.057 | 0.056 | 0.047 | 0.034 | 0.034 | 0.038 | 0.017 | 0.000 | 0.024 | 0.030 | 0.061 | 0.061 | 0.080 | 0.098 | 0.106 | 0.120 | 0.126 | 0.170 | 0.209 |
| 0.097 | 0.109 | 0.110 | 0.112 | 0.104 | 0.093 | 0.089 | 0.087 | 0.094 | 0.087 | 0.080 | 0.076 | 0.068 | 0.065 | 0.061 | 0.047 | 0.046 | 0.039 | 0.034 | 0.024 | 0.000 | 0.034 | 0.074 | 0.073 | 0.092 | 0.099 | 0.095 | 0.115 | 0.121 | 0.160 | 0.199 |
| 0.113 | 0.113 | 0.113 | 0.112 | 0.110 | 0.109 | 0.105 | 0.103 | 0.101 | 0.099 | 0.097 | 0.092 | 0.086 | 0.085 | 0.076 | 0.062 | 0.062 | 0.056 | 0.044 | 0.030 | 0.034 | 0.000 | 0.041 | 0.046 | 0.062 | 0.068 | 0.078 | 0.102 | 0.108 | 0.144 | 0.181 |
| 0.139 | 0.139 | 0.139 | 0.139 | 0.137 | 0.135 | 0.132 | 0.131 | 0.129 | 0.127 | 0.125 | 0.120 | 0.114 | 0.113 | 0.104 | 0.091 | 0.093 | 0.096 | 0.072 | 0.061 | 0.074 | 0.041 | 0.000 | 0.020 | 0.027 | 0.044 | 0.066 | 0.090 | 0.094 | 0.132 | 0.169 |
| 0.131 | 0.131 | 0.130 | 0.131 | 0.129 | 0.127 | 0.124 | 0.123 | 0.121 | 0.119 | 0.116 | 0.111 | 0.105 | 0.104 | 0.096 | 0.083 | 0.093 | 0.096 | 0.064 | 0.061 | 0.073 | 0.046 | 0.020 | 0.000 | 0.024 | 0.050 | 0.065 | 0.087 | 0.092 | 0.129 | 0.164 |
| 0.154 | 0.155 | 0.154 | 0.154 | 0.152 | 0.150 | 0.148 | 0.147 | 0.145 | 0.142 | 0.139 | 0.135 | 0.128 | 0.127 | 0.119 | 0.106 | 0.111 | 0.115 | 0.088 | 0.080 | 0.092 | 0.062 | 0.027 | 0.024 | 0.000 | 0.029 | 0.051 | 0.073 | 0.077 | 0.114 | 0.150 |
| 0.177 | 0.178 | 0.177 | 0.177 | 0.174 | 0.173 | 0.170 | 0.169 | 0.167 | 0.165 | 0.161 | 0.156 | 0.151 | 0.149 | 0.141 | 0.129 | 0.129 | 0.123 | 0.111 | 0.098 | 0.099 | 0.068 | 0.044 | 0.050 | 0.029 | 0.000 | 0.029 | 0.049 | 0.060 | 0.090 | 0.127 |
| 0.185 | 0.186 | 0.185 | 0.185 | 0.182 | 0.182 | 0.178 | 0.176 | 0.175 | 0.173 | 0.169 | 0.164 | 0.159 | 0.157 | 0.150 | 0.137 | 0.137 | 0.130 | 0.119 | 0.106 | 0.095 | 0.078 | 0.066 | 0.065 | 0.051 | 0.029 | 0.000 | 0.029 | 0.034 | 0.069 | 0.109 |
| 0.196 | 0.197 | 0.196 | 0.197 | 0.194 | 0.192 | 0.190 | 0.189 | 0.188 | 0.186 | 0.182 | 0.177 | 0.171 | 0.169 | 0.162 | 0.150 | 0.150 | 0.143 | 0.132 | 0.120 | 0.115 | 0.102 | 0.090 | 0.087 | 0.073 | 0.049 | 0.029 | 0.000 | 0.035 | 0.053 | 0.092 |
| 0.202 | 0.204 | 0.202 | 0.203 | 0.200 | 0.198 | 0.196 | 0.195 | 0.195 | 0.192 | 0.188 | 0.183 | 0.177 | 0.176 | 0.169 | 0.157 | 0.156 | 0.150 | 0.138 | 0.126 | 0.121 | 0.108 | 0.094 | 0.092 | 0.077 | 0.060 | 0.034 | 0.035 | 0.000 | 0.048 | 0.091 |
| 0.246 | 0.247 | 0.246 | 0.247 | 0.244 | 0.242 | 0.240 | 0.239 | 0.239 | 0.236 | 0.232 | 0.227 | 0.221 | 0.220 | 0.213 | 0.201 | 0.201 | 0.194 | 0.183 | 0.170 | 0.160 | 0.144 | 0.132 | 0.129 | 0.114 | 0.090 | 0.069 | 0.053 | 0.048 | 0.000 | 0.044 |
| 0.286 | 0.287 | 0.286 | 0.286 | 0.284 | 0.282 | 0.280 | 0.279 | 0.278 | 0.275 | 0.272 | 0.267 | 0.261 | 0.260 | 0.252 | 0.240 | 0.239 | 0.233 | 0.223 | 0.209 | 0.199 | 0.181 | 0.169 | 0.164 | 0.150 | 0.127 | 0.109 | 0.092 | 0.091 | 0.044 | 0.000 |
| Dependent Variables | Independent Variables (Explanatory Variables) | |||||||
|---|---|---|---|---|---|---|---|---|
| Constant | Coefficient | Pearson | Standard Error of Regression | R-Squared | p-Value | F Statistics (F-Value) | Observations | |
| NPS EN | ||||||||
| NPS EMPN | 0.188 | −0.071 | 0.705 | 0.015 | 0.496 | 0.000 | 25.637 | 28 |
| NPS FA | 0.033 | 0.103 | 0.701 | 0.004 | 0.491 | 0.041 | 1.261 | 16 |
| NPS SCO | 0.086 | 1.125 | 0.846 | 0.057 | 0.716 | 0.000 | 65.581 | 28 |
| SCE | 41,000.760 | −30,194.844 | 0.661 | 2745.697 | 0.437 | 0.000 | 20.922 | 29 |
| TP | 120,245.936 | −285,045.130 | 0.884 | 12,096.489 | 0.781 | 0.000 | 96.061 | 29 |
| PCO | 98,946.869 | −233,262.379 | 0.919 | 8,025.344 | 0.844 | 0.000 | 146.150 | 29 |
| NPS EMPN | ||||||||
| NPS FA | 0.098 | 0.085 | 0.385 | 0.005 | 0.148 | 0.000 | 2.437 | 16 |
| NPS IO | ||||||||
| NPS EMPN | 0.064 | 0.074 | 0.328 | 0.016 | 0.108 | 0.001 | 3.012 | 28 |
| NPS FA | 0.063 | −0.041 | 0.080 | 0.025 | 0.003 | 0.005 | 0.036 | 16 |
| TP | 68,104.311 | 61,423.965 | 0.303 | 18,673.687 | 0.092 | 0.013 | 2.519 | 28 |
| PpU | 0.712 | 0.498 | 0.298 | 0.119 | 0.089 | 0.000 | 2.429 | 28 |
| NPS FA | ||||||||
| NPS EMPN | 0.098 | 0.085 | 0.385 | 0.005 | 0.148 | 0.000 | 2.437 | 16 |
| TP | 84,490.058 | −190,457.361 | 0.395 | 10,935.424 | 0.156 | 0.000 | 2.586 | 16 |
| PpU | 0.981 | −0.630 | 0.199 | 0.076 | 0.040 | 0.000 | 0.580 | 16 |
| FA | ||||||||
| PCO | 27,960.320 | −0.160 | 0.866 | 2384.262 | 0.750 | 0.000 | 81.151 | 29 |
| IO | ||||||||
| FA | 6257.254 | 0.004 | 0.741 | 2205.773 | 0.549 | 0.000 | 32.824 | 29 |
| NPS IO | ||||||||
| rFA | 0.118 | 0.137 | 0.317 | 0.092 | 0.101 | 0.000 | 2.796 | 28 |
References
- Tutak, M.; Brodny, J.; Siwiec, D.; Ulewicz, R.; Bindzár, P. Studying the Level of Sustainable Energy Development of the European Union Countries and Their Similarity Based on the Economic and Demographic Potential. Energies 2020, 13, 6643. [Google Scholar] [CrossRef]
- Rodrigues, J.F.D.; Wang, J.; Behrens, P.; de Boer, P. Drivers of CO2 emissions from electricity generation in the European Union 2000–2015. Renew. Sustain. Energy Rev. 2020, 133, 110104. [Google Scholar] [CrossRef]
- Kaczmarek, J.; Krzemiński, P.; Litwa, P.; Szymla, W. Procesy Zmian W Okresie Transformacji Systemowej. Prywatyzacja, Restrukturyzacja, Rynek Kapitałowy (Processes of Change during Systemic Transformation. Privatization, Restructuring, Capital Market); Wydawnictwo Akademii Ekonomicznej w Krakowie: Kraków, Poland, 2005; pp. 102–103. [Google Scholar]
- Fischer, S.; Sahay, R.; Vegh, C.A. Stabilization and Growth in Transition Economies: The Early Experience. J. Econ. Perspect. 1996, 10, 45–66. [Google Scholar] [CrossRef]
- Blanchard, O. Assesment of the Economic Transition in Central and Eastern Europe—Theoretical Aspects of Transition. Am. Econ. Rev. 1996, 86, 117–122. Available online: https://www.jstor.org/stable/i337086 (accessed on 12 January 2022).
- Åslund, A.; Boone, P.; Johnson, S. How to Stabilize: Lessons from Post-Communist Countries. Brook. Pap. Econ. Act. 1996, 1, 217–313. [Google Scholar] [CrossRef]
- Kuznets, S. Economic Growth of Nations. In Total Output and Production Structure; HUP Belknap Press Imprint: Cambridge, UK, 2013; pp. 10–18. [Google Scholar]
- Kaczmarek, J. The Role of Structural Policies in Counteracting the Crisis. In Moving from the Crisis to Sustainability. Emerging Issues in the International Context; Calabro, G., D’Amico, A., Lanfranchi, M., Moschella, G., Pulejo, L., Salomone, R., Eds.; Edizioni Franco Angeli: Milano, Italy, 2011; pp. 45–54. [Google Scholar]
- Peres, W.; Primi, A. Theory and Practice of Industrial Policy: Evidence from the Latin American Experience; UN Cepal: Santiago, Chile, 2009; Volume 187, pp. 1–51. Available online: https://www.cepal.org/en/publications/4582-theory-and-practice-industrial-policy-evidence-latin-american-experience (accessed on 12 January 2022).
- Kaczmarek, J. The Stance, Factors, and Composition of Competitiveness of SMEs in Poland. Sustainability 2022, 14, 1788. [Google Scholar] [CrossRef]
- Hübner, D. Transformacja i rozwój (Transformation and development). In Gospodarka Polski W Procesie Transformacji; IRiSS: Warszawa, Poland, 1992; p. 153. [Google Scholar]
- Koźmiński, A.; Obłój, K. Zarys Teorii Równowagi Organizacyjnej (Outline of Organizational Balance Theory); PWE: Warszawa, Poland, 1989; ISBN 832080728X. [Google Scholar]
- Singh, H. Challenges in Researching Corporate Restructuring. J. Manag. Stud. 1993, 30, 147–172. [Google Scholar] [CrossRef]
- Stoner, J.A.F.; Freeman, R.E.; Gilbert, D.R. Management; Prentice Hall: Hoboken, NJ, USA, 1995; pp. 260–269. [Google Scholar]
- Griffin, R.W. Management; Cengage Learning: Boston, MA, USA, 2016; pp. 392–397. [Google Scholar]
- Porter, M.E. Competitive Adventage: Creating and Sustaining Superiorer Performance; The Free Press: New York, NY, USA, 1998; pp. 50–62. [Google Scholar]
- Slatter, S. Corporate Recovery: A Guide to Turnaround Management; Penguin Business: London, UK, 1984; pp. 81–92. [Google Scholar]
- Copeland, T.; Koller, T.; Murrin, J. Valuation—Measuring and Managing the Values of Companies; John Wiley Sons: New York, NY, USA, 2000; pp. 301–308. [Google Scholar]
- Danovi, A.; Magno, F.; Dossena, G. Pursuing Firm Economic Sustainability through Debt Restructuring Agreements in Italy: An Empirical Analysis. Sustainability 2018, 10, 4830. [Google Scholar] [CrossRef]
- Ho, L.-H.; Tsai, C.-C. A Model Constructed to Evaluate Sustainable Operation and Development of State-Owned Enterprises after Restructuring. Sustainability 2018, 10, 2354. [Google Scholar] [CrossRef]
- Lis, A. Typologia restrukturyzacji (Typology of restructuring). Przegląd Organ. 2004, 4, 9–12. [Google Scholar] [CrossRef]
- Nogalski, B.; Hałaczkiewicz, M.; Witt, J. Restrukturyzacja Procesowa W Zarządzaniu Małymi I Średnimi Przedsiębiorstwami (Process-oriented Restructuring in the Management of Small and Medium Enterprises); OPO TNOiK: Bydgoszcz, Poland, 1999; pp. 10–23. [Google Scholar]
- Kaczmarek, J. The concept and Measurement of Creating Excess Value in Listed Companies. Eng. Econ. 2018, 29, 1392–2785. [Google Scholar] [CrossRef]
- Gajdzik, B.; Gawlik, R. Choosing the Production Function Model for an Optimal Measurement of the Restructuring Efficiency of the Polish Metallurgical Sector in Years 2000–2015. Metals 2018, 8, 23. [Google Scholar] [CrossRef]
- Christensen, C.M.; Marx, M.; Stevenson, H.H. The tools of cooperation and change. Harv. Bus. Rev. 2006, 84, 72–80. Available online: https://hbr.org/2006/10/the-tools-of-cooperation-and-change (accessed on 8 January 2022). [PubMed]
- Kaczmarek, J. The Mechanisms of Creating Value vs. Financial Security of Going Concern-Sustainable Management. Sustainability 2019, 11, 2278. [Google Scholar] [CrossRef]
- Slatter, S.; Lovett, D. Restrukturyzacja Firmy. Zarządzanie Przedsiębiorstwem W Sytuacjach Kryzysowych (Restructuring of Enterprise. Managing a Company in Crisis Situations); WIG-Press: Warszawa, Poland, 2001; pp. 42–48. [Google Scholar]
- Mączyńska, E. Upadłość przedsiębiorstw w kontekście ekonomii kryzysu (Bankruptcy of enterprises in the context of crisis economics). In Zarządzanie Przedsiębiorstwem W Kryzysie; Morawska, S., Ed.; SGH: Warszawa, Poland, 2011; pp. 10–31. [Google Scholar]
- Kaczmarek, J. Measurement of Creating Corporate Value for Shareholders—Development of Measurements and Improvement of Management Competence and Skills. Pol. J. Manag. Stud. 2014, 9, 72–83. Available online: http://oaji.net/articles/2014/1384-1416997716.pdf (accessed on 21 January 2022).
- Platt, H.D.; Platt, M.B. Predicting Corporate Financial Distress: Reflection on Choice-Based Sample Bias. J. Econ. Financ. 2002, 26, 184–199. [Google Scholar] [CrossRef]
- Altman, E.I.; Narayanan, P. An International Survey of Business Failure Classification Models. Financ. Mark. Inst. Instrum. 1997, 6, 1–57. [Google Scholar] [CrossRef]
- Pociecha, J. Model logitowy jako narzędzie prognozowania bankructwa—Jego zalety i wady (The logit model as a tool for predicting bankruptcy—Its advantages and disadvantages). In Spotkania Z Królową Nauk; Malawski, A., Tatar, J., Eds.; Uniwersytet Ekonomiczny w Krakowie: Kraków, Poland, 2012; pp. 60–74. [Google Scholar]
- Pavitt, K. Sectoral patterns of technical change: Towards a taxonomy and a theory. Res. Policy 1984, 13, 343–374. [Google Scholar] [CrossRef]
- Timmer, M.P.; Szirmai, A. Productivity Growth in Asian Manufacturing: The structural bonus hypothesis examined. Struct. Chang. Econ. Dyn. 2000, 11, 371–392. [Google Scholar] [CrossRef]
- Kukuła, K. Statystyczne Metody Analizy Struktur Ekonomicznych (Statistical Methods of the Analysis of Economic Structures); Wydawnictwo Edukacyjne: Cracow, Poland, 1996; pp. 9, 15–17. [Google Scholar]
- Hambrick, D.C. Taxonomic approaches to studying strategy: Some conceptual and methodological issues. J. Manag. 1984, 10, 27–41. [Google Scholar] [CrossRef]
- Consoli, D.; Rentocchini, F. A taxonomy of multi-industry labour force skills. Res. Policy 2015, 44, 1116–1132. [Google Scholar] [CrossRef]
- Archibugi, D. Pavitt’s taxonomy sixteen years on: A review article. Econ. Innov. New Technol. 2001, 3, 415–425. [Google Scholar] [CrossRef]
- Kotelska, J. Restructuring Conditions for Traditional Industry Enterprises in Poland. Zesz. Naukowe. Organ. I Zarządzanie/Politech. Śląska 2019, 134, 93–108. [Google Scholar] [CrossRef]
- Brauers, H.; Oei, P.-Y.; Walk, P. Comparing coal phase-out pathways: The United Kingdom’s and Germany’s diverging transitions. Environ. Innov. Soc. Transit. 2020, 37, 238–253. [Google Scholar] [CrossRef] [PubMed]
- Burns, A.; Winterton, J.; Newby, M. The restructuring of the British coal industry. Camb. J. Econ. 1985, 9, 93–110. [Google Scholar] [CrossRef]
- Turnheim, B.; Geels, F.W. The destabilisation of existing regimes: Confronting a multi-dimensional framework with a case study of the British Coal Industry (1913–1967). Res. Policy 2013, 42, 1749–1767. [Google Scholar] [CrossRef]
- Sovacool, B.K.; Noel, L.; Orsato, R.J. Stretching, embeddedness, and scripts in a sociotechnical transition: Explaining the failure of electric mobility at better place (2007–2013). Technol. Forecast. Soc. Chang. 2017, 123, 24–34. [Google Scholar] [CrossRef]
- Bankier.pl, Kontrowersje Wokół Budowy Pierwszej Od 34 Lat Kopalni Węgla Kamiennego W Wielkiej Brytanii (Controversy over the Construction of the First Hard Coal Mine in Great Britain in 34 Years). Available online: https://www.bankier.pl/wiadomosc/Wielka-Brytania-rozwaza-budowe-pierwszej-od-34-lat-kopalni-wegla-Beda-konsultacje-publiczne-8073599.html (accessed on 21 January 2022).
- Oei, P.-Y.; Brauers, H.; Herpich, P. Lessons from Germany’s hard coal mining phase-out: Policies and transition from 1950 to 2018. Clim. Policy 2020, 20, 963–979. [Google Scholar] [CrossRef]
- Ohlhorst, D. Germany’s energy transition policy between national targets and decentralized responsibilities. J. Integr. Environ. Sci. 2015, 12, 303–322. [Google Scholar] [CrossRef]
- Rogge, K.S.; Pfluger, B.; Geels, F.W. Transformative policy mixes in socio-technical scenarios: The case of the low-carbon transition of the German electricity system (2010–2050). Technol. Forecast. Soc. Chang. 2020, 151, 119259. [Google Scholar] [CrossRef]
- Jonek-Kowalska, I.; Wolny, M.; Sojda, A. Analiza trendów i korelacji cen węgla kamiennego na rynkach międzynarodowych w erze dekarbonizacji (Analysis of coal prices trends and correlations in international markets in era of decarbonization). Zesz. Nauk. Politech. Śląskiej Ser. Organ. I Zarządzanie 2014, 74, 185–197. Available online: https://bibliotekanauki.pl/articles/323139 (accessed on 21 January 2022).
- PEP 2040. Polityka Energetyczna Polski Do 2040 Roku. (PEP 2040. Energy Policy of Poland until 2030). Ministerstwo Klimatu I Środowiska, Warsaw, February 2021. Available online: https://www.gov.pl/attachment/62a054de-0a3d-444d-a969-90a89502df94 (accessed on 22 February 2022).
- Eurostat. Eurostat Data Browser. Production of Electricity and Derived Heat by Type of Fuel. Available online: https://ec.europa.eu/eurostat/databrowser/explore/all/envir?lang=en&subtheme=nrg.nrg_quant.nrg_quanta.nrg_bal&display=list&sort=category&extractionId=NRG_BAL_PEH__custom_2069571 (accessed on 22 February 2022).
- Toborek-Mazur, J.; Wójcik-Jurkiewicz, M. Multi-Energy Concern as an Example of the Implementation of Agenda 2030: Poland as a Case Study. Energies 2022, 15, 1669. [Google Scholar] [CrossRef]
- Kryk, B.; Guzowska, M.K. Implementation of Climate/Energy Targets of the Europe 2020 Strategy by the EU Member States. Energies 2021, 14, 2711. [Google Scholar] [CrossRef]
- Gadowska, K. The Phenomenon of Political and Economic Clientelism: A Systemic Analysis of the Network Connections in the Case of the Transformation of the Mining Sector in Poland; Wydawnictwo Uniwersytetu Jagiellońskiego: Cracow, Poland, 2002. [Google Scholar]
- Czech, A. Conditions of Polish Energy Policy in the Context of Sustainable Development Postulate. Studia Ekon. 2016, 269, 50–61. Available online: https://www.ue.katowice.pl/fileadmin/user_upload/wydawnictwo/SE_Artyku%C5%82y_251_270/SE_269/04.pdf (accessed on 22 February 2022).
- Wensierski, P. Poszerzenie Unii Europejskiej: Proces akcesji Polski (Enlargement of the European Union: The process of Poland’s accession). Słupskie Studia Hist. 2003, 10, 227–248. Available online: https://bazhum.muzhp.pl/media/files/Slupskie_Studia_Historyczne/Slupskie_Studia_Historyczne-r2003-t10/Slupskie_Studia_Historyczne-r2003-t10-s227-248/Slupskie_Studia_Historyczne-r2003-t10-s227-248.pdf (accessed on 22 February 2022).
- European Commission. Directive 2001/80/EC. Available online: https://eur-lex.europa.eu/legal-content/PL/ALL/?uri=CELEX%3A32001L0080 (accessed on 22 February 2022).
- European Commission. Directive 2001/77/EC. Available online: https://eur-lex.europa.eu/legal-content/PL/ALL/?uri=CELEX%3A32001L0077 (accessed on 22 February 2022).
- European Commission. 2020 Climate & Energy Package. Available online: https://ec.europa.eu/clima/eu-action/climate-strategies-targets/2020-climate-energy-package_en (accessed on 22 February 2022).
- Szymla, W. Influence of the Climate and Energy Package on the Conditions of Functioning of the Power Sector Enterprises in Poland. In Contemporary Economies in the Face of New Challenges: Economic, Social and Legal Aspects; Borowiecki, R., Jaki, A., Rojek, T., Eds.; Foundation of the Cracow University of Economics: Cracow, Poland, 2013; pp. 751–761. [Google Scholar]
- Kowalke, K.; Prochownik, M. The Impact of Climate and Energy Package on the Process of Modernization the Polish Energy Sector. J. Manag. Financ. 2014, 12, 229–245. Available online: http://zif.wzr.pl/pim/2014_4_15.pdf (accessed on 22 February 2022).
- Liobikienė, G.; Butkus, M. The European Union possibilities to achieve targets of Europe 2020 and Paris agreement climate policy. Renew. Energy 2017, 106, 298–309. [Google Scholar] [CrossRef]
- Rosenow, J.; Cowart, R.; Bayer, E.; Fabbri, M. Assessing the European Union’s energy efficiency policy: Will the winter package deliver on ‘Efficiency First’? Energy Res. Soc. Sci. 2017, 26, 72–79. [Google Scholar] [CrossRef]
- European Commission. Delivering the European Green Deal. Available online: https://ec.europa.eu/info/strategy/priorities-2019-2024/european-green-deal/delivering-european-green-deal_en#key-steps (accessed on 22 February 2022).
- European Commission. Fit for 55% Package. Available online: https://eur-lex.europa.eu/legal-content/EN/TXT/?uri=CELEX%3A52021DC0550 (accessed on 22 February 2022).
- European Commission. Directive 2003/87/EC. Available online: https://eur-lex.europa.eu/legal-content/EN/TXT/?uri=celex%3A32003L0087 (accessed on 22 February 2022).
- Verbruggen, A.; Laes, E.; Woerdman, E. Anatomy of Emissions Trading Systems: What is the EU ETS? Environ. Sci. Policy 2019, 98, 11–19. [Google Scholar] [CrossRef]
- Szymla, W. The effects of the restructuring of power sector companies in terms of maintaining the energy security in Poland after 1989. Zarządzanie Publiczne 2013, 4, 20–33. Available online: https://zarzadzaniepubliczne.pl/index.php/zpub/article/view/280/195 (accessed on 22 February 2022).
- ZPEP 1990-2010. Założenia Polityki Energetycznej Polski Na Lata 1990–2010 (PEP 1990–2010. Energy Policy of Poland for 1990–2010). Available online: https://isap.sejm.gov.pl/isap.nsf/DocDetails.xsp?id=WMP19900430332 (accessed on 22 February 2022).
- ZPEP 2010. Założenia Polityki Energetycznej Polski Do 2010 R. (PEP 2010. Energy Policy of Poland until 2010). Dokument Rządowy, Warsaw, October 1995. Available online: https://www.prawo.pl/akty/m-p-1990-43-332,16823035.html (accessed on 22 February 2022).
- PEP 2020. Założenia Polityki Energetycznej Polski Do 2020 r (PEP 2020. Energy Policy of Poland until 2020), Warsaw, February 2000. Available online: http://bazekon.icm.edu.pl/bazekon/element/bwmeta1.element.ekon-element-000000109211 (accessed on 22 February 2022).
- PEP 2025. Polityka Energetyczna Polski Do 2025 Roku. (PEP 2025. Energy Policy of Poland until 2025). Ministerstwo Gospodarki I Pracy, Warsaw, July 2005. Available online: https://sip.lex.pl/akty-prawne/mp-monitor-polski/polityka-energetyczna-panstwa-do-2025-r-17205399 (accessed on 22 February 2022).
- PEP 2030. Polityka Energetyczna Polski Do 2030 Roku. (PEP 2030. Energy Policy of Poland until 2030). Ministerstwo Gospodarki, Warsaw, November 2009. Available online: https://sip.lex.pl/akty-prawne/mp-monitor-polski/polityka-energetyczna-panstwa-do-2030-r-17589536 (accessed on 22 February 2022).
- Europe’s Energy Transition: A Common Challenge. Report. Institute Montaigne, September 2021. Available online: https://www.institutmontaigne.org/en/publications/europes-energy-transition-common-challenge (accessed on 22 April 2022).
- Nies, S. (Ed.) The European Energy Transition. In Actors, Factors, Sectors; Claeys & Casteels: Deventer, The Netherland, 2019; Available online: https://author.energy-community.org/enc-author-prd/dam/jcr:9a2c264d-766f-445b-8ffd-1cd1a2893622/SS19_Nies_08_2019.pdf (accessed on 22 April 2022).
- Tagliapietra, S.; Zachmann, G.; Edenhofer, O.; Glachant, J.M.; Linares, P.; Loeschel, A. The European union energy transition: Key priorities for the next five years. Energy Policy 2019, 132, 950–954. [Google Scholar] [CrossRef]
- Peña-Ramos, J.; del Pino-García, M.; Sánchez-Bayón, A. The Spanish Energy Transition into the EU Green Deal: Alignments and Paradoxes. Energies 2021, 14, 2535. [Google Scholar] [CrossRef]
- Foxon, T. Managing the transition to renewable energy: Theory and practice from local, regional and macro perspectives. Environ. Sci. 2008, 5, 286–288. [Google Scholar] [CrossRef]
- Gawlik, L.; Mokrzycki, E. Changes in the Structure of Electricity Generation in Poland in View of the EU Climate Package. Energies 2019, 12, 3323. [Google Scholar] [CrossRef]
- Grubišić Šeba, M.; Flora, A. Poland’s Energy Transition—Caught between Lobbying and Common (Economic) Sense, IEEFA Europe, January 2022. Available online: http://ieefa.org/wp-content/uploads/2022/01/Polands-Energy-Transition-Caught-Between-Lobbying-and-Common-Economic-Sense_January-2022.pdf (accessed on 22 April 2022).
- Lew, G.; Sadowska, B.; Chudy-Laskowska, K.; Zimon, G.; Wójcik-Jurkiewicz, M. Influence of Photovoltaic Development on Decarbonization of Power Generation—Example of Poland. Energies 2021, 14, 7819. [Google Scholar] [CrossRef]
- Bednorz, J. Charakterystyka programów rządowych w latach 1989–2010 i ich wpływ na producentów węgla kamiennego w Polsce (Characteristics of government programs in 1989–2010 and their impact on hard coal producers in Poland). In Bezpieczeństwo Energetyczne—Rynki Surowców I Energii; Kwiatkiewicz, P., Ed.; Wydawnictwo Wyższej Szkoły Bezpieczeństwa: Poznań, Poland, 2011; pp. 207–237. [Google Scholar]
- Marszowski, R. Działania restrukturyzacyjne wobec górnictwa węgla kamiennego i ich wpływ na otoczenie społeczno-gospodarcze. Stan i perspektywy (Restructuring actions to coal mining and its impact on socio-economic environment. State and perspectives). Humanum. Int. J. Soc. Humanit. Stud. 2017, 3, 113–124. Available online: http://cejsh.icm.edu.pl/cejsh/element/bwmeta1.element.mhp-2470d1d5-c621-4986-9992-9c917edbcd06 (accessed on 25 April 2022).
- Paszcza, H. Procesy restrukturyzacji w polskim górnictwie węgla kamiennego w aspekcie zrealizowanych przemian i zmiany bazy zasobowej (Restructuring processes in the Polish hard coal mining industry in terms of the implemented changes and changes in the resource base). Górnictwo I Geoinżynieria 2010, 34, 63–82. Available online: http://yadda.icm.edu.pl/baztech/element/bwmeta1.element.baztech-article-AGHM-0014-0004 (accessed on 25 April 2022).
- Zabierowski, J. Wybrane problemy restrukturyzacji polskiego górnictwa węgla kamiennego (Selected problems of restructuring of the Polish hard coal mining industry). Wiadomości Górnicze 1996, 3, 5–9. [Google Scholar]
- Kamola-Cieślik, M. Bezpieczeństwo energetyczne Polski a sytuacja ekonomiczna Kompanii Węglowej SA po 2014 roku (Poland’s energy security and the economic situation of Kompania Węglowa SA after 2014). Bezpieczeństwo. Teor. I Prakt. 2016, 1, 133–148. Available online: http://hdl.handle.net/11315/20277 (accessed on 25 April 2022).
- Karbownik, A.; Wodarski, K. Efekty restrukturyzacji polskiego górnictwa węgla kamiennego w latach 1990–2004 (The effects of restructuring of the Polish hard coal mining industry in 1990–2004). Wiadomości Górnicze 2005, 56, 274–281. Available online: http://yadda.icm.edu.pl/baztech/element/bwmeta1.element.baztech-article-BGPK-1139-4504?q=bwmeta1.element.baztech-volume-0043-5120-wiadomosci_gornicze-2005-vol__56_nr_6;0&qt=CHILDREN-STATELESS (accessed on 25 April 2022).
- Tkocz, M. Efekty restrukturyzacji górnictwa węgla kamiennego w Polsce (Effects of restructuring of the hard coal mining industry in Poland). Pr. Kom. Geogr. Przemysłu 2006, 9, 28–39. Available online: http://cejsh.icm.edu.pl/cejsh/element/bwmeta1.element.desklight-f7429231-225e-4197-ba15-1b528977bdb9 (accessed on 25 April 2022).
- Przybyłka, A. Spadek zatrudnienia wśród górników węgla kamiennego w kolejnych etapach restrukturyzacji branży na Górnym Śląsku (Decline in employment among hard coal miners in the subsequent stages of industry restructuring in Upper Silesia). Studia I Materiały. Misc. Oeconomicae 2011, 1, 99–108. Available online: https://tuudi.net/wp-content/uploads/2017/03/A.-Przyby%C5%82ka-Spadek-zatrudnienia-w%C5%9Br%C3%B3d-g%C3%B3rnik%C3%B3w-w%C4%99gla-kamiennego-w-kolejnych-etapach-restrukturyzacji-bran%C5%BCy-na-G%C3%B3rnym-%C5%9Al%C4%85sku..pdf (accessed on 25 April 2022).
- Bluszcz, A.; Kijewska, A.; Sojda, A. Analiza efektywności zarządzania wartością przedsiębiorstwa górniczego (Analysis of the effectiveness of managing the value of a mining enterprise). Zesz. Nauk. Uniw. Szczecińskiego. Finans. Rynk. Finans. Ubezpieczenia 2013, 64, 87–96. Available online: http://yadda.icm.edu.pl/yadda/element/bwmeta1.element.ekon-element-000171281001 (accessed on 25 April 2022).
- Sojda, A. Perspektywy i zagrożenia dla rozwoju zasobów ludzkich w górnictwie węgla kamiennego (Prospects and threats for the development of human resources in hard coal mining). Studia Ekon. 2014, 196, 185–195. Available online: http://yadda.icm.edu.pl/yadda/element/bwmeta1.element.ekon-element-000171355831 (accessed on 25 April 2022).
- Gumiński, A.; Karbownik, A.; Wodarski, K.; Jędrychowski, S. Restrukturyzacja zatrudnienia w polskim górnictwie węgla kamiennego w latach 1998–2006 (Employment restructuring in the Polish hard coal mining industry in 1998–2006). Wiadomości Górnicze 2008, 59, 166–174. Available online: http://yadda.icm.edu.pl/baztech/element/bwmeta1.element.baztech-article-BGPK-2100-7971?q=bwmeta1.element.baztech-volume-0043-5120-wiadomosci_gornicze-2008-vol__59_nr_3;0&qt=CHILDREN-STATELESS (accessed on 25 April 2022).
- Hibner, M. Restrukturyzacja zatrudnienia w górnictwie węgla kamiennego w latach 2004–2014 (Employment restructuring in the hard coal mining industry in 2004–2014). Zesz. Nauk. Państwowej Wyższej Szkoły Zawodowej Im. Witelona W Legn. 2016, 19, 39–50. Available online: https://bazhum.muzhp.pl/czasopismo/449/?idvol=11224 (accessed on 25 April 2022).
- Jonek-Kowalska, I. Koszty produkcji w polskim górnictwie węgla kamiennego (Production costs in the Polish hard coal mining). In Analiza I Ocena Kosztów W Górnictwie Węgla Kamiennego W Polsce W Aspekcie Poprawy Efektywności Wydobycia; Turek, M., Ed.; Difin: Warszawa, Poland, 2013; pp. 45–56. ISBN 978-83-7641-825-4. [Google Scholar]
- Turek, M.; Jonek-Kowalska, I.; Ganszczyk, Z. Determinanty Innowacyjności W Przedsiębiorstwach Górniczych (Determinants of Innovation in Mining Enterprises); Politechnika Śląska: Gliwice, Poland, 2016; Available online: http://yadda.icm.edu.pl/baztech/element/bwmeta1.element.baztech-article-BSL3-0024-0084 (accessed on 25 April 2022).
- Jonek-Kowalska, I. Challenges for long-term industry restructuring in the Upper Silesian Coal Basin: What has Polish coal mining achieved and failed from a twenty-year perspective? Resour. Policy 2015, 44, 135–149. [Google Scholar] [CrossRef]
- Rybak, A. The strategy of flexible mining in conditions of seasonal demand for hard coal (Strategia elastycznego wydobycia w warunkach sezonowości popytu na węgiel kamienny). Wiadomości Górnicze 2014, 65, 227–233. [Google Scholar]
- Wendt, R. Change Management in a Polish Company (Zarzadzanie Zmianą W Polskiej Firmie); Dom Wydawniczy Zachorek: Warsaw, Poland, 2010; Available online: https://wendt.pl/images/files/Zarzadzanie_zmiana_bezplatny_fragment.pdf (accessed on 25 April 2022).
- Analiza I Ocena Kosztów W Górnictwie Węgla Kamiennego W Polsce W Aspekcie Poprawy Efektywności Wydobycia (Analysis and Evaluation of Costs in the Hard Coal Mining Industry in Poland in Terms of Improving Mining Efficiency); Turek, M., Ed.; Difin: Warszawa, Poland, 2013; ISBN 978-83-7641-825-4. [Google Scholar]
- Sojda, A. Analiza statystyczna wskaźników finansowych dla przedsiębiorstw górniczych (Statistical analysis of financial indicators for mining enterprises). Organ. I Zarządzanie. Zesz. Nauk. Politech. Śląskiej 2014, 68, 255–264. Available online: http://yadda.icm.edu.pl/baztech/element/bwmeta1.element.baztech-235fe354-121b-4c8d-9abe-54ab7c70b65a (accessed on 25 April 2022).
- Turowski, K. Unowocześnienie struktury gospodarczej jako czynnik wzrostu produktywności w polskiej gospodarce (Modernization of the economic structure as a factor of productivity growth in the Polish economy). In Problemy Gospodarowania W Dobie Globalizacji; Kunasz, M., Ed.; Print Group, Daniel Krzanowski: Szczecin, Poland, 2006; pp. 145–157. ISBN 8360065942. [Google Scholar]
- Cellura, M.; Longo, S.; Mistretta, M. Application of the Structural Decomposition Analysis to assess the indirect energy consumption and air emission changes related to Italian households consumption. Renew. Sustain. Energy Rev. 2012, 16, 1135–1145. [Google Scholar] [CrossRef]
- Barba, I.; Iraizoz, B. Effect of the Great Crisis on Sectoral Female Employment in Europe: A Structural Decomposition Analysis. Economies 2020, 8, 64. [Google Scholar] [CrossRef]
- Barcik, R.; Dziwiński, P. Społecznie odpowiedzialna restrukturyzacja zatrudnienia. Pr. Nauk. Uniw. Ekon. We Wrocławiu 2016, 419, 21–32. [Google Scholar] [CrossRef][Green Version]
- Pierścionek, Z. Strategie Rozwoju Firmy (Company Development Strategies); Wydawnictwo Naukowe PWN: Warszawa, Poland, 1996; ISBN 8301119802. [Google Scholar]
- Cascio, W.F. Strategies for responsible restructuring. Acad. Manag. Perspect. 2002, 16, 80–91. [Google Scholar] [CrossRef]
- Chomątowski, S. Warunki a czynniki rozwoju przedsiębiorstwa. Próba identyfikacji i klasyfikacji (Conditions and factors of enterprise development. An attempt to identify and classify). In Restrukturyzacja W Procesie Przekształceń I Rozwoju Przedsiębiorstw; Borowiecki, R., Ed.; Towarzystwo Naukowe Organizacji i Kierownictwa: Kraków, Poland, 1996; pp. 174–175. Available online: http://www.nukat.edu.pl/nukat/icov/WALAZ/zz2007825000.pdf (accessed on 25 April 2022).
- Gabrusewicz, W. Rozwój przedsiębiorstw przemysłowych i jego ocena w gospodarce rynkowej (Development of industrial enterprises and its evaluation in the market economy). Zesz. Nauk. Akad. Ekon. W Pozn. 1992, 120, 197. Available online: https://www.wbc.poznan.pl/dlibra/publication/97731/edition/109494/content (accessed on 25 April 2022).
- Fijorek, K.; Kaczmarek, J.; Kolegowicz, K.; Krzemiński, P. Ocena zagrożenia przedsiębiorstw upadłością—Koncepcja systemowa ISR (Evaluation of enterprise bankruptcy risk—A systemic concept of ISR). Przegląd Organ. 2015, 4, 18–25. [Google Scholar] [CrossRef]
- Antonowicz, P. Metody Oceny I Kondycji Ekonomiczno-Finansowej Przedsiębiorstw (Methods of Evaluating the Economic and Financial Condition of Enterprises); ODiDK: Gdańsk, Poland, 2007; pp. 31–42. [Google Scholar]
- Juszczyk, S. Prognozowanie upadłości przedsiębiorstw (Forecasting enterprise bankruptcy). Ekonomista 2010, 5, 701–728. Available online: http://bazekon.icm.edu.pl/bazekon/element/bwmeta1.element.ekon-element-000168325184 (accessed on 21 January 2022).
- Prusak, B. Nowoczesne Metody Prognozowania Zagrożenia Finansowego Przedsiębiorstw (Modern Methods of Forecasting Enterprise Financial Threats); Difin: Warszawa, Poland, 2005; pp. 129–172. [Google Scholar]
- Jajuga, K. Statystyczne modele wczesnego ostrzegania—Metody Formalne (Statistical models of early warning—Formal Methods). Barom. Reg. 2006, 6, 52–55. Available online: http://br.wszia.edu.pl/zeszyty/pdfs/br06_07jajuga.pdf (accessed on 25 April 2022).
- Gavurova, B.; Packova, M.; Misankova, M.; Smrcka, L. Predictive potential and risks of selected bankruptcy prediction models in the Slovak business environment. J. Bus. Econ. Manag. 2017, 18, 1156–1173. [Google Scholar] [CrossRef]
- Hosmer, D.W.; Lemeshow, S. Applied Logistic Regression; Wiley: New York, NY, USA, 1989; pp. 145–162. [Google Scholar]
- Fijorek, K.; Fijorek, D. Dobór zmiennych objaśniających metodą najlepszego podzbioru do modelu regresji logistycznej Firtha (Selection of Explanatory Variables Using the Best Subset Method for Firth’s Logistic Regression Model. Metod. Inform. Stosow. 2011, 2, 15–24. Available online: http://www.pan.wi.zut.edu.pl/mispdf/MIS-2011-2.pdf (accessed on 11 January 2022).
- Long, S.J. Regression Models for Categorical and Limited Dependent Variables; Thousand Oaks, SAGE Publications: London, UK, 1997; pp. 56–68. [Google Scholar]
- Hafiz, A.A.; Lukumon, O.O.; Hakeem, A.O.; Vikas, K.; Saheed, O.A.; Olugbenga, O.A.; Muhammad, B. Systematic review of bankruptcy prediction models: Towards a framework for tool selection. Expert Syst. Appl. 2018, 94, 164–184. [Google Scholar] [CrossRef]
- Fijorek, K.; Denkowska, S.; Kaczmarek, J.; Náñez Alonso, S.L.; Sokołowski, A. Financial threat profiles of industrial enterprises in Poland. Oeconomia Copernic. 2021, 12, 463–498. [Google Scholar] [CrossRef]
- Heinze, G.; Schemper, M. A solution to the problem of separation in logistic regression. Stat. Med. 2002, 21, 2409–2419. [Google Scholar] [CrossRef] [PubMed]
- Firth, D. Bias reduction of maximum likelihood estimates. Biometrika 1993, 80, 27–38. [Google Scholar] [CrossRef]
- Fijorek, K.; Sokołowski, A. Separation-Resistant and Bias-Reduced Logistic Regression: STATISTICA macro. J. Stat. Softw. 2012, 47, 1–12. [Google Scholar] [CrossRef][Green Version]
- Hadasik, D. Upadłość przedsiębiorstw w Polsce i metody jej prognozowania (Bankruptcy of enterprises in Poland and the methods of its forecasting). Zesz. Nauk. Akad. Ekon. W Pozn. 1998, 153, 1–198. Available online: www.wbc.poznan.pl:115723 (accessed on 9 January 2022).
- Zelek, A. Wczesna identyfikacja kryzysu ucieczką od bankructwa (Early identification of a crisis as an escape from bankruptcy). Przegląd Organ. 2002, 2, 32–36. Available online: http://www.przegladorganizacji.pl/plik/375/po200202pdf (accessed on 14 January 2022). [CrossRef]
- Fijorek, K.; Kaczmarek, J.; Kolegowicz, K.; Krzemiński, P. Bankruptcy Risk Assessment—A Microeconomic Perspective. In The Rapid Response Instrument to Bankruptcy Risk in the Non-Financial Sector. Design and Implementation; Boguszewski, P.A., Ed.; Polish Agency for Enterprise Development: Warsaw, Poland, 2014; pp. 117–131. [Google Scholar]
- Piłatowska, M. Repetytorium Ze Statystyki (Repertory of Statistics); Wydawnictwo Naukowe PWN: Warszawa, Poland, 2006. [Google Scholar]
- Higgins, R.C.; Koski, J.L.; Mitton, T. Analysis for Financial Management, 12th ed.; McGraw-Hill Education: New York, NY, USA, 2019; pp. 35–89. [Google Scholar]
- Block, S.; Hirt, G.; Danielsen, B. Foundations of Financial Management, 17th ed.; McGraw-Hill Education: New York, NY, USA, 2019; pp. 250–348. [Google Scholar]
- Dudycz, T.; Wrzosek, S. Analiza Finansowa. Problemy Metodyczne W Ujęciu Praktycznym (Financial Analysis. Methodological Problems in a Practical Approach); Wydawnictwo Akademii Ekonomicznej we Wrocławiu: Wrocław, Poland, 2000; pp. 124–168. [Google Scholar]
- Chomątowski, S. (Ed.) Dynamika I Kierunki Zmian Wielkości I Struktury Sektora Przedsiębiorstw W Polsce W Latach 1990–2005; Fundacja Uniwersytetu Ekonomicznego w Krakowie: Kraków, Poland, 2009; p. 39. [Google Scholar]
- Kukuła, K. Propozycja w zakresie pewnych miar dynamiki struktur (A proposal for certain measures of the dynamics of structures). Przegląd Stat. 1975, 3, 453–461. [Google Scholar]
- Archibugi, D.; Pianta, M. Measuring technological change through patents and innovation surveys. Technovation 1996, 9, 451–468. [Google Scholar] [CrossRef]
- Castellacci, F. Technological paradigms, regimes and trajectories: Manufacturing and service industries in a new taxonomy of sectoral patterns of innovation. Res. Policy 2008, 37, 978–994. Available online: https://www.files.ethz.ch/isn/32006/719_TechnologicalParadigms.pdf (accessed on 25 April 2022). [CrossRef]
- Chomątowski, S.; Sokołowski, A. Taksonomia struktur (Taxonomy of structures). Przegląd Stat. 1978, 2, 217–226. [Google Scholar]
- Kamiński, J. Siła Rynkowa W Krajowym Sektorze Wytwarzania Energii Elektrycznej—Zagadnienia Wybrane (Market Power in the Domestic Electricity Generation Sector—Selected Issues); Wydawnictwo IGSMiE PAN: Kraków, Poland, 2012. [Google Scholar]
- Szpor, A. Coal Transition in Poland. An Historical Case Study for the Project Coal Transitions: Research and Dialogue on the Future of Coal. IDDRI Clim. Strat. 2017. Available online: https://www.iddri.org/sites/default/files/PDF/Publications/Catalogue%20Iddri/Rapport/201706-iddri-climatestrategies-reportcoal_pl.pdf (accessed on 11 January 2022).
- Karbownik, A.; Wodarski, K.; Turek, M. Wpływ procesów restrukturyzacyjnych w latach 1989–2000 na kształtowanie się wielkości parametrów struktury i modelu kopalń węgla kamiennego (The impact of restructuring processes in 1989–2000 on the shaping of the parameters of the structure and model of hard coal mines). In Restrukturyzacja Górnictwa a Struktura Kopalń Węgla Kamiennego; Główny Instytut Górnictwa: Katowice, Poland, 2002; p. 11. [Google Scholar]
- Rybak, A.; Rybak, A. Possible strategies for hard coal mining in Poland as a result of production function analysis. Resour. Policy 2016, 50, 27–33. [Google Scholar] [CrossRef]
- Blaschke, W.; Gawlik, L.; Lorenz, U. Perspektywy górnictwa węgla kamiennego po przystąpieniu Polski do Unii Europejskiej w świetle realizowanych programów restrukturyzacyjnych (Perspectives of hard coal mining after Poland’s accession to the European Union in the light of the implemented restructuring programs). In Proceedings of the XIV Konferencja Z Cyklu Aktualia I Perspektywy Gospodarki Surowcami Mineralnymi W Zakopanem, Sympozja I Konferencje Nr 63; Wyd. Instytutu GSMiE PAN: Kraków, Poland, 2004; pp. 15–27. [Google Scholar]
- Stalewski, T.; Szpak, A. Likwidowanie Kopalń Węgla Kamiennego W Małym Mieście Górniczym (Closure of Hard Coal Mines in a Small Mining Town). Studia Regionalne i Lokalne nr 4; Uniwersytet Warszawski: Warszawa, Poland, 2000. [Google Scholar]
- Szczepański, M.S. Górnicy Nie Przepuścili Odpraw. Często Brakowało im Jednak Qiedzy (The Miners Did Not Miss the Severance Pay. However, They Often Lacked Knowledge), Dziennik Zachodni, 12 January 2015. Available online: https://dziennikzachodni.pl/prof-szczepanski-gornicy-nie-przepuscili-odpraw-czesto-brakowalo-im-jednak-wiedzy/ar/c3-3711606 (accessed on 11 January 2022).
- Fornalczyk, A.; Choroszczak, L.; Mikulec, M. Restrukturyzacja Górnictwa Węgla Kamiennego (Restructuring of Hard Coal Mining); Poltext: Warszawa, Poland, 2008; pp. 34–52. [Google Scholar]
- Sejm Rzeczpospolitej Polskiej, Ustawa Z Dnia 26.11.1998 r. o Dostosowaniu Górnictwa Węgla Kamiennego Do Funkcjonowania W Warunkach Gospodarki Rynkowej Oraz Szczególnych Uprawnieniach I Zadaniach Gmin Górniczych, Wraz Z Późniejszymi Zmianami (Dz.U.1998, nr 162, Poz.1112). Available online: https://isap.sejm.gov.pl/isap.nsf/DocDetails.xsp?id=WDU19981621112 (accessed on 22 February 2022).
- Sejm Rzeczpospolitej Polskiej, Ustawa Dnia 28.11.2003 r. o Restrukturyzacji Górnictwa Węgla Kamiennego W Latach 2003–2006 (Dz. U. nr 120, Poz.2037). Available online: https://isap.sejm.gov.pl/isap.nsf/DocDetails.xsp?id=WDU20032102037 (accessed on 22 February 2022).
- Paszcza, H.; Madejski, A. Górnictwo węgla kamiennego w Polsce w 2003 roku (Hard Coal Industry in Poland in 2005), Wiadomości Górnicze 2004, 6, 249. Available online: http://yadda.icm.edu.pl/baztech/element/bwmeta1.element.baztech-article-BGPK-1398-5383 (accessed on 22 February 2022).
- Bednarski, L.; Borowiecki, R.; Duraj, J.; Kurtys, E.; Waśniewski, T.; Wersty, B. Analiza Ekonomiczna W Przedsiębiorstwie (Economic Analysis in the Enterprise); Wydawnictwo Akademii Ekonomicznej we Wrocławiu: Wrocław, Poland, 1995. [Google Scholar]
- Restructuring and Privatizing the Coal Industries in Central and Eastern Europe and the CIS; World Energy Council: London, UK, 2000; pp. 1–199. Available online: https://www.worldenergy.org/assets/downloads/PUB_Restructuring_and_privatizing_coal_in_CIES_2004_WEC.pdf (accessed on 28 January 2022).
- Dubiński, J.; Turek, M. Wybrane aspekty zmian restrukturyzacyjnych w polskim górnictwie węgla kamiennego w latach 1990–2008 (Selected aspects of restructuring changes in Polish hard coal mining in 1990–2008). Res. Rep. Min. Environ. 2009, 2, 5–19. Available online: https://kwartalnik.gig.eu/sites/default/files/articles/prace-naukowe-gig/2009_2_1.pdf (accessed on 24 January 2022).
- Jonek-Kowalska, I.; Turek, M. Dependence of Total Production Costs on Production and Infrastructure Parameters in the Polish Hard Coal Mining Industry. Energies 2017, 10, 1480. [Google Scholar] [CrossRef]
- Marek, J. Uwarunkowania i przebieg procesu likwidacji kopalń węgla kamiennego (Determinants and the process of hard coal mines liquidation). Studia Ekon. Akad. Ekon. W Katowicach 2006, 37, 269–283. Available online: https://www.ue.katowice.pl/fileadmin/user_upload/wydawnictwo/SE_Archiwalne/SE_37/18.pdf (accessed on 28 January 2022).
- Rutledge, D. Estimating long-term world coal production with logit and probit transforms. Int. J. Coal Geol. 2011, 85, 23–33. [Google Scholar] [CrossRef]
- Tkocz, M. Effects of hard coal mining restructuring in Poland. Stud. Ind. Geogr. Comm. Pol. Geogr. Soc. 2006, 9, 28–39. [Google Scholar] [CrossRef]
- Smoliło, J.; Chmiela, A.; Gajdzik, M.; Menéndez, J.; Loredo, J.; Turek, M.; Bernardo-Sánchez, A. A New Method to Analyze the Mine Liquidation Costs in Poland. Mining 2021, 1, 351–363. [Google Scholar] [CrossRef]
- Fuksa, D. Innovative Method for Calculating the Break-Even for Multi-Assortment Production. Energies 2021, 14, 4213. [Google Scholar] [CrossRef]
- Kaczmarek, J. The effectiveness of working capital management strategies in manufacturing enterprises. Sci. Pap. Sil. Univ. Technol. Organ. Manag. 2019, 136, 191–208. [Google Scholar] [CrossRef]
- Ukryty Rachunek Za Węgiel (Hidden Coal Account); WiseEuropa: Warszawa, Poland, 2017; pp. 1–44. Available online: https://wise-europa.eu/2017/09/19/ukryty-rachunek-wegiel-premiera-raportu/ (accessed on 18 January 2022).
- Rybak, A.; Rybak, A. Analysis of the Main Coal Mining Restructuring Policy Objectives in the Light of Polish Mining Companies’ Ability to Change. Energies 2020, 13, 3281. [Google Scholar] [CrossRef]
- Kaczmarek, J. The Balance of Outlays and Effects of Restructuring Hard Coal Mining Companies in Terms of Energy Policy of Poland PEP 2040. Energies 2022, 15, 1853. [Google Scholar] [CrossRef]
- Baran, M.; Kuźniarska, A.; Makieła, Z.J.; Sławik, A.; Stuss, M. Does ESG Reporting Relate to Corporate Financial Performance in the Context of the Energy Sector Transformation? Evidence from Poland. Energies 2022, 15, 477. [Google Scholar] [CrossRef]
- Galos, K.; Lewicka, E.; Burkowicz, A.; Guzik, K.; Kot-Niewiadomska, A.; Kamyk, J.; Szlugaj, J. Approach to identification and classification of the key, strategic and critical minerals important for the mineral security of Poland. Resour. Policy 2020, 70, 101900. [Google Scholar] [CrossRef]
- Kotelska, J. Przesłanki procesu restrukturyzacji górnictwa węgla kamiennego w Polsce (Premises of the restructuring process of the hard coal mining industry in Poland). ZN WSH Zarządzanie 2018, 1, 207–229. [Google Scholar]
- Mokrzycki, E.; Ney, R.; Siemek, J. Światowe zasoby surowców energetycznych. Wnioski dla Polski (Global reserves of energy fossil resources—Conclusions for Poland). Rynek Energii 2008, 6, 2–13. Available online: http://yadda.icm.edu.pl/baztech/element/bwmeta1.element.baztech-article-BPL2-0011-0044 (accessed on 22 February 2022).
- Kaliski, M.; Sikora, A.; Szurlej, A. Węgiel kamienny w polityce energetycznej Polski (Hard coal in Poland’s energy policy). Polityka Energetyczna-Energy Policy J. 2014, 17, 7–18. Available online: http://yadda.icm.edu.pl/baztech/element/bwmeta1.element.baztech-0d18bd03-a9ef-437f-875d-7dec826e0f52/c/kaliski_in_wegiel_kamienny_17_3.pdf.pdf (accessed on 22 February 2022).
- Oksińska, B.; Furman, T. Plan rządu dla górnictwa sypie się. Nie ma planu B (The government’s plan for mining is falling apart. There is no plan B). Rzeczpospolita. Ekon. I Rynek 2005, 15, 115. [Google Scholar]
- Szlązak, J. Restrukturyzacja Górnictwa Węgla Kamiennego W Polsce W Latach 1990–2002. Analiza Skuteczności Realizowanych Programów (Restructuring of Hard Coal Mining in Poland in the Years 1990–2002. Analysis of the Effectiveness of Implemented Programs); Biblioteka Szkoły Eksploatacji Podziemnej: Kraków, Poland, 2004. [Google Scholar]
- Restrukturyzacja. In Fakty I Opinie (Restructuring. Facts and Opinions); Zarząd Główny SITG: Katowice, Poland, 2015.
- Makieła, Z. Wyniki realizacji programów restrukturyzacji górnictwa węgla kamiennego po 1989 r. (Results of implementation of hard coal mining restructuring programs after 1989). Pr. Kom. Geogr. Przemysłu Pol. Tow. Geogr. 2002, 4, 57–65. Available online: http://bazekon.icm.edu.pl/bazekon/element/bwmeta1.element.ekon-element-000171298913 (accessed on 25 April 2022).
- Grmela, A.; Harat, A.; Adamczyk, Z. The process of mines liquidation as an environmental, economic and legal problem. Ecol. Eng. Environ. Technol. 2017, 18, 39–45. [Google Scholar] [CrossRef][Green Version]
- Gumiński, A. Efektywne wykorzystanie zasobów ludzkich jako kluczowy warunek funkcjonowania przedsiębiorstwa górniczego w perspektywie długoterminowej (Effective use of human resources as a key condition for the functioning of a mining company in the long term). Organ. I Zarządzanie. Zesz. Nauk. Politech. Śląskiej 2016, 89, 163–176. Available online: https://bibliotekanauki.pl/api/full-texts/2020/12/11/2eb3cc3e-64bf-47c4-8bd2-12f12bfccfbe.pdf (accessed on 25 April 2022).
- Bluszcz, A. Proces przemian struktury zatrudnienia w górnictwie węgla kamiennego (The process of changes in the employment structure in the hard coal mining industry). Studia Ekonomiczne. Uniw. Ekon. W Katowicach 2014, 196, 103–113. Available online: http://bazekon.icm.edu.pl/bazekon/element/bwmeta1.element.ekon-element-000171356073 (accessed on 25 April 2022).
- Gumiński, A. Analiza możliwości zwiększenia efektywności wykorzystania środków produkcji w ścianach wydobywczych kopalni węgla kamiennego (Analysis of the possibilities of increasing the efficiency of the use of production means in the mining walls of a hard coal mine). Organ. I Zarządzanie. Zesz. Nauk. Politech. Śląskiej 2015, 78, 167–177. Available online: http://bazekon.icm.edu.pl/bazekon/element/bwmeta1.element.ekon-element-000171402853 (accessed on 25 April 2022).
- Grzybek, J. Restrukturyzacja zatrudnienia w górnictwie węgla kamiennego—Nakłady budżetowe, efekty podjętych działań. (Employment restructuring in the hard coal mining industry—Budget expenditures, effects of actions taken). Przegląd Górniczy 2012, 68, 63–67. Available online: http://yadda.icm.edu.pl/baztech/element/bwmeta1.element.baztech-b1c9f470-d936-49b1-b162-78d9cbb3ae55?q=0739a17e-cf12-49e3-84b7-4fd19fd2d4b6$2&qt=IN_PAGE (accessed on 25 April 2022).
- Dołęga, W. Operation security of national distribution grids. Przegląd Elektrotechniczny 2020, 1, 23–26. [Google Scholar] [CrossRef]
- Turek, M.; Jonek-Kowalska, I. Rozwój polskiego górnictwa węglowego w świetle prognozowanych potrzeb energetycznych (Development of the Polish coal mining in the light of forecasted energy needs). Zesz. Naukowe. Organ. I Zarządzanie/Politech. Śląska 2015, 83, 691–701. Available online: http://bazekon.icm.edu.pl/bazekon/element/bwmeta1.element.ekon-element-000171408367?printView=true (accessed on 25 April 2022).
- Kamyk, J.; Kot-Niewiadomska, A.; Galos, K. The criticality of crude oil for energy security: A case of Poland. Energy 2021, 220, 119707. [Google Scholar] [CrossRef]
- Stala-Szlugaj, K.; Grudziński, Z. Energy efficiency and steam coal transport over long distances. ES3 Web Conf. 2016, 10, 00089. [Google Scholar] [CrossRef]
- Frankowski, J.; Mazurkiewicz, J.; Sokołowski, J.; Lewandowski, P. Employment in Hard Coal Mining in the Upper Silesian Coal Basin. Zatrudnienie W Górnictwie Węgla Kamiennego W Zagłębiu Górnośląskim. IBS Research Report, Warsaw, Poland, January 2020. Available online: https://ibs.org.pl/app/uploads/2020/09/IBS_Research_Report_01_2020.pdf (accessed on 22 February 2022).
- Dróżdż, W. The distribution system operator in the era of innovative energy challenges. Zesz. Nauk. Inst. Gospod. Surowcami Miner. I Energią Pol. Akad. Nauk. 2018, 102, 291–300. Available online: https://min-pan.krakow.pl/wydawnictwo/wp-content/uploads/sites/4/2018/03/20-zn-19-drozdz.pdf (accessed on 22 February 2022).
- Rusin, A.; Wojaczek, A.; Nawrat, K. Change of the energy system structure and possibilities of energy production by national power units. Rynek Energii 2020, 2, 3–7. Available online: http://rynek-energii.pl/pl/RE147 (accessed on 22 February 2022).
- Malec, M. The prospects for decarbonisation in the context of reported resources and energy policy goals: The case of Poland. Energy Policy 2022, 161, 112763. [Google Scholar] [CrossRef]
- Kaliski, M.; Gawlik, L.; Szurlej, A.; Sikora, A.; Kamiński, J. Hard coal in the fuel-mix of Poland: The long perspective. Arch. Min. Sci. 2016, 61, 335–350. [Google Scholar] [CrossRef][Green Version]
- Bórawski, P.; Bełdycka-Bórawska, A.; Szymańska, E.J.; Jankowski, K.J.; Dubis, B.; Dunn, J.W. Development of renewable energy sources market and biofuels in the European Union. J. Clean. Prod. 2019, 228, 467–484. [Google Scholar] [CrossRef]
- Papież, M.; Śmiech, S.; Frodyma, K. Determinants of renewable energy development in the EU countries. A 20-year perspective. Renew. Sustain. Energy Rev. 2018, 91, 918–934. [Google Scholar] [CrossRef]
- Bonnet, C.; Hache, E.; Seck, G.S.; Simoën, M.; Carcanague, S. Who’s winning the low-carbon innovation race? An assessment of countries’ leadership in renewable energy technologies. Int. Econ. 2019, 160, 31–42. [Google Scholar] [CrossRef]
- Bel, G.; Joseph, S. Policy stringency under the European Union Emission trading system and its impact on technological change in the energy sector. Energy Policy 2018, 117, 434–444. [Google Scholar] [CrossRef]
- Wierling, A.; Schwanitz, V.J.; Zeiß, J.P.; Bout, C.; Candelise, C.; Gilcrease, W.; Gregg, J.S. Statistical Evidence on the Role of Energy Cooperatives for the Energy Transition in European Countries. Sustainability 2018, 10, 3339. [Google Scholar] [CrossRef]
- Grudziński, Z. Konkurencyjność paliw w wytwarzaniu energii elektrycznej (Competitiveness of fuels in electricity generation). Energy Policy J. 2013, 6, 87–105. Available online: https://se.min-pan.krakow.pl/publikacje/13_06zg_pe_z.pdf (accessed on 25 April 2022).
- European Parliament and the Council, Regulation (EU) 2019/943 of the European Parliament and of the Council. Available online: https://eur-lex.europa.eu/legal-content/EN/TXT/?uri=CELEX%3A32019R0943 (accessed on 22 February 2022).
- Appunn, K. Setting the Power Price: The Merit Rrder Effect. Available online: https://www.cleanenergywire.org/factsheets/setting-power-price-merit-order-effect (accessed on 22 February 2022).
- Loumakis, S.; Giannini, E.; Maroulis, Z. Merit Order Effect Modeling: The Case of the Hellenic Electricity Market. Energies 2019, 12, 3869. [Google Scholar] [CrossRef]
- Korkmaz, O.; Önöz, B. Modelling the Potential Impacts of Nuclear Energy and Renewables in the Turkish Energy System. Energies 2022, 15, 1392. [Google Scholar] [CrossRef]
- What’s Next after Coal? RES Potential in Poland. Raport. Instrat.pl. Available online: https://instrat.pl/wp-content/uploads/2021/06/Instrat-What-next-after-coal-v.1.2.pdf (accessed on 3 May 2022).
- Brodny, J.; Tutak, M.; Saki, S.A. Forecasting the Structure of Energy Production from Renewable Energy Sources and Biofuels in Poland. Energies 2020, 13, 2539. [Google Scholar] [CrossRef]
- Przybylska-Cząstkiewicz, M. The legal conditions for the development of Renewable Energy in Poland after 2015. Energy Policy J. 2017, 20, 115–116. Available online: https://epj.min-pan.krakow.pl/The-legal-conditions-for-the-development-of-Renewable-Energy-nin-Poland-after-2015,96161,0,2.html (accessed on 3 May 2022).
- Gawlikowska-Fyk, A. Po 2025 r. Węgiel Będzie Wychodził Z Polskiego Systemu Energetycznego Falami (After 2025, Coal Will Come Out of the Polish Energy System in Waves). Available online: https://www.forum-energii.eu/pl/blog/luka-weglowa-2025 (accessed on 22 February 2022).
- Zamasz, K. Efektywność Ekonomiczna Przedsiębiorstwa Energetycznego W Warunkach Wprowadzenia Rynku Mocy (Economic Efficiency of an Energy Company in the Conditions of Introducing the Capacity Market); Wydawnictwo Naukowe PWN: Warszawa, Poland, 2015; ISBN 9788301183783. [Google Scholar]


| Financial Ratio Name (Predictor) | Predictor Symbol | Parameter Estimate |
|---|---|---|
| Intercept | - | −5.85 |
| Operating return on assets | R1 | −1.231 |
| Debt payment capacity | R3 | −0.492 |
| Operating return on sales | R6 | −1.947 |
| Total debt ratio | R9 | +0.62 |
| Short-term liabilities cycle | R13 | +0.004 |
| Objectives of the Programs/Programs | Programme I 1993 | Programme II 1993 | Programme III 1994–1995 | Programme IV 1996–2000 | Programme V 1998–2002 | Programme VI 2003–2006 | Programme VII 2004–2010 | Programme VIII 2007–2015 | Programme IX 2018–2030 |
|---|---|---|---|---|---|---|---|---|---|
| Improving profitability, competitiveness, timely payment of liabilities | |||||||||
| Mitigating the effects of the current and planned restructuring of employment | |||||||||
| Protection of mining against collapse (debt reduction) | |||||||||
| Employment rationalisation, increase in labour productivity, improvement of working conditions | |||||||||
| Adaptation of production capacity, efficiency improvement, reduction of output costs | |||||||||
| Rational and effective management of coal beds | |||||||||
| Reducing the harmful effects on the natural environment | |||||||||
| Ensuring the country’s energy security | |||||||||
| Privatisation of mining enterprises | |||||||||
| Optimisation of the organisational structures of the mining industry | |||||||||
| Diversification of coal use and maintaining export | |||||||||
| Vertical integration of mining and power industries | |||||||||
| Development of employee skills and innovations in mines | |||||||||
| Elimination of the negative effects of restructuring | |||||||||
| Maintaining the competitiveness of the mining sector | |||||||||
| The scope of planned coal sales (mill. Mg/year) | 124–130 | 119–125 | 134–134 | 127–125 | 116–110 | 94–87 | 97–80 | 93–90 | - |
| The planned Investment outlays (mill. PLN/programme) | 588 | - | 1490 | 5488 | 5988 | - | 7921 | 2200 | 26,738 |
| The scope of planned employment (thousand people, at the end of the year) | 300 | 287 | 273–253 | 256–194 | 219–138 | 130–114 | 117 | - | - |
| The scope of the planned capacity (Mg/employee/year) | 437 | - | 463–515 | 508–529 | 525–773 | 725–806 | 795–810 | - | - |
| The scope of the planned coal production (mill. Mg/year) | 126–131 | - | 135–132 | 130–128 | 121–112 | 95–89 | 95–100 | 95–91 | - |
Publisher’s Note: MDPI stays neutral with regard to jurisdictional claims in published maps and institutional affiliations. |
© 2022 by the authors. Licensee MDPI, Basel, Switzerland. This article is an open access article distributed under the terms and conditions of the Creative Commons Attribution (CC BY) license (https://creativecommons.org/licenses/by/4.0/).
Share and Cite
Kaczmarek, J.; Kolegowicz, K.; Szymla, W. Restructuring of the Coal Mining Industry and the Challenges of Energy Transition in Poland (1990–2020). Energies 2022, 15, 3518. https://doi.org/10.3390/en15103518
Kaczmarek J, Kolegowicz K, Szymla W. Restructuring of the Coal Mining Industry and the Challenges of Energy Transition in Poland (1990–2020). Energies. 2022; 15(10):3518. https://doi.org/10.3390/en15103518
Chicago/Turabian StyleKaczmarek, Jarosław, Konrad Kolegowicz, and Wojciech Szymla. 2022. "Restructuring of the Coal Mining Industry and the Challenges of Energy Transition in Poland (1990–2020)" Energies 15, no. 10: 3518. https://doi.org/10.3390/en15103518
APA StyleKaczmarek, J., Kolegowicz, K., & Szymla, W. (2022). Restructuring of the Coal Mining Industry and the Challenges of Energy Transition in Poland (1990–2020). Energies, 15(10), 3518. https://doi.org/10.3390/en15103518