Article

The Impact of Uncertainties on Crude Oil Prices: Based on a Quantile-on-Quantile Method

1
Business School, Hunan Institute of Technology, Hengyang 421200, China
2
Economics and Finance Group, Portsmouth Business School, University of Portsmouth, Portsmouth PO1 3DE, UK
*
Authors to whom correspondence should be addressed.
Energies 2022, 15(10), 3510; https://doi.org/10.3390/en15103510
Submission received: 14 March 2022 / Revised: 6 April 2022 / Accepted: 6 May 2022 / Published: 11 May 2022
(This article belongs to the Special Issue Global Market for Crude Oil II)

Abstract

:
There has always been a complex relationship between uncertainty and crude oil prices. Three types of uncertainty, i.e., economic policy uncertainty, geopolitical risk uncertainty, and climate policy uncertainty (EPU, GPR, and CPU for short), have exacerbated abnormal fluctuations in the energy market, making crude oil prices volatile more and more frequently, especially from the perspective of the financial attribute of crude oil. Based on the time-series data related to uncertainties and crude oil prices from December 2001 to March 2021, this paper uses the quantile-on-quantile regression (QQR) method to explore the overall impact of various uncertainties on crude oil prices. Moreover, this paper adopts the QQR method based on the wavelet transform to investigate the heterogeneous effects of various uncertainties on crude oil prices at different time scales. The following conclusions are obtained. First, there are significant differences in the overall impact of the three types of uncertainties on crude oil prices, and this heterogeneity is reflected in quantiles of the peak impact intensity, the impact direction, and the fluctuation change. Second, the impact intensities of the three types of uncertainties on crude oil prices are significantly different at different time scales. This is mainly reflected in the different periods of significant impact of the three uncertainties on crude oil prices. Third, the impact directions and fluctuations of the three types of uncertainties on crude oil prices are heterogeneous at different time scales.

1. Introduction

In recent years, due to the continuous intensification of uncertainty, the global economic and political environment has been gradually complicated. The development of the world financial market is full of high uncertainty, and the price fluctuation of financial assets is becoming more and more frequent [1,2]. On the one hand, geopolitical risks and economic and trade friction frequently occur, making it difficult for the financial market to develop smoothly, and affecting regular economic activities in various countries. For instance, in the events such as the 2008 international financial crisis, the European debt crisis, the Brexit, and the Sino–US trade friction, the uncertainty shocks have caused huge impacts on the global financial market, making the price of financial assets, including the price of crude oil, fluctuate violently. With the continuous development of economic globalization, the impact of uncertainty will become more and more intense. On the other hand, the frequent occurrence of climate uncertainties such as earthquakes, tsunamis, and volcanic eruptions in recent years has disrupted the normal acquisition of various resources, making the pricing of resources represented by crude oil fluctuate continuously. In addition, the Climate Uncertainty Index in the past two decades [3] fluctuated more violently in recent ten years. It reached the peak value of 629.02 in September 2019, which is much higher than the average value of 105.12, reflecting the increasing volatility of climate uncertainty in recent years. It can be seen that different types of uncertainty continue to increase, and have a significant impact on the price fluctuation of financial assets.
As the most financialized energy product, crude oil has both the commodity attribute and financial attribute, and the formation and fluctuation of crude oil prices have the basic characteristics of financial products [4,5,6,7,8,9]. Crude oil prices have been in a relatively volatile trend in the past two decades, being in a stable state only in individual periods, and the time interval between large fluctuations is gradually decreasing. Taking original data on the WTI crude oil price as an example, before the 2008 international financial crisis, it maintained a stable upward trend for a period of time with small fluctuations; after the Crisis, it began to fluctuate violently, especially in 2014, 2018, and 2020, when three sharp price drops occurred. Due to the multiple attributes of crude oil, including commodity, finance, politics, resources, and strategies, crude oil prices are vulnerable to economic crises, international political events, climate change, and other factors, and they have the characteristics of volatility, complexity, and variability. Therefore, the fluctuation frequency and amplitude of crude oil prices continue to increase, and effectively identifying the influencing factors is of great significance.
Since both uncertainties and crude oil prices have a trend of increasing fluctuation, and crude oil has complex attributes and characteristics, the influence relationship between uncertainties and crude oil price is not invariable, and there is a close and complex relationship between the two. On the one hand, according to different sources, uncertainty can be divided into economic policy uncertainty, geopolitical risk uncertainty, climate policy uncertainty, and market uncertainty. These uncertainty shocks vary widely in the time, direction, and intensity of their impact on crude oil prices. Compared with uncertain events such as political events and environmental changes, the impact of economic crisis events related to economic uncertainty on crude oil prices is more sustained, broader, and more intense. On the other hand, since the 2008 international financial crisis, uncertainty shocks in the fields of economy, politics, and climate have exacerbated and normalized the fluctuation of crude oil market price. The extreme “V” fluctuation of crude oil prices often occurs. In the post-COVID-19 epidemic period, the impact of global uncertainty continues to increase, causing supply and demand problems in the international crude oil market, and the continuous fluctuation of crude oil prices. For example, in mid-2020, the weak demand for crude oil caused by the impact of uncertainty further intensified the dispute between OPEC and Russia over oil production reduction, resulting in the continuous decline of international crude oil prices, which is not conducive to the normal operation of the international financial market. Based on this, studying the impact of various uncertain shocks on crude oil prices can help fully explore their relationship.
At present, studies on the relationship between uncertainty and crude oil price are mainly divided into the following three categories.
The first is the research on the relationship between economic policy uncertainty (EPU) and crude oil price. Some scholars use different models to study the one-way relationship between them. Aimer and Lusta [10] used a nonlinear and auto-regressive distribution lag method to study the impact of crude oil prices on global economic policy uncertainty. The results show a long-term equilibrium relationship between economic uncertainty and crude oil price, and different types of oil price shocks have no asymmetric effect on economic policy uncertainty in the long run, and only in the short-term. Based on daily data from 17 January to 14 September in 2020, Le et al. [11] analyzed the potential influencing factors of the historical oil price fluctuation during the COVID-19 pandemic. The findings suggest that with the increase in COVID-19 epidemic cases, the U.S. economic policy uncertainty and expected stock market volatility contributed to the decline in WTI crude oil prices. Based on the monthly data of G7 countries from January 1997 to June 2018, Hailemariam et al. [12] adopted a non-parametric panel-data model to study the relationship between oil prices and economic policy uncertainty in G7 countries. The results indicate that the impact of oil price on economic policy uncertainty is time-varying, and the estimated time-varying coefficient of oil price is negative in the year when the oil price rises. Lyu et al. [13] constructed a new time-varying parameter oil market model to study the impact of economic policy uncertainty on crude oil prices based on the monthly oil market data from 2000 to 2020. The findings confirm that economic policy uncertainty shocks have a negative impact on crude oil prices, and the magnitude of this time-varying effect is usually counter-cyclical to oil prices. Another group of scholars studied the interaction between economic policy uncertainty and crude oil prices using the Granger causality test. Sun et al. [14] employed the wavelet analysis and the Granger causality test to study the interaction and causality between economic policy uncertainty and crude oil price at the national level. The results show that the interaction between economic policy uncertainty and oil price is weak in the short-term, but the relationship will gradually strengthen in the long-term; in the short-term, there is no Granger causality between economic policy uncertainty and crude oil price in all sample countries except the United States, whereas there is a strong one-way or two-way Granger causality in all sample countries in the medium- and long-term. Lin and Bai [15] used the TVPVAR model to analyze the interaction between the newly formulated economic policy uncertainty index and oil price. The results show that economic policy uncertainty explains the fluctuation response of oil price shock, and the oil price has a negative response to economic policy uncertainty. After two financial crises, positive oil price shocks can reduce uncertainty and vice versa. Based on the crude oil price data from 1985 to 2018, He et al. [16] proposed a new composite model and divided the sample data into multiple periods to study the correlation effect between economic policy uncertainty and WTI futures prices. The findings indicate that no matter how the time scale is divided, the information will be transmitted from the EPU index to crude oil price, but the transmission capacity is different. The reverse chain cycle between oil price and EPU index accounts for 63% of the sampling interval. The correlation intensity between the EPU index and oil price varies significantly in different periods. Su et al. [17] used the quantile Granger causality test to study the impact of crude oil price shocks on economic policy uncertainty in BRICS countries. The research results show the characteristics of asymmetry. When the oil market price rises, the crude oil price shock positively impacts the EPU of China, India, and Brazil; the EPU of BRICs countries has a heterogeneous impact on the oil market price, and the degree of impact is related to the oil demand.
The second is to study the relationship between geopolitical risk uncertainty and crude oil prices using different types of empirical models and geopolitical risk measurement methods, and most scholars use time series models to study the relationship. Lu et al. [18] developed an AS-TVTP-MS-GARCH model to study geopolitical risk (GPR), which can predict crude oil price volatility from the perspective of time-varying transition dynamics. The research results show that under this model, geopolitical risk has a better prediction effect on the regime-switching of crude oil price volatility, and the negative shocks of GPR have a greater impact on the switching probabilities than the positive shocks. Liu et al. [19] used the GARCH-MIDAS model to analyze the impact of geopolitical uncertainty on the price fluctuations of major energy commodities. It was found that geopolitical uncertainty has a significant positive impact on energy price volatility, and it may affect energy markets through adverse geopolitical events. Based on monthly data from January 1970 to December 2018, Monge and Crist’obal [20] adopted the FC-VAR model and the wavelet analysis method to analyze the impact of terrorist attacks on oil production and prices. The results indicate that the impact of terrorist attacks on oil production and oil prices is insignificant and has a short-term feature. Based on the crude oil price data from January 1998 to September 2014, Chen et al. [21] used the SVAR model to study the impact of the OPEC’s political risk on the volatility of international crude oil prices. The empirical results show that the political risks of OPEC countries have a significant positive impact on crude oil prices, contributing to a smaller proportion of oil price fluctuations than oil demand shocks. Some scholars construct panel data models to test the relationship between geopolitical risk uncertainty and crude oil price fluctuations. For example, Ivanovski and Hailemariam [22] used a variable coefficient non-parametric panel data model to study the time-varying impact of oil price volatility on geopolitical risk based on monthly panel data of 16 countries from 1997 to 2020. The results show that there is a negative correlation between oil price and geopolitical risk, and there is a positive correlation between oil price fluctuation and geopolitical risk in most sample periods, and there is national heterogeneity in the time-varying relationship between oil price and geopolitical uncertainty. Some scholars have constructed geopolitical risk uncertainty indices in different ways to analyze the relationship between geopolitical risk uncertainty and crude oil prices. Atri et al. [23] used the autoregressive distributed lag (ARDL) method to study whether panic and media coverage related to COVID-19 news could affect oil and gold prices from January 2020 to June 2020. Empirical results show that relevant media coverage during the COVID-19 epidemic has a positive impact on the price of gold, whereas coverage of bad news has a more significant impact on oil prices, and both economic and financial uncertainties have had a negative impact on oil and gold prices during the COVID-19 epidemic period. Based on the monthly data of the global geopolitical tension index and global crude oil prices from 1990 to 2020, Lee et al. [24] studied the relationship between geopolitical risks and crude oil price volatility. The findings revealed that the newly constructed geopolitical tension index has a significant impact on the fluctuation of global oil prices after a series of causality tests, and it was determined that geopolitical threats are the core influencing and predicting factors of global oil price fluctuations.
The third is the research on the relationship between various uncertainties and crude oil price. The existing research mainly focuses on analyzing the relationship between crude oil price and economic policy uncertainty, as well as geopolitical risk uncertainty. Hu et al. [25] adopted high-frequency data to study the impact of six indexes, such as the economic policy uncertainty index and the geopolitical risk index, on the three main commodities of soybean, gold, and crude oil. The results show that the response of different commodities to macro shocks has different and significant characteristics. Compared with the other two commodities, the impact of economic policy uncertainty and geopolitical risk on crude oil volatility is greater. Based on the quantile auto-regressive and the quantile causality methods, Uddin et al. [26] investigated the impact of geopolitical risks and the U.S. economic policy uncertainty on the fuel prices in the United States, Brazil, and Malaysia. The research shows that the increase of uncertainty has a relatively greater impact on the prices of ethanol and palm oil, causing a huge negative fluctuation in the price of the biofuel portfolio. Yi et al. [27] developed a GARCH-MIDAS model to study the interpretation and prediction ability of economic uncertainty and geopolitical risk on the volatility of the crude oil futures market. They found that uncertainties such as geopolitical risks and global economic policy uncertainty have a superior ability to predict the future fluctuations of crude oil prices. Dutta et al. [28] applied a quantile regression method to study the impact of news-based equity market volatility (EMV) trackers on crude oil price volatility. They also compared the impact of other uncertainty indexes on crude oil price volatility. The findings reflect that in the period of high oil price volatility, the EMV trackers significantly impact oil price volatility, whereas in other periods of the oil market, the EMV trackers have no significant impact on the oil price. Through further analysis, it can be seen that the EMV trackers have better prediction ability than the volatility index (VIX), economic policy uncertainty (EPU), and geopolitical risk (GPR) indexes.
Throughout the above research, scholars mainly focused on the impact relationship between crude oil price and economic policy uncertainty, as well as geopolitical risk uncertainty, providing many new ideas for this research. However, there are few studies related to the impact of multiple uncertainty shocks on crude oil price; in particular, the relationship between climate policy uncertainty and crude oil price is less studied, although some scholars have begun to pay attention to the impact between climate change and crude oil price [29,30,31]. Based on this, according to the time-series data of uncertainties and crude oil price from December 2001 to March 2021, this paper explores the impact of various uncertainties on crude oil price, and further analyzes the heterogeneous impact of various uncertainties on crude oil price under different time scales.
Compared with previous studies, the marginal contribution of this paper is mainly reflected in the following three aspects. Firstly, this paper analyzes and compares the effects of three uncertainties on crude oil prices. This paper uses a quantile-on-quantile regression method to explore the overall impact of three uncertainties on crude oil prices. It is found that the impact of the three types of uncertainties on the crude oil price is heterogeneous, which is reflected explicitly in the quantiles of the peak impact intensity, the impact direction, and the fluctuation changes. Overall, the three uncertainties have a negative impact on crude oil prices at most quantiles. When the crude oil market is in a downturn, the volatility impact of economic policy uncertainty on crude oil price is more frequent, and the impact of climate policy uncertainty on crude oil price is more severe. Secondly, this paper analyzes the heterogeneous effects of three uncertainties on crude oil prices in different periods. Based on the maximum overlap discrete wavelet transform and the quantile-on-quantile regression method, this paper explores the differences in the impact of three types of uncertainties on crude oil prices at different time scales. It is found that the impact of each uncertainty on crude oil price at different time scales is heterogeneous, which is mainly reflected in the impact intensity, impact direction, and fluctuation change. From multiple periods, the positive impact of the three uncertainties on crude oil prices is mainly concentrated in the boom period of the crude oil market, whereas the negative impact mainly occurs in the depression period of the crude oil market. In terms of influence direction, the change of influence direction of three uncertainties on crude oil price mainly occurs in the depression period of the crude oil market. Thirdly, this paper compares and summarizes the heterogeneous effects of three uncertainties on crude oil prices in different periods. By comparing the effects of three types of uncertainties on crude oil prices at different time scales, it is found that these effects are significantly different. This is mainly embodied in the following two aspects. On the one hand, there are differences in the time when the three types of uncertainties dramatically impact crude oil prices on different time scales. On the other hand, there is heterogeneity in the influence direction and fluctuation of the three kinds of uncertainties on crude oil prices at different time scales. In terms of the period when uncertainties affecting the crude oil price, the strong impact of economic policy uncertainty on the crude oil price mainly occurs in the long-term; the impact of climate policy uncertainty on the crude oil price is more significant in the medium-term; and the geopolitical risk uncertainty has a significant impact on the crude oil price in all three periods. From the perspective of impact fluctuation, the impact of economic policy uncertainty on crude oil price mainly occurs during the depression period of the crude oil market. In contrast, the impact of geopolitical risk uncertainty and climate policy uncertainty on crude oil price mainly focuses on the normal period of the crude oil market.
The follow-up structure of the paper is as follows: Section 2 elaborates the research design; Section 3 carries out the empirical analysis on the impact of uncertainties on crude oil prices; Section 4 extends the discussion further; and Section 5 draws the conclusion.

2. Research Design

2.1. Research Strategy and Methods

In order to study the possible complex correlation and heterogeneity of various uncertainties on crude oil prices, this paper adopts the maximum overlap discrete wavelet transform and the quantile-on-quantile regression (QQR) methods. The specific steps are as follows. Firstly, this paper uses the QQR method to study the overall impact of economic policy uncertainty (EPU), geopolitical risk uncertainty (GPR), and climate policy uncertainty (CPU) on crude oil prices. Secondly, considering that there may be heterogeneity in the impact of various uncertainties on crude oil prices under a long sample period, this paper uses the discrete wavelet technology to divide the time frequency of the research data into five timescales [32,33], namely D1–D5, according to 2–4, 4–8, 8–16, 16–32, and 32–64 quarters. On this basis, the heterogeneity impact of various uncertainties on crude oil prices is further analyzed, thus forming a distinct comparison of the impact results. If only three cycles are divided to represent the long, medium, and short periods, some key information may be neglected, which is not conducive to our in-depth observation of the relationship between the two. If this time period is divided into more timescales, it may lead to little change in the impact relationship between the two, which is not conducive to further analysis. Based on this, the paper considers dividing the time period of the research data into five timescales. Finally, this paper illustrates the robustness of the conclusions of this paper by comparing the average estimates of the influence coefficients under two different estimation methods: quantile regression and quantile-on-quantile regression.
Compared with traditional econometric methods, such as the VAR model, the Granger causality test method, and the GARCH model, the wavelet analysis method and the QQR analysis method used in this paper can more effectively track the impact of various uncertainties on crude oil prices to varying degrees, capturing richer impact relationship information, so as to bring more comprehensive results. In addition, based on the quantile regression method, the quantile-on-quantile regression method can effectively reveal the impact of various uncertainties under different quantiles on the crude oil price of different quantiles, effectively avoiding the restrictive assumptions of parameters, and making up for the defect that the traditional quantile regression method ignores the state of explanatory variables. Therefore, this paper uses the maximum overlap discrete wavelet transform and the quantile-on-quantile regression method to study the heterogeneous effects of three uncertainty indexes on crude oil prices in different time dimensions, and further compares and analyzes these effects. This paper mainly uses the Matlab software and the Stata software for data analysis and empirical analysis. The Stata software is mainly used for data analysis, and the Matlab software is mainly used for empirical analysis and 3D graphs.

2.1.1. The Wavelet Analysis Method

Compared with ordinary discrete wavelet transform, maximum overlap discrete wavelet transform (MODWT) has no excessive requirements for data length and higher resolution [34,35]. Scholars often use this method to decompose time series data in empirical research [8]. Based on this, this paper uses MODWT to decompose the original time series. The following is the process of the wavelet decomposition. Firstly, it is assumed that all time series variables Z ( t ) in this paper follow a specific structure, as shown in Formula (1):
Z ( t ) = k s j , k ω j , k ( t ) + k d j , k ψ j , k ( t ) + k d j 1 , k ψ j 1 , k ( t ) + + k d 1 , k ψ 1 , k ( t )
where j represents the decomposition level, and k represents the translation parameter; ω j , k ( t ) is the father wavelet, which is applied for the trend components in Formula (1); ψ j , k ( t ) is the mother wavelet, which stands for the degree of deviation from the trend; s j , k represents scaling coefficients; d j , k represents detail coefficients. s j , k and d j , k can be further expressed by ω j , k ( t ) and ψ j , k ( t ) , as shown in Formulas (2) and (3):
s j , k =   ω j , k ( t ) f ( t ) d t    
d j , k =   ψ j , k ( t ) f ( t ) d t  
where d j , k is the scale deviation from the smooth process;   s j , k is the smooth behavior of data j = 1 n that is connected with a location t and scale [ 2 j 1 , 2 j ] .
Secondly, in this paper, the maximum overlap discrete wavelet transform (MODWT) is used to decompose the original time series at multiple scales so that the functional expressions of the father wavelet and the mother wavelet can be obtained, as shown in Formulas (4) and (5):
S j ( t ) = k s j , k ω j , k ( t )
D j ( t ) = k d j , k ψ j , k ( t )        
Finally, the original time series in Formula (1) can be rewritten into the form of Formula (6):
Z ( t ) = D 1 ( t ) + + D j ( t ) + S j ( t )  
where D j ( t ) represents the decomposed time series; S j ( t ) represents the residual term.
To sum up, after the wavelet transformation, the research data in this paper can be transformed from the original time series to data with different frequencies under five timescales, D1–D5, which are helpful for a more comprehensive study on the impact of various uncertainties on crude oil prices under different time scales.

2.1.2. The Quantile-on-Quantile Regression Method

Compared with the traditional OLS regression method and the quantile regression analysis (QRA) method, the quantile-on-quantile regression (QQR) method can more effectively and comprehensively analyze the impact of various uncertainties on crude oil prices. Although QRA can provide more information about tail dependence, i.e., it can capture the influence between uncertainties and crude oil price in different degrees and the correlation structure between variables, it may ignore that the nature of uncertainty can affect the interaction between uncertainties and crude oil prices. The QQR method, however, can comprehensively study the heterogeneous effect of uncertainty under different quantiles on crude oil prices in different quantiles. Flexibility is the main advantage of the QQR method, which can effectively test the functional relationship between various uncertainties and crude oil prices. Furthermore, the asymmetric effects of uncertainty at different quantiles on crude oil prices at different quantiles are negligible in this paper. In summary, after referring to the method of Sim and Zhou [36], this paper adopts the QQR method to analyze the influence of various uncertainties on international crude oil prices under different quantiles. The following is an introduction to the QQR method. The specific model is shown in Formula (7):
O i l t = β θ ( U I n , t ) + μ t θ
where O i l t represents the crude oil price in period t ; U I n , t represents the uncertainty indexes in period t, where n = 1 ,   2 ,   3 , representing the economic policy uncertainty index, the geopolitical risk uncertainty index, and the climate policy uncertainty index; θ represents the θ th quantile; μ t θ stands for the residual under quantile θ ; β θ ( · ) is an unknown function form lacking prior information.
In order to calculate the unknown relationship function β θ ( · ) between uncertainties and crude oil price in Model (7), this paper first uses the first-order Taylor expansion to expand the regression model, and the specific form is shown in Formula (8):
β θ ( U I n , t ) β θ ( U I n φ ) + β θ ( U I n φ ) ( U I n , t U I n φ )
where β θ ( U I n φ ) is the value of U I n (uncertainty) at the quantile φ , and β θ ( U I n , t φ ) is the partial derivative of β θ ( U I n , t φ ) with respect to U I n , t , which can be seen as a marginal benefit. Since all variables in Formula (8) are functions of θ and φ , β θ ( U I n φ )   and   β θ ( U I n φ ) can be regarded as the functions of θ and φ in Formula (8), so that Formula (8) can be simplified as Formula (9):
β θ ( U I n , t ) β 0 ( θ , φ ) + β 1 ( θ , φ ) ( U I n , t U I n φ )
Then, by substituting Formula (9) into Formula (7), Formula (10) can be further obtained:
O i l t = β 0 ( θ , φ ) + β 1 ( θ , φ ) ( U I n , t U I n φ ) + μ t θ
where β 0 ( θ , φ ) + β 1 ( θ , φ ) ( U I n , t U I n φ ) is the linear part of the crude oil price of the conditional quantile θ , from which it can be seen that these parameters change with the change of the quantile, effectively reflecting the impact of the nth uncertainty on the φ th quantile on crude oil price at the θ th quantile.
Finally, this paper uses the estimators of U I n , t and U I n φ to replace the original estimators, and uses b 0 and b 1 to replace the estimated coefficients β 0 and β 1 in the local linear regression. In this way, the original problem can be transformed into a minimization problem. The specific solution formula is shown in Formula (11), and the values of β ^ 0 ( θ , φ ) and   β ^ 1 ( θ , φ ) can be finally obtained. Formula (11) is as follows:
min b 0 , b 1 i = 1 m ρ θ [ O i l t b 0 b 1 ( U I ^ n , t U I ^ n φ ) ] K ( F m ( U I ^ n , t φ ) h )  
where ρ θ ( u ) is a quantile loss function, and ρ θ ( u ) = u ( θ I ( u < 0 ) ) ; I ( · ) is a commonly used indicator function; K ( · ) represents the kernel function, which is widely used for parameter estimation due to its simplicity and effectiveness. Therefore, this paper adopts the Gaussian kernel function to weight the adjacent observations of U I n φ . In addition, the weight of the neighborhood observations is inversely proportional to the distanced observations in the distribution of   U I ^ n , t , which can be represented by the empirical distribution function of F m ( U I ^ n , t ) in Formula (12):
F m ( U I ^ n , t ) = 1 n k = 1 m I ( U I ^ n , k < U I ^ n , t )
It should be noted that the key to kernel function regression is the choice of bandwidth. Therefore, by referring to the relevant literature [36,37,38], this paper finally decides that the bandwidth parameter is 0.05, so as to weight the observation values near the quantile.

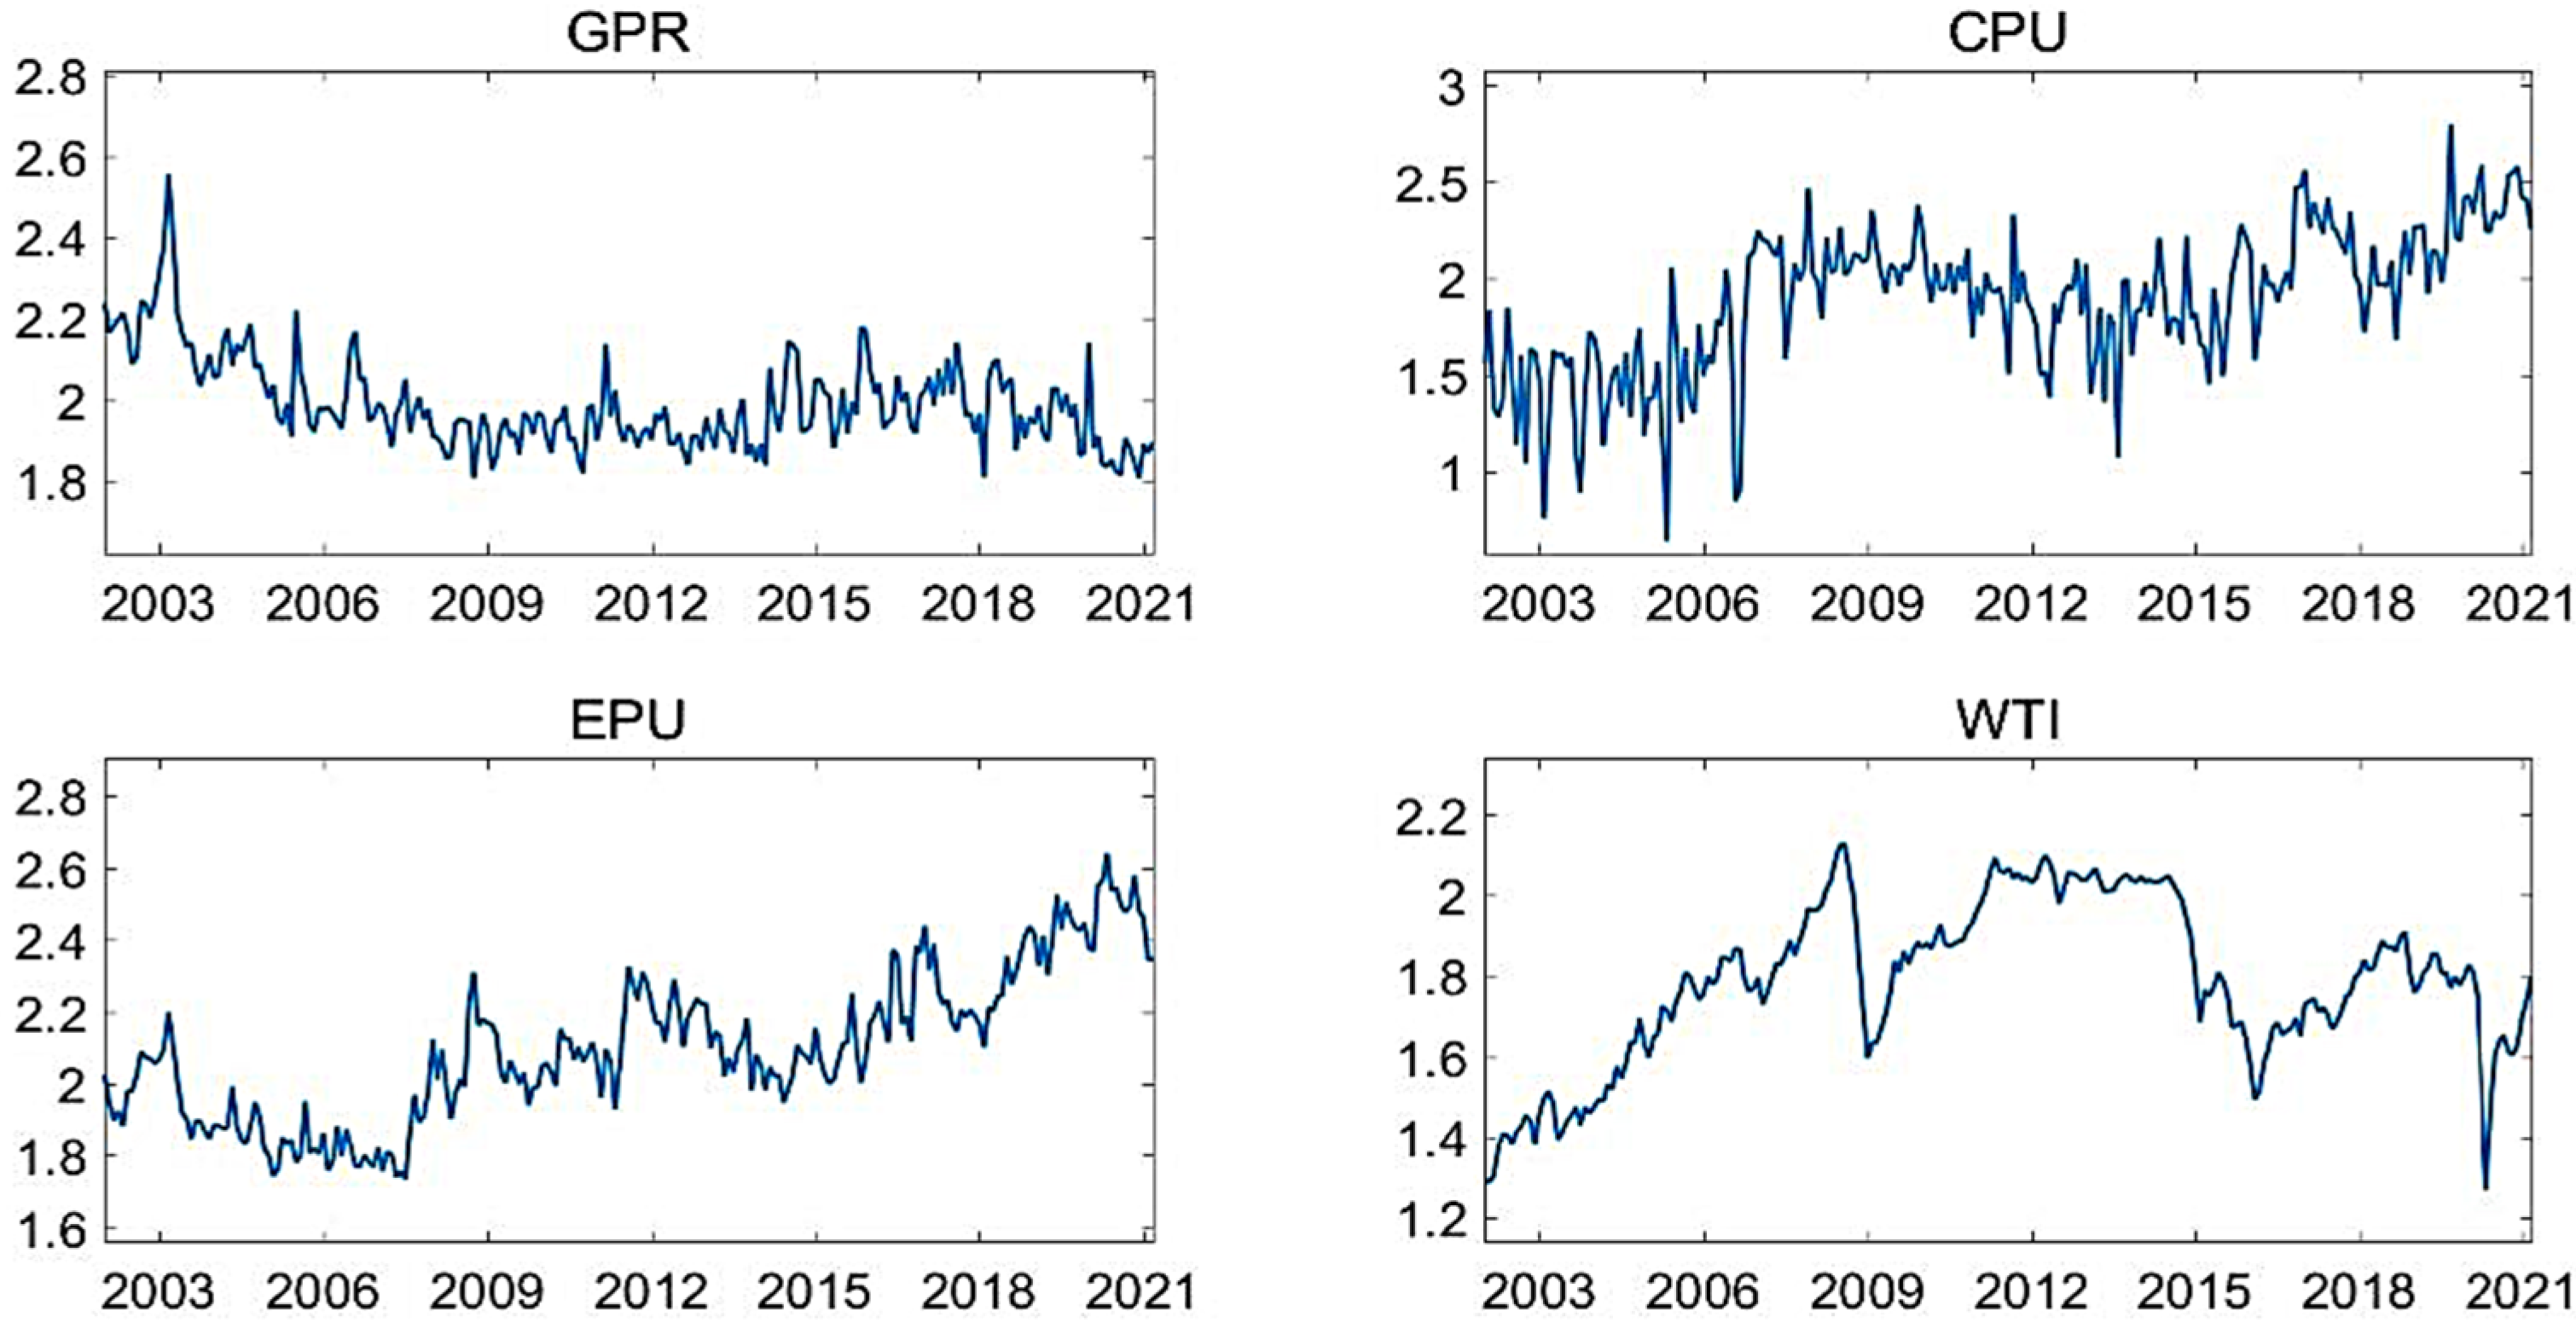
2.2. Variable Description and Data Trend Analysis

In order to study the impact of various uncertainties on crude oil prices, and based on the complex relationship between crude oil prices and uncertainties, this paper selects economic policy uncertainty (EPU), geopolitical risk uncertainty (GPR), and climate policy uncertainty (CPU) from three perspectives of macroeconomics, geopolitical events, and climate impacts, as well as the WTI crude oil price, as the core variables.
The EPU index used in this paper is the GEPU index obtained by scholars through the weighted average calculation of the EPU indexes of 21 countries based on Baker et al. [39]. The EPU index of each country reflects the article frequency in national newspapers on three terms: economy, policy, and uncertainty. The GDP of the 21 countries that entered the EPU index accounts for 71% of the world’s total GDP. Based on this, the EPU index selected in this paper is representative and persuasive, and can effectively reflect the uncertainty of global economic policy.
Caldara and Iacoviello constructed the GPR index to measure geopolitical risks based on newspaper articles on geopolitical tensions [40]. Caldara and Iacoviello mainly calculated the number of articles related to harmful geopolitical events in each newspaper every month, i.e., based on the automatic text search results of the electronic search of 10 newspapers, to build the GPR. The automatic search mainly includes 8 types of keywords: war threat, peace threat, military build-up, nuclear threat, terrorist threat, war start, war escalation, and terrorist act. This paper adopts the GPR index to reflect the uncertainty of global geopolitics comprehensively.
Gavriilidis measures the CPU index according to the standardization of the ratio of relevant articles per month in the total number of articles published per month by searching the keywords in 8 influential newspapers in the United States based on the EPU constructed by Baker et al. [3]. These keywords of climate policy uncertainty include uncertainty, climate, climate risk, greenhouse gases, greenhouse gas emissions, carbon dioxide, carbon dioxide emissions, global warming, climate change, green energy, renewable energy, and environment. The CPU index used in this paper can effectively interpret the connotation of climate policy uncertainty and reflect the uncertainty of global climate policy.
The detailed description and data sources of the EPU index, the GPR index, and the CPU index used in this paper are from www.policyuncertainty.com (accessed on 5 April 2021). Considering that crude oil has multiple attributes, and the financial attribute of crude oil has become more obvious in recent years [41,42,43,44,45,46], the risk evolution and risk volatility to the crude oil market are more violent. Therefore, when selecting the crude oil price variable, this paper will pay more attention to the financial attribute of the crude oil price. Moreover, considering the representativeness and openness of crude oil data and the consistency of data frequency, this paper finally selects the WTI crude oil spot price as the crude oil price variable, and the data come from the U.S. Energy Information Administration (EIA). For the crude oil data, this paper adopts the yield data, which can better reflect the change of internal value, and provide more information. The data of all variables in this paper are monthly data, and the sample interval covers 232 months from December 2001 to March 2021. On the one hand, based on the availability of data, this paper selects this time period to ensure the time ranges of the uncertainty data and the crude oil price data are consistent. On the other hand, the selection of 232 monthly data in nearly 20 years is conducive to a more in-depth analysis of the dynamic relationship between uncertainties and crude oil prices. The selection of variables and data sources in this paper are summarized in Table 1 [47].
Figure 1 illustrates the fluctuation trends of three types of uncertainties and crude oil prices in the sample interval. First of all, from the perspective of the fluctuation frequency and intensity of the data, the fluctuation frequency of the CPU index is large, and its fluctuation intensity is significantly stronger than the other two uncertainties and crude oil prices, which is consistent with the information fed back in Table 1. Secondly, judging from the upward trend of the data, except for the GPR, the other three variables all show an upward trend of fluctuation in the sample interval. Finally, from the trend chart of crude oil prices, it can be seen that the three time periods with large fluctuations in crude oil prices are 2007–2009, 2013–2016, and 2019–2020.
The variable descriptive statistics of crude oil price and three types of uncertainties are recorded in Table 2 [48,49,50].
Table 2 displays the data characteristics of each variable. Next, this paper compares and analyzes the trends in the time dimension of the variables. All variables in the empirical analysis have been logarithmically processed. Table 2 shows that all the data in this paper passed the J-B test, as well as the ADF test.

3. Empirical Results of the Impact of Uncertainties on Crude Oil Prices

This section explores the overall impact of three uncertainties on crude oil prices. Secondly, by exploring the impact of three types of uncertainty on crude oil price under five different time scales, D1–D5, it can be seen that the impacts of uncertainties on crude oil price are heterogeneous [40,51]. For a more direct understanding of the analysis and comparison of the impacts of uncertainties on crude oil price, this paper extracts the key features of the three-dimensional impact diagram and summarizes them in Table 3, Table 4 and Table 5.

3.1. The Overall Impact of Three Uncertainties on Crude Oil Prices

This paper adopts the quantile-on-quantile regression method to study the impact of economic policy uncertainty, geopolitical risk uncertainty, and climate policy uncertainty on crude oil prices under different quantiles. The specific influence coefficient estimation results are shown in Figure 2.
From Figure 2, for the overall impact of three uncertainties on crude oil prices, this paper has the following findings. (1) The EPU has a negative impact on the WTI in most cases, but there are significant differences in the impact of the EPU on the WTI at individual quantiles. When the WTI is at the middle and low quantile (0.2–0.4), the EPU has an inverted U-shaped effect on the WTI; that is, when the WTI is at the quantile of about 0.3, the EPU has a significant positive effect on the WTI, whereas at other quantiles, the EPU has a negative effect on the WTI. (2) The GPR significantly inhibits the WTI at most quantiles. Among them, when the GPR is at the middle and high quantile (0.6–0.8), and the WTI is at the middle and low quantile (0.2–0.4), the inhibitory intensity of the GPR on the WTI reaches the peak. When the WTI is at the low quantile (0–0.2), the GPR has a slight positive effect on the WTI. (3) The CPU has a weak negative impact on the WTI in most cases, but when the WTI is at the low quantile (0–0.2), the impact of the CPU on the WTI has strong heterogeneity. Among them, when the WTI is at the low quantile (0–0.1), the CPU has a slightly positive impact on the WTI. When the CPU is in the middle and low quantile (0.2–0.4), and the WTI is in the low quantile (0.1–0.2), the CPU has a strong negative impact on the WTI.

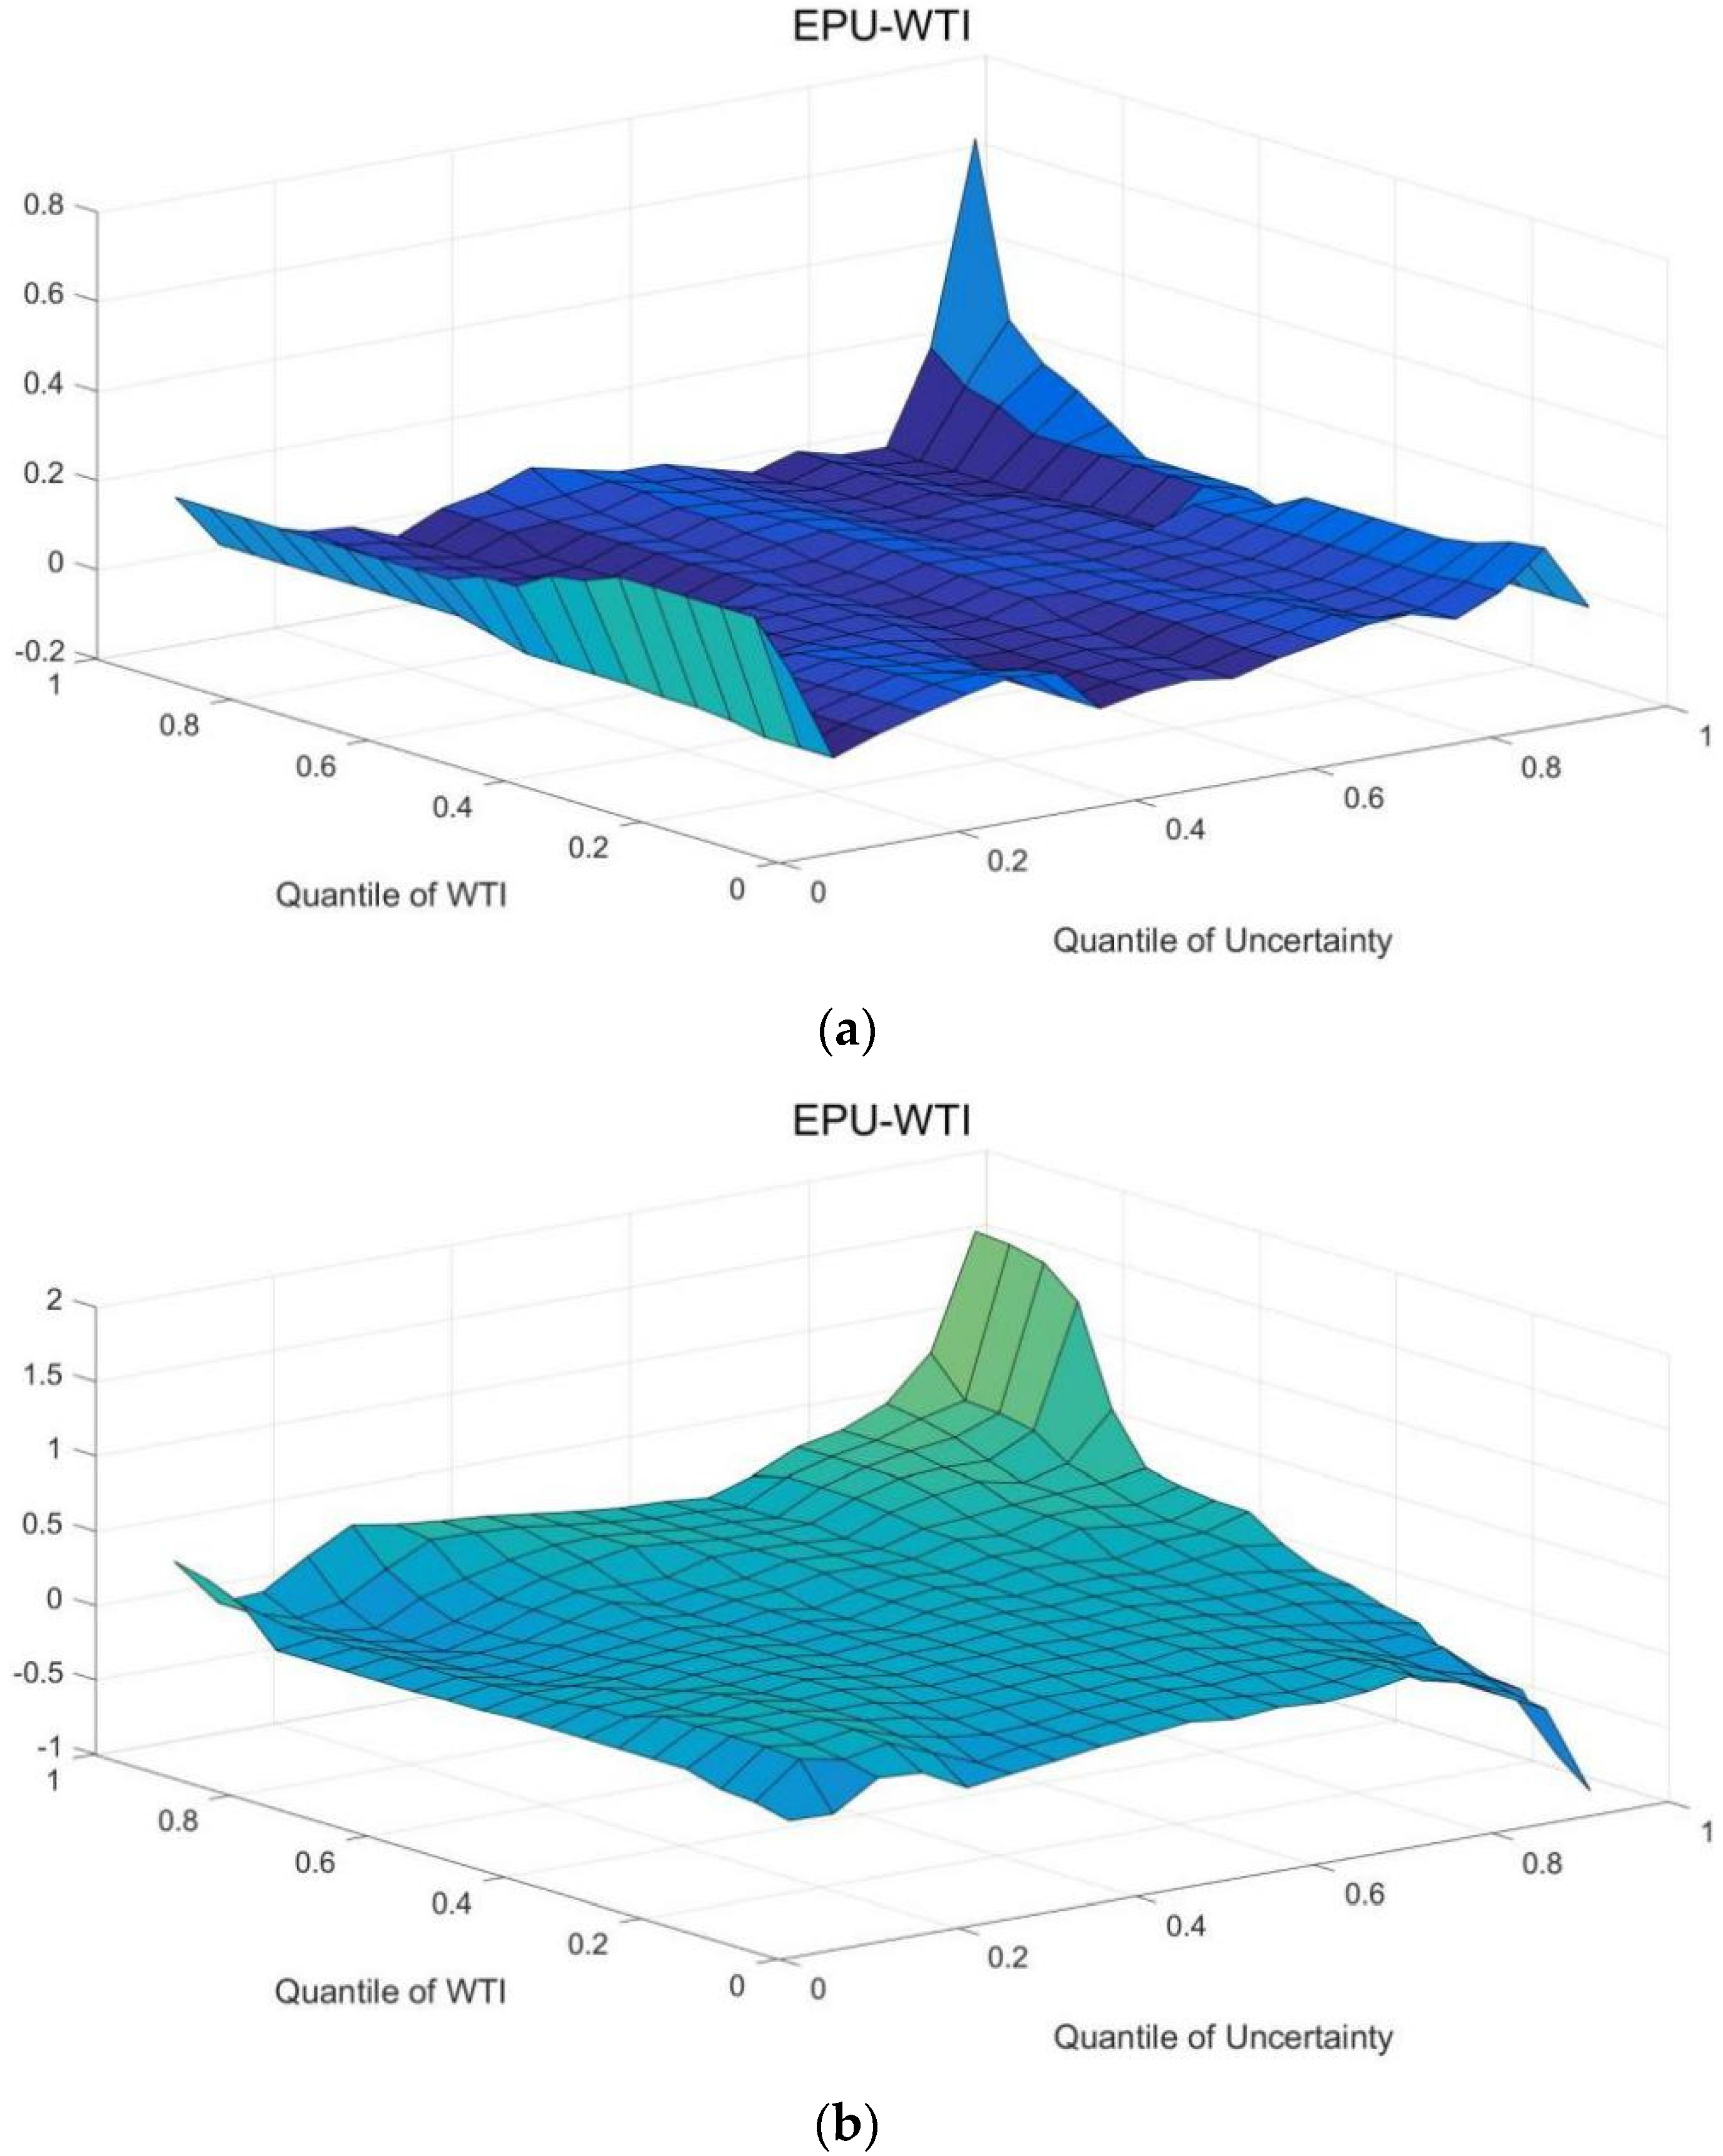
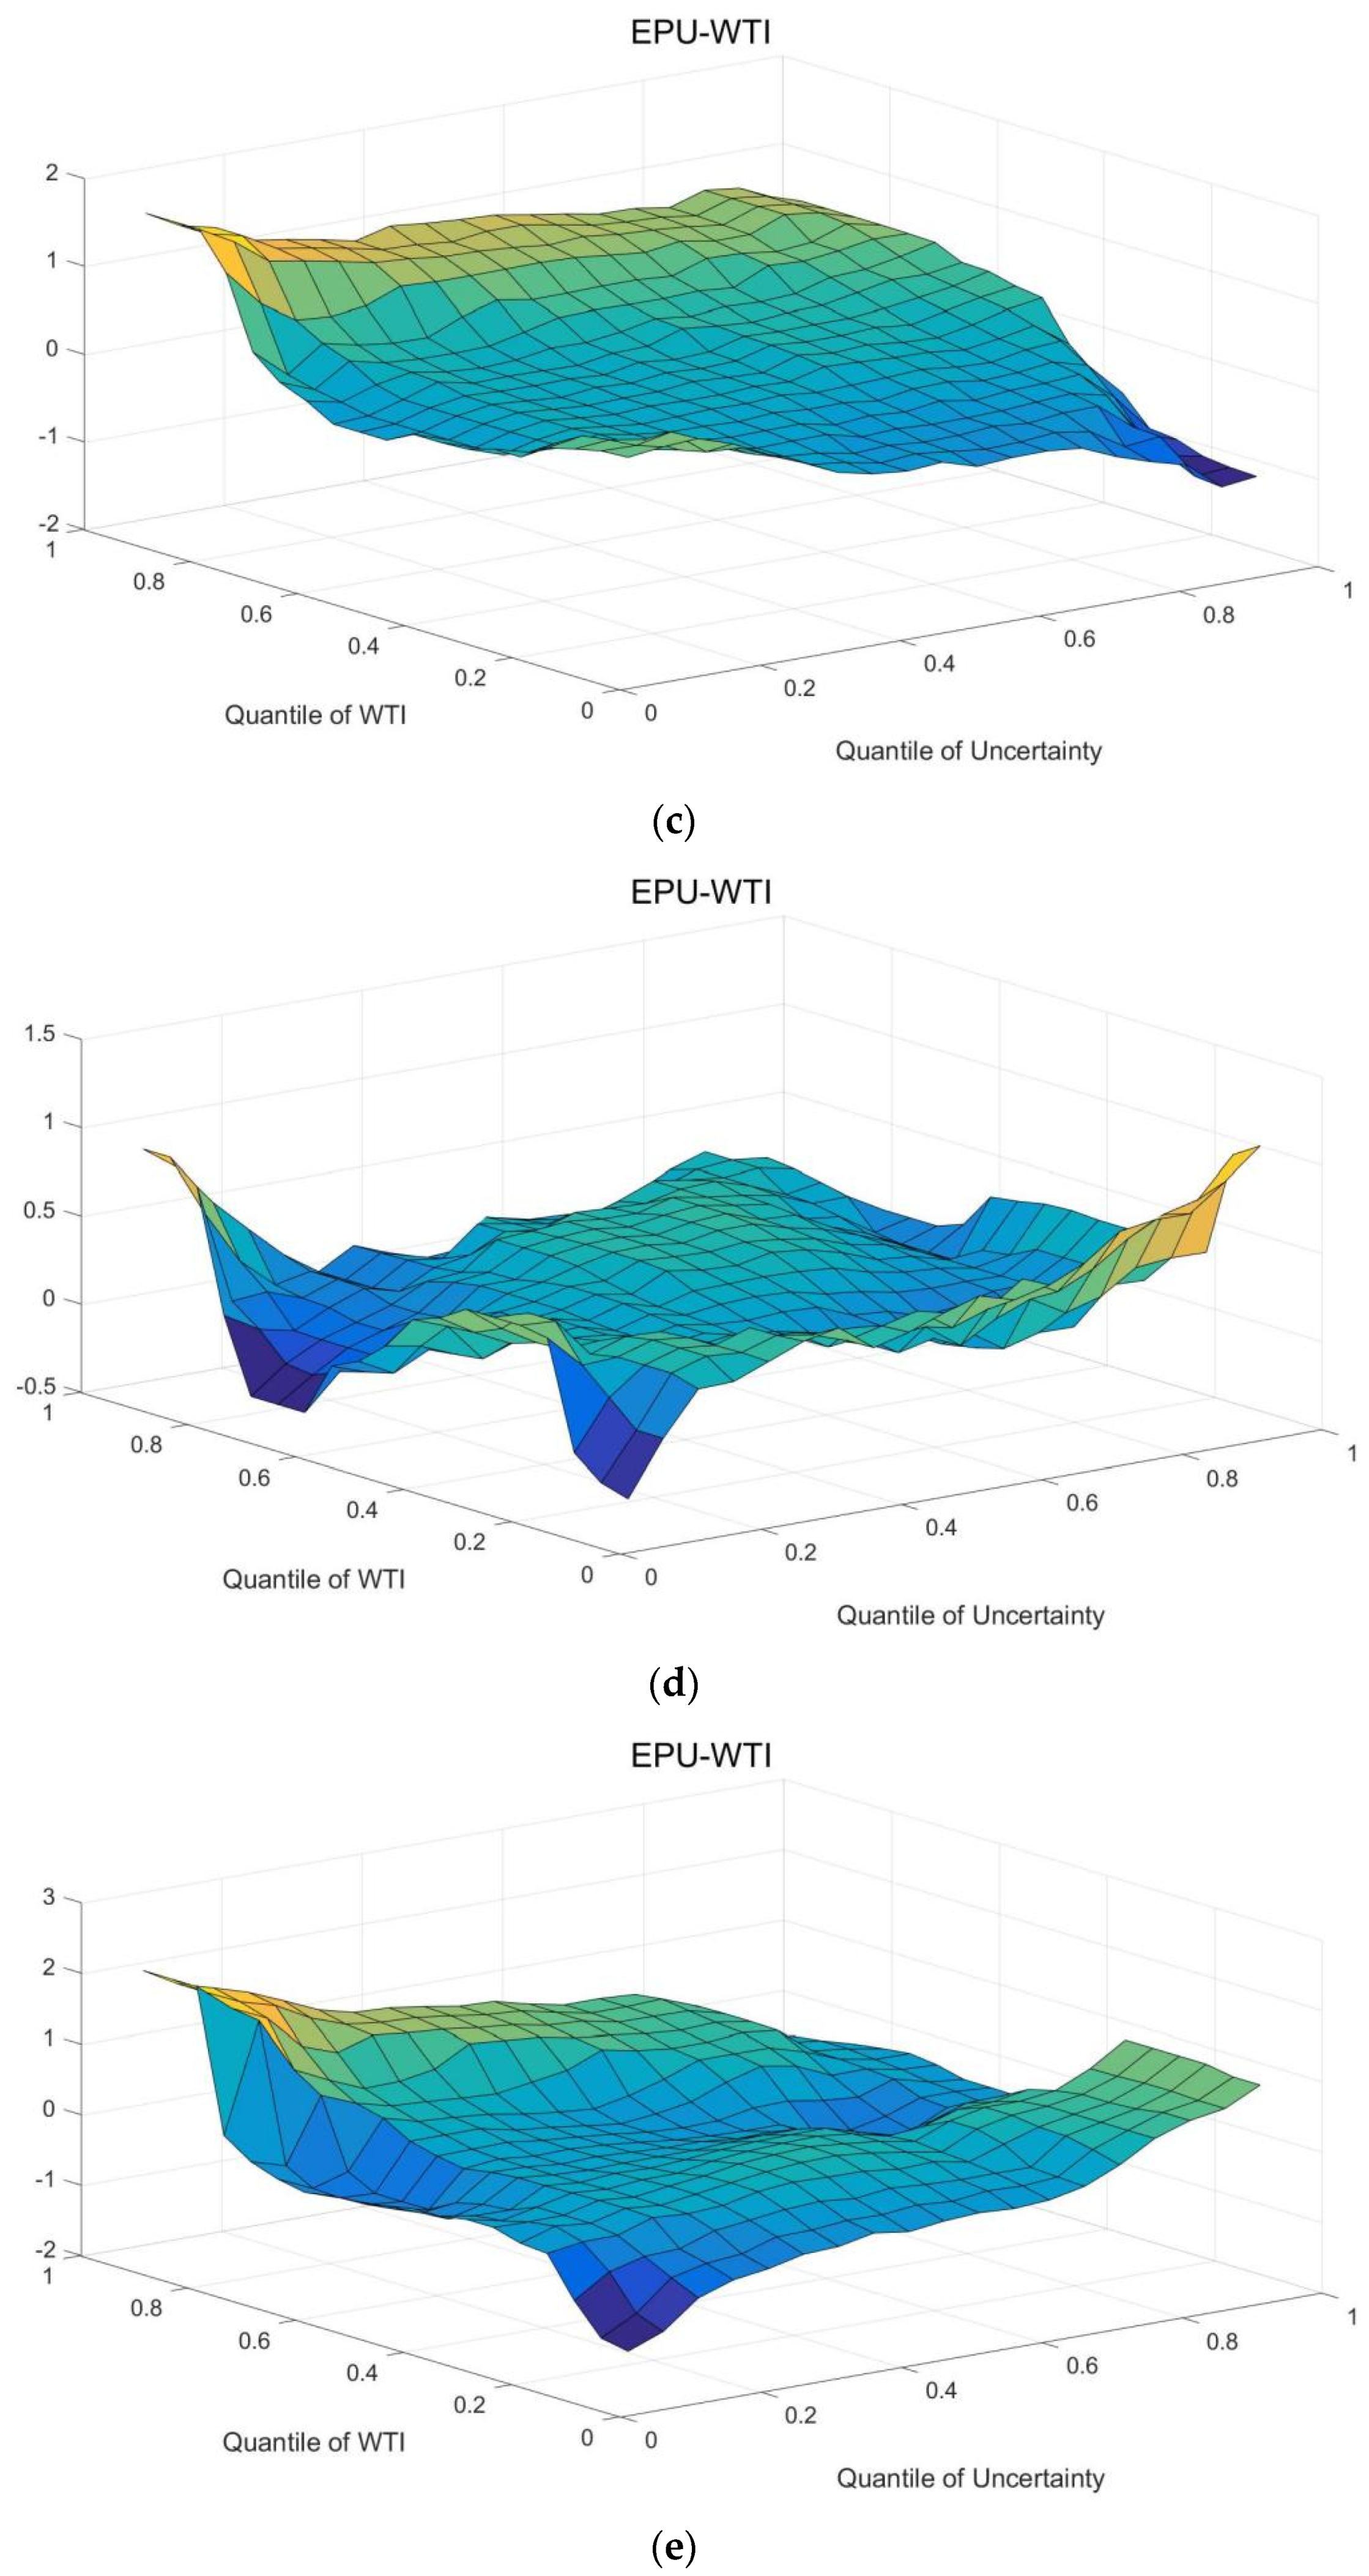
3.2. The Heterogeneous Impact of Economic Policy Uncertainty on Crude Oil Prices

This sub-section focuses on the heterogeneity impact of economic policy uncertainty on crude oil prices on five different time scales from D1 to D5 with the wavelet transform and the quantile-on-quantile regression methods [52,53]. The specific impact coefficient estimation results are shown in Figure 3. Among them, (a–e) represent the estimated results at the time scale of D1–D5, respectively.
From Figure 3, we conclude the following findings regarding the impact of the EPU on crude oil prices at different time scales. At the time scale D1, the EPU has a heterogeneous impact on the WTI, mainly in terms of the impact intensity. More specifically, the EPU has a positive effect on the WTI across all quantiles. At the time scale D2, there are significant differences in the effect of the EPU on the WTI, and this heterogeneity is reflected in both the impact intensity and direction. There is a weak positive impact of the EPU on the WTI at most quantiles. At the time scale D3, there are differences in the impact of the EPU on the WTI, which is also embodied in the impact intensity and the direction. At most quantiles, the EPU has a positive effect on the WTI, and the intensity of this positive effect peaks at the low quantile (0–0.1) of the EPU, and the high quantile (0.8–1) of the WTI. At the time scale D4, heterogeneity exists in the influence intensity and direction of the EPU on the WTI. The EPU has a positive impact on the WTI at most quantiles. At the time scale D5, the impact intensity and direction of the EPU on the WTI are significantly different at different quantiles. At most quantiles, the EPU has a positive effect on the WTI.
By comparing the impact features of the EPU on the WTI at the time scales of D1–D5 in Table 3, we have the following findings. (1) From the perspective of the impact direction, the EPU has a positive impact on the WTI at most quantiles in D1–D5, and the impact intensity has obvious heterogeneity at different time scales. (2) From the perspective of the peak impact intensity, the maximum values of both the positive and the negative impact intensities appear in the D5 time scale. This indicates that compared with other periods, the impact of economic policy uncertainty on crude oil prices is more significant in the long run. (3) From the perspective of the quantiles at which the peaks appear on the D1–D5 time scale, the peak impact intensity is more likely to appear in the following three quantiles: both the EPU and the WTI are at the high quantile (0.9–1); when the EPU is at the low quantile (0–0.1) and the WTI is at the high quantile (0.8–1); when the EPU is at the high quantile (0.8–1) and the WTI is as the low quantile (0–0.1). It can be seen that the positive and significant impact of economic policy uncertainty on crude oil prices mainly occurs in the boom period of the crude oil market, whereas the strong negative impact mainly occurs in the depression period. (4) As for the changing forms of the impact direction, it can be seen that the main form is from the negative impact to the positive impact, which mainly occurs when the EPU and the WTI are at extreme quantiles. This shows that there are certain fluctuations in the impact of economic policy uncertainty on crude oil prices, and this fluctuation mainly occurs in the depression period of the crude oil market.

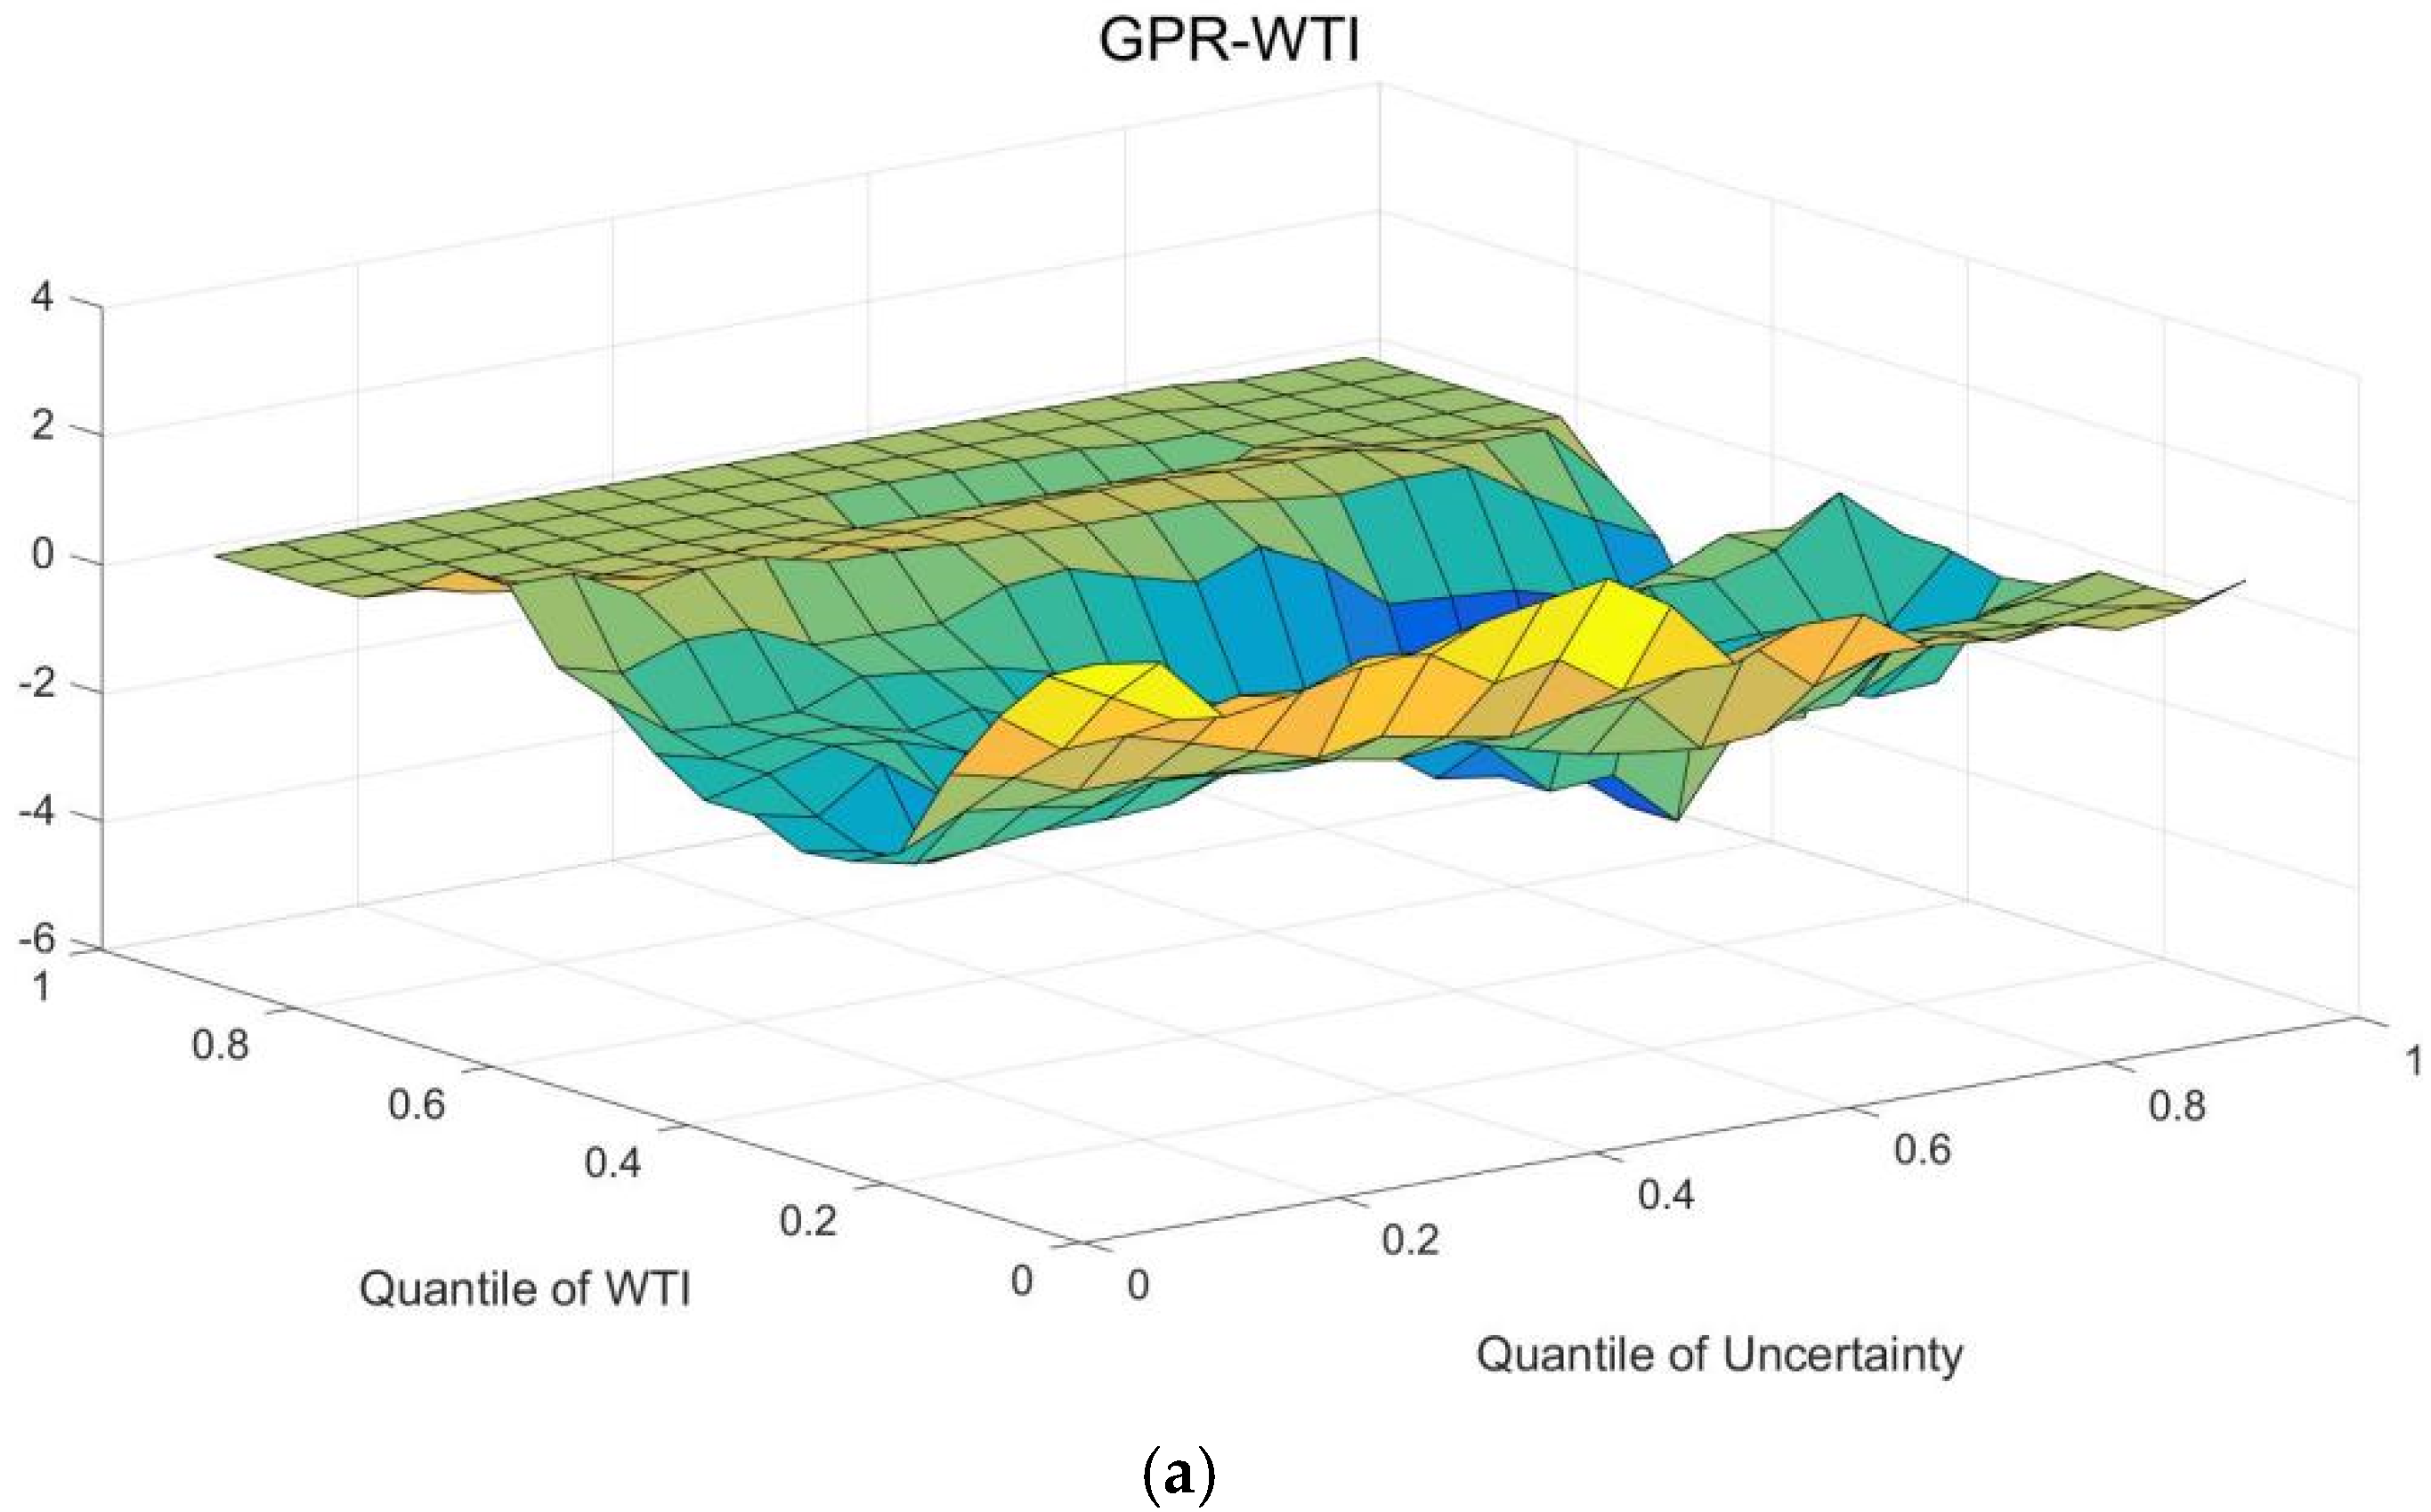
3.3. The Heterogeneous Impact of Geopolitical Risk Uncertainty on Crude Oil Prices

In this sub-section, we focus on the heterogeneity impact of geopolitical risk uncertainty (GPR) on crude oil prices (WTI) on five different time scales from D1 to D5 with the wavelet transform and the QQR methods [54,55]. The specific impact coefficient estimation results are shown in Figure 4. Among them, (a–e) represent the estimated results at the time scale of D1–D5, respectively.
From Figure 4, the following findings are summarized regarding the impact of the GPR on crude oil prices at different time scales. At the time scale of D1, the GPR has a heterogeneous impact on the WTI, mainly in terms of the impact intensity. More specifically, the GPR has a slightly negative effect on the WTI at all quantiles. At the time scale of D2, there are significant differences in the effect of the EPU on the WTI, and this heterogeneity is reflected in both the impact intensity and the direction. There is a weak inhibiting impact of the GPR on the WTI at most quantiles. At the time scale of D3, there are differences in the impact of the GPR on the WTI, which is mainly embodied in the impact intensity. At most quantiles, the GPR has a minor effect on the WTI. At the time scale of D4, the GPR has a heterogeneous effect on the WTI, mainly manifested in the impact intensity and the direction. In most cases, there is a slight inhibitory effect of the GPR on the WTI. At the time scale of D5, the GPR also has a heterogeneous effect on the WTI, mainly reflected in the impact intensity and direction. In most cases, the GPR has a negative effect on the WTI, and the impact intensity reaches the peak when the GPR is at the low quantile (0–0.2) and the WTI is at the mid-low quantile (0–0.4).
By comparing the impact characteristics of the GPR on the WTI on the D1–D5 time scale in Table 4, the following findings are concluded. (1) From the perspective of the impact direction, the GPR has a negative impact on the WTI at most quantiles in D1–D5, and the intensity of this negative impact has apparent heterogeneity on different time scales. (2) Judging from the impact intensity peaks of the GPR on the WTI, the positive and the negative peaks do not appear on the same time scale, but in D4, D1, and D5, respectively. However, the peak of the negative impact intensity reaches −1 throughout the D1–D5 time scales. It can be seen that the geopolitical risk uncertainty has a strong negative impact on crude oil prices in different periods. From the perspective of the quantiles where the peak values occur, they are mainly concentrated in extreme positions such as the high quantile and the low quantile. This indicates that the positive impact of geopolitical risk uncertainty on crude oil prices mainly occurs in the boom period of the crude oil market, whereas the strong negative impact mainly occurs in the depression period of the crude oil market. (3) From the changing form of the influence direction, we can see that the impact direction mainly changes from the negative to the positive, and this transition mainly occurs when the GPR is at the low quantile (0–0.2) of the medium- and long-term, and the WTI is at the middle quantile (0.4–0.6). Therefore, the impacts of geopolitical risk uncertainty on crude oil prices are mainly concentrated in the non-prosperous period of the crude oil market.

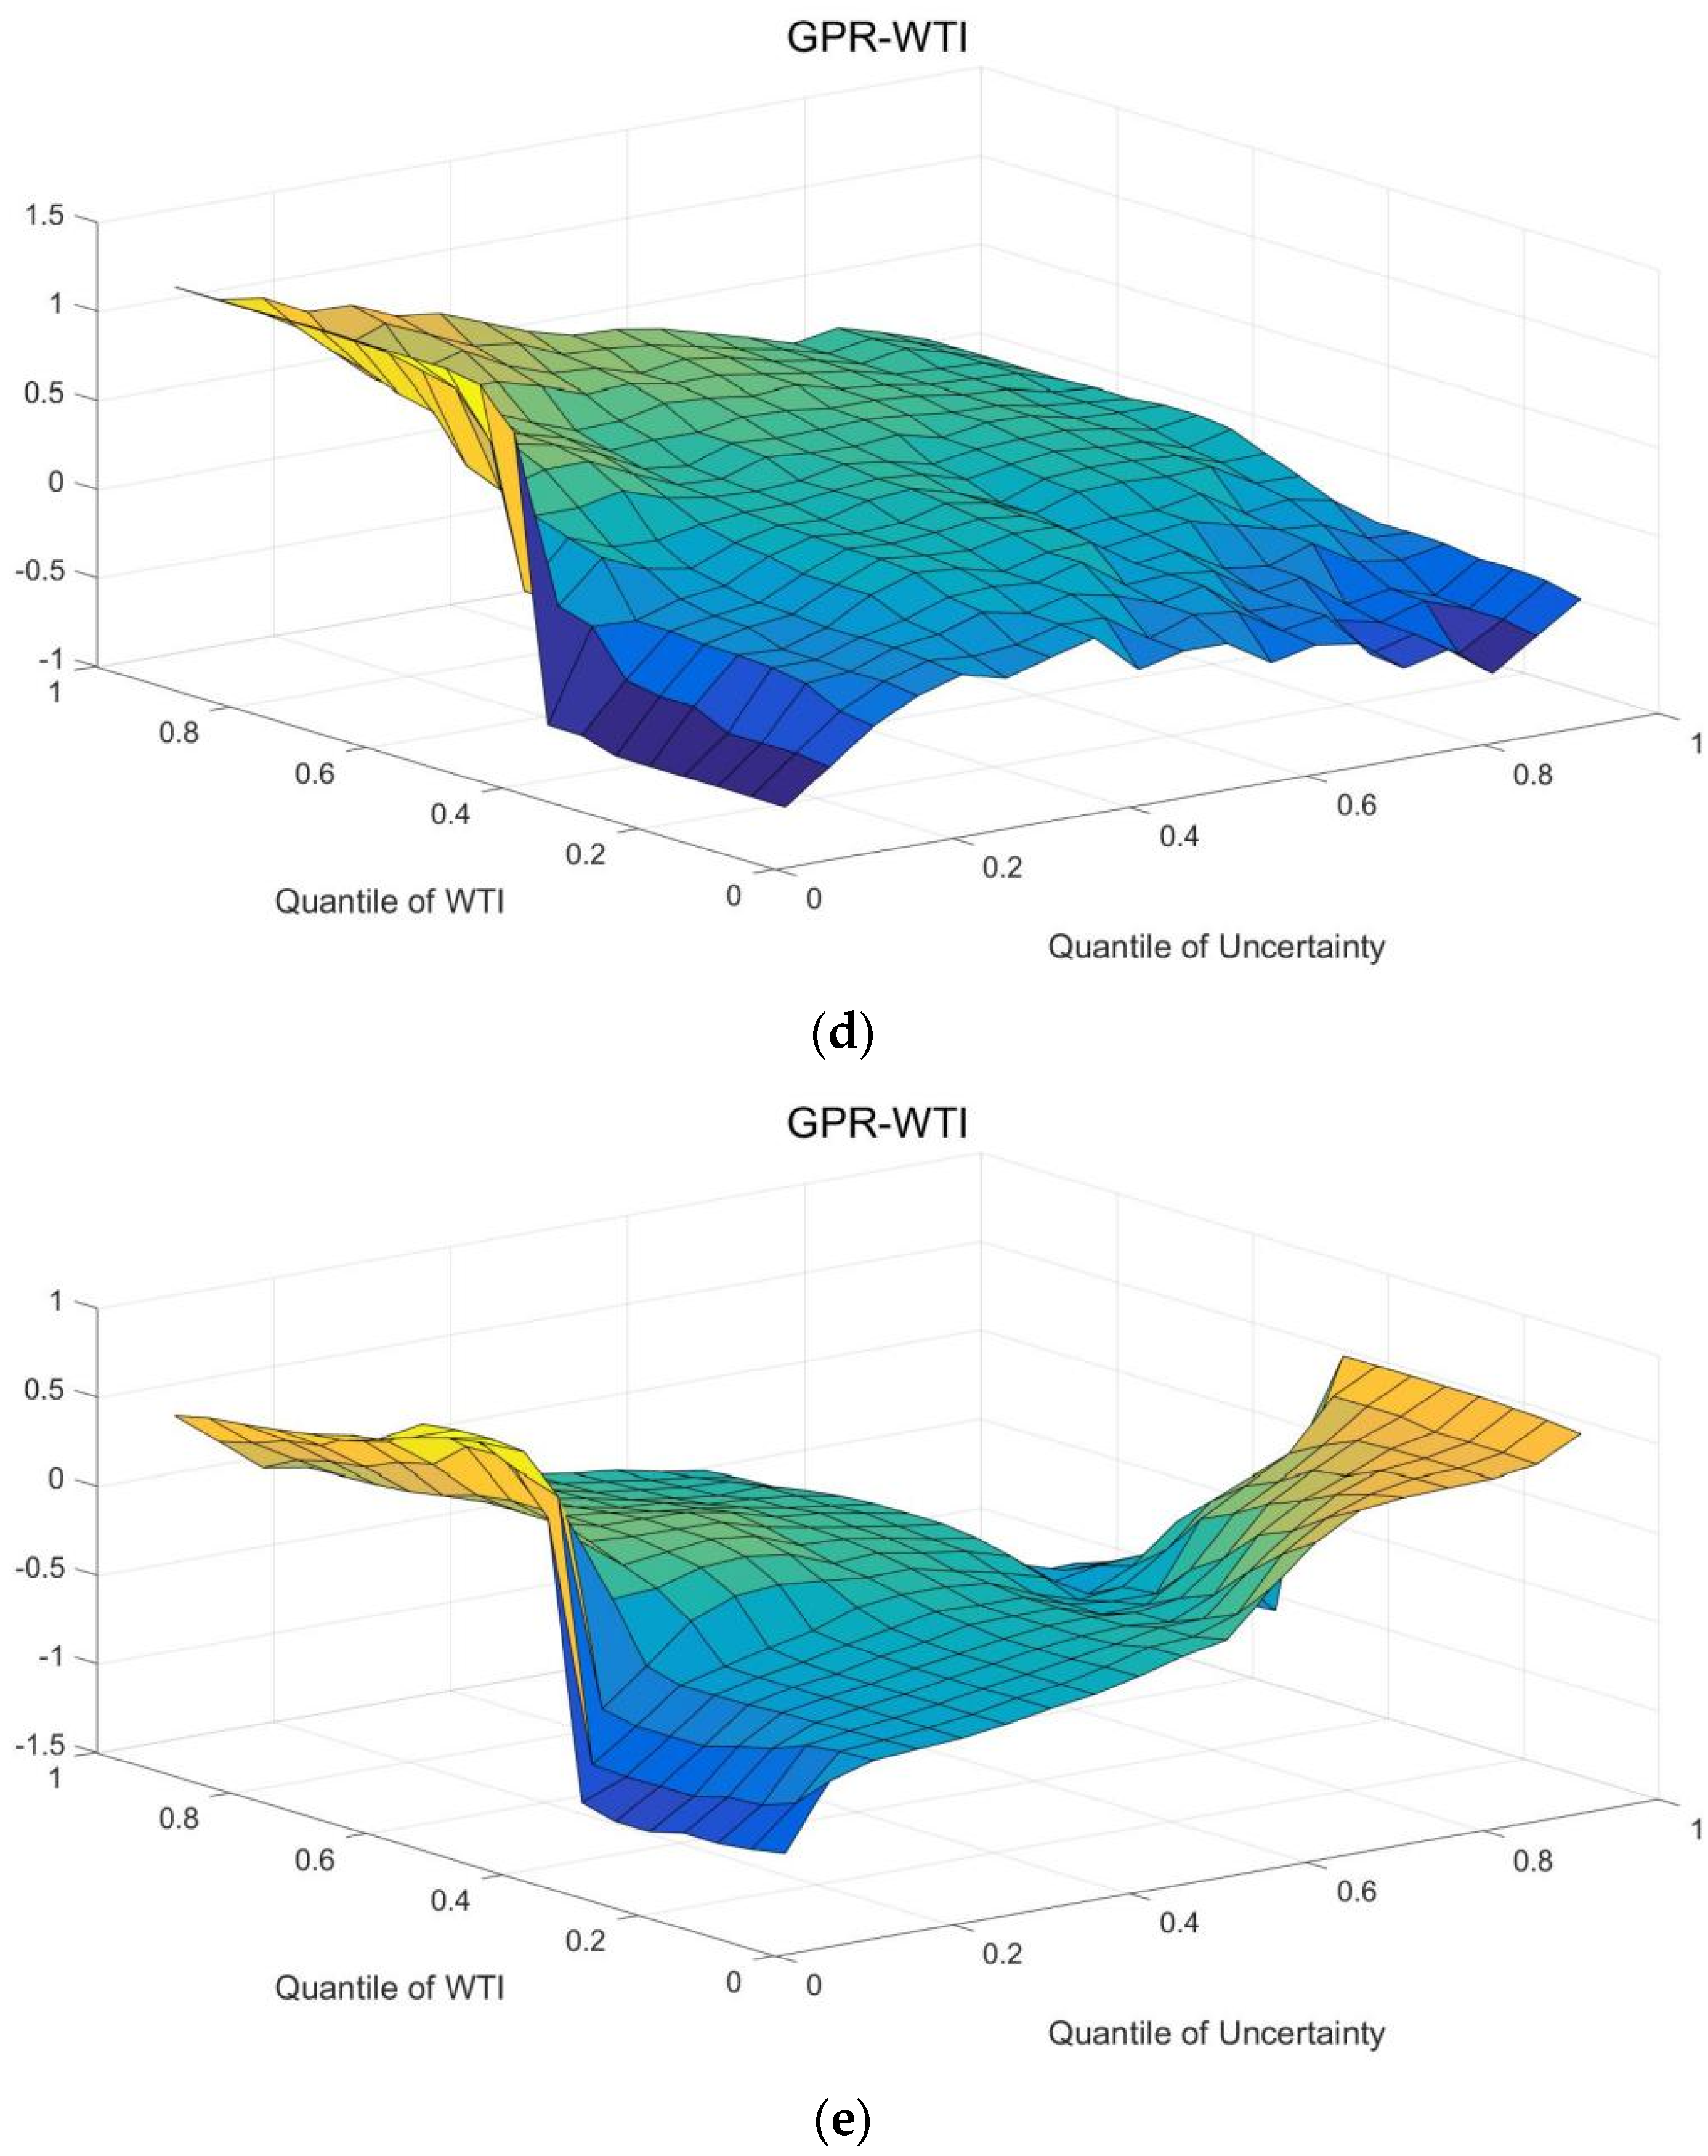
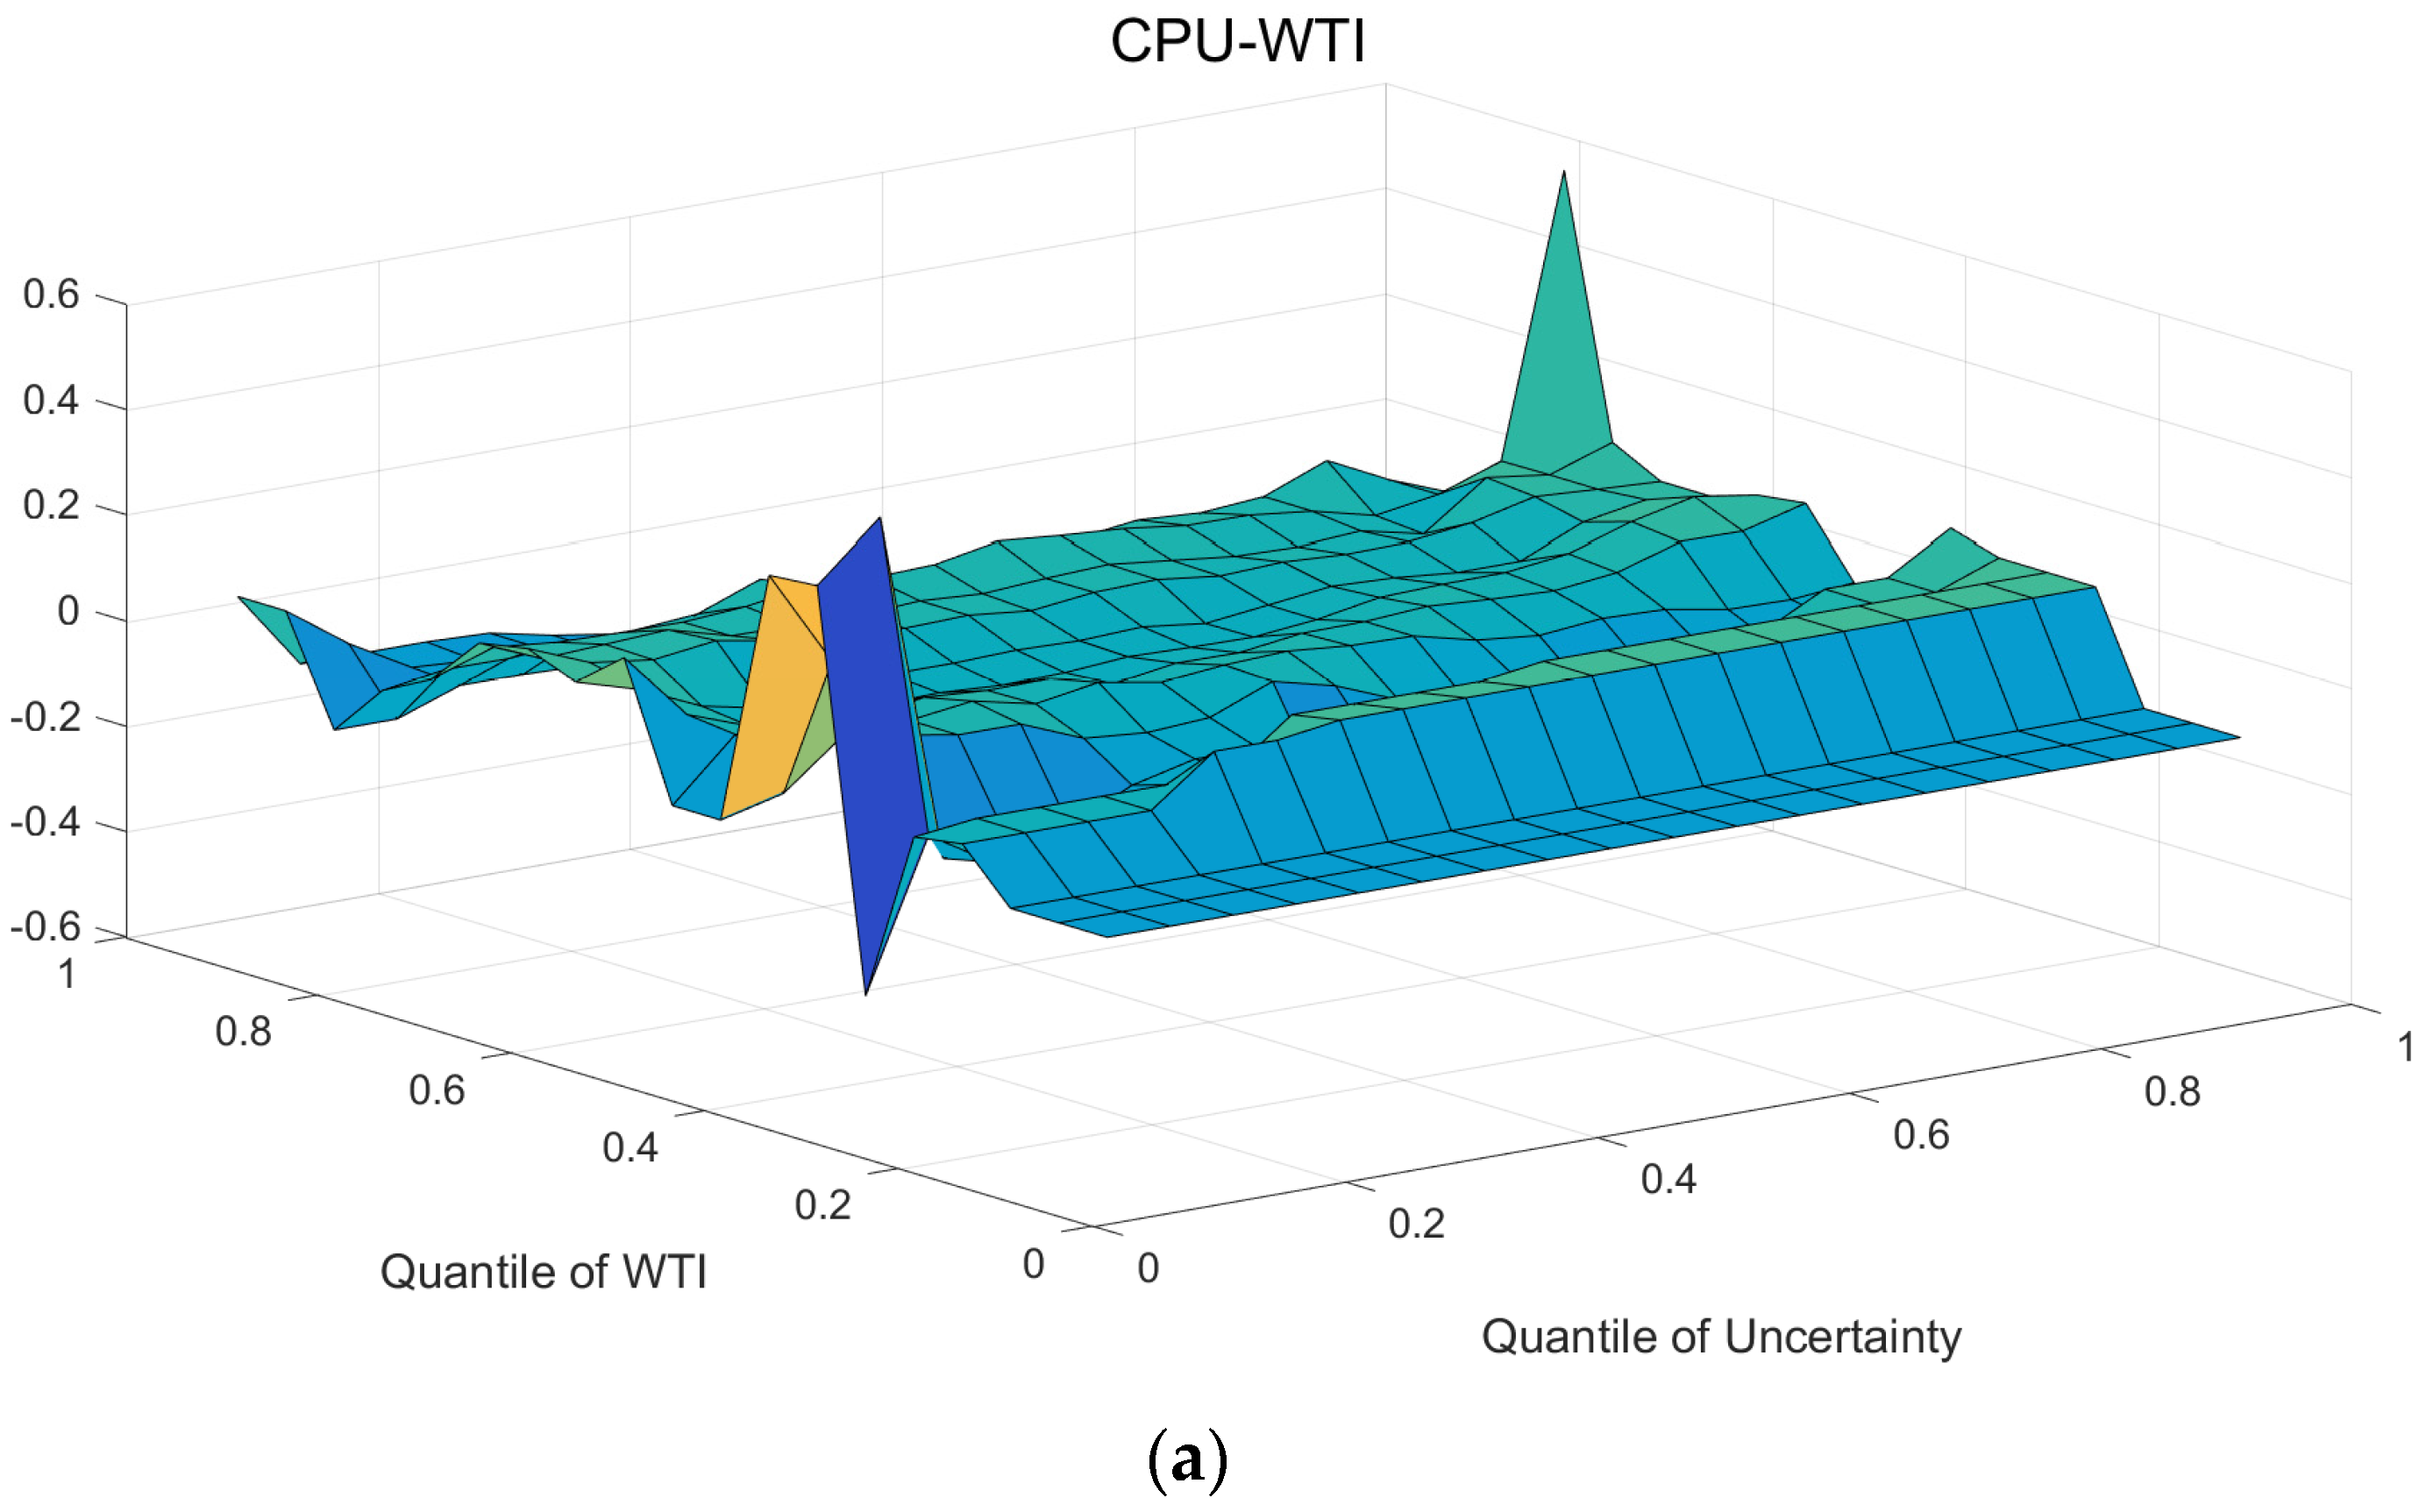
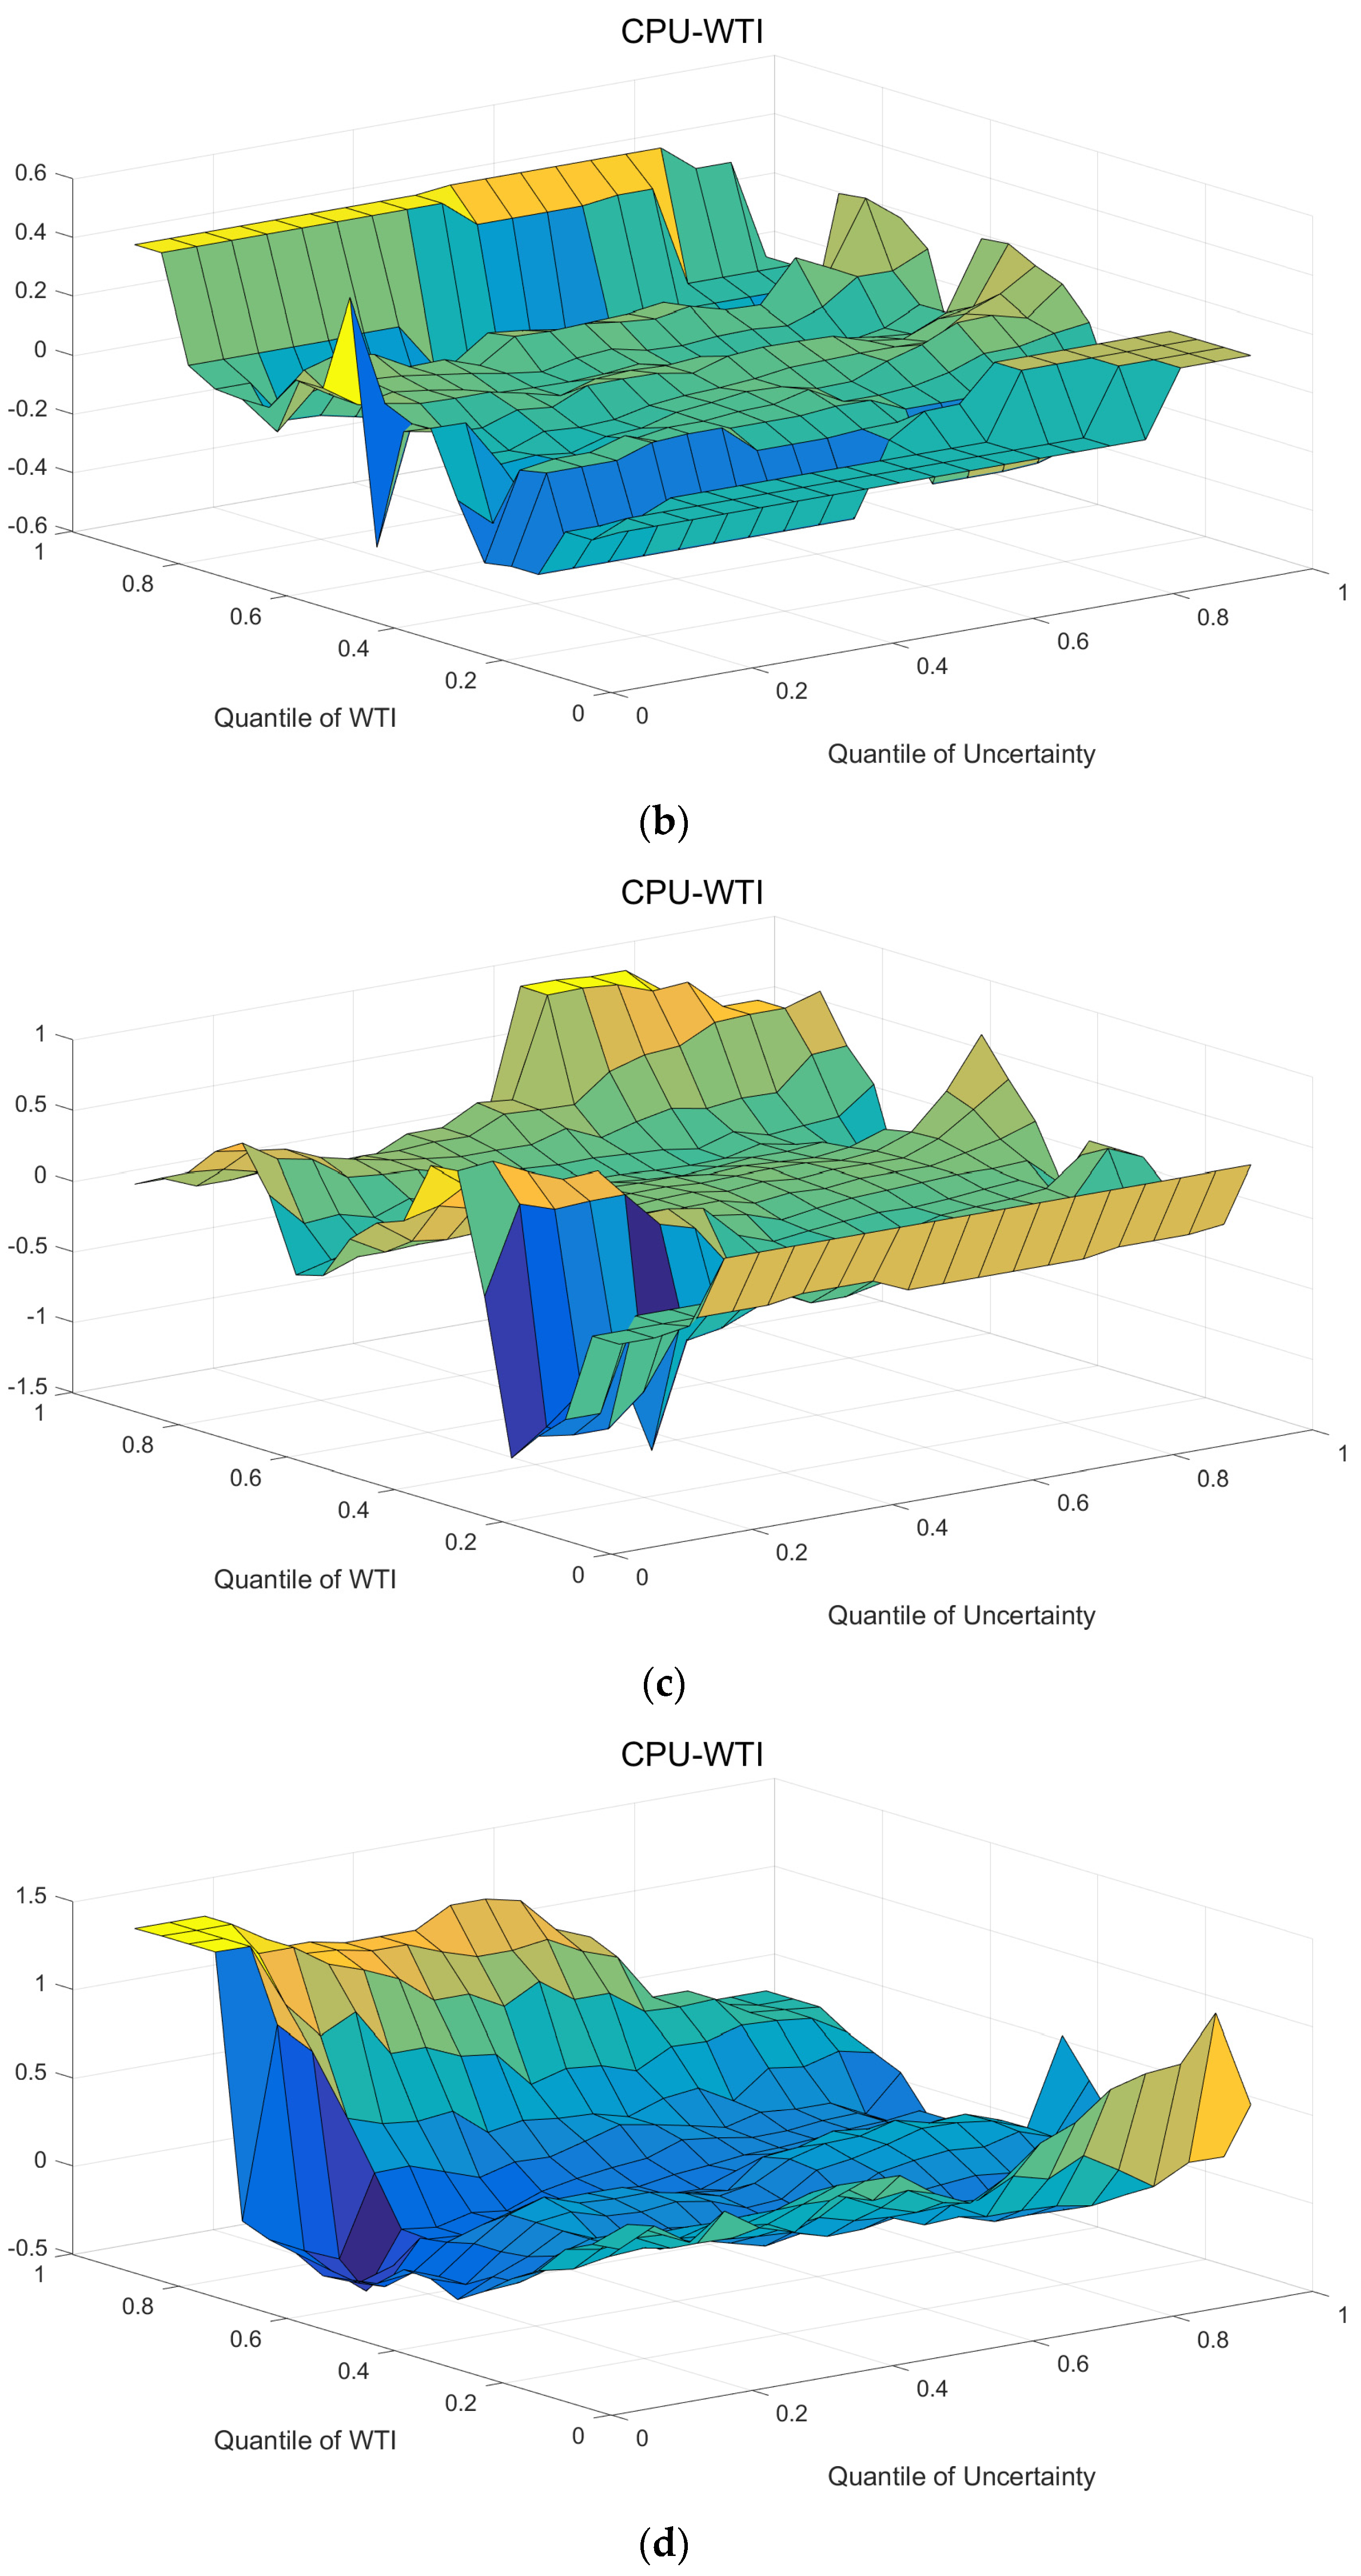
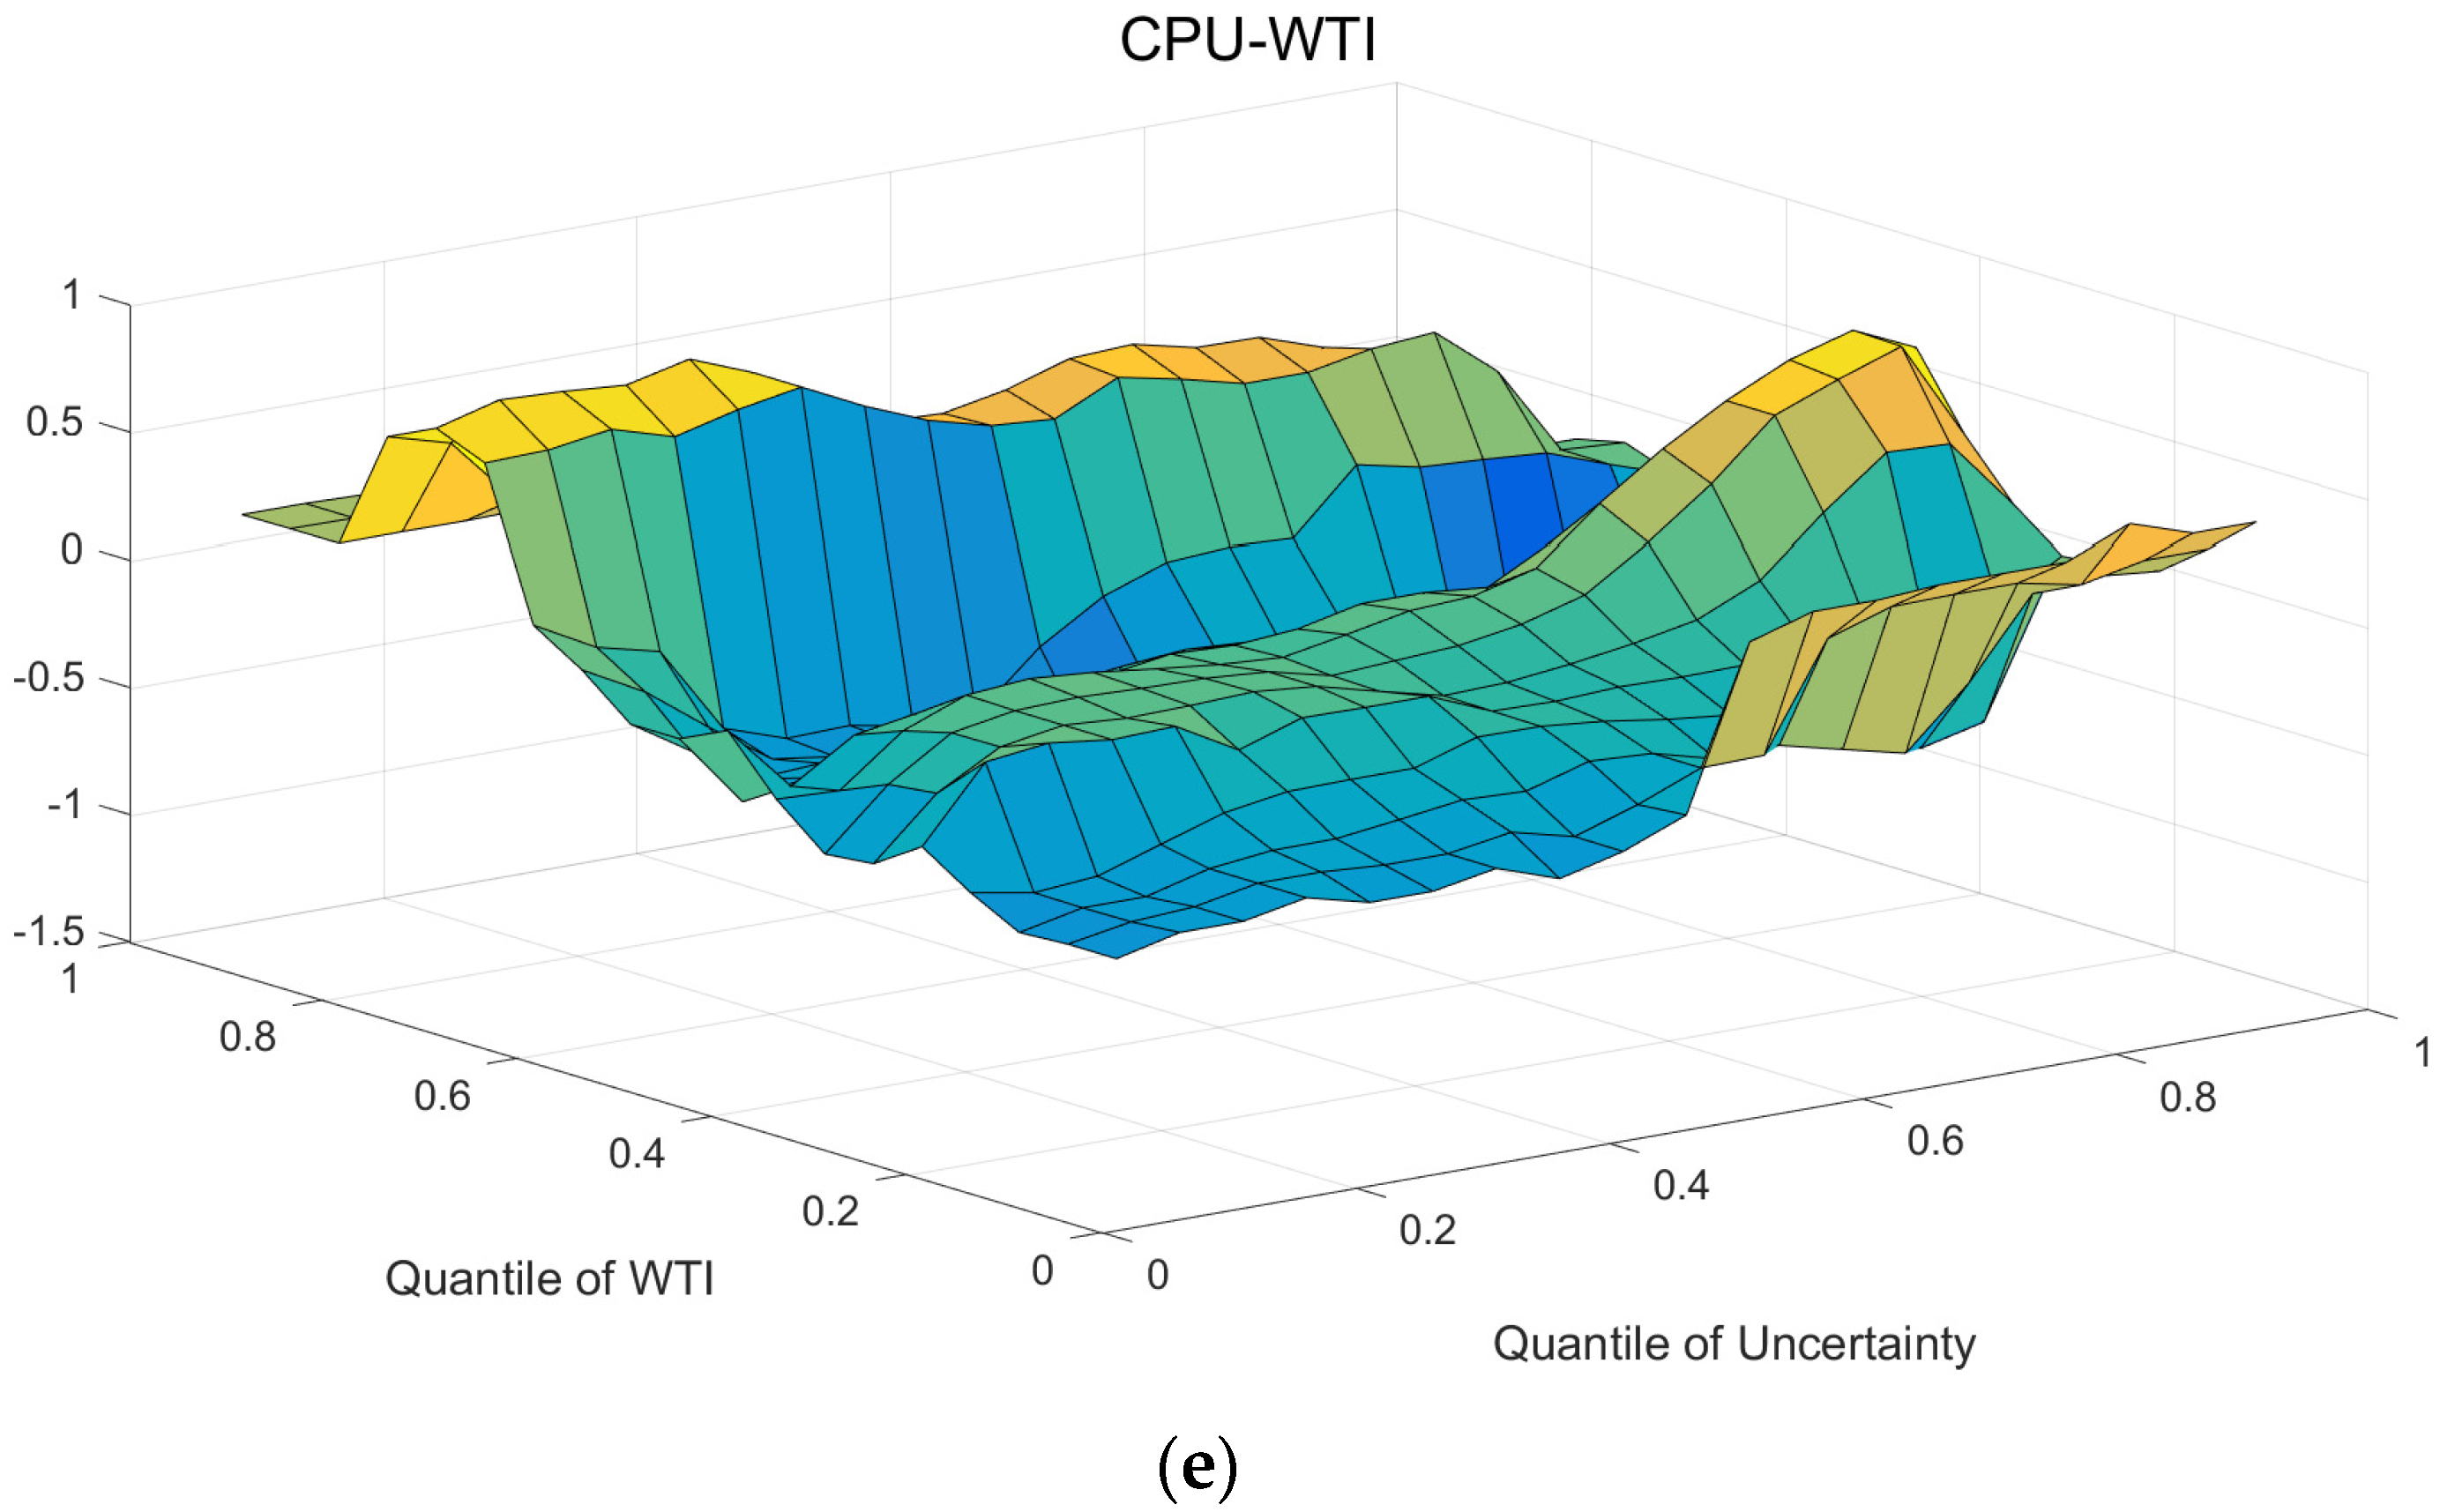
3.4. The Heterogeneous Impact of Climate Policy Uncertainty on Crude Oil Prices

In this sub-section, the heterogeneity impact of Climate Policy Uncertainty (CPU) on crude oil prices (WTI) on five different time scales from D1 to D5 is studied with the wavelet transform and the QQR methods [56,57]. The specific impact coefficient estimation results are shown in Figure 5. Among them, (a–e) represent the estimated results at the time scale of D1–D5, respectively.
From Figure 5, we summarize the following findings regarding the impact of the CPU on crude oil prices at different time scales. At the time scale of D1, the CPU has a heterogeneous impact on the WTI in terms of the impact intensity and the direction. The CPU has a negative impact on the WTI at most quantiles. At the time scale of D2, there are significant differences in the effect of the CPU on the WTI, and this heterogeneity is reflected in both the impact intensity and the direction. There is a negative impact of the CPU on the WTI at most quantiles. At the time scale of D3, there are differences in the impact of the CPU on the WTI, which are mainly embodied in the impact intensity and direction. At most quantiles, the CPU impacts negatively on the WTI. At the time scale of D4, the CPU has a heterogeneous effect on the WTI, mainly manifested in the impact intensity. In most quantiles, the CPU impacts the WTI positively. At the time scale of D5, the CPU also has a heterogeneous effect on the WTI, which is mainly reflected in the impact intensity and direction. In most cases, the CPU has a slightly negative effect on the WTI.
By comparing the impact characteristics of the CPU on the WTI on the D1–D5 time scales in Table 5, we have the following findings. (1) From the perspective of the impact direction, the CPU has negative impacts on the WTI in most quantiles in D1–D5, and the impact intensities are significantly different on different time scales. (2) From the perspective of the peak impact intensity, both positive and negative influence intensity peaks appear on the D4 and D3 time scales, i.e., in the mid-term. This shows that, compared with other periods, the impact of the CPU on the WTI is more significant in the mid-term. It can be seen from the quantiles on the D1–D5 time scales that the positive impact peak mainly occurs when the WTI is at the high quantile (0.8–1), whereas the negative impact peak mainly occurs when the CPU is at the low quantile (0–0.2) and the WTI is at the mid-low quantile (0.2–0.6). The positive impact of climate policy uncertainty on crude oil prices mainly occurs during the boom period of the crude oil market, whereas the negative impact mainly occurs during the period when the climate policy uncertainty is less, and the crude oil market is depressed. (3) The main transformation form of the impact direction is the “M” type transformation trend, which mainly occurs when the CPU is at the low quantile (0–0.2) and the WTI is at the middle quantile (0.4–0.6). It indicates that the impact of climate policy uncertainty on crude oil prices has a relatively complex “M”-shaped fluctuation trend, and this fluctuation mainly occurs when climate policy uncertainty is small, and the crude oil market is relatively stable.

4. Discussion

In the previous section, this paper describes the overall impact of various uncertainties on crude oil prices and the heterogeneity on different time scales. In this section, this paper first discusses the findings of the previous section further, and then, by comparing the parameter estimation results of the quantile regression (Q.R.) method and the quantile-on-quantile regression (QQR) method, it shows that the conclusions of this paper are robust. Finally, the conclusions are summarized, and relevant policy implications are given.

4.1. Comparison and Discussion on the Overall Impacts of Three Uncertainties on Crude Oil Prices

According to the description in Chapter 3.1, the overall impact of the three uncertainties on crude oil prices is heterogeneous at different quantiles, which is mainly reflected in three aspects: impact intensity, impact direction, and impact fluctuation [26,58]. For further comparison, this paper extracts the key characteristics of the impacts and summarizes them in Table 6.
By comparing the impact characteristics of the three uncertainty indexes on crude oil prices in Table 6, the following conclusions can be drawn [59,60]. First, from the impact direction, the three types of uncertainties negatively impact crude oil prices at most quantiles. Secondly, from the perspective of the impact intensity, there are significant differences that are reflected in the impact peaks. Finally, for the impact fluctuation, heterogeneity still exists. Specifically, the transformation form of the impact of economic policy uncertainty on the crude oil price is more complex; the influence of climate policy uncertainty on crude oil price changes from the positive to the negative; and there is no obvious change in the overall impact direction of geopolitical risk uncertainty on crude oil prices. The impact direction of the EPU is similar to that of the CPU, indicating that the impact of economic policy uncertainty on the volatility of crude oil price is more frequent, whereas the impact of climate policy uncertainty on the volatility of crude oil price is more severe, and these fluctuations mainly occur in the relatively depressed crude oil market.
In the above-described situation, the three types of uncertainties have negative impacts on crude oil prices in most cases, which is consistent with the research of some scholars [11,30,51]. The main reasons are as follows. Generally speaking, the three types of uncertainties have relatively strong negative impacts on crude oil prices when the crude oil market is sluggish. Due to the commodity and financial attributes of crude oil, when the crude oil market is in a depressed state, the liquidity of commodities in the market is weakened, and both the crude oil supply and demand sides and investors will be affected by panic, so the subtle changes of the three uncertainties lead to the overreaction of the crude oil market, resulting in a sharp increase in the impact of the three uncertainties on the volatility of crude oil prices, which is more likely to cause a negative impact. The complexity of the impact of economic policy uncertainty on crude oil prices may be due to the fact that economic policies include monetary policies and fiscal policies in different situations, which requires a specific and separate analysis of the impact of monetary policies or fiscal policies or the combination of the two policies on crude oil prices. The impacts of climate policy uncertainty and geopolitical risk uncertainty on crude oil prices are relatively stable. On the one hand, due to the increasingly prominent climate problem in recent years, people have paid more attention to climate and environmental issues. It is challenging to maintain crude oil price stability under extreme climate conditions. On the other hand, the uncertainty of geopolitical risk is more reflected in the changes in the international political situation and the outbreak of extreme events such as war. These events will affect the supply and demand side of crude oil, and make the crude oil price unstable. To sum up, from the perspective of statistics and the economy, it is true that the three uncertainties have a negative impact on crude oil prices in most cases.

4.2. Comparison and Discussion on the Impact Intensity of Three Uncertainties on Crude Oil Price under Different Time Scales

In order to further analyze and compare the impact intensity differences of the three uncertainties on crude oil prices under different time scales, this sub-section focuses on extracting the impact intensity peaks and quantile positions, and summarizes them in Table 7.
By comparing the impact intensity characteristics of the three uncertainties on the crude oil price under the D1–D5 time scale in Table 7, this paper has the following findings. First, the positive and significant impacts of the three uncertainties on the crude oil price are mainly concentrated in the boom period of the crude oil market, whereas the negative impacts are mainly concentrated in the depression period of the crude oil market. Secondly, the impacts of the three types of uncertainties on crude oil prices vary significantly on different time scales. Specifically, economic policy uncertainty has a more significant impact on crude oil prices in the long-term; climate policy uncertainty has a more significant impact on crude oil prices in the medium-term; and geopolitical risk uncertainty has a significant impact on crude oil prices in the long-, medium-, and short-term.
Regarding the period in which the three types of uncertainties affect crude oil prices, some scholars also found that the positive effects of uncertainties on crude oil prices are mainly concentrated in the prosperous period of the crude oil market, whereas the negative effects are mainly concentrated in the depression period of the crude oil market [14,22,51,61]. This can be analyzed and explained from the following two aspects. On the one hand, when the crude oil market is in a well-developed and prosperous period, the market is in a highly active state. At this time, the positive impacts of these three uncertainties on investors and crude oil suppliers will be far greater than the negative impacts. From the perspective of the commodity attribute of crude oil, the crude oil supplier will change the scale of oil production and sales, thereby obtaining more profits. From the perspective of the financial attribute of crude oil, investors will increase their risk appetite for crude oil as a financial asset, thereby increasing the price of crude oil. When the crude oil market is in a downturn, the negative impacts of the three uncertainties on crude oil prices are obvious, similar to the analysis in Section 4.1. On the other hand, from the perspective of the impact periods, the timeliness of the impact is also somewhat different. In terms of the economic policy uncertainty’s impact on crude oil price, the promulgation and specific implementation measures of economic policies have a certain time lag, and their impact on crude oil prices may not be so significant in the short- and medium-term, which is similar to the research of Sun et al. [14]. For the impact of climate policy uncertainty, climate policymakers need to pay attention to climate change and environmental changes, which will take some time to be reflected in the crude oil market, so they may have a significant impact on crude oil prices only in the medium-term. For the geopolitical risk uncertainty, the impact of such uncertainty on the crude oil market is reflected in the long-, medium-, and short-term. Some geopolitical events, such as terrorist attacks, tend to break out in a short period of time and have a short duration, which will cause strong short-term fluctuations in crude oil prices. Political struggles between countries or between countries and oil organizations are often protracted, and it is very likely that it will have a more significant impact on crude oil prices in the medium- and long-term. In summary, there is heterogeneity in the impact intensities of the three uncertainties on crude oil prices at different time scales.

4.3. Comparison and Discussion on the Impact Direction and Fluctuation of Three Uncertainties on Crude Oil Price on Different Time Scales

In this sub-section, we will continue to analyze and compare the impact direction and fluctuation of the three uncertainties on crude oil prices under different time scales. We focus on extracting the influence direction changes and quantile positions, and summarize them in Table 8.
By comparing the impact direction and fluctuation features of three types of uncertainties on crude oil prices on the D1–D5 time scales through Figure 3, Figure 4 and Figure 5 and Table 8, this paper has the following findings. First, the impact direction of economic policy uncertainty and geopolitical risk uncertainty on crude oil prices at different time scales mainly changes from the negative to the positive, occurring during the depression period of the crude oil market, whereas the impact direction of climate policy uncertainty on crude oil prices is mainly in the “M” shape, concentrating during normal oil market operations. Second, from the perspective of quantiles, there are obvious differences in the impact direction. Economic policy uncertainty has a positive impact on crude oil prices on different time scales, whereas geopolitical risk uncertainty and climate policy uncertainty mainly have a negative impact. Third, there are obvious differences in impact fluctuation changes on different time scales. This difference is mainly reflected in the impact of economic policy uncertainty on crude oil prices, which mainly occurs during the depression period of the crude oil market, whereas the impact fluctuation changes of geopolitical uncertainty and climate policy uncertainty on crude oil prices and fluctuations mainly occur during the normal operation of the crude oil market.
The above conclusions are consistent with the findings of some scholars [16,18,42,62,63]. First, from the perspective of direction change and the crude oil market, when the crude oil market is in a depression period, the crude oil market is unstable, and the uncertainty of crude oil prices is prone to sharp changes, especially when the uncertainty is at an extreme level. The change in the impact direction of the climate policy uncertainty on crude oil prices may be related to the strong volatility of climate policy uncertainty, which is reflected in descriptive statistics. Second, economic policy uncertainty mainly has a positive impact on crude oil prices at different time scales, which is different from the views of some scholars [2,13]. This may be because the data and methods selected in this paper can more comprehensively and deeply explore the relationship between economic policy uncertainty and crude oil prices. Geopolitical risk uncertainty and climate policy uncertainty negatively impact crude oil prices at different time scales. This may be because geopolitical risks and climate change will affect the supply and demand structure of crude oil, thereby affecting the price of crude oil. Third, the fluctuation changes of the impact of the three uncertainties on crude oil prices mainly occur in the depression period and normal period of the crude oil market, which may be due to the following two reasons. On the one hand, when the crude oil market is relatively sluggish, economic policy uncertainty is more likely to affect investors’ strategies and crude oil supply and demand sides by affecting market sentiment, thereby affecting crude oil prices. On the other hand, geopolitical risk uncertainty and climate policy uncertainty will also impact the political situation and crude oil production and sales when the crude oil market is operating normally, thereby affecting crude oil prices. To sum up, there are significant differences in the direction and fluctuation of the impact of the three uncertainties on crude oil prices at different time scales [64].

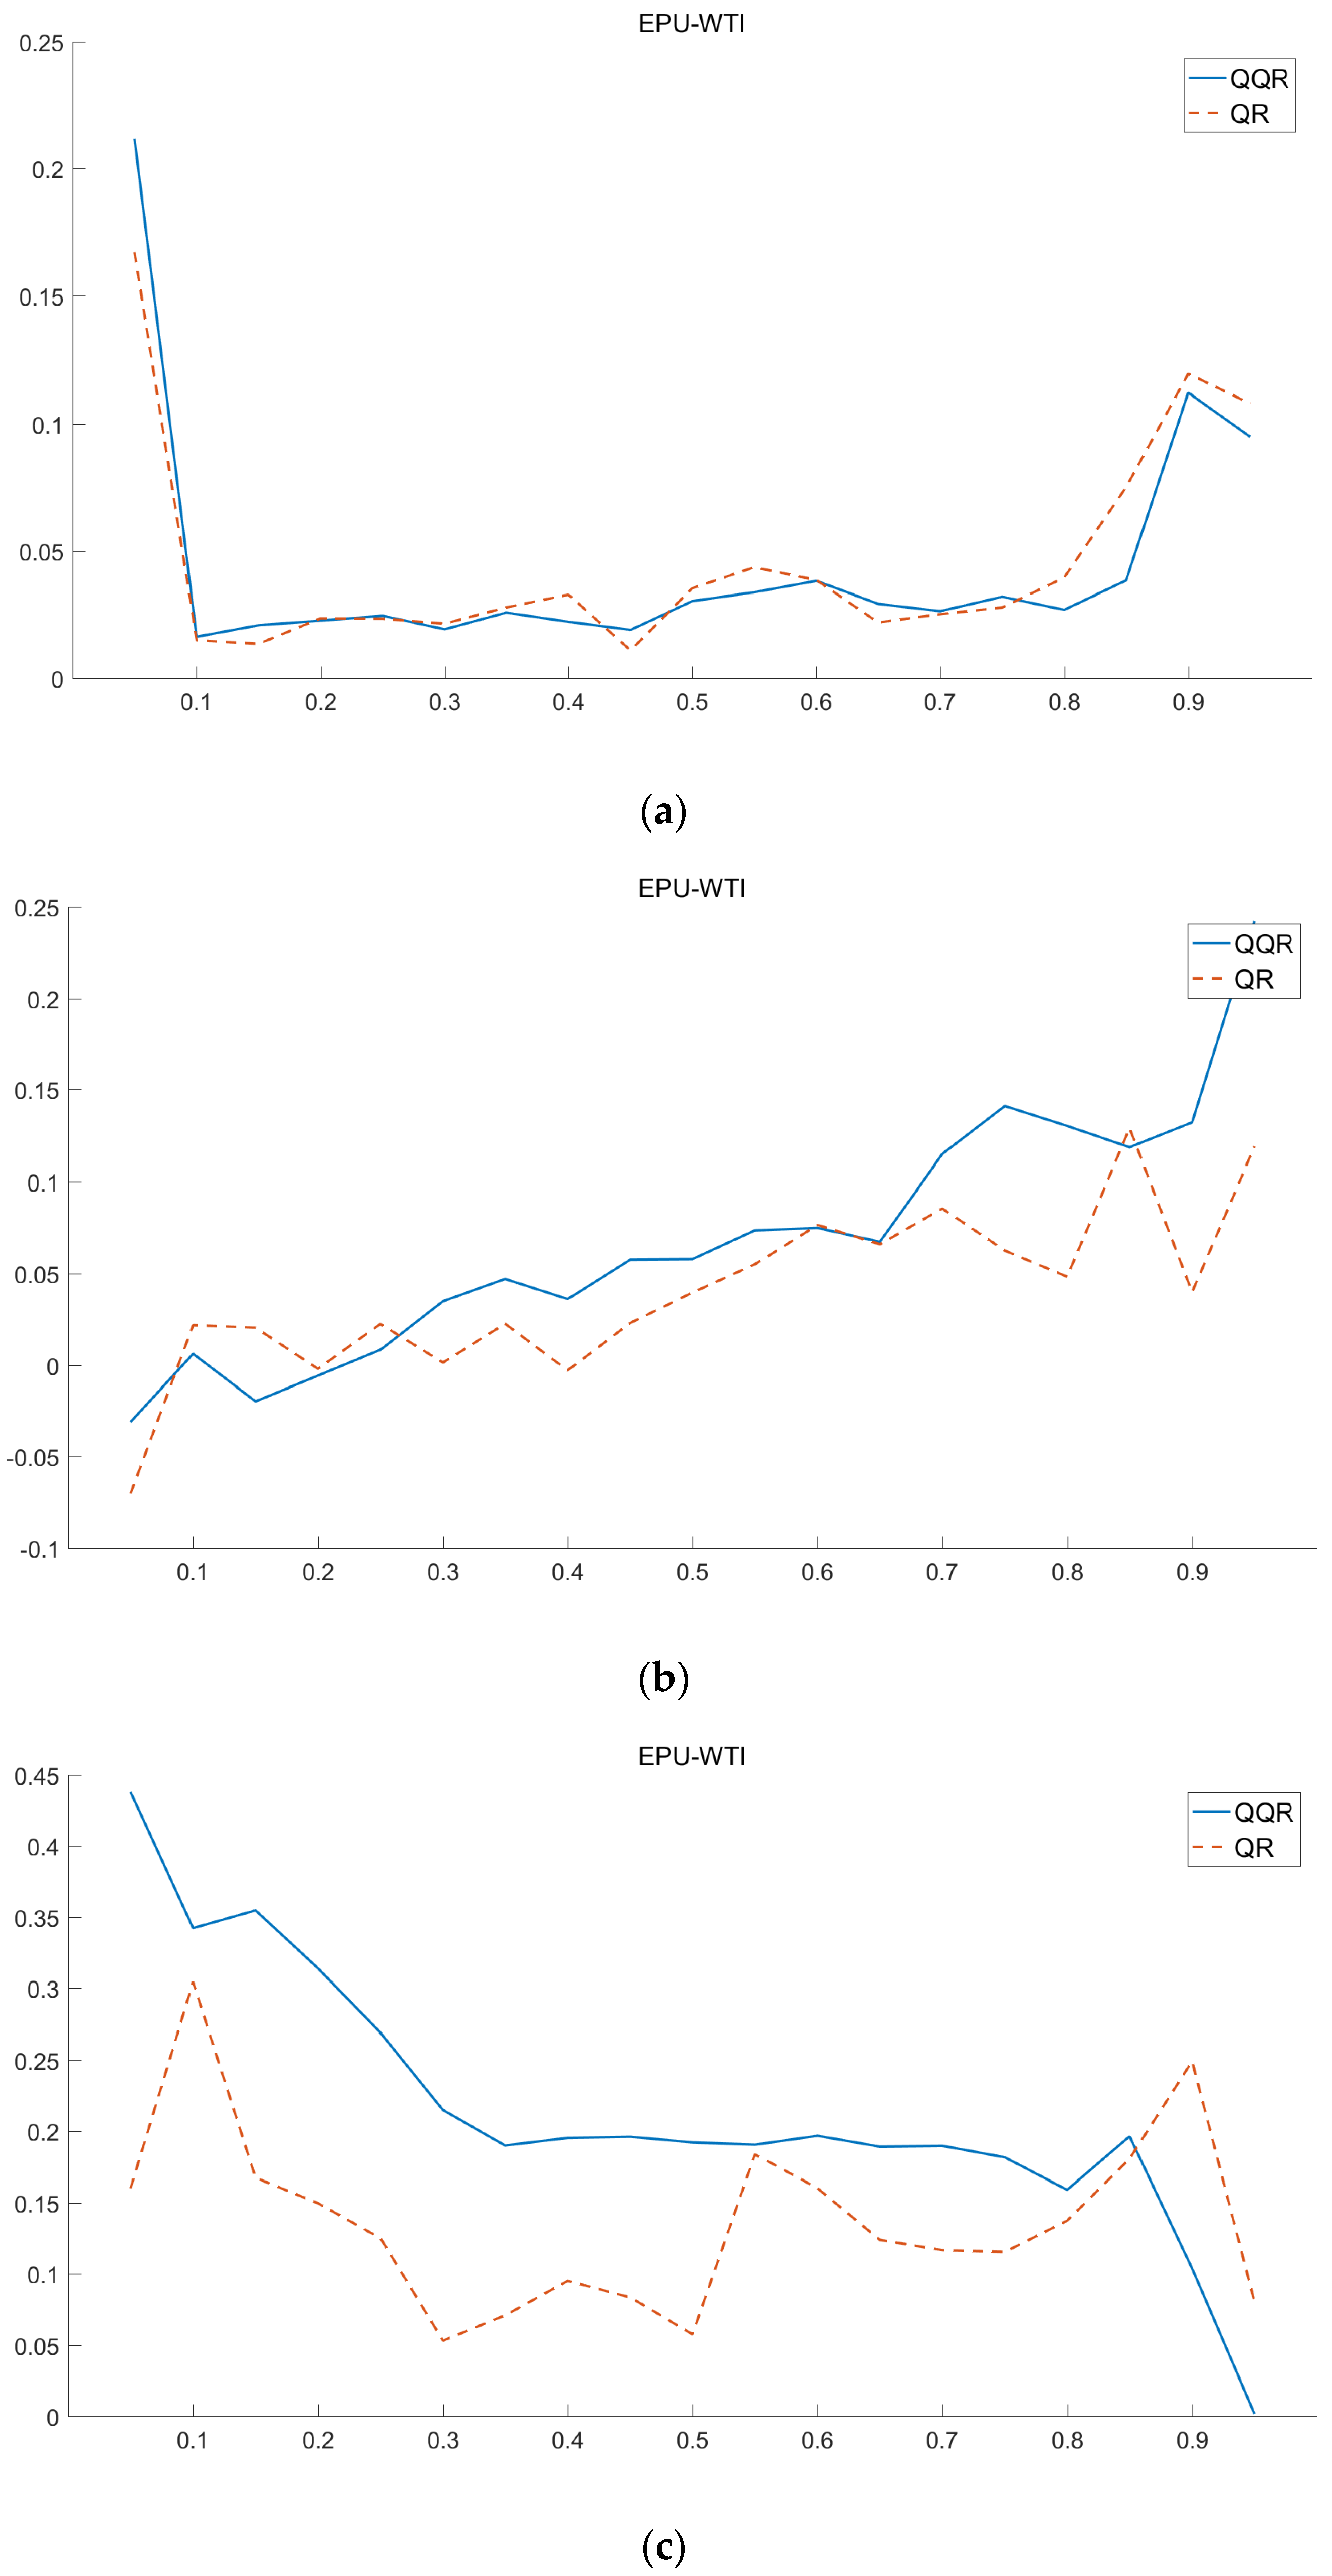
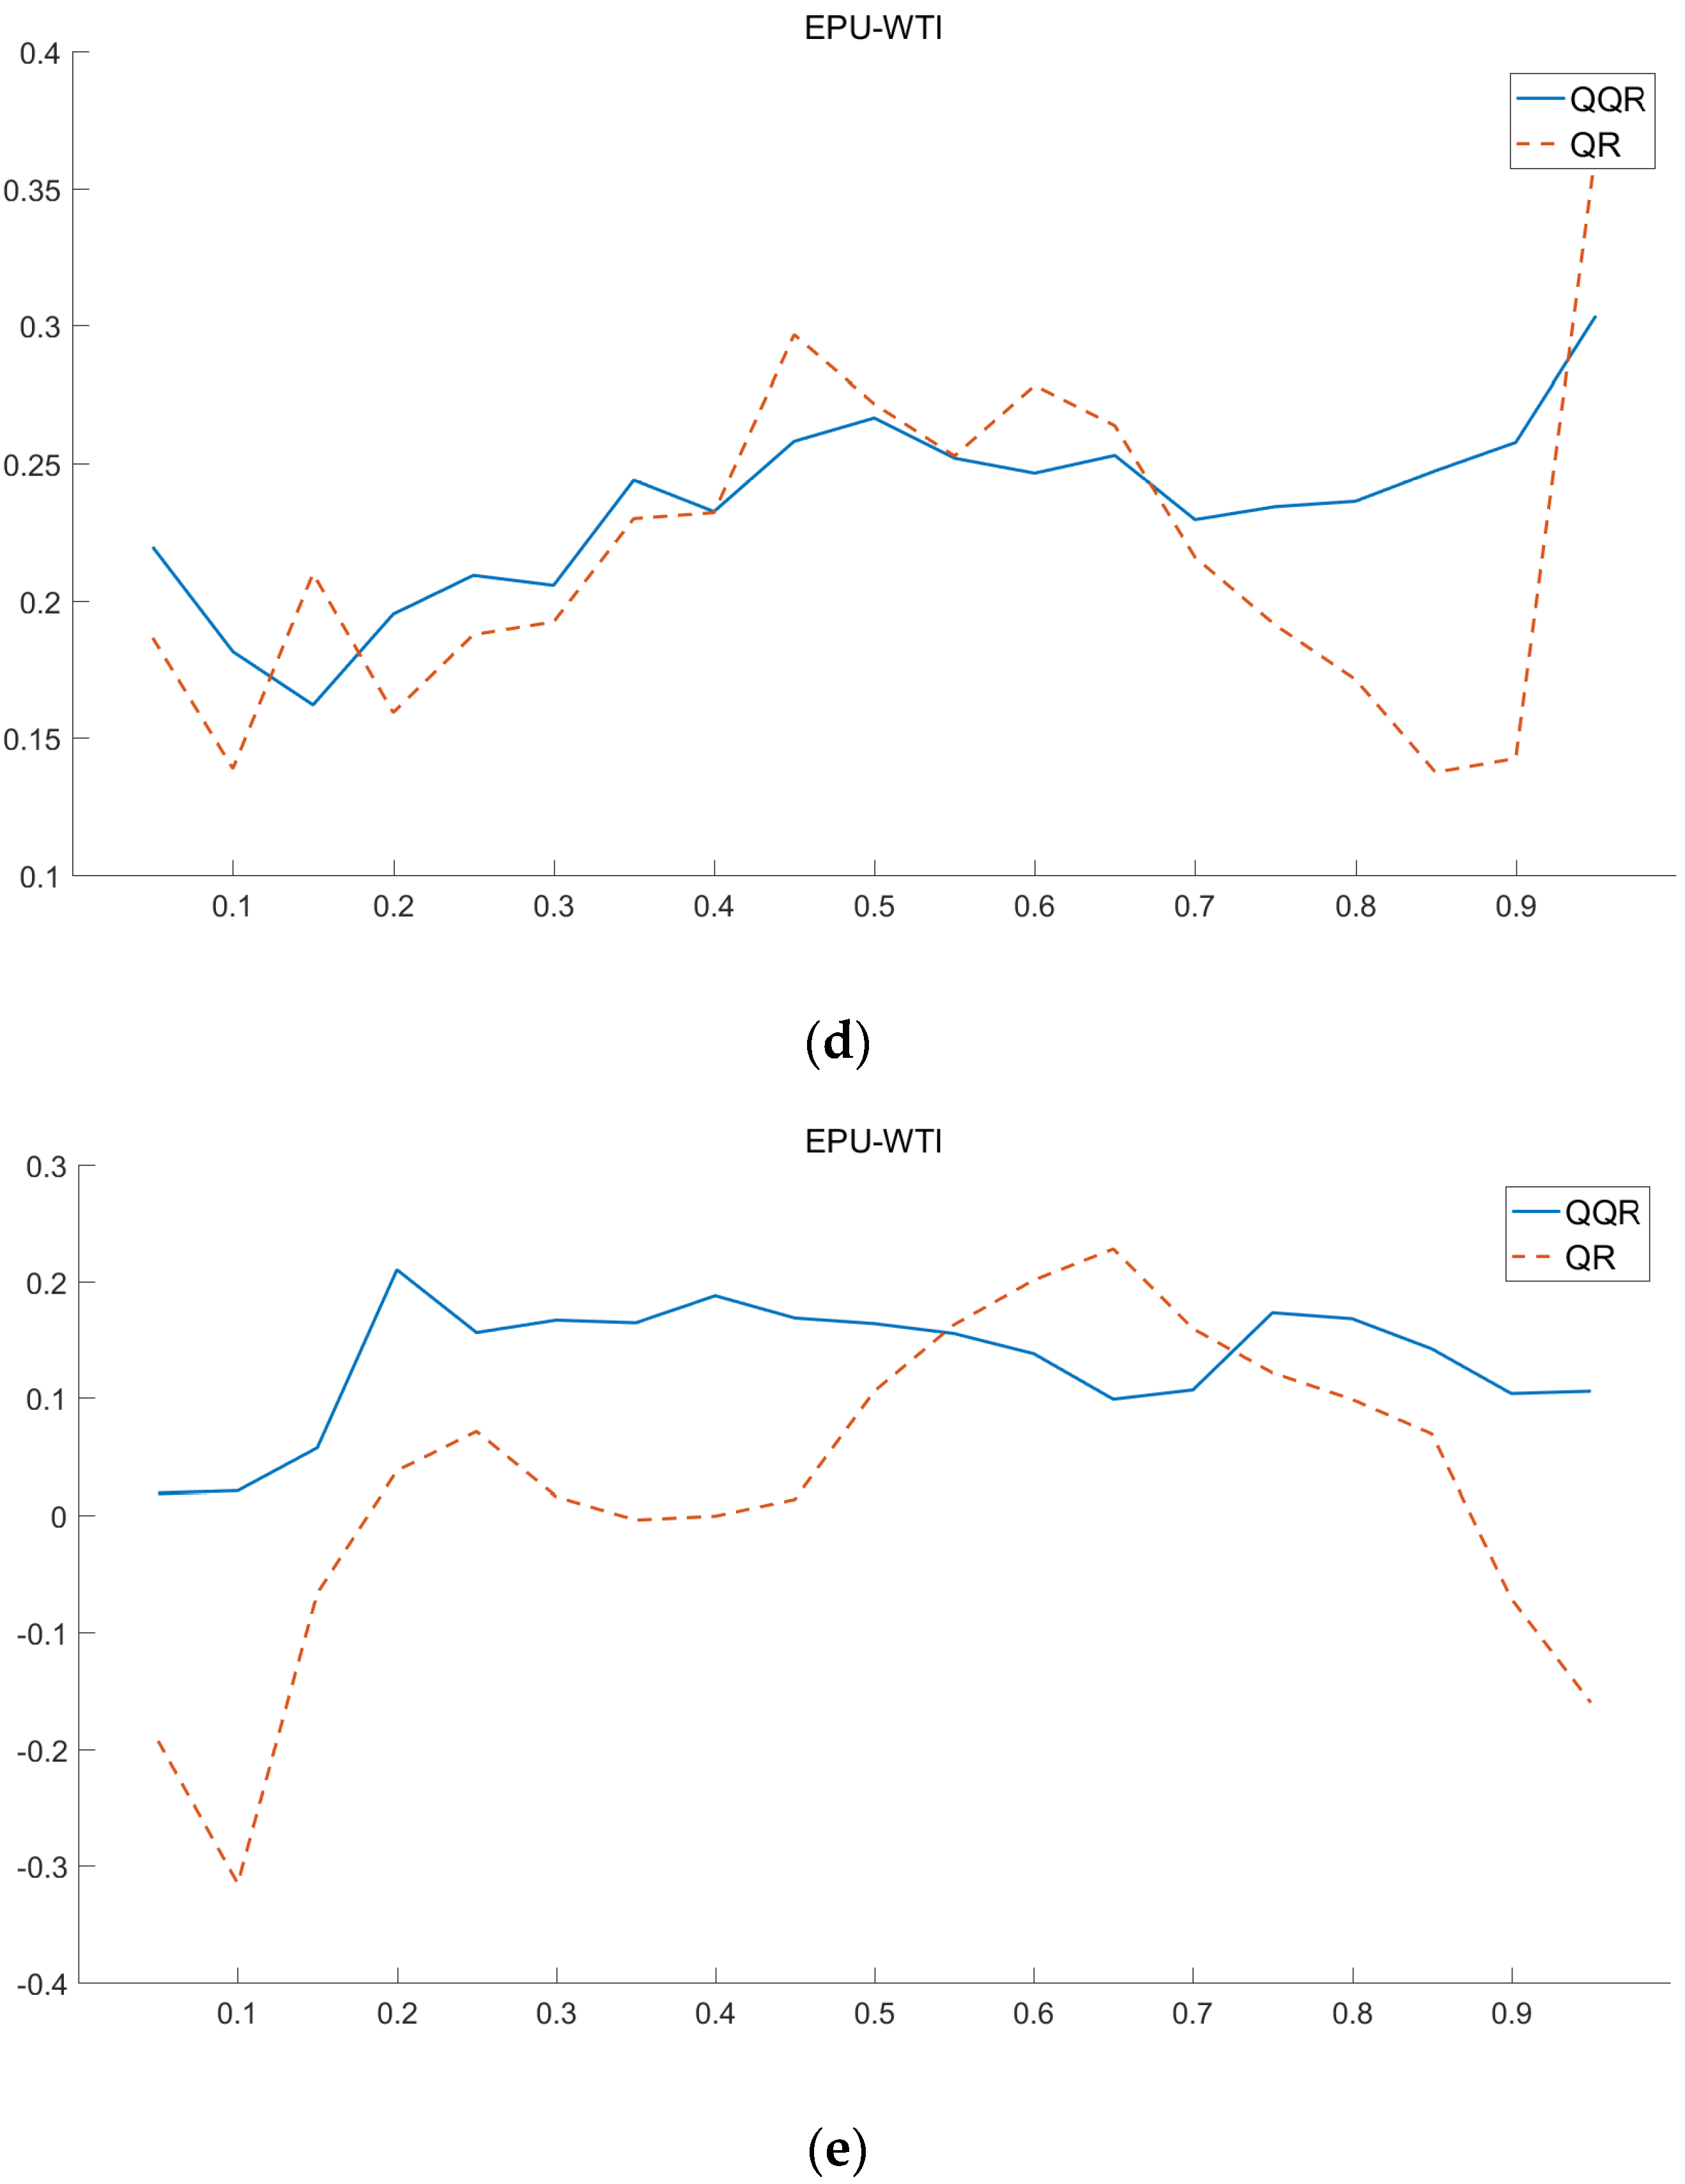
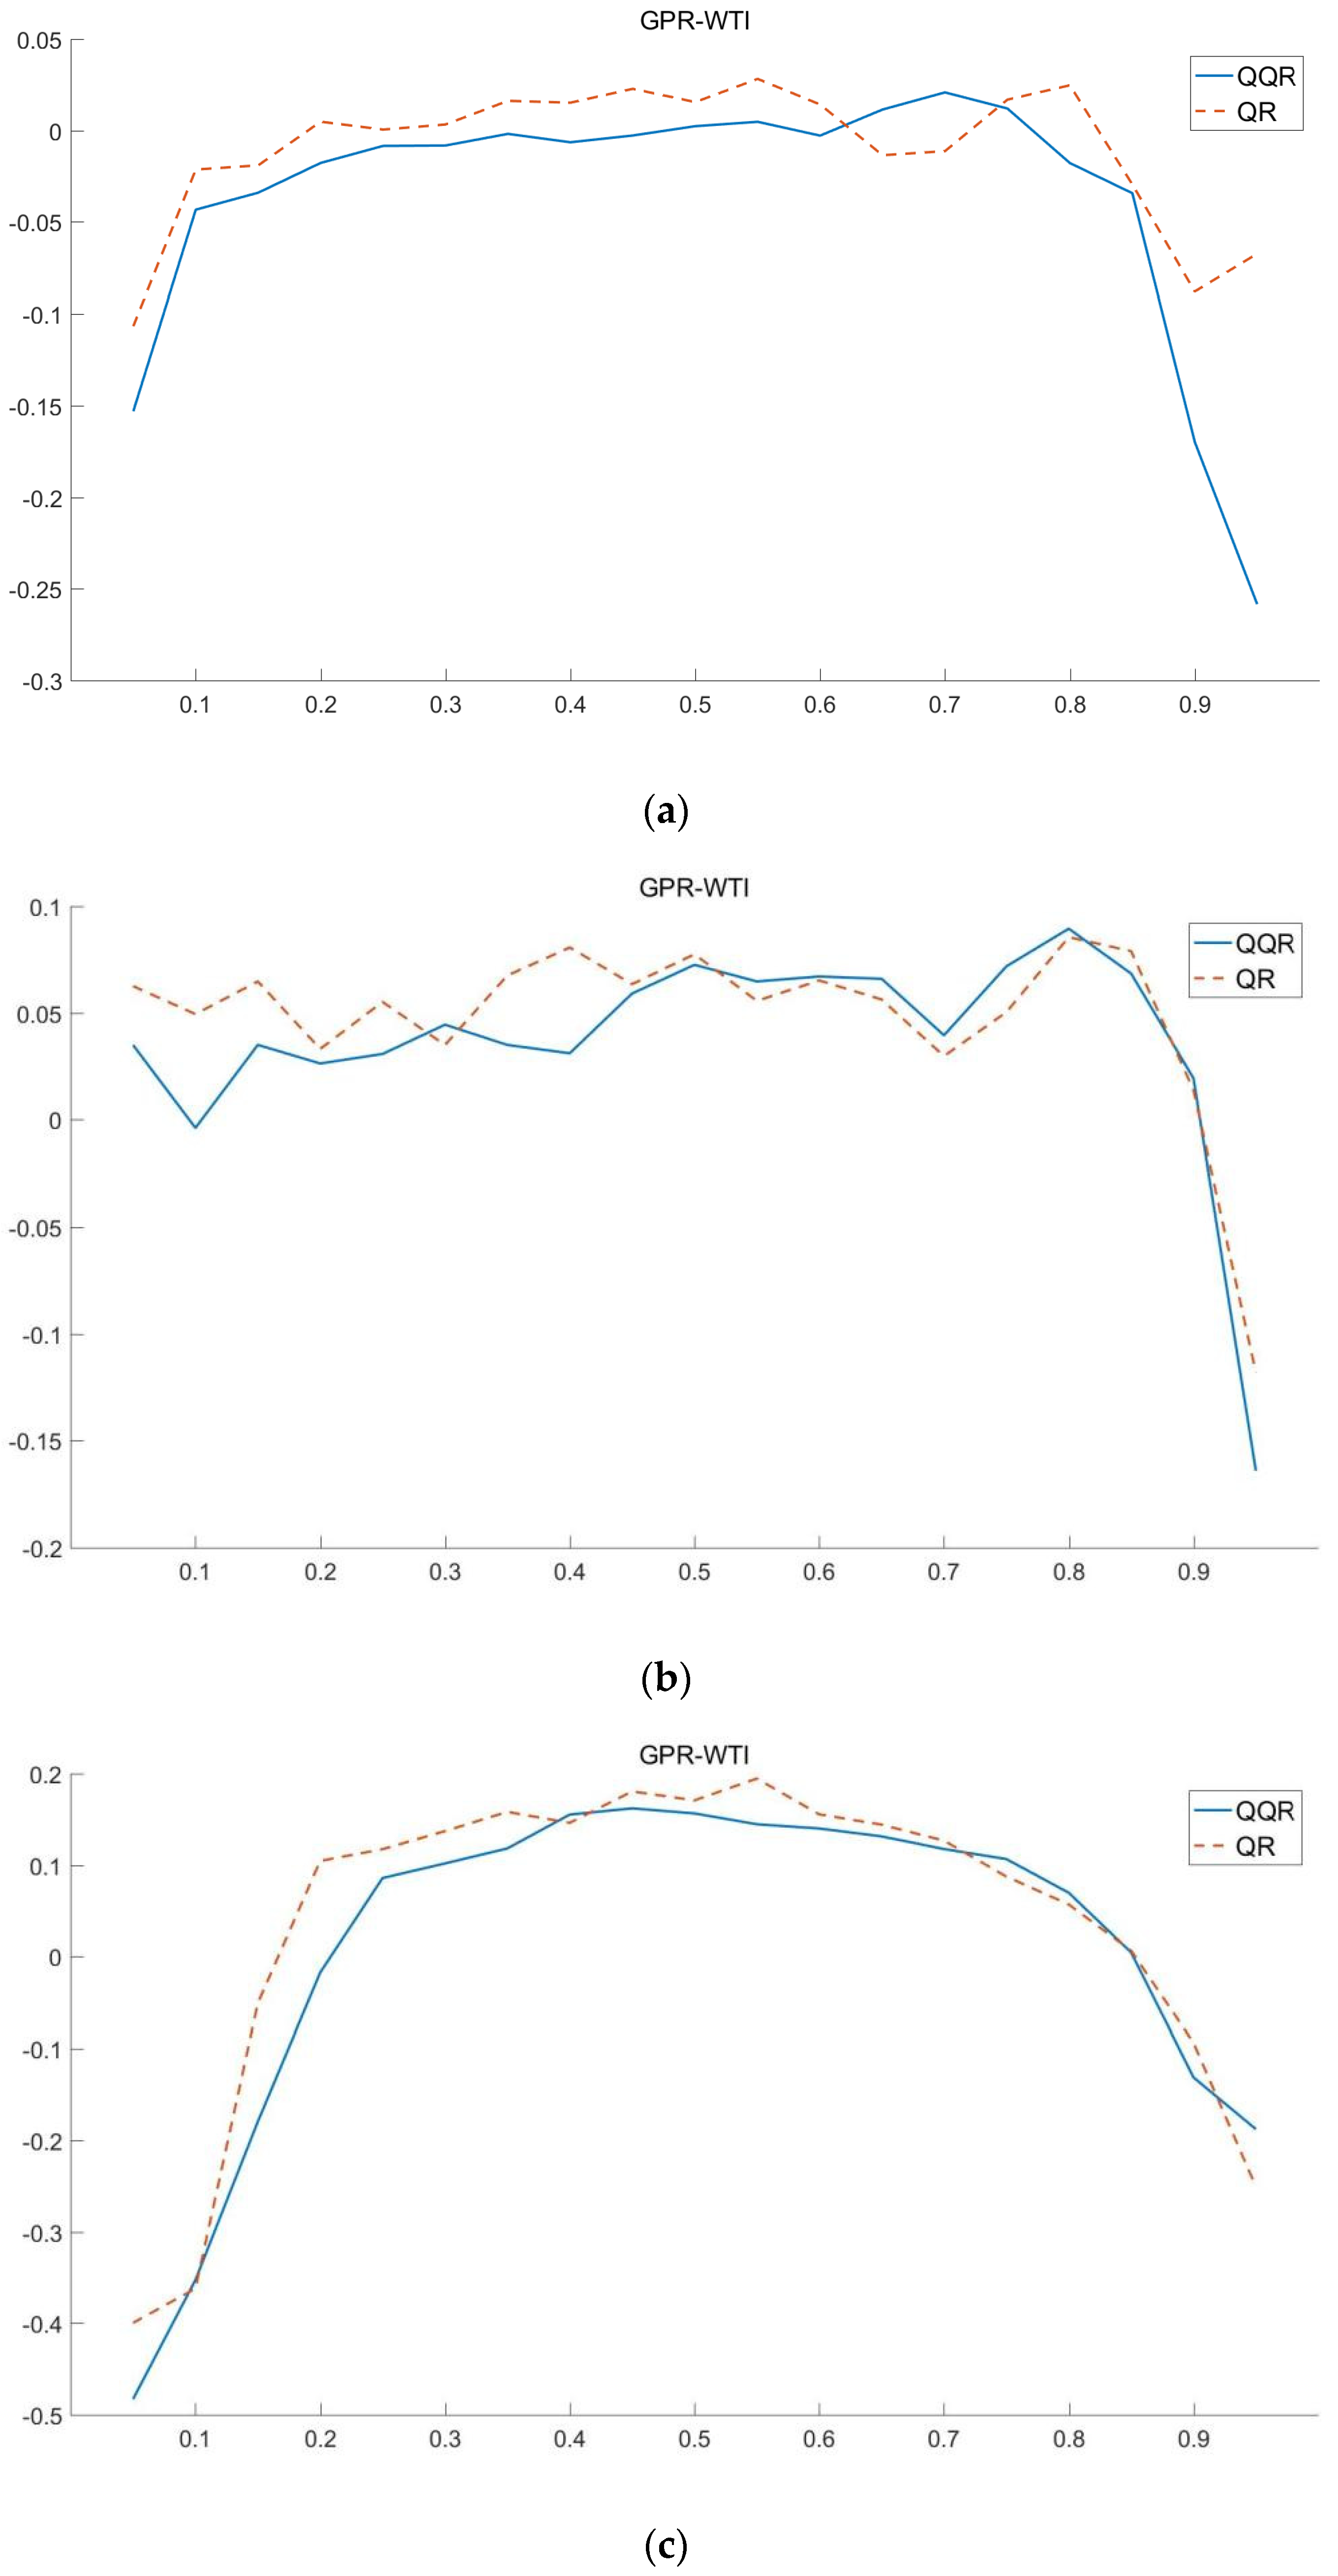
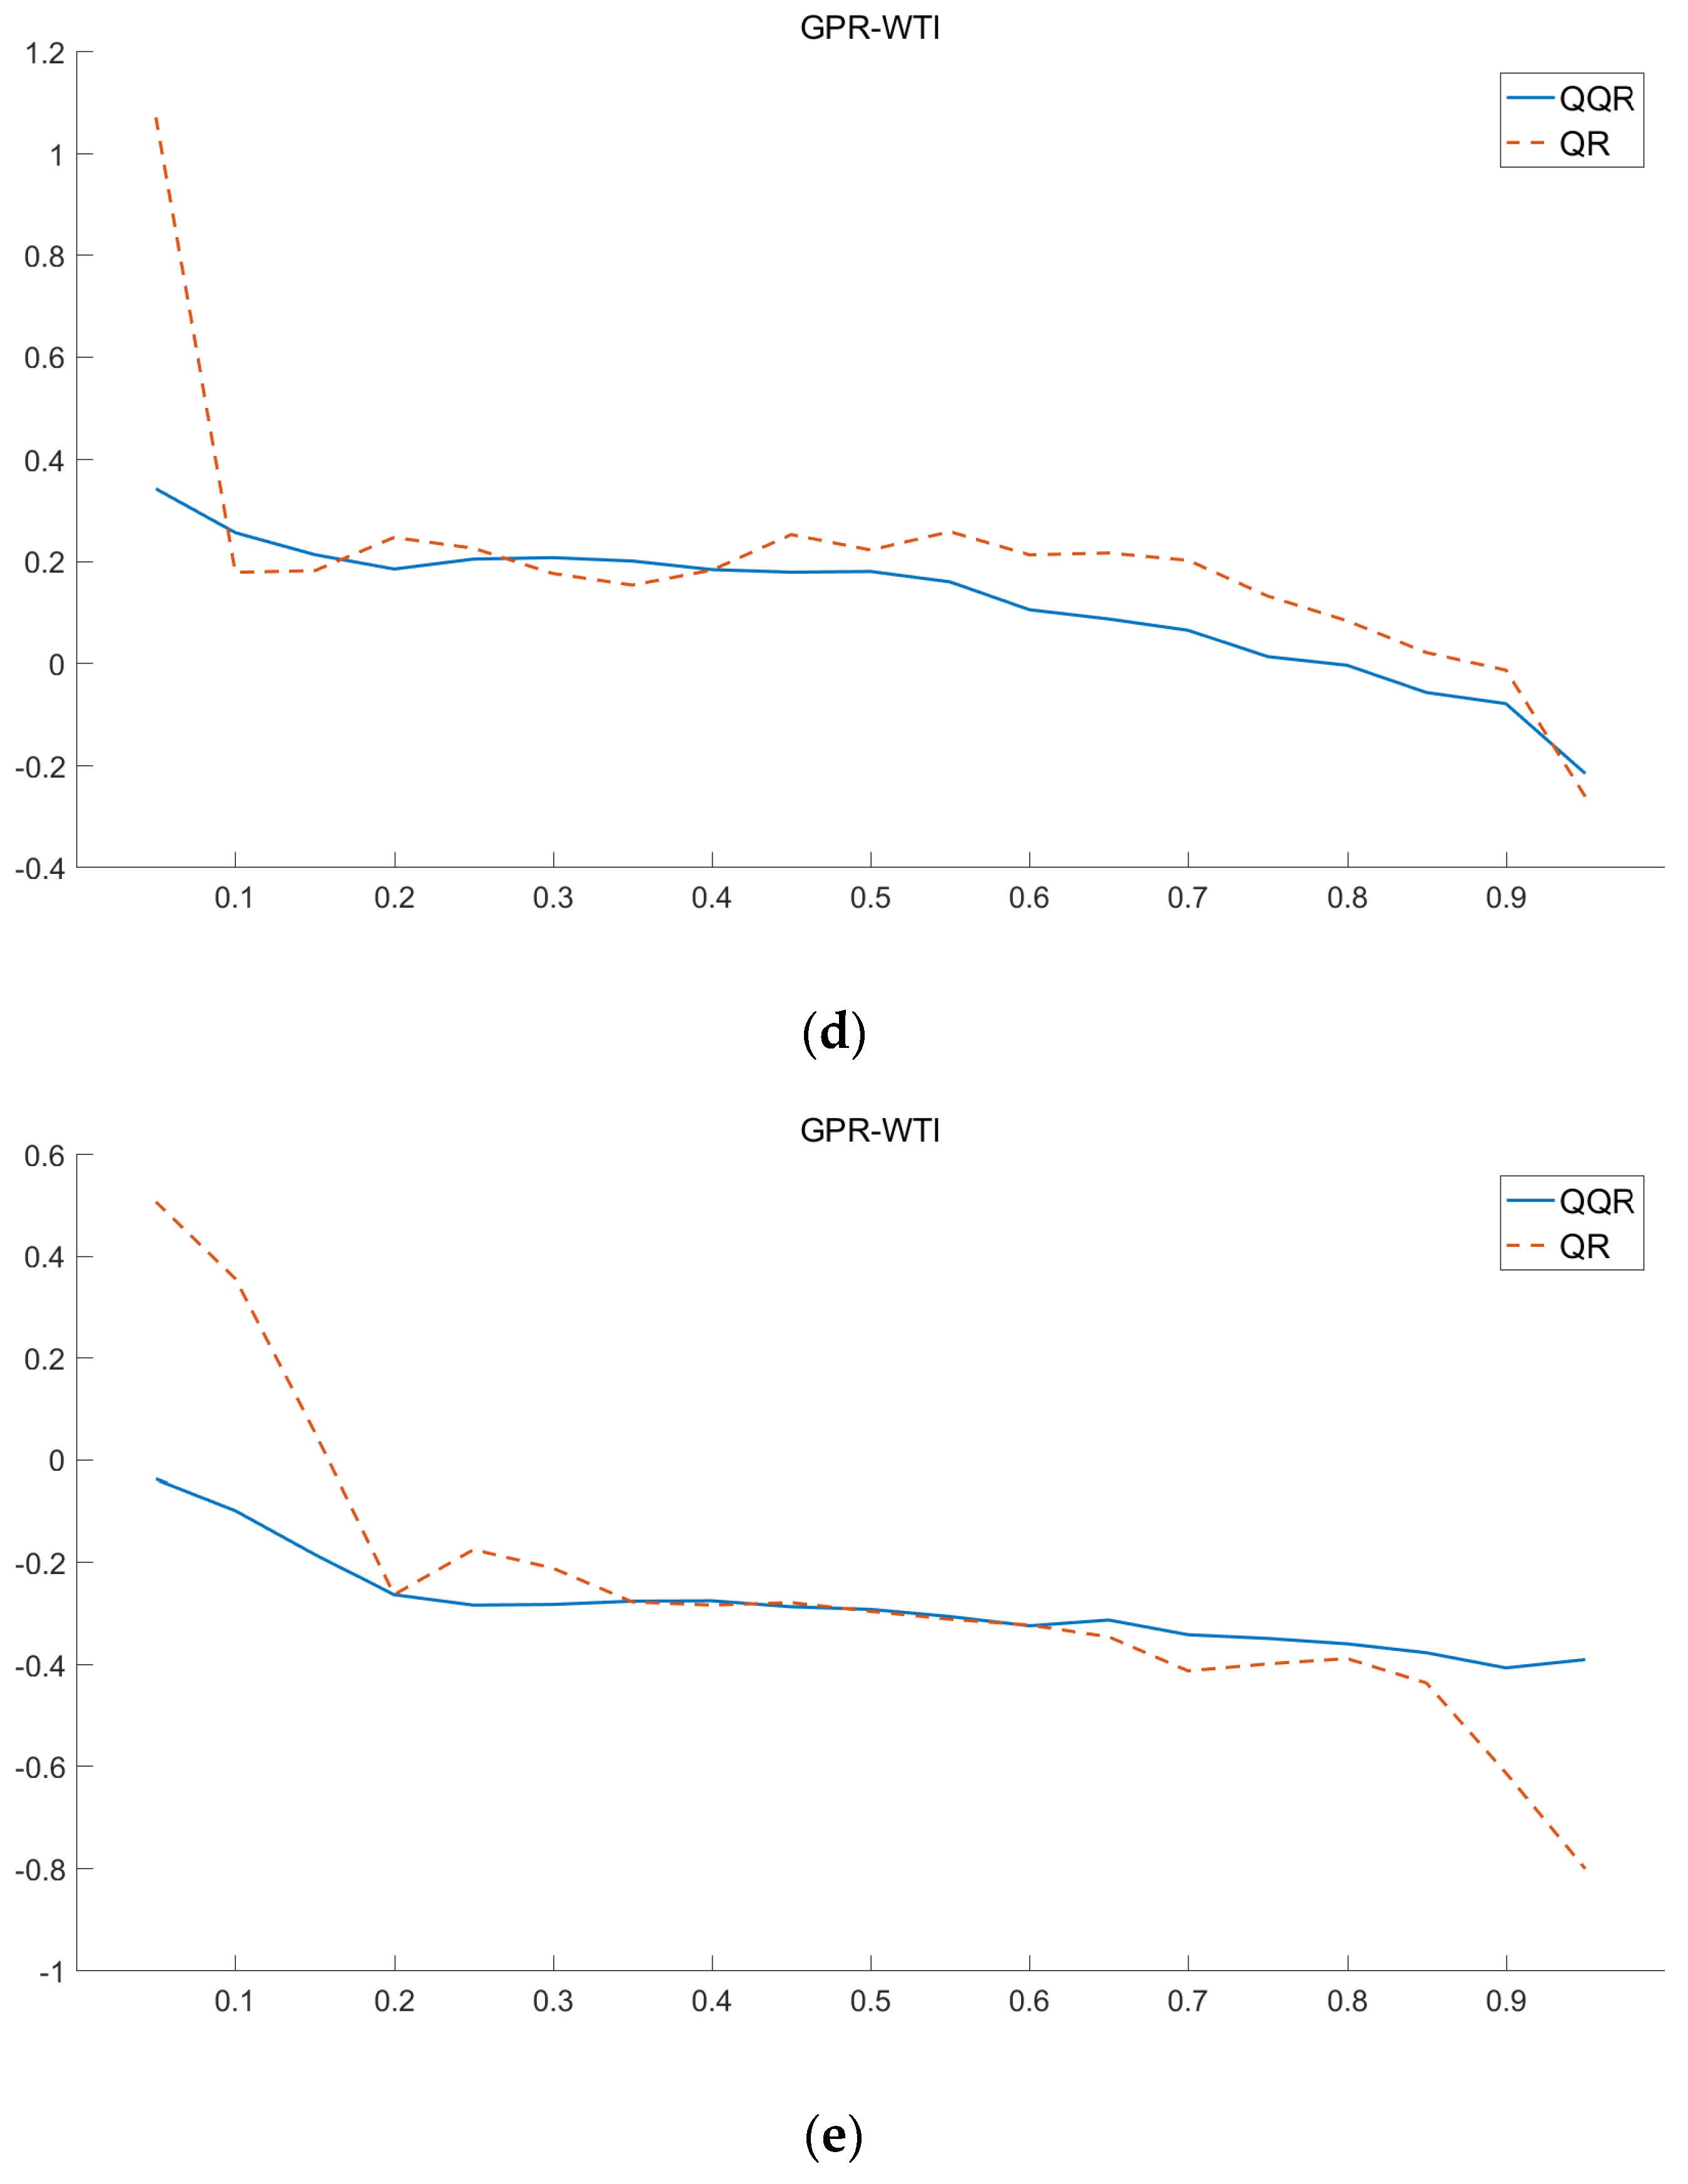
4.4. Robustness Test

In this sub-section, the impact coefficient estimation results of three uncertainties on crude oil price, under the Q.R. method and the QQR method, are compared as the robustness explanation of the conclusion (see Figure 6, Figure 7 and Figure 8 for details) [34]. Among them, sub-figures (a–e) in Figure 6 respectively record the comparison of the estimated values of the impact coefficient of economic policy uncertainty on crude oil price under the time scales of D1–D5; sub-figures (a–e) in Figure 7 are about geopolitical risk uncertainty; and sub-figures (a–e) in Figure 8 are about the climate policy uncertainty.
It can be seen from Figure 6, Figure 7 and Figure 8 that the impact coefficients estimations of the three uncertainty indexes on crude oil prices do not differ much under the two estimation methods, and most of the estimates’ parameter curves in the figures remain consistent or even coincide. Based on this, it can be explained that the conclusion of this paper is robust.

5. Conclusions

Based on the uncertainty and crude oil price data from December 2001 to March 2021, this paper studies the multi-dimensional impact of three uncertainties on crude oil price by using the wavelet transform and the quantile-on-quantile regression method, and it further compares the impact differences of three uncertainties on crude oil price. The following conclusions are drawn:
(1) The three types of uncertainties have heterogeneous effects on crude oil prices, which are mainly reflected in the quantiles of the impact intensity peaks and the impact fluctuation. On the one hand, the quantiles of the peak impact intensity of the three uncertainties on crude oil prices are significantly different. On the other hand, compared with the impact of geopolitical risk uncertainty on crude oil price, the impact of economic policy uncertainty on crude oil price fluctuates more frequently, and the impact of climate policy uncertainty on crude oil price volatility is more intense.
(2) On different time scales, the significant impact periods of the three uncertainties on crude oil prices are significantly different. Specifically, economic policy uncertainty has a more significant impact on crude oil prices in the long-term; climate policy uncertainty has a significant impact on crude oil prices in the medium-term; geopolitical risk uncertainty has a significant impact on crude oil prices in the short-, medium-, and long-term.
(3) The impact direction and fluctuation change of the three uncertainties on the crude oil price at different time scales are heterogeneous. This is mainly reflected in the following two aspects. First, on different time scales, economic policy uncertainty mainly has a positive impact on crude oil prices, whereas geopolitical risk uncertainty and climate policy uncertainty mainly have negative impacts on crude oil prices. Second, under different time scales, the impact of economic policy uncertainty on the fluctuation of crude oil price is mainly concentrated in the depression period of the crude oil market, whereas the impact of geopolitical risk uncertainty and climate policy uncertainty on the fluctuation of crude oil price is mainly concentrated in the stable period of the crude oil market.
Based on the above conclusions, this paper puts forward the following policy implications [64,65,66,67]. Firstly, when economic policies change, governments should pay attention to preventing the long-term impact of economic policy fluctuations on the crude oil market, making more reasonable decisions according to the impact relations between the two on different time scales. In the face of fluctuations in the crude oil market, governments should carefully adopt different types of economic policies according to the actual situation, so as to reduce the economic impact caused by crude oil price fluctuations. Secondly, in view of the strong negative impact of geopolitical risk uncertainty on the crude oil market in different periods, governments should pay special attention to the period before and after the geopolitical crisis, taking corresponding measures in advance to stabilize the political situation, so as to prevent sharp fluctuations in oil prices, which will have a more significant impact on the economy. Thirdly, in view of the increasing attention paid to climate change and the severe impact of climate policy uncertainty on crude oil prices, governments should actively pay attention to global climate change, and put forward relevant solutions with carbon neutrality as the ultimate goal, so as to gradually reduce the severe impact of climate policy uncertainty on crude oil prices [68,69]. In addition, when the crude oil price is at the low quantile, governments and investors should be alert to the negative impact of economic policies, geopolitical risks, and climate policies, and take corresponding preventive measures in advance [70]. When the crude oil price is at the high point, investors may need to reasonably analyze the impact of these uncertainties on the fluctuation of crude oil price, so as to make better investment decisions.
This paper may have the following limitations. First, the data used in this paper have certain limitations. The study period of this paper is from December 2001 to March 2021. There is still some room for improvement in the time dimension. Secondly, this paper mainly studies and compares the impact of three kinds of uncertainties on crude oil prices in different periods. It may ignore some details, such as which specific uncertainty affects crude oil prices more significantly. This paper can make a more in-depth analysis of some specific economic policies or geopolitical events in the future. Finally, some of the chart collocations in this article may be unclear. The research methods and models in this paper can be further advanced so that more interesting conclusions can be found.

Author Contributions

Conceptualization, Y.D. and Y.L.; methodology, Y.D.; software, Y.L.; validation, Y.D., Y.L. and P.F.; formal analysis, Y.D.; investigation, Y.L.; resources, P.F.; data curation, Y.L.; writing—original draft preparation, Y.D.; writing—review and editing, P.F.; visualization, Y.L.; supervision, P.F.; project administration, P.F.; funding acquisition, Y.D. and Y.L. All authors have read and agreed to the published version of the manuscript.

Funding

This research was funded by the Natural Science Fund of Hunan Province, 2020JJ5122; the Key Project of Education Department of Hunan Province, 20A139.

Data Availability Statement

The data in this study are available from authors upon request.

Conflicts of Interest

The authors declare no conflict of interest.

References

  1. Li, Z.; Dong, H.; Floros, C.; Charemis, A.; Failler, P. Re-examining Bitcoin Volatility: A CAViaR-based Approach. Emerg. Mark. Financ. Trade 2022, 58, 1320–1338. [Google Scholar] [CrossRef]
  2. Boateng, E.; Asafo-Adjei, E.; Addison, A.; Quaicoe, S.; Yusuf, M.A.; Abeka, M.J.; Adam, A.M. Interconnectedness among commodities, the real sector of Ghana and external shocks. Resour. Policy 2022, 75, 102511. [Google Scholar] [CrossRef]
  3. Gavriilidis, K. Measuring Climate Policy Uncertainty. 2021. Available online: https://ssrn.com/abstract=3847388 (accessed on 24 June 2021).
  4. Adekunle, W.; Bagudo, A.M.; Odumosu, M.; Inuolaji, S.B. Predicting stock returns using crude oil prices: A firm level analysis of Nigeria’s oil and gas sector. Resour. Policy 2020, 68, 101708. [Google Scholar] [CrossRef]
  5. Asai, M.; Gupta, R.; McAleer, M. Forecasting volatility and co-volatility of crude oil and gold futures: Effects of leverage, jumps, spillovers, and geopolitical risks. Int. J. Forecast. 2020, 36, 933–948. [Google Scholar] [CrossRef] [Green Version]
  6. Chkir, I.; Guesmi, K.; Ben Brayek, A.; Naoui, K. Modelling the nonlinear relationship between oil prices, stock markets, and exchange rates in oil-exporting and oil-importing countries. Res. Int. Bus. Financ. 2020, 54, 101274. [Google Scholar] [CrossRef]
  7. Li, Z.H.; Zhong, J.H. Impact of economic policy uncertainty shocks on China’s financial conditions. Eur. J. Oper. Res. 2020, 35. [Google Scholar] [CrossRef]
  8. Huynh, T.L.D.; Burggraf, T.; Nasir, M.A. Financialisation of natural resources & instability caused by risk transfer in commodity markets. Resour. Policy 2020, 66, 101620. [Google Scholar]
  9. Latunde, T.; Akinola, L.S.; Dare, D.D. Analysis of capital asset pricing model on Deutsche bank energy commodity. Green Financ. 2020, 2, 20–34. [Google Scholar] [CrossRef]
  10. Aimer, N.; Lusta, A. Asymmetric effects of oil shocks on economic policy uncertainty. Energy 2022, 241, 122712. [Google Scholar] [CrossRef]
  11. Le, T.-H.; Le, A.T.; Le, H.-C. The historic oil price fluctuation during the COVID-19 pandemic: What are the causes? Res. Int. Bus. Finance 2021, 58, 101489. [Google Scholar] [CrossRef]
  12. Hailemariam, A.; Smyth, R.; Zhang, X. Oil prices and economic policy uncertainty: Evidence from a nonparametric panel data model. Energy Econ. 2019, 83, 40–51. [Google Scholar] [CrossRef]
  13. Lyu, Y.; Yi, H.; Wei, Y.; Yang, M. Revisiting the role of economic uncertainty in oil price fluctuations: Evidence from a new time-varying oil market model. Econ. Model. 2021, 103, 105616. [Google Scholar] [CrossRef]
  14. Sun, X.; Chen, X.; Wang, J.; Li, J. Multi-scale interactions between economic policy uncertainty and oil prices in time-frequency domains. North Am. J. Econ. Financ. 2020, 51, 100854. [Google Scholar] [CrossRef]
  15. Lin, B.; Bai, R. Oil prices and economic policy uncertainty: Evidence from global, oil importers, and exporters’ perspective. Res. Int. Bus. Financ. 2021, 56, 101357. [Google Scholar] [CrossRef]
  16. He, H.; Sun, M.; Gao, C.; Li, X. Detecting lag linkage effect between economic policy uncertainty and crude oil price: A multi-scale perspective. Phys. A Stat. Mech. Its Appl. 2021, 580, 126146. [Google Scholar] [CrossRef]
  17. Su, C.-W.; Huang, S.-W.; Qin, M.; Umar, M. Does crude oil price stimulate economic policy uncertainty in BRICS? Pacific-Basin Financ. J. 2021, 66, 101519. [Google Scholar] [CrossRef]
  18. Wang, L.; Ma, F.; Hao, J.; Gao, X. Forecasting crude oil volatility with geopolitical risk: Do time-varying switching probabilities play a role? Int. Rev. Financ. Anal. 2021, 76, 101756. [Google Scholar] [CrossRef]
  19. Liu, Y.; Han, L.; Xu, Y. The impact of geopolitical uncertainty on energy volatility. Int. Rev. Financ. Anal. 2021, 75, 101743. [Google Scholar] [CrossRef]
  20. Monge, M.; Cristóbal, E. Terrorism and the behavior of oil production and prices in OPEC. Resour. Policy 2021, 74, 102321. [Google Scholar] [CrossRef]
  21. Chen, H.; Liao, H.; Tang, B.-J.; Wei, Y.-M. Impacts of OPEC’s political risk on the international crude oil prices: An empirical analysis based on the SVAR models. Energy Econ. 2016, 57, 42–49. [Google Scholar] [CrossRef]
  22. Ivanovski, K.; Hailemariam, A. Time-varying geopolitical risk and oil prices. Int. Rev. Econ. Financ. 2022, 77, 206–221. [Google Scholar] [CrossRef]
  23. Atri, H.; Kouki, S.; Gallali, M.I. The impact of COVID-19 news, panic and media coverage on the oil and gold prices: An ARDL approach. Resour. Policy 2021, 72, 102061. [Google Scholar] [CrossRef] [PubMed]
  24. Lee, C.-C.; Olasehinde-Williams, G.; Akadiri, S.S. Are geopolitical threats powerful enough to predict global oil price volatility? Environ. Sci. Pollut. Res. 2021, 28, 28720–28731. [Google Scholar] [CrossRef] [PubMed]
  25. Hu, M.; Zhang, D.; Ji, Q.; Wei, L. Macro factors and the realized volatility of commodities: A dynamic network analysis. Resour. Policy 2020, 68, 101813. [Google Scholar] [CrossRef] [PubMed]
  26. Uddin, G.S.; Hernandez, J.A.; Wadström, C.; Dutta, A.; Ahmed, A. Do uncertainties affect biofuel prices? Biomass-Bioenergy 2021, 148, 106006. [Google Scholar] [CrossRef]
  27. Yi, A.; Yang, M.; Li, Y. Macroeconomic Uncertainty and Crude Oil Futures Volatility–Evidence from China Crude Oil Futures Market. Front. Environ. Sci. 2021, 9, 21. [Google Scholar] [CrossRef]
  28. Dutta, A.; Bouri, E.; Saeed, T. News-based equity market uncertainty and crude oil volatility. Energy 2021, 222, 119930. [Google Scholar] [CrossRef]
  29. Dutta, A.; Bouri, E.; Noor, H. Climate bond, stock, gold, and oil markets: Dynamic correlations and hedging analyses during the COVID-19 outbreak. Resour. Policy 2021, 74, 102265. [Google Scholar] [CrossRef]
  30. Ben Jabeur, S.; Khalfaoui, R.; Ben Arfi, W. The effect of green energy, global environmental indexes, and stock markets in predicting oil price crashes: Evidence from explainable machine learning. J. Environ. Manag. 2021, 298, 113511. [Google Scholar] [CrossRef]
  31. Fahmy, H. The rise in investors’ awareness of climate risks after the Paris Agreement and the clean energy-oil-technology prices nexus. Energy Econ. 2022, 106, 105738. [Google Scholar] [CrossRef]
  32. Crowley, P.M. A guide to wavelets for economists. J. Econ. Surv. 2007, 21, 207–267. [Google Scholar] [CrossRef]
  33. Jiang, Y.; Tian, G.; Wu, Y.; Mo, B. Impacts of geopolitical risks and economic policy uncertainty on Chinese tourism-listed company stock. Int. J. Financ. Econ. 2022, 27, 320–333. [Google Scholar] [CrossRef]
  34. Gencay, R.; Signori, D. Multi-scale tests for serial correlation. J. Econom. 2015, 184, 62–80. [Google Scholar] [CrossRef]
  35. Mo, B.; Li, Z.; Meng, J. The dynamics of carbon on green energy equity investment: Quantile-on-quantile and quantile coherency approaches. Environ. Sci. Pollut. Res. 2022, 29, 5912–5922. [Google Scholar] [CrossRef]
  36. Sim, N.; Zhou, H. Oil prices, US stock return, and the dependence between their quantiles. J. Bank. Financ. 2015, 55, 1–8. [Google Scholar] [CrossRef]
  37. Shahzad, S.J.H.; Shahbaz, M.; Ferrer, R.; Kumar, R.R. Tourism-led growth hypothesis in the top ten tourist destinations: New evidence using the quantile-on-quantile approach. Tour. Manag. 2017, 60, 223–232. [Google Scholar] [CrossRef] [Green Version]
  38. Mo, B.; Chen, C.; Nie, H.; Jiang, Y. Visiting effects of crude oil price on economic growth in BRICS countries: Fresh evidence from wavelet-based quantile-on-quantile tests. Energy 2019, 178, 234–251. [Google Scholar] [CrossRef]
  39. Baker, S.R.; Bloom, N.; Davis, S.J. Measuring Economic Policy Uncertainty. Q. J. Econ. 2016, 131, 1593–1636. [Google Scholar] [CrossRef]
  40. Caldara, D.; Iacoviello, M. Measuring Geopolitical Risk; Working Paper; Board of Governors of the Federal Reserve Board: Wasington, DC, USA, 2021.
  41. Jia, S.S.; Dong, H.; Wang, Z.Z. Identifying the Asymmetric Channel of Crude Oil Risk Pass-Through to Macro Economy: Based on Crude Oil Attributes. Front. Energy Res. 2022, 9, 831. [Google Scholar] [CrossRef]
  42. Liu, Y.Q.; Li, Z.H.; Yao, Y.Y.; Dong, H. Asymmetry of Risk Evolution in Crude Oil Market: From the Perspective of Dual Attributes of Oil. Energies 2021, 14, 4063. [Google Scholar] [CrossRef]
  43. Jia, S.S.; Dong, H.; Yang, H.W. Asymmetric Risk Spillover of the International Crude Oil Market in the Perspective of Crude Oil Dual Attributes. Front. Environ. Sci. 2021, 9, 335. [Google Scholar] [CrossRef]
  44. Chen, S.L.; Ouyang, S.Y.; Dong, H. Oil Price Pass-Through Into Consumer and Producer Prices With Monetary Policy in China: Are There Non-linear and Mediating Effects. Front. Energy Res. 2020, 8, 35. [Google Scholar] [CrossRef] [Green Version]
  45. Liu, Y.; Dong, H.; Failler, P. The Oil Market Reactions to OPEC’s Announcements. Energies 2019, 12, 3238. [Google Scholar] [CrossRef] [Green Version]
  46. Dong, H.; Liu, Y.; Chang, J.Q. The heterogeneous linkage of economic policy uncertainty and oil return risks. Green Financ. 2019, 1, 46–66. [Google Scholar] [CrossRef]
  47. Liu, Y.; Li, Z.; Xu, M. The Influential Factors of Financial Cycle Spillover: Evidence from China. Emerg. Mark. Financ. Trade 2019, 56, 1336–1350. [Google Scholar] [CrossRef]
  48. Li, T.; Li, X.; Liao, G. Business cycles and energy intensity. Evidence from emerging economies. Borsa Istanb. Rev. 2021. [Google Scholar] [CrossRef]
  49. Zhu, J.; Huang, Z.; Li, Z.; Albitar, K. The Impact of Urbanization on Energy Intensity—An Empirical Study on OECD Countries. Green Financ. 2021, 3, 508–526. [Google Scholar] [CrossRef]
  50. Atta-Mensah, J. Commodity-linked bonds as an innovative financing instrument for African countries to build back better. Quant. Financ. Econ. 2021, 5, 516–541. [Google Scholar] [CrossRef]
  51. Qin, Y.; Hong, K.; Chen, J.; Zhang, Z. Asymmetric effects of geopolitical risks on energy returns and volatility under different market conditions. Energy Econ. 2020, 90, 104851. [Google Scholar] [CrossRef]
  52. Zhu, X.; Liao, J.; Chen, Y. Time-varying effects of oil price shocks and economic policy uncertainty on the nonferrous metals industry: From the perspective of industrial security. Energy Econ. 2021, 97, 105192. [Google Scholar] [CrossRef]
  53. Li, Z.; Ao, Z.; Mo, B. Revisiting the Valuable Roles of Global Financial Assets for International Stock Markets: Quantile Coherence and Causality-in-Quantiles Approaches. Mathematics 2021, 9, 1750. [Google Scholar] [CrossRef]
  54. Huang, J.; Ding, Q.; Zhang, H.; Guo, Y.; Suleman, M.T. Nonlinear dynamic correlation between geopolitical risk and oil prices: A study based on high-frequency data. Res. Int. Bus. Financ. 2021, 56, 101370. [Google Scholar] [CrossRef]
  55. Monge, M.; Gil-Alana, L.A.; de Gracia, F.P. Crude oil price behaviour before and after military conflicts and geopolitical events. Energy 2017, 120, 79–91. [Google Scholar] [CrossRef]
  56. Li, Z.; Zou, F.; Tan, Y.; Zhu, J. Does Financial Excess Support Land Urbanization—An Empirical Study of Cities in China. Land 2021, 10, 635. [Google Scholar] [CrossRef]
  57. Fine, J.; Busch, C.; Garderet, R. The upside hedge value of California’s global warming policy given uncertain future oil prices. Energy Policy 2012, 44, 46–51. [Google Scholar] [CrossRef]
  58. Li, Z.; Chen, L.; Dong, H. What are bitcoin market reactions to its-related events? Int. Rev. Econ. Financ. 2021, 73, 1750. [Google Scholar] [CrossRef]
  59. You, W.; Guo, Y.; Zhu, H.; Tang, Y. Oil price shocks, economic policy uncertainty and industry stock returns in China: Asymmetric effects with quantile regression. Energy Econ. 2017, 68, 1–18. [Google Scholar] [CrossRef]
  60. Aloui, R.; Gupta, R.; Miller, S.M. Uncertainty and crude oil returns. Energy Econ. 2016, 55, 92–100. [Google Scholar] [CrossRef] [Green Version]
  61. Li, Z.; Huang, Z.; Failler, P. Dynamic Correlation between Crude Oil Price and Investor Sentiment in China: Heterogeneous and Asymmetric Effect. Energies 2022, 15, 687. [Google Scholar] [CrossRef]
  62. Dash, S.R.; Maitra, D. Do oil and gas prices influence economic policy uncertainty differently: Multi-country evidence using time-frequency approach. Q. Rev. Econ. Financ. 2021, 81, 397–420. [Google Scholar] [CrossRef]
  63. Li, F.; Huang, Z.; Zhong, J.; Albitar, K. Do Tense Geopolitical Factors Drive Crude Oil Prices? Energies 2020, 13, 4277. [Google Scholar] [CrossRef]
  64. Li, T.; Li, X.; Albitar, K. Threshold effects of financialization on enterprise R & D innovation: A comparison research on heterogeneity. Quant. Financ. Econ. 2021, 5, 496–515. [Google Scholar] [CrossRef]
  65. Li, Z.; Zou, F.; Mo, B. Does mandatory CSR disclosure affect enterprise total factor productivity? Econ. Res.-Ekon. Istraživanja 2021, D04–D24. [Google Scholar] [CrossRef]
  66. Kanwal, M.; Khan, H. Does carbon asset add value to clean energy market? Evidence from EU. Green Financ. 2021, 3, 495–507. [Google Scholar] [CrossRef]
  67. Farouq, I.S.; Sambo, N.U.; Ahmad, A.U.; Jakada, A.H.; Danmaraya, I.A. Does financial globalization uncertainty affect CO2 emissions? Empirical evidence from some selected SSA countries. Quant. Financ. Econ. 2021, 5, 247–263. [Google Scholar] [CrossRef]
  68. Haas, R.; Ajanovic, A.; Ramsebner, J.; Perger, T.; Knápek, J.; Bleyl, J.W. Financing the future infrastructure of sustainable energy systems. Green Financ. 2021, 3, 90–118. [Google Scholar] [CrossRef]
  69. Li, F.; Yang, C.; Li, Z.; Failler, P. Does Geopolitics Have an Impact on Energy Trade? Empirical Research on Emerging Countries. Sustainability 2021, 13, 5199. [Google Scholar] [CrossRef]
  70. Yang, C.; Li, T.; Albitar, K. Does Energy Efficiency Affect Ambient PM2.5? The Moderating Role of Energy Investment. Front. Environ. Sci. 2021, 9, 707751. [Google Scholar] [CrossRef]
Figure 1. Three uncertainties and crude oil price trends.
Energies 15 03510 g001
Figure 2. Estimation of the overall impact coefficients of three uncertainties on crude oil price. (a) The overall impact of the GPR on the WTI; (b) The overall impact of the EPU on the WTI; (c) The overall impact of the CPU on the WTI.
Energies 15 03510 g002aEnergies 15 03510 g002b
Figure 3. Estimation of the impact coefficients of the EPU on the WTI at different time scales. (a) The impact of the EPU on the WTI at D1; (b) The impact of the EPU on the WTI at D2; (c) The impact of the EPU on the WTI at D3; (d) The impact of the EPU on the WTI at D4; (e) The impact of the EPU on the WTI at D5.
Energies 15 03510 g003aEnergies 15 03510 g003b
Figure 4. Estimation of the impact coefficients of the GPR on the WTI at different time scales. (a) The impact of the GPR on the WTI at D1; (b) The impact of the GPR on the WTI at D2; (c) The impact of the GPR on the WTI at D3; (d) The impact of the GPR on the WTI at D4; (e) The impact of the GPR on the WTI at D5.
Energies 15 03510 g004aEnergies 15 03510 g004b
Figure 5. Estimation of the impact coefficients of the CPU on the WTI at different time scales. (a) The impact of the CPU on the WTI at D1; (b) The impact of the CPU on the WTI at D2; (c) The impact of the CPU on the WTI at D3; (d) The impact of the CPU on the WTI at D4; (e) The impact of the CPU on the WTI at D5.
Energies 15 03510 g005aEnergies 15 03510 g005bEnergies 15 03510 g005c
Figure 6. Comparison of impact coefficient estimates of the EPU on the WTI under QQR and Q.R. (a) Comparison of the impact of EPU on WTI under the Q.R. and the QQR at D1; (b) Comparison of the impact of EPU on WTI under the Q.R. and the QQR at D2; (c) Comparison of the impact of EPU on WTI under the Q.R. and the QQR at D3; (d) Comparison of the impact of EPU on WTI under the Q.R. and the QQR at D4; (e) Comparison of the impact of EPU on WTI under the Q.R. and the QQR at D5.
Energies 15 03510 g006aEnergies 15 03510 g006b
Figure 7. Comparison of impact coefficient estimates of the GPR on the WTI under QQR and Q.R. (a) Comparison of the impact of GPR on WTI under the Q.R. and the QQR at D1; (b) Comparison of the impact of GPR on WTI under the Q.R. and the QQR at D2; (c) Comparison of the impact of GPR on WTI under the Q.R. and the QQR at D3; (d) Comparison of the impact of GPR on WTI under the Q.R. and the QQR at D4; (e) Comparison of the impact of GPR on WTI under the Q.R. and the QQR at D5.
Energies 15 03510 g007aEnergies 15 03510 g007b
Figure 8. Comparison of impact coefficient estimates of the CPU on the WTI under QQR and Q.R. (a) Comparison of the impact of CPU on WTI under the Q.R. and the QQR at D1; (b) Comparison of the impact of CPU on WTI under the Q.R. and the QQR at D2; (c) Comparison of the impact of CPU on WTI under the Q.R. and the QQR at D3; (d) Comparison of the impact of CPU on WTI under the Q.R. and the QQR at D4; (e) Comparison of the impact of CPU on WTI under the Q.R. and the QQR at D5.
Energies 15 03510 g008aEnergies 15 03510 g008b
Table 1. Variable selection and data sources.
VariableCharacterization VariableAbbreviationData Source
Economic policy uncertaintyThe GEPU indexEPUwww.policyuncetainty.com
accessed on 5 April 2021.
Geopolitical risk uncertaintyThe GPR indexGPR
Climate policy uncertaintyThe CPU indexCPU
International crude oil priceWTI crude oil spot priceWTIEIA
Table 2. Descriptive Statistics.
GPRCPUEPUWTI
Mean1.9912221.8865672.0968811.783795
Max2.5547452.7986642.6405242.126261
Min1.8066360.6464041.7355421.269046
S.D.0.1150560.3729320.2057220.200629
Skew1.271105−0.605450.351873−0.39509
Kurt5.6176753.4122052.5047632.465084
J-B128.157415.748377.1274818.763766
Prob00.000380.0283330.012502
ADF−4.46863−3.45683−4.98621−3.11919
Prob0.00030.01010.00030.0265
Table 3. Comparison of the impact characteristics of the EPU on the WTI at different time scales.
PeriodTime ScalePositive Impact Peak and the QuantilesNegative Impact Peak and the QuantilesThe Change of the Impact DirectionThe Quantiles at Which the Impact Direction Changes
Short-termD1The peak is around 0.62; both the EPU and the WTI are at the high quantile (0.9–1)NoneNoneNone
D2The peak is around 1.5; both the EPU and the WTI are at the high quantile (0.9–1)The peak is around −1; the EPU is at the high quantile (0.8–1), and the WTI is at the low quantile (0–0.1)From the negative to the positiveThe EPU is at the high quantile (0.8–0.95), and the WTI is at the low quantile (0–0.1)
Mid-termD3The peak is around 1.5; the EPU is at the low quantile (0–0.1), and the WTI is at the high quantile (0.8–1)The peak is around −1.2; the EPU is at the high quantile (0.8–1), and the WTI is at the low quantile (0–0.1)From the positive to the negative The EPU is at the high quantile (0.8–0.95), and the WTI is at the low quantile (0–0.1)
D4The peak is around 1; the EPU is at the high quantile (0.8–1), and the WTI is at the low quantile (0–0.1)The peak is around −0.4; the EPU is at the low quantile (0–0.1), and the WTI is at the high quantile (0.6–0.75)From the negative to the positive; in the “N” shape.Both the EPU and the WTI are at the low quantile (0–0.2);
the EPU is at the low quantile (0–0.1), whereas the WTI is in the full stage.
Long-termD5The peak is around 2; the EPU is at the low quantile (0–0.1), and the WTI is at the high quantile (0.8–1)The peak is around −1.4; both the EPU and the WTI are at the low quantile (0–0.1)From the negative to the positive The EPU is at the low quantile (0–0.1), and the WTI is at the mid-high quantile (0.6–0.8); the EPU is at the middle and high quantile (0.6–0.8), and the WTI is at the low quantile (0–0.1).
Table 4. Comparison of the impact characteristics of the GPR on the WTI at different time scales.
PeriodTime ScalePositive Impact Peak and the QuantilesNegative Impact Peak and the QuantilesThe Change of the Impact Direction The Quantiles at Which the Impact Direction Changes
Short-termD1NoneThe peak is around −1.5; the GPR is at the high quantile (0.8–1), and the WTI is at the low quantile (0–0.2)NoneNone
D2The peak is around 0.4; both the GPR and the WTI are at the high quantile (0.8–1)The peak is around −1.2; the GPR is at the high quantile (0.8–1), and the WTI is at the low quantile (0–0.2)From the negative to the positive The GPR is at the high quantile (0.8–1), and the WTI is at the low quantile (0–0.2)
Mid-termD3NoneThe peak is around −1; the GPR is at the low quantile (0–0.2), and the WTI is at the middle and low quantile (0–0.4)NoneNone
D4The peak is around 1; the GPR is at the low quantile (0–0.2), and the WTI is at the high quantile (0.8–1)The peak is around −1; the GPR is at the low quantile (0–0.2), and the WTI is at the mid-low quantile (0–0.4)From the negative to the positiveThe GPR is at the low quantile (0–0.2), and the WTI is at the middle quantile (0.4–0.6)
Long-termD5The peak is around 0.5; the GPR is at the high quantile (0.8–1), and the WTI is at the low quantile (0–0.4)The peak is around −1.54; the GPR is at the low quantile (0–0.2), and the WTI is at the mid-low quantile (0–0.4)From the negative to the positive The GPR is at the low quantile (0–0.2), and the WTI is at the middle quantile (0.4–0.6); the GPR is at the mid-high quantile (0.6–0.8), and the WTI is at the mid-low quantile (0–0.4)
Table 5. Comparison of the impact characteristics of the CPU on the WTI at different time scales.
PeriodTime ScalePositive Impact Peak and the QuantilesNegative Impact Peak and the QuantilesThe Change of the Impact Direction The Quantiles at Which the Impact Direction Changes
Short-termD1The peak is around 0.56; the CPU is at the high quantile (0.8–1), and the WTI is at the mid-high quantile (0.6–0.8)The peak is around −0.4; the CPU is at the low quantile (0–0.2), and the WTI is at the quantile (0.2–0.4)In the “M” shape.The CPU is at the low quantile (0–0.2), and the WTI is at the middle quantile (0.4–0.6); the CPU is at the high quantile (0.8–1), and the WTI is at the mid-high quantile (0.6–0.8).
D2The peak is around 0.38; the WTI is at the high quantile (0.9–1)The peak is around −0.4; the CPU is at the low quantile (0–0.2), and the WTI is at the middle quantile (0.4–0.6)In the “M” shape.The CPU is at the low quantile (0–0.2), and the WTI is at the middle quantile (0.4–0.6)
Mid-termD3The peak is around 0.8; the CPU is at the mid-high quantile (0.6–0.8), and the WTI is at the high quantile (0.8–1)The peak is around −1; the EPU is at the low quantile (0–0.2), and the WTI is at the low quantile (0.2–0.3)In the “M” shape.The CPU is at the low quantile (0–0.2), and the WTI is at the mid-low quantile (0.2–0.6)
D4The peak is around 1.25; the CPU is at the low quantile (0–0.2), and the WTI is at the high quantile (0.8–1)The peak is around −0.3; the CPU is at the low quantile (0–0.2), and the WTI is at the middle quantile (0.4–0.6)NoneNone
Long-termD5The peak is around 0.55; the CPU is at the high quantile (0.8–1), and the WTI is at the mid-low quantile (0–0.4)NoneFrom the negative to the positive The EPU is at the high quantile (0.7–1), and the WTI is at the high quantile (0.6–0.8).
Table 6. Comparison of the overall impacts of three uncertainty indexes on crude oil prices.
Uncertainty TypePositive Impact Peak and the QuantilesNegative Impact Peak and the QuantilesThe Change of the Impact DirectionThe Quantiles at Which the Impact Direction Changes
EPUThe peak is around 1.6; the EPU is at the quantile (0.2–0.6) and the WTI is near the quantile 0.3No obvious peakFrom the negative to the positive, then to the negativeWhen the EPU is at the quantile (0.2–1) and the WTI is at the low quantile (0–0.4)
GPRNo obvious peakThe peak is around −4; the GPR is at the mid-high quantile (0.6–0.8) and the WTI is at the mid-low quantile (0.2–0.4)No obvious changeNone
CPUThe peak is around 2; the CPU is at the quantile (0.4–0.9), and the WTI is at the low quantile (0–0.1)The peak is about −15; the CPU is at the mid-low quantile (0.2–0.4) and the WTI is at the low quantile (0.1–0.2)From the positive to the negativeWhen the WTI is at low quantile (0–0.2)
Table 7. Comparison of the impact intensities of three uncertainty indexes on crude oil price under different time scales.
Uncertainty TypeImpact Intensity Peak and Quantile Position in D1Impact Intensity Peak and Quantile Position in D2Impact Intensity Peak and Quantile Position in D3Impact Intensity Peak and Quantile Position in D4Impact Intensity Peak and Quantile Position in D5
EPUThe positive impact peak is around 0.62 when both the EPU and the WTI are at the high quantile (0.9–1);
no obvious negative impact peak
The positive peak is around 1.5 when both the EPU and the WTI are at the high quantile (0.9–1);
the negative impact peak is around −1; the EPU is at the high quantile (0.8–1), and the WTI is at the low quantile (0–0.1)
The positive impact peak is around 1.5; the EPU is at the low quantile (0–0.1), and the WTI is at the high quantile (0.8–1);
the negative impact peak is around −1.2; the EPU is at the high quantile (0.8–1), and the WTI is at the low quantile (0–0.1)
The positive impact peak is around 1; the EPU is at the high quantile (0.8–1), and the WTI is at the low quantile (0–0.1);
The negative impact peak is around −0.4; the EPU is at the low quantile (0–0.1), and the WTI is at the high quantile (0.6–0.75)
The positive impact peak is around 2; the EPU is at the low quantile (0–0.1), and the WTI is at the high quantile (0.8–1);
the negative impact peak is around −1.4; both the EPU and the WTI are at the low quantile (0–0.1)
GPRNo obvious positive impact peak;
the negative impact peak is around −1.5 when the GPR is at the high quantile (0.8–1), and the WTI is at the low quantile (0–0.2)
The peak is around 0.4 when both the GPR and the WTI are at the high quantile (0.8–1);
the negative impact peak is around −1.2 when the GPR is at the high quantile (0.8–1), and the WTI is at the low quantile (0–0.2)
No obvious positive impact peak;
the negative impact peak is around −1 when the GPR is at the low quantile (0–0.2), and the WTI is at the middle and low quantile (0–0.4)
The positive impact peak is around 1 when the GPR is at the low quantile (0–0.2), and the WTI is at the high quantile (0.8–1). The negative impact peak is around −1 when the GPR is at the low quantile (0–0.2), and the WTI is at the middle and low quantile (0–0.4)The positive impact peak is around 0.5 when the GPR is at the high quantile (0.8–1), and the WTI is at the low quantile (0–0.4);
the negative impact peak is around −1.54; the GPR is at the low quantile (0–0.2), and the WTI is at the middle and low quantile (0–0.4)
CPUThe positive impact peak is around 0.56 when the CPU is at the high quantile (0.8–1), and the WTI is at the mid-high quantile (0.6–0.8);
the negative impact peak is around −0.4 when the CPU is at the low quantile (0–0.2), and the WTI is at the quantile (0.2–0.4).
The positive impact peak is around 0.38 when the WTI is at the high quantile (0.9–1);
the negative impact peak is around −0.4; the CPU is at the low quantile (0–0.2), and the WTI is at the middle quantile (0.4–0.6)
The positive impact peak is around 0.8 when the CPU is at the mid-high quantile (0.6–0.8), and the WTI is at the high quantile (0.8–1);
the negative impact peak is around −1 when the EPU is at the low quantile (0–0.2), and the WTI is at the low quantile (0.2–0.3).
The positive impact peak is around 1.25 when the CPU is at the low quantile (0–0.2), and the WTI is at the high quantile (0.8–1);
the negative impact peak is around −0.3; the CPU is at the low quantile (0–0.2), and the WTI is at the middle quantile (0.4–0.6).
The positive impact peak is around 0.55; the CPU is at the high quantile (0.8–1), and the WTI is at the mid-low quantile (0–0.4);
no obvious negative impact peak
Table 8. Comparison of the impact direction of three uncertainty indexes on crude oil price under different time scales.
Uncertainty TypeImpact Direction Change and Quantile Position in D1Impact Direction Change and Quantile Position in D2Impact Direction Change and Quantile Position in D3Impact Direction Change and Quantile Position in D4Impact Direction Change and Quantile Position in D5
EPUNoneFrom the negative to the positive; the EPU is at the high quantile (0.8–0.95) and the WTI is at the low quantile (0–0.1)From the positive to the negative. The EPU is at the high quantile (0.8–0.95), and the WTI is at the low quantile (0–0.1)From the negative to the positive; change in the “N” shape. Both the EPU and the WTI are at the low quantile (0–0.2);
the EPU is at the low quantile (0–0.1), whereas the WTI is in the full stage
From the negative to the positive; the EPU is at the low quantile (0–0.1), and the WTI is at the middle and high quantile (0.6–0.8); the EPU is at the middle and high quantile (0.6–0.8), and the WTI is at the low quantile (0–0.1).
GPRNoneFrom the negative to the positive; the GPR is at the high quantile (0.8–1), and the WTI is at the low quantile (0–0.2)NoneFrom the negative to the positive, when the GPR is at the low quantile (0–0.2) and the WTI is at the middle quantile (0.4–0.6)From the negative to the positive when the GPR is at the low quantile (0–0.2) and the WTI is at the middle quantile (0.4–0.6); the GPR is at the mid-high quantile (0.6–0.8), and the WTI is at the mid-low quantile (0–0.4)
CPUIn the “M” shape, the CPU is at the low quantile (0–0.2), and the WTI is at the middle quantile (0.4–0.6)In the “M” shape, the CPU is at the low quantile (0–0.2), and the WTI is at the middle quantile (0.4–0.6)In the “M” shape, the CPU is at the low quantile (0–0.2), and the WTI is at the mid-low quantile (0.2–0.6)NoneFrom the negative to the positive when the EPU is at the high quantile (0.7–1) and the WTI is at the high quantile (0.6–0.8)
Publisher’s Note: MDPI stays neutral with regard to jurisdictional claims in published maps and institutional affiliations.

