Article

Monitoring the Microseismicity through a Dense Seismic Array and a Similarity Search Detection Technique: Application to the Seismic Monitoring of Collalto Gas-Storage, North Italy

1
Department of Physics “Ettore Pancini”, University of Napoli Federico II, 80126 Napoli, Italy
2
Dipartimento di Scienze e Tecnologie, Università degli Studi del Sannio, 82100 Benevento, Italy
3
Istituto Nazionale di Oceanografia e di Geofisica Sperimentale-OGS, 34010 Sgonico, Italy
4
Istituto Nazionale di Geofisica e Vulcanologia, Sezione Napoli-Osservatorio Vesuviano, 80125 Napoli, Italy
*
Author to whom correspondence should be addressed.
Energies 2022, 15(10), 3504; https://doi.org/10.3390/en15103504
Submission received: 25 March 2022 / Revised: 27 April 2022 / Accepted: 6 May 2022 / Published: 11 May 2022

Abstract

:
Seismic monitoring in areas where induced earthquakes could occur is a challenging topic for seismologists due to the generally very low signal to noise ratio. Therefore, the seismological community is devoting several efforts to the development of high-quality networks around the areas where fluid injection and storage and geothermal activities take place, also following the national induced seismicity monitoring guidelines. The use of advanced data mining strategies, such as template matching filters, auto-similarity search, and deep-learning approaches, has recently further fostered such monitoring, enhancing the seismic catalogs and lowering the magnitude of completeness of these areas. In this framework, we carried out an experiment where a small-aperture seismic array was installed within the dense seismic network used for monitoring the gas reservoir of Collalto, in North Italy. The continuous velocimetric data, acquired for 25 days, were analysed through the application of the optimized auto-similarity search technique FAST. The array was conceived as a cost-effective network, aimed at integrating, right above the gas storage site, the permanent high-resolution Collalto Seismic Network. The analysis allowed to detect micro-events down to magnitude Ml = −0.4 within a distance of ~15 km from the array. Our results confirmed that the system based on the array installation and the FAST data analysis might contribute to lowering the magnitude of completeness around the site of about 0.7 units.

1. Introduction

Monitoring the seismicity in areas of underground hydrocarbon exploitation and fluid injection and storage is a crucial task considering the significant socio-economic implications in case of induced earthquakes [1]. Seismic monitoring aims to characterize the spatio-temporal evolution of the seismicity in a sub-surface volume where industrial exploitation activities take place with the two following goals: (i) discriminating the natural seismicity from the anthropogenic one (i.e., induced), (ii) intercepting variations in the background seismicity rate that, if needed, will guide the re-modulation, interruption, and restart of industrial activities. Indeed, tracking the microseismicity in time after fluid injection and accurately locating it can allow one to detect pore pressure changes and intercept migration fluid patterns [2].
An exhaustive review of concepts, methods, and physical bases concerning the monitoring of induced seismicity, possibly deploying small aperture seismic arrays, is provided by [3] and references therein. In this framework, [4] realized a feasibility study for seismic networks aiming to monitor the induced seismicity according to the performance requirements in the Italian guidelines [5]. Such a study considered several network layouts, with different geometries and station densities, also including the use of seismic arrays with a maximum aperture size of 1 km. The results indicate that, for low noise levels, integrating seismic networks with small-scale arrays can achieve a magnitude detection threshold close to Mw 0 and small location errors (i.e., a few hundred meters for depths down to 8 km).
For this reason, during the last years, efforts from the seismological community have focused on the development of cost-effective seismic sensors that can be combined with high-quality observing systems. Furthermore, efforts have been made in the application of innovative data mining strategies for improving the detection capability.
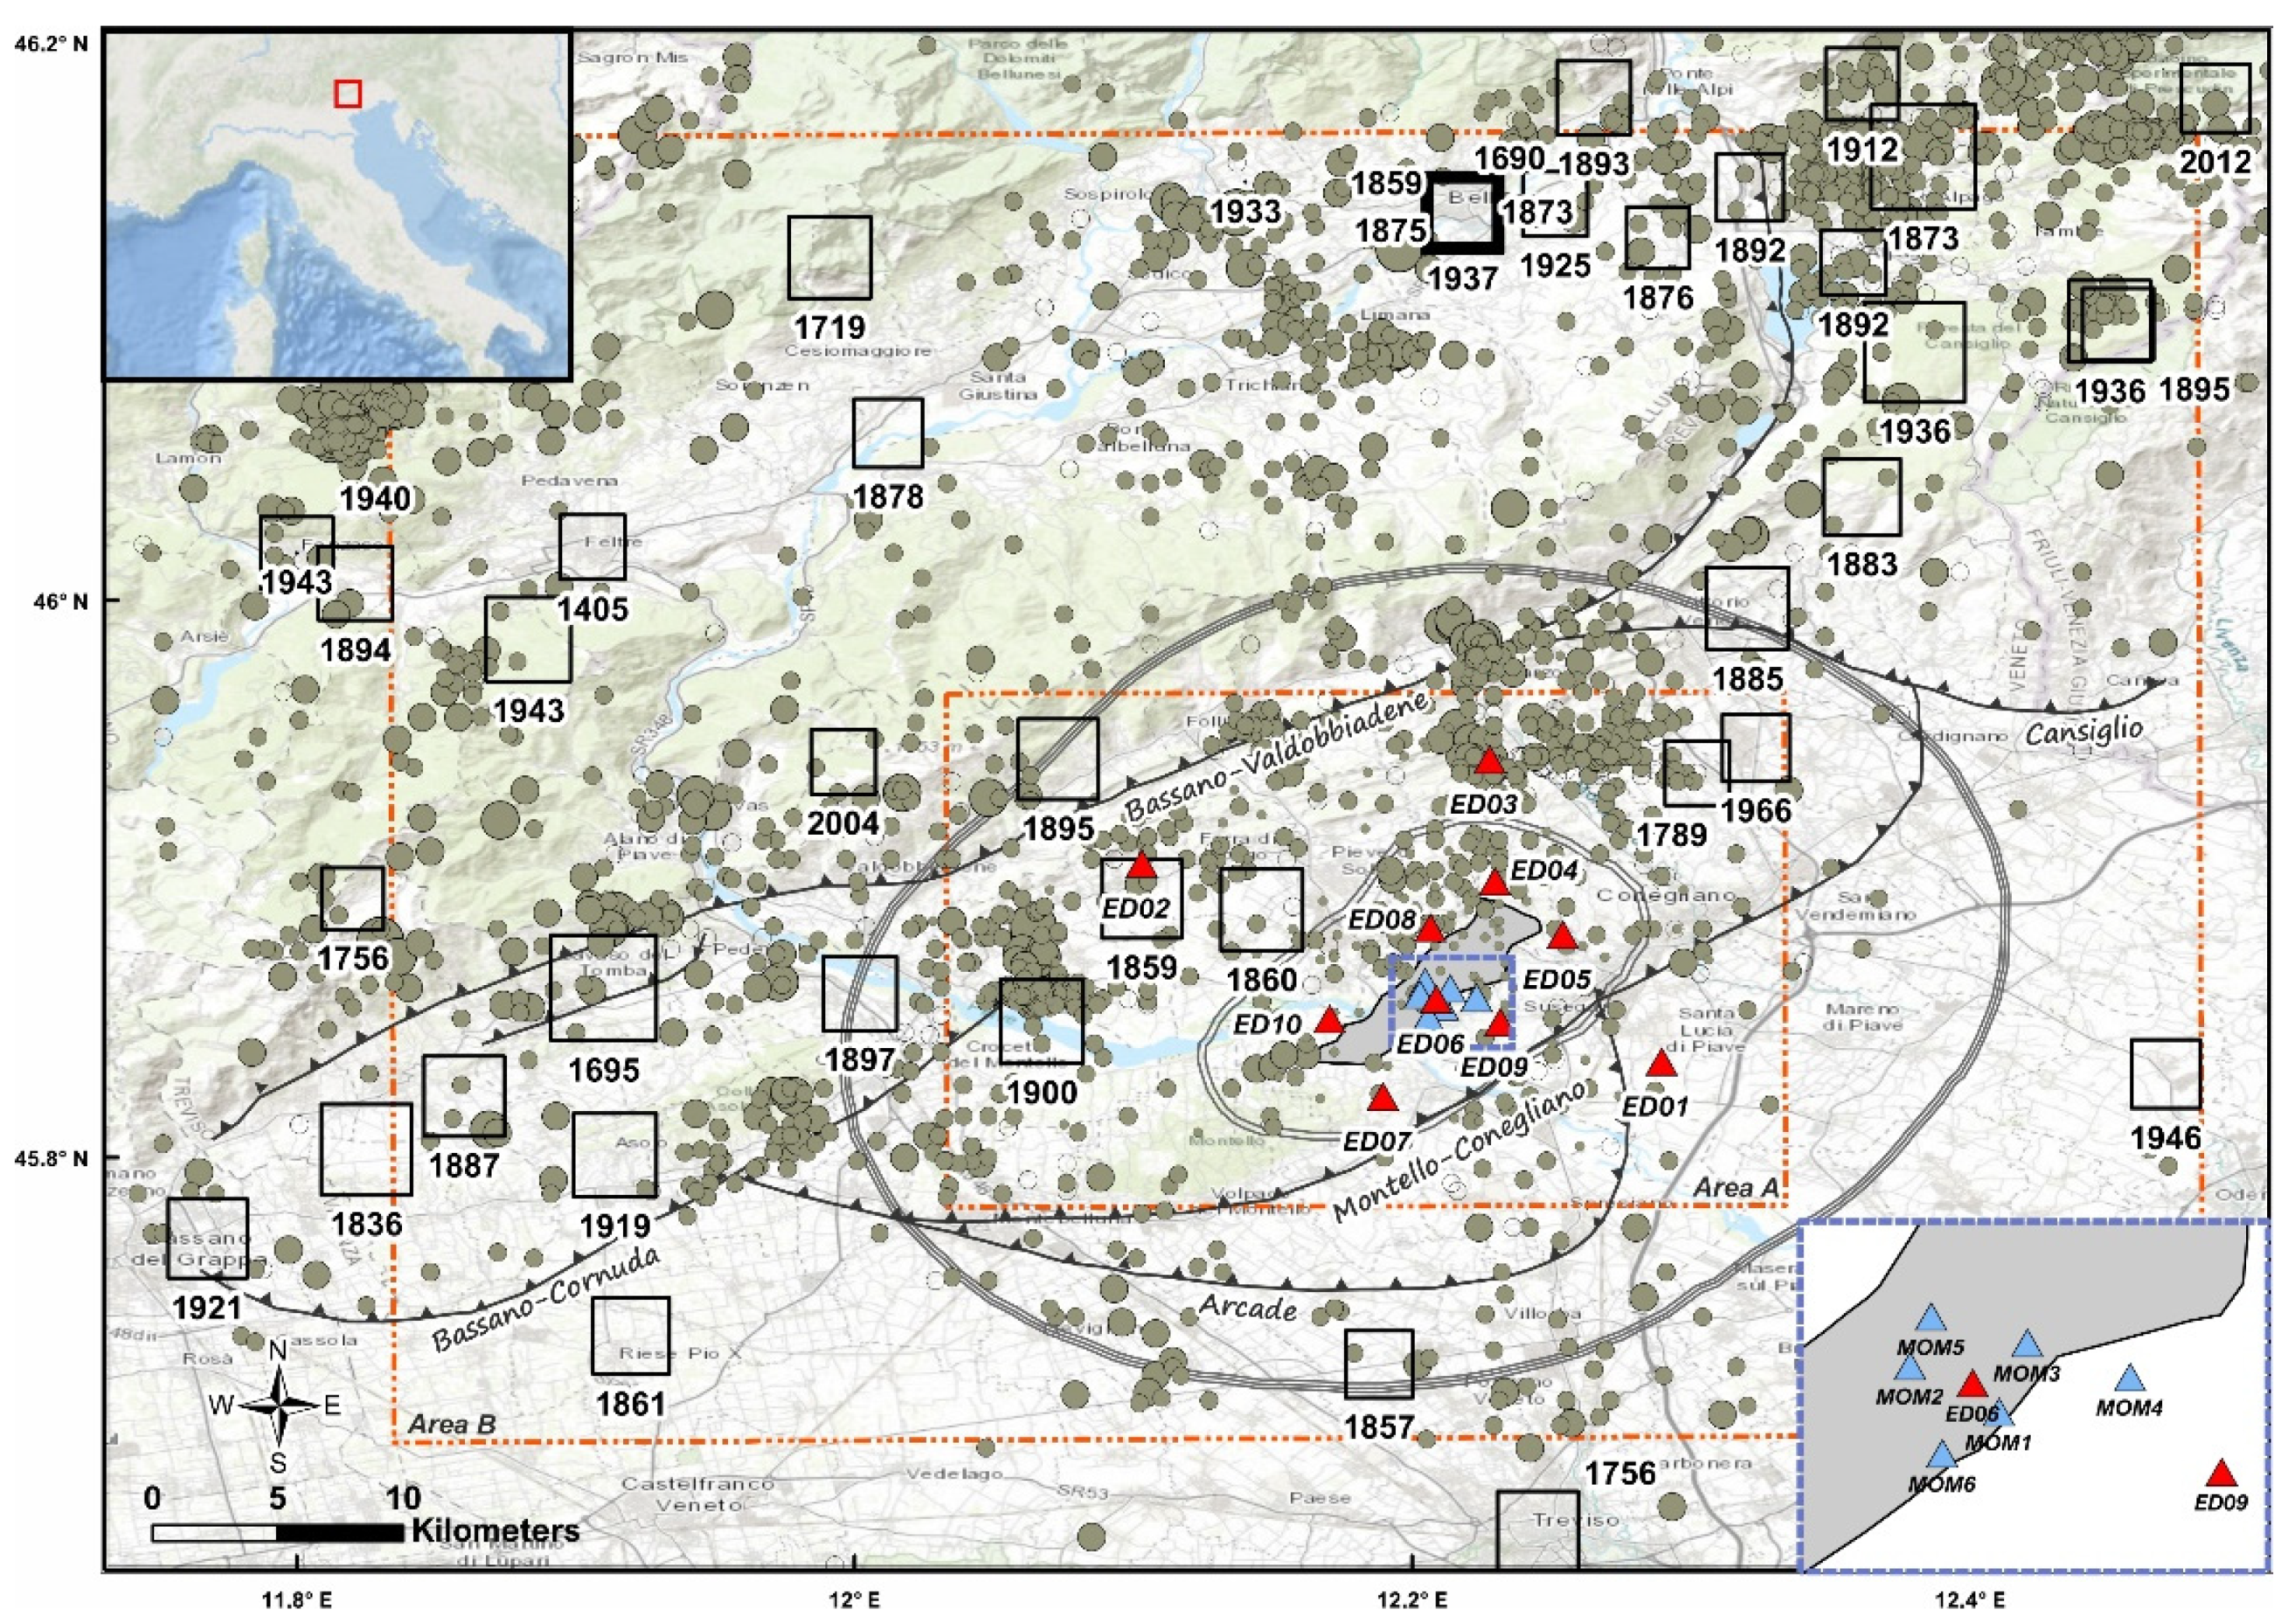
An example of a high-sensitivity network is the one deployed around the Collalto underground gas storage (UGS) in north-eastern Italy [6]. The Collalto seismic network (Rete Sismica di Collalto, RSC) aims at monitoring the natural and induced seismicity potentially related to the industrial activity of the Collalto gas storage facility. It is composed of ten seismological stations equipped with borehole seismometers with periods varying between 10 s and 120 s operating at a sampling rate of 200 Hz, and accelerometric sensors at the surface of five sites. This network is managed by Istituto Nazionale di Oceanografia e di Geofisica Sperimentale (OGS) on behalf of Edison Stoccaggio S.p.A., which is the holder of the storage concession, and it has been the first case of industrial seismic monitoring in Italy managed by a public research institute. The RSC has been fully operating since the 1 January 2012, and it represented an important experience for the Italian guidelines for monitoring the industrial activities associated with underground resource exploitation, which were developed after the destructive earthquake that struck the Emilia region in 2012 [5]. The OGS guarantees the seismic (real-time and off-line) monitoring and network maintenance service, as well as any related research activity, delivering full data and transparent information through the RSC website (rete-collalto.crs.inogs.it). Publicly available data include full waveform data and the earthquake catalog, which is updated every six months. More details about the network deployment and features can be found in [6].
The Collalto gas field is a natural, depleted reservoir with a working gas storage capacity of approximately 600 million standard m3 (total capacity of more than 900 million standard m3) covering an area of almost 89 km2 [7]. The field is equipped with 17 active wells through which the gas is seasonally injected into the reservoir during the April–October period and extracted during the November–March period [6,8]. In ten years of operation, the Collalto seismic network recorded thousands of microearthquakes of natural origin in the surrounding areas, reaching a completeness magnitude Mc for the whole area of 0.6 and 1.2 for the local [8] and moment [9] magnitude, respectively, and of 0.1 for a smaller region around the reservoir [10]. The ten-year long monitoring highlighted that no events occurred close to the gas-reservoir and no clear correlation exists between seismicity in a broader area and the injection and extraction activity [8].
The efficiency of seismic monitoring can be further enhanced by data mining approaches, capable of enriching earthquake catalogs, lowering the Mc threshold near to 0 or below, and hence allowing to better investigate the mechanical features of the spatio-temporal seismicity evolution. Most of these methods [11,12,13,14] are generally referred to as template matching. They detect micro-events within a continuous data stream through cross-correlation of the waveforms associated with some previously identified earthquakes. As an example of the efficiency of this approach, [15] retrieved an extended catalog of ~3500 earthquakes for the 2013 induced seismic sequence at the Castor injection platform offshore Spain, which includes three earthquakes of magnitude 4.1. This final catalog significantly improved the official IGN and Ebro catalogs, reporting 536 and 982 earthquakes respectively. Thanks to this catalog [15], the authors were able to study the progressive fault failure and unlocking, triggered by pore pressure diffusion and characterized by the migration of seismicity away from the injection point. Moreover, the detection through the recognition of some peculiar seismic waveform features is now being developed increasingly by means of advanced deep learning algorithms [16].
A similarity search can be carried out also without the use of template events, using auto-correlation techniques that correlate different portions of the continuous data stream [17,18,19,20,21]. These methods are particularly efficient in areas characterized by a low level of seismicity with few events available in seismic catalogs. Nevertheless, the computational costs are much more expensive due to the need for mutual comparison between all data portions. The FAST technique (fingerprinting and similarity thresholding [22,23]) represents an optimized auto-correlation approach, based on the compression of waveforms in key discriminative features, using binary fingerprints, and the a priori grouping of similar fingerprints to reduce the order of magnitude of the performed comparisons. The FAST technique playback on the Hector Mine earthquake (1999, Mw 7.1, [24]) revealed an intense foreshock sequence with 50 detected events with a minimum magnitude of −0.4. Recently, the same approach was applied to the Southern Italy, Rocca San Felice sequence (3–6 July 2020, maximum magnitude Ml = 3.0), allowing to increase by a factor of 10 the number of detected events while lowering by about 1 point in magnitude the completeness threshold when compared to the released Irpinia Seismic Network catalog [25,26].
A comparison between the FAST technique and a standard template matching approach [27] has been recently proposed for a very active seismic sequence (~14 k events in three months), potentially induced by wastewater injection, that occurred in Arkansas, USA in 2010 [28]. In this work, the authors showed that the two approaches lead to similar results in terms of detections. Although the large number of templates allows the template matching to slightly overperform, the events only detected by FAST are characterized by smaller average magnitude values.
In this work, we aim to show how and to what extent a small aperture, low-cost seismic array combined with an advanced microseismicity detection technique can locally improve, e.g., in terms of magnitude of completeness, the performance of a permanent, high-quality, less-dense seismic network, enhancing the local earthquake catalog. We used the data collected during an experiment that integrated the array monitoring system for induced seismicity application, proposed by [
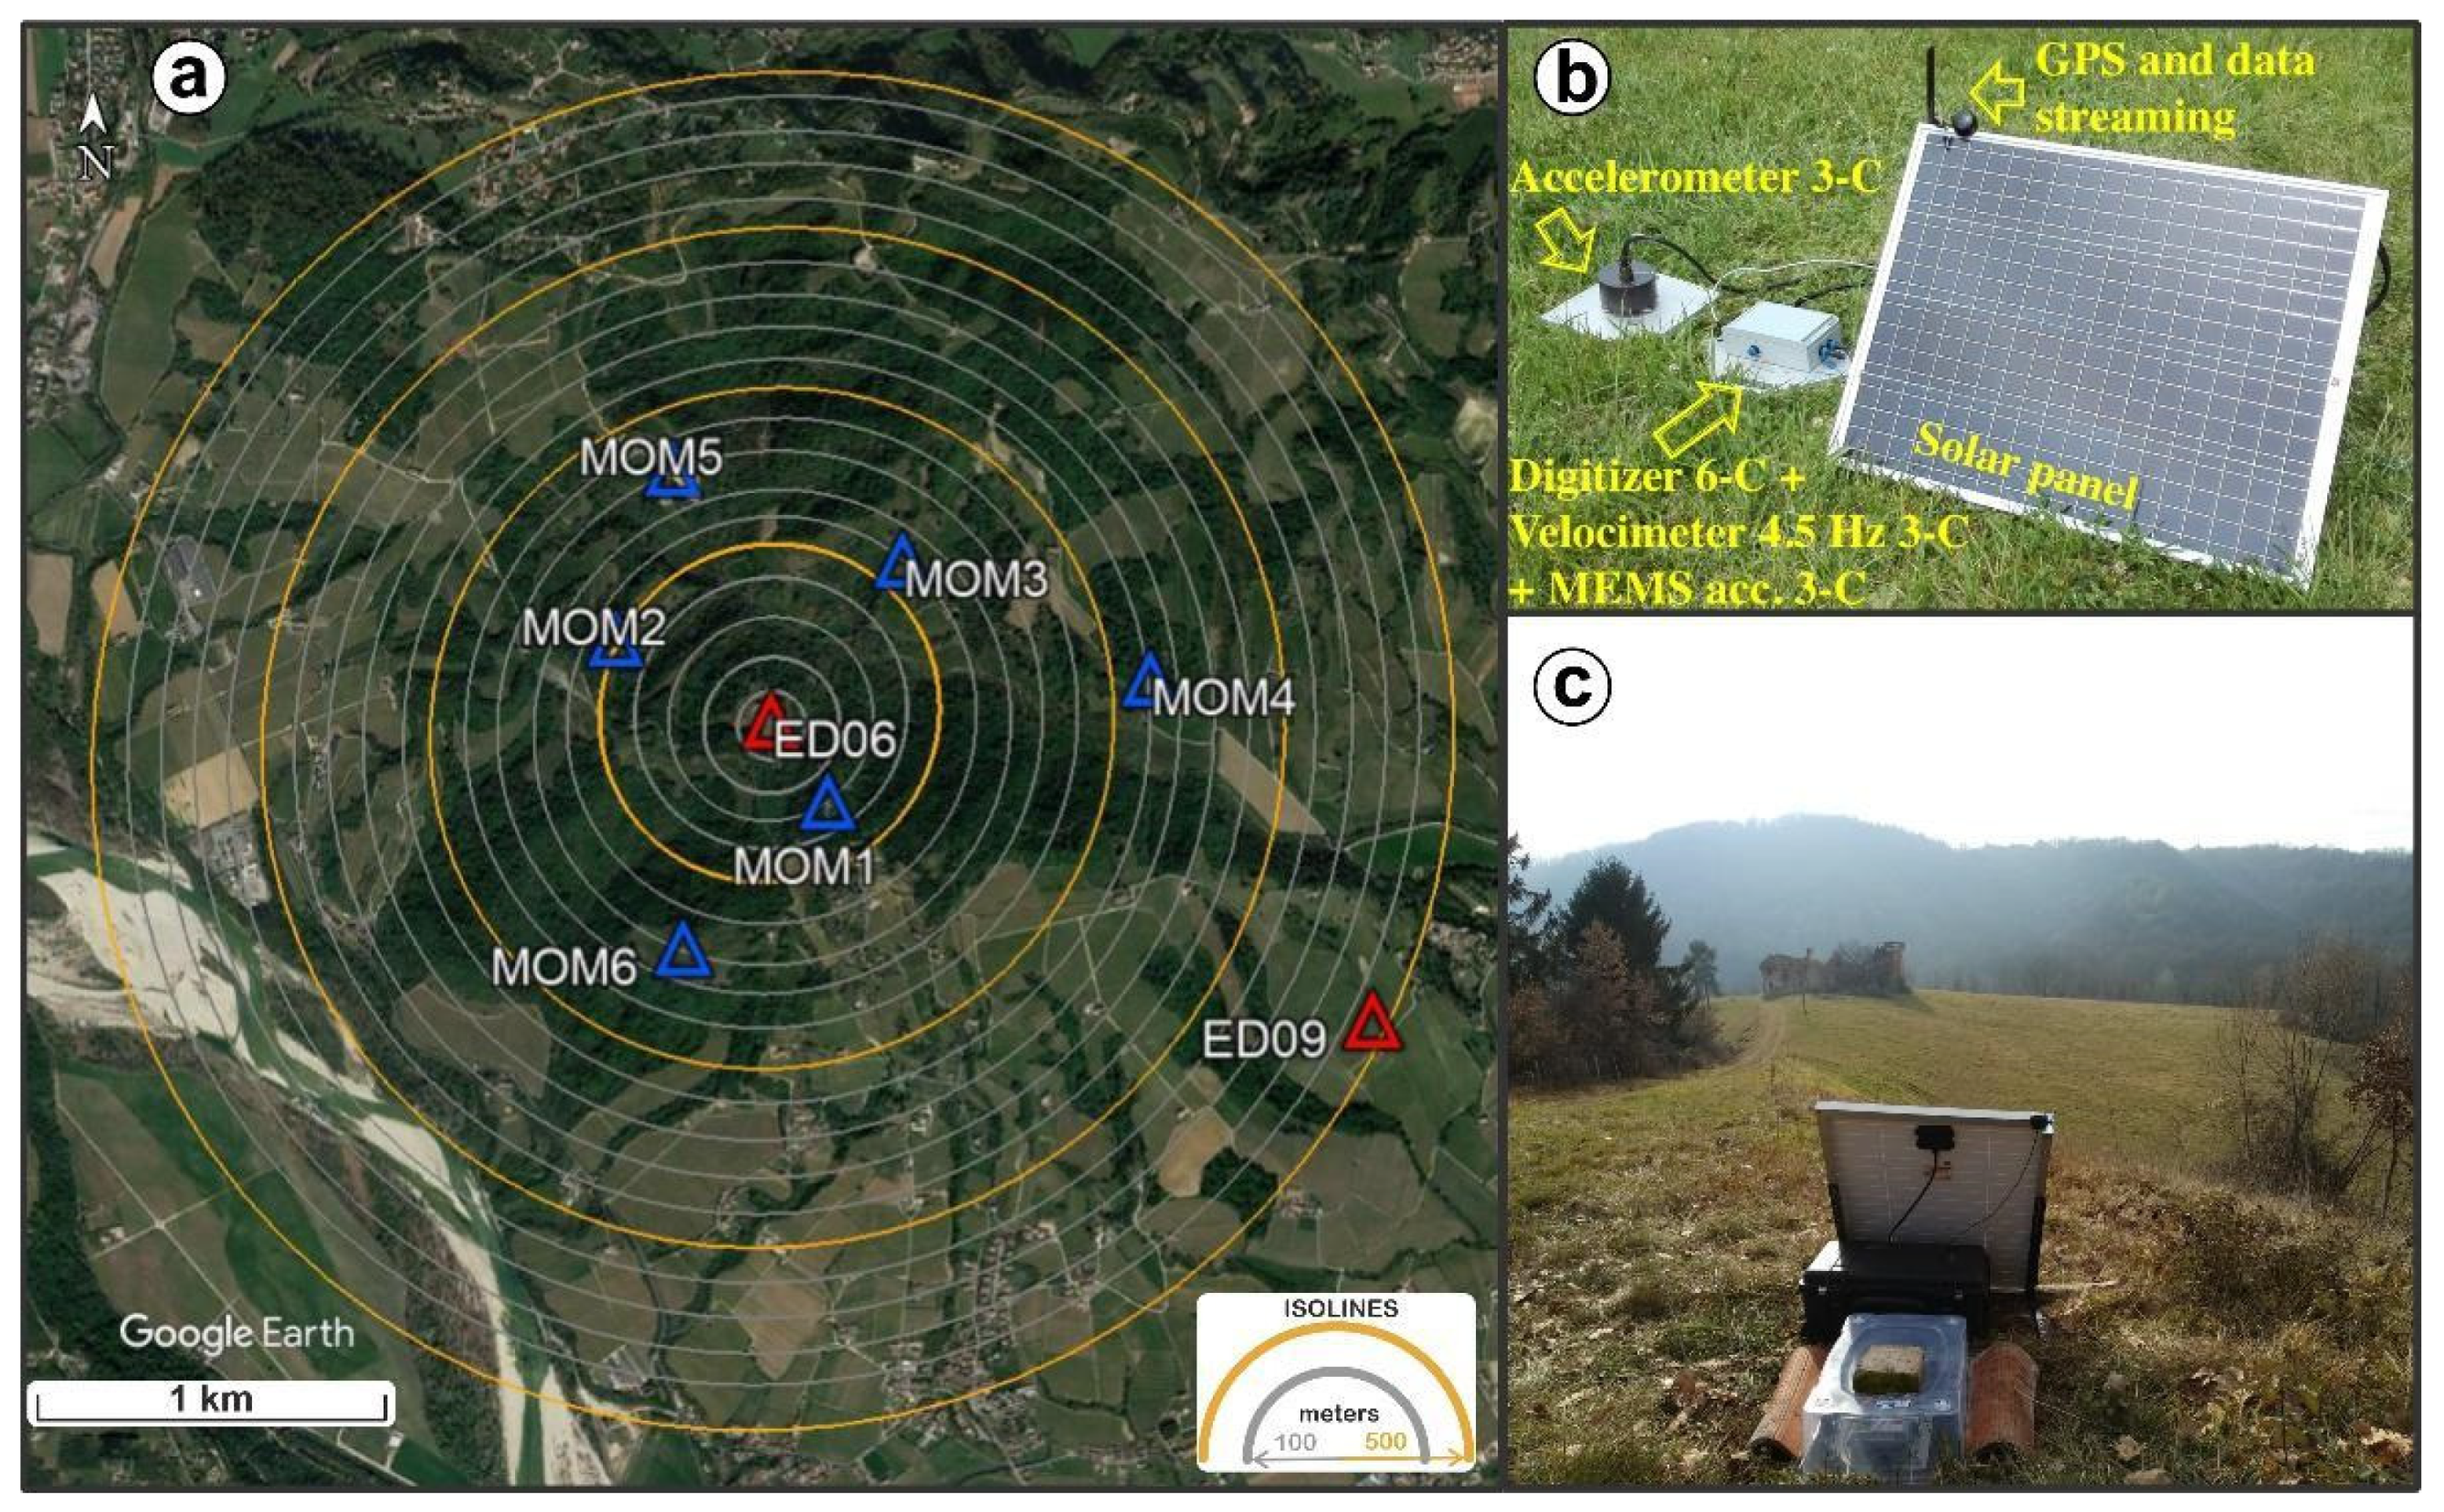
4], with the data mining approach implemented in the FAST technique. For this purpose, the installed array, with a 2 km maximum aperture, was composed of eight seismic stations located in the area near the gas storage site in Collalto. The temporary network was installed in wintertime and was operative for about one month.
We first describe the geology of the investigated area. Then, we provide details about the experimental and methodological setup. Second, the results relevant to the number of detected events and their features will be presented and discussed. Finally, conclusions are presented.

2. Experiment

2.1. Seismotectonic Setting

The underground gas storage of Collalto is located in north-eastern Italy, within the Adria-European collision zone where the Plio-Quaternary front of the Southern Alps is still active. The main tectonic structures are related to the origin of the SSE-verging Neogene–Quaternary eastern South-Alpine chain from the Adria-European continental margin collisions [29,30]. Thrusts and foreland folds (from Serravallian to Messinian) with S-vergence and WSW–ENE trends show an imbricate fan geometry with the main compressive stress axis oriented along NNW–SSE direction. The age and the activity of the thrust sheet migrated from north to south along the eastern Southern Alps showing the external younger thrust front in the foothill range of the mountain belt or buried in the foreland deposits, as in the Venetian region [30,31]. The Collalto gas storage is a stratigraphic/structural geological trap along the Montello anticline with an area of about 10 × 2.5 km2. Several productive reservoirs, made up of calcareous sandstone with shales (Arenaria of Vittorio Veneto Formation) a few meters thick, are located at depth of 1200–1400 m [8,32]. The Montello-Conegliano thrust is part of the active, compressive external front of the eastern Southern Alps and it is bounded by the Bassano-Cornuda thrust to E, the Cansiglio thrust to NE, the Bassano-Valdobbiadene to N, and the Arcade thrust to S (Figure 1) [8,31]. The activity of these structures is testified by geological, geodetic, and seismological studies showing a compression rate of 1–2 mm/yr [33], according to N–S or NNW–SSE convergence and a low magnitude (M < 4) instrumental seismicity [6,8]. The active thrusts are kinematically independent and are rooted in the mid-crust (15–20 km) as evidenced by seismic profiles and seismicity [29].
In historical times, the Montello area (Figure 1) was hit by several earthquakes with I0 > 4. Intermediate size earthquakes, such as the 1789, 1859, 1860, 1900, and 1966 events (I0 < 6–7), can be associated to the Montello-Conegliano seismogenic source (CPT15, [34]). The most destructive earthquake, the 1695 Asolano earthquake (I0 = 10), occurred eastward and can be related to the activity of the Bassano–Cornuda thrust [30]. The instrumental seismicity of the last 50 years is moderate and occurred at depths of 15–20 km with magnitude < 4.5 (Figure 1). The fault plane solutions show reverse to strike-reverse kinematics. Since the end of 2011, the dense Collalto Seismic Network (RSC, Figure 1), deployed around the underground gas storage to monitor the associated industrial activities, has significantly improved the capability to detect the seismicity, lowering the regional and national monitoring thresholds below Ml 1.0. [8], to show that the seismicity depicts the Montello-Conegliano active thrust as a gently NE-dipping plane, locally interrupted by minor faults, with earthquakes located at 5–13 km depth. In 6 years (2012–2017), [8] analysed 1635 earthquakes with −0.8 ≤ ML ≤ 4.5 with strongest events located north-eastward, outside the principal monitored region, in a 20 km wide square area denoted as the area A in [6] (see the smallest red dashed square in Figure 1). The largest events are spatio-temporally clustered in seismic sequences that occurred near Sedico-Belluno, Vidor-Valdobbiadene, Cavaso del Tomba-Segusino (with 3.3 < Mmax < 3.8), and in the Pieve di Soligo, Tarzo-Vittorio Veneto and Alpago areas (with 2.0 < Mmax < 3.0; Figure 1). The 2012–2017 earthquake catalogue reported in [8] revealed that no earthquake occurred in the volume surrounding the Collalto gas reservoir for a spatial range of 3 km, in the “inner domain” as described by the protocols stated by the Italian Ministry of the Economic Development (MiSE) monitoring guidelines [5]. Here, no seismicity is located at depths shallower than 5 km and within 13 km from the gas storage boundary (“external domain”). Moreover, the seismicity recorded in 6 years has a magnitude smaller than 2.0, except for one event. It is important to note that the Collalto seismic network ensures a high detection capability for the area, providing a completeness magnitude ranging from Ml 0.1 to Ml 0.6 inside the extended domain [8,9,10].
Different ideas exist about the seismic potential of the fault structures forming the compressive external front of the eastern Southern Alps. In particular, the seismic role of the Montello-Conegliano thrust is still debated as well as its fault plane continuity or segmentation. For some authors [30,35,36], it is possible to originate earthquakes with M > 6.5 based on surface geological and structural data, while they can be characterized by creeping behaviour with small inter-seismic periods as hypothesized by other authors based on rheological modeling [37] and strain-rate or seismicity observations [8,33].

2.2. Experimental Setting

We designed the temporary array field experiment in the Collalto underground gas storage area to test its potential in detecting natural/induced micro-seismicity (Figure 2a). The objectives of the field experiment are: (1) to design and test a prototype implementation of a small dimension seismic array integrated within the Collalto seismic network; (2) to assess the performance the seismic array during the monitoring experiment when combined with modern powerful algorithms to detect micro-seismicity signals buried into ambient noise.
For the Collalto experiment, we designed a six-component (6C) seismic array made up of 6 smart seismic stations (MOMA, Figure 2b) capable of recording the ground motion with high resolution and real-time data transfer to a data acquisition centre, complemented by two stations of the RSC (ED06 equipped with a 120 s broad-band velocimeter at 5 m depth; ED09 equipped with an extended band seismometer at 14.6 m depth.) Each MOMA station is equipped with a 6C high dynamic range (32-bit) A/D-converter with SeedLink data transmission protocol (latency < 0.3 s) capability, a 3C geophone (4.5 Hz), and a 3C MEMS accelerometer. Since in this work we are interested in detecting low-amplitude micro-earthquakes signals, almost fully buried into the noise, only the velocimetric data are analysed. The data are recorded in MiniSeed format and stored on an internal compact memory flashcard. Each seismic station is equipped with a 12 V solar panel that ensures the recharge of a battery and an antenna for the radio communication to a local control system (Figure 2c). The MOMA seismic station was designed and manufactured by RISS company (Realtime Innovative Solutions for Seismology, Via Cinthia 26, 80126 Napoli, Italy), an academic spin-off of the Physics Department of the University of Napoli Federico II.
The seismic acquisition started on 7 January 2019 and lasted approximately one month. The installation sites were carefully chosen in order to get: (1) an adequate homogeneous coverage of the area of the underground gas reservoir reducing the interstation distances with respect to the RSC; (2) a small azimuthal gap. All the stations were positioned within a radius of 2 km over the gas field area following an irregular geometry (Figure 2a).
We remind that both RSC stations are equipped with borehole instruments (ED06 has a 120 s broad-band velocimeter at 5 m depth; ED09 has an extended band seismometer at 14.6 m depth). Those stations sample data at 200 Hz. For the MOMA stations, the sampling rate was set at 250 Hz.

3. Detection Technique

To detect micro-earthquakes at the level of the seismic noise, we applied the FAST technique (fingerprint and similarity thresholding, https://github.com/stanford-futuredata/FAST [22] accessed on 10 July 2020) to the 25 days (from 7 to 31 January 2019) of the continuous velocity data stream recorded during the experiment.
FAST is a uninformed self-similarity technique that converts time-domain waveforms into fingerprints, containing key discriminative features of earthquakes, and then performs an optimized similarity search to individuate couples of similar fingerprints. FAST features good performances both in computational efficiency and in detection sensitivity since it can reach the accuracy of autocorrelation methods while requiring lower runtime [22,23]. The advantage of using FAST is that it does not require templates to search for similar events. Hence, it is particularly efficient in areas characterized by low seismicity, such as the gas-storage area of Collalto considered in this study.
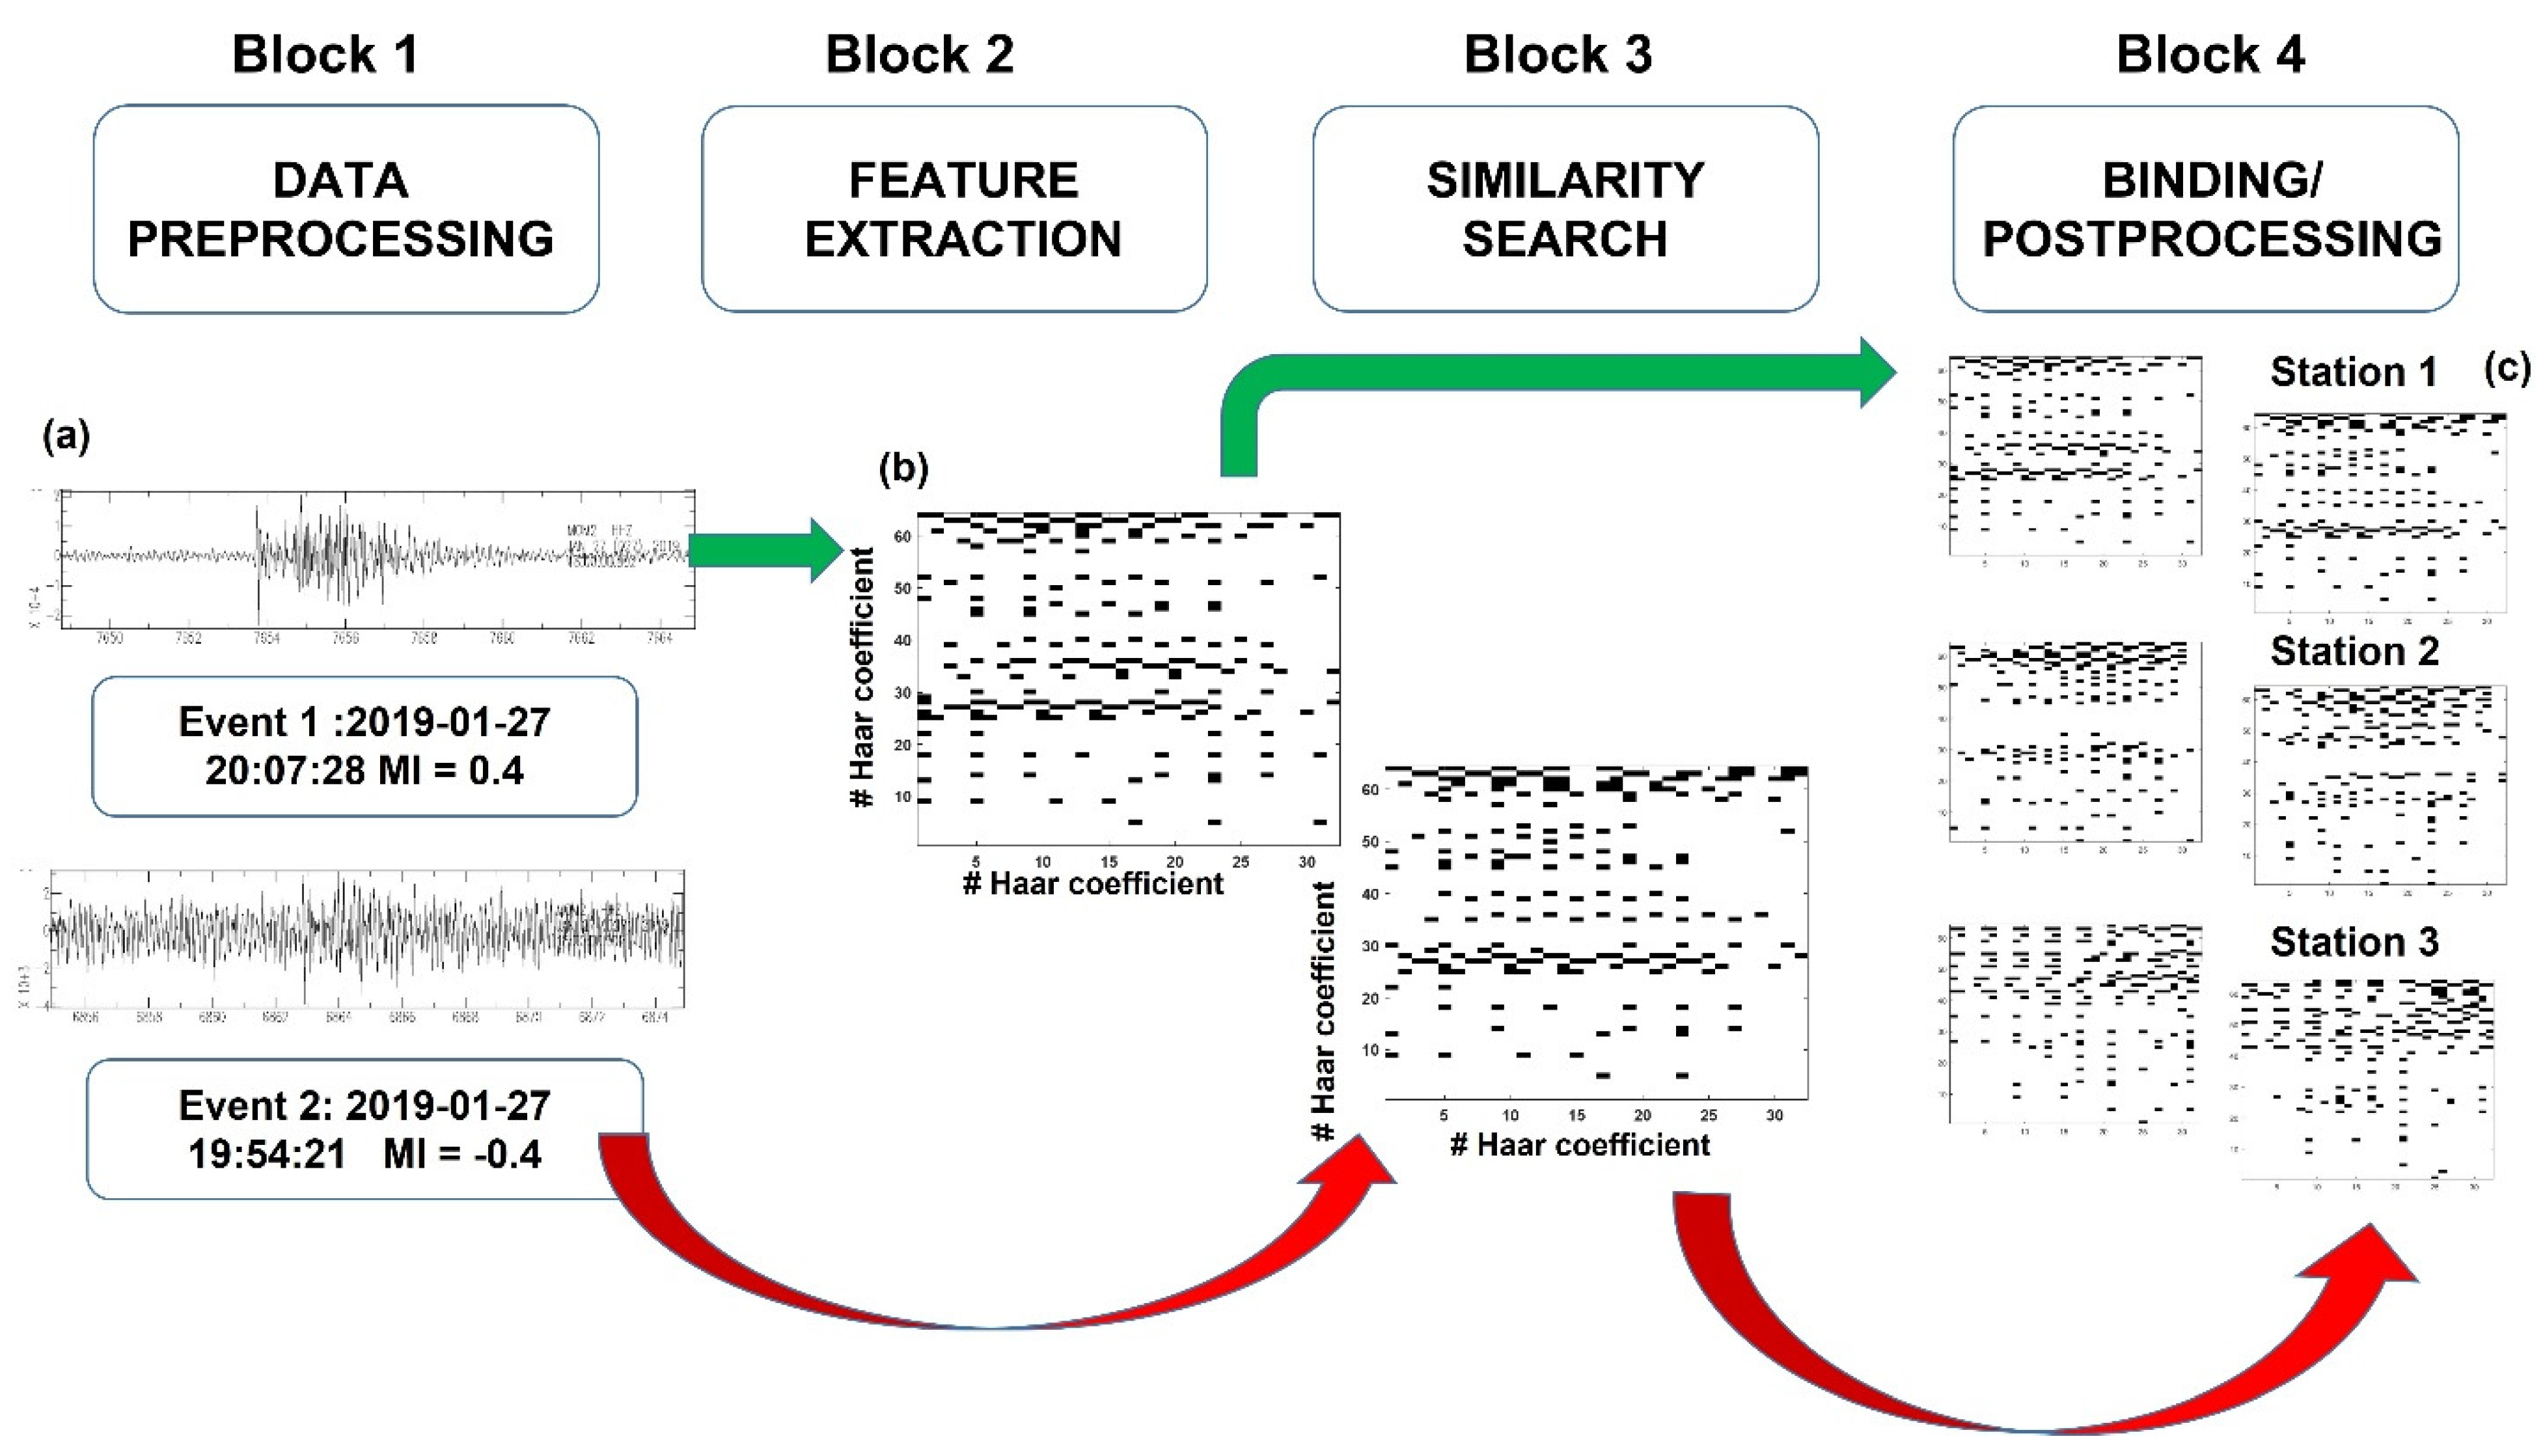
The FAST workflow consists of four steps: (a) data pre-processing; (b) feature extraction, in which time series are compressed into binary fingerprints; (c) similarity search, with similar fingerprints gathered in a database; (d) network association, where single station detections are bound, and post-process analysis, where false events are discarded and the magnitude of the detected earthquakes is estimated.
In the pre-processing phase (Block 1 in the workflow of Figure 3), gaps and zero in the data stream are replaced with Gaussian uncorrelated noise. Moreover, the signal at all the stations is bandpass filtered between 1 and 20 Hz using a 2-poles acausal Butterworth filter and decimated to 50 Hz to dump the high frequency noise and improve computational efficiency.
In the feature extraction phase (Block 2 in Figure 3), 12.4 s long signals from single components are converted into spectrograms where each spectrum is built for 6.0 s of signal with a shift of 0.2 s, and the frequency range 1–20 Hz is subdivided in 32 equally spaced bins. The resulting spectrogram has 32 × 32 samples. Two consecutive spectrograms are shifted in time with a lag of 1.0 s [22]. Each spectrogram is then compressed applying the Haar wavelet transform and maintaining only the 200 out of 1024 coefficients that most detach from their daily average. This compression is shown to preserve the seismic features in the fingerprints under the assumption that the daily average is representative of the ambient noise. The selected coefficients are then binarized, following the scheme of [22] to generate final fingerprints, each consisting of 2048 bits.
In the similarity search step (Block 3 of Figure 3), FAST uses the Jaccard similarity to compare the fingerprints. Such a comparison is reduced to a limited number of fingerprint characteristics extracted through the application of a Min-Hash independent permutation algorithm [38]. In the bottom panels (a) and (b) of Figure 3 waveforms from two events (14 and 15 in Table 1) and the associated fingerprints are plotted. The shown fingerprints are characterized by a high Jaccard similarity, and hence will be inspected at following steps for event declaration.
The fingerprint pairs extracted at component level are combined and associated at the network level, allowing time delays compatible with the wave propagation within the network (Figure 3 Block 4 and panel c). At this stage, we select transients only if their similarity is retrieved at least at 4 stations. Since one of the main issues when applying FAST trying to reduce its detection reliability is the large number of false declared events [24,28], the transient list is further investigated in terms of first arrival times and duration. For the Collalto array, several candidate events forming a family of candidate events were removed because of low apparent velocity across the array, long duration, and almost monochromatic character. These characteristics let us guess that such transients were related to anthropic activity and/or weather effects. Finally, local earthquakes from regional and teleseismic events separation is carried out according to the transients’ duration. After this last step, the catalog was further enhanced, including all the transients associated at less than 4 stations but being similar at least at 2 stations. The final catalog provided by FAST is a detection list without locations. Some of the detected events are reported in the RSC catalog for the larger events (hereinafter, reference events). This information concerning the reference events is used, hence, to assume that smaller events featuring low signal-to-noise ratio and belonging to the same family of the larger ones are co-located with them.
For those small events that were declared similar to an event included in the RSC catalog, we computed the magnitude of these latter events as:
M l = M l r e f + log 10 ( A A r e f )
where A is the maximum peak-to-peak displacement amplitude on the non-filtered horizontal components of the target event while M l r e f and A r e f are the magnitude and the maximum peak-to-peak displacement amplitude of the reference event, respectively. The magnitude values obtained at the stations where FAST declared the similarity are then averaged to obtain the final estimation.

4. Results

We applied the analysis described in Section 3 and detected 38 transients. Among them, 20 transients were discarded during the post-processing association phase due to unrealistic apparent velocity within the array. Indeed, they are characterized by signals having short durations ( t d < 20   s ) and a large difference between the arrival times at the different array nodes ( max { t 0 j t 0 i } > 10   s ). To verify algorithm performance, we visually inspected them, and we confirmed that these waveforms were not seismic signals being characterized by either monochromatic wave trains or the superposition of two monochromatic components at close frequencies. At the end of the analysis, we obtained a list of 18 detections. These findings confirm that the implemented procedure overcomes the FAST limitation concerning the discrimination between real and false events for the array experimental setup.
It is worthwhile to highlight that, during the experiment, a seismic sequence occurred in the district of Ravenna, at an epicentral distance of about 230 km from the array centre, with the largest event having magnitude Mw 4.3. Inspecting the detected events, FAST declared five different transients that can be associated with three events of this sequence. The number of transients (5) is larger than the number of associated events (3) since two events were detected twice (FAST separately declared body-waves and later surface waves).
Our final catalog is composed of 16 seismic events (Table 1). These events are ordered according to their origin time, and with the associated location and magnitude as extracted from the INGV or the RCS catalog, when available. The last column of Table 1 indicates the events, to which FAST declared the similarity.
We recognize seven local events that occurred in the area of Collalto, while the remaining ones are regional or teleseismic events.
The three events belonging to the Ravenna sequence (ev. number 05-06-07 in Table 1) were detected because their waveforms were similar to each other (Figure S1 in the Supplementary Material). The same condition holds for three regional events (ev. 01-02-11 in Table 1, Figure S2 in the Supplementary Material) that originated northward of the array at distances ranging from ~45~135 km, and for three teleseisms (ev. 08-12-16 in Table 1, Figure S3 in the Supplementary Material). These latter events were declared due to the similarity in the frequency content of surface waves recorded at the array stations, within the sampled frequency band.
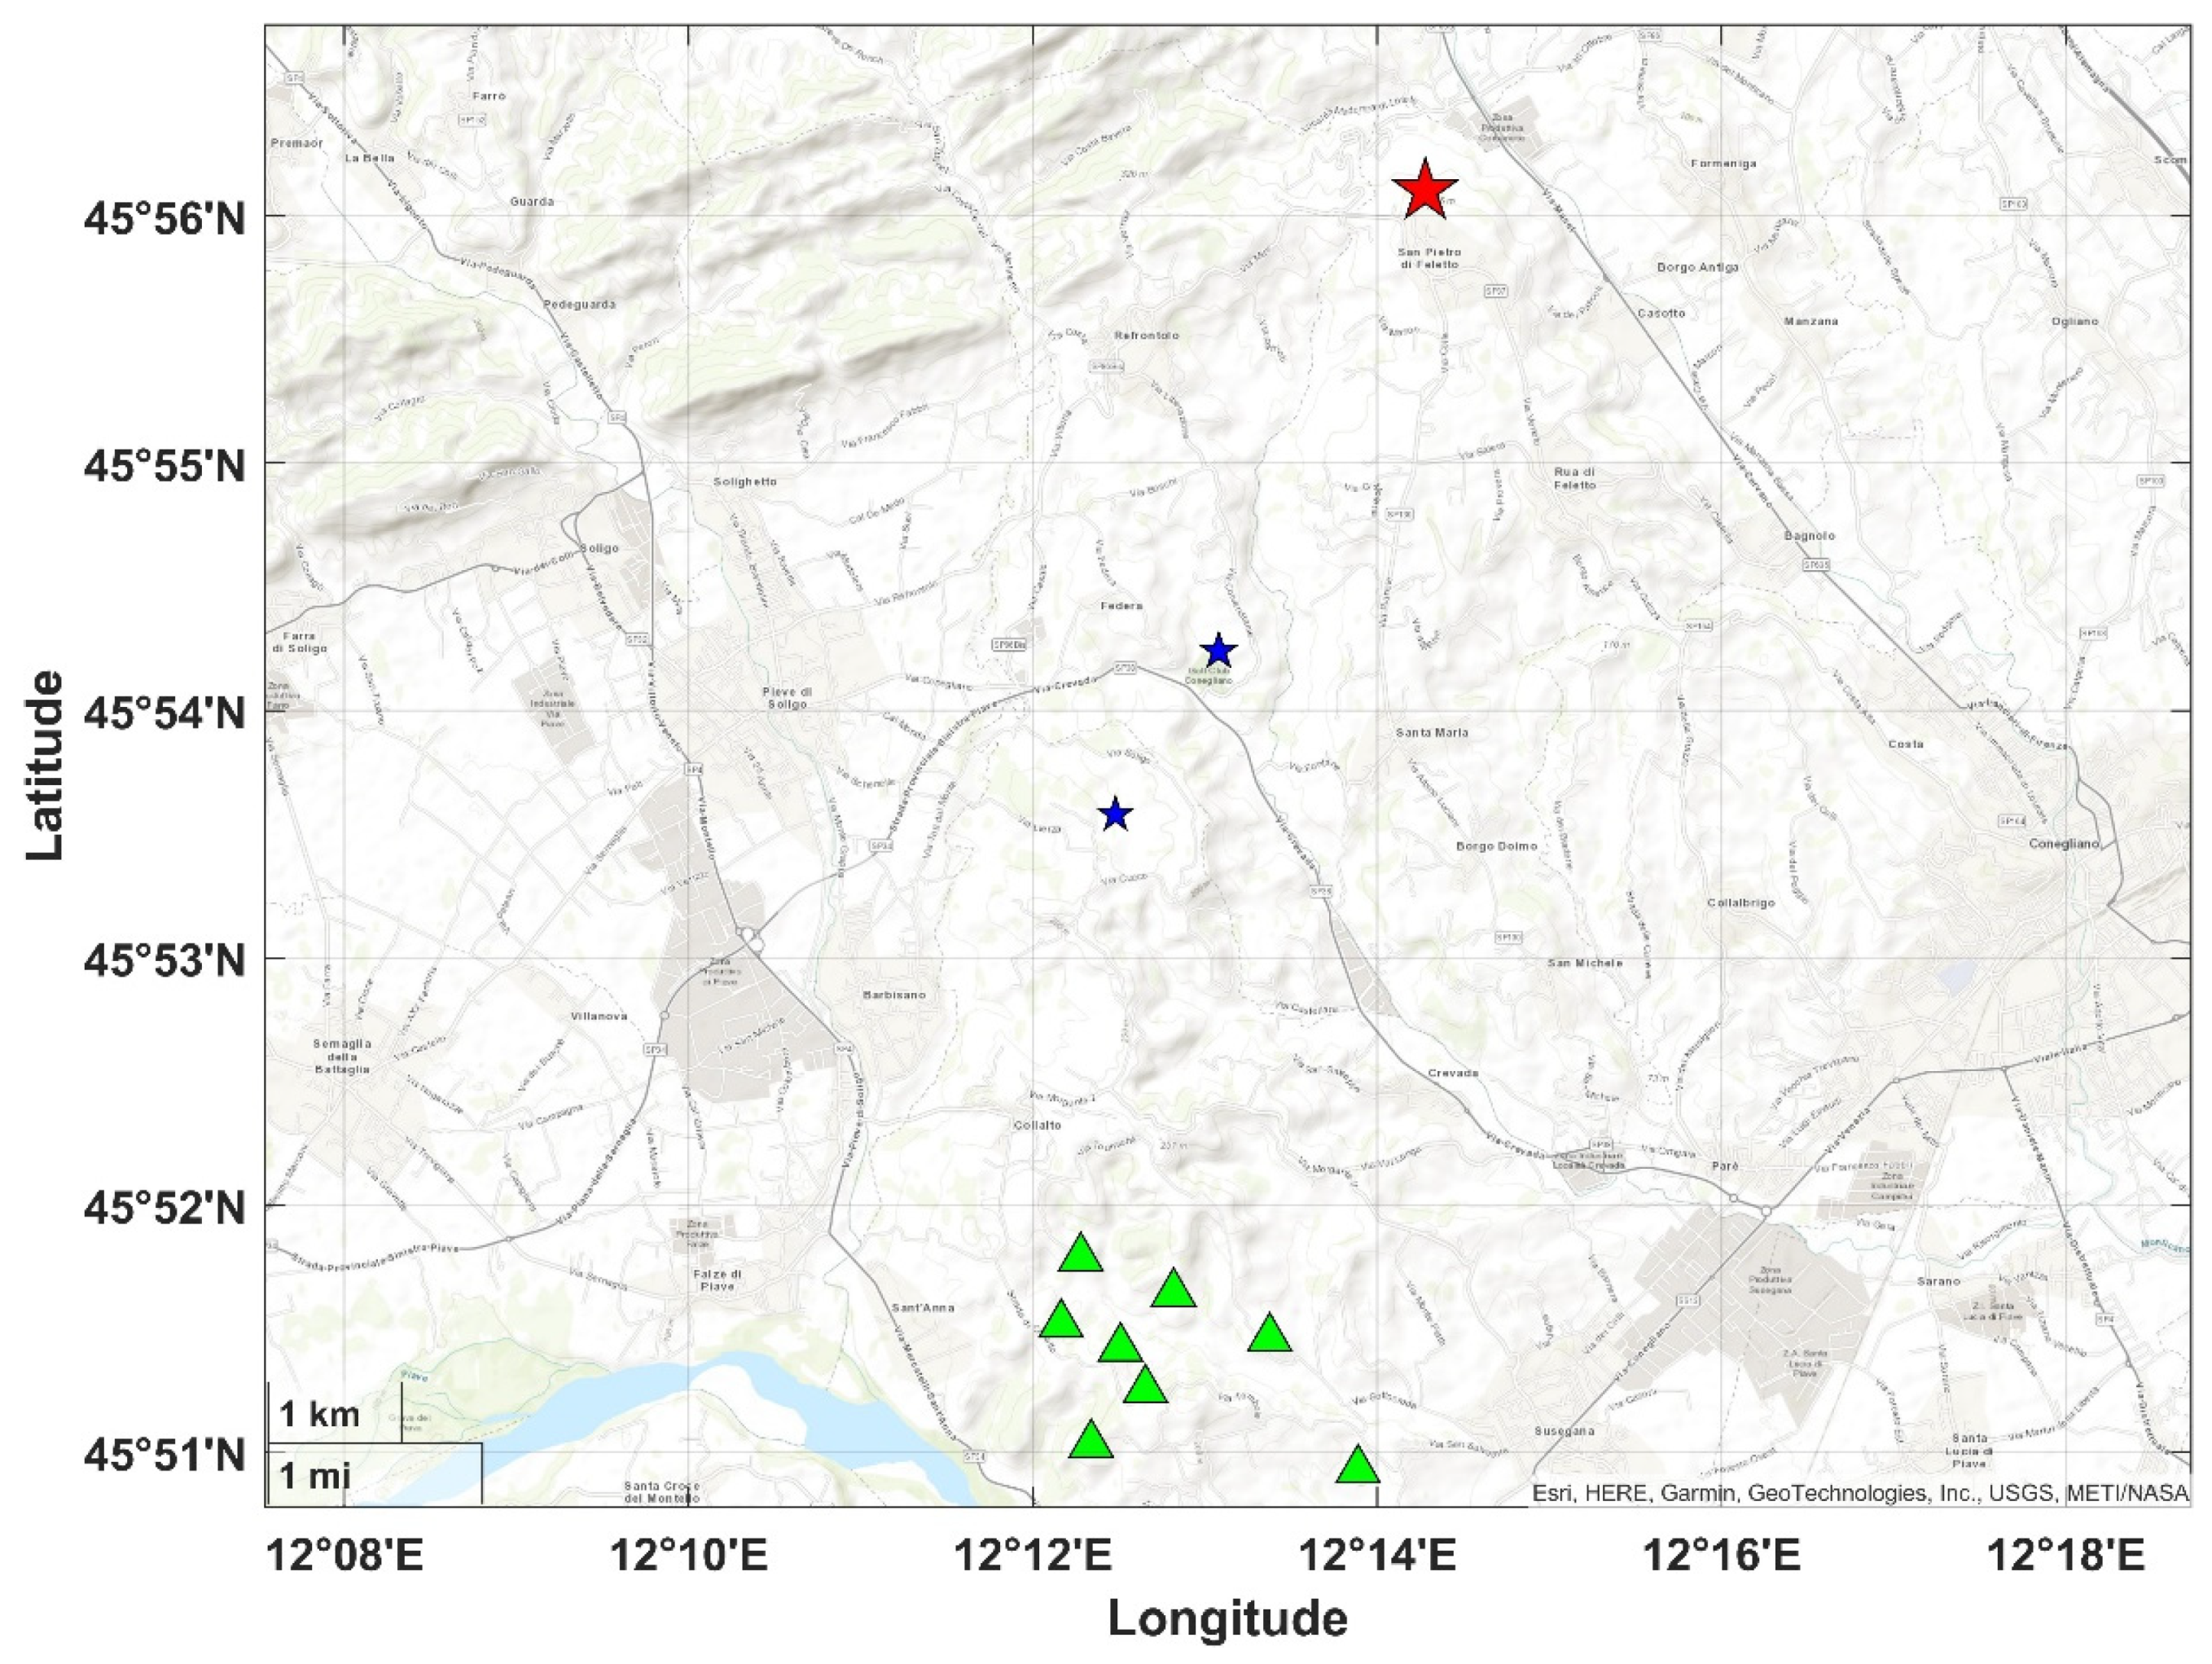
Concerning the local events, we found two detections located close to Conegliano (ev. 09–10 in Table 1, blue stars in Figure 4, Figure S4c,d in Supplementary Material). These latter were the closest earthquakes to the array that occurred during the experiment, according to the RCS catalog, with magnitude Ml 0.1 and Ml 0.0 respectively. Another two events were detected by FAST (ev. 03–04 in Table 1, Figure S4a,b in the Supplementary Material) and not reported in the catalog. These events were declared because of their reciprocal similarity and their similarity with ev. 09. They feature a very low signal-to-noise ratio (SNR~1.5) and cannot be located using the array records. However, considering that their waveforms are very similar with those of the ev. 09, we assumed these events co-located and provided an estimate of the magnitude (Ml −0.4 and −0.2 respectively) as the average magnitude value computed by applying Equation (1) at all the stations where the events were declared. In the following, we will discuss the performance of FAST in terms of minimum detectable magnitude in the area close to the Collalto gas storage area and the meaning of the local magnitude scale for such small events.
In addition, FAST correctly also identified the Ml 0.4 event located at Vittorio Veneto (ev. 15 in Table 1, red star in Figure 4), which was also included in the RCS catalog, and two further events (ev. 13–14, Figure S5 in the Supplementary Material) similar to it. Also in this case, the magnitude was estimated through the amplitude ratio (Equation (1)) considering the ev. 15 as a reference.
It is worth noting that the negative magnitude events of Conegliano (ev. 03–04 in Table 1) and Vittorio Veneto (ev. 13–14 in Table 1) anticipated the corresponding larger-magnitude events. In particular, events 03 and 04 occurred ~15.5 and ~14 h before event 09, while events 13 and 14 were detected ~6.5 h and ~13 min before the origin time of event 15. We finally highlight that for the whole period of our experiment, no events located in the close vicinity of the array and gas-storage were detected.

5. Discussion

The similarity search results do not report any detected earthquake near the gas storage during the experiment. Nevertheless, the procedure allowed us to detect seven events a few kilometers from the array deployment to the north, four of which represent new events. For the new detections, we exploited their high similarity to some larger-magnitude events, so that we could co-locate the new small events with the corresponding parents and estimated their magnitude, which resulted to be negative. Despite the small number of these new events, we can interpret them as foreshocks of the two larger-magnitude reference events. According to [39], who observed foreshocks before small magnitude events in Central Alaska, a systematic observation of foreshocks associated with small magnitude events for long periods could help to investigate the continuity and complexity of slip processes occurring in a specific area. Our results, hence, suggest that the integration of seismic networks and seismic arrays over long periods, combined with advanced data analysis strategies, could help to shed light on important questions concerning earthquake nucleation.
The limited duration of our experiment did not allow us to fully estimate the capability of the full permanent and temporary deployment in monitoring the micro-seismicity with respect to the storage area target. However, starting from our results, in the following, we propose a strategy to (i) infer the smallest magnitude that could have been detected in the study area; (ii) confirm, within a fixed level of confidence, that no events above a certain level of magnitude occurred in the gas-storage area during the experiment period.
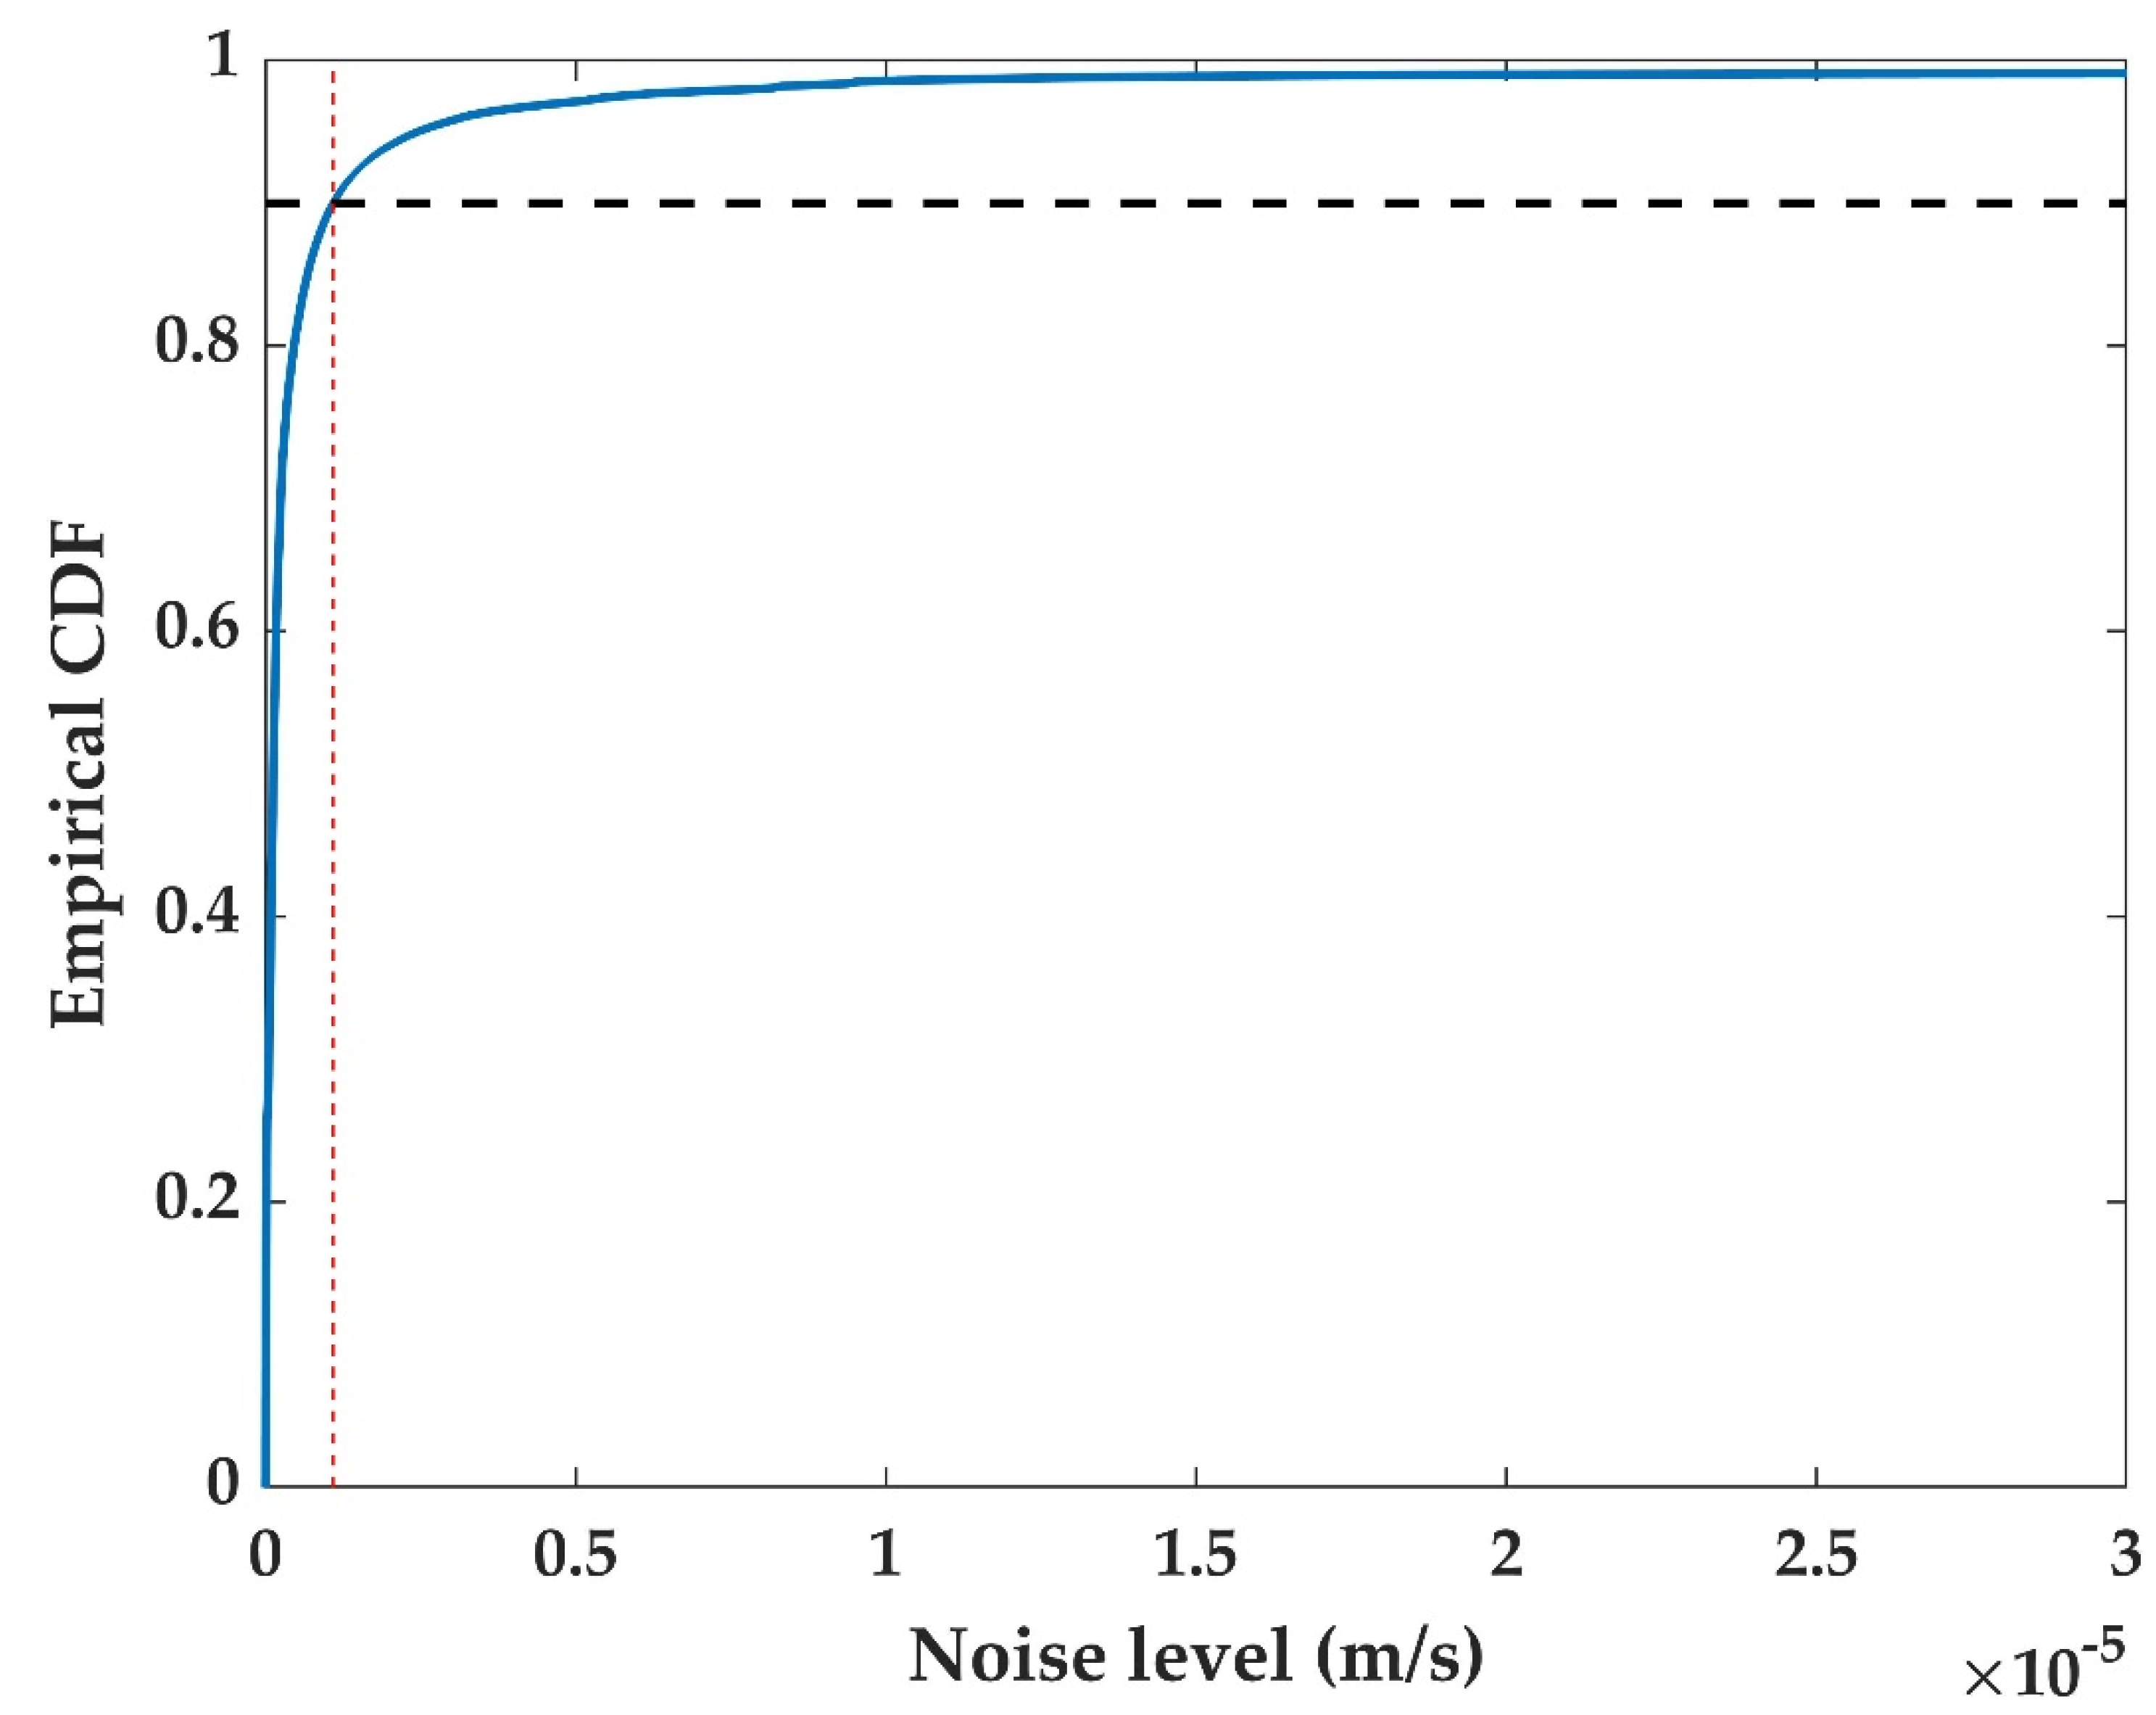
To estimate the minimum magnitude that could have been detected in the storage area, we investigate the noise distribution in the waveforms processed through the similarity search of FAST. For this study, the data stream at all stations of the array was subdivided into one-minute-long windows and then filtered in the band 1–20 Hz, similarly to the pre-processing phase described in Section 3. Within each window, the level of noise was estimated as the RMS of the whole signal. Figure 5 shows the empirical cumulative distribution of the noise along with the level corresponding to the 90th percentile, that is 1.08 × 10 6   m / s .
For local events detected by FAST, we computed the signal-to-noise ratio (SNR) on the horizontal components of the stations associated by FAST. Considering 7 s-long windows before and after the origin time as the noise N ( t ) and the signal S ( t ) contributions, we computed the Fourier transforms of both time series N ( ν ) and S ( ν ) . The S N R writes as:
S N R = f 1 f 2 S ^ ( ν ) d ν f 1 f 2 N ^ ( ν ) d ν
where f 1 = 1   Hz and f 2 = 20   Hz . For the three largest events of the two clusters (ev. 9, 10 and 15 in Table 1), SNR ranges between 4 and 6 at all the horizontal components of the stations of the array, while for the smallest ones (ev. 3, 4, 13 and 14 in Table 1) SNR ranges between 1.01 and 1.67 with a mean value S N R = 1.34 . We can consider this mean value as an estimate of the limit for the detection capability of the array system processed by FAST. Around this S N R level, we have detected events of minimum magnitude M = −0.4 at a maximum hypocentral distance R = 13 km. Fixing this SNR level and reducing the distance in the range between 2 km and 3 km, to account for events potentially occurring near the gas-storage area, we can estimate the minimum detectable magnitude using the local magnitude scaling law proposed by [40] and valid for north-eastern Italy:
M l ( r ) = log 10 A + n log 10 ( r R * ) + k ( r R * ) 3 + S
with Ml local magnitude, n = 1 , k = 0.0169   km 1 , r the distance (in km), R * = 100   km , S the local station coefficient, which is assumed zero, and A the Wood-Anderson displacement maximum amplitude. To estimate the limit magnitude detectable around the array deployment, considering the overall level of noise and the estimated quantity S N R , we replace the amplitude term in Equation (3) with the following quantity:
A o v e r n o i s e = S N R A n n o i s e
with A n n o i s e the Wood-Anderson amplitude of the nth percentile of the noise distribution (see Figure 5). Equations (3) and (4) enable the magnitude estimate for a local event located at a generic distance r , generating an amplitude emerging from a fixed level of noise with a prescribed S N R level. The higher the percentile, the more our estimate represents a good proxy for the magnitude of completeness of the system.
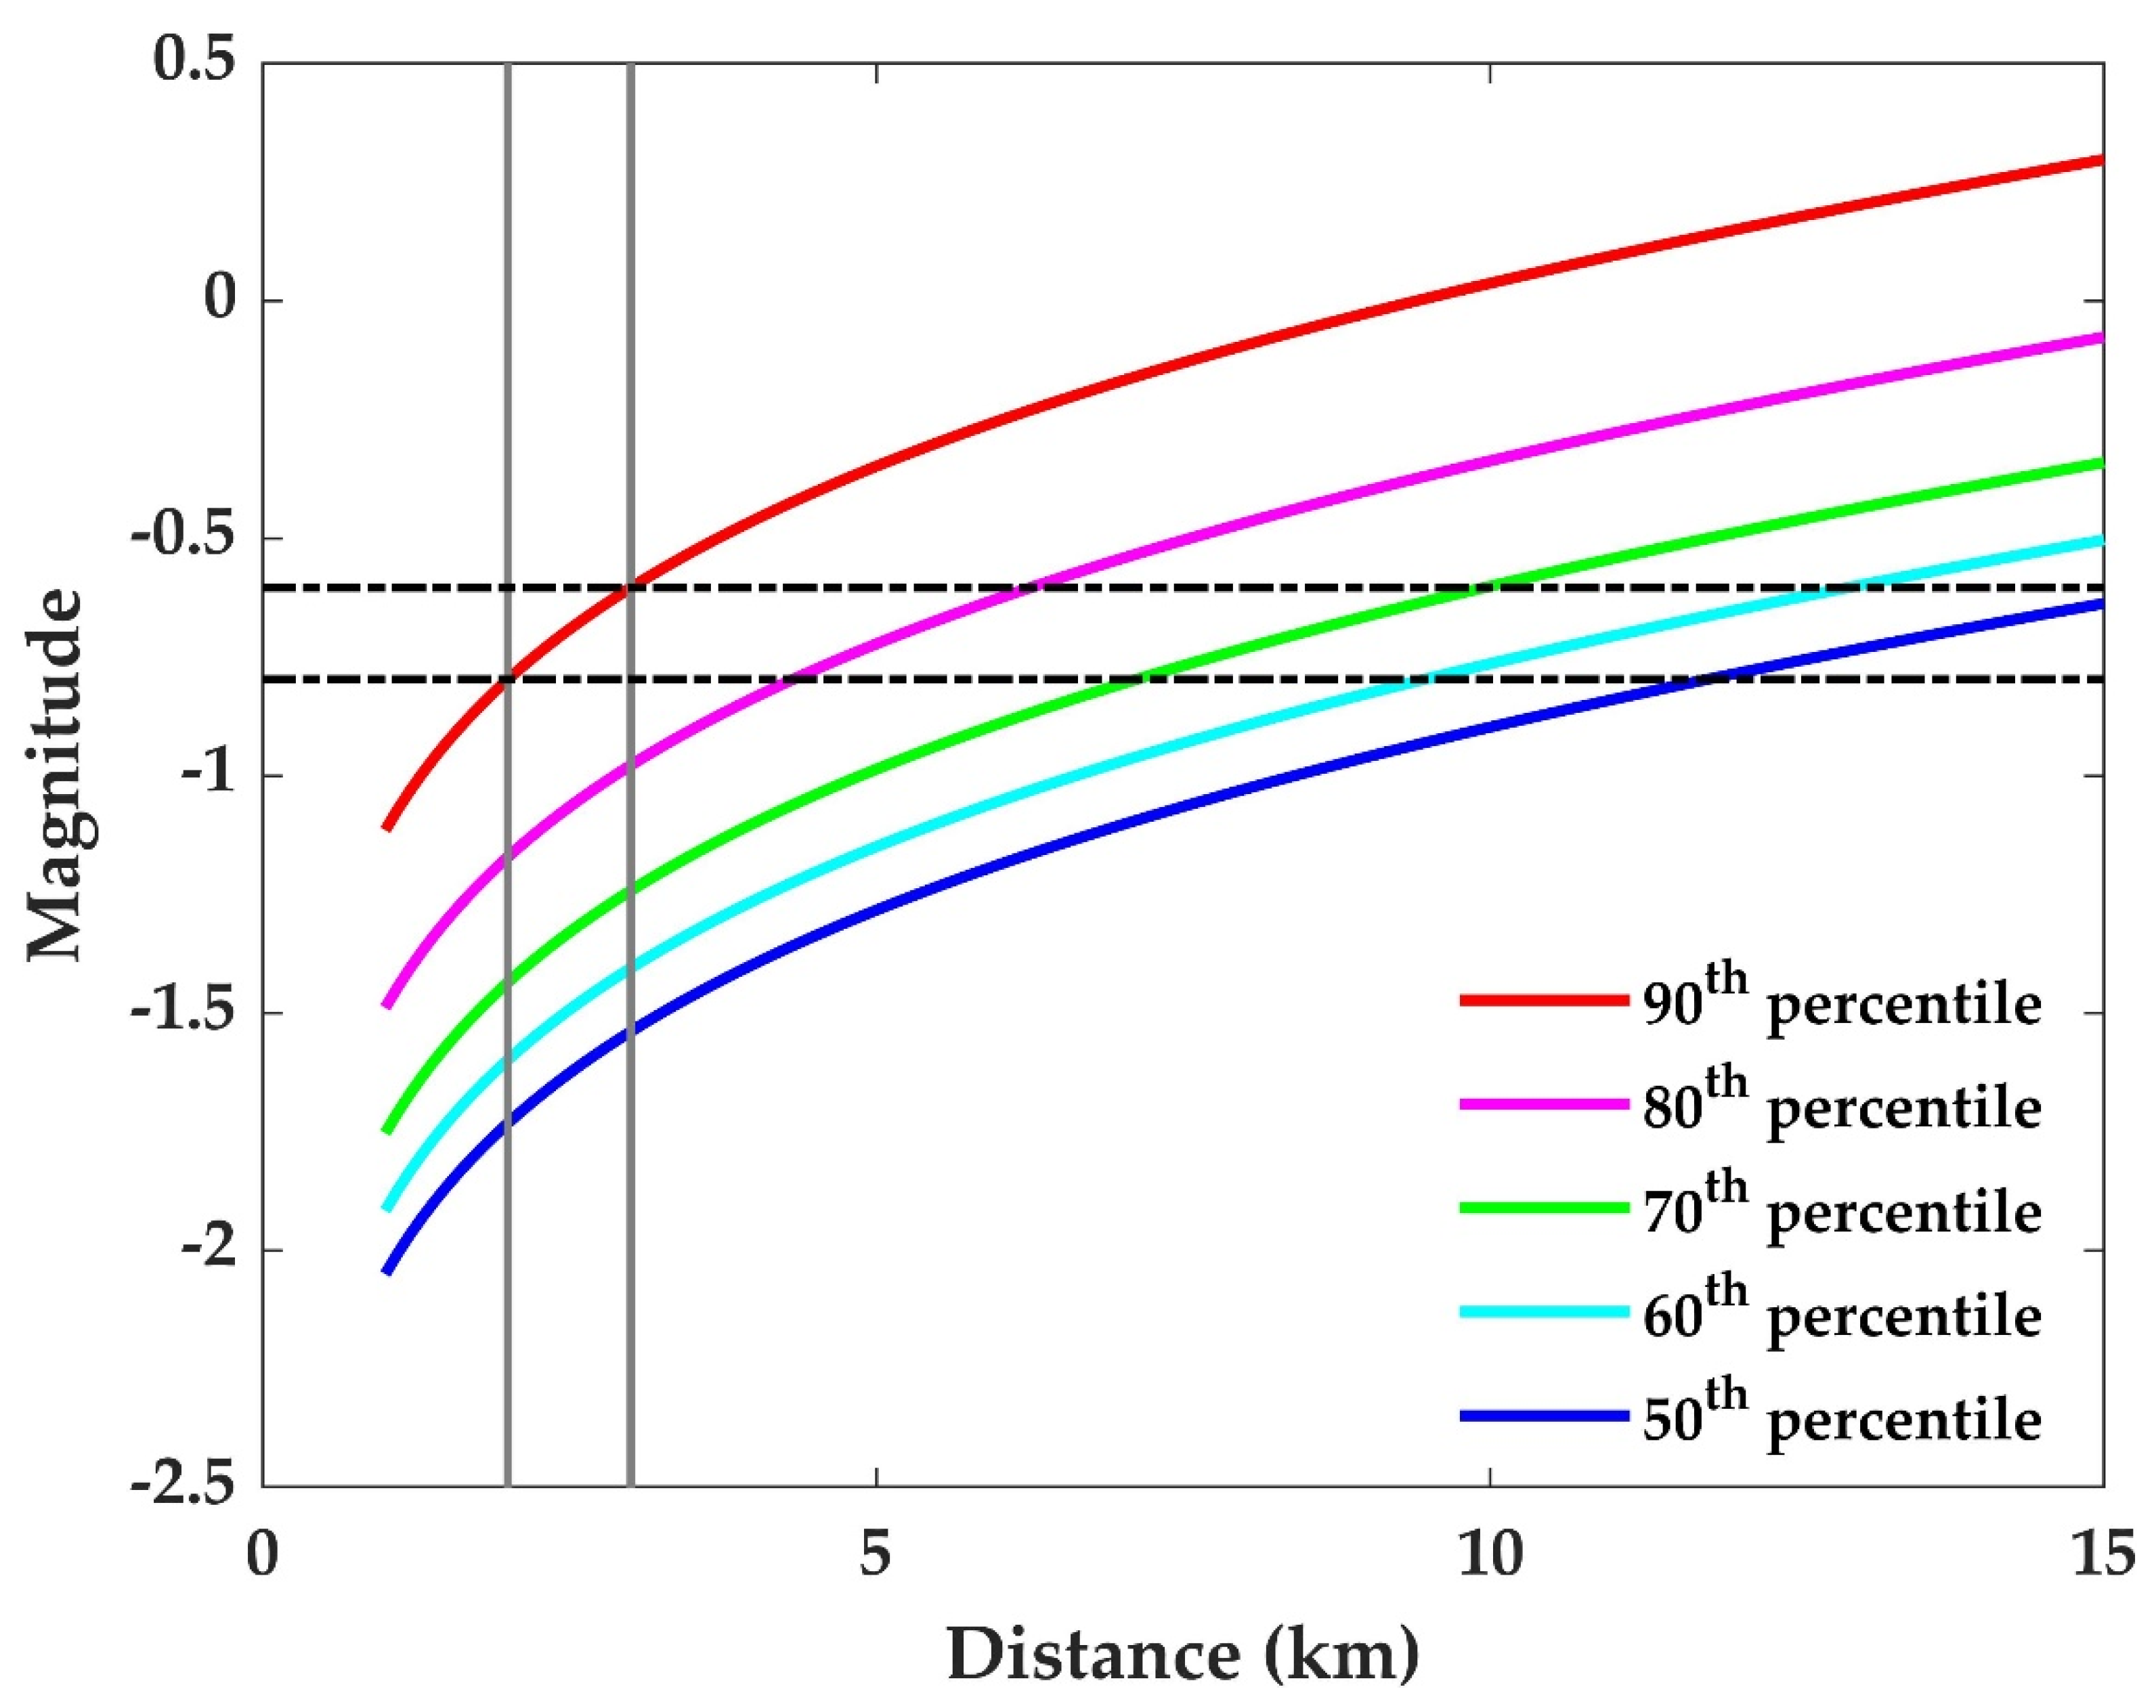
The results of this analysis using a value of S N R = 1.34 for computing Equations (3) and (4) are shown in Figure 6 for different percentile values of the noise amplitude. Considering that the Collalto gas-storage has an average depth of 1.5–1.6 km, and taking into account a range of reference distances between 2 km and 3 km from the array stations, we have retrieved an average limit magnitude M l lim between −0.8 and −0.6 when we select a noise level equal to the 90th percentile of the noise distribution. Thus, we can state, with a 90% level of confidence, that no events with local magnitude larger than −0.6 have occurred within the study area during the experiment. It is worthwhile to notice that in the case of very intense seismic activity, the expected detection accuracy of FAST was shown to be comparable to one of the more common template matching approaches, and that the combined use of both techniques might further increase the detection capability [28]. However, the low level of seismicity in the area under study in this work, with no available waveform templates for events within the reservoir and very low SNRs for the smallest events in the final catalog, seem to confirm that relying on FAST is the near-optimal choice for the presented application.
All the estimated magnitudes presented here are local magnitudes derived from the regional scaling presented in [40]. The values discussed in this study are small and well below the limit for which the local magnitude M l can be estimated without systematic bias. (e.g., [9,41]). This is due to the restriction of the exploitable frequency range for the analysis, determined by the sampling rate generally adopted by the networks (low compared to frequency content of the micro earthquakes), the signal to noise ratio and the combined effect of the anelastic and scattering attenuation [42,43]. This implies that any interpretation of the local magnitude in terms of seismic moment should be treated with caution. Indeed, when decreasing the magnitude, the corner frequency is above the Nyquist frequency, providing a theoretically faster scaling for the local magnitude than for larger earthquakes [43].
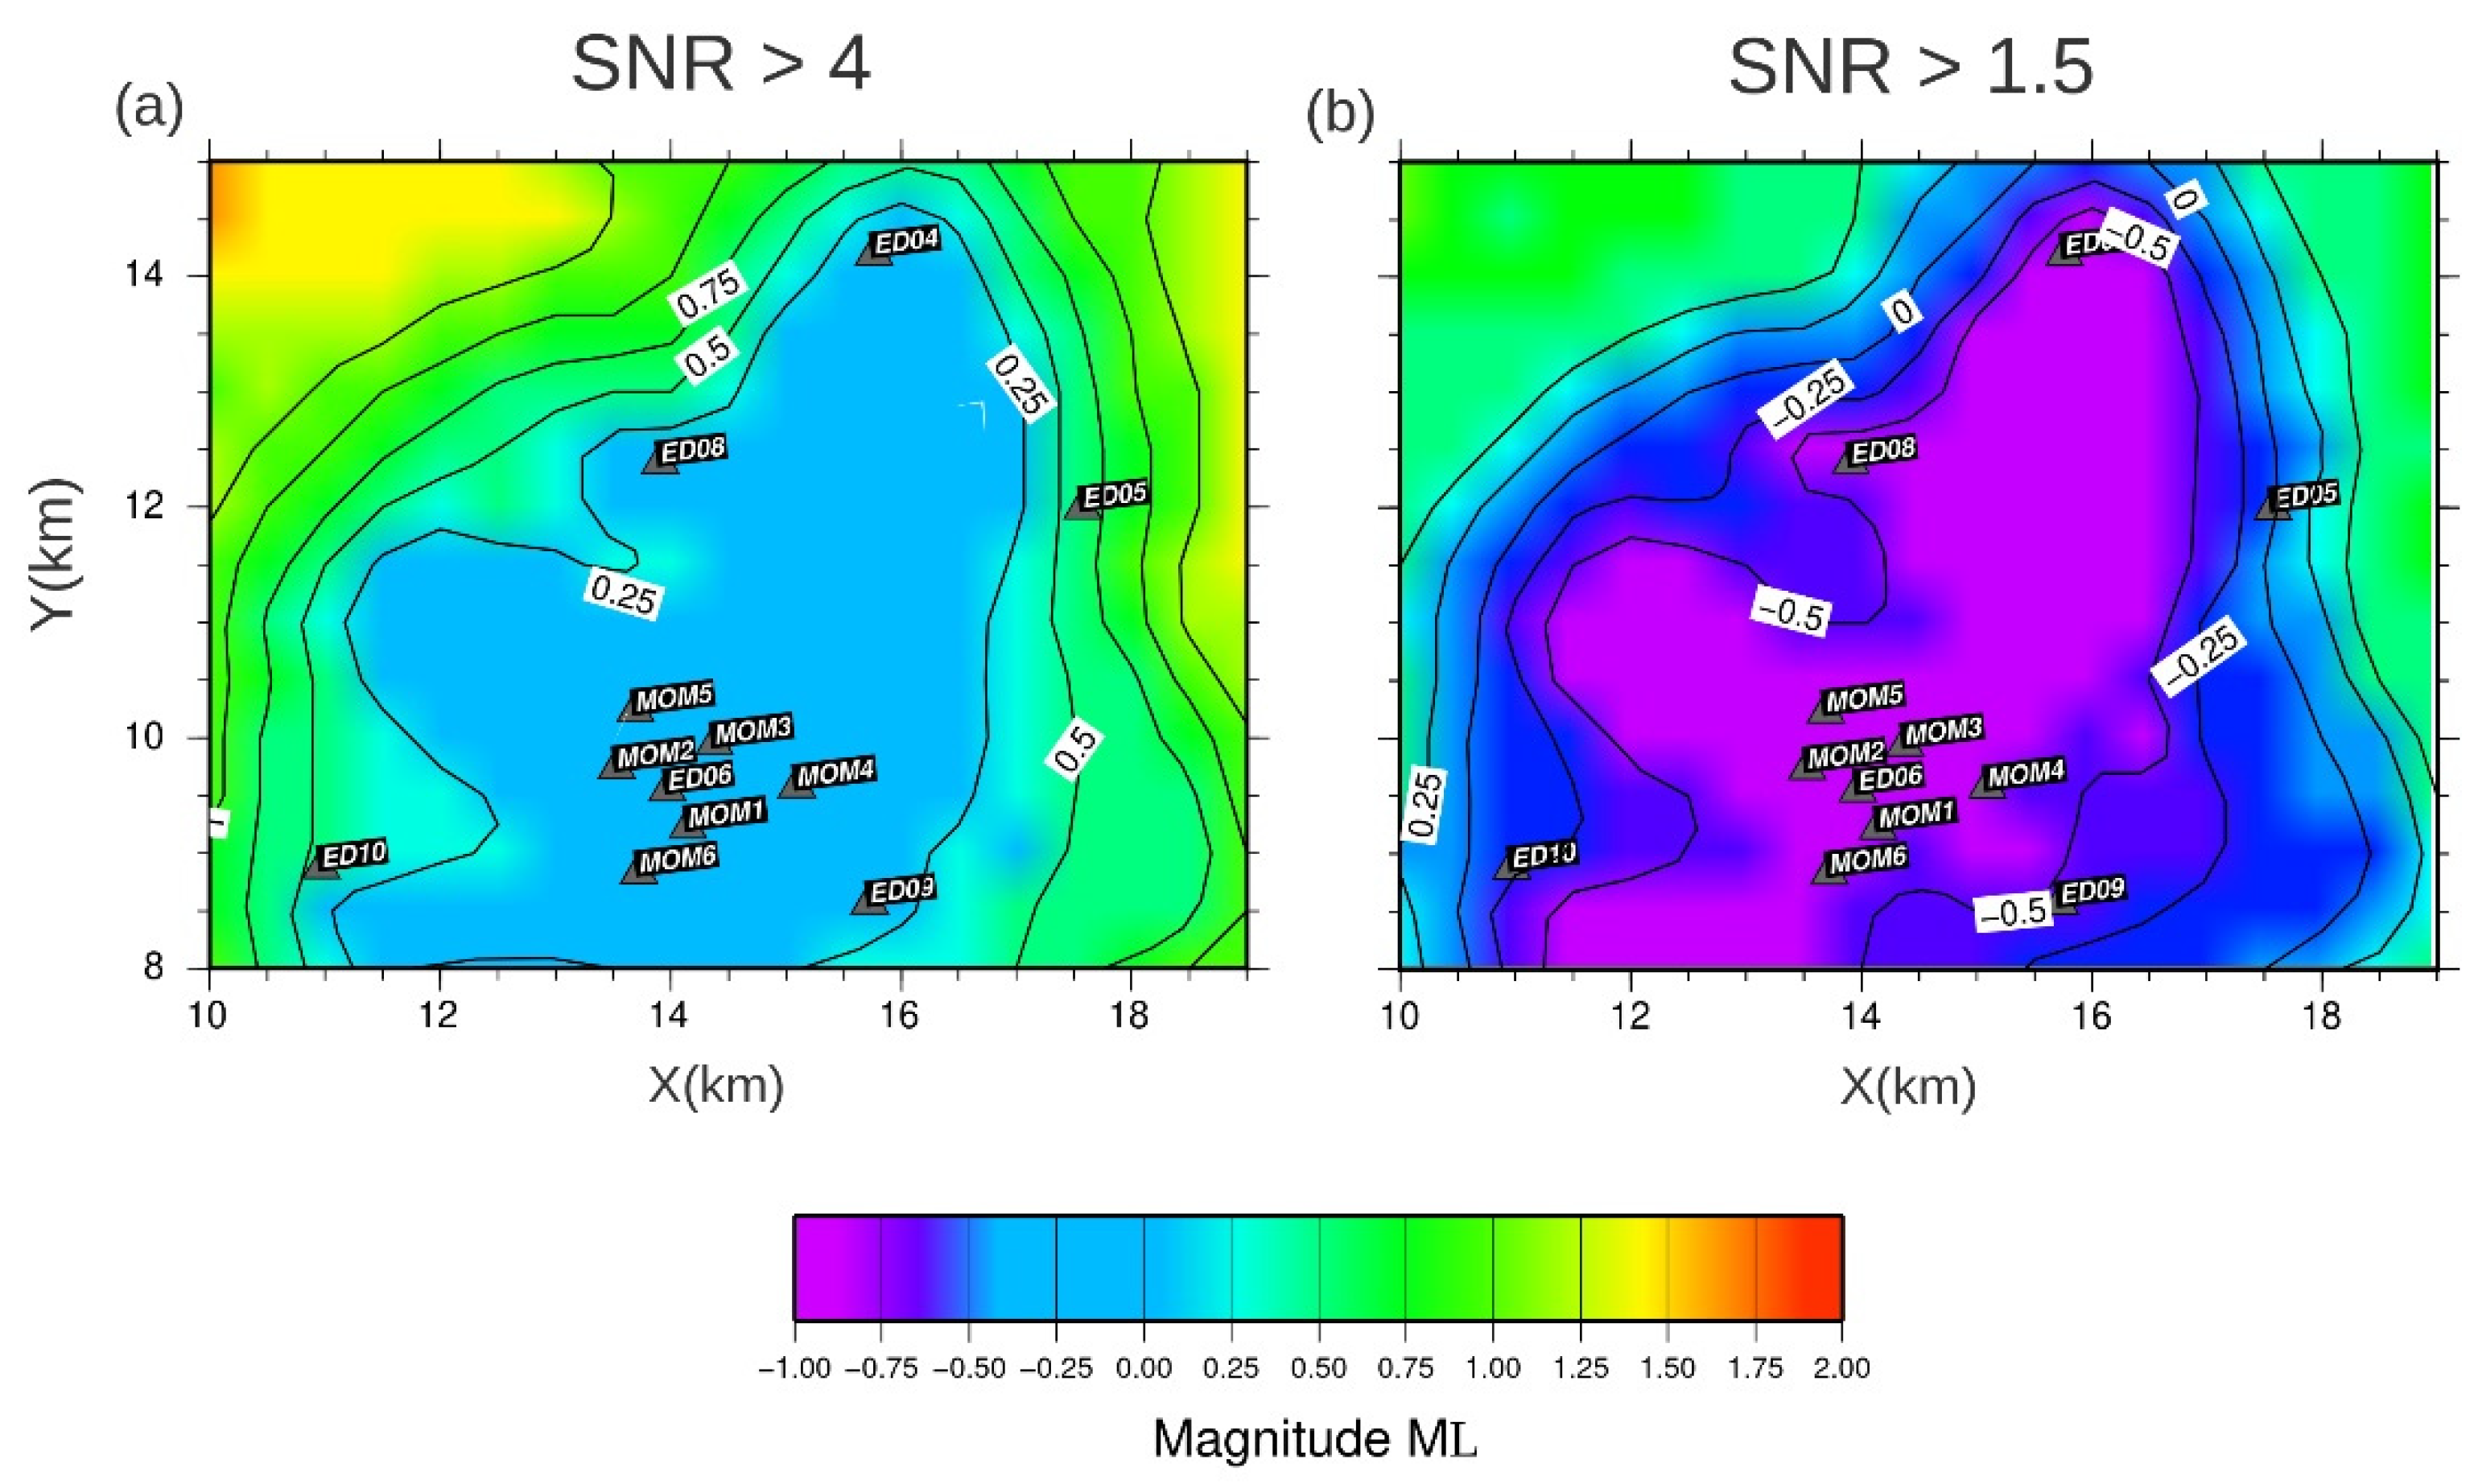
To provide a theoretical interpretation of the results and estimate to what extent the improvement is due to the proposed seismic array technique, we followed the approach of [4]. Considering the seismic noise conditions observed during the experiment, we evaluated the expected detection capability of the Collalto standard network integrated with the seismic array for events at 2.5 km depth. For the simulation, we have considered the scenario composed by the Collalto seismic network integrated with the array, the noise level evaluated in this study (~10−6 m/s), and the 1D local velocity derived for the area [44,45]. Figure 7a shows that, for an area of 2–3 km around the reservoir, the minimum expected detectable magnitude is approximately 0.0. It is worthwhile noting that the detection threshold adopted in this analysis is estimated by considering a standard detection technique based on STA/LTA requiring a SNR > 4 for at least three S-wave phases. Concerning these detection criteria, we observe no significant improvement of the RSC magnitude of completeness, obtained from visual waveform inspection [10]. When using the same waveform similarity criteria as adopted for FAST processing and a threshold of SNR > 1.5, the expected magnitude of completeness improved to −0.7, consistent with the M l lim estimated above. In this framework, the main contribution of a dense seismic array placed in the close vicinity of the gas storage area is to increase the number of stations where the minimum needed SNR is achieved.
In conclusion, taking into account all the described limitations, our findings suggest that the empirical estimation presented in Figure 6 is a good proxy of the magnitude of completeness of the experimental system and that, in this configuration, most of the improvement results from the application of an efficient detection algorithm based on similarity-search, which allows us to catch events with amplitude comparable to the noise level. Hence, in a future perspective, a longer installation of the presented monitoring setup might unveil whether ultra-micro earthquakes (M < 0) actually occur around the reservoir area and, possibly, if they can be correlated to the gas-storage activity.

6. Conclusions

This work concerns a monitoring experiment carried out in the monitoring area of the Collalto gas-storage in the North-East of Italy. Here, we installed a seismic array with a radius smaller than 2 km and analysed continuous velocity data acquired for 25 days during wintertime through the application of the optimized auto-similarity search technique FAST. The array monitoring system was conceived as a low-cost system, aimed at integrating the permanent high-resolution Collalto Seismic Network (Rete Sismica Collalto, RSC) right in the center of the monitoring network.
FAST was able to detect all the small events included in the RSC earthquake catalog and occurred just outside the gas-storage area, within a distance of 15 km from the array. These events were very small, and their magnitude was in the range 0.0–0.4, very close to the magnitude of completeness of the RSC network. FAST was also able to detect four more events, all with negative magnitude and not reported in the RSC catalog, which occurred a few hours before the reference events. Instead, no events were detected right below the array or the gas storage area.
To infer the detection capability of the system, in terms of magnitude of completeness, we first defined a proxy for the minimum SNR, enabling the detection by estimating the overall distribution of the signal-to-noise ratio for the smallest detected events throughout the array. This SNR threshold resulted, on average, equal to 1.34, revealing that the system was able to detect a micro-earthquake whose signals were fully buried in the noise. The overall noise amplitude distribution and the minimum SNR estimates were in turn used to quantify the minimum magnitude that could be detected for events occurring in the gas-storage area. Exploiting the magnitude law proposed for North-East Italy by [40], and considering the 90th percentile of the noise distribution, the limit magnitude of detectable events ranges between −0.8 and −0.6. Thus, we can also reasonably guess that no events with Ml > −0.6 occurred during the experiment within the gas-storage area. These findings are consistent with the theoretical model proposed by [4], which indicates that most of the improvement is due to the application of an advanced data mining strategy enabling the detection of events even with very low SNR.

Supplementary Materials

The following supporting information can be downloaded at: https://www.mdpi.com/article/10.3390/en15103504/s1, Figures S1–S5: Signals of detected events collected by similarity.

Author Contributions

A.S., G.M.A. and M.P. managed the workflow from the experiment conceptualization to the manuscript preparation. R.R., M.R., G.M.A., M.P., S.P. and E.P. worked on the organization and realization of the field experiment. A.S., F.S.d.U. and G.F. worked on data analysis and catalog definition. A.S., G.M.A., M.P., F.S.d.U., G.F., S.P., E.P. and G.D.L. contributed to the results discussion and interpretation. All authors have read and agreed to the published version of the manuscript.

Funding

This study has been partly supported by the Italian Ministry for Economic Development (MiSE), General Directorate for Mining Resources, within the context of a Program Agreement with the University of Naples “Federico II” and by the national project PRIN FLUIDS, Grant Number 20174 × 3P29.

Institutional Review Board Statement

Not applicable.

Data Availability Statement

The data presented in this study are available on request from the corresponding author.

Acknowledgments

The Collalto Seismic Network is managed by the OGS on behalf of Edison Stoccaggio S.p.A., under requirements of the Italian Ministry for the Environment, Land, and Sea Protection (MATTM) and in agreement with the Veneto Region. The authors acknowledge the full cooperation of Edison Stoccaggio S.p.A. in achieving the objectives of this research. Part of the figures and calculations were performed with MATLAB, version 9.9.0 (R2020b), The MathWorks Inc., Natick, Massachusetts. Licence number: 40500131.

Conflicts of Interest

The authors declare no conflict of interest.

References

  1. Ellsworth, W.L. Injection-Induced Earthquakes. Science 2013, 341, 142–143. [Google Scholar] [CrossRef] [PubMed]
  2. Goertz-Allmann, B.P.; Goertz, A.; Wiemer, S. Stress drop variations of induced earthquakes at the Basel geothermal site. Geophys. Res. Lett. 2011, 38, L09308. [Google Scholar] [CrossRef]
  3. Grigoli, F.; Cesca, S.; Priolo, E.; Rinaldi, A.P.; Clinton, J.F.; Stabile, T.A.; Dost, B.; Fernandez, M.G.; Wiemer, S.; Dahm, T. Current challenges in monitoring, discrimination, and management of induced seismicity related to underground industrial activities: A European perspective. Rev. Geophys. 2017, 55, 310–340. [Google Scholar] [CrossRef]
  4. De Landro, G.; Picozzi, M.; Russo, G.; Adinolfi, G.M.; Zollo, A. Seismic networks layout optimization for a high-resolution monitoring of induced micro-seismicity. J. Seismol. 2020, 24, 953–966. [Google Scholar] [CrossRef]
  5. MiSE. Guidelines For Monitoring Seismicity, Ground Deformation And Pore Pressure in Subsurface Industrial Activities. 2014. Available online: https://unmig.mise.gov.it/images/docs/151_238.pdf (accessed on 23 March 2022).
  6. Priolo, E.; Romanelli, M.; Plasencia Linares, M.P.; Garbin, M.; Peruzza, L.; Romano, M.A.; Marotta, P.; Bernardi, P.; Moratto, L.; Zuliani, D.; et al. Seismic monitoring of an underground natural gas storage facility: The Collalto seismic network. Seismol. Res. Lett. 2015, 86, 109–123. [Google Scholar] [CrossRef]
  7. Centrale Stoccaggio di Collalto. Available online: https://www.edison.it/it/centrale-stoccaggio-di-collalto (accessed on 23 March 2022).
  8. Romano, M.A.; Peruzza, L.; Garbin, M.; Priolo, E.; Picotti, V. Microseismic Portrait of the Montello Thrust (Southeastern Alps, Italy) from a Dense High-Quality Seismic Network. Seismol. Res. Lett. 2019, 90, 1502–1517. [Google Scholar] [CrossRef]
  9. Lanzoni, A.; Moratto, L.; Priolo, E.; Romano, M.A. Fast MW estimation of microearthquakes recorded around the underground gas storage in the Montello-Collalto area (Southeastern Alps, Italy). J. Seismol. 2020, 24, 1029–1043. [Google Scholar] [CrossRef] [Green Version]
  10. Priolo, E.; Romanelli, M.; Linares, M.P.P.; Garbin, M. Rete Di Rilevamento Sismico Finalizzata Al Monitoraggio Della Sismicità Naturale e Microsismicità Indotta Presso la Concessione Di Stoccaggio Gas Metano Denominata “Collalto Stoccaggio” (TV) 2021-Prima Relazione Annuale; Academia.edu: San Francisco, CA, USA, 2021. [Google Scholar]
  11. Gibbons, S.J.; Ringdal, F. The detection of low magnitude seismic events using array-based waveform correlation. Geophys. J. Int. 2006, 165, 149–166. [Google Scholar] [CrossRef] [Green Version]
  12. Peng, Z.; Zhao, P. Migration of early aftershocks following the 2004 Parkfield earthquake. Nat. Geosci. 2009, 2, 877–881. [Google Scholar] [CrossRef]
  13. Barrett, S.A.; Beroza, G.C. An Empirical Approach to Subspace Detection. Seismol. Res. Lett. 2014, 85, 594–600. [Google Scholar] [CrossRef]
  14. Chamberlain, C.J.; Townend, J.; Gerstenberger, M.C. RT-EQcorrscan: Near-Real-Time Matched-Filtering for Rapid Development of Dense Earthquake Catalogs. Seismol. Res. Lett. 2020, 91, 3574–3584. [Google Scholar] [CrossRef]
  15. Cesca, S.; Stich, D.; Grigoli, F.; Vuan, A.; López-Comino, J.Á.; Niemz, P.; Blanch, E.; Dahm, T.; Ellsworth, W.L. Seismicity at the Castor gas reservoir driven by pore pressure diffusion and asperities loading. Nat. Commun. 2021, 12, 4783. [Google Scholar] [CrossRef] [PubMed]
  16. Mousavi, S.M.; Ellsworth, W.L.; Zhu, W.; Chuang, L.Y.; Beroza, G.C. Earthquake transformer—an attentive deep-learning model for simultaneous earthquake detection and phase picking. Nat. Commun. 2020, 11, 3952. [Google Scholar] [CrossRef] [PubMed]
  17. Parolai, S.; Trojani, L.; Frapiccini, M.; Monachesi, G. Seismic Source Classification by Means of a Sonogram- Correlation Approach: Application to Data of the RSM Seismic Network (Central Italy). Pure Appl. Geophys. 2002, 159, 2763–2788. [Google Scholar] [CrossRef]
  18. Brown, J.R.; Beroza, G.C.; amd Shelly, D.R. An autocorrelation method to detect low frequency earthquakes within tremor. Geophys. Res. Lett. 2008, 35, L16305. [Google Scholar] [CrossRef]
  19. Poiata, N.; Satriano, C.; Vilotte, J.-P.; Bernard, P.; Obara, K. Multiband array detection and location of seismic sources recorded by dense seismic networks. Geophys. J. Int. 2016, 205, 1548–1573. [Google Scholar] [CrossRef]
  20. Skoumal, R.J.; Brudzinski, M.R.; Currie, B.S. An efficient repeating signal detector to investigate earthquake swarms. J. Geophys. Res.-Sol. Earth 2016, 121, 5880–5897. [Google Scholar] [CrossRef] [Green Version]
  21. Guidarelli, M.; Klin, P.; Priolo, E. Migration-based near real-time detection and location of microearthquakes with parallel computing. Geophys. J. Int. 2020, 221, 1941–1958. [Google Scholar] [CrossRef]
  22. Yoon, C.E.; O’Reilly, O.; Bergen, K.J.; Beroza, G.C. Earthquake detection through computationally efficient similarity search. Sci. Adv. 2015, 1, e1501057. [Google Scholar] [CrossRef] [Green Version]
  23. Bergen, K.J.; Beroza, G.C. Detecting earthquakes over a seismic network using single-station similarity measures. Geophys. J. Int. 2018, 213, 1984–1998. [Google Scholar] [CrossRef]
  24. Yoon, C.E.; Yoshimitsu, N.; Ellsworth, W.L.; Beroza, G.C. Foreshocks and Mainshock Nucleation of the 1999 Mw 7.1 Hector Mine, California, Earthquake. J. Geophys. Res. Solid Earth 2019, 124, 1569–1582. [Google Scholar] [CrossRef]
  25. Vassallo, M.; Festa, G.; Bobbio, A. Seismic Ambient Noise Analysis in Southern Italy. Bull. Seismol. Soc. Am. 2012, 102, 574–586. [Google Scholar] [CrossRef]
  26. Festa, G.; Adinolfi, G.M.; Caruso, A.; Colombelli, S.; de Landro, G.; Elia, L.; Emolo, A.; Picozzi, M.; Scala, A.; Carotenuto, F.; et al. Insights into Mechanical Properties of the 1980 Irpinia Fault System from the Analysis of a Seismic Sequence. Geosciences 2021, 11, 28. [Google Scholar] [CrossRef]
  27. Huang, Y.; Beroza, G.C. Temporal variation in the magnitude-frequency distribution during the Guy-Greenbrier earthquake sequence. Geophys. Res. Lett. 2015, 42, 6639–6646. [Google Scholar] [CrossRef]
  28. Yoon, C.; Huang, Y.; Ellsworth, W.L.; Beroza, G.C. Seismicity during the initial stages of the Guy-Greenbrier, Arkansas, earthquake sequence. J. Geophys. Res. Solid Earth 2017, 122, 9253–9274. [Google Scholar] [CrossRef]
  29. Castellarin, A.; Nicolich, R.; Fantoni, R.; Cantelli, L.; Sella, M.; Selli, L. Structure of the lithosphere beneath the Eastern Alps (southern sector of the TRANSALP transect). Tectonophysics 2006, 414, 259–282. [Google Scholar] [CrossRef]
  30. Burrato, P.; Poli, M.E.; Vannoli, P.; Zanferrari, A.; Basili, R.; Galadini, F. Sources of Mw 5+ earthquakes in northeastern Italy and western Slovenia: An updated view based on geological and seismological evidence. Tectonophysics 2008, 453, 157–176. [Google Scholar] [CrossRef]
  31. Castellarin, A.; Cantelli, L. Neo-Alpine evolution of the Southern Eastern Alps. J. Geodyn. 2000, 30, 251–274. [Google Scholar] [CrossRef]
  32. Mellere, D.; Stefani, C.; Angevine, C. Polyphase Tectonics through subsidence analysis: The Oligo-Miocene Venetian and Friuli Basin, north-east Italy. Bas. Res. 2000, 12, 159–182. [Google Scholar] [CrossRef]
  33. Serpelloni, E.; Vannucci, G.; Anderlini, L.; Bennett, R.A. Kinematics, seismotectonics and seismic potential of the eastern sector of the European Alps from GPS and seismic deformation data. Tectonophysics 2016, 688, 157–181. [Google Scholar] [CrossRef]
  34. Rovida, A.; Locati, M.; Camassi, R.; Lolli, B.; Gasperini, P.; Antonucci, A.; Azzaro, R.; Bernardini, F.; D’amico, S.; Ercolani, E.; et al. Italian Parametric Earthquake Catalogue CPTI15 Version 4.0 Macroseismic Data Management and Validation. 2016. Available online: https://emidius.mi.ingv.it/CPTI15-DBMI15/ (accessed on 23 March 2022).
  35. Galadini, F.; Poli, M.E.; Zanferrari, A. Seismogenic sources potentially responsible for earthquakes with M ≥ 6 in the eastern Southern Alps (Thiene-Udine sector, NE Italy). Geophys. J. Int. 2005, 161, 739–762. [Google Scholar] [CrossRef] [Green Version]
  36. Poli, M.E.; Burrato, P.; Galadini, F.; Zanferrari, A. Seismogenic sources responsible for destructive earthquakes in north-eastern Italy. Boll. Geofis. Teor. Appl. 2008, 49, 301–313. [Google Scholar]
  37. Barba, S.; Finocchio, D.; Sikdar, E.; Burrato, P. Modelling the interseismic deformation of a thrust system: Seismogenic potential of the Southern Alps. Terra Nova 2013, 25, 221–227. [Google Scholar] [CrossRef] [Green Version]
  38. Broder, A.Z.; Charikar, M.; Frieze, A.M.; Mitzenmacher, M. Min-Wise Independent Permutations. 2000. Available online: https://www.cs.princeton.edu/courses/archive/spr04/cos598B/bib/BroderCFM-minwise.pdf (accessed on 23 March 2022).
  39. Tape, C.; Holtkamp, S.; Silwal, V.; Hawthorne, J.; Kaneko, Y.; Ampuero, J.-P.; Ji, C.; Ruppert, N.; Smith, K.; West, M.E. Earthquake nucleation and fault slip complexity in the lower crust of central Alaska. Nat. Geosci. 2018, 11, 536–541. [Google Scholar] [CrossRef]
  40. Bragato, P.L.; Tento, A. Local magnitude in northeastern Italy. Bull. Seismol. Soc. Am. 2005, 95, 579–591. [Google Scholar] [CrossRef]
  41. Moratto, L.; Saraò, A.; Priolo, E. Moment magnitude (Mw) estimation of weak seismicity in Northeastern Italy. Seismol. Res. Lett. 2017, 88, 1455–1464. [Google Scholar] [CrossRef]
  42. Deichmann, N. Local Magnitude, a Moment Revisited. Bull. Seismol. Soc. Am. 2006, 96, 1267–1277. [Google Scholar] [CrossRef]
  43. Deichmann, N. Theoretical Basis for the Observed Break in ML/Mw Scaling between Small and Large Earthquakes. Bull. Seismol. Soc. Am. 2017, 107, 505–520. [Google Scholar] [CrossRef]
  44. Priolo, E.; Barnaba, C.; Bernardi, P.; Bernardis, G.; Bragato, P.L.; Bressan, G.; Candido, M.; Cazzador, E.; di Bartolomeo, P.; Duri, G.; et al. Seismic Monitoring in Northeastern Italy: A Ten-year Experience. Seismol. Res. Lett. 2005, 76, 446–454. [Google Scholar] [CrossRef]
  45. Bragato, P.L.; di Bartolomeo, P.; Pesaresi, D.; Percy, M.; Saraò, A. Acquiring, archiving, analyzing and exchanging seismic data in real time at the Seismological Research Center of the OGS in Italy. Ann. Geophys. 2011, 54, 67–75. [Google Scholar] [CrossRef]
Figure 1. Epicentral location map of seismicity recorded by RSC (red triangles) in the period 01/01/2012-29/03/2021 (http://rete-collalto.crs.inogs.it/DATI/Localizzazioni/H71/fri/eventi-sismici-full-period.txt, accessed on 20 March 2022). The magnitude of earthquakes (green circles) ranges between −0.9 to 3.8. The Collalto array is reported with blue triangles. The Collalto underground gas storage is shown in grey with the internal (two grey lines) and extended domain (three grey lines) areas. The monitoring areas A and B according to [6] are highlighted with dashed red lines. Historical seismicity with epicentral macroseismic intensity I0 > 4 is reported (CPT15, [34]). Thrust faults of the compressive external front of the eastern Southern Alps are displayed according to [30].
Energies 15 03504 g001
Figure 2. (a) Geometry of the Collalto array deployed in the Susegana (TV) municipality for the field experiment. The RSC and MOMA stations are represented by red and blue triangles, respevtively. (b) Example of MOMA station configuration equipped with a 3C geophone (4.5 Hz), a 3C MEMS accelerometer. An additional external accelerometer might be added but it was not installed during this experiment. The seismic station is also equipped with a 12 V solar panel, GPS and radio antennas for communication to a local control system. (c) Example of field seismic station (MOM3) installed during the Collalto experiment. Map Data: Google Earth © Google 2022.
Energies 15 03504 g002
Figure 3. Top, with blue arrows: Workflow of the FAST data processing for microseismicity detection. Bottom: an application example based on two events included in the Table 1 (see Section 4): (a) signals in time domain; (b) binary fingerprints comparison at a single station; (c) binary fingerprints comparison at network level.
Energies 15 03504 g003
Figure 4. Location of the events detected by FAST and included in the OGS catalogue in the vicinity of the array. Blue stars represent the events 9 and 10 in Table 1, while the red star represents the event 15 in Table 1. The size of the stars is proportional to the magnitude of the events and the green triangles mark the position of the array stations.
Energies 15 03504 g004
Figure 5. Empirical Cumulative Distribution Function (ECDF) of the noise distribution. The horizontal black dashed line marks the 0.9 level and the red dashed line intercepts the 90th percentile for the distribution.
Energies 15 03504 g005
Figure 6. Attenuation curves computed through the application of equation The coloured solid lines represent the different percentiles of the noise distribution as reported in the legend. The grey solid lines mark the reference distance range between 2 and 3 km, while the dashed-dotted black lines represent the average limit magnitude at those distances for the 90th percentile curve.
Energies 15 03504 g006
Figure 7. Map of the theoretical minimum detectable magnitude for the array + RSC network configuration considering SNR for the detection at least 4 (a) and at least 1.5 (b).
Energies 15 03504 g007
Table 1. Final catalog from the application of the FAST analysis to the array continuous data.
Event n.Date/Time UTCLatitudeLongitudeDepth (km)PlaceTriggered StationsMagnitudeAgency
Amp. Ratio (AR)
Similarity
012019-01-10 18:42:1246.84211.19812Bolzano, Italy62.7 (Ml)INGV02–11
022019-01-13 08:33:0746.22412.3766Belluno, Italy72.4 (Ml)INGV01–11
032019-01-14 20:32:21N/AN/AN/AConegliano, Italy4−0.4 (Ml)AR-Ev.0909
042019-01-14 22:10:18N/AN/AN/AConegliano, Italy4−0.2 (Ml)AR-Ev.0909
052019-01-14 23:03:5744.34712.28621Ravenna, Italy84.3 (Mw)INGV06–07
062019-01-14 23:29:0744.37712.30221Ravenna, Italy83.0 (Ml)INGV05–07
072019-01-15 00:45:4144.29212.2315Ravenna, Italy82.0 (Ml)INGV05–06
082019-01-15 01:25:0538.9320.5510Greece54.5 (mb)EMSC12–16
092019-01-15 12:05:2045.90412.2187.9Conegliano, Italy70.1 (Ml)OGS04–05–10–15
102019-01-15 17:26:4445.89312.2088.4Conegliano, Italy70.0 (Ml)OGS09–15
112019-01-15 18:31:0446.41913.17314Udine, Italy42.4 (Ml)INGV01–02
122019-01-26 19:56:43−21.206−178.716594Fiji Islands46.1 (Mwp)EMSC08–16
132019-01-27 13:51:37N/AN/AN/AVittorio Veneto, Italy2−0.4 (Ml)AR-Event 1515
142019-01-27 19:54:21N/AN/AN/AVittorio Veneto, Italy3−0.4 (Ml)AR-Event 1515
152019-01-27 20:07:3145.93512.2388.7Vittorio Veneto, Italy60.4 (Ml)OGS09–10
162019-01-29 12:53:4551.5816.1010Poland64.8 (mb)EMSC08–12
Publisher’s Note: MDPI stays neutral with regard to jurisdictional claims in published maps and institutional affiliations.

