Article

Study on the Optimal Dispatching Strategy of a Combined Cooling, Heating and Electric Power System Based on Demand Response

School of Electrical and Electronic Engineering, Shandong University of Technology, Zibo 255000, China
*
Author to whom correspondence should be addressed.
Energies 2022, 15(10), 3500; https://doi.org/10.3390/en15103500
Submission received: 13 April 2022 / Revised: 4 May 2022 / Accepted: 8 May 2022 / Published: 10 May 2022

Abstract

:
This paper proposes a combined cooling, heating and electric power (CCHP) system based on demand side response. In order to improve the economy of the system, a two-stage optimal scheduling scheme is proposed with the goal of minimizing the total operating cost of the system and maximizing user satisfaction. The optimal operation of the system was divided into two optimization problems, including the demand side and the supply side. In the first stage, combined with user satisfaction, from the new point of view that users are prone to excessive behavior due to time-of-use electricity prices, the cooling, heating and power load curves are optimized. In the second stage, an economic dispatch model that includes operating costs in terms of energy, maintenance and environment is established. An improved artificial bee colony (IABC) algorithm is used to solve the optimal energy production scheme based on the demand curves optimized in the first stage. Case studies are conducted to verify the efficiency of the proposed method. Compared with the CCHP system that does not consider demand response, this method reduced operation cost on typical days in summer and winter by 5.20% and 5.76%, respectively.

1. Introduction

With the development of global industry and economy, we are increasingly dependent on energy [1,2]. However, the overexploitation and use of fossil fuels pose unprecedented challenges to the global environment [3]. Therefore, the microgrid technology with renewable energy has been developed rapidly [4], and the combined cooling, heating and electric power (CCHP) system, which is a branch of the microgrid, has become the main solution to improve energy efficiency and reduce environmental pollution [5]. CCHP systems can provide electric energy, cold energy and heat energy to the user side through energy cascade utilization, which greatly reduces the loss of energy [6]. However, it still faces many challenges in resolving supply–demand balance and optimizing equipment output.
At first, many scholars added clean energy equipment, such as wind turbines, photovoltaics and power-to-gas (P2G) [7,8,9] to the traditional CCHP system. Later, some scholars made improvements in energy storage, such as adding pumped water energy storage systems and compressed air energy storage systems [10,11]. These played an important role in solving the problem of insufficient energy supply on the supply side. Based on these studies, this paper adds ground source heat pump (HP) equipment [12] to improve the energy supply capacity of cooling and heating loads, which is cleaner and more economical than the gas boiler equipment in traditional CCHP systems.
Economics is always the research focus of the CCHP system. With the development of smart grid technology, scholars have found that in addition to optimizing the output of the supply side to reduce the operating cost of the system, there is also a lot of room for improvement in the management of the user side. At this time, a new optimization method was born, known as demand response [13]. Furthermore, this optimization method has been proven to reduce the operating cost of the system. Li et al. [14,15] used user satisfaction as an evaluation index to measure user experience, establish a multi-objective scheduling model and reduce system costs. While considering user satisfaction, Cui et al. [16] established a transferable load model and divided the load into fixed loads and transferable loads. The influence of the equipment model on the optimal operation with load transfer under different thermoelectric ratios was also analyzed. Xu et al. [17,18] also considered the transferable load and established an optimal scheduling model with maximum user satisfaction as the objective function. However, their satisfaction model only considers the electrical load and does not optimize the management of the cooling and heating loads. Ma et al. [19,20] combined energy storage and demand response, adding price incentives and rewards and punishments to redistribute users’ transferable loads. The results showed a 14.66% cost reduction after considering energy storage and demand response. However, this makes the system structure more complex. From the perspective of user energy preference, Li et al. [21] established the priority of energy supply, gave priority to satisfying the energy most needed by users and improved user satisfaction. In order to give full consideration to the adjustment ability of the demand side, Wu et al. [22] established a bi-level optimization model. The upper level is the integrated energy system with the greatest total benefit, and the lower level considers the thermal comfort of residents. Simulation analysis showed that this method reduces the heating costs of residents. Yuce et al. [23] added smart appliances to power demand response. On this basis, Su et al. [24] constructed an integrated demand response model using electrical equipment. Combining wind power output uncertainty with demand response, Dolatabadi et al. [25] proposed a two-stage stochastic method based on risk-constrained scenarios to solve the smart energy hub (SHE) scheduling problem. In summary, these scholars redistributed schedulable loads into time slots according to their mobile characteristics, which played a role in shaving peaks and filling valleys. However, they did not take into account the possible excessive behavior of users under time-of-use electricity prices, which leads to the reverse peak-to-valley phenomenon.
For the CCHP system’s economic scheduling problem, another important challenge is the solution method of the model. At present, the solution methods are roughly divided into two categories: mathematical programming methods and intelligent optimization algorithms. Jing et al. [26] used the mixed integer non-linear programming (MINLP) method to solve the operation optimization model of the CCHP system containing solid oxide fuel cells so that the required cost is lower than that of the traditional energy system. In order to solve the uncertainty of new energy power generation, Chen et al. [27]. established a two-stage adjustable robust optimization model. Due to the difficulty in solving the model, he transformed it into two tractable mixed-integer linear programming (MILP) methods to solve. In addition to considering the uncertainty at the supply side, Qi et al. [28] also considered the uncertainty of the load. In order to solve the optimal operation of the system under double uncertainty, a stochastic optimal operation model was established, and the sequential quadratic programming method was used to solve the optimal model. In addition, Wang et al. [29,30,31] adopted the improved interval optimization algorithm, the interior point dispatching and the FCM clustering algorithm to solve the economic dispatch model of the microgrid. The operation optimization of the CCHP system is a multi-variable, multi-constraint, nonlinear decision-making problem. When solving such problems, the mathematical programming method not only needs a lot of mathematical calculations but also disassembles and transforms the model, which increases the difficulty of the solution. Therefore, it is more advantageous to use intelligent optimization algorithms to solve complex high-latitude problems. Defining operating cost and environmental pollution cost as the optimization goals, Qi et al. [32] established an economic dispatch model and used the improved gray wolf (GWO) algorithm to solve the problem. Simulation analysis showed that the improved algorithm is better than the original algorithm. Wang et al. [33,34,35] adopted the improved particle swarm (PSO) algorithm to solve the optimal solution of the model. Li et al. [36] proposed a quantum genetic algorithm (GA) to solve the optimization problem of the CCHP-GSHP system. Cao et al. [37] proposed an owl search algorithm (OSA) to obtain the optimal results for the CCHP system. Zhi et al. [38] employed a butterfly optimization algorithm (BOA) to analyze the performance and exergy efficiency of a CCHP system. While intelligent algorithms are useful for solving optimization problems, most intelligent algorithms require some input parameters. In practical problems, there are uncertainties in the parameter settings which affect the quality of the optimization. Therefore, this paper chose the artificial bee colony (ABC) algorithm, which does not require input parameters, and improves it for the problem of poor convergence. Compared with the original algorithm and particle swarm algorithm, better results were obtained.
In summary, the current research has made significant progress in demand response and optimization algorithms. The adjustable load model plays a role in peak shaving and valley filling but does not take into account the excessive behavior that users may engage in under time-of-use electricity pricing, which leads to the phenomenon of reverse peak–valley differences. In the solution method, in order to avoid too many parameters affecting the quality of the simulation results, the artificial bee colony algorithm was selected and improved. The effectiveness of the scheme was verified through actual case analysis. The contributions of this study are as follows:
  • A two-stage optimization strategy is established. The optimization operation of the system is divided into two problems: demand-side optimization and supply-side optimization, which is convenient for calculation;
  • From the new perspective of reverse peak-to-valley differences caused by the excessive behavior of users, the objective load function is proposed, which is combined with user satisfaction to establish an adjustable load model and optimize the demand curve;
  • Aiming at the shortcomings of the poor local search ability and the slow convergence speed of the ABC algorithm, the algorithm’s local search ability and convergence ability have been improved.

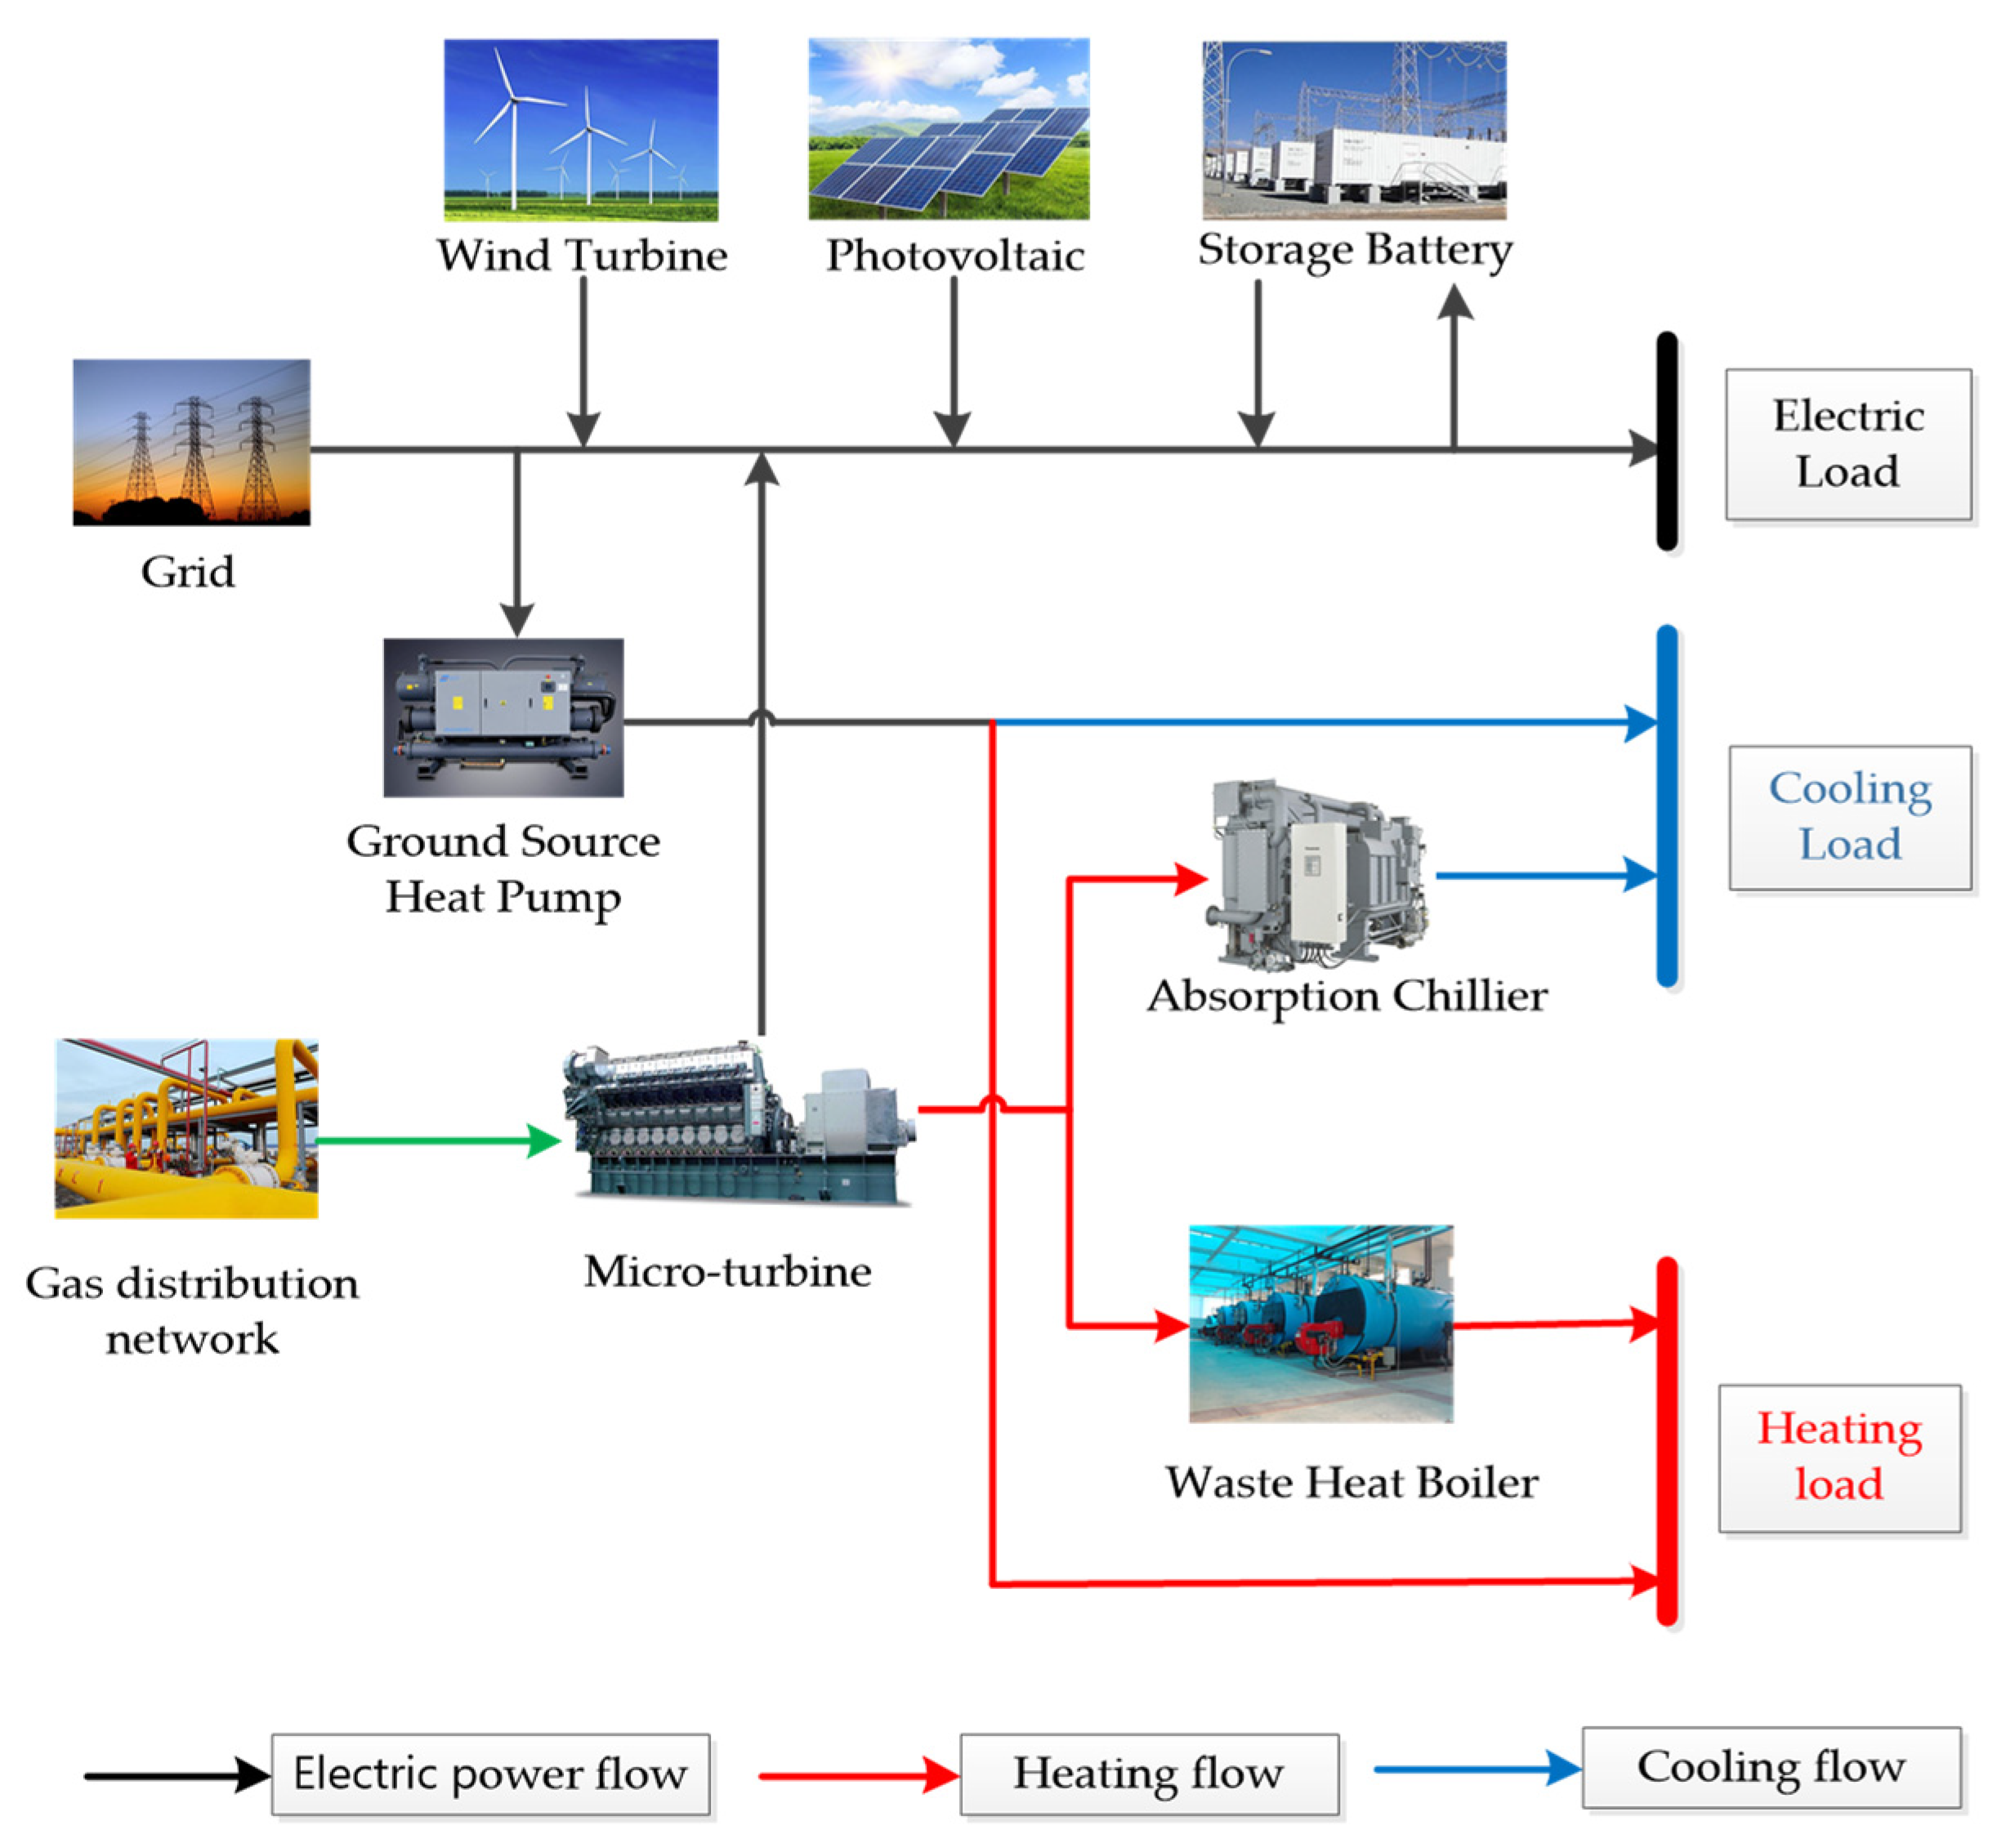
2. Mathematical Model of CCHP System

The structure of the CCHP system is shown in Figure 1. Wind turbines (WT) and photovoltaics (PV), as renewable energy sources, do not cause harm to the environment. Therefore, they are given priority to powering the system [39]. When there is excess new energy power generation, the excess electricity is stored in energy storage batteries (SB) or sold to the grid; when new energy power generation is insufficient, the micro gas turbine (MT) consumes natural gas to generate electricity, and at the same time, the generated heat is supplied to users through a heat recovery system, which includes an absorption chiller (AC) and waste heat boiler (WHB). The ground source heat pump (HP) cooperates with the heat recovery system to supplement the cooling load and heat load for the user [40]. The mathematical model of each device is as follows:

2.1. Mathematical Model of Micro Gas Turbine

The mathematical models of micro gas turbines, absorption chillers and waste heat boilers are described in [35]:
V M T , t = P M T , t η M T L N G
Q M T , t = P M T , t · 1 η M T η L η M T
L a c , t = Q M T , t η r e c k c o
H w h , t = Q M T , t η r e c · k h e
The gas consumption of micro the gas turbine is shown in (1). The heat generated by the micro gas turbine is all distributed to the absorption chiller or waste heat boiler to generate the required cold and heat energy in (3) and (4).

2.2. Mathematical Model of Ground Source Heat Pump

When the heat generated by the micro gas turbine cannot meet the user cooling and heating load, it is supplemented by the ground source heat pump [40].
L H P C , t = C H P C P H P , t
H H P H , t = C H P H P H P , t

2.3. Mathematical Model of Battery

The storage battery is mainly used to stabilize the fluctuation of new energy power generation and improve the stability of the power grid. The mathematical model is as follows [39]:
S b a t , t = 1 σ S b a t , t + η b a t c P b a t c , t Δ t P b a t d , t Δ t / η b a t d

3. Two-Stage Economic Optimal Dispatching Model

3.1. The First Stage Optimization Model

In a typical residential house, part of the electrical load comes from smart appliances. They have shown great adjustability under the incentive of time-of-use electricity prices [41]. Therefore, we split the residential electrical load into fixed loads and adjustable loads. Fixed load refers to the load that cannot be disconnected at a specific time, such as lighting or electric cookers. Adjustable load refers to the load with power that can be partially adjusted within a fixed period of time, such as electric water heaters. When the load needs to be reduced, the temperature of the electric water heater relatively decreases, and vice versa. Therefore, the total load of the residential community during t period is the sum of the fixed load and the adjustable load. The expression is shown in (8).
S t o t a l , t = S b s i c , t + S k t , t
The expression after load adjustment is shown in (9). When dispatching the adjustable load, the amount of load involved in regulation should be kept within the limit, and the expression is shown in (10).
S t i , t = S t o t a l , t + S b i , t
S b i m i n , t S b i , t S b i m a x , t

3.1.1. Objective Function

In this paper, the total cooling, heating and power load of users remains unchanged before and after adjusting the user load. After implementing the time-of-use electricity price measures, users reduce electricity consumption when the electricity price is high and increase electricity consumption when the electricity price is low. However, some users even reduce the use of fixed load in order to save electricity cost, a phenomenon we call excessive behavior. This behavior leads to the reverse peak-to-valley difference, which reduces the stability of the power grid and runs counter to the purpose of using time-of-use electricity pricing. Therefore, according to the characteristics of electricity price and electricity consumption being inversely proportional, the user target load function under time-of-use electricity pricing is formulated to simulate user over-response, which is expressed as:
E m u , t = t = 1 T E y l o a d , t · 1 / C t t = 1 T 1 / C t
Running under the target load can cope with user over-response and reduce user electricity costs and the system’s operating cost. In the CCHP system, part of the cooling and heating load is satisfied by the waste heat of the micro gas turbine, and there is a coupling characteristic between the electrical load and the cooling and heating load. Therefore, in order to match the supply side, the target loads of the cooling and heating loads are obtained by the product of the adjusted electrical load and the thermoelectric ratio, which is expressed as:
H m u , t = K H · E t i , t L m u , t = K L · E t i , t
However, if power is provided to users only according to the target load, there will be a situation where the fixed load cannot be satisfied, which was mentioned earlier. Although it can prevent the occurrence of over-response, it is too different from the users’ electricity consumption habits, which reduces user comfort and also affects the stability of the power grid. Therefore, combined with user satisfaction, this section takes the minimum difference between the adjusted user load and the target load and the maximum user satisfaction as the objective function:
F = m i n f 1 f 2
where f 1 is the difference function between the adjusted user load and the user target load, and f 2 is the user satisfaction function; the calculation method for the functions is explained in (14).
f 1 = t = 1 T E t i , t E m u , t 2 + H t i , t H m u , t 2 + L t i , t L m u , t 2 f 2 = 1 t T E b i , t + H b i , t + L b i , t t = 1 T E y l o a d + H y l o a d + L y l o a d
Combining f 1 and f 2 can reduce user electricity costs, prevent overreaction and maintain user satisfaction to a large extent. At the same time, it can also cut peaks and fill valleys and improve the stability of the power grid.

3.1.2. Model Constraints

In order to maintain the stability of the power supply system, the total load of users before and after regulation remains unchanged:
t = 1 T E b i , t = 0 t = 1 T H b i , t = 0 t = 1 T L b i , t = 0

3.2. The Second Stage Optimization Model

In this section, the operation cost of the CCHP system is comprehensively considered from the four aspects of fuel, environment, maintenance and interaction with the power grid, and the lowest cost is adopted as the objective function of the second stage.

3.2.1. Objective Function

F = m i n t = 1 T F F u e l , t + F E , t + F O M , t + F G , t
where F F u e l , t is the fuel cost, F E , t is the environmental governance cost, F O M , t is the maintenance cost and F G , t is the electricity purchase and sale cost.
  • Fuel cost
The fuel cost only includes micro gas turbine.
F F u e l , t = C N G · V M T , t
2.
Environmental governance cost
The environmental governance cost includes the pollutant gas produced by the combustion of natural gas.
F E t = j = 1 n α j · β j · P M T , t
where j represents the type of pollutant containing NOx, SO2 and CO2,   α j is the emission cost of pollutants and β j is the emission coefficient.
3.
Maintenance cost
It covers the maintenance cost of all equipment in the CCHP system.
F O M , t = i = 1 m P i , t · k O M , i
where k O M , i is the unit maintenance cost of equipment in the system and P i , t is the output of each equipment at time t.
4.
Electricity purchase and sale cost
In this paper, the CCHP system adopts the grid-connected operation mode, which will generate transactions with the grid.
F G , t = P g r i d , t · C b u y , t , P g r i d , t 0 P g r i d , t · C s e l l , t , P g r i d , t < 0
If P g r i d , t is positive, it means purchasing electricity from the grid. If P g r i d , t is negative, it means selling electricity to the grid.

3.2.2. Model Constraints

  • Constraints of energy balance
Energy balance includes electrical balance and thermal balance.
P W T , t + P P V , t + P M T , t + P g r i d , t + P b a t d , t = P l o a d , t + P b a t c , t + P H P , t
H w h , t + H H P H , t = H h l o a d t
L a c t + L H P C t = L c l o a d t
The power balance is shown in (21); the power consumption of the ground source heat pump is not included in the electric load.
2.
Constraints of equipment
The constraints of equipment mainly refer to their output constraints in each time period.
S b a t · m i n S b a t S b a t · m a x
0 P b a t · c P b a t · c m a x
0 P b a t · d P b a t · d m a x
P b a t · c , t · P b a t · d , t = 0
0 P M T P M T · m a x
0 P H P P H P · m a x
In this paper, the charging and discharging processes of the battery are not carried out at the same time.
3.
Constraints of the power grid
To avoid large disturbances to the grid, the system sets a power limit for interacting with the grid.
P g · m i n P g r i d t P g · m a x

4. Solution Method

4.1. Standard Artificial Bee Colony Algorithm (ABC)

The artificial bee colony (ABC) algorithm is an intelligent algorithm inspired by the foraging behavior of honeybees. It is more effective than particle swarm optimization (PSO) and ant colony optimization (ACO) [42]. The colony of artificial bees in ABC contains three groups of bees: employed bees, onlooker bees and scout bees [43]. The goal of the whole bee colony is to find the honey source with the largest amount of nectar in a limited range. The position of the honey source represents the solution of the problem, and the amount of nectar contained in the honey source is the quality (fitness) of the solution. The number of employed bees and onlooker bees is equal to the number of honey sources. First, honey information is taken back to the hive by employed bees. Then, the onlooker bee selects a honey source with a certain probability based on the information provided by the employed bees and searches for new honey sources nearby. If the quality of the new nectar source is higher than the original nectar source, the original nectar source is discarded. If the honey source is still not replaced after a limited number of iterations, the employed bees will be converted into the scout bees to randomly search for new honey sources.

4.1.1. Initialization Phase

For all honey sources, x i i = 1 ,   2 ,   3 , , S N , initial positions of honey sources are calculated as follows:
X i d = X m i n d + r · X m a x d X m i n d
where i = 1 ,   2 ,   3 , , S N represents the number of honey sources, d = 1 ,   2 , , D represents the dimension of the solution, r is a uniform random number among [0, 1], X m i n d represents the lower and X m a x d represents the upper bound of the solution space.

4.1.2. Employed Bee Phase

Each employed bee searches for new honey sources around the initial source, as shown in (32):
V i d = X i d + φ i d · X i d X k d
where V i d is the new honey source, k = 1 ,   2 , , S N is not equal to i. If the quality of the new honey source is better than that of the original honey source, the new honey source replaces the original honey source, and if not, the honey source remains unchanged.

4.1.3. Onlooker Bee Phase

When the employed bees update the honey source, the onlooker bees select the honey source to be collected according to the quality of the honey source with a certain probability. The probability formula is shown in (33):
P i = f i t i j = 1 S N f i t j
where f i t i is the fitness value of the honey source; the better the quality of the honey source, the greater the probability of being selected. Since this paper is a minimization problem, the fitness function can be expressed as:
f i t i = 1 1 + f i f i 0 1 + f i f i < 0
where f i is the objective function value.
Next, the onlooker bee searches for new honey sources around the selected honey source, and the search formula is given in (32).

4.1.4. Scout Bee Phase

If the position of the honey source does not change during a limited number of iterations, the honey source is discarded and the related employed bee is converted into a scout bee, and a new solution over the entire solution space is generated by (31).

4.2. Improved Artificial Bee Colony Algorithm (IABC)

In the standard artificial bee colony algorithm, the bee colony can obtain the honey source information of the whole region through the information shared between individuals, so the global search ability of the algorithm is strong. However, in the employed bee stage, the search formula is used to randomly generate a new solution, which makes the local search ability of the solutions weak. In the onlooker bee stage, the new solution is randomly generated by the same search formula, which makes its convergence poor. Therefore, this section improves the employed bee stage and the onlooker bee stage, respectively.

4.2.1. Employed Bee Phase

The search formula of the algorithm emphasizes the information exchange between individuals, which makes the algorithm focus too much on the global search, resulting in weak local search ability. We are inspired by the particle swarm algorithm, and aiming at the problem of poor local search ability in the employed bee stage, a global optimal factor is added to the search formula of the employed bee, as shown in (35):
V i d = X i d + φ i d · X g b e s t d X i d
where X g b e s t d is the global optimal solution; in this way, employed bees can more fully search for new honey sources within the range between the current honey source and the global optimal honey source, which improves the local exploitation ability of employed bees.

4.2.2. Onlooker Bee Phase

After improvement, the local exploitation ability of employed bees is improved. If the original search formula is still used in the stage of onlooker bees, it not only affects the local exploitation ability of employed bees but also reduces the convergence speed of the algorithm. Therefore, we introduce a variable step factor in the onlooker bee stage. With the increase of the number of iterations, the search step of the onlooker bee becomes smaller, which improves the convergence of the algorithm. The improved search formula is shown in (36):
V i d = X i d + e x p 20 M a x I t · X i d X k d
where the number of current iterations, M a x I t , is the maximum number of iterations.
In order to prevent the improved algorithm from falling into local optimum, we still use the random search formula of the original algorithm in the scout bee stage, which helps the scout bee jump out of the local optimum solution.

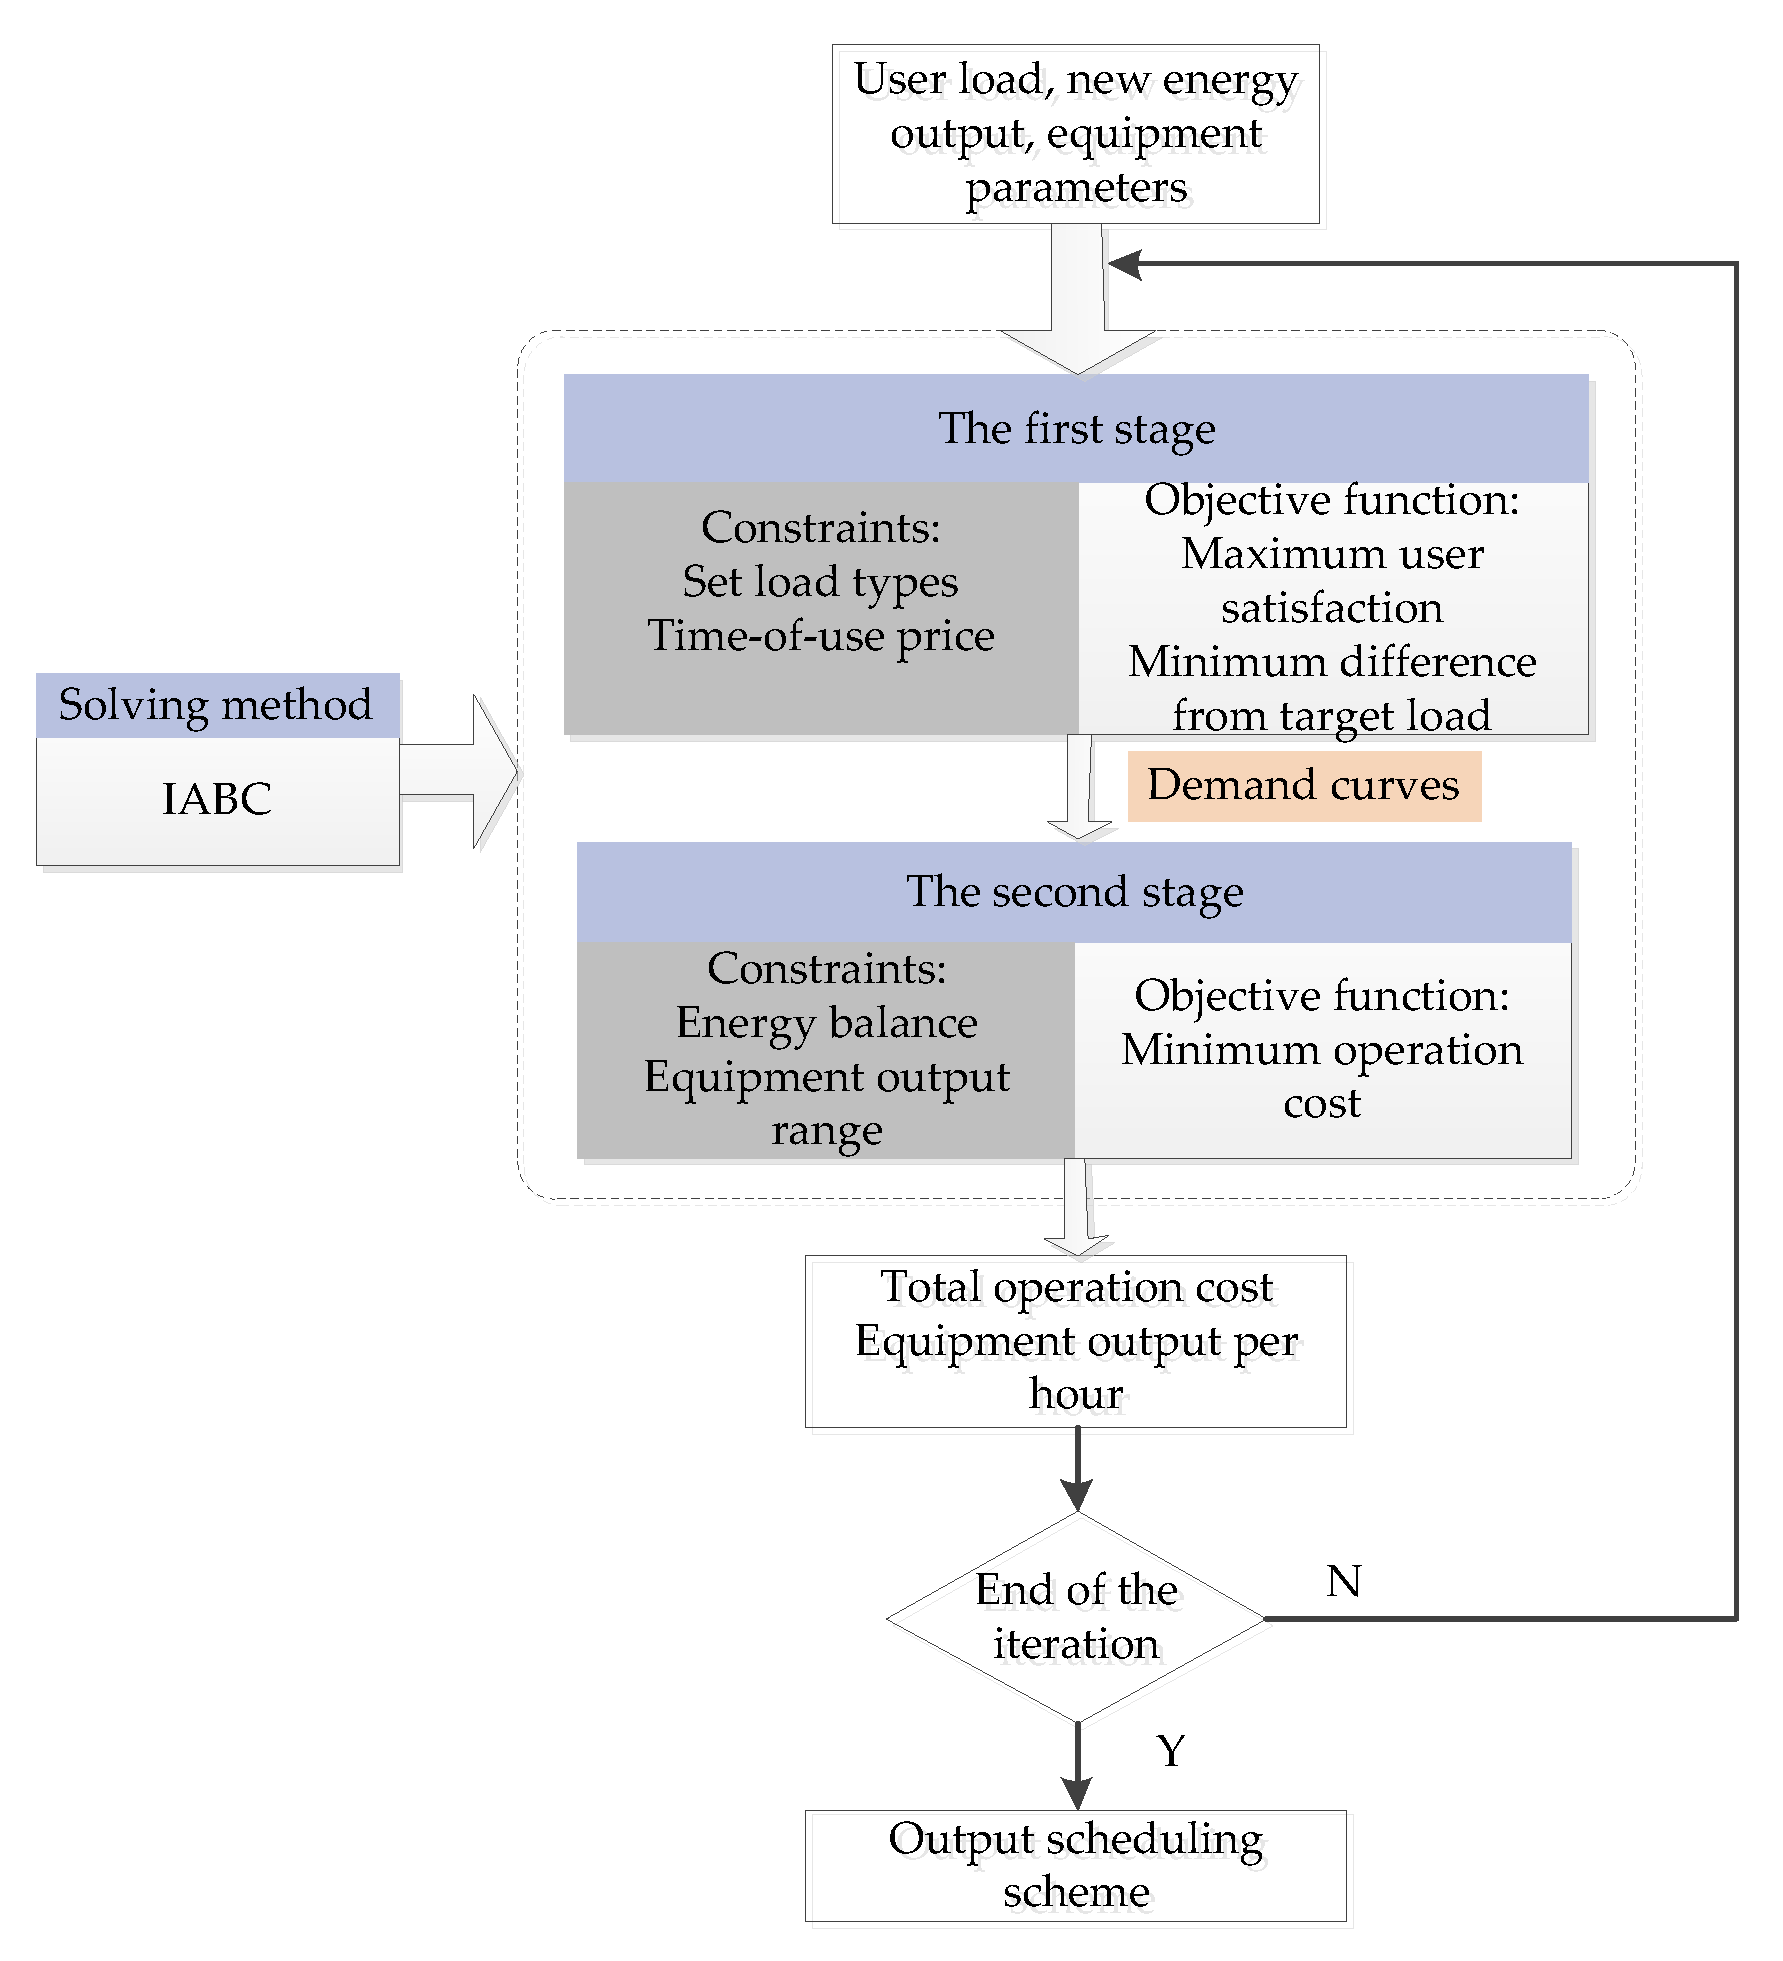
4.3. Solving Process

The logic flow of the two-stage operation scheme is shown in Figure 2. We adopt new energy power generation, load type and equipment parameters as input from the first stage (the objective function is shown in Equation (13)). While ensuring user satisfaction, the difference between the adjusted load and the target load should be minimized. The objective function is solved by employed bee Equation (35) and onlooker bee Equation (36). Each time the algorithm completes one iteration, the fitness of the solution is calculated by Equation (34), and the best set of solutions is retained. This operation is repeated until the iteration is completed, and the optimized demand curve is output. In the second stage, the objective function is shown in Equation (16). The optimized demand curve is used as the initial data, and the equipment output is used as the variable. After the iteration is completed, the minimum operating cost of the system and the optimal output of the equipment are output.

5. Case Studies

To verify the effectiveness of the scheme, we compared four cases. In the separating supply system, the electrical load is met by the power grid, and the cooling and heating load is met by the ground source heat pump.
  • Case 1. Separating supply system without demand response.
  • Case 2. Separating supply system with demand response.
  • Case 3. CCHP system without demand response.
  • Case 4. CCHP system with demand response.

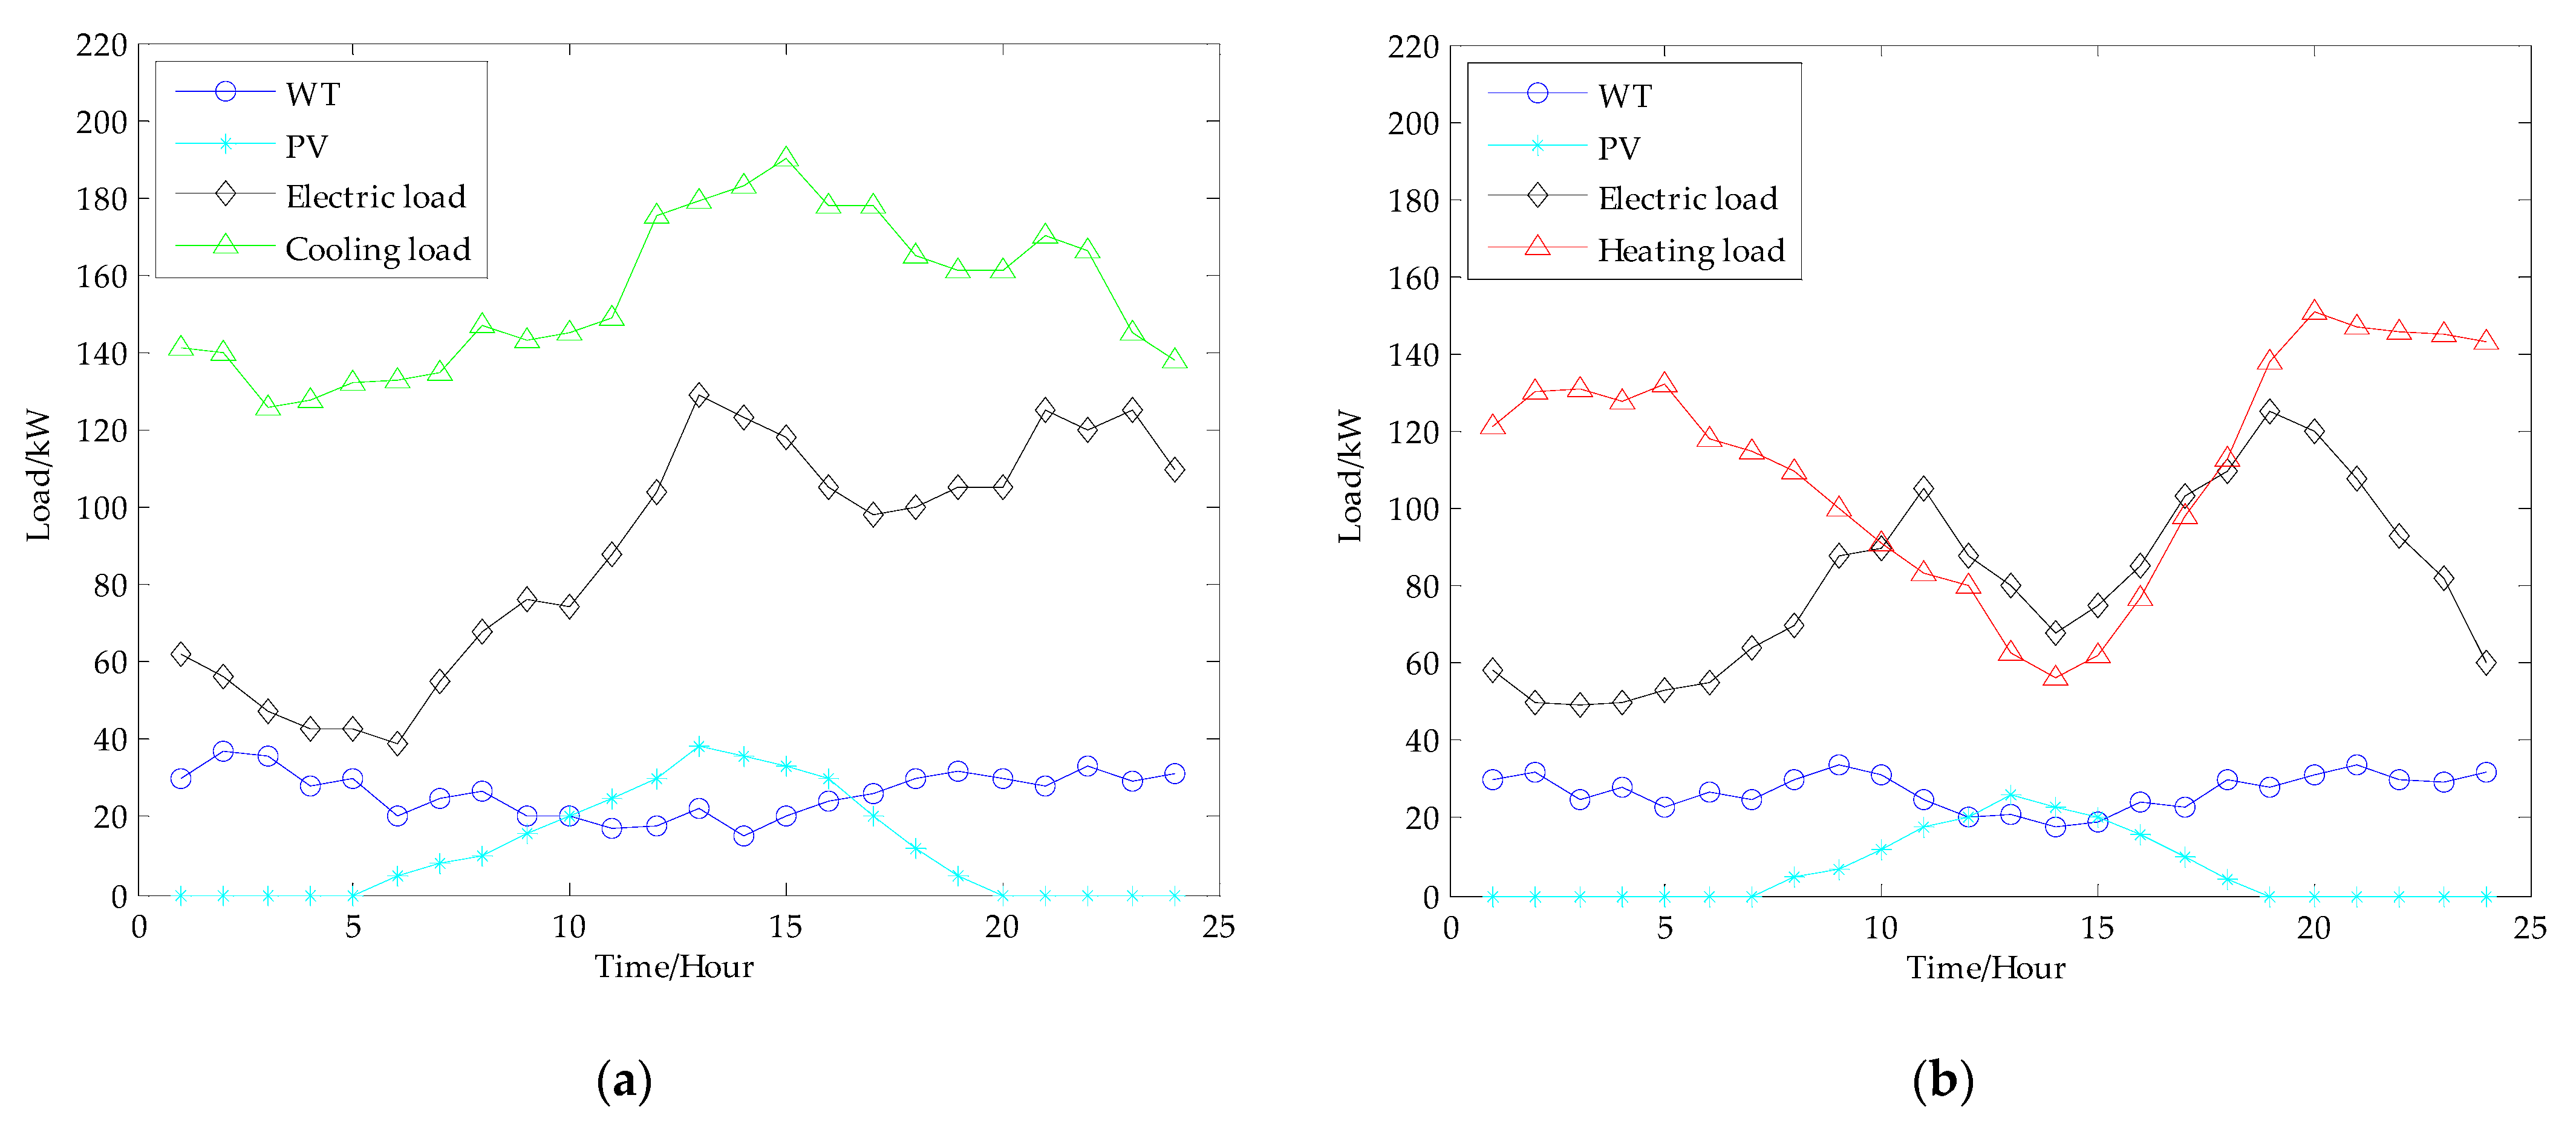
5.1. Test Parameters

This study uses the example of a typical residential building in the north to validate the effectiveness of the scheme. The typical daily load and new energy output [44,45] in summer and winter are shown in Figure 3. Time-of-use electricity pricing used in the case is shown in Table 1. The pollutant emission parameters of micro gas turbine are shown in Table 2. Technical parameters of the equipment are shown in Table 3. The scheduling period is 24 h, and the time interval is 1 h. The problem was solved using MATLAB on a computer configured with win7 64-bit, MATLAB version is R2014a.

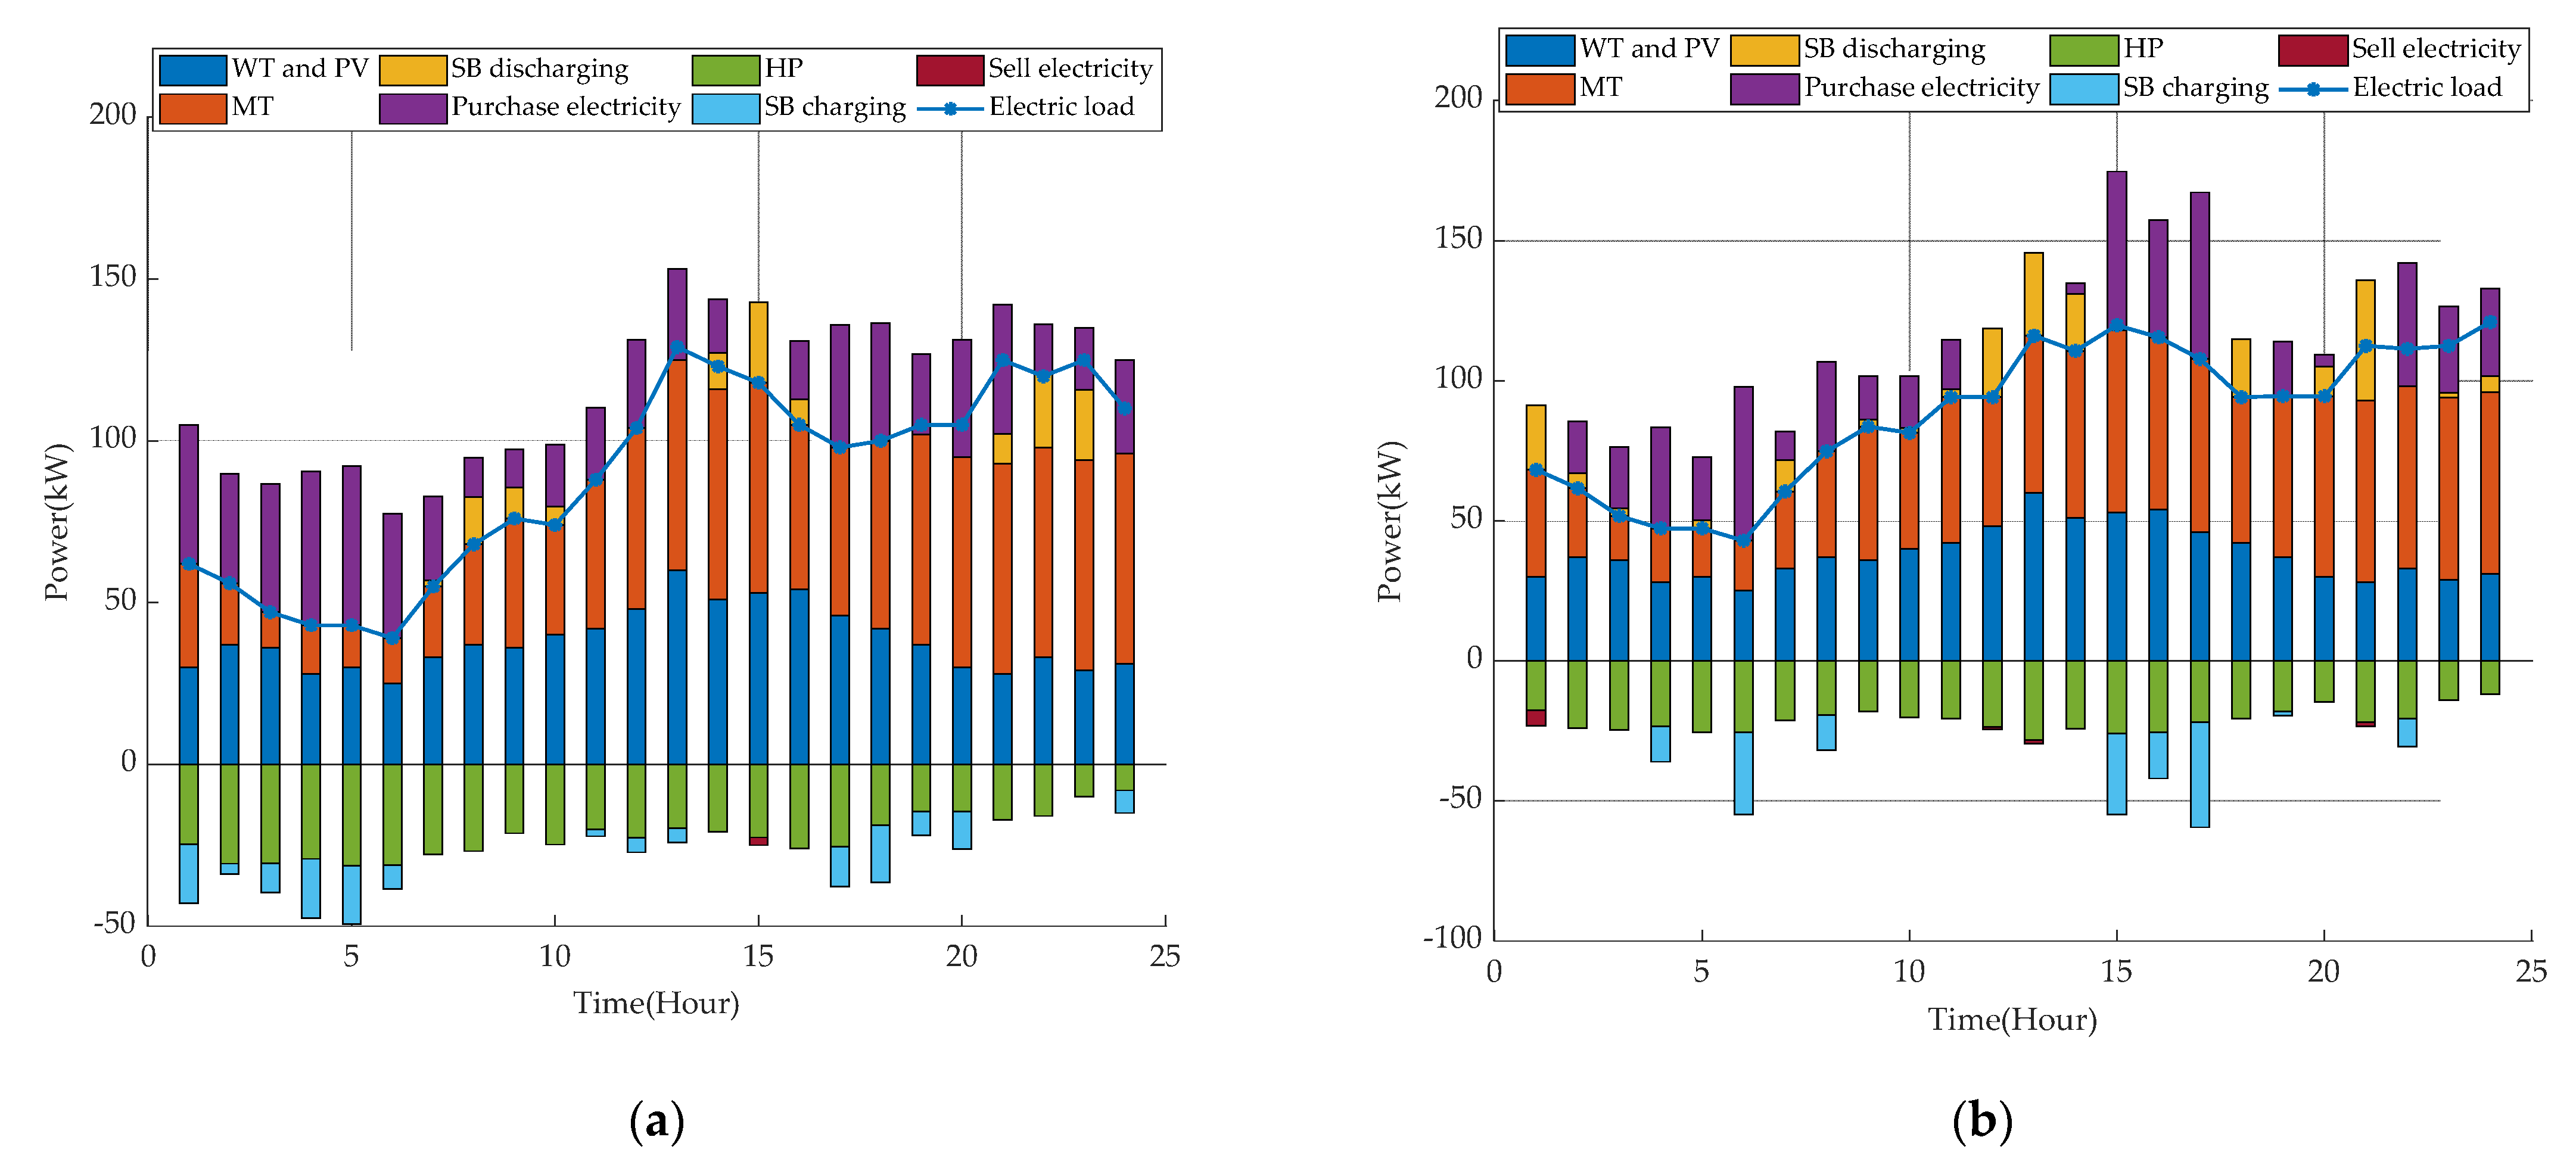
5.2. Analysis of Simulation Results

The resulting costs obtained from the four cases are summarized in Table 4. By comparing case 3 and case 1, it can be clearly seen that the economic benefit of the CCHP system is better than that of the separating supply system. Compared with case 3, the costs of case 4 are reduced by 5.20% and 5.76%. After considering the demand side response, the performance of the CCHP system is effectively improved.
Since this paper studies the impact of demand response on the CCHP system, a detailed comparative analysis of case 3 and case 4 is carried out.
In the first stage, this study simplified the load that can participate in the adjustment at each moment. Assume that the adjustable load at time t account for 10% of the total load. That is, the total load is regarded as the load limit, and the amount of load involved in regulation fluctuates within 10% of the load limit [15]. After the first stage of optimization, the adjusted loads in summer and winter in case 4 are shown in Figure 4. It can be seen that after the adjustment, the peak–valley difference of electric load in summer and winter decreased by 13.2% and 22.89%, respectively, which played a role in peak clipping and valley filling and reduced the disturbance to the power grid. Since users are sleeping at night and have less demand for hot and cold loads, this solution reduces the supply at night and increases the supply during the day. This is more in line with user behavior and habits, and user satisfaction remains above 90%.
In the second stage, the optimized load obtained in the first stage is used as the initial data, and the economic dispatch model is solved to obtain the total operating cost of the system and the output of each set of equipment.
The operating costs of case 3 and case 4 in summer are shown in Table 5. After demand response, the total cost is reduced by 5.20%. The results of economic dispatch are shown in Figure 5. It can be seen from the figure that wind power and photovoltaic power generation at first meet the electrical load. After taking into account the demand response, the electricity demand and cooling demand at night both decreased, so the output of the MT and HP decreased. Compared with case 3, the way of supplying power to the HP during the peak electricity price periods (12:00–14:00, 20:00–21:00) changed from purchasing electricity from the grid to battery discharging, which reduced the cost. At 6:00 and 15:00–17:00, the electricity price is lower and the battery is charged to store electricity.
Figure 6 shows the output changes of each equipment in summer for case 3 and case 4. The average load rate of MT increased from 69.16% to 72.03%, which improved the utilization rate. At the same time, the output of HP decreased, leading to a reduction in power purchases and ultimately reducing total operating costs.
The operating costs of case 3 and case 4 in winter are shown in Table 6. After demand response, the total cost is reduced by 5.76%. The results of economic dispatch are shown in Figure 7. In case 4, the battery is charged to store electricity during the valley electricity price periods (3:00–4:00). In the peak electricity price periods (11:00–12:00, 14:00, 18:00, 21:00), the battery discharges; in addition to meeting the needs of the HP, it also sells electricity to the grid for revenue. Since this study adopts a hybrid operation strategy [40], the operation mode of the battery becomes particularly important.
Figure 8 shows the output changes of each set of equipment in winter for case 3 and case 4. Similar to summer, the output of MT increased, and the average load rate rose from 61.3% to 66.66%. The increase in the output of micro MT and the decrease in the output of HP led to a reduction in power purchases, thereby reducing the total cost.
In order to verify the effectiveness of the improved algorithm, this paper takes the winter scheduling scheme as an example, and uses the particle swarm algorithm (PSO), firefly algorithm (FA), whale optimization algorithm (WOA), artificial bee colony algorithm (ABC) and improved artificial bee colony algorithm (IABC) to solve it. Each algorithm was run 20 times, and their maximum, minimum, mean and standard deviation are shown in Table 7. It can be seen that although IABC has no advantage in convergence time, it provides lower running cost sand better search performance. At the same time, the minimum standard deviation of IABC also proves its strong stability.

6. Conclusions

The economic scheduling problem of the CCHP system is a complex, multi-decision problem. In this study, a two-stage optimization operation method based on IABC is proposed, and a demand-side optimization model and a supply-side optimization model are established. In the first stage, the demand curve is optimized by the target load function and the user satisfaction function, which not only maintains the maximum satisfaction of users but also prevents the occurrence of reverse peak-to-valley differences. In the second stage, with the goal of minimizing fuel, maintenance and environmental treatment costs, a supply-side optimization model is established to optimize equipment output. In the solution method, IABC avoids the problem of affecting the simulation effect due to the input of more parameters and improves the search ability and accuracy compared with the original algorithm.
Taking a typical residential building in the north as an example, the effectiveness of the proposed scheme was verified. The simulation results show that after the first stage of optimization, the load peak–valley difference in summer and winter is reduced by 13.2% and 22.89%, respectively, which reduces the disturbance to the power grid. At the same time, user satisfaction remains above 90%. After considering the demand-side response, the total operating costs of the system are reduced by 5.20% and 5.76%, respectively. Therefore, the two-stage scheduling scheme greatly reduces the operating costs of the system on the basis of satisfying user satisfaction and reducing grid disturbance.
To verify the effectiveness of the improved algorithm, this study compared IABC with a variety of intelligent algorithms. Simulation results show that IABC has higher accuracy and stability when solving nonlinear multi-decision problems.

Author Contributions

Conceptualization, Y.Z.; methodology, Y.Z.; software, Y.Z., Z.Y. and R.X.; validation, Y.Z.; formal analysis, Z.D.; investigation, L.L.; resources, L.L.; writing—original draft preparation, Y.Z.; writing—review and editing, Y.Z. and Z.D.; visualization, M.Q. and Y.W.; project administration, Z.D.; funding acquisition, Z.D. All authors have read and agreed to the published version of the manuscript.

Funding

This research was funded by the Youth Project of the Shandong Natural Science Foundation of China, Funding number: (ZR2017LEE022). Funder: Z.D. and The Key Research and Development Program of Zibo, Shandong, China, Funding number: (2019ZBXC498). Funder: Z.D.

Institutional Review Board Statement

Not applicable.

Informed Consent Statement

Not applicable.

Data Availability Statement

Not applicable.

Conflicts of Interest

The authors declare no conflict of interest.

Nomenclature

tIndex of time intervals H t i , t Adjusted heat load at time t
V M T , t Gas demand of micro gas turbine at time t L t i , t Adjusted cooling load at time t
P M T , t The output power of micro gas turbine at time t E b i , t Electric load involved in regulation at time t
η M T The micro gas turbine efficiency for generating power H b i , t Heat load involved in regulation at time t
L N G Calorific value of natural gas L b i , t Cooling load involved in regulation at time t
Q M T , t Flue gas residual heat of micro gas turbine at time t E m u , t Target value of electrical load at time t
η L Heat loss coefficient of micro gas turbine H m u , t Target value of heat load at time t
L a c , t Refrigeration capacity of absorption chiller at time t L m u , t Target value of cooling load at time t
H w h , t Heating capacity of waste heat boiler at time t C t Electricity price at time t
η r e c Heat recovery efficiency K H Thermoelectric ratio of the demand side
k c o Refrigeration coefficient of absorption chiller K L Cooling-to-electricity ratio of the demand side
k h e Heating coefficient of waste heat boiler F F u e l , t Fuel cost at time t
P H P , t The electric demand of heat pump at time t F E , t Environmental cost at time t
L H P C , t Refrigeration capacity of heat pump at time t F O M , t Maintenance cost at time t
H H P H , t Heating capacity of heat pump at time t F G , t Grid-interaction cost at time t
C H P C Refrigeration coefficient of heat pump C N G Price of natural gas
C H P H Heating coefficient of heat pump P g r i d , t Power purchased and sold with the grid at time t
S b a t , t Capacity of the battery at time t C b u y , t Electricity purchase price at time t
P b a t c , t Charging power of the battery at time t C s e l l , t Electricity selling price at time t
P b a t d , t Discharge power of the battery at time t P W T , t Output power of wind turbine at time t
σ Self-discharge rate of the battery P P V , t Output power of photovoltaic at time t
η b a t c Charging efficiency of the battery P l o a d , t Electrical load at time t
η b a t d Discharge efficiency of the battery H h l o a d , t Heat load at time t
S t o t a l , t Total load at time t L c l o a d , t Cooling load at time t
S b a s i c , t Fixed load at time t S b a t · m i n Minimum capacity of the battery
S k t , t Adjustable load at time t S b a t · m a x Maximum capacity of the battery
S t i , t Adjusted user load at time t S b a t · n o m Rated capacity of the battery
S b i , t The amount of load involved in regulation at time t P b a t · c m a x Maximum charging power of the battery
S b i m a x , t Maximum power involved in regulation at time t P b a t · d m a x Maximum discharge power of the battery
S b i m i n , t Minimum power involved in regulation at time t P M T · m a x Maximum output power of micro gas turbine
E y l o a d , t Predicted electrical load at time t P H P · m a x Maximum output power of heat pump
H y l o a d , t Predicted heat load at time t P g · m i n Upper limit of interaction with the grid
L y l o a d , t Predicted cooling load at time t P g · m a x Lower limit of interaction with the grid
E t i , t Adjusted electrical load at time t

References

  1. Zhou, X.Q.; Yu, Z.W.; Ai, Q.; Zeng, S.Q. Review of optimal dispatch strategy of microgrid with CCHP system. Electr. Power Autom. Equip. 2017, 37, 26–33. [Google Scholar] [CrossRef]
  2. Gao, L.; Hwang, Y.; Cao, T. An overview of optimization technologies applied in combined cooling, heating and power systems. Renew. Sustain. Energy Rev. 2019, 114, 109344. [Google Scholar] [CrossRef]
  3. Azeem, O.; Ali, M.; Abbas, G.; Uzair, M.; Qahmash, A.; Algarni, A.; Hussain, M. A Comprehensive Review on Integration Challenges, Optimization Techniques and Control Strategies of Hybrid AC/DC Microgrid. Appl. Sci. 2021, 11, 6242. [Google Scholar] [CrossRef]
  4. Tan, K.M.; Babu, T.S.; Ramachandaramurthy, V.K.; Kasinathan, P.; Solanki, S.G.; Raveendran, S.K. Empowering smart grid: A comprehensive review of energy storage technology and application with renewable energy integration. J. Energy Storage 2021, 39, 102591. [Google Scholar] [CrossRef]
  5. Geng, J.; Yang, D.M.; Gao, Z.P.; Chen, Y.H.; Liu, G.; Chen, H. Optimal operation of distributed integrated energy microgrid with CCHP considering energy storage. Electr. Power Eng. Technol. 2021, 40, 25–32. [Google Scholar] [CrossRef]
  6. Mahian, O.; Mirzaie, M.R.; Kasaeian, A.; Mousavi, S.H. Exergy analysis in combined heat and power systems: A review. Energy Convers. Manag. 2020, 226, 113467. [Google Scholar] [CrossRef]
  7. Chen, X.; Xu, Q.S.; Yang, Y.B. Day-ahead Optimized Economic Dispatch of CCHP Microgrid Considering Wind Power Uncertainty. Electr. Power Constr. 2020, 41, 107–113. [Google Scholar] [CrossRef]
  8. Li, Y.; Zhang, F.; Li, Y.; Wang, Y. An improved two-stage robust optimization model for CCHP-P2G microgrid system considering multi-energy operation under wind power outputs uncertainties. Energy 2021, 223, 120048. [Google Scholar] [CrossRef]
  9. Xie, M.; Ke, S.J.; Ji, X.; Cheng, P.J.; Liu, M.B. Microgrid Dynamic Economic Dispatch Considering Wind-solar Complementary Characteristics. Smart Power 2017, 45, 9–14, 20. [Google Scholar]
  10. Qu, Y.J.; Sun, J.T.; Chen, G. Integrated Optimization Scheduling Method for Renewable Energy System with Pumped Storage Power Station. Guangdong Electr. Power 2019, 32, 79–88. [Google Scholar] [CrossRef]
  11. Sun, Y.X. Research on Renewable Energy Power Forecasting, Load Forecasting and Energy Management Strategy of CCHP System with Compressed Air Energy Storage. Master’s Thesis, Shandong University, Shandong, China, 2019. [Google Scholar]
  12. Wang, G.L.; Yang, X.; Ma, L.; Zhou, J.Q.; Shen, G.H.; Wang, W.L. Status quo and prospects of geothermal energy in heat supply. Huadian Technol. 2021, 43, 15–24. [Google Scholar] [CrossRef]
  13. Wang, J.; Zhong, H.; Ma, Z.; Xia, Q.; Kang, C. Review and prospect of integrated demand response in the multi-energy system. Appl. Energy 2017, 202, 772–782. [Google Scholar] [CrossRef]
  14. Li, Y.; Yang, Z.; Zhao, D.; Lei, H.; Cui, B.; Li, S. Incorporating energy storage and user experience in isolated microgrid dispatch using a multi-objective model. IET Renew. Power Gener. 2019, 13, 973–981. [Google Scholar] [CrossRef] [Green Version]
  15. Chen, H.; Gao, L.; Zhang, Z. Multi-objective optimal scheduling of a microgrid with uncertainties of renewable power generation considering user satisfaction. Int. J. Electr. Power Energy Syst. 2021, 131, 107142. [Google Scholar] [CrossRef]
  16. Cui, Q.; Ma, P.; Huang, L.; Shu, J.; Luv, J.; Lu, L. Effect of device models on the multiobjective optimal operation of CCHP microgrids considering shiftable loads. Appl. Energy 2020, 275, 115369. [Google Scholar] [CrossRef]
  17. Xu, H.; Meng, Z.; Zhao, R.; Wang, Y.; Yan, Q. Optimal Dispatching Strategy of an Electric-Thermal-Gas Coupling Microgrid Considering Consumer Satisfaction. IEEE Access 2020, 8, 173169–173176. [Google Scholar] [CrossRef]
  18. Yang, H.H.; Tang, P.P.; Huang, W.T. Multi-Objective Optimal Dispatch of Microgrid Based on Demand Side Management Considering User Satisfaction. Electr. Meas. Instrum. Available online: http://kns.cnki.net/kcms/detail/23.1202.TH.20210202.1741.002.html (accessed on 11 August 2021).
  19. Ma, Y.; Li, C.; Zhou, J.; Zhang, Y. Comprehensive stochastic optimal scheduling in residential micro energy grid considering pumped-storage unit and demand response. J. Energy Storage 2020, 32, 101968. [Google Scholar] [CrossRef]
  20. Liu, Z.; Zhao, Y.; Wang, X. Long-term economic planning of combined cooling heating and power systems considering energy storage and demand response. Appl. Energy 2020, 279, 115819. [Google Scholar] [CrossRef]
  21. Li, Y.K.; Han, J.B.; Wang, Q.; Yang, M.; Zhao, J.; Li, X.; Li, X.L. Integrated energy load priority scheduling model based on Fbprophet prediction algorithm and customer satisfaction constraints. J. North China Electr. Power Univ. 2021, 48, 81–89. [Google Scholar] [CrossRef]
  22. Wu, C.; Gu, W.; Xu, Y.; Jiang, P.; Lu, S.; Zhao, B. Bi-level optimization model for integrated energy system considering the thermal comfort of heat customers. Appl. Energy 2018, 232, 607–616. [Google Scholar] [CrossRef]
  23. Yuce, B.; Rezgui, Y.; Mourshed, M. ANN–GA smart appliance scheduling for optimised energy management in the domestic sector. Energy Build. 2016, 111, 311–325. [Google Scholar] [CrossRef]
  24. Su, Y.; Zhou, Y.; Tan, M. An interval optimization strategy of household multi-energy system considering tolerance degree and integrated demand response. Appl. Energy 2019, 260, 114144. [Google Scholar] [CrossRef]
  25. Dolatabadi, A.; Mohammadi-Ivatloo, B. Stochastic risk-constrained scheduling of smart energy hub in the presence of wind power and demand response. Appl. Therm. Eng. 2017, 123, 40–49. [Google Scholar] [CrossRef]
  26. Jing, R.; Wang, M.; Wang, W.; Brandon, N.; Li, N.; Chen, J.; Zhao, Y. Economic and environmental multi-optimal design and dispatch of solid oxide fuel cell based CCHP system. Energy Convers. Manag. 2017, 154, 365–379. [Google Scholar] [CrossRef]
  27. Chen, X.; Liu, Y.; Li, B. Adjustable robust optimization in enabling optimal day-ahead economic dispatch of CCHP-MG considering uncertainties of wind-solar power and electric vehicle. J. Ind. Manag. Optim. 2021, 17, 1639. [Google Scholar] [CrossRef] [Green Version]
  28. Qi, X.M.; Kong, L.; Xiong, H.; Pei, W.; Xiao, H. Stochastic optimal operation of integrated cooling, heating and power energy system considering coordination of source-load-storage. Adv. Technol. Electr. Eng. Energy 2021, 40, 10–21. [Google Scholar] [CrossRef]
  29. Wang, S.; Fan, X.; Han, L.; Ge, L. Improved Interval Optimization Method Based on Differential Evolution for Microgrid Economic Dispatch. Electr. Power Components Syst. 2015, 43, 1882–1890. [Google Scholar] [CrossRef]
  30. Aidong, Z.; Sipeng, H.; Qingshan, X.; Yujun, L.; Yu, H. A Day-Ahead Optimal Economic Dispatch Schedule for Building CCHP System Based on Centralized Energy Storage Infrastructure. Electron. Electr. Eng. 2018, 24, 53–58. [Google Scholar] [CrossRef] [Green Version]
  31. Zhang, K.; Feng, P.; Zhang, G.; Xie, T.; Hou, J.; He, X. The Bi-Level Optimal Configuration Model of the CCHP System Based on the Improved FCM Clustering Algorithm. Processes 2021, 9, 907. [Google Scholar] [CrossRef]
  32. Qi, Y.; Shang, X.J.; Nie, J.Y.; Huo, X.X.; Wu, B.Y.; Su, W.H. Optimization of CCHP Micro-Grid Operation Based on Improved Multi-Objective Grey Wolf Algorithm. Electr. Meas. Instrum. Available online: http://kns.cnki.net/kcms/detail/23.1202.TH.20200713.1636.016.html (accessed on 27 August 2021).
  33. Wang, L.; Singh, C. Stochastic combined heat and power dispatch based on multi-objective particle swarm optimization. Int. J. Electr. Power Energy Syst. 2008, 30, 226–234. [Google Scholar] [CrossRef]
  34. Yuan, X.; Liu, Y.; Bucknall, R. Optimised MOPSO with the grey relationship analysis for the multi-criteria objective energy dispatch of a novel SOFC-solar hybrid CCHP residential system in the UK. Energy Convers. Manag. 2021, 243, 114406. [Google Scholar] [CrossRef]
  35. Yun, B.J.; Bai, S.K.; Zhang, G. Optimization of CCHP system based on a chaos adaptive particle swarm optimization algorithm. Power Syst. Prot. Control. 2020, 48, 123–130. [Google Scholar] [CrossRef]
  36. Li, B.; Hu, P.; Zhu, N.; Lei, F.; Xing, L. Performance analysis and optimization of a CCHP-GSHP coupling system based on quantum genetic algorithm. Sustain. Cities Soc. 2019, 46, 101408. [Google Scholar] [CrossRef]
  37. Cao, Y.; Wang, Q.; Wang, Z.; Jermsittiparsert, K.; Shafiee, M. A new optimized configuration for capacity and operation improvement of CCHP system based on developed owl search algorithm. Energy Rep. 2020, 6, 315–324. [Google Scholar] [CrossRef]
  38. Zhi, Y.; Weiqing, W.; Haiyun, W.; Khodaei, H. Improved butterfly optimization algorithm for CCHP driven by PEMFC. Appl. Therm. Eng. 2019, 173, 114766. [Google Scholar] [CrossRef]
  39. Li, L.-L.; Zheng, S.-J.; Tseng, M.-L.; Liu, Y.-W. Performance assessment of combined cooling, heating and power system operation strategy based on multi-objective seagull optimization algorithm. Energy Convers. Manag. 2021, 244, 114443. [Google Scholar] [CrossRef]
  40. Kang, L.; Yang, J.; An, Q.; Deng, S.; Zhao, J.; Wang, H.; Li, Z. Effects of load following operational strategy on CCHP system with an auxiliary ground source heat pump considering carbon tax and electricity feed in tariff. Appl. Energy 2016, 194, 454–466. [Google Scholar] [CrossRef]
  41. Vlot, M.C.; Knigge, J.D.; Slootweg, J.H. Economical Regulation Power Through Load Shifting With Smart Energy Appliances. IEEE Trans. Smart Grid 2013, 4, 1705–1712. [Google Scholar] [CrossRef] [Green Version]
  42. Li, G.; Niu, P.; Xiao, X. Development and investigation of efficient artificial bee colony algorithm for numerical function optimization. Appl. Soft Comput. 2012, 12, 320–332. [Google Scholar] [CrossRef]
  43. Motahhir, S.; Chouder, A.; El Hammoumi, A.; Benyoucef, A.S.; El Ghzizal, A.; Kichou, S.; Kara, K.; Sanjeevikumar, P.; Silvestre, S. Optimal Energy Harvesting From a Multistrings PV Generator Based on Artificial Bee Colony Algorithm. IEEE Syst. J. 2020, 15, 4137–4144. [Google Scholar] [CrossRef]
  44. Yang, Z.P. Research on Coordinated Optimal Scheduling of Micro Energy Grid with CCHP System and Energy Storage. Master’s Thesis, Shandong University, Shandong, China, 2019. [Google Scholar]
  45. Liu, C.; Wang, Y.T.; Wang, L.C.; Li, J.Y.; Li, Z.X. Research on the economical operation of the micro-grid with CCHP. Electr. Meas. Instrum. 2015, 52, 31–37. [Google Scholar] [CrossRef]
  46. Wang, W.J.; Yu, L.T.; Han, A.Y.; Zhang, Z.S. Research on optimal scheduling of combined cooling, heating and power system based on MOABC algorithm. Power Demand Side Manag. 2019, 21, 48–53. [Google Scholar] [CrossRef]
Figure 1. CCHP system structure diagram.
Energies 15 03500 g001
Figure 2. Two-stage scheduling scheme.
Energies 15 03500 g002
Figure 3. Typical daily load and predicted power of PV and WT: (a) summer and (b) winter.
Energies 15 03500 g003
Figure 4. Optimization results in case 4: (a) summer and (b) winter.
Energies 15 03500 g004
Figure 5. Economic dispatch results in summer: (a) Case 3 and (b) Case 4.
Energies 15 03500 g005
Figure 6. Changes in equipment output in summer.
Energies 15 03500 g006
Figure 7. Economic dispatch results in winter: (a) Case 3 and (b) Case 4.
Energies 15 03500 g007
Figure 8. Changes in equipment output in winter.
Energies 15 03500 g008
Table 1. Time of use for the electricity price.
Time PeriodPurchase
(CNY/kWh)
Sell
(CNY/kWh)
Peak period11:00–14:00;
18:00–21:00
0.880.66
Flat period7:00–10:00; 15:00–17:00; 22:00–23:000.510.4
Valley period24:00–6:000.170.12
Table 2. Pollutant emission parameters of micro gas turbine [35,46].
Polluted GasEmission Coefficient
(g/kWh)
Emission Cost
(CNY/kg)
CO23860.21
SO20.003614.84
NOX0.262.96
Table 3. The parameters of the equipment in CCHP System.
EquipmentParametersValueEquipmentParametersValue
PV [44] P m a x 50 kWWHB [46] k O M 0.03 CNY/kW
k O M 0.029 CNY/kW k h e 1.1
WT [44] P m a x 50 kWAC [11] k O M 0.02 CNY/kW
k O M 0.025 CNY/kW k c o 0.9
MT [35,44] P M T · m a x 65 kWGSHP [40] P H P · m a x 60 kW
k O M 0.025 CNY/kW k O M 0.026 CNY/kW
L N G 9.7 kWh/m3 C H P C , C H P H 3.5
C N G 2.05 CNY/m3SB [44] k O M 0.0018 CNY/kW
η L 0.03 S b a t · m a x , S b a t · m i n 120 kW, 30 kW
η r e c 0.85 σ 0.001
Grid P g · m a x , P g · m i n 60 kW, −60 kW η b a t c , η b a t d 0.95
Table 4. Typical daily operation costs of the four cases in winter and summer.
SeasonCase 1 (¥)Case 2 (¥)Case 3 (¥)Case 4 (¥)
Summer1888.11859.31304.791237
Winter15641544.91042.02981.98
Table 5. Cost comparison of case 3 and case 4 in summer.
CasesFuel Cost/¥Environmental Cost/¥Maintenance Cost/¥Power Purchase Cost/¥Total
Case 3760.1291.8120.73332.141304.79
Case 4791.6495.61123.71226.041237.00
Table 6. Cost comparison of case 3 and case 4 in winter.
Dispatch StrategyFuel Cost/¥Environmental Cost/¥Maintenance Cost/¥Power Purchase Cost/¥Total
Case 3673.6481.35109.94177.091042.02
Case 4732.5488.47116.3644.61981.98
Table 7. Cost comparison of different algorithms.
Value (¥)PSOFAWOAABCIABC
Maximum1092.991099.931111.051029.97989.64
Minimum1016.391010.481066.601010.56981.98
Mean1053.991060.921081.871020.00985.84
Standard Deviation28.1023.4712.286.162.57
Average Convergence Time/s185.37273.86246.17351.86263.19
Publisher’s Note: MDPI stays neutral with regard to jurisdictional claims in published maps and institutional affiliations.

