Article

Effect of In-Pore Wettability on Mass Transfer Performance of Fuel Cell Gas Diffusion Layer

1
School of Mechanical Engineering and Automation, Fuzhou University, Fuzhou 350002, China
2
School of Information and Electromechanical Engineering, Ningde Normal University, Ningde 350900, China
*
Author to whom correspondence should be addressed.
These authors contributed equally to this work.
Energies 2022, 15(10), 3474; https://doi.org/10.3390/en15103474
Submission received: 7 March 2022 / Revised: 30 April 2022 / Accepted: 1 May 2022 / Published: 10 May 2022

Abstract

:
The gas diffusion layer (GDL), as the main mass transfer carrier in a hydrogen fuel cell, transports fuel and discharges water, the only by-product of the electrochemical reaction. The dispersion process of water in the pore will hinder the diffusion of gas, thus reducing the concentration of fuel gas at the catalytic site, resulting in the decrease of the electrochemical reaction rate. In this paper, the effect of wettability in the GDL hole on the water transport process is studied. When the pore wall is hydrophilic, the liquid phase is affected by the gas phase eddy current velocity field, and the particles at the center advance to the edge, forming a liquid phase interface with a thin center and thick edge. With the increase of the wall contact angle, the curvature of the three-phase interface increases, the wall adhesion decreases, and the liquid phase is more likely to be discharged. When the contact angle is 130°, the liquid phase almost does not shift in the hole with a radius of 5 μm. With the increase of the radius or inlet pressure difference, the liquid phase is discharged gradually, and the discharge rate of the liquid phase is only related to the wettability of the wall.

1. Introduction

Energy is the basis of human survival, which is related to the progress and development of human society. Among them, hydrogen energy, as a secondary energy and renewable energy, has been widely used in the field of new energy and is of great significance. The emergence of fuel cells further complements the width and breadth of mobile power consumption, but one of the difficulties in the commercial development of fuel cells lies in their internal multiphase flow coupling effect. Part of the water produced by the electrochemical reaction is attached to the proton exchange membrane (PEM), partly through the PEM to reach the anode, and then that part is electrically dragged back to the cathode and partly flows out with the gas; the water left on the cathode side is partially attached to the electrode and partly flows out with the gas, as shown in Figure 1.
The gas diffusion layer (GDL) is a key component of the fuel cell, which will complete the diffusion transport of fuel gas and the discharge of water. If the water generated in the fuel cell is not discharged in time, it will directly affect the working efficiency of the PEM and electrode, and the problem of water flooding will block the pore diameter, thus reducing the working efficiency of the fuel cell. However, if all the generated water is discharged quickly, there will be PEM dehydration, and when there is less water in the fuel cell, the activity of the catalyst will decrease, which will directly affect the performance and life of the fuel cell.
GDL is a key component of two-phase transport, in which water and gas restrict each other, and a large number of experimental studies have shown that the existence of water can inhibit gas transport to a certain extent, resulting in the “blockage” of the transmission pore size [1,2,3,4,5]. Krisztina Anita Nagy et al. [6] found that because the carbon cloth has a dual pore size distribution, water usually accumulates in larger pores, thus allowing oxygen to be transported to CL in more and smaller pores. When the inner wall of the GDL aperture has a higher surface roughness, it is more beneficial for the water droplets to detach from the surface and reduce the mass transfer loss. Yan yaoBao et al. [7] studied the effect of GDL surface roughness on the removal of water droplets in the flow channel of the fuel cell by the fluid volume method. The simulation results showed that the three different motion modes of droplets on the rough surface were rolling, lifting, and breaking, which were affected by the air velocity. The numerical solution showed that, for a given channel geometry, the optimal air velocity was most beneficial to the water management in the GDL channel. A Bazylak et al. [8] found that the hydrophobic material attached to GDL fiber was damaged by a fracture deformation with high roughness, which reduced the hydrophobicity of the GDL, and the compressed area became the priority path for liquid water transport. Therefore, the removal, state, and diffusion of water in the fuel cell are affected by many factors, and the effect of water on the performance of fuel cells is particularly prominent.
The effect of uneven PTFE distribution on the local porosity of the GDL is important, and its drying rate after soaking will affect the distribution of PTFE in the material. Fast-drying of the suspension resulted in two regions of high PTFE concentrations near the surface of the GDL, and slow drying of the suspension resulted in an excessively high PTFE concentration in the central region of the GDL. Alink, R. et al. [9] found that porosity is not a critical factor limiting the current density, and the oxygen diffusion was also improved when the liquid phase saturation distribution was optimized. In the review by Ji, M. et al. [10], it was shown that hydrophobic pores provide channels for gas transport, while hydrophilic pores facilitate the transport of liquid water, and as the content of PTFE increases, its electrical conductivity decreases, porosity decreases, and mass transfer resistance increases. Lin, G. et al. [11] believed that the optimal ratio of hydrophobic and hydrophilic pores depends on the pore size and its distribution. Reshetenko, TV et al. [12] found that the local changes of PTFE have an impact on the space and overall performance of the fuel cell. At a high current density, the local performance of the fuel cell decreased when the PTFE loading increased, but in a low humidity environment, this effect will be moderated. C, J, Hwan et al. [13] found that an increase in the PTFE also resulted in an increase in the GDL thickness, a decrease in gas permeability, and through-plane conductivity. In the low-current density region, water saturation has almost no effect on the battery performance. In the high-current density region, water first exists in the form of steam and then gradually condenses into a liquid state, and the water yield is greater. Wang Chen et al. [14] analyzed the effect of PTFE loading and distribution on liquid flow utilizing a LBM simulation. Under the action of the hydrophobic agent, the liquid first selectively occupies the larger pores, and as the reaction proceeds, the liquid water is discharged onto some preferential flow paths. SungHyunKwon et al. [15] used the capillary siphon method to prepare the GDL with a PTFE concentration gradient along the vertical direction. They found that excess PTFE would lead to CL overflow, the reason being that excess PTFE led to an increase of the hydrophobic pores, and the experimental results showed that GDL with a concentration gradient at 20 wt% PTFE is beneficial for water management of the PEMFC.
Previous works mostly focused on the effect of hydrophobicity or hydrophobic agent contents on the mass transfer performance of the GDL, but there were a few studies on the effect of wettability on the liquid phase behavior and mass transfer. For the study of GDL water management, the wettability of the pore walls is the key to affecting two-phase transport.

2. Experiment and Method

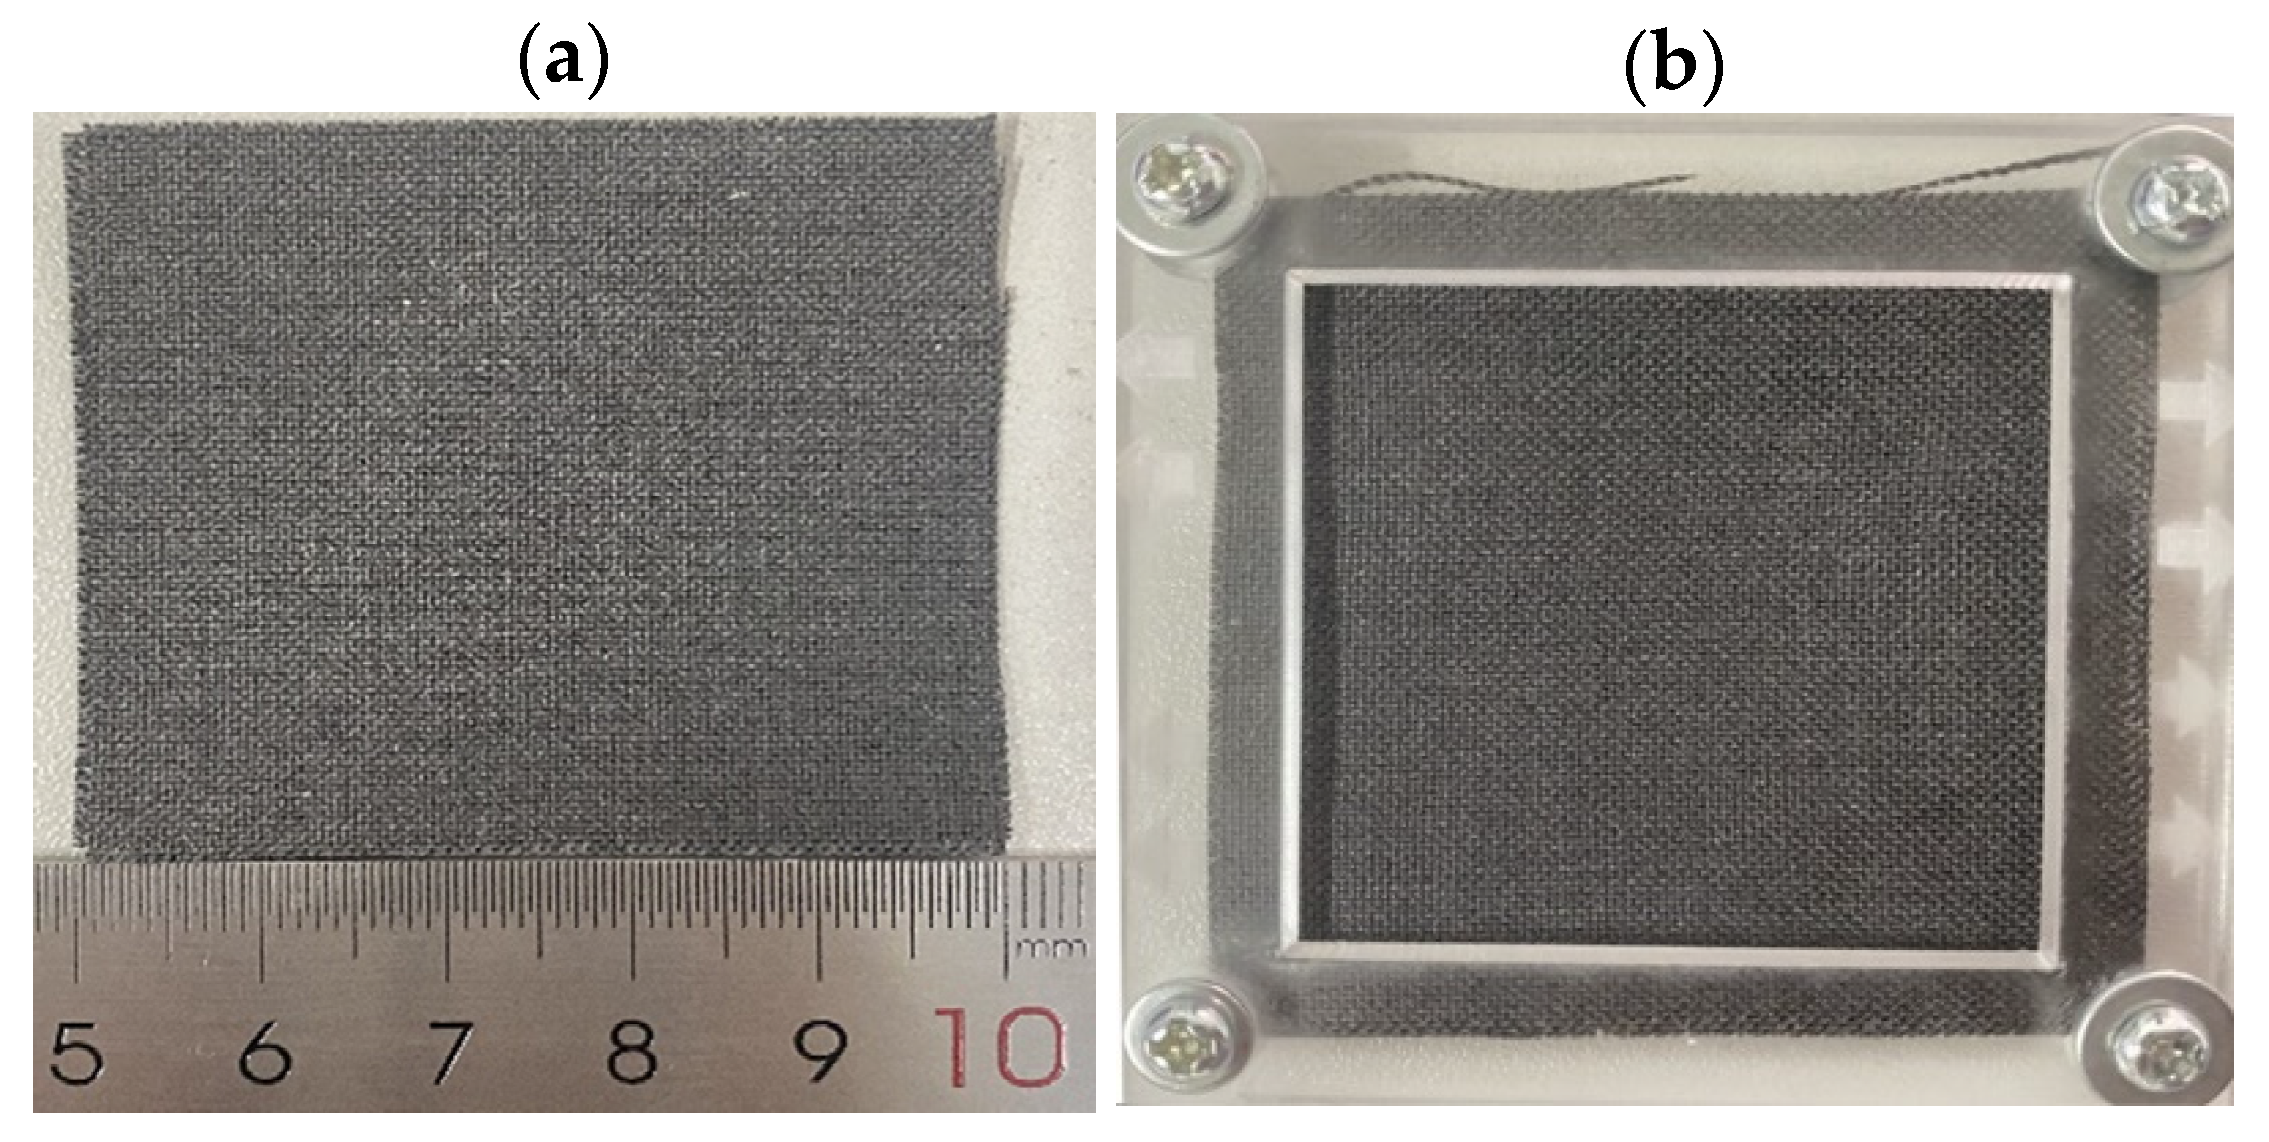
2.1. Preparation of Hydrophilic and Hydrophobic Carbon Cloth

The raw carbon cloth (Taiwan carbon energy, WOS1002) was immersed in deionized water by ultrasonic oscillating for 20 min, then immersed in 30 wt% hydrogen peroxide solution, placed in the oven at 80 °C for 1 h, dried, and calcined in air at 450 °C for 2 h, washed with deionized water, and dried to get a hydrophilic carbon cloth.
Equipped with 20 wt% PTFE emulsion, sprayed on carbon cloth, placed in an oven for 1.5 h, then calcined in a natural environment at 380 °C for 2 h and washed with deionized water to dry, hydrophobic carbon cloth was obtained and set aside. The size of carbon cloth and the area of hydrophobic coating are shown in Figure 2.

2.2. Numerical Simulation

The numerical model is simple to simulate the two-phase transfer process in the pore diameter, in which the interface contact angle [16,17,18] is used to characterize the wettability of the pore wall, and the contact angle θ > 90° is hydrophobic; in the contrast, it is hydrophilic.
In the model, the simulation aperture can be obtained by rotating the rectangle through the Y-axis. As shown in Figure 3, domain 1 is the gas chamber, domain 2 is the liquid chamber, the intake direction is the negative direction of the Y-axis, and domain 3 is the simulation reserved collection chamber, which is used to count the liquid outflow value. To meet the reality that the axial direction of the aperture is mostly horizontal or less vertical, the gravity distribution points to the negative half of the X-axis. The interface contact Angle definition is shown in Figure 4.

2.2.1. Representation of Fluid Interfaces and Convection

The set function Ф is introduced to distinguish the two phases. The liquid interface is represented by the 0.5 isolines of the set function. The set function is expressed as a volume fraction, Ф = 0 is expressed as a gas, and Ф = 1 is expressed as a liquid. The transfer of the fluid interface separating the two phases is given by the following formula:
Ф t + u Ф = γ · ( ε Ф Ф ( 1 Ф ) Ф | Ф | )
The ε parameter determines the thickness of the two-phase contact interface, ε = hc/2, and hc is the mesh size in the area through which the interface passes. The gamma parameter determines the number of reinitializations, which is the maximum speed that occurs in the model. The density and viscosity are:
ρ = ρ a i r + ( ρ w a t e r ρ a i r ) Ф
μ = μ a i r + ( μ w a t e r μ a i r ) Ф
Similarly, the dynamics of the two-phase flow are controlled by the Cahn-Hilliard [19] equation, such as the Ф area from −1 to 1, which is divided into two equations:
Ф t + u · Ф = · γ λ ε 2 ψ
ψ = · ε 2 Ф + ( Ф 2 1 ) Ф
where u is the fluid velocity, γ is the mobility, λ is the mixed energy density, and ψ is the auxiliary variable.
To strengthen the contact angle in the boundary force:
F θ = σ δ ( n w a l l · n cos θ w ) n
where θW is the contact angle.
P c = P l P g = 2 σ cos θ w r
The subscripts l and g are the liquid and gas, respectively, r is the capillary radius, and Pc is the capillary pressure.

2.2.2. Mass and Momentum Transfer

The model simulates the mass and momentum transfer of fluids based on the Navier–Stokes equations for incompressible fluids. Its equation is
ρ u t + ρ ( u · ) u = · [ p I + μ ( u + ( u ) T ) ] + F s t + ρ g
· u = 0
Among them, ρ is the density, μ is the dynamic viscosity, u is the viscosity, p is the pressure, I is the unit tensor, g is the gravity vector, Fst is the surface tension acting between the two-phase interface, and T is the temperature of 293.15 K.
F s t = σ δ k n
k = · n is the curvature, n is the interface normal vector, and   δ is the Dirac function.

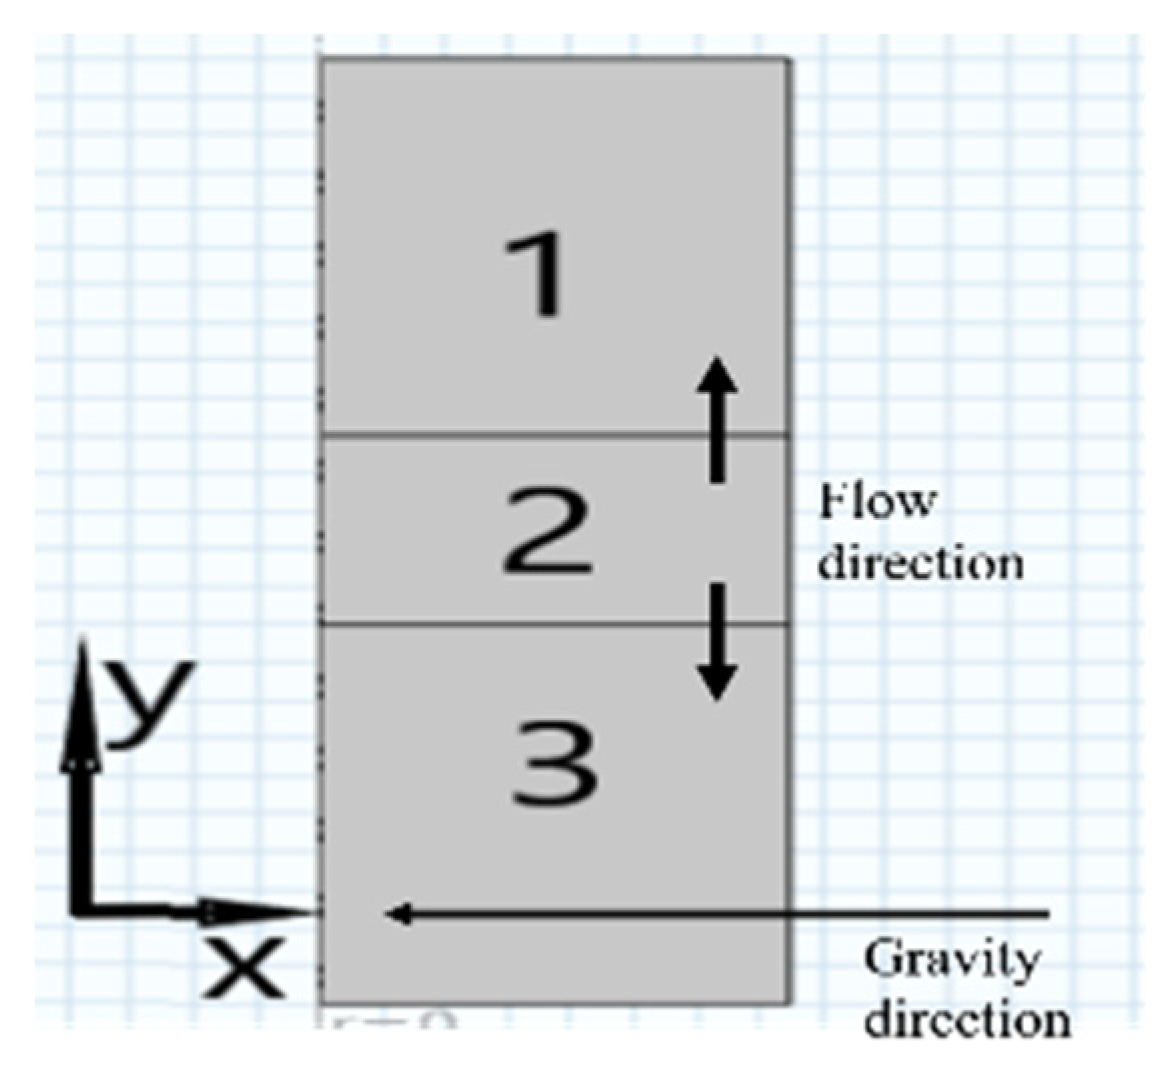
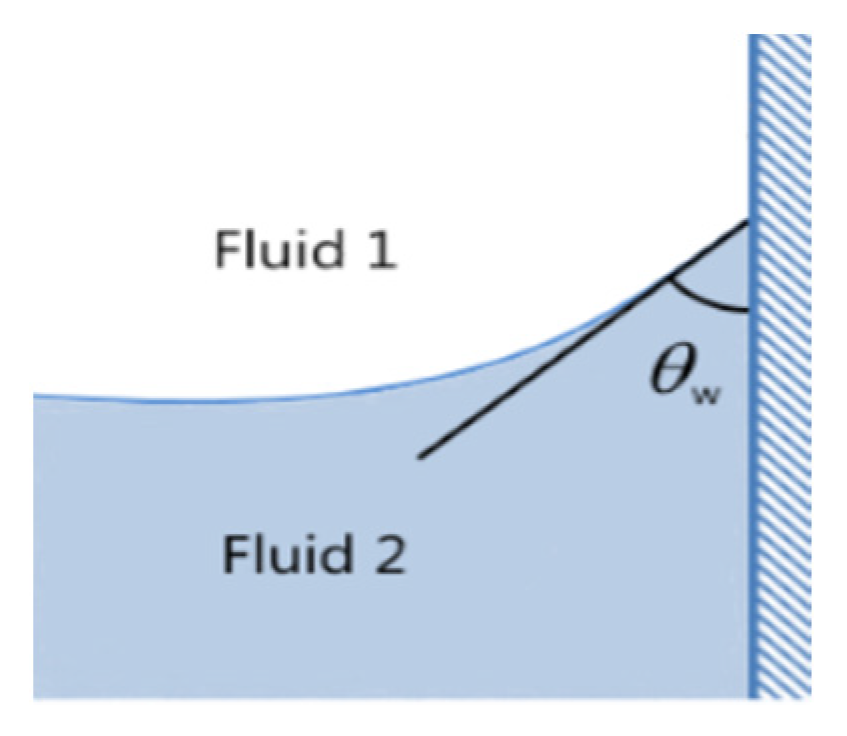
2.2.3. Boundary Conditions

In the case of natural diffusion, the model only needs domain 1 and domain 2, and the liquid will move upward (actually, to the left, in the opposite direction of the intake air) due to the action of adhesion. The velocity component is set to zero. When there is an inlet pressure difference, the inlet is the inlet, p0 is a variable, and the volume fraction of the liquid phase in domain 2 is 1. There is an intake pressure difference, and the liquid movement direction may be the same as the intake direction, so domain 3 is only required to meet the simulation conditions, the outlet selects the lower boundary of domain 3 and ensures hydrostatic pressure compensation and suppression of the backflow, where the static pressure is 0. Ф = 1 in domains 1 and 3, Ф = 0 in domain 2, the wetted wall is the right boundary of domains 2 and 3, and periodic boundary conditions are selected for the rest of the boundaries.
Taking different θ as the cases and selecting the inlet pressure as the variable, the influence of the wettability of the GDL hole wall on gas–liquid two-phase transport is studied. The specific variables are shown in Table 1.

3. Results and Discussion

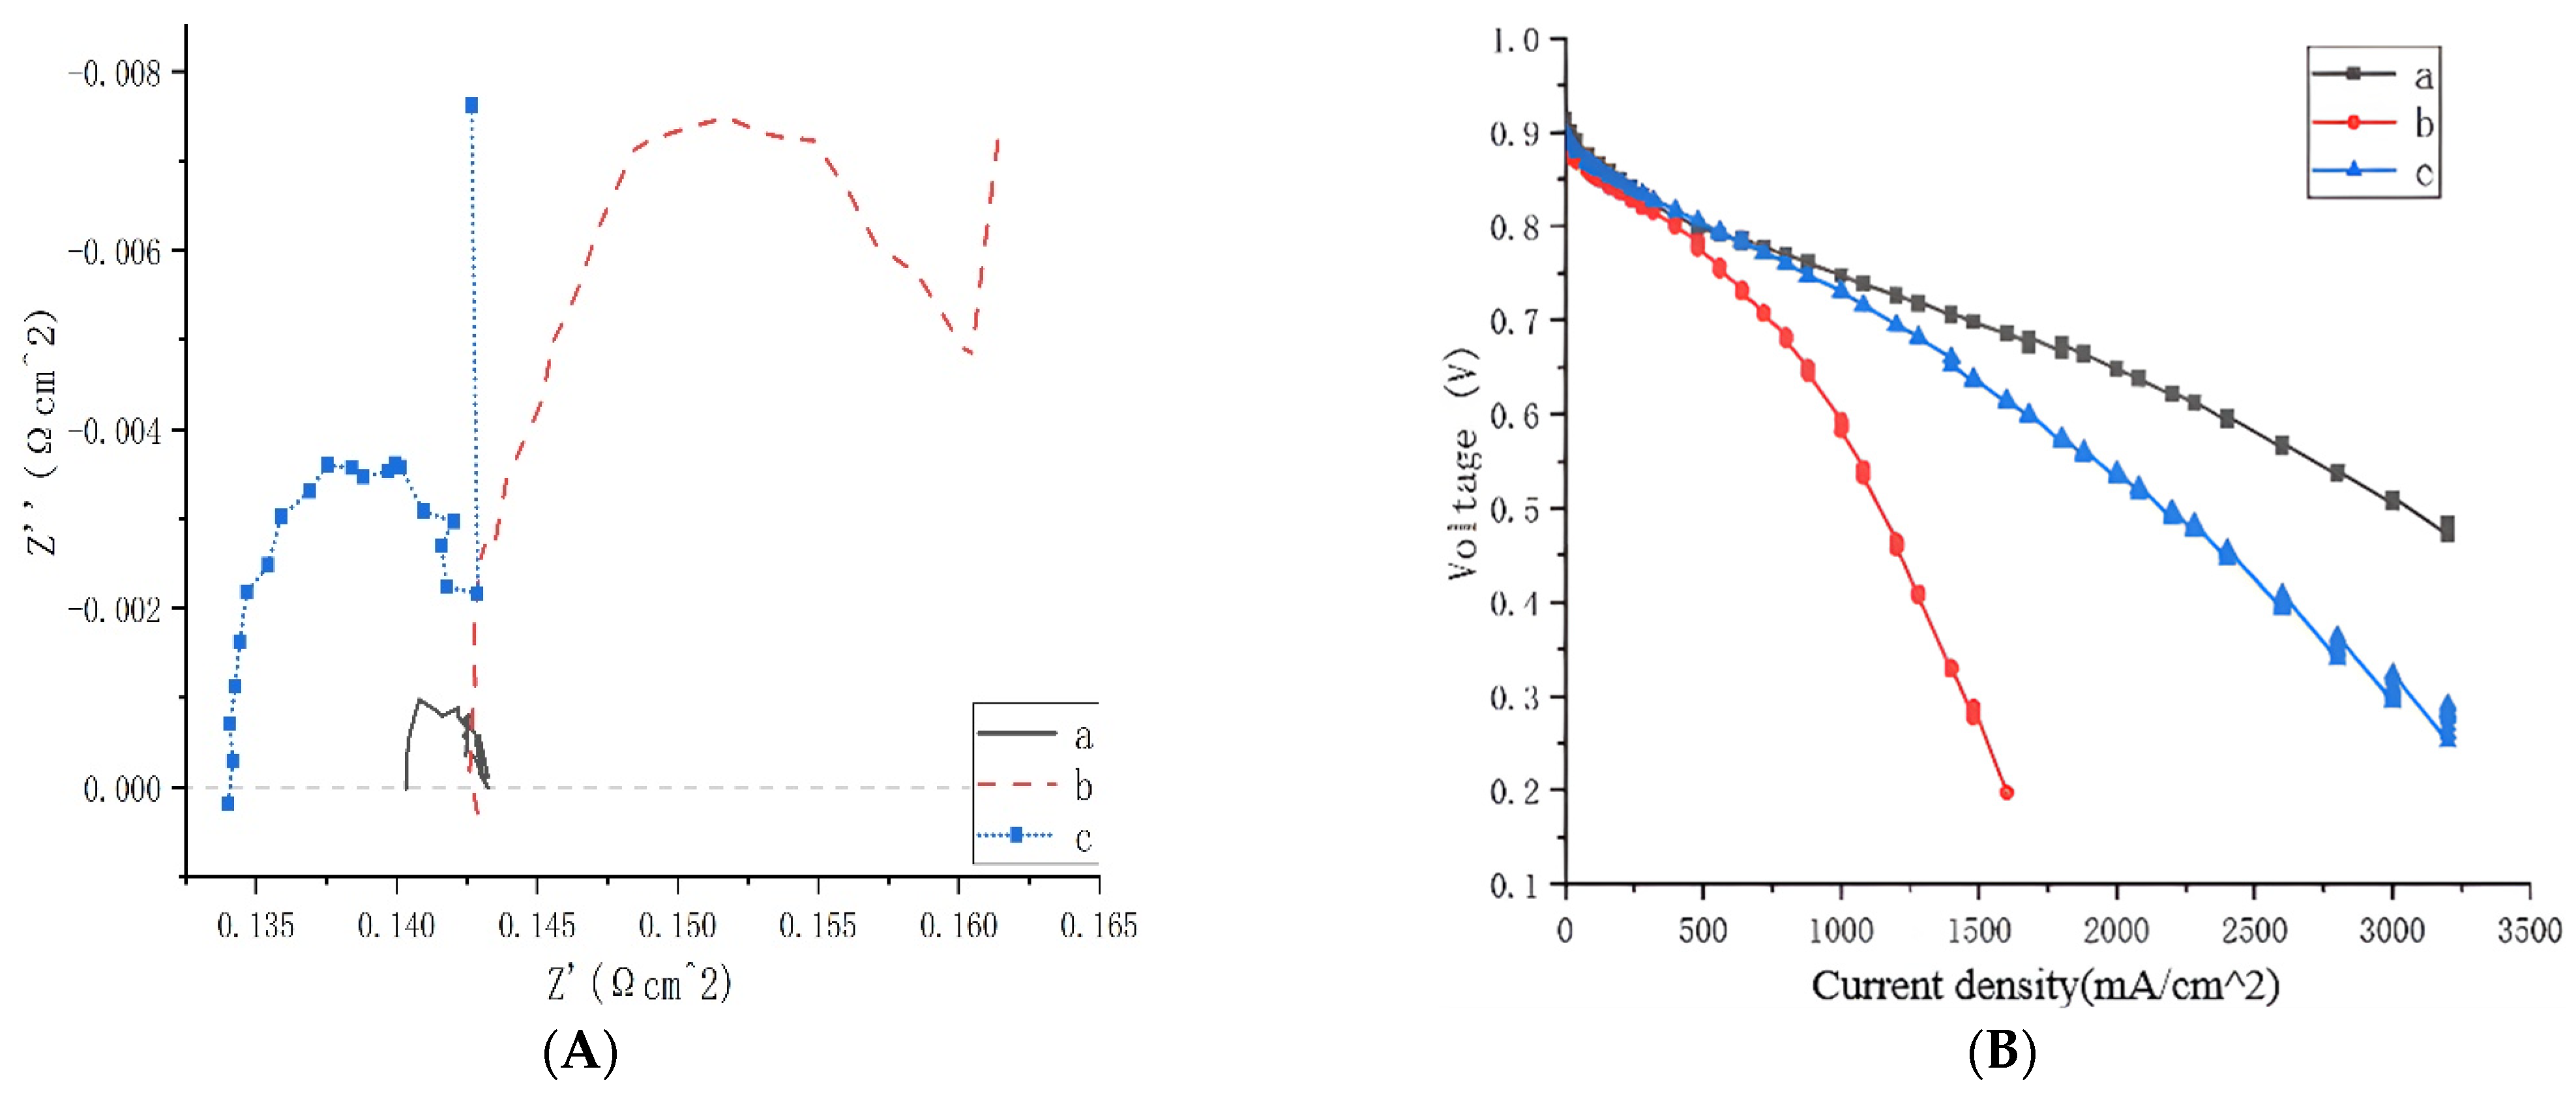
3.1. Electrochemical Test

Figure 5 is the electrochemical test curve, where a, b, and c are the initial carbon cloth, hydrophobic carbon cloth, and hydrophilic carbon cloth, respectively. Figure 5A is the electrochemical impedance spectrum, in which the ohmic impedance of the hydrophobic carbon cloth is larger than that of the hydrophilic carbon cloth; this is because when water is generated on the catalytic site of the catalytic layer, the hydrophobic carbon cloth will directly generate liquid The phase barrier reduces the liquid water saturation inside the pore size, the inside of the GDL pore size remains dry, and the surface roughness is increased under the action of the PTFE, thereby increasing the contact resistance. In addition, with the continuous production of liquid water, a large amount of the liquid phase of the ions converges between the GDL and the proton exchange membrane, causing a flooding problem of the proton exchange membrane, which, in turn, increases the ohmic resistance. The oblique line in the low-frequency region is the Warburg impedance of the ions on the electrode—that is, the diffusion impedance of the ions when they diffuse to the electrode surface. The slashed part in the electrochemical impedance spectrum of the hydrophilic carbon cloth is almost parallel to the imaginary part, which is the characteristic of resistance and capacitance in the series, which is characterized by capacitive ion diffusion, while the initial carbon cloth shows the characteristics of pure resistance and electrochemical capacitance. The hydrophilic carbon cloth is better than the hydrophobic carbon cloth, and at a low frequency, the material transfer of the hydrophobic carbon cloth is a limited layer diffusion, while the hydrophilic carbon cloth is the barrier layer diffusion.
Figure 5B shows the cathode polarization curve of a single cell. The open-circuit voltages of the three-carbon cloths are similar. With the increase of the current density, the voltage of the hydrophobic carbon cloth decreases the fastest, and the limiting current density of the hydrophilic carbon cloth is about 2.2 times that of the hydrophobic carbon cloth. Combined with EIS, it can be seen that the ohmic resistance of the hydrophobic carbon cloth and the hydrophilic carbon cloth is caused by the ohmic resistance of the hydrophobic carbon cloth. The voltage losses are about 214.05 mV and 201.15 mV, respectively, but in the polarization curve, when the current density is 1500 mA/cm2, the voltage value of the hydrophilic carbon cloth is about 2.2 times that of the hydrophobic carbon cloth, resulting in a smaller activation loss. On the contrary, it is a hydrophilic carbon cloth. During the operation of the fuel cell, the hydrophilic carbon cloth can better discharge the liquid phase from the generation site, while the hydrophobic carbon cloth prevents most of the liquid phase from entering the inside of the pore, resulting in the water-flooding problem of the membrane that is also the reason for the rapid drop in the voltage of the hydrophobic carbon cloth in Figure 5B. However, at the same time, due to the high-water content inside the hydrophilic carbon cloth, the transport of fuel is reduced, thereby reducing the concentration of the reactants, which is also the reason why the limiting current density of the hydrophilic carbon cloth in Figure 5B is lower than that of the initial carbon cloth.

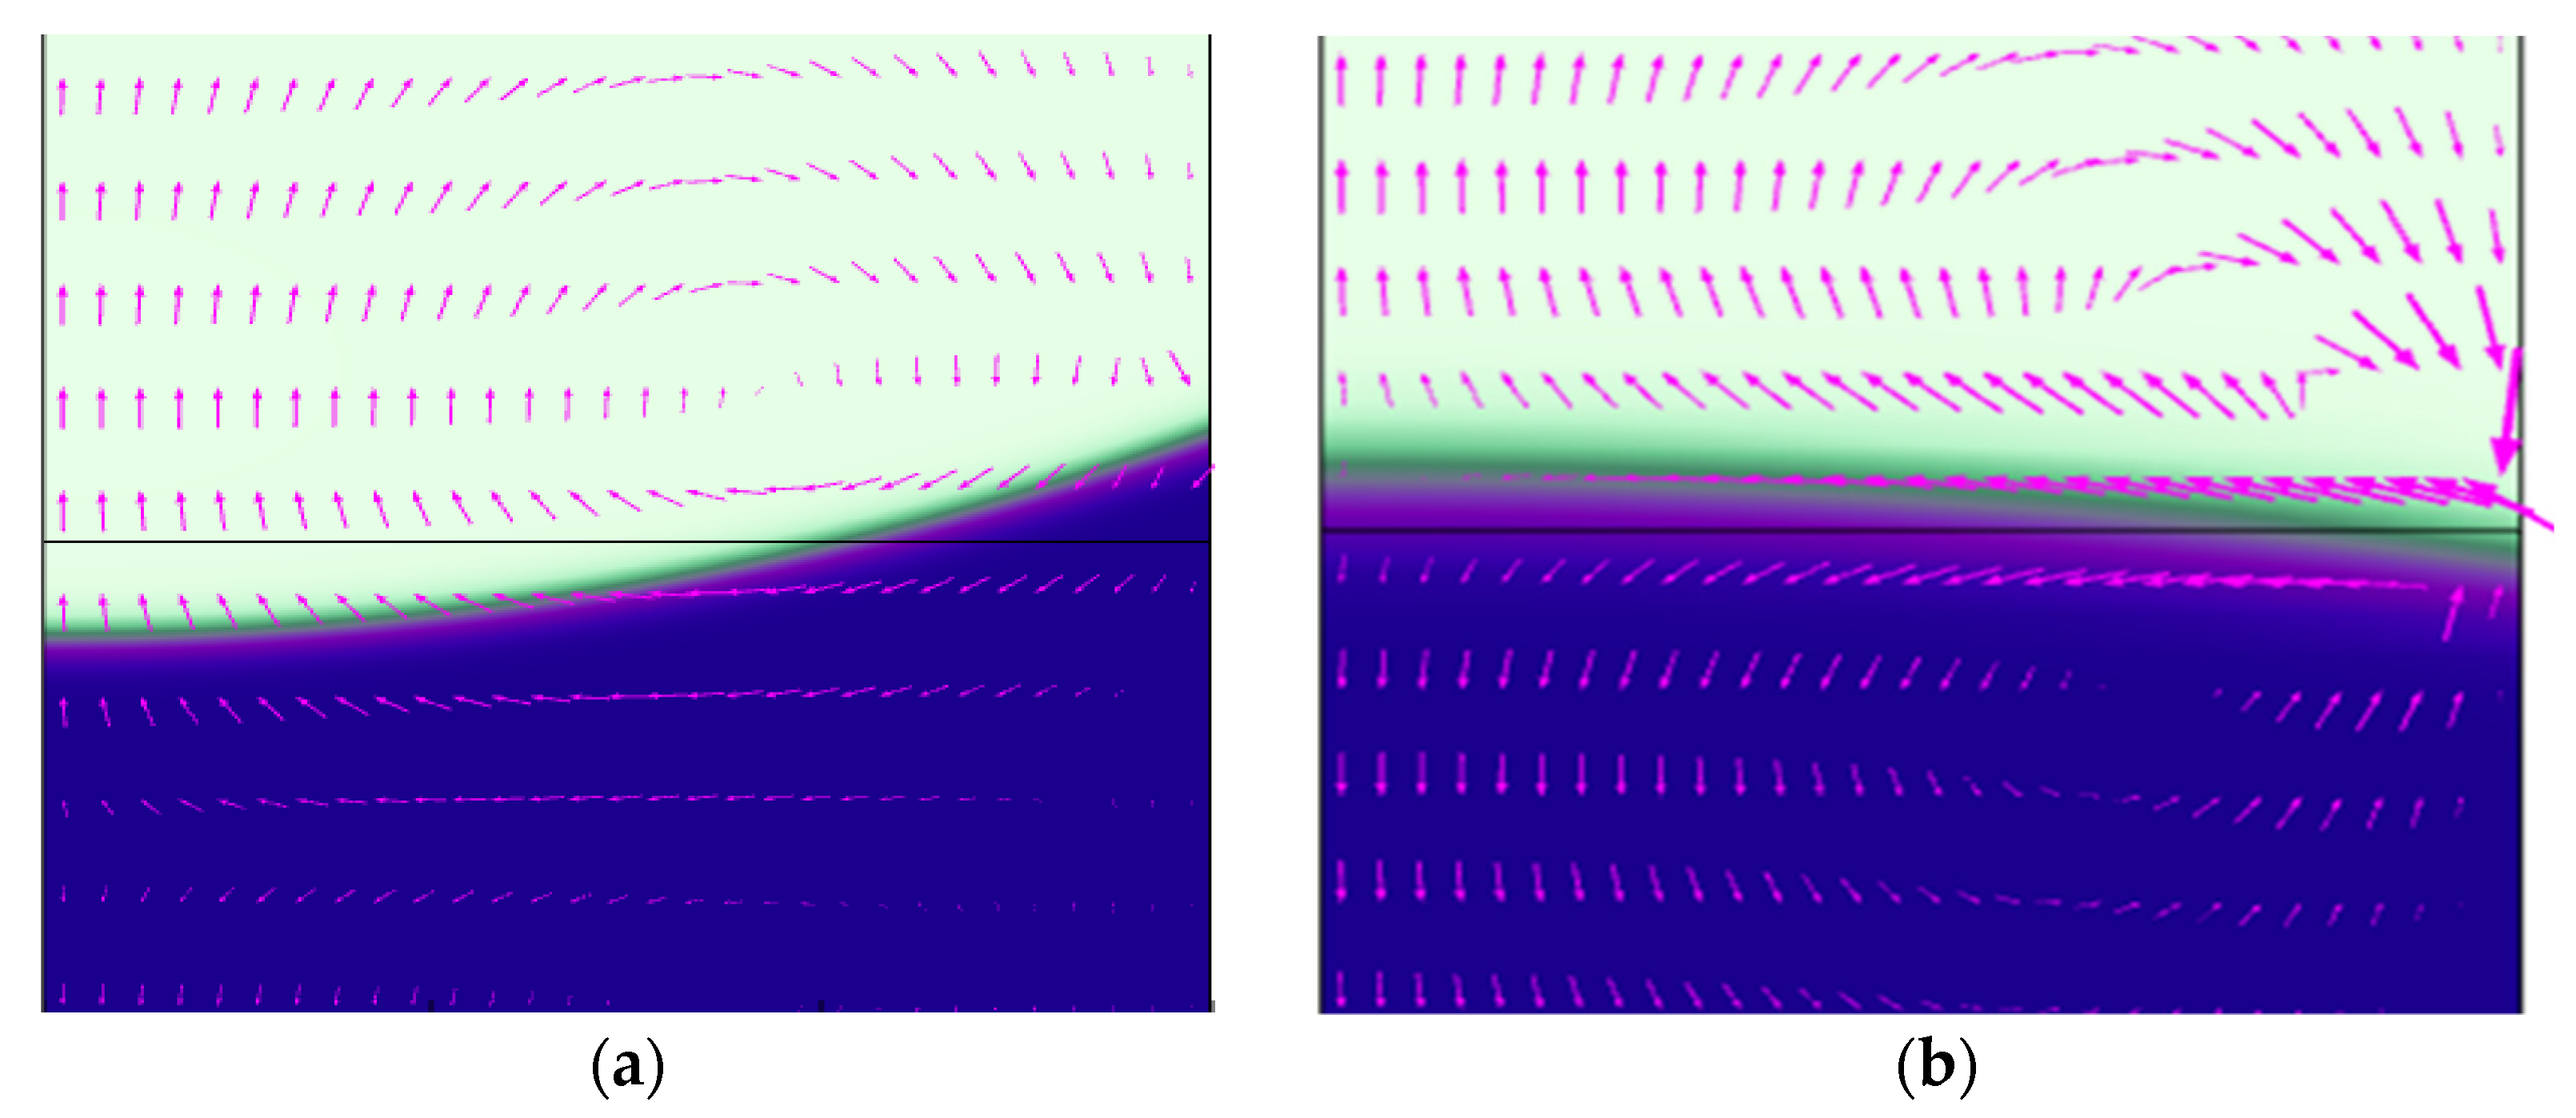
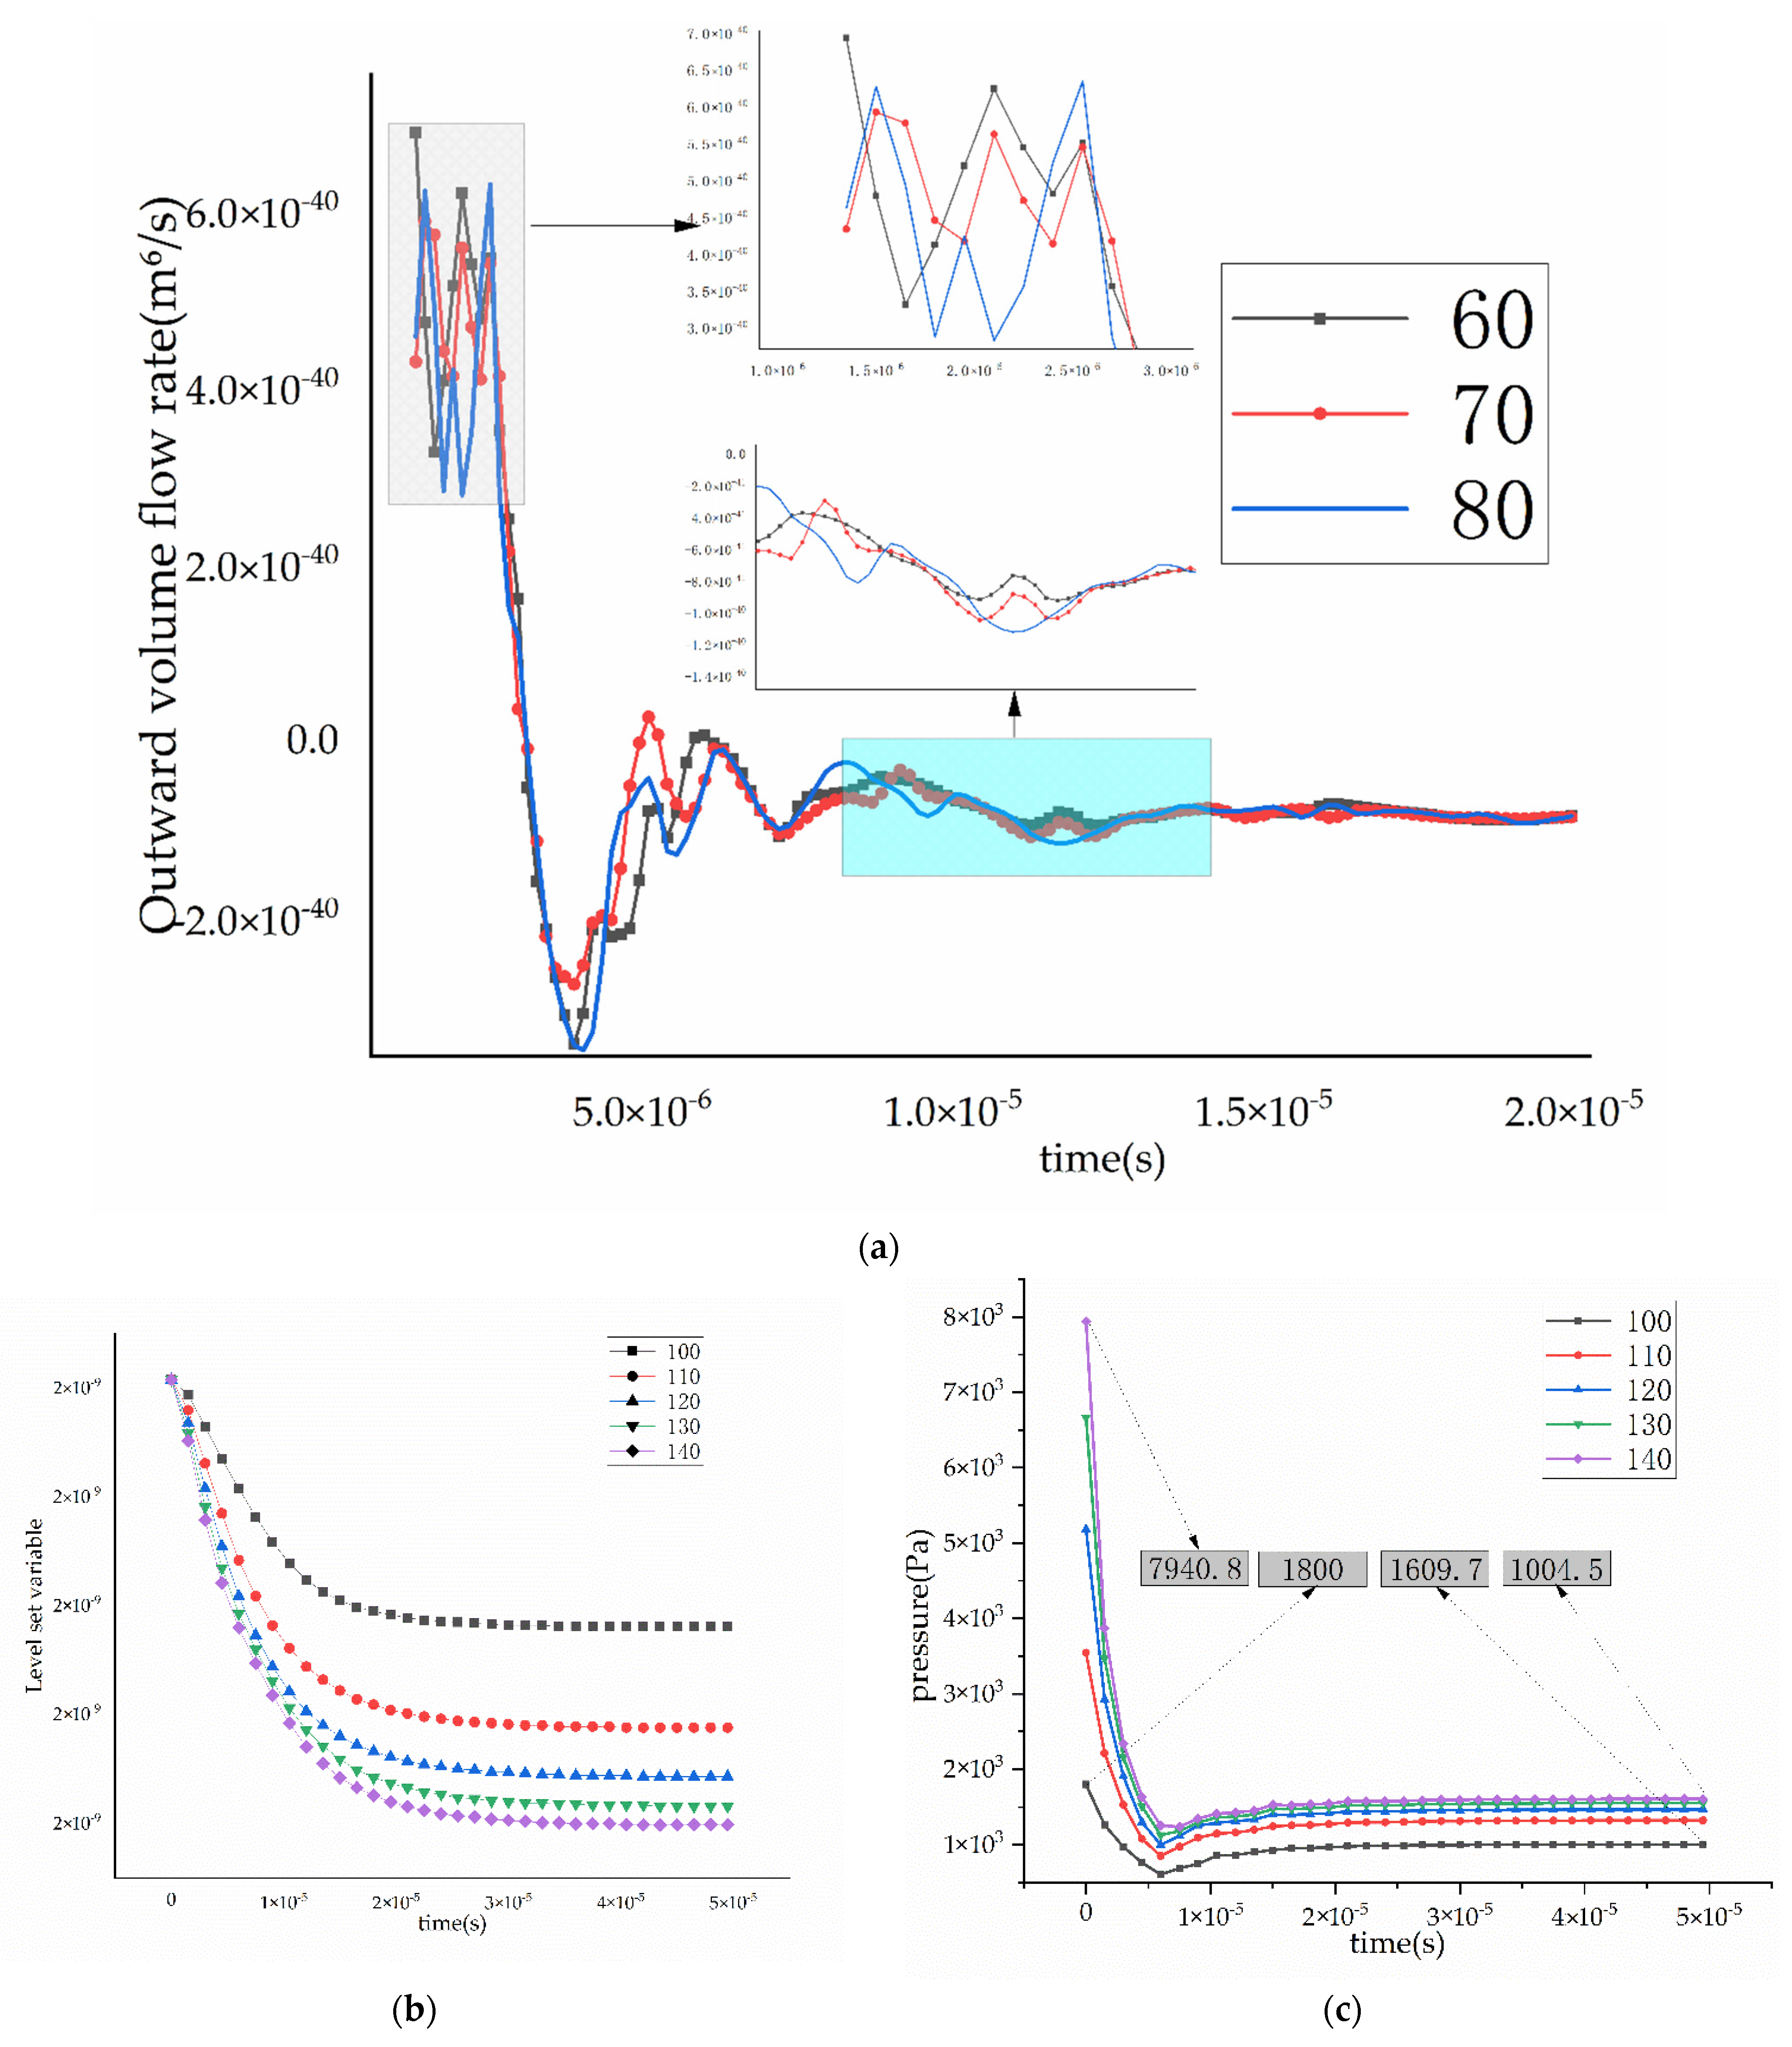
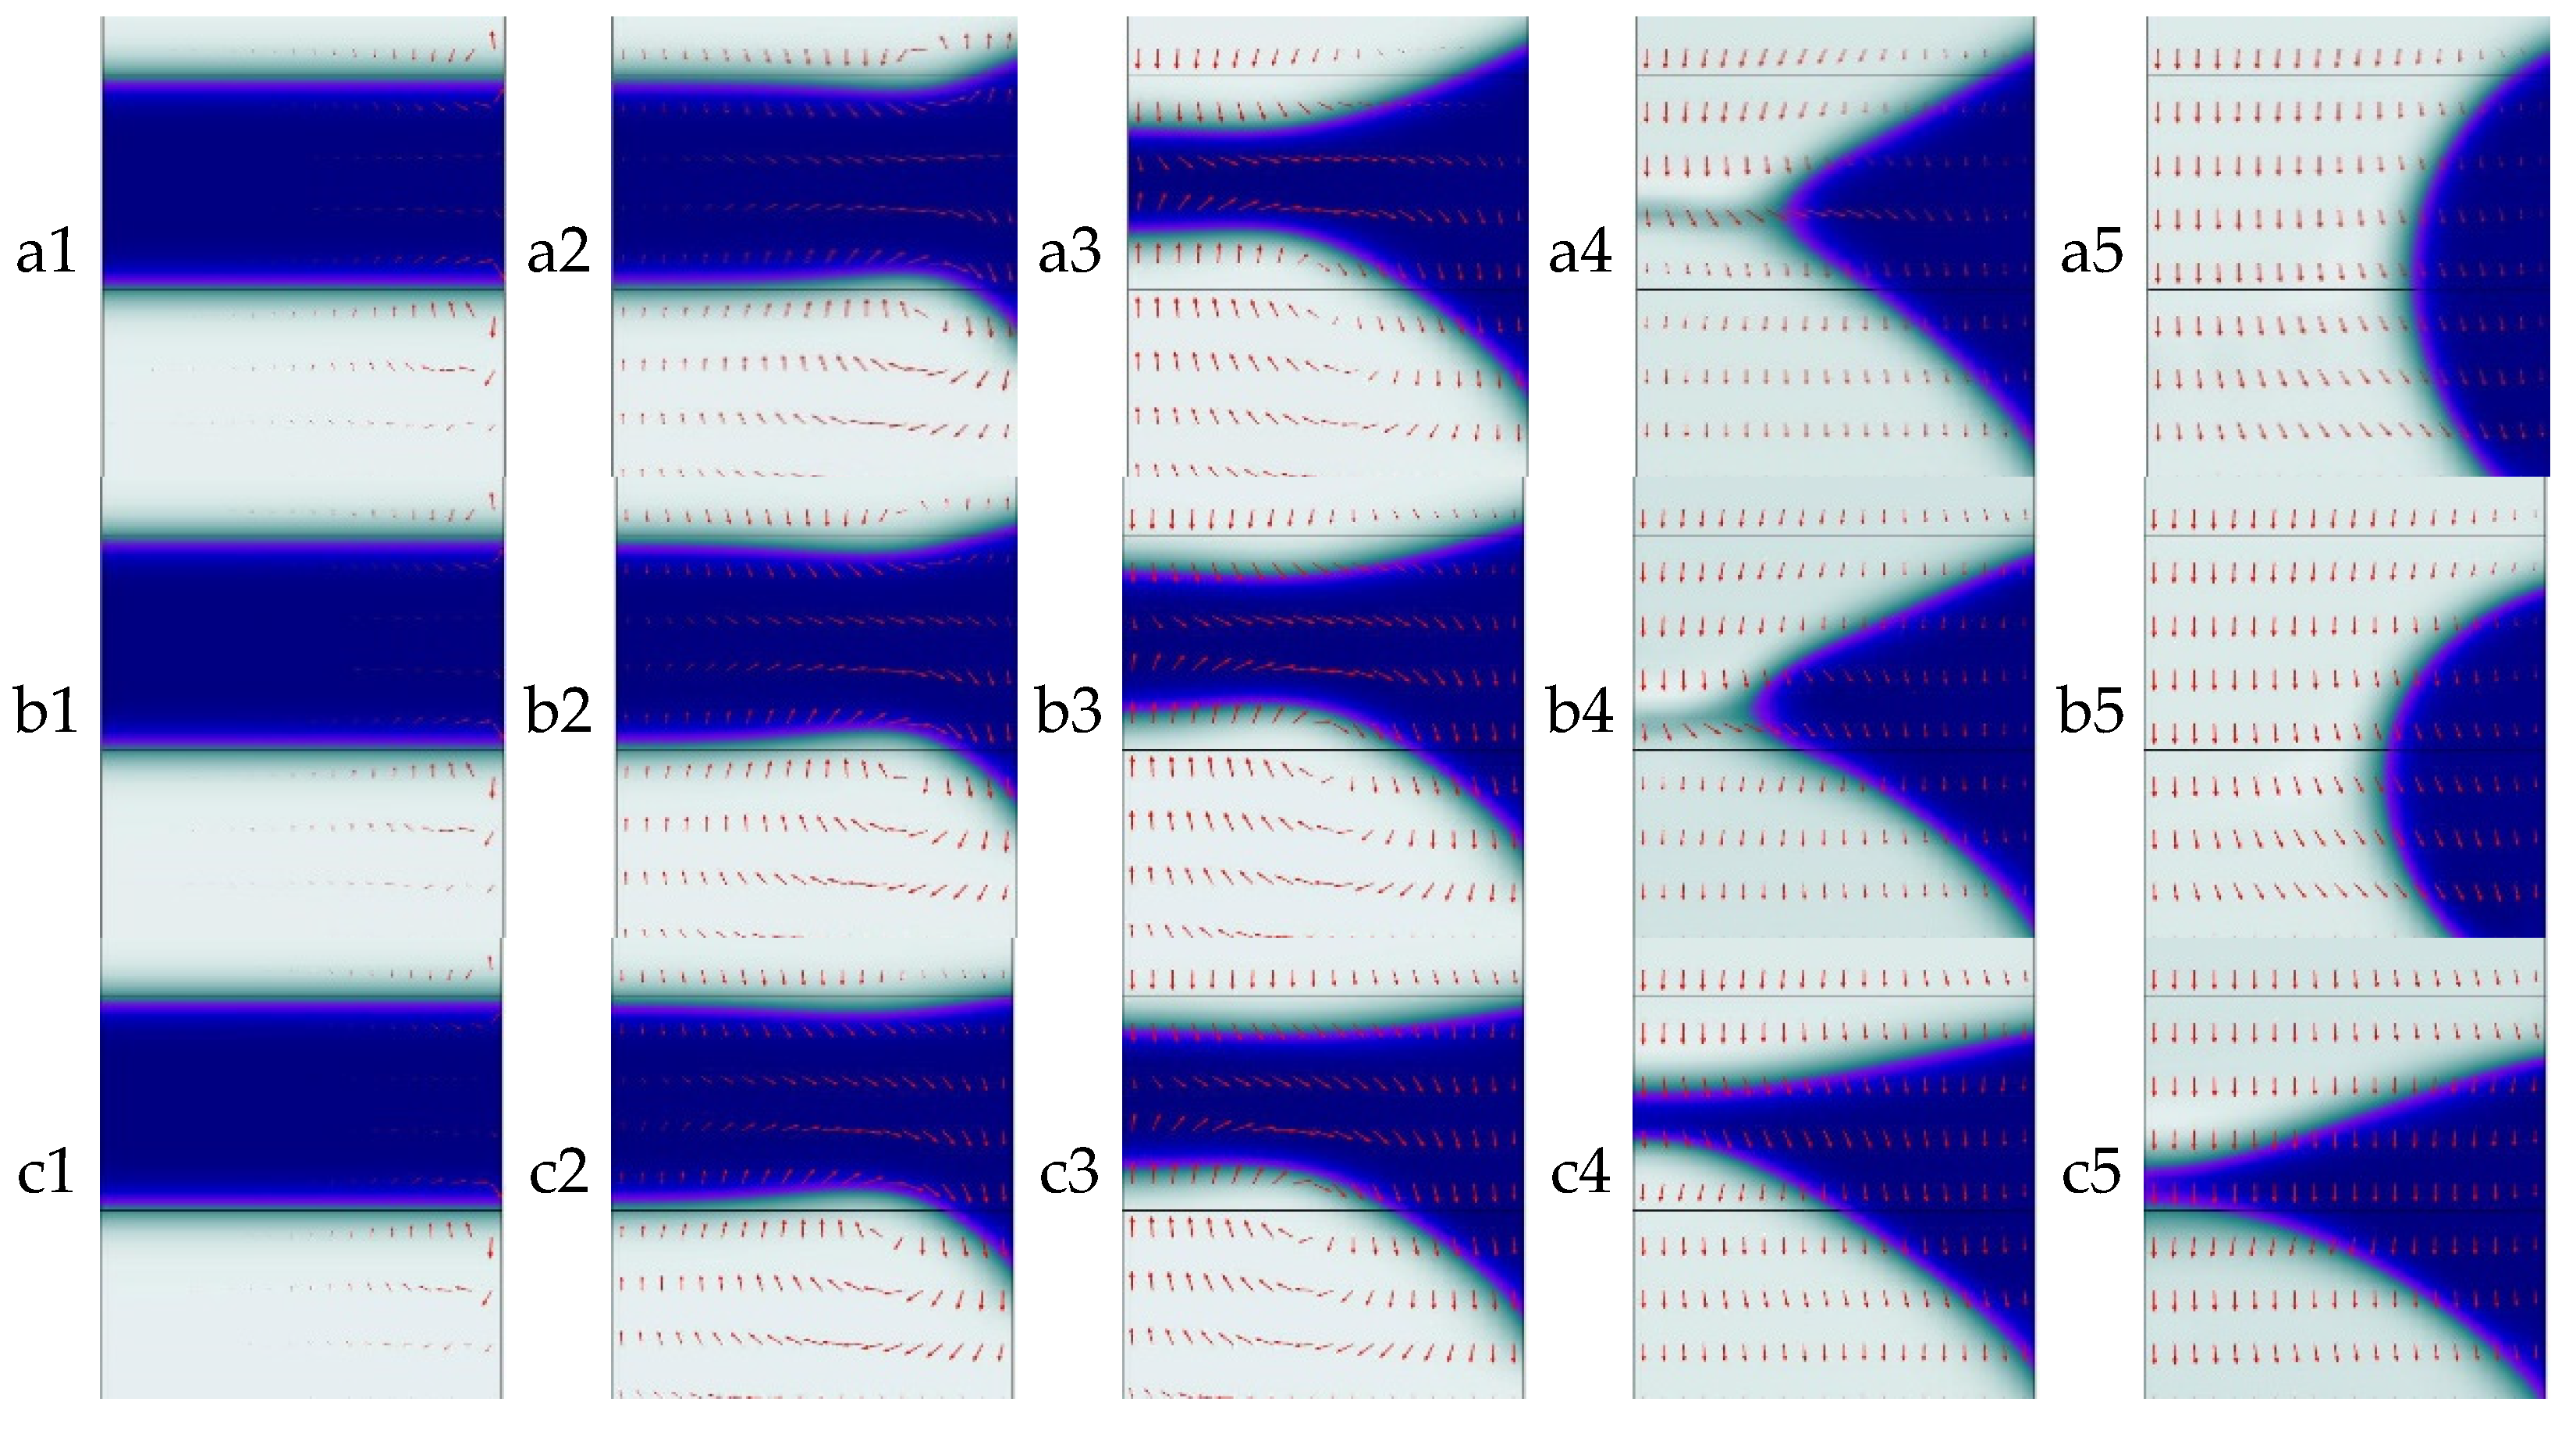
3.2. Influence of Intrapore Wettability on Mass Transfer during Natural Diffusion

When the inner wall of the hole is hydrophilic, the liquid phase near the inner wall of the hole first moves in the Y direction due to the drag adhesion force given by the wall. During this process, the flow of the fluid is continuous and then drags the surrounding particles to achieve the same movement trend. When the liquid volume fraction remains constant, the central interface has contractile movement, which is attributed to the sudden change of the phase interface pressure during the process of particle transfer. When the interface at the center shrinks to a certain extent, and the contact angle between the interface and the wall satisfies the initial wettability of the material, the energy caused by the sudden change of the pressure is offset, the fluid flows back, and finally, the edge of the phase interface protrudes outward, while the central boundary contracts inwardly. With the weakening of the hydrophilicity, the interface tends to be smooth, as shown in Figure 6. On the contrary, when the inner wall of the hole is hydrophobic, the edge shrinks inward and protrudes outward away from the wall.
As shown in Figure 7, for the inner wall of the hydrophilic hole, the liquid originally existing in domain 2 will flow out, and with the increase of the contact angle (that is, the hydrophilicity decreases), the growth rate of the fluid flow rate will gradually increase in the whole transition state. However, in the final steady state, the rate is no longer affected by the contact angle, or affected very little, the cosine value decreases with the increase of the contact angle θW, and the corresponding boundary force increases.
Figure 7a shows the integral diagram of the volume fraction of the liquid particles at the lower boundary of hydrophilic time domain 2. When gas particles are diffused freely, the change rate of the liquid outward volume flow rate increases with the increase of the contact angle. When the direction of the surface tension vector is consistent with the contact angle and the rolling angle is constant, the change rate of the forward angle and the backward angle decreases; the larger the contact angle, the weaker the dragging ability of the wall to the liquid phase, and the flatter the curvature of the phase interface, the easier it is for the liquid phase to be discharged from the pore diameter as a whole. Figure 7b,c show the horizontal set function integral diagram and the pressure diagram of the phase interface at the lower boundary of hydrophobic time domain 2, respectively. With time, the pressure on the phase interface decreases from 1800 Pa to 1609.7 Pa when the contact angle is 100°, and the difference is 190.3 Pa. When the contact angle is 140°, the pressure on the phase interface decreases from 7940.8 Pa to 1004.5 Pa, and the difference is about 36.5 times that of the contact angle at 100°. This is because, when the inner wall of the hole is hydrophobic, the phase interface is protruding at the edge of the contraction center, and the drag effect of the wall on the liquid phase is very small. With the free diffusion of the gas phase, the liquid phase particles are discharged at the wall. On the other hand, there is a lag phenomenon in the movement of the particles at the center due to the capillary pore pressure, and then, the lagging particles are discharged rapidly when the curvature of the phase interface is satisfied and the fluid is continuous.

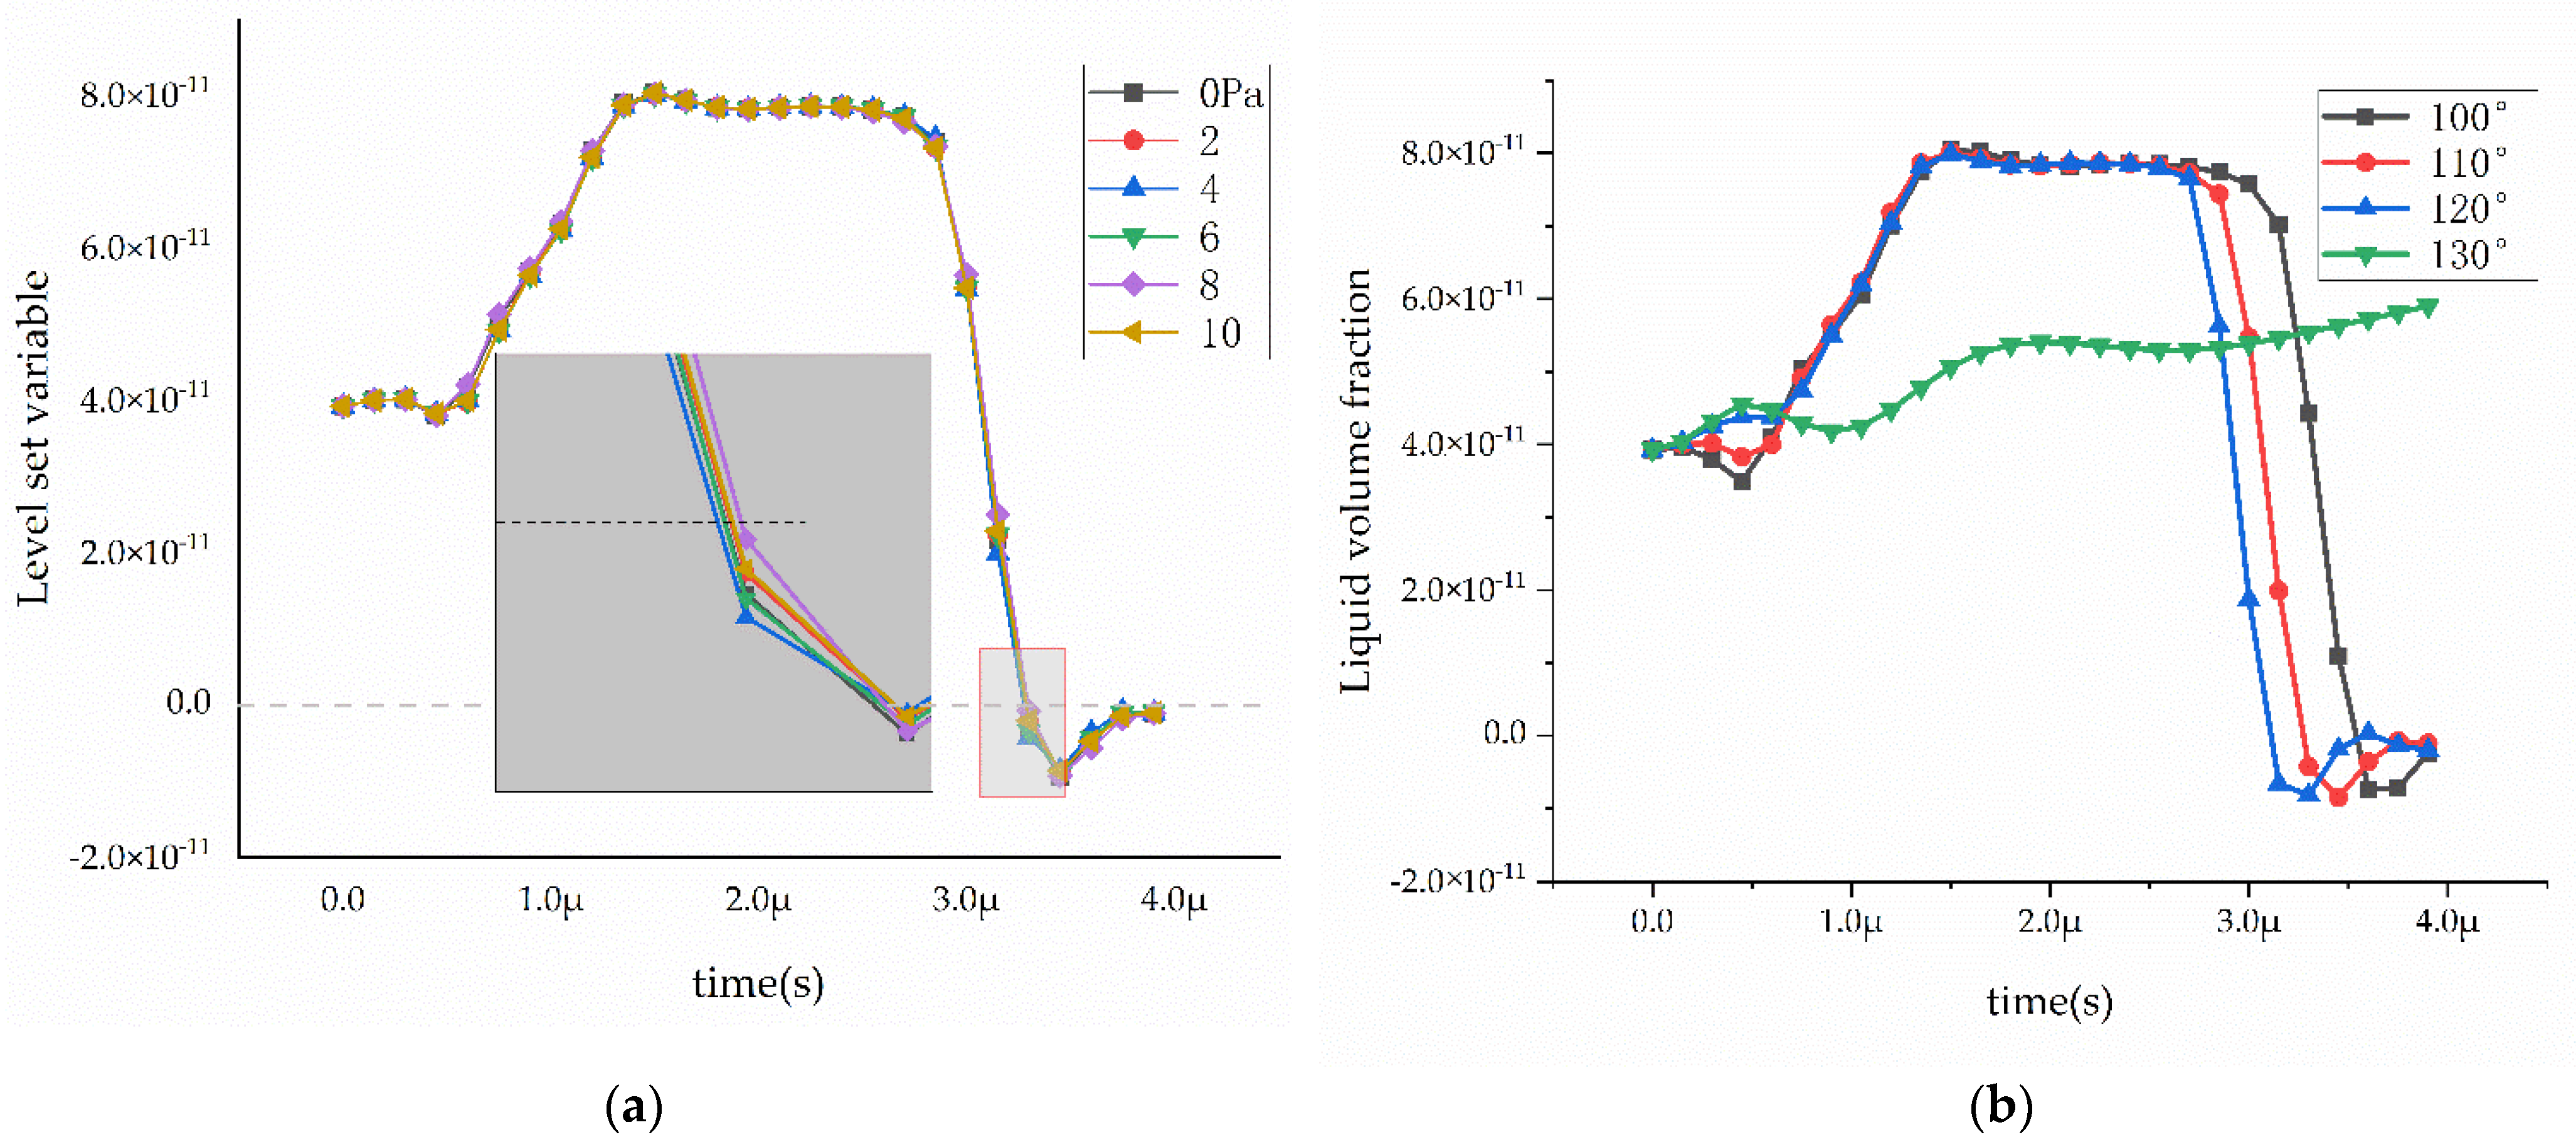
3.3. Effect of Wettability on Mass Transfer at Different Inlet Pressure

The simulation conditions set the pressure to 100 Pa, the contact angle to be 60–80°, and the pore diameter to be 15 μm. At the beginning of the experiment, the liquid is stable in domain 2, and due to the wettability of the inner walls of the pores, the liquid tends to expand outwards at the beginning, as shown in Figure 8(a1). The liquid in contact with the wall then comes closer first, and the liquid away from the wall temporarily stays in place. The gas forms a vortex velocity field tangent to this at the phase interface. The kinetic energy only depends on the intermolecular force provided by the surrounding particles, and the vortex velocity field moves toward the center of the liquid interface, changing its particle potential energy, as shown in Figure 8(a2–a4); the arrow in the figure is the direction of the gas phase velocity field vector. When the vortex velocity field keeps moving to the center of the liquid interface, the gas-phase particles keep hitting the liquid-phase particles, making their potential energy change. Finally, the pore size is dredged, and the liquid phase respreads under the action of the wettability of the pore wall, forming a new phase interface and gathering on the wall surface. At this time, the liquid reaches a certain quasi-steady state, and then, under the influence of the gas flow rate, it all flows out in the direction of the intake air. During the whole process, the upper end of the liquid phase interface in contact with the wall maintains a stable receding angle. When the receding angle and the advancing angle under the condition of the wettability of the wall surface are satisfied, the liquid phase moves as a droplet as the whole.
Change the simulation conditions: set the pressure to 0–10 Pa, the aperture radius to 5 μm, and the contact angle to 100–130°. Figure 9a,b take the pressure difference and contact angle as single variables, respectively, and measure the level set function value and the integral value of the liquid phase volume fraction on the lower boundary line of domain 2. When the inner wall of the pore is hydrophobic, the liquid phase is in the shape of a convex lens as a whole in the aperture—that is, the liquid phase shrinks near the wall and expands in the center, which is also the reason for the increase in the numerical change graph obtained in Figure 9. Taking the value of 0 as the reference value of the liquid phase discharge pore size, the liquid phase discharge speed is the fastest when the pressure difference is 4 Pa. In Figure 9a, only the air intake velocity is determined, and the flow of the liquid phase depends more on the drag force provided by the wettability of the inner wall of the hole, and when the inner wall of the hydrophobic hole is used, the receding angle determines the ease of the rolling of the liquid phase. In Figure 9b, when the contact angle is 130°, the liquid phase remains in the pore size without almost any displacement because of the existence of capillary pressure, as shown in Equation 7. As the contact angle increases, the capillary pressure and the inlet pressure increases. The difference cannot overcome the capillary pressure. At this time, the receding angle and the capillary pressure work together to make the liquid phase into a pseudo-stable state and remain stationary. However, when the pore radius or pressure difference is increased, this pseudo-stable state will decrease with the capillary pressure. When broken, the liquid phase will still be discharged.

4. Conclusions

By changing the factors such as the inlet pressure difference, the size of the pores, and the wettability in the pores, the model is simulated and tested, and the following conclusions are drawn:
(1) In the case of the free diffusion of gas, if the wettability in the pores is hydrophilic when the liquid phase particles are affected by the surface tension of the wall of the hole, they preferentially move to the wall. When the angle between the liquid interface and the wall of the hole reaches the maximum advancing angle, the particles of the liquid phase will no longer move to the wall. Due to the continuity of the fluid and the invariance of the volume, the particles at the wall surface far away from the hole shrink inward and, finally, remain stable in the form of a concave lens. When it is hydrophobic, the liquid phase interface remains stable in the form of a convex lens. Due to the surface tension on the wall of the hole, the wall has a weaker binding ability to the liquid phase, and the particles have hysteresis.
(2) When there is a pressure difference at the inlet since the wall has a strong drag on the liquid in the hydrophilic pores, the inlet pressure gradually overcomes the viscous force and surface tension, and finally, the liquid phase is discharged from the pores. When the pores are hydrophobic, a small inlet pressure differential can expel the liquid phase, but as the hydrophobicity increases, the greater the capillary pressure, and the more difficult it is for the liquid phase to be expelled from the pores. The discharge rate of the liquid phase is only related to the wettability of the wall and the size of the pore and is not affected by the inlet pressure difference or has little effect.
(3) The wettability of macropores is set to hydrophilic for liquid phase transport; the wettability of small pores is set to hydrophobicity for gas-phase transport to avoid the two-phase coupling problem to the greatest extent, thereby improving the mass transfer efficiency of the GDL and fuel battery performance.

Author Contributions

Conceptualization, L.L.; Data curation, Q.N.; Funding acquisition, L.L.; Methodology, M.L.; Visualization, Q.N.; Writing—original draft, Q.N.; Writing—review & editing, M.L. All authors have read and agreed to the published version of the manuscript.

Funding

This research was supported by the national key research and development project (research and development of high-performance long-life fuel cell engine system, grant no. 2017YF B0102900) and the new energy-saving technology research and industrialization of super-efficient asynchronous motor (grant no. 2021G02016).

Institutional Review Board Statement

Not applicable.

Informed Consent Statement

Not applicable.

Data Availability Statement

Not applicable.

Conflicts of Interest

The authors declare no conflict of interest.

References

  1. Daokuan, J.; Kui, J.; Qing, D. Two-Phase Flow in Porous Electrodes of Proton Exchange Membrane Fuel Cell. Trans. Tianjin Univ. 2020, 26, 51–61. [Google Scholar]
  2. Fan, M.; Duan, F.; Wang, T.; Kang, M.; Zeng, B.; Xu, J.; Anderson, R.; Du, W.; Zhang, L. Effect of Pore Shape and Spacing on Water Droplet Dynamics in Flow Channels of Proton Exchange Membrane Fuel Cells. Energies 2021, 14, 1250. [Google Scholar] [CrossRef]
  3. Okonkwo, P.C.; Otor, C. A review of gas diffusion layer properties and water management in proton exchange membrane fuel cell system. Int. J. Energy Res. 2020, 45, 3780–3800. [Google Scholar] [CrossRef]
  4. Zhou, K.; Li, T.; Han, Y.; Wang, J.; Chen, J.; Wang, K. Optimizing the hydrophobicity of GDL to improve the fuel cell performance. RSC Adv. 2021, 11, 2010–2019. [Google Scholar] [CrossRef] [PubMed]
  5. Jiao, K.; Xiaoyan, S.; Zhou, X.; Fanlin, H. Effect of compression on two-phase flow in gas diffusion layers treated with different hydrophobicity. J. Eng. Thermophys. 2020, 41, 3–8. [Google Scholar]
  6. Nagy, K.A.; Tóth, I.Y.; Ballai, G.; Varga, Á.T.; Szenti, I.; Sebők, D.; Kopniczky, J.; Hopp, B.; Kukovecz, Á. Wetting and evaporation on a carbon cloth type gas diffusion layer for passive direct alcohol fuel cells. J. Mol. Liq. 2020, 304, 2698. [Google Scholar] [CrossRef]
  7. Bao, Y.; Gan, Y. Roughness effects of gas diffusion layers on droplet dynamics in PEMFC flow channels. Int. J. Hydrogen Energy 2020, 45, 17869–17881. [Google Scholar] [CrossRef]
  8. Bazylak, A.; Sinton, D.; Liu, Z.S.; Djilali, N. Effect of compression on liquid water transport and microstructure of PEMFC gas diffusion layers. J. Power Sources 2007, 163, 784–792. [Google Scholar] [CrossRef]
  9. Alink, R.; Gerteisen, D. Modeling the Liquid Water Transport in the Gas Diffusion Layer for Polymer Electrolyte Membrane Fuel Cells Using a Water Path Network. Energies 2013, 6, 4508–4530. [Google Scholar] [CrossRef] [Green Version]
  10. Ji, M.; Wei, Z. A Review of Water Management in Polymer Electrolyte Membrane Fuel Cells. Energies 2009, 2, 1057–1106. [Google Scholar] [CrossRef] [Green Version]
  11. Lin, G.; Nguyen, T.V. Effect of Thickness and Hydrophobic Polymer Content of the Gas Diffusion Layer on Electrode Flooding Level in a PEMFC. J. Electrochem. Soc. 2005, 152, A1942–A1948. [Google Scholar] [CrossRef]
  12. Reshetenko, T.V.; St-Pierre, J.; Artyushkova, K.; Rocheleau, R.; Atanassov, P.; Bender, G.; Ulsh, M. Multianalytical Study of the PTFE Content Local Variation of the PEMFC Gas Diffusion Layer. J. Electrochem. Soc. 2013, 160, F1305–F1315. [Google Scholar] [CrossRef]
  13. Chun, J.H.; Park, K.T.; Jo, D.H.; Lee, J.Y.; Kim, S.G.; Park, S.H.; Lee, E.S.; Jyoung, J.-Y.; Kim, S.H. Development of a novel hydrophobic/hydrophilic double micro porous layer for use in a cathode gas diffusion layer in PEMFC. Int. J. Hydrogen Energy 2011, 36, 8422–8428. [Google Scholar] [CrossRef]
  14. Chen, W.; Jiang, F. Impact of PTFE content and distribution on liquid–gas flow in PEMFC carbon paper gas distribution layer: 3D lattice Boltzmann simulations. Int. J. Hydrogen Energy 2016, 41, 8550–8562. [Google Scholar] [CrossRef]
  15. Kwon, S.H.; Lee, S.Y.; Kim, H.-J.; Jang, S.S.; Lee, S.G. Distribution characteristics of phosphoric acid and PTFE binder on Pt/C surfaces in high-temperature polymer electrolyte membrane fuel cells: Molecular dynamics simulation approach. Int. J. Hydrogen Energy 2021, 46, 17295–17305. [Google Scholar] [CrossRef]
  16. Pradecta, M.R.; Prakoso, T.; Indarto; Widyaparaga, A. Contact angle dynamics during the impact of single water droplet onto a hot flat practical stainless steel surface under medium Weber numbers. Heat Mass Transf. 2021, 57, 1097–1106. [Google Scholar]
  17. Janssen, D.; Palma, R.D.; Verlaak, S.; Heremans, P.; Dehaen, W. Static solvent contact angle measurements, surface free energy and wettability determination of various self-assembled monolayers on silicon dioxide. Thin Solid Film. 2006, 515, 1433–1438. [Google Scholar] [CrossRef]
  18. Qian, X.; Jie, L.I. Analysis of the Influence Factors of the Steady State Contact Angle Measurement. Sci. Technol. Vis. 2020, 101, 418–426. [Google Scholar]
  19. Gurtin, M.E. Generalized Ginzburg-Landau and Cahn-Hilliard equations based on a microforce balance. Phys. D Nonlinear Phenom. 1996, 92, 178–192. [Google Scholar] [CrossRef]
Figure 1. Schematic diagram of water diffusion in fuel cells. GDL is a gas diffusion layer, CL is a catalytic layer, and PEM is a proton exchange membrane. The red scissors in the figure are the movement directions of the water diffusion, electrical drag back, and transmembrane transport from the production site.
Energies 15 03474 g001
Figure 2. Sample drawing, where (a) is the carbon cloth after the hydrophilic treatment, and the hollowed-out part of (b) is the hydrophobic spraying area.
Energies 15 03474 g002
Figure 3. GDL aperture transmission simplified model. 1, 2, and 3, respectively, are for each phase region, and the intake direction is in the negative Y direction.
Energies 15 03474 g003
Figure 4. Schematic diagram of the contact angle θW at the three-phase interface.
Energies 15 03474 g004
Figure 5. Electrochemical test curve (A) impedance spectrum. The current density is 1500 mA/cm2, the frequency is 100–104 mHz, and (B) is the single-cell cathode polarization curve, The current sweep range is 0–2 A, the scan rate is 50 mA per second, and the SLPM of oxygen is 3. It is marked in the picture that (a~b~c) are the initial carbon cloth, hydrophobic carbon cloth, and hydrophilic carbon cloth, respectively.
Energies 15 03474 g005
Figure 6. (a,b) The simulation diagrams of the curvature of the phase interface when the contact angles are 60° and 140°, respectively. The arrows in the figure are the directions of the gas phase particle velocity vector, the liquid phase is blue, and the gas phase is green.
Energies 15 03474 g006
Figure 7. The motion state of the liquid with the same pore diameter on different wettability walls. (a) is the flow rate of liquid outflow domain 2 when hydrophilic, and (b) is the variable integral at the boundary of domain 2 when hydrophobic. (c) is the pressure on the fluid interface when it is hydrophobic.
Energies 15 03474 g007
Figure 8. Two-phase transport state under each wettability phase when the inlet pressure is 100 Pa and the aperture radius is 15 μm. (a) is contact angle 60°, (b) is 70°, and (c) is 80°. The arrow in the picture is the velocity vector direction of the gas particles, the liquid phase is blue, and the gas phase is green. The 1–5 in figure are instantaneous graphs with time increasing in sequence.
Energies 15 03474 g008
Figure 9. Changes of the horizontal variables and the integral value of the liquid volume fraction on the lower boundary line of domain 2. Represented in (a) is the level set variable with an aperture of 5 μm, the contact angle is 100°, and the pressure is 0–10 Pa. Represented in (b) is the level set variable with an aperture of 5 μm, the contact angle is 100–130°, and the pressure is 4 Pa.
Energies 15 03474 g009
Table 1. Table of the experimental variables.
VariableValue
Contact angle θW (°)60–140
Aperture size (μm)5, 15
Inlet pressure (Pa)0–10, 100
Publisher’s Note: MDPI stays neutral with regard to jurisdictional claims in published maps and institutional affiliations.

