Article

Development of Electromobility in European Union Countries under COVID-19 Conditions

1
Institute of Economics and Finance, Warsaw University of Life Sciences, 02-787 Warsaw, Poland
2
Department of Agrotechnology and Agribusiness, Faculty of Agriculture and Forestry, University of Warmia and Mazury in Olsztyn, ul. Oczapowskiego 2, 10-719 Olsztyn, Poland
3
Department of Economics of Agricultural and Horticultural Holdings, Institute of Agricultural and Food Economics—National Research Institute, ul. Świętokrzyska 20, 00-002 Warszawa, Poland
*
Author to whom correspondence should be addressed.
Energies 2022, 15(1), 9; https://doi.org/10.3390/en15010009
Submission received: 19 November 2021 / Revised: 12 December 2021 / Accepted: 19 December 2021 / Published: 21 December 2021

Abstract

:
The introduction of electromobility contributes to an increase in energy efficiency and lower air pollution. European countries have not been among the world’s leading countries in this statistic. In addition, there have been different paces in the implementation of electromobility in individual countries. The main purpose of this paper is to determine the directions of change and the degrees of concentration in electromobility in European Union (EU) countries, especially after the economic closure as a result of the COVID-19 pandemic. The specific objectives are to indicate the degree of concentration of electromobility in the EU and changes in this area, especially during the COVID-19 pandemic; to determine the dynamics of changes in the number of electric cars in individual EU countries, showing the variability in this aspect, while also taking into account the crisis caused by COVID-19; to establish the association between the number of electric cars and the parameters of the economy. All EU countries were selected for study by the use of the purposeful selection procedure, as of December 31, 2020. The analyzed period covered the years 2011–2020. It was found that in the longer term, the development of electromobility in the EU, measured by the number of electric cars, is closely related to the economic situation in this area. The crisis caused by the COVID-19 pandemic has influenced the economic situation in all EU countries, but has not slowed down the pace of introducing electromobility, and may have even accelerated it. In all EU countries, in the first year of the COVID-19 pandemic, the dynamics of introducing electric cars into use increased. The growth rate in the entire EU in 2020 was 86%, while in 2019 it was 48%. The reason was a change in social behavior related to mobility under conditions of risk of infection. COVID-19 has become a positive catalyst for change. The prospects for the development of this type of transport are very good because activities related to the development of the electromobility sector perfectly match the needs related to the reduction of pollution to the environment.

Graphical Abstract

1. Introduction

1.1. Negative Externalities of Car Use

Use of cars contributes to climate change. In addition, global car mobility continues to grow [1]. This is because transport is a key factor for the regional, national and international economy. Personal mobility is also important. Motor vehicles continue to depend on oil as their main source of energy. According to estimates, road transport directly contributed to around 20% of CO2 emissions in Europe [2,3,4,5]. In addition to climate change caused by greenhouse gases, toxic tailpipe emissions and road noise pose an increasing threat to air quality and life in urban areas. Cars, trucks, vans and buses have been the biggest polluters of NOx in cities [6]. Road traffic also contributes significantly to the emission of soot particles, directly increasing the risk of lung disease [7]. According to data from the World Health Organization (WHO), much more people die from poor outdoor air quality due to road traffic than from accidents [8,9]. According to the European Environment Agency’s (EEA) Air Quality in Europe 2018 report, road transportation is a major source of atmospheric pollution, and the upper emission limits for the most harmful—ground-level ozone (O3) nitrogen oxides (NOx), and particulate matter were significantly exceeded [10]. The EU has estimated that 100 million people have been impacted by harmful noise levels outside 55 dB in the day and 60 million people above 50 dB at night. The dominant source of noise was road traffic. Such exposure resulted in deterioration of health and even death [11].

1.2. Electric Cars as an Element of Reducing Negative Externalities

Emissions of pollutants and noise from the propulsion of the vehicle can be avoided. Trains, trams and subways were electrified decades ago, and in the early years cars were also electric. For example, in 1914, 2.4% of the Dutch automobile fleet was battery powered [12]. After its initial success, however, electrification was delayed for practical reasons. The range of this type of car was too limited, and the batteries were too large, heavy, and expensive while oil was much more energy dense and cheaper [13,14]. Nowadays, thanks to improved electronics and batteries, electric vehicles can travel 500 km on a single charge and quickly recharge the batteries. This range has been confirmed in the authors’ research on the example of the British market. The average range of the top 10 electric cars was 491 km, with the smallest range being 350 km and the largest 610 km [15]. The charging time of an electric car is directly dependent on the power of the charging station. Zero exhaust emissions from the exhaust pipe of electric vehicles and zero engine noise have a positive effect on local air quality and living conditions [16]. Depending on the energy source used, emissions in the energy supply chain and production can also be very low or even zero. The total environmental impact of vehicles powered by electricity generated from hard coal is better than in the case of a car with an internal combustion engine [17,18]. In many countries, public charging stations deliver electricity from renewable energy sources like water, sun and wind power, in which case electric cars can truly be called emission-free. Electric vehicles are also seen as providing storage capacity for variable renewable energy production [19,20].
Breakthrough technologies such as electrification, automation and the sharing economy, mean renewable energy can make the automotive industry more sustainable [21,22]. Changes in the automotive industry should have a positive impact on ecology and the economy [23]. In addition to technology, a key factor in this transformation is willingness to change, which is the social part of the innovation process. The refusal to continue tolerating the negative aspects of transport for the environment is often the cause of public acceptance [24,25,26,27,28].

1.3. Types of Electric Cars

There are several types of electric cars. The division criterion is the type of drive. battery electric vehicle (BEV) cars are fully electric, i.e., they do not have an internal combustion engine and their only drive unit is a battery. The batteries are charged from the socket, which one can do at home. The operating costs of such a vehicle can be reduced by charging the battery at night, when electricity rates are lower. The battery capacity determines the range of the vehicle, which is why such a car is best suited for city driving or short distances. This limitation is a disadvantage of BEVs. Its mechanics should be considered an advantage, as it is much simpler than in conventional drive vehicles (fewer parts and less liquid to top up). BEVs powered only by a battery do not emit any harmful substances into the atmosphere [29].
The hybrid electric vehicle (HEV) car has two types of drive, i.e., a combustion engine and an electric drive (the so-called hybrid). This vehicle does not have the option of recharging the battery from external energy sources. The car uses conventional fuel for the internal combustion engine and the energy generated by the vehicle when braking during various maneuvers. The most “recycled” energy is generated, for example, when driving in city traffic jams, and not much on the motorway [30].
The plug-in hybrid electric vehicle (PHEV) car is a hybrid electric car with the possibility of charging. The vehicle is partly conventional and partly electric. It can be refueled at a gas station and the batteries can be charged from an external energy source. This combination makes the PHEV a very popular type of electric car. While driving the internal combustion engine can be used, then one may switch to electric drive or to hybrid mode [31]. Compared with other types of electric cars, PHEVs have a better range. In addition to the electric drive, they use an internal combustion engine. Usually, PHEV have smaller fuel tanks due to the placement of batteries. This range has been confirmed in the authors’ research on the example of the ranking conducted by Forbes. The average range of the 11 best PHEV cars was 716 km, with the lowest range being 515 km and the highest 966 km [32]. The disadvantage of the PHEV is the need for more expensive maintenance of two power units with different energy sources. The production costs of such cars are higher, and so are their market prices [31].
Additionally, there are several types of partially electric cars. The mild hybrid electric vehicle (MHEV) car is another type of hybrid, the so-called soft hybrid. The construction of such a drive system is the same as in the case of the HEV. The difference lies in the size and power of the electric motor used (it is much weaker). Its main role is to start the engine and take over the function of the alternator. The reduction in fuel consumption can be up to 15%. The range extended electric vehicle (REEV) car is one of the vehicles with extended range, which is also the opposite of the MHEV. The internal combustion engine in this case plays a supporting role by charging the batteries, while the electric unit is the main driving force. The fuel cell electric vehicle (FCEV) is the most secretive car. Hydrogen and its reaction with oxygen are responsible for the generation of electricity going to the battery. Instead of supplying a portion of electricity, users refill the fuel cells with hydrogen [33,34,35].

1.4. The COVID-19 Pandemic and Its Impact on the Global Electric Car Market

COVID-19 has been determined as an acute infectious illness of the respiratory system caused by infection of the SARS-CoV-2 virus [36]. It was first recognized and described in December 2019, in central China, in the city of Wuhan, Hubei province [37,38,39,40]. There have been many cases that have spread beyond the borders of China, to virtually all countries of the world. On 11 March 2020, the World Health Organization (WHO) recognized the series of COVID-19 incidents since December 2019 as a pandemic. At that time, there were over 118 thousand confirmed cases of infection in 114 countries and 4291 people died [41]. The pandemic’s pace and course varied. By 4 November 2021, 248 million cases of infection had been confirmed worldwide, and 5 million people had lost their lives. There were 78 million infections and 1.44 million deaths in Europe [42]. The continued spread of the disease in the first year was due to the lack of a vaccine and effective therapeutic agents against this new virus [43,44]. Many countries have introduced movement restrictions and some activities have been officially banned. Thus, the pandemic had a big impact on social life and the economy. Scenarios for dealing with the outbreak varied from country to country [45].
In the world, sales of electric cars in the second decade of the 21st century grew very quickly, at a rate of 46–69% per year. Only in 2019 was there a visible slowdown, because worldwide the number of light electric vehicles increased by 9% compared with 2018. This meant a clear deviation from the pace of growth in the previous six years. The reason for this change was the decline in sales in the second half of 2019 in the two largest markets, i.e., China and the USA. However, even with the stagnation in these markets, global sales of electric vehicles continued to grow, mainly in Europe, which saw an increase of several dozen percent. The COVID-19 pandemic and the ensuing economic slowdown had a negative impact on the global market for all types of cars. As a result, the prospects for global sales of electric vehicles in 2020 were uncertain. However, time has shown that 2020 has turned out to be surprisingly positive despite the pandemic and its effects. Global electric vehicle sales have risen 43% from 2019 and global electric car market share has risen to a record 4.6% in 2020. Given the decarbonization challenge that most leading countries now take seriously, 2021 is a breakthrough in the history of electric vehicle sales and about 6.4 million vehicles (BEV and PHEV combined) will be sold by the end of the year worldwide. This would then mean an increase of 98% year on year [46].
In 2019, the global market for electric vehicles was valued at USD 162 billion, and is forecast to reach a value of approximately USD 800 billion by 2027, with an average annual growth rate of 23%. The Asia-Pacific markets should continue to dominate, and it is estimated that they will generate USD 358 billion by 2027 (with an average annual growth rate of 20%). In the North American market, revenues should be USD 194 billion, with an annual growth rate of 28%. Markets in North America and Europe together accounted for 40% of the world market in 2019. According to forecasts, in 2027 the share of these two segments will reach 51% of the total electric car market in the world [47].

1.5. Justification, Aims and Structure of the Article

The subject matter of the article is important and up to date. Transport is a significant energy consumer. The use of electric cars contributes to the reduction of negative externalities in the form of environmental pollution, noise and energy consumption. The share of electric cars is still small, especially on the European continent. Some hope lies in the high pace of introducing electric cars into use. The outbreak of the COVID-19 pandemic may have contributed to a slowdown in this regard. This can be judged by the example of many industries that have been affected by the crisis caused by the global pandemic. An example is the automotive industry, which is slowing down quite sharply. In the EU countries, the effects of the crisis were quite visible, because the automotive industry was based on components imported from Asia. As a result of the interruption of supply chains, many factories of automotive concerns have had to reduce their production.
There is a research gap that this article can fill. The literature review shows no previous studies on the situation in the electromobility sector during the COVID-19 pandemic. We did not find publications that reported the situation of the electromobility market in EU before and during COVID-19. In addition, our research will cover the area of the EU, which is still quite diverse. Europe still has considerable electromobility market development potential. It will be interesting to determine whether this development stopped during the COVID-19 pandemic and how it unfolded in individual countries. The above aspects make the research necessary and original. The novelty of the article is the presentation of the situation and changes in the field of electromobility under COVID-19 pandemic conditions, as well as the relationship between the grade of economic development and the development of electromobility. This type of research has not been performed so far.
The main goal of the article is to determine the directions of change and the degree of concentration in electromobility in European Union (EU) countries, especially after the economic closure as a result of the COVID-19 pandemic.
The specific objectives are:
  • identifying the degree of concentration of electromobility in EU and changes in this area, especially during the COVID-19 pandemic;
  • determining the dynamics of change in the number of electric cars in individual EU countries;
  • showing the variability in number of electric cars, while also taking into account the crisis caused by COVID-19;
  • establishing an association between the number of electric cars and the parameters of the economy, including during the COVID-19 pandemic period.
Three research hypotheses are formulated in the paper:
Hypothesis 1.
Electric car concentration is decreasing in the EU, and the COVID-19 pandemic has accelerated these changes.
Hypothesis 2.
In EU countries, the dynamics of introducing electric cars into use has decreased in the first year of the COVID-19 pandemic.
Hypothesis 3.
The development of electromobility in the EU, measured by the number of electric cars, is closely related to the economic situation in this area.
The organization of this paper is as follows: Section 1 provides an introduction to the subject. The impact of road transport in negative externalities is presented. The possibility of using electric cars is shown. Concerns related to the COVID-19 pandemic on the development of electromobility are also presented. This section also contains justification and aims of the article. Section 2 proposes methods to identify differences and changes in electromobility in EU states. In Section 3, the research findings are presented. Section 4 includes reference to other research studies that have dealt with the relationships tested. Section 5 concludes this paper.

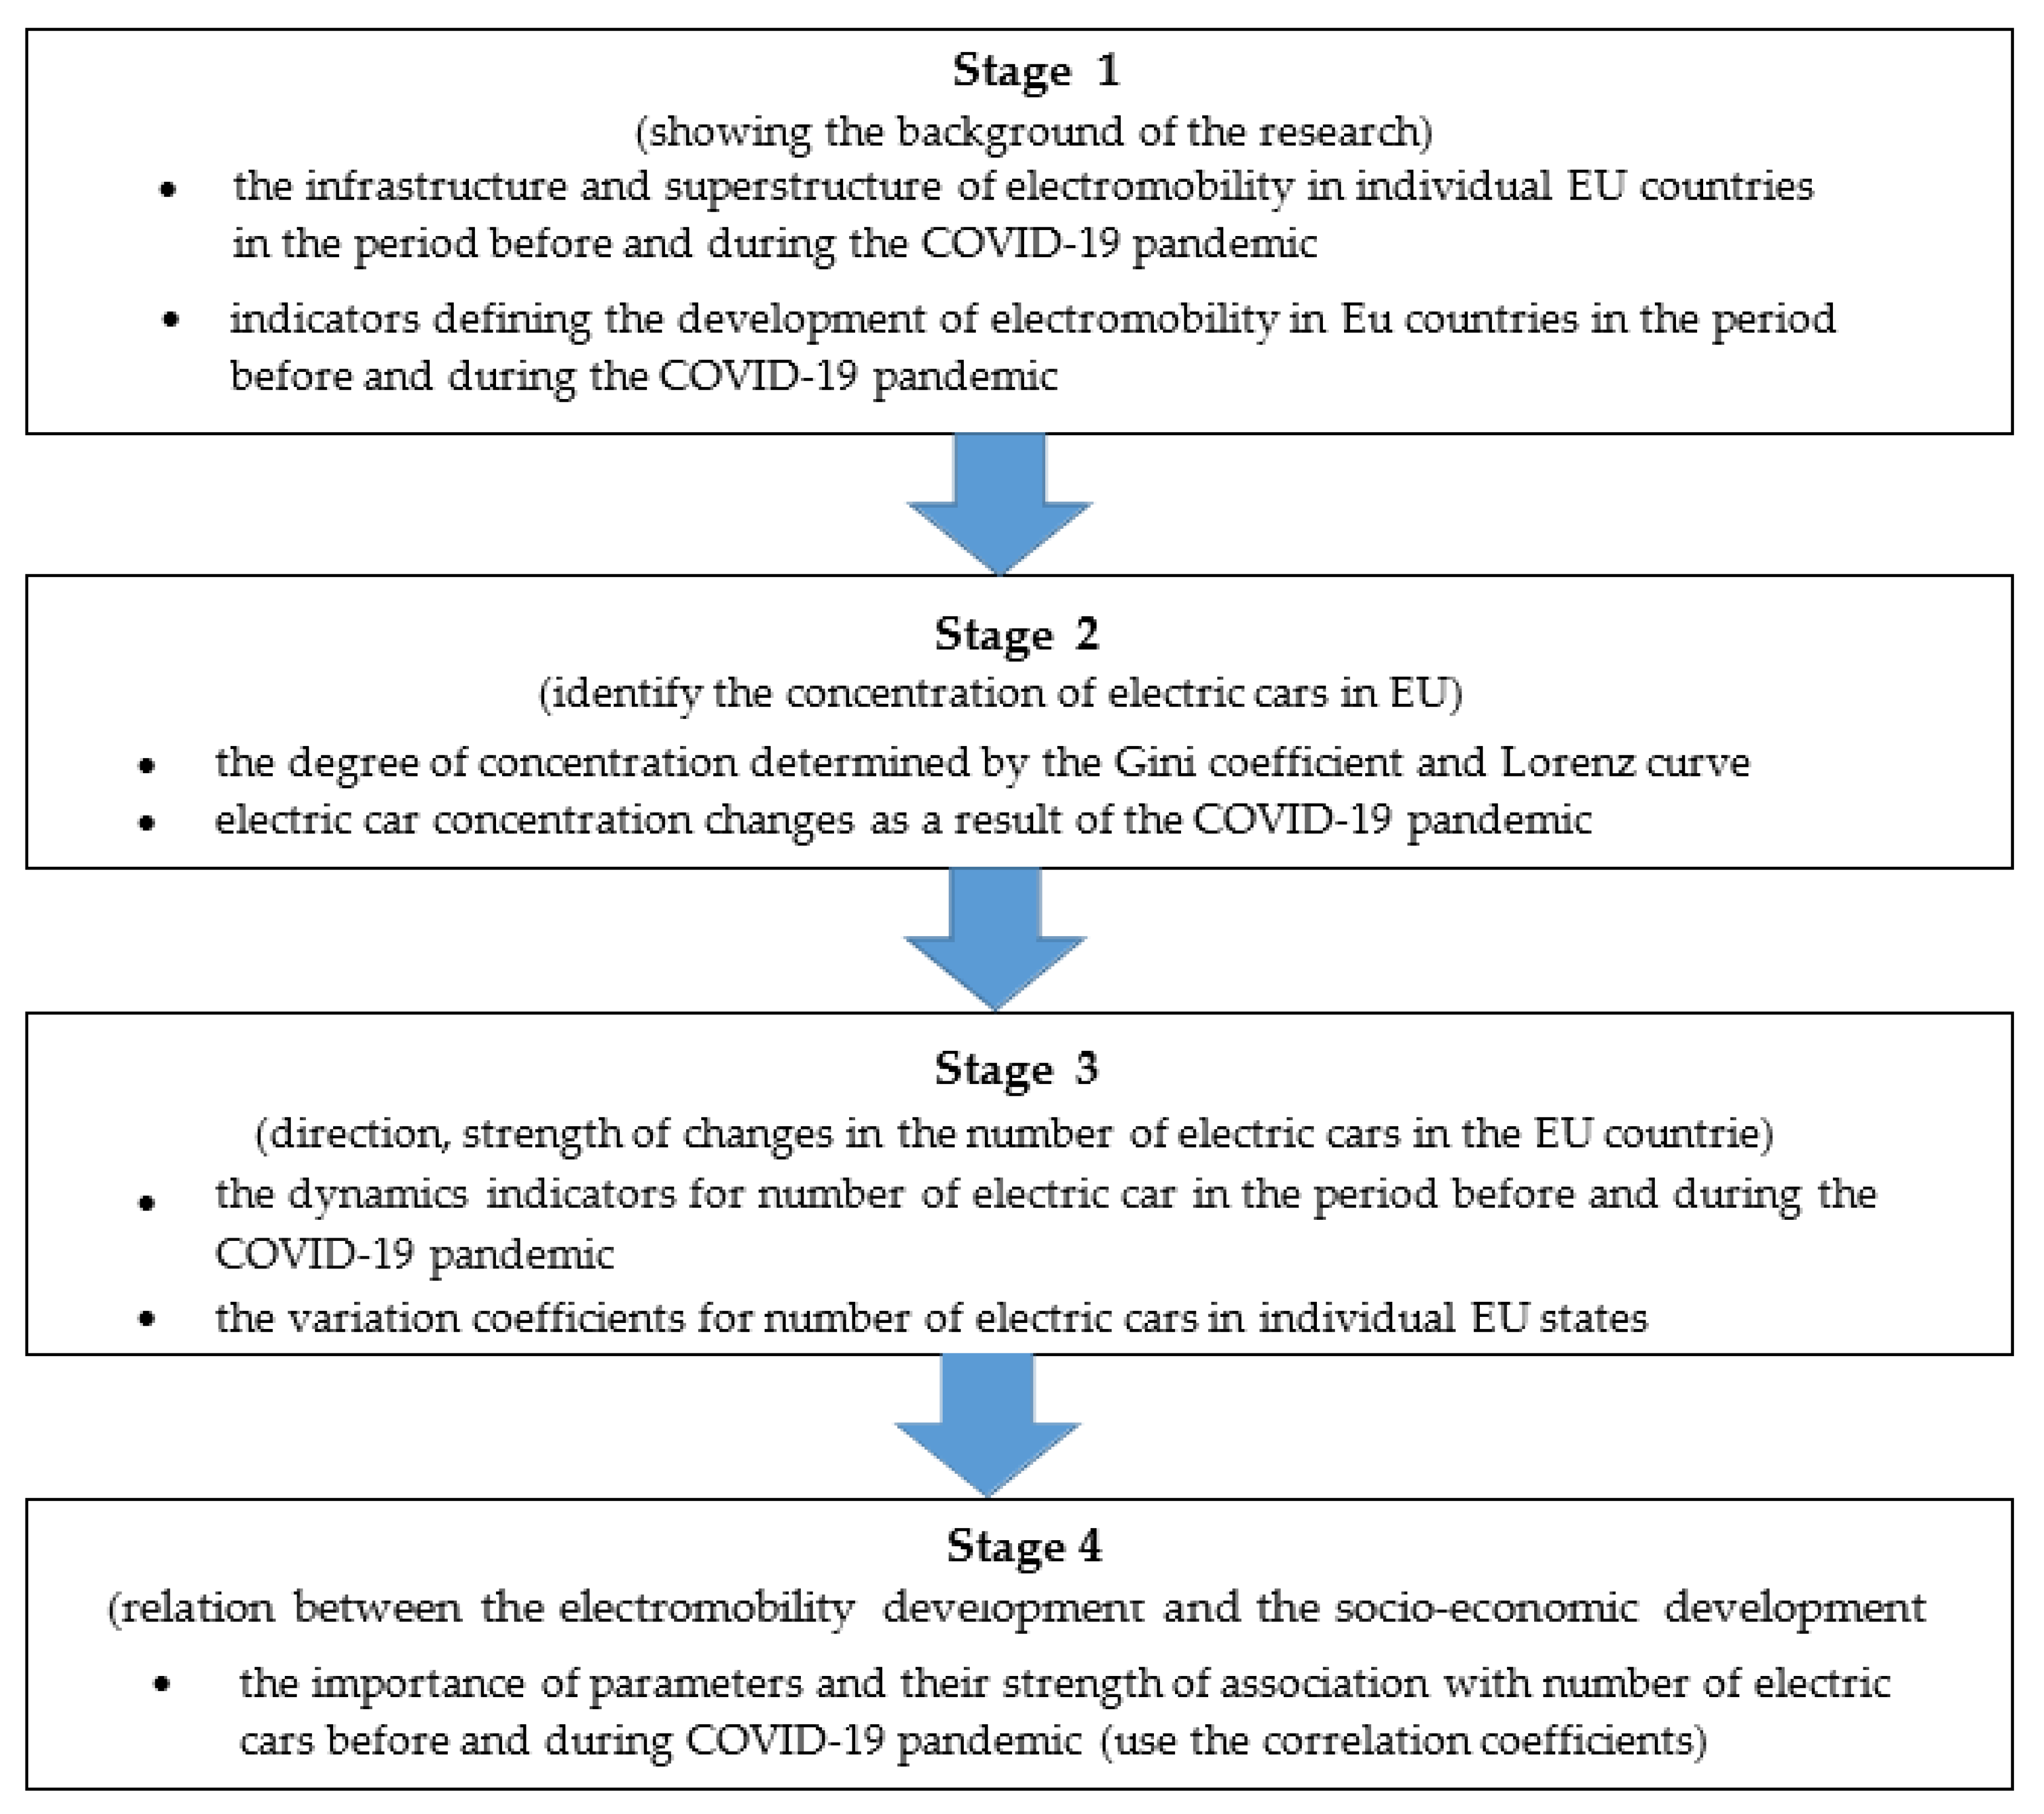
2. Materials and Methods

2.1. Data Collection, Processing, and Limitations

All EU countries were selected for this research using the purposeful selection method, as of 31 December 2020. In total, 28 EU states were examined. Great Britain was a member of the EU until 31 January 2020. Until the end of 2020, there was a transition period in mutual relations between Great Britain and the EU. Relationships in all areas were conducted on the basis of previous conditions. In addition, the country is one of the leaders in electromobility in the EU. Therefore, it was decided to include Great Britain in the research.
The research period covered the years 2011–2020. Adopting such a period is substantively justified. Before 2011, electromobility was developed in a few EU countries. In 2011, electric cars were already in use in most EU countries (in 19 countries). In 2014, electric cars were already available in all countries. Until 2019, changes in electromobility resulting from the normal functioning of the economy can be observed. In 2020, there was an economic crisis caused by the COVID-19 pandemic. The European continent has been severely hit by the effects of COVID-19. The year 2020 was the last in which complete research data is available.
The research used data on the total number of BEV and PHEV electric cars. These were cars that used batteries and required the use of charging stations. Other forms of electromobility, such as electric micromobility (bicycles, scooters, scooters) are becoming more and more popular. They were not tested.
The data used in the study comes from Eurostat for the years 2011–2020. Data collection is limited by the lack of detailed and timely information on electromobility. Additionally, these data are aggregated at the country level, so there is a problem with performing analyses at the regional or city level.
The study is a result of the authors’ previous research on transport. Quite recently, the field of the writers’ interest has been power engineering. These two areas are closely connected because without energy, transport is impossible. The vast majority of authors are economists. Therefore, the aspect related to economics was raised. Additionally, it was noted that there is no current academic studies on the relationship between electromobility and economic development.

2.2. Applied Methods

The research was sectional into stages. Figure 1 shows a scheme of the conducted research.
The first stage of the research presents the situation in all EU countries in the period before and during the COVID-19 pandemic (2019–2020) in terms of the number of electric cars. Such raw data do not always make it possible to determine the significance and development of electromobility in individual countries. Therefore, it was decided to calculate the basic indicators. Such indicators are needed because individual countries vary in terms of population, area of the country, the total number of cars, and the length of highways (roads of the best quality). The aim of this part was to present the actual leaders and outsiders in the field of electromobility in the EU in the period before and during the pandemic.
In the second stage of the research, the concentration of electric cars in total in individual EU states is presented. Changes in this respect are also shown. Gini’s associate was utilized for this aim. The degree of concentration is determined by the number of electric cars in the EU. If these values concern merely one nation, the coefficient would be 1. If, on the other hand, they are spread for more countries, the coefficient is lower; the closer to 0, the more even the decomposition of the volume of consumption of renewable energy amongst EU countries. The degree of concentration can be represented graphically, for which the Lorenz curve is used.
Concentration ratios were calculated every four years and additionally in 2020, as the period of the crisis caused by the COVID-19 pandemic. Therefore, the results relate to the years 2011–2020. Such a comparison allows us to determine the direction and speed of the changes taking place in the concentration of the number of electric cars in the EU.
The Gini coefficient is used to measure the unevenness (concentration) of decomposition of a random variable. In cases where the observations are sorted in ascending order, the coefficient can be presented by the formula [48]:
G ( y ) = i = 1 n ( 2 i n 1 ) × y i n 2 × y ¯
where:
n—count of observations,
y i —value of the “i-th” measurement,
y ¯ —the average value for all observations, i.e., y ¯ = 1 n i = 1 n y i .
The Lorenz curve defines the degree of concentration for a one-dimensional random variable decomposition [49]. With sorted observations yi, being non-negative values 0 y 1 y 2 y n ,   i = 1 n y i > 0 , the Lorenz curve can be referred to as a polyline with apexes ( x h , z h ) , for h = 0, 1, …, n, having the following coordinates:
x 0 = z 0 = 0 ,   x h = h n ,   z h = i = 1 h y i i = 1 n y i
The Gini coefficient means the area between the Lorenz curve and the secant of a unit square multiplied by two.
The third stage of the research presents data on changes in the total number of electric cars in individual EU countries. Dynamics indicators for the number of electric cars were calculated. As a result, the directions and strength of the analyzed variables were obtained. It was not until 2014 that the first electric cars appeared in several countries. Therefore, the dynamics indicators for the two periods 2011–2020 and 2014–2020 were calculated. Admitting the years 2014–2020 to the research allows for more reliable results. In 2014, electric cars were already in use in all countries. Two types of dynamics indicators were used.
In this paper the chain simple dynamic indicators were used as follows [50]:
i t , t 1 = y t y t 1 100
where:
yt—level of the occurrence in a certain period,
yt-1—level of the phenomenon during one period earlier.
The dynamics indices on a constant base were utilized for the research too. The constant-based dynamics indicator has the following formula [50]:
i = y n y 0   or   i = y n y 0 × 100 %
where:
y n —the level of the phenomenon in a certain period,
y 0 —level of the phenomenon during the reference period.
In the third phase, the variation coefficients for the number of electric cars in individual EU states were calculated too. As a result, it was possible to determine whether the number of electric cars is stable or is subject to substantial fluctuations.
The variation coefficient referred to as Cv eliminates the unit of estimate from the standard deviation of a set of number. This is done by receiving the quotient of standard deviation divided by the arithmetic mean. For sequence of N numbers, the variation coefficient is counted as follows [51]:
C v = S M
where:
S—standard deviation of the exemplar set of numbers,
M—arithmetic mean from the exemplar set of numbers.
In the fourth stage, the relationship between the number of electric cars in the EU and the parameters related to socio-economic potential. For the calculations, parameters were selected that are components of simple indicators that actually assess electromobility. These indicators are presented in the first stage of the research. The following variables were used: population (million), area of the country (square kilometer), number of cars, the length of the highways (kilometer), value of gross domestic product (GDP)(million euro), GDP per capita (euro per capita). The research was performed for four periods. Two of these concerned the time before the COVID-19 pandemic, i.e., the years 2011–2019 and 2014–2019. The next two already included 2020, i.e., a full year related to functioning in the conditions of the COVID-19 pandemic (2011–2020 and 2014–2020). The logic of carrying out the tests for different periods was the same as for the dynamics indicators.
Thanks to this study, it is possible to determine the importance of parameters and their strength of association with the number of electric cars before and during COVID-19 pandemic. In this phase of the study, two non-parametric tests were used to define the correlation between the parameters. The first is Kendall’s tau correlation coefficient. This indicator is established on the dissimilarity between the probability that two variables decrease in the same sequence (for the commentate data) and the plausibility that these factors are different. This coefficient has a fluctuation in the range of values <−1, 1>. Value 1 means full match, value 0 indicates no adjust of order, and value -1 indicates the complete reverse. The Kendall coefficient indicates not only the robustness but also the trend of the interdependence. It is an appropriate tool to represent the resemblance of the ordered sets of information. The following formula can be utilized to calculate Kendall’s tau correlation coefficient [52]:
τ = P [ ( x 1 x 2 ) ( y 1 y 2 ) > 0 ] P [ ( x 1 x 2 ) ( y 1 y 2 ) < 0 ]
This formula evaluates Kendall’s tau to give a statistical sample. At the beginning, all possible pairs of the research trial are combined. In the next step, the pairs are split to three potentially units:
P—compatible pairs, in which the analyzed factors about two observations fluctuate in the identic trend, i.e., either in the first remark both are higher than in the second, whether both are less meaningful,
Q—incompatible pairs, in which the factors are different against each other in the opposite tendency, i.e., one of them is much more significant for this observation in the couple, while the other is lower,
T—related couple, when one of the variables has similar values in both tested observations.
The Kendall tau coefficient is then counted from the following formula:
τ = P Q P + Q T
Moreover,
P + Q + T = ( N 2 ) = N ( N 1 ) 2
where:
N—sample volume.
The pattern can be quantified as:
τ = 2 P Q N ( N 1 )
The second form of non-parametric research trial is the Spearman’s rank correlation coefficient, that describes the strength of the correlation of couple characteristics. It is used to study the relationship between quantitative parameters for the small amount of tested observations. Spearman’s rank correlation coefficient is calculated according to the following formula [53]:
r S = 1 6 i = 1 n d i 2 n ( n 2 1 )
where:
di—disagreement between the range of the corresponding parameters xi and feature yi (i = 1, 2, …, n)
The value of Spearman’s rank coefficient oscillates in the range −1 ≤ r s ≤ +1. A positive digit means a positive correlation, while a negative number indicates a negative correlation. The more identic modulus (absolute value) of the correlation coefficient, the stronger a correlation between analyzed variables.
MS Excel was used to calculate the basic electromobility indices as well as the dynamics indicators and coefficient of variation. The Gnu Regression, Econometrics and Time-series Library (GRETL) econometric package was used to determine the degree of concentration of electric cars in the EU, with Kendall’s tau correlation coefficient and Spearman’s rank coefficient [54].
Descriptive, tabular and graphic methods were also used to present some of the findings.

3. Results

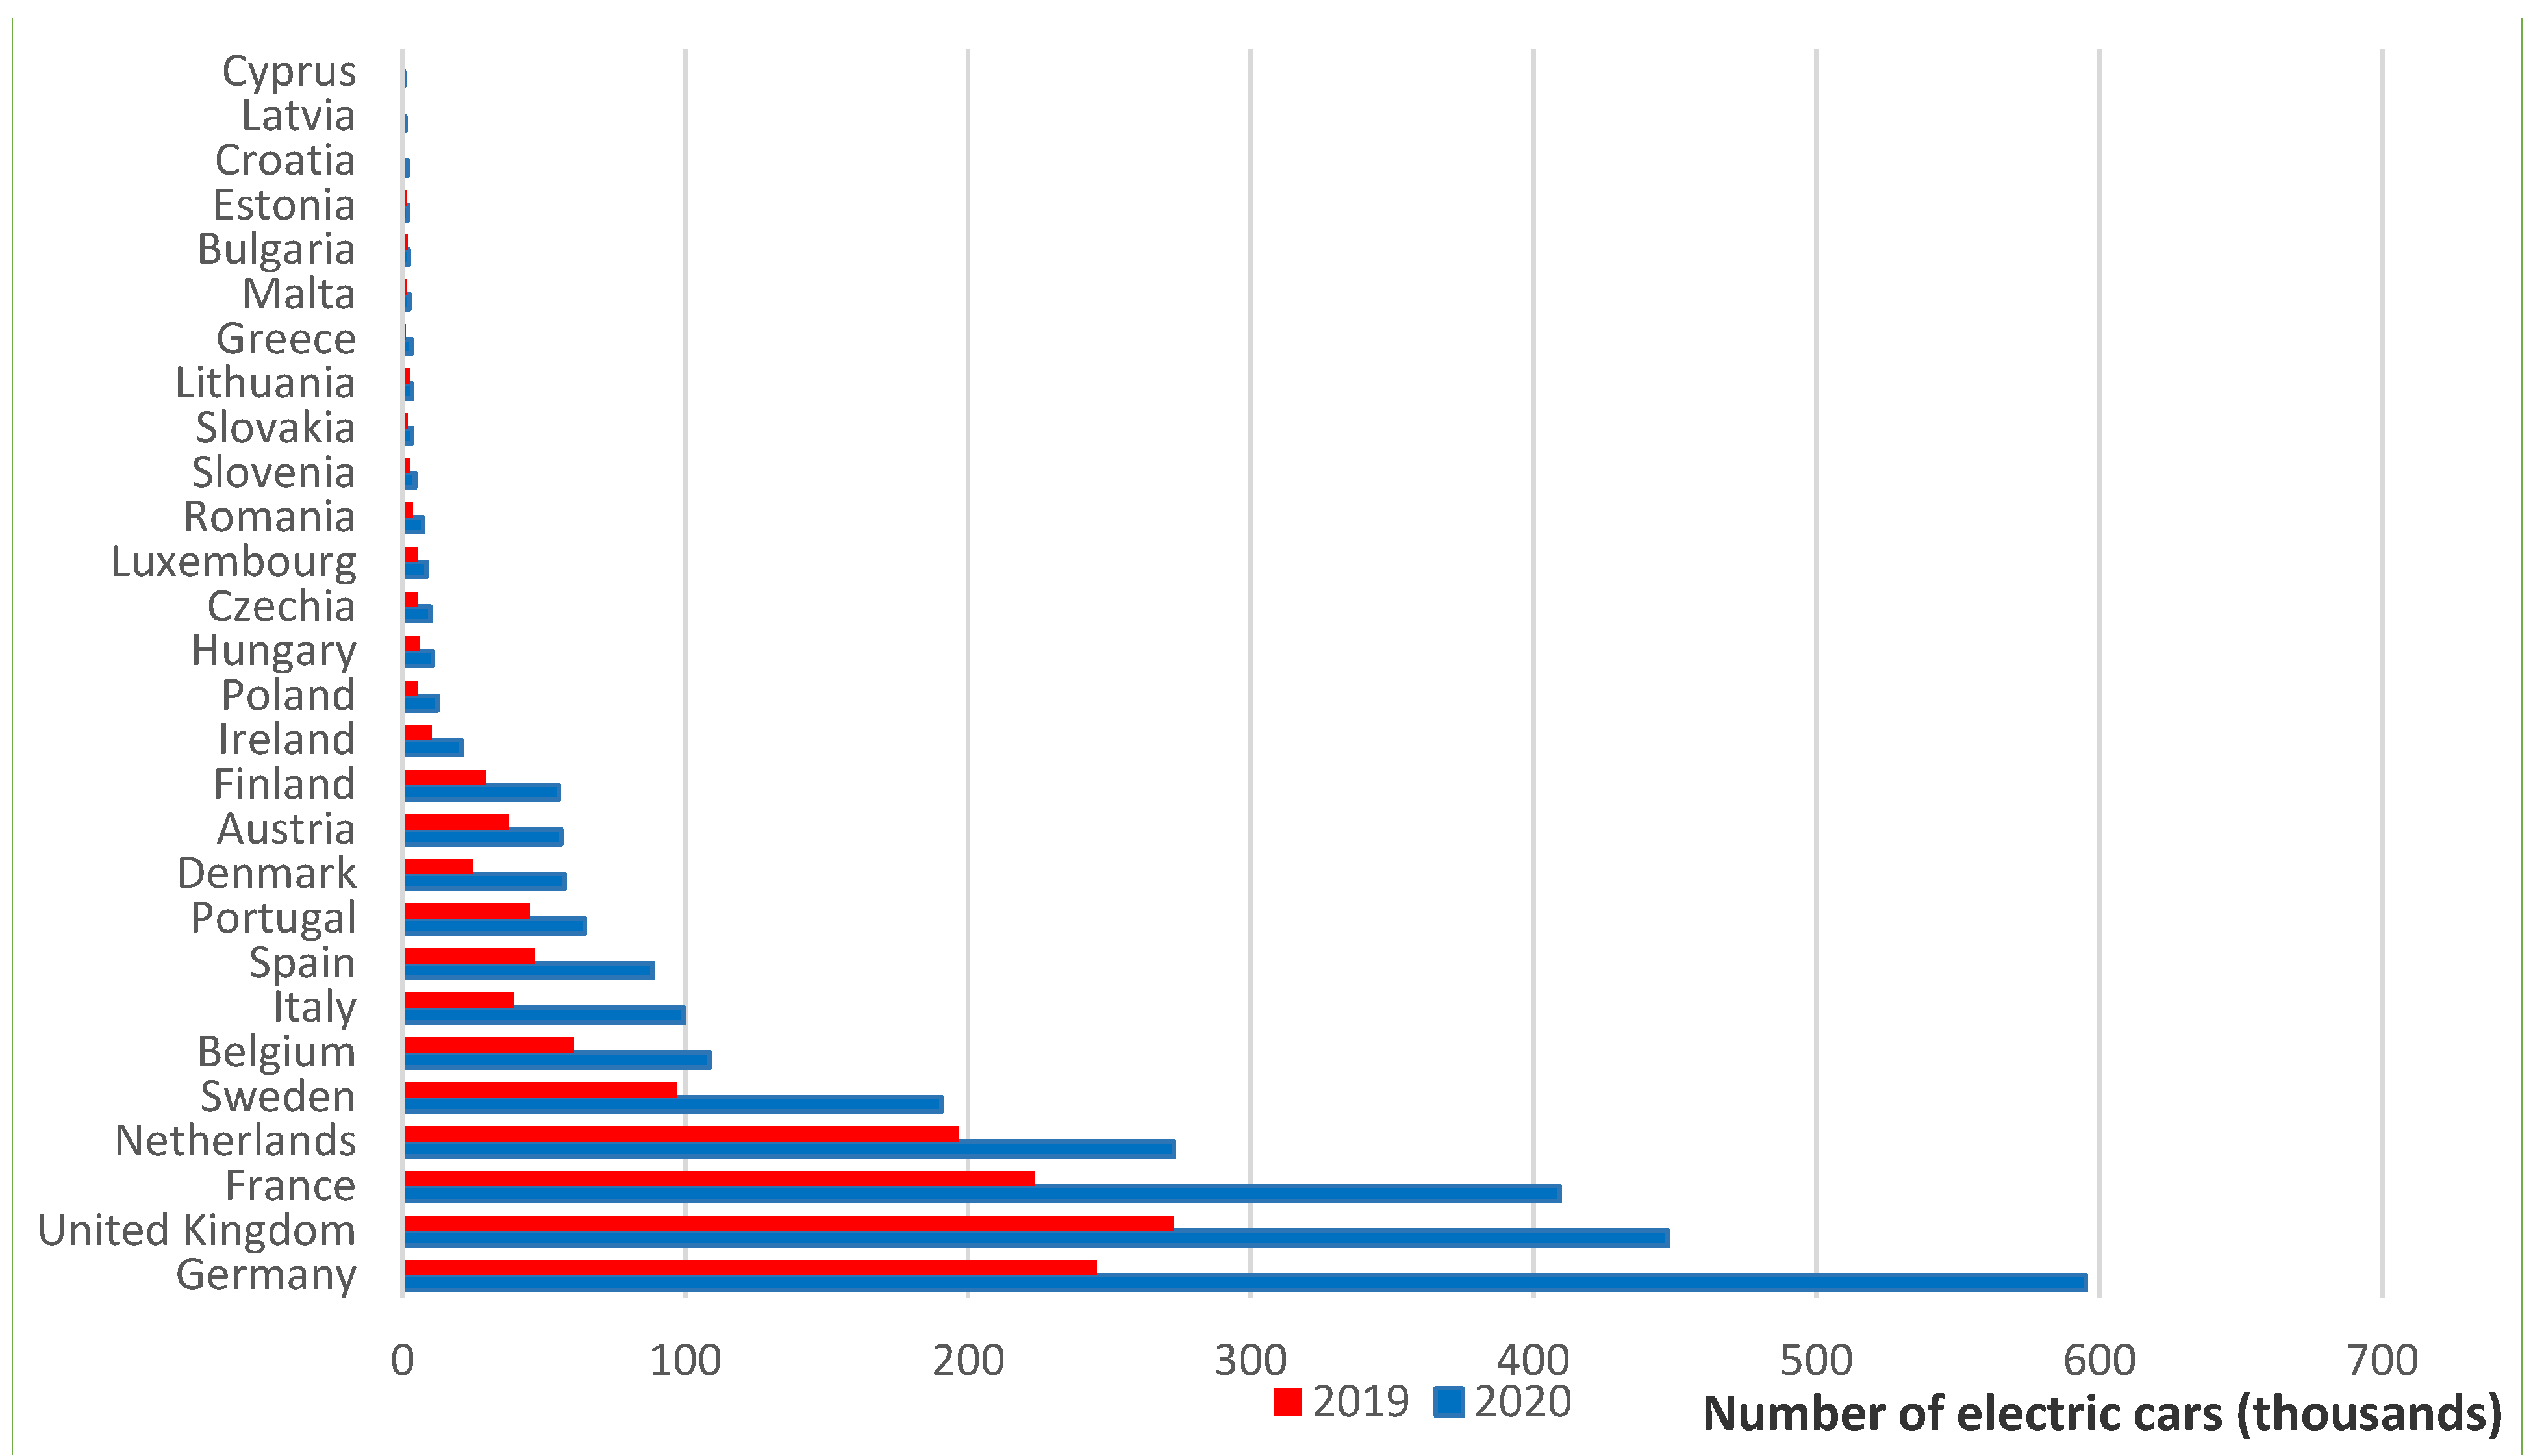
3.1. Electromobility in Individual EU Countries before and during the COVID-19 Pandemic

The development of electromobility can be measured in several ways. One of the most obvious and accurate is the number of electric cars. In EU countries, the idea of electromobility began to gain particular importance in the second decade of the 21st century. In 2011, electric cars were used in 19 EU countries, and in 2014, in all member states. In 2011, a total of 15,000 electric cars were used in the EU, and in 2020 already 2.5 million. Of course, there are differences between countries in the scale and speed of introducing electric cars into service. In 2020, every fourth electric car in the EU was used in Germany (Figure 2). This country has been a leader in the field of electromobility. Certainly, the location of significant car concerns in this country could be one of the factors explaining Germany’s position. Great Britain, France, the Netherlands, and Sweden are also among the top five countries in terms of the number of electric cars. They were the most economically developed countries. In turn, among the five countries with the lowest number of electric cars was Cyprus, Latvia, Croatia, Estonia and Bulgaria. They are economically developing countries. Malta and Cyprus are among the smallest countries in terms of area. In 2020, the number of electric cars in all EU countries increased, which means that the effects of the crisis caused by COVID-19 did not considerably affect this part of the automotive industry.
Appropriate infrastructure in the form of public charging stations contributes to the development of electromobility. Such points are located in the largest cities. The situation in this respect is improving year by year. Individual countries were compared in terms of infrastructure using the indicator of the number of electric cars per one public charging point (Figure 3). It turns out that the largest number of cars for such a point was in countries with a relatively small number of vehicles, such as Portugal, Malta and Lithuania. Probably in this case the development of infrastructure did not keep up with the increase in sales of this type of cars. The case of Germany is interesting, where in 2019 there were 6.2 electric cars per public charging point, and in 2020 it was already 13.3. The reason for such a large increase in the indicator was the very high sales of electric cars in 2020 (an increase of 143% compared with 2019), with a small increase in public charging points (by 14%). A similar situation also occurred in the case of Malta, Ireland, Denmark and Luxembourg. Only a few countries have seen a lower load on public charging stations, i.e., Greece, Cyprus, Bulgaria and Austria. This was due to large investments in infrastructure. In most EU countries, the changes were not large. Of course, the COVID-19 pandemic could have had an impact on electromobility development strategies in individual countries. This problem requires closer examination. The presented results show that there has been no single path for the development of electromobility in individual EU countries.
In the next stage, the basic indicators determining the development of electromobility in individual countries are compared (Table 1). Data are compiled for the two years before and during the COVID-19 crisis. The three highest results for a given indicator are marked in blue, and the three lowest in red. The Netherlands is the country with the best indicators in each category. Almost all of the highest indicators are also in Sweden. It can therefore be concluded that these are the most developed countries in the field of electromobility. Greece is at the other extreme, as is Croatia. In most of the categories, the indicators are relatively low in Poland and Bulgaria. In these countries, the development of electromobility has been quite weak compared with the potential. Interestingly, Germany is in the middle of the field in all indicators. Of course, the number of electric cars is impressive, but it should be remembered that it is a country with the largest population of people, a very large area, developed motorization and transport infrastructure. The indicator determining the share of electric cars in the total number of cars in a given country is particularly interesting. In Sweden, the Netherlands and Denmark, it is at the level of 2–4%. It must be added that these countries are leaders. Objectively assessing the share of electric cars in the total number of cars, it is very low. The still low popularity of this type of vehicle, and the undeveloped infrastructure causes a vicious circle. Infrastructure in the form of public charging stations is particularly required. Without it, the number of electric cars will not grow rapidly.

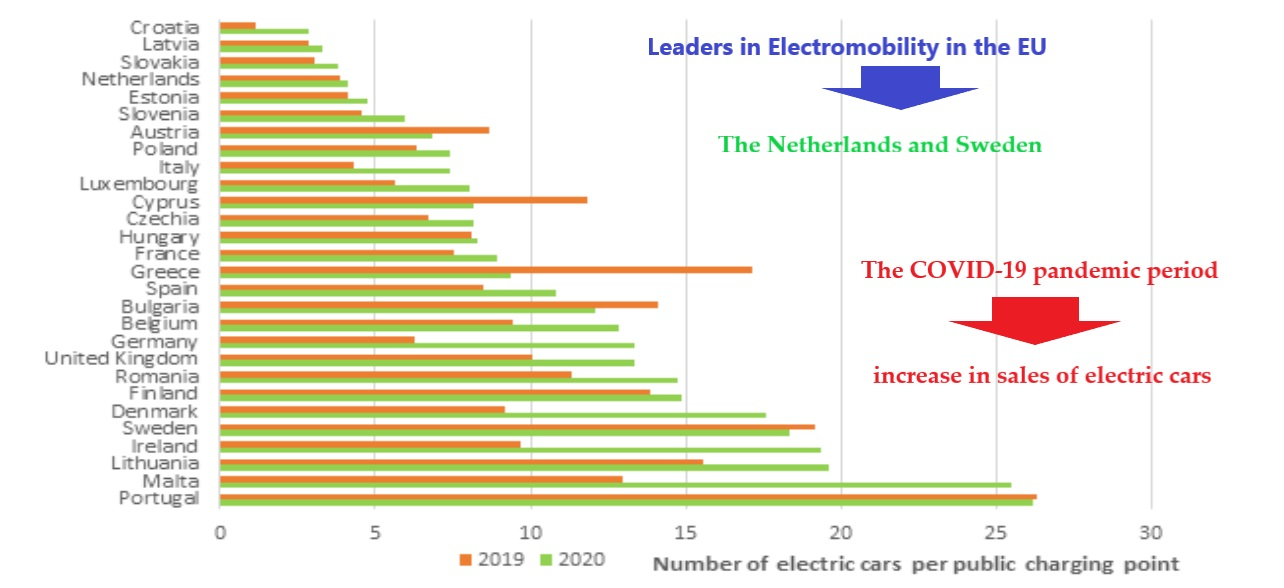
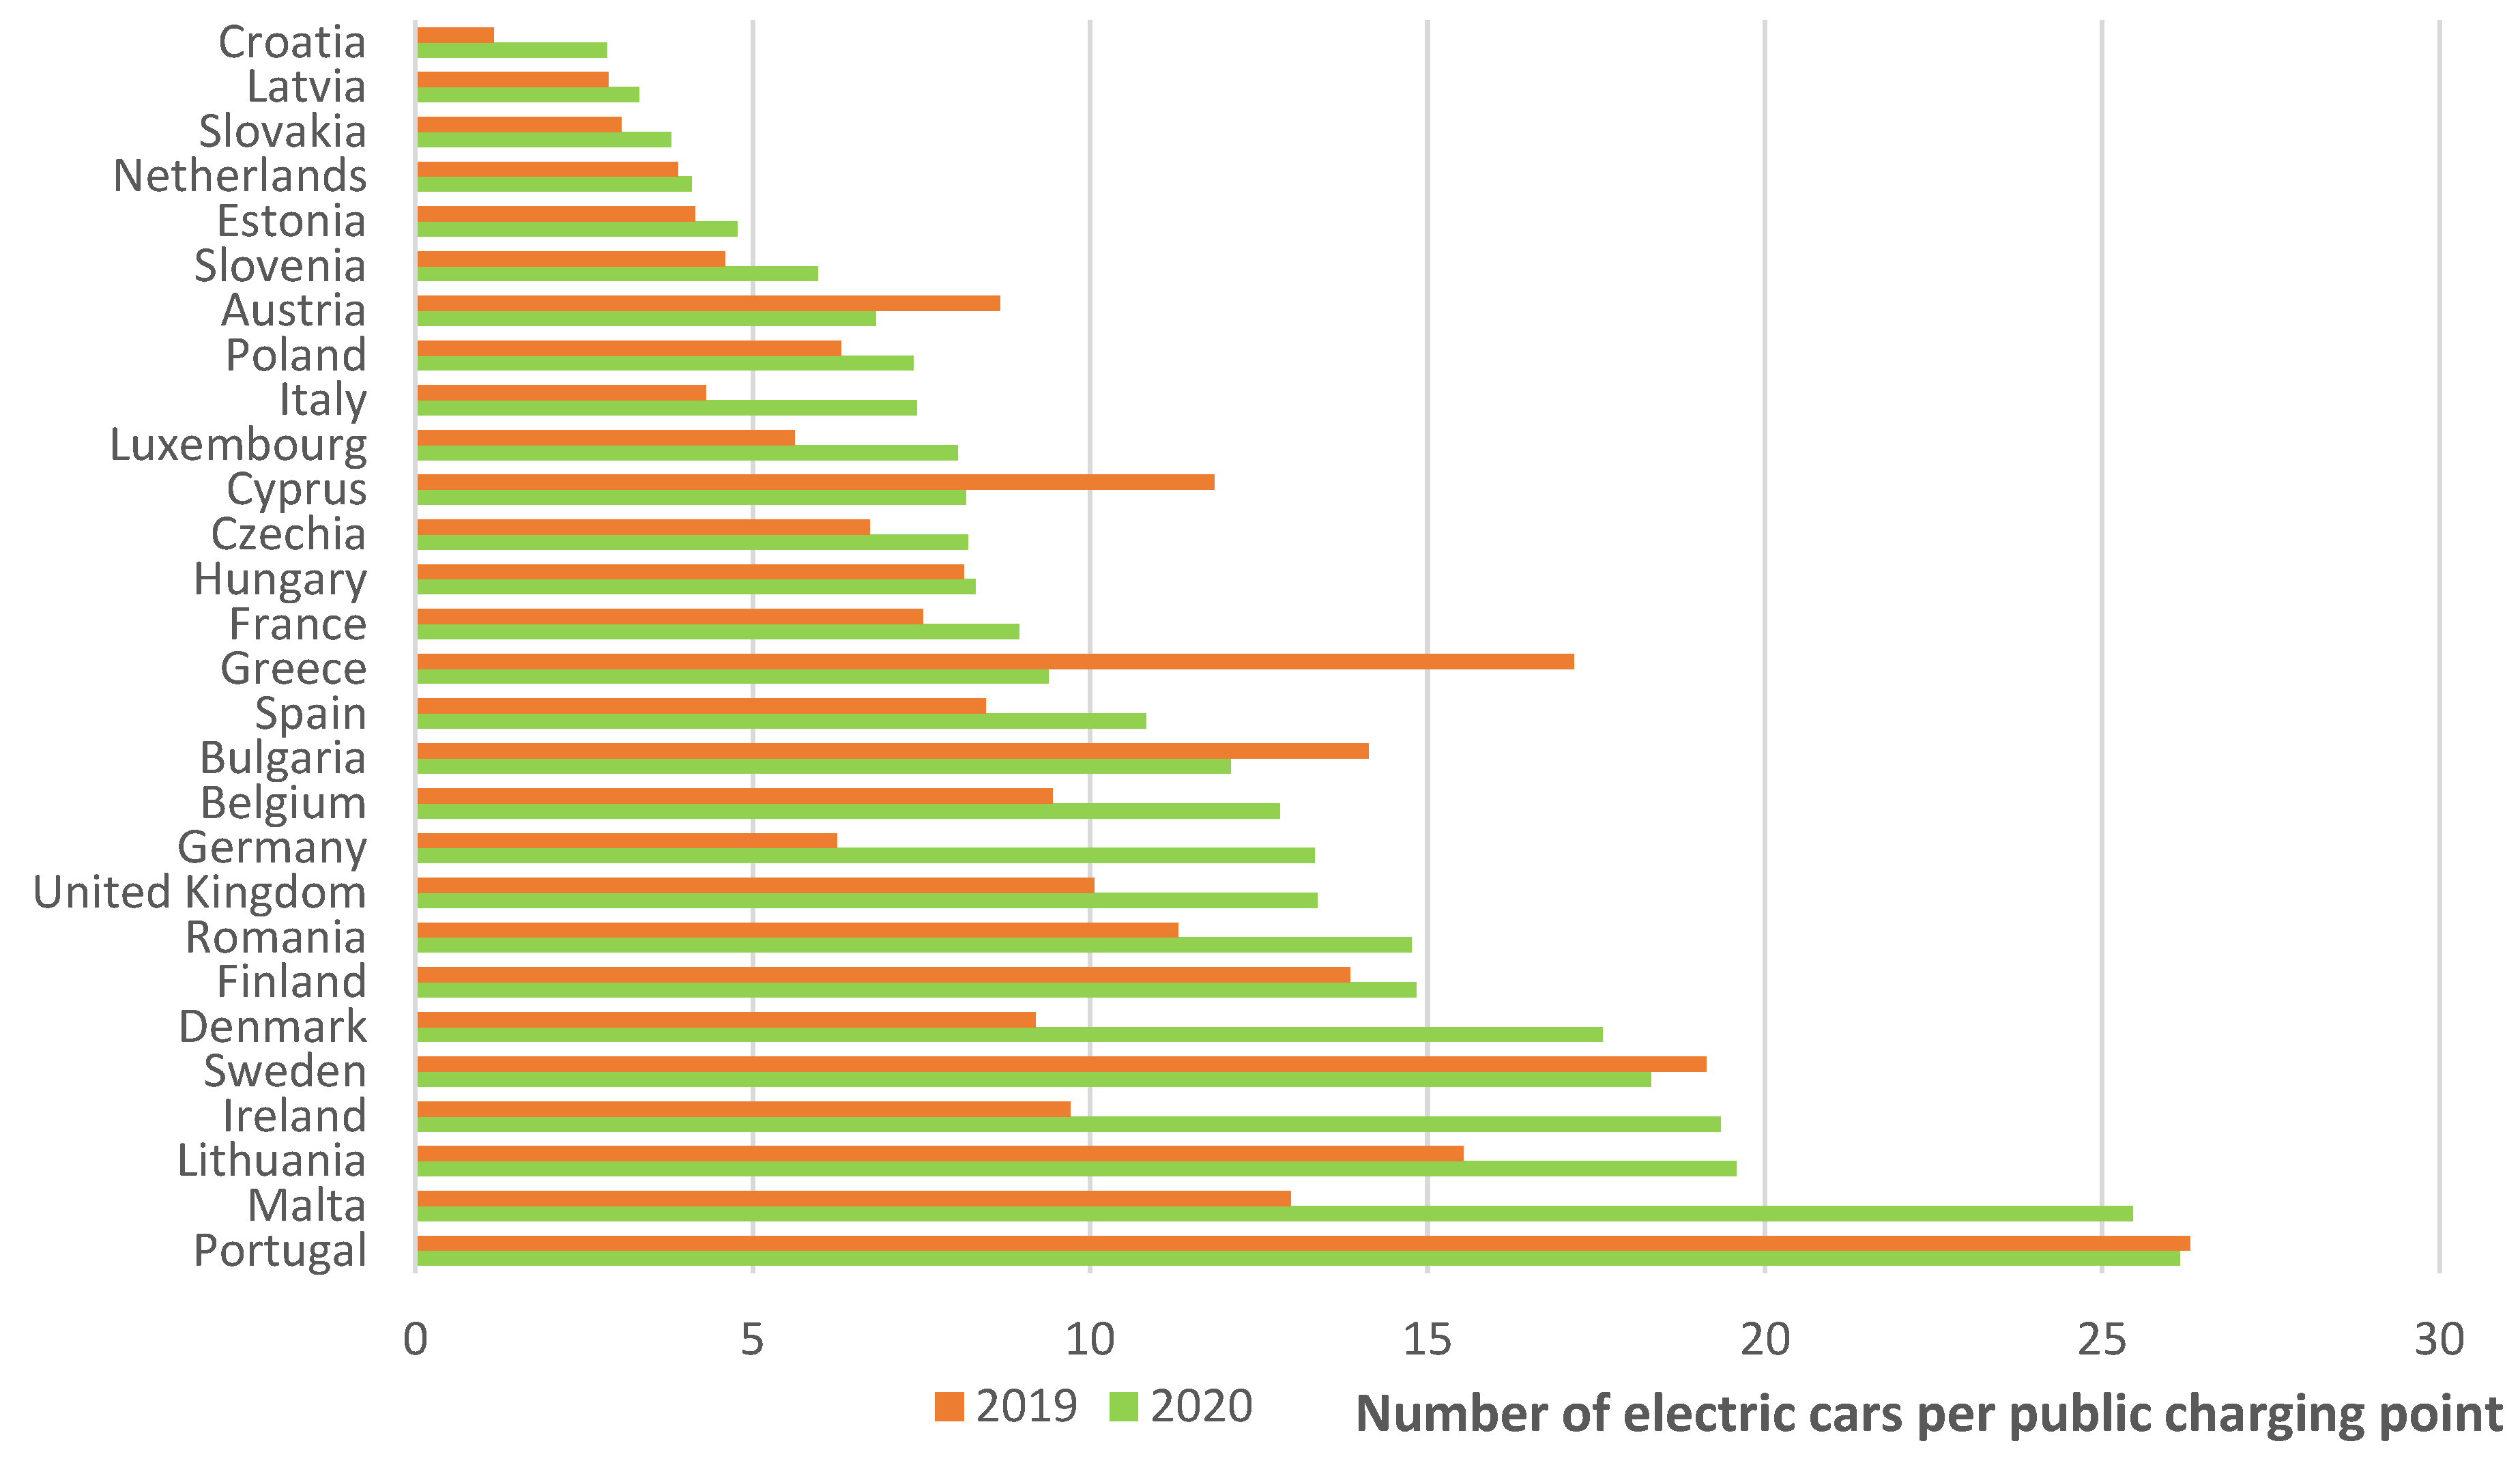
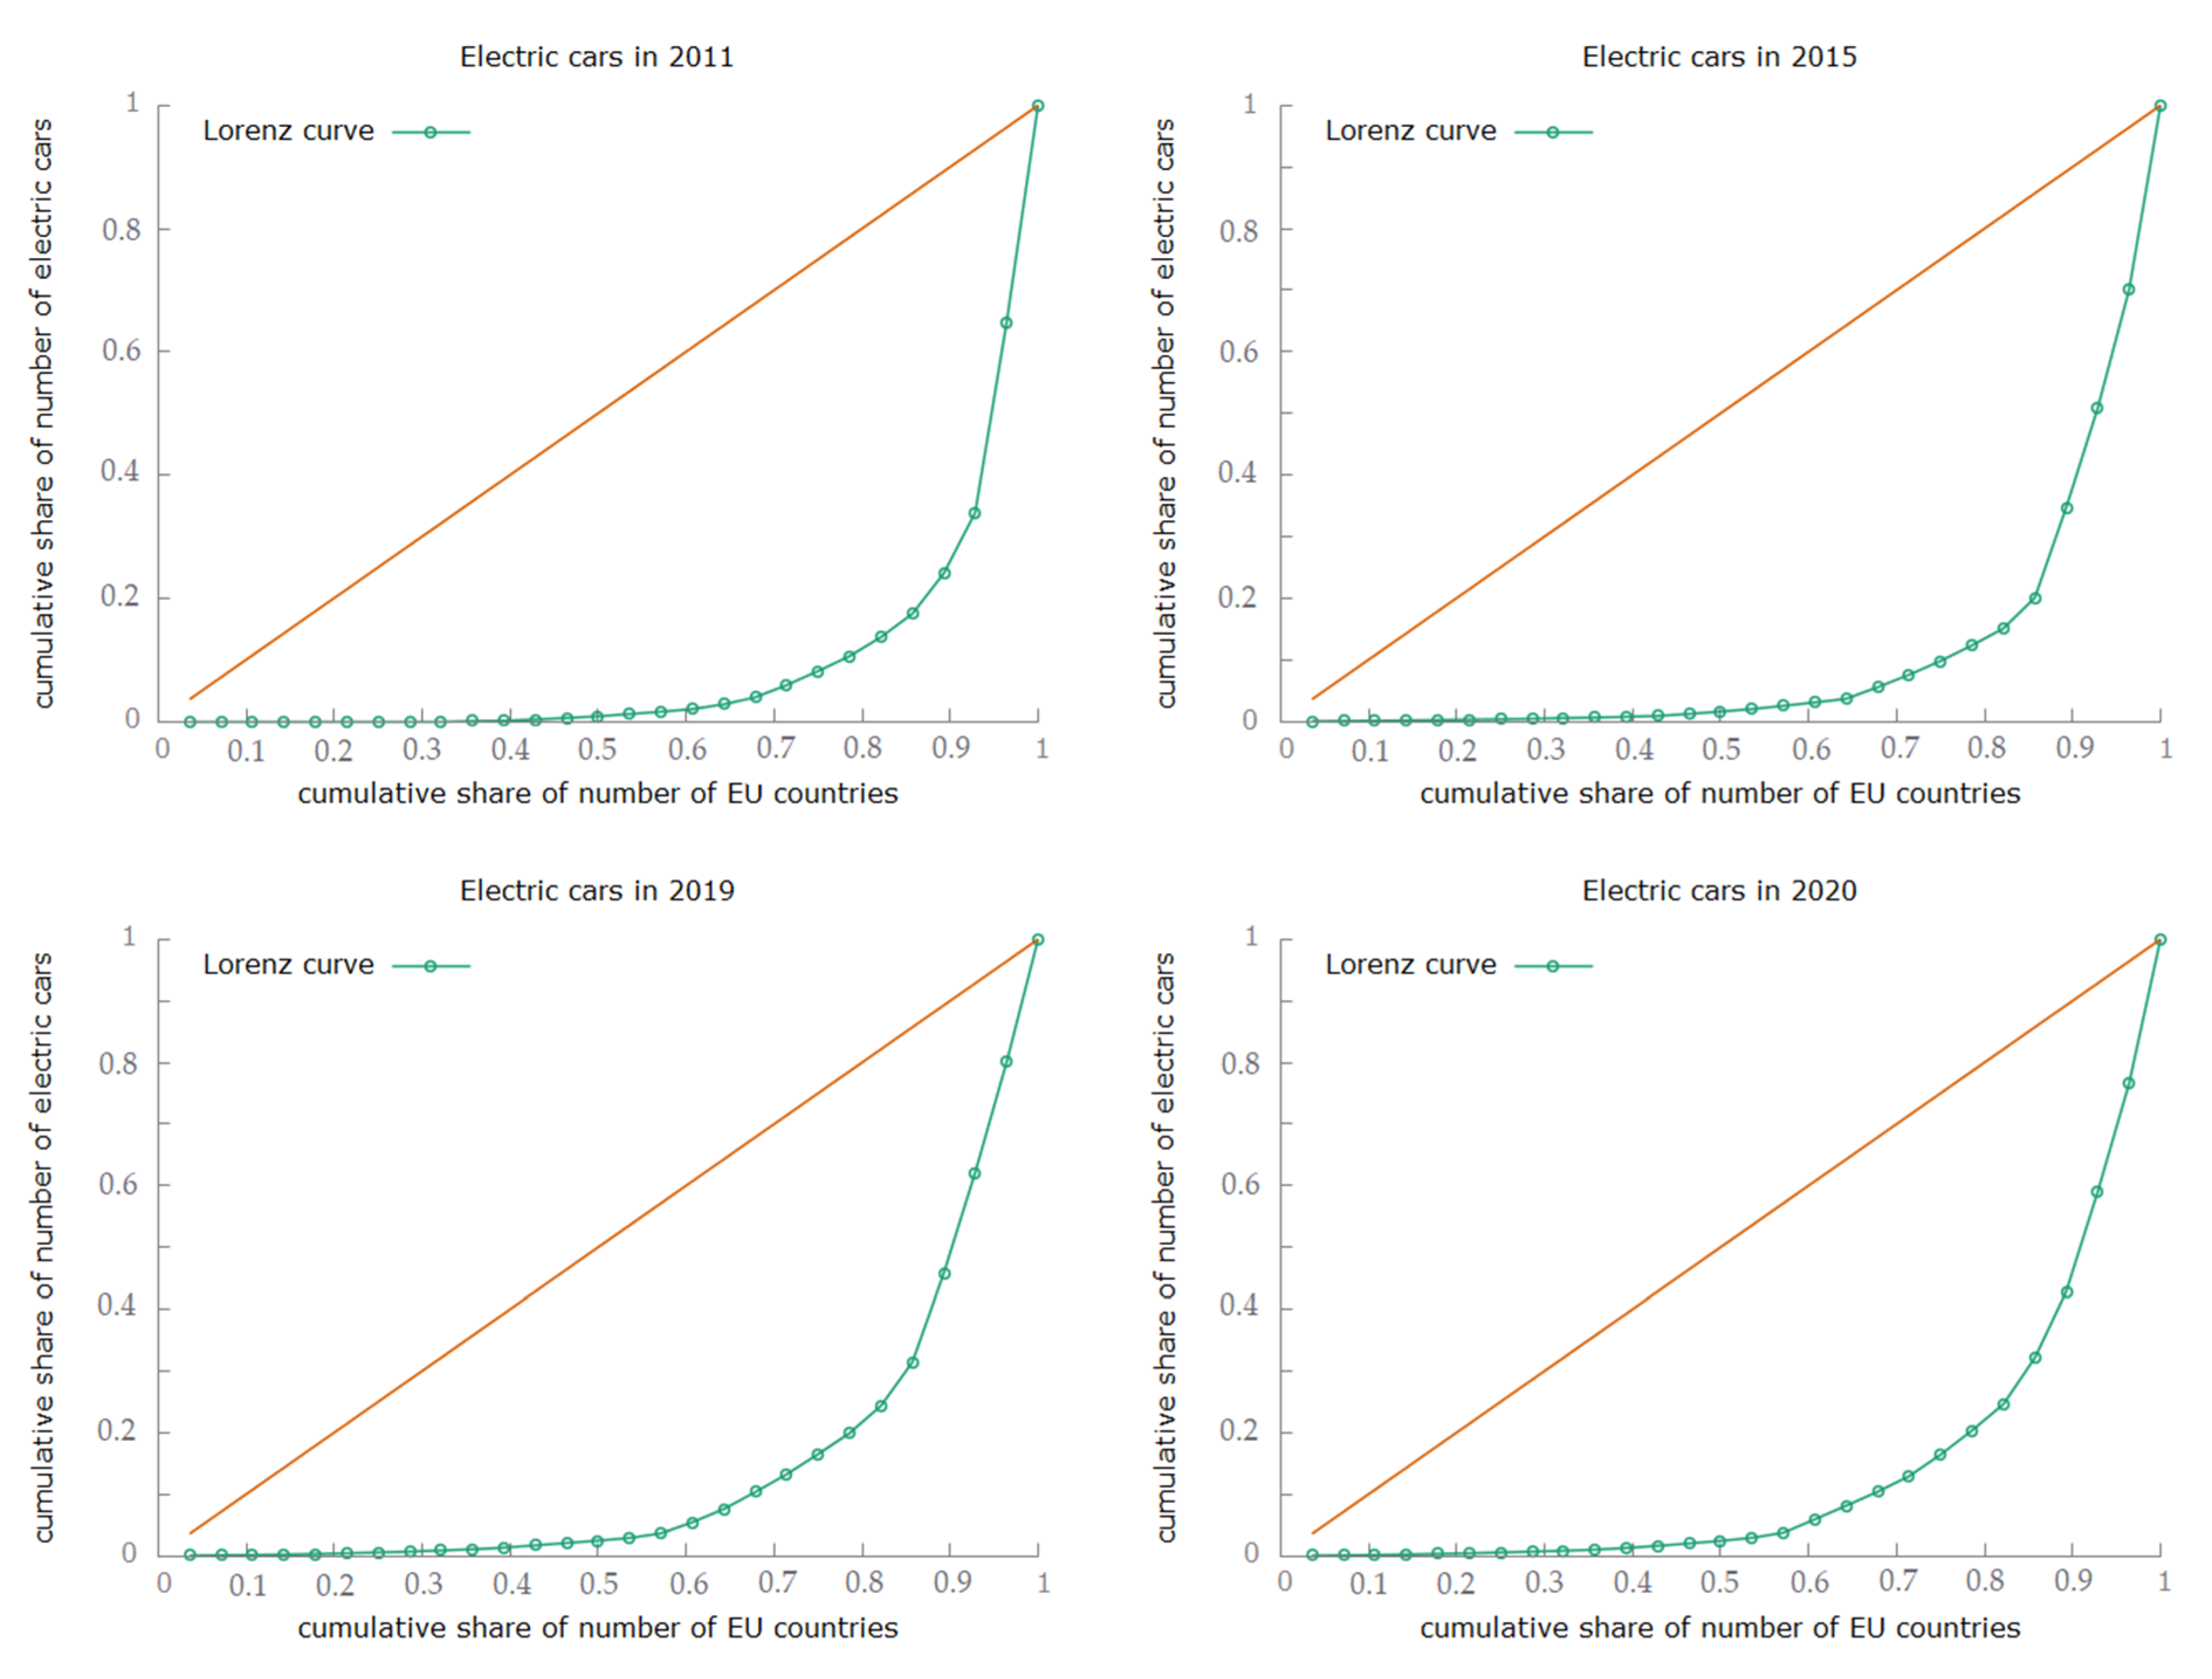
3.2. Changes in the Concentration of Electric Cars in EU Countries

The next stage of the research was to present the concentration of the number of electric cars in individual countries and changes in this regard. The Gini coefficient was used to determine the concentration degree of the number of electric cars. In 2011, the Gini coefficient calculated from the sample was 0.83, and the estimated coefficient for the population was 0.86. This meant a very high concentration of electric cars in one or several EU countries. In the following years, the degree of concentration decreased systematically. The existing differentiation was as well shown by means of the Lorenz concentration curve (Figure 4). Among the leaders there are countries from Western Europe, the most economically developed. In 2020, the top five countries (Germany, Great Britain, France, the Netherlands, Sweden) accounted for 75% of the total number of electric cars in the EU. In the top ten countries, there were 92% of such cars in total. This group included only Western European countries.
Concentration coefficients were as well calculated for the earlier periods, every four years, and additionally in 2020, as the period of the crisis caused by the COVID-19 pandemic. As a result, the effects relate to the years 2011–2020. Such a comparison allows us to determine the direction and pace of the changes taking place in the concentration of the number of electric cars in the EU. Generally, it can be noticed that the concentration level of electric cars is decreasing in several countries (Table 2). Such a phenomenon is positive because it proves the development of this type of transport in many EU countries. Interestingly, the period of the crisis resulted in a slight increase in concentration. Probably in less developed countries, the focus has been on other problems. Therefore, the most developed countries in the field of electromobility have increased their advantage.

3.3. Directions of Changes of Number of Electric Cars in EU Countries before and during the COVID-19 Pandemic

The number of electric cars in the EU countries varies. The dynamics of their changes are also different (Table 3). The three countries with the highest dynamics of changes in a given year or period are marked in blue, and three countries with the lowest dynamics are marked in red. In fact, there is no country that would be the growth leader in the following years. The reason is also because there are different levels from which individual countries began to develop electromobility. Very high dynamics indicators were achieved for the years 2011–2020. The largest of these are in Greece, Romania and Hungary, i.e., in countries that have not been the largest tycoons in the field of electromobility. In turn, the lowest rates are obtained in Croatia, Estonia and Bulgaria, which were most often indicated as the least developed in electromobility. For the years 2014–2020, the dynamics indicators are still very high, but still much lower than for the period 2011–2020. This time, the fastest growth in the number of electric cars is in Portugal, Romania and Finland. On the other hand, the slowest rates are in Estonia, Latvia and the Netherlands. There may have been some market saturation in the Netherlands. In addition, the country had begun to develop electromobility very quickly. That said, the more than fivefold increase in the number of electric cars in six years cannot be considered a poor result. Overall, it must be said that the number of electric cars grew rapidly in all countries. The pace of change depended on the initial number of electric cars and the stage of electromobility development in a given country. In 2020, compared with 2019, the number of cars increased in all EU countries. There was no COVID-19 crisis in sight here. On the contrary, the growth rate in the entire EU in 2020 was 86%, while in 2019 it was 48%.

3.4. Variability of the Number of Electric Cars in EU Countries

The variability of the number of electric cars over several periods was also determined. Again, the three best results are marked in blue, with the lowest variability indicating stable, steady growth. In turn, the three highest results, i.e., countries with very large fluctuations in the number of electric cars, are marked in red. The greatest stabilization is in Estonia, the Netherlands and Latvia (Table 4). In turn, the greatest changes are found in Malta, Romania and Greece. In the case of adopting a shorter period (from 2014), the level of variability in the number of cars is lower than for the longer period (from 2011). Additionally, a comparison of the results for the periods before the COVID-19 pandemic with the periods including the year 2020 allowed us to state a certain regularity. The COVID-19 pandemic resulted in greater variability in the number of electric cars in individual EU countries. Based on the results of the dynamics study, it can be concluded that in 2020, as a rule, the dynamics of change accelerated, the number of cars increased significantly. Therefore, the coefficient of variation deteriorated when taking into account the year 2020.

3.5. Relation between the Number of Electric Cars and Parameters Related to Socio-Economic Potential in the EU before and during the COVID-19 Pandemic

In the next step, the Kendall tau correlation coefficient and Spearman’s rank correlation coefficients were calculated. The aim was to find the relationship between the number of electric cars in the EU and the parameters related to the socio-economic potential (Table 5 and Table 6). We used p = 0.05 to specify the border value of the significance level. Correlation coefficients were calculated for the entire EU for different periods. A research project attempted to test a correlation that does not indicate that one factor influences another, but that there is a strong significant or weak secondary relationship. The number of electric cars in the EU was used for the calculations.
For all parameters, significant relationships with a strong connection with the number of electric cars were found. In most cases, this relationship was very strong. The EU population is steadily growing, as is the number of cars and the length of highways. For these parameters, very good compliance with the increase in the number of electric cars was obtained. The surface area of the EU remains basically the same, so the correlation was negative for this parameter. Economic parameters such as total GDP value and per capita also showed a close relationship with the number of electric cars in the EU. Such results were noted in both tests. Based on previous analyses and correlation studies, it can be concluded that a higher standard of living has been associated with more electric cars in the EU. On the other hand, the deterioration of the economic situation in 2020 did not stop the upward trend in the number of electric cars. It can be said that, on the contrary, the introduction of electromobility has even accelerated. Interestingly, the results for the periods containing the years 2011–2019 and 2014–2019 indicate a higher correlation than for the periods containing 2020. They confirm that the crisis caused by COVID-19 had an impact on the economic situation in the EU but did not slow down changes related to the introduction of electromobility. Additionally, in longer periods (from 2011), more strict dependencies were visible than in shorter periods (from 2014). Based on the research, a general conclusion can be drawn that the development of electromobility is progressing despite the crisis caused by COVID-19. This is probably largely influenced by the policies of the EU and individual countries. Such issues may pose a new problem to be solved in future research.

4. Discussion

The development of electromobility in Europe has its motivators, but also barriers. According to Biresselioglu et al. [55,56] the main barriers are the lack of charging infrastructure, economic constraints and high-cost concerns, technical and operational constraints, as well as a lack of trust, information, and knowledge. In turn, the most important drivers appear to be the environmental, economic, and technical benefits of electric vehicles, as well as personal and demographic factors. It seems that economic and environmental factors have the greatest influence here. Haddadian et al. point to the higher price of an electric vehicle compared with a vehicle powered by conventional energy [57]. Such analysis should take into account the life cycle costs of the vehicles. Such studies were performed by Gass et al. [58], Thiel et al. [59] and Ogden et al. [60]. The results were inconclusive and often the electric car was not the best option. The introduction of new technologies depends largely on economic factors. Incentives for car buyers are necessary. Mock and Yang [61] analyzed the tax incentive policy for electric vehicles around the world. They found that there is a significant relationship between supporting national incentive systems and the level of use of electric vehicles. The most effective incentives are direct subsidies (a one-time bonus when buying an electric vehicle) and tax breaks. Li et al. [62], using the example of the US market, found that a federal income tax credit of up to USD 7500 for electric vehicles buyers contributed to about 40% of sales of these cars during 2011–2013. Different forms of support were used in individual EU countries, which also translated into an interest in purchasing electric cars. The different forms and amounts of support may partially explain the disparities between countries in the field of electromobility development, which were found in our research [63]. According to Zubaryev et al. [64] an adequate charging infrastructure is one of the most important factors for the large-scale deployment of electric vehicles in Europe. Harrison and Thiel [65] drew attention to the appropriate ratio between public charging points and the number of cars, especially in the early stages of introducing electromobility. The optimal ratio of electric vehicles to charging points is from 5 to 25. In our research, the highest rate was obtained in Sweden in 2020, with 18.46 cars per public charging point. In most countries (16 countries) the indicator was below five. The situation is better than in 2019 when too low an indicator was found in 23 countries. Improving this indicator to the optimal one may contribute to the faster development of electromobility in individual EU countries. Hall and Lutsey [66] report in their study that the indicator of the number of electric cars per public charging point is not interpreted in the same way. In 2014, the European Parliament recommended that this ratio should be 10. In our research, exactly this ratio was achieved by 2020 in only Finland, Denmark and Belgium. It was higher in three countries and lower in others. These results show that EU countries in most cases developed different aspects of electromobility unevenly.
Another problem in the development of electromobility in the EU is the inadequate attitude of car dealers. In studies by de Rubens et al. [67] made at 82 car dealerships in Denmark, Finland, Iceland, Norway, and Sweden, it was found that dealers disregarded electric vehicles, misled buyers about vehicle specifications, omitted electric vehicles in sales talks, and strongly suggested vehicles with gasoline and diesel engines. Additionally, the sale of electric cars requires the adaptation of business models and entire supply chains, which is a problem [68,69,70]. Dealerships are also discouraged by the reduced number of required parts and services for electric cars, which represent significant profits for dealers for conventional cars [71,72]. These are additional factors that could lead to poor performance in the take-up of electric cars. During the COVID-19 pandemic, contacts between buyers and dealers were reduced. It can be assumed that many buyers of electric cars drew their knowledge from the internet. At that time, they were not as subject to sellers’ suggestions as they were before the pandemic. Perhaps the pandemic thus contributed to the more frequent choice of electric cars by buyers. In 2020, every tenth car sold in the EU was electric [73].
Tucki et al. [74] indicated that the leaders of the electromobility sector in the EU were the Netherlands, France, Germany, and the United Kingdom. In 2017, the total number of electric car registrations in these countries accounted for around 70% of all registrations in the EU. The results obtained by us for the years 2019–2020 are similar. The same countries dominated and their share was similar to the data from 2017. Tucki et al. [74] stated that the leaders of electromobility were highly developed countries and it ranks very high in terms of economic conditions. At the same time, in these countries, the dynamics of changes in the number of electric cars was much lower than in developing countries such as Poland. We obtained similar results in our research. In many articles, the authors focus on the nominal number of electric cars or new registrations, equating the obtained results with the level of electromobility development. An example is the work of Tucki et al. [75], Drożdż [76], Sendek-Matysiak and Łosiewicz [77]. More complex methods of electromobility assessment in the form of indicators were used, among others, by Feckova Skrabulakova et al. [78], Schuh et al. [79] and Silvestri et al. [80]. Overall, however, such composite indicators have not been used very often. In our research, we proposed the use of indicators assessing the development of electromobility, such as the number of electric cars per population, as well as the area of the country, the total number of cars, and the length of highways (roads of the best quality). Thanks to this, we were able to assess the actual development of electromobility in a given country. It turned out that the leaders were not the largest countries anymore. The highest levels of electromobility development were found in Sweden and the Netherlands. We should also distinguish Luxembourg for the number of electric cars per thousand inhabitants, Belgium and Malta for electric cars per square kilometer, Denmark and Luxembourg for electric cars share in total cars, Great Britain for electric cars per kilometer of motorway.
We have not found any papers in which the authors analyze the relationship between the level of economic development of the country and the number of electric cars used. Our research fills the research gap in this aspect. We found that such relationships exist. Other authors most often assessed the development of electromobility as the cause, and not the result, of economic development. They argued that as a result of developing electromobility, many new jobs were created and the economy was developing. This statement is of course also true. This type of regularity was found, among others, by Daňo and Rehák [81], Połom and Wiśniewski [82], Drożdż and Starzyński [83], Castelli and Beretta [84]. A different view is represented by Mönnig et al. [85] who, based on Germany, state that initially the development of electromobility has a positive impact on economic development, but in the long run it leads to a reduction in the value of GDP and employment. According to estimates, the technology change will lead to the loss of 114,000 jobs by the end of 2035. The entire German economy will lose almost EUR 20 billion (0.6% of GDP). A certain explanation is the functioning of many automotive concerns in Germany. Electric cars compete with cars powered by conventional fuels. In addition, they do not require as much maintenance as cars with a gasoline or diesel engine. Another example is Russia. According to Kolpakov and Galinger [86], increasing the market share of electric vehicles will worsen macroeconomic indicators. Higher material consumption of low-emission technologies ensures increased production in the country, but their disadvantage is the need for additional import of elements and subassemblies. Additionally, Russia would experience a decrease in revenues from the sale of crude oil and gas.
According to Ivanov and Dolgui [87], the COVID-19 pandemic was one of the most serious supply chain disruptors in recent world history. Baldwin and Tomiura [88] state that the spread of the disease from China to other industrial powers in the US and the EU has caused massive supply disruptions. Additionally, these supply disruptions would cascade onto other manufacturing sectors in countries less affected by knock-on effects in the supply chain. The automotive sector is highly internationalized, with highly specialized suppliers that make short-term substitution difficult [89,90]. In the automotive industry, the effects of the pandemic and the domino effect were very visible. The decreases in production in Germany affected suppliers from, among others, Hungary, Spain, Italy, and the USA. At the same time, the demand for German cars was falling, e.g., in the USA, China, Austria [91]. The automotive industry has been one of the industries most affected by COVID-19 in the first period of the pandemic. The supply chains of the European automotive industry have been disrupted by downtime in Chinese factories [92]. However, shutdowns in factories in Europe from March to May 2020 were more severe. In EU member states, automotive factories have been shut down for an average of 30 days, with the shortest downtime in Sweden (15 days) and the longest time in Italy (41 days) [93]. In the first half of 2020 for the automotive industry, the EU suffered a production loss of 3.6 million vehicles, reflecting a loss of EUR 100 billion [94]. A new wave of infections and restrictions introduced in EU countries since November have caused further problems in the automotive industry. Dealers had to close, and overall consumer economic uncertainty has increased. Some incentives to buy cars at that time were higher tax breaks and subsidies for purchases from governments [95]. Overall, about 24% fewer cars were sold in 2020 than in 2019, which corresponds to about 9.9 million units [96].
The impact of COVID-19 on electric vehicles is smaller than the impact on the sector as a whole [97]. The average share of electric car sales in total car sales has grown from 3.4% in 2019 to 7.8% in the first half of the year 2020, with a peak of 11% in April and around 8% in May and June. Also, in terms of world sales, electric cars suffered less than non-electric cars [98]. Anticipated for the first wave of the pandemic, electric vehicles were predicted to further expand their market participation to 10.5% of the total EU car market [99]. Plug-in and clean and mild hybrid cars increased their market share to 26.8% and outperformed diesel car sales in the last months of 2020 [100]. The COVID-19 pandemic has accelerated the growth of the electric vehicle market. There are several reasons for this. Consumer behavior is shifting towards greater private mobility rather than public mobility to reduce the risk of infection. In addition, regulatory authorities are intensifying actions to protect the climate in the mobility sector. As a result, green transition subsidies are offered that encourage investment in this sector [101]. We obtained similar results in our research. There was an acceleration in the dynamics of introducing new electric cars in the EU countries.
Factors limiting the development of electromobility were analyzed by Coffman et al. [102] and Sierzchuli et al. [103]. Coffman et al. [102] group these factors into internal, external and applied policies. In the first class, there is a higher initial investment [104,105,106], extended charging time, and limited range [107]. Second, Coffman et al. [102] take into account the relative fuel prices [103] and the characteristics of potential buyer, but the literature is ambiguous. The availability of charging stations is also significant, which was one of the most important factors in making the decision to buy an electric vehicle. In the latter group, Coffman et al. [102] mentions financial and non-financial incentives, public support for building charging infrastructure and awareness-raising. Of course, in poorer countries there are fewer incentives and there is less purchasing power for consumers than in economically developed countries, which causes natural limitations in the development of electromobility in developing countries.
The success of the electromobility sector in the EU should be associated with a change in social behavior. There are already many examples of how COVID-19 has modified social behavior and transport patterns. An example is the work of Wang and Wells [108], Griftyhs et al. [109], Benita [110], De Vos [111], Abdullah et al. [112], Przybylowski et al. [113], Scarabaggio et al. [114] and Santamaria et al. [115]. Promoting sustainable transport is also important. According to Holden et al. [116] electromobility is one of the elements of such transport (others include collective transport 2.0 and societies with limited mobility). Activities related to the development of the electromobility sector perfectly match the needs related to the reduction of pollution in the environment. Therefore, they will be promoted even more by the governments of EU countries. It can therefore be concluded that the pandemic has become a positive catalyst for change. Policymakers should use incentive funding, social bias, and perceptions induced by COVID-19 to influence long-term changes in the transport system that can positively impact climate action [109,117].

5. Conclusions and Recommendations

5.1. Conclusions

The conducted research allows for a few generalizations.
  • Taking into account the socio-economic potential of the EU countries, the most developed countries in the field of electromobility were the Netherlands and Sweden, and the least developed countries were Greece and Croatia. There were large disparities between countries.
  • The level of concentration of electric cars in several EU countries was very high, but it was systematically declining. The phenomenon is positive because it proves the development of this type of transport in many EU countries. During the COVID-19 pandemic, the trend was reversed (Hypothesis one was partially confirmed).
  • In all EU countries, in the first year of the COVID-19 pandemic, the dynamics of introducing electric cars into use increased. The growth rate in the entire EU in 2020 was 86%, while in 2019 it was 48%. During the crisis, the development of electromobility in the EU accelerated (the second hypothesis was verified negatively).
  • The COVID-19 pandemic resulted in a greater average annual variation in the number of cars in individual EU countries. The reason was the very rapid introduction of electric cars during the pandemic.
  • The development of electromobility in the EU, measured by the number of electric cars, is closely related to the economic situation in this area. As a rule, a higher standard of living was associated with a greater number of electric cars (the third hypothesis was verified positively).
  • The crisis caused by the COVID-19 pandemic affected the economic situation in all EU countries but did not slow down the pace of introducing electromobility. The prospects for the development of this type of transport are very good.

5.2. Recommendations

The relationship between the number of electric cars and the economic situation has not been the subject of research. There is a lack of research on such relationships during the COVID-19 pandemic. This is a new situation, so it needs some explanation. Furthermore, there were no such studies related to the EU. The reason may be the introduction of electric cars for use only from a few or several years in EU countries. It was only in 2014 that electric cars were widely used in all EU countries.
The limitations in conducting such academic studies are the lack of available current and detailed data on electromobility. A possible direction of further research is linking electromobility with environmental pollution and economic development. Research could also concern these dependencies on the example of large urban agglomerations. Electric cars are mainly used in cities. Another direction of academic analysis is the examination of dependencies occurring in regions, differing in their level of economic development.

Author Contributions

Conceptualization, T.R.; methodology, T.R.; software, T.R.; validation, T.R.; formal analysis, T.R.; investigation, T.R.; resources, T.R.; data curation, T.R.; writing—original draft preparation, T.R., P.B., A.B.-B. and A.Ż.; writing—review and editing, T.R., P.B., A.B.-B., A.Ż. and G.K.; visualization, T.R.; supervision, T.R.; project administration, T.R. All authors have read and agreed to the published version of the manuscript.

Funding

This research received no external funding.

Institutional Review Board Statement

Not applicable.

Informed Consent Statement

Not applicable.

Conflicts of Interest

The authors declare no conflict of interest.

References

  1. Dulac, J. Global Transport Outlook 2050; International Energy Agency: Paris, France, 2014. [Google Scholar]
  2. European Commission Climate Action. Road Transport.: Reducing CO2 Emissions from Vehicles. Available online: https://ec.europa.eu/clima/policies/transport/vehicles_en (accessed on 21 October 2021).
  3. Rokicki, T.; Koszela, G.; Ochnio, L.; Wojtczuk, K.; Ratajczak, M.; Szczepaniuk, H.; Michalski, K.; Bórawski, P.; Bełdycka-Bórawska, A. Diversity and Changes in Energy Consumption by Transport in EU Countries. Energies 2021, 14, 5414. [Google Scholar] [CrossRef]
  4. Rokicki, T.; Perkowska, A. Changes in Energy Supplies in the Countries of the Visegrad Group. Sustainability 2020, 12, 7916. [Google Scholar] [CrossRef]
  5. Rokicki, T.; Perkowska, A. Diversity and Changes in the Energy Balance in EU Countries. Energies 2021, 14, 1098. [Google Scholar] [CrossRef]
  6. Quak, H. Presentation FREVUE. In Estimated Total Emissions per Year per Vehicle Type for All Urban Traffic in the Netherlands; TNO: Delft, The Netherlands, 2015. [Google Scholar]
  7. Nemery, B.; Leuven, K.U. Department of Public Health and Primary Care, Centre for Environment and Health. In Proceedings of the Plenary Presentation AEC2018, Brussels, Belgium, 27 July 2018. [Google Scholar]
  8. Krzyzanowski, M.; Kuna-Dibbert, B.; Schneider, J. Health Effects of Transport-Related Air Pollution; World Health Organization: Geneva, Switzerland, 2016. [Google Scholar]
  9. Rokicki, T.; Perkowska, A.; Ratajczak, M. Differentiation in Healthcare Financing in EU Countries. Sustainability 2021, 13, 251. [Google Scholar] [CrossRef]
  10. Air Quality in Europe Report, EEA 2018. Available online: http://www.eea.europa.eu/highliights/air-polution-still-too-high (accessed on 25 October 2021).
  11. Folder|Annual Indicator Report Series (AIRS)—In Support to the Monitoring of the 7th Environment Action Programme 2017. Available online: https://www.eea.europa.eu/airs/2017/environment-and-health/pdfStatic (accessed on 25 October 2021).
  12. De Wouters, J.; Elektrische Auto. Is Het Marktaandeel van 1914 in 2020 Haalbaar? Pepijn, B.V., Ed.; Uitgeverij: Eindhoven, The Netherlands, 2013; ISBN 9789078709220. [Google Scholar]
  13. Yang, C.; Tu, J.-C.; Jiang, Q. The Influential Factors of Consumers’ Sustainable Consumption: A Case on Electric Vehicles in China. Sustainability 2020, 12, 3496. [Google Scholar] [CrossRef] [Green Version]
  14. Righolt, H.; Rieck, F. Energy chain and efficiency in urban traffic for ICE and EV. In Proceedings of the 2013 World Electric Vehicle Symposium and Exhibition, Barcelona, Spain, 17–20 November 2013. [Google Scholar]
  15. Best electric cars for sale 2021. Available online: https://www.carwow.co.uk/electric-cars#gref (accessed on 11 December 2021).
  16. Buekers, J.; Van Holderbeke, M.; Bierkens, J.; Panis, L. Health and environmental benefits related to electric vehicle introduction in eu countries. Transp. Res. Part. D Transp. Environ. 2014, 33, 26–38. [Google Scholar] [CrossRef]
  17. Messagie, M.; Boureima, F.-S.; Coosemans, T.; Macharis, C.; Mierlo, J.V. A Range-Based Vehicle Life Cycle Assessment Incorporating Variability in the Environmental Assessment of Different Vehicle Technologies and Fuels. Energies 2014, 7, 1467–1482. [Google Scholar] [CrossRef]
  18. ElTayeb, T.K. The examination on the drivers for green purchasing adoption among ems 14001 certified companies in malaysia. J. Manuf. Technol. Manag. 2010, 21, 206–225. [Google Scholar] [CrossRef]
  19. Morganti, E.; Browne, M. Technical and operational obstacles to the adoption of electric vans in france and the uk: An operator perspective. Transp. Policy 2018, 63, 90–97. [Google Scholar] [CrossRef] [Green Version]
  20. Rokicki, T.; Bórawski, P.; Gradziuk, B.; Gradziuk, P.; Mrówczyńska-Kamińska, A.; Kozak, J.; Guzal-Dec, D.J.; Wojtczuk, K. Differentiation and Changes of Household Electricity Prices in EU Countries. Energies 2021, 14, 6894. [Google Scholar] [CrossRef]
  21. Seba, T. Clean Disruption of Energy and Transportation; Tony Seba: Stanford, CA, USA, 2014; ISBN 9780692210536. [Google Scholar]
  22. Rokicki, T.; Ratajczak, M.; Bórawski, P.; Bełdycka-Bórawska, A.; Gradziuk, B.; Gradziuk, P.; Siedlecka, A. Energy Self-Subsistence of Agriculture in EU Countries. Energies 2021, 14, 3014. [Google Scholar] [CrossRef]
  23. Berger, R. Automotive Disruption Radar; Roland Berger GmbH: Munich, Germany, 2017. [Google Scholar]
  24. Lane, B.; Potter, S. The adoption of cleaner vehicles in the uk: Exploring the consumer attitude–action gap. J. Clean. Prod. 2007, 15, 1085–1092. [Google Scholar] [CrossRef]
  25. Krupa, J.S.; Rizzo, D.M.; Eppstein, M.J.; Lanute, D.B.; Gaalema, D.E.; Lakkaraju, K.; Warrender, C.E. Analysis of a consumer survey on plug-in hybrid electric vehicles. Transp. Res. Part. A Policy Pract. 2014, 64, 14–31. [Google Scholar] [CrossRef]
  26. Liao, F.; Molin, E.; van Wee, B. Consumer preferences for electric vehicles: A literature review. Transp. Rev. 2016, 37, 252–275. [Google Scholar] [CrossRef] [Green Version]
  27. Ling, Z.; Cherry, C.R.; Wen, Y. Determining the Factors That Influence Electric Vehicle Adoption: A Stated Preference Survey Study in Beijing, China. Sustainability 2021, 13, 11719. [Google Scholar] [CrossRef]
  28. Rokicki, T.; Perkowska, A.; Klepacki, B.; Szczepaniuk, H.; Szczepaniuk, E.K.; Bereziński, S.; Ziółkowska, P. The Importance of Higher Education in the EU Countries in Achieving the Objectives of the Circular Economy in the Energy Sector. Energies 2020, 13, 4407. [Google Scholar] [CrossRef]
  29. Helmers, E.; Marx, P. Electric cars: Technical characteristics and environmental impacts. Environ. Sci. Eur. 2012, 24, 1–15. [Google Scholar] [CrossRef] [Green Version]
  30. Halderman, J.D.; Martin, T. Hybrid. and Alternative Fuel Vehicles; Pearson Prentice Hall: Upper Saddle River, NJ, USA, 2009; pp. 19–21. [Google Scholar]
  31. Kullingsjö, L.H.; Karlsson, S. Estimating the PHEV potential in Sweden using GPS derived movement patterns for representative privately driven cars. In Proceedings of the EVS26, Los Angeles, CA, USA, 6–9 May 2012; Volume 2, pp. 1153–1161. [Google Scholar]
  32. 10 Great Plug-In Hybrids If You’re Not Ready For A Full EV. Available online: https://www.forbes.com/wheels/features/best-plug-in-hybrids-range (accessed on 11 December 2021).
  33. Benajes, J.; Garcia, A.; Monsalve-Serrano, J.; Martinez-Boggio, S. Emissions reduction from passenger cars with RCCI plug-in hybrid electric vehicle technology. Appl. Therm. Eng. 2020, 164, 114430. [Google Scholar] [CrossRef]
  34. Williams, B.; Martin, E.; Lipman, T.; Kammen, D. Plug-in-Hybrid Vehicle Use, Energy Consumption, and Greenhouse Emissions: An Analysis of Household Vehicle Placements in Northern California. Energies 2011, 4, 435–457. [Google Scholar] [CrossRef] [Green Version]
  35. Wróblewski, P.; Drożdż, W.; Lewicki, W.; Dowejko, J. Total Cost of Ownership and Its Potential Consequences for the Development of the Hydrogen Fuel Cell Powered Vehicle Market in Poland. Energies 2021, 14, 2131. [Google Scholar] [CrossRef]
  36. World Health Organization. WHO Coronavirus Disease (COVID-19) Dashboard. Available online: https://www.who.int/health-topics/coronavirus#tab=tab_1 (accessed on 30 October 2021).
  37. Chen, N.; Zhou, M.; Dong, X.; Qu, J.; Gong, F.; Han, Y.; Yu, T. Epidemiological and clinical characteristics of 99 cases of 2019 novel coronavirus pneumonia in Wuhan, China: A descriptive study. Lancet 2020, 395, 507–513. [Google Scholar] [CrossRef] [Green Version]
  38. Huang, C.; Wang, Y.; Li, X.; Ren, L.; Zhao, J.; Hu, Y.; Cheng, Z. Clinical features of patients infected with 2019 novel coronavirus in Wuhan, China. Lancet 2020, 395, 497–506. [Google Scholar] [CrossRef] [Green Version]
  39. Lu, H.; Stratton, C.W.; Tang, Y.W. Outbreak of pneumonia of unknown etiology in Wuhan, China: The mystery and the miracle. J. Med. Virol. 2020, 92, 401. [Google Scholar] [CrossRef] [Green Version]
  40. Lu, H.; Stratton, C.W.; Tang, Y.W. The Wuhan SARS-CoV-2—What’s next for China. J. Med. Virol. 2020, 92, 546–547. [Google Scholar] [CrossRef] [PubMed] [Green Version]
  41. World Health Organization. WHO Director-General’s Opening Remarks at the Media Briefing on COVID-19-11 March 2020. Available online: https://www.who.int/dg/speeches/detail/who-director-general-s-opening-remarks-at-the-media-briefing-on-COVID-19-11-march-2020 (accessed on 30 October 2021).
  42. World Health Organization. WHO Coronavirus Disease (COVID-19) Dashboard. 2020. Available online: https://COVID19.who.int (accessed on 5 November 2021).
  43. Jayadev, C.; Shetty, R. Commentary: What happens after the lockdown? Indian J. Ophthalmol. 2020, 68, 730–731. [Google Scholar] [CrossRef] [PubMed]
  44. Shetty, R.; Ghosh, A.; Honavar, S.G.; Khamar, P.; Sethu, S. Therapeutic opportunities to manage COVID-19/SARS-CoV-2 infection: Present and future. Indian J. Ophthalmol. 2020, 68, 693. [Google Scholar] [PubMed]
  45. Jarynowski, A.; Wójta-Kempa, M.; Płatek, D.; Czopek, K. Attempt to understand public health relevant social dimensions of COVID-19 outbreak in Poland. Soc. Regist. 2020, 4, 7–44. [Google Scholar] [CrossRef] [Green Version]
  46. The Global Electric Vehicle Market Overview in 2022: Statistics & Forecasts. Available online: https://www.virta.global/global-electric-vehicle-market (accessed on 5 November 2021).
  47. Electric Vehicle Market by Type (Battery Electric Vehicles (BEV), Hybrid Electric Vehicles (HEV), and Plug-in Hybrid Electric Vehicles (PHEV)), Vehicle Class (Mid-Priced and Luxury), and Vehicle Type (Two-wheelers, Passenger Cars, and Commercial Vehicles): Global Opportunity Analysis and Industry Forecast, 2020–2027. Available online: https://www.alliedmarketresearch.com/electric-vehicle-market (accessed on 5 November 2021).
  48. Dixon, P.M.; Weiner, J.; Mitchell-Olds, T.; Woodley, R. Erratum to ‘Bootstrapping the Gini Coefficient of Inequality. Ecology 1988, 69, 1307. [Google Scholar] [CrossRef]
  49. Dagum, C. The Generation and Distribution of Income, the Lorenz Curve and the Gini Ratio. Econ. Appliquée 1980, 33, 327–367. [Google Scholar]
  50. Starzyńska, W. Statystyka Praktyczna; Wydawnictwo Naukowe PWN: Warszawa, Poland, 2002. [Google Scholar]
  51. Abdi, H. Coefficient of Variation. Encycl. Res. Des. 2010, 1, 169–171. [Google Scholar]
  52. Kendall, M.G. Rank Correlation Methods; Griffin: London, UK, 1955; Volume 19. [Google Scholar]
  53. Spearman, C. The proof and measurement of association between two things. Am. J. Psychol. 1904, 15, 72–101. [Google Scholar] [CrossRef]
  54. Cottrell, A.; Lucchetti, R. GNU Regression, Econometrics and Time-Series Library (GRETL); Department of Economics, Wake Forest University: Winston-Salem, NC, USA, 2006. [Google Scholar]
  55. Biresselioglu, M.E.; Kaplan, M.D.; Yilmaz, B.K. Electric mobility in Europe: A comprehensive review of motivators and barriers in decision making processes. Transp. Res. Part A: Policy Pract. 2018, 109, 1–13. [Google Scholar] [CrossRef]
  56. Biresselioglu, M.E.; Nilsen, M.; Demir, M.H.; Røyrvik, J.; Koksvik, G. Examining the barriers and motivators affecting European decision-makers in the development of smart and green energy technologies. J. Clean. Prod. 2018, 198, 417–429. [Google Scholar] [CrossRef]
  57. Haddadian, G.; Khodayar, M.; Shahidehpour, M. Accelerating the global adoption of electric vehicles: Barriers and drivers. Electr. J. 2015, 28, 53–68. [Google Scholar] [CrossRef]
  58. Gaß, V.; Schmidt, J.; Schmid, E. Analysis of alternative policy instruments to promote electric vehicles in Austria. Renew. Energy 2014, 61, 96–101. [Google Scholar] [CrossRef]
  59. Thiel, C.; Perujo, A.; Mercier, A. Cost and CO2 aspects of future vehicle options in Europe under new energy policy scenarios. Energy Policy 2010, 38, 7142–7151. [Google Scholar] [CrossRef]
  60. Ogden, J.M.; Williams, R.H.; Larson, E.D. Societal lifecycle costs of cars with alternative fuels/engines. Energy Policy 2004, 32, 7–27. [Google Scholar] [CrossRef]
  61. Mock, P.; Yang, Z. Driving Electrification: A Global Comparison of Fiscal Incentive Policy for Electric Vehicles; The Internationa Council on Clean Transportation (ICCT): Washington, DC, USA, 2014. [Google Scholar]
  62. Li, S.; Tong, L.; Xing, J.; Zhou, Y. The market for electric vehicles: Indirect network effects and policy design. J. Assoc. Environ. Resour. Econ. 2017, 4, 89–133. [Google Scholar] [CrossRef]
  63. National Research Council. Overcoming Barriers to Electric-Vehicle Deployment: Interim Report; Committee on Overcoming Barriers to Electric-Vehicle Deployment; National Academies Press: Washington, DC, USA, 2013.
  64. Zubaryeva, A.; Thiel, C.; Zaccarelli, N.; Barbone, E.; Mercier, A. Spatial multi-criteria assessment of potential lead markets for electrified vehicles in Europe. Transp. Res. Part A Policy Pract. 2012, 46, 1477–1489. [Google Scholar] [CrossRef]
  65. Harrison, G.; Thiel, C. An exploratory policy analysis of electric vehicle sales competition and sensitivity to infrastructure in Europe. Technol. Forecast. Soc. Change 2017, 114, 165–178. [Google Scholar] [CrossRef]
  66. Hall, D.; Lutsey, N. Emerging Best Practices for Electric Vehicle Charging Infrastructure; The International Council on Clean Transportation (ICCT): Washington, DC, USA, 2017. [Google Scholar]
  67. de Rubens, G.Z.; Noel, L.; Sovacool, B.K. Dismissive and deceptive car dealerships create barriers to electric vehicle adoption at the point of sale. Nat. Energy 2018, 3, 501–507. [Google Scholar] [CrossRef]
  68. de Rubens, G.Z.; Noel, L.; Kester, J.; Sovacool, B.K. The market case for electric mobility: Investigating electric vehicle business models for mass adoption. Energy 2020, 194, 116841. [Google Scholar] [CrossRef]
  69. Huang, Y.; Qian, L. Consumer adoption of electric vehicles in alternative business models. Energy Policy 2021, 155, 112338. [Google Scholar] [CrossRef]
  70. Wagner, N.M.; Du, Y.L. Business Model Design-A Matter of Perspective? A Qualitative Study on the Significance of Business Model Components in the Context of Electric Vehicles in the German Automotive Market. Master’s Thesis, School of Economics and Management, Lund University, Lund, Sweden, 2021. [Google Scholar]
  71. O’Neill, E.; Moore, D.; Kelleher, L.; Brereton, F. Barriers to electric vehicle uptake in Ireland: Perspectives of car-dealers and policy-makers. Case Stud. Transp. Policy 2019, 7, 118–127. [Google Scholar] [CrossRef]
  72. Tromaras, A.; Aggelakakis, A.; Margaritis, D. Car dealerships and their role in electric vehicles’ market penetration-A Greek market case study. Transp. Res. Procedia 2017, 24, 259–266. [Google Scholar] [CrossRef]
  73. 2021 Progress Report—Making the Transition to Zero-Emission Mobility. Available online: https://www.acea.auto/publication/2021-progress-report-making-the-transition-to-zero-emission-mobility/ (accessed on 5 November 2021).
  74. Tucki, K.; Orynycz, O.; Świć, A.; Mitoraj-Wojtanek, M. The Development of Electromobility in Poland and EU States as a Tool for Management of CO2 Emissions. Energies 2019, 12, 2942. [Google Scholar] [CrossRef] [Green Version]
  75. Tucki, K.; Orynycz, O.; Mitoraj-Wojtanek, M. Perspectives for Mitigation of CO2 Emission due to Development of Electromobility in Several Countries. Energies 2020, 13, 4127. [Google Scholar] [CrossRef]
  76. Drożdż, W. The development of electromobility in Poland. Virtual Econ. 2019, 2, 61–69. [Google Scholar] [CrossRef]
  77. Sendek-Matysiak, E.; Łosiewicz, Z. Analysis of the Development of the Electromobility Market in Poland in the Context of the Implemented Subsidies. Energies 2021, 14, 222. [Google Scholar] [CrossRef]
  78. Feckova Skrabulakova, E.; Ivanova, M.; Rosova, A.; Gresova, E.; Sofranko, M.; Ferencz, V. On Electromobility Development and the Calculation of the Infrastructural Country Electromobility Coefficient. Processes 2021, 9, 222. [Google Scholar] [CrossRef]
  79. Schuh, G.; Schwartz, M.; Kolz, D.; Jussen, P.; Meyring, T.L. Scenarios for the Development of Electromobility. In Proceedings of the 7th International Conference on Informatics, Environment, Energy and Applications, Beijing, China, 28 March 2018; pp. 174–178. [Google Scholar] [CrossRef]
  80. Silvestri, B.; Rinaldi, A.; Roccotelli, M.; Fanti, M.P. Innovative Baseline Estimation Methodology for Key Performance Indicators in the Electro-Mobility Sector. In Proceedings of the 2019 IEEE 6th International Conference on Control, Decision and Information Technologies (CoDIT), Paris, France, 23–26 April 2019; IEEE: Paris, France, 2019; pp. 1367–1372. [Google Scholar] [CrossRef]
  81. Daňo, F.; Rehák, R. Electromobility in the European Union and in the Slovakia and its development opportunities. Int. J. Multidiscip. Bus. Sci. 2018, 4, 74–83. [Google Scholar]
  82. Połom, M.; Wiśniewski, P. Implementing Electromobility in Public Transport in Poland in 1990–2020. A Review of Experiences and Evaluation of the Current Development Directions. Sustainability 2021, 13, 4009. [Google Scholar] [CrossRef]
  83. Drożdż, W.; Starzyński, P. Economic conditions of the development of electromobility in Poland at the background of selected countries. Eur. J. Serv. Manag. 2018, 28, 133–140. [Google Scholar] [CrossRef]
  84. Castelli, M.; Beretta, J. Development of electromobility in France: Causes, facts and figures. World Electr. Veh. J. 2016, 8, 772–782. [Google Scholar] [CrossRef] [Green Version]
  85. Mönnig, A.; Schneemann, C.; Weber, E.; Zika, G.; Helmrich, R. Electromobility 2035: Economic and labour market effects through the electrification of powertrains in passenger cars (No. 8/2019). IAB-Discuss Pap. 2019, 1–44. [Google Scholar]
  86. Kolpakov, A.Y.; Galinger, A.A. Economic Efficiency of the Spread of Electric Vehicles and Renewable Energy Sources in Russia. Her. Russ. Acad. Sci. 2020, 90, 25–35. [Google Scholar] [CrossRef]
  87. Ivanov, D.; Dolgui, A. Viability of intertwined supply networks: Extending the supply chain resilience angles towards survivability. A position paper motivated by COVID-19 outbreak. Int. J. Prod. Res. 2020, 58, 2904–2915. [Google Scholar] [CrossRef] [Green Version]
  88. Baldwin, R.; Tomiura, E. Thinking Ahead about the Trade Impact of COVID-19. Economics in the Time of COVID-19; Centre for Economic Policy Research: London, 2020; p. 59. [Google Scholar]
  89. Mazur, C.; Contestabile, M.; Offer, G.J.; Brandon, N.P. Understanding the drivers of fleet emission reduction activities of the German car manufacturers. Environ. Innov. Soc. Transit. 2015, 16, 3–21. [Google Scholar] [CrossRef] [Green Version]
  90. Ceryno, P.S.; Scavarda, L.F.; Klingebiel, K. Supply chain risk: Empirical research in the automotive industry. J. Risk Res. 2015, 18, 1145–1164. [Google Scholar] [CrossRef]
  91. Guan, D.; Wang, D.; Hallegatte, S.; Davis, S.J.; Huo, J.; Li, S.; Gong, P. Global supply-chain effects of COVID-19 control measures. Nat. Hum. Behav. 2020, 4, 577–587. [Google Scholar] [CrossRef]
  92. Accenture. COVID-19: Impact on the Automotive Industry. 2020. Available online: https://www.accenture.com/_acnmedia/PDF-121/AccentureCOVID-19-Impact-Automotive-Industry.pdf (accessed on 5 November 2021).
  93. ACEA. Passenger Car Registrations. 2020. Available online: https://www.acea.be/press-releases/article/passenger-car-registrations-28.8-ninemonths-into-2020-3.1-in-september (accessed on 5 November 2021).
  94. ACEA. Truck makers gear up to go fossil-free by 2040, but EU and Member States need to step up their game. 2021. Available online: https://www.acea.be/news/article/interactive-map-COVID-19-impact-on-eu-automobile-production-up-until-septem (accessed on 5 November 2021).
  95. McKinsey. The second COVID-19 lockdown in Europe: Implications for automotive retail. 2020. Available online: https://www.mckinsey.com/industries/automotive-and-assembly/our-insights/the-second-covid-19-lockdown-in-europe-implicationsfor-automotive-retail (accessed on 5 November 2021).
  96. ACEA. Passenger car registrations: −23.7% in 2020, −3.3% in December. 2021. Available online: https://www.acea.be/pressreleases/article/passenger-car-registrations-23.7-in-2020-3.3-in-december (accessed on 5 November 2021).
  97. PwC Strategy. The Impact of COVID-19 on the European Automotive Market. 2020. Available online: https://www.strategyand.pwc.com/it/en/assets/pdf/S&-impact-of-COVID-19-on-EU-automotive-market.pdf (accessed on 5 November 2021).
  98. Mock, P.; Yang, Z.; Tietge, U. The Impact of COVID-19 on New Car Markets in China, Europe, and the United States; The International Council on Clean Transportation (ICCT): 2020. Available online: https://theicct.org/blog/staff/impact-COVID-19-new-car-markets-china-europe-andunited-states-v-u-w-or-l (accessed on 5 November 2021).
  99. Just Auto. Global Pandemic Sector Recovery Briefing. 2021. Available online: https://www.just-auto.com/news/free-to-read-global-pandemicsector-recovery-briefing_id197509.aspx (accessed on 5 November 2021).
  100. Just Auto. Electrified Vehicle Buck Gloomy COVID Trend in Europe. 2021. Available online: https://www.just-auto.com/news/electrified-vehiclesbuck-gloomy-COVID-trend-in-europe_id198976.aspx (accessed on 5 November 2021).
  101. McKinsey. From no Mobility to Future Mobility: Where COVID-19 Has Accelerated Change. 2020. Available online: https://www.mckinsey.com/industries/automotive-and-assembly/our-insights/from-no-mobility-to-future-mobility-where-COVID-19-has-accelerated-change (accessed on 5 November 2021).
  102. Coffman, M.; Bernstein, P.; Wee, S. Electric vehicles revisited: A review of factors that affect adoption. Transp. Rev. 2017, 37, 79–93. [Google Scholar] [CrossRef]
  103. Sierzchula, W.; Bakker, S.; Maat, K.; van Wee, B. The influence of financial incentives and other socio-economic factors on electric vehicle adoption. Energy Policy 2014, 68, 183–194. [Google Scholar] [CrossRef]
  104. Graham-Rowe, E.; Gardner, B.; Abraham, C.; Skippon, S.; Dittmar, H.; Hutchins, R.; Stannard, J. Mainstream consumers driving plug-in battery-electric and plug-in hybrid electric cars: A qualitative analysis of responses and evaluations. Transp. Res. Part A Policy Pract. 2012, 46, 140–153. [Google Scholar] [CrossRef]
  105. Ramsey, M. Ford Reveals How Much Electric-Car Batteries Cost. Wall Str. Journal. 2012. Available online: http://blogs.wsj.com/drivers-seat/2012/04/17/ford-reveals-how-much-electric-car-batteries-cost (accessed on 10 November 2021).
  106. Transportation Electrification Panel (TEP). Plug-in Electric Vehicles: A Practical Plan for Progress; Transportation Electrification Panel, School of Public and Environmental Affairs at Indiana University: Bloomington, IN, USA, 2011; Available online: http://www.indiana.edu/~cree/pdf/TEP%20Report.pdf (accessed on 10 November 2021).
  107. Hidrue, M.K.; Parsons, G.R.; Kempton, W.; Gardner, M.P. Willingness to pay for electric vehicles and their attributes. Resour. Energy Econ. 2011, 33, 686–705. [Google Scholar] [CrossRef] [Green Version]
  108. Wang, L.; Wells, P. Automobilities after SARS-CoV-2: A Socio-Technical Perspective. Sustainability 2020, 12, 5978. [Google Scholar] [CrossRef]
  109. Griffiths, S.; Del Rio, D.F.; Sovacool, B. Policy mixes to achieve sustainable mobility after the COVID-19 crisis. Renew. Sustain. Energy Rev. 2021, 143, 110919. [Google Scholar] [CrossRef]
  110. Benita, F. Human mobility behavior in COVID-19: A systematic literature review and bibliometric analysis. Sustain. Cities Soc. 2021, 70, 102916. [Google Scholar] [CrossRef]
  111. De Vos, J. The effect of COVID-19 and subsequent social distancing on travel behavior. Transp. Res. Interdiscip. Perspect. 2020, 5, 100121. [Google Scholar] [CrossRef]
  112. Abdullah, M.; Dias, C.; Muley, D.; Shahin, M. Exploring the impacts of COVID-19 on travel behavior and mode preferences. Transp. Res. Interdiscip. Perspect. 2020, 8, 100255. [Google Scholar] [CrossRef]
  113. Przybylowski, A.; Stelmak, S.; Suchanek, M. Mobility behaviour in view of the impact of the COVID-19 pandemic—Public transport users in Gdansk case study. Sustainability 2021, 13, 364. [Google Scholar] [CrossRef]
  114. Scarabaggio, P.; La Scala, M.; Carli, R.; Dotoli, M. Analyzing the Effects of COVID-19 Pandemic on the Energy Demand: The Case of Northern Italy. In Proceedings of the 2020 IEEE AEIT International Annual Conference (AEIT), Catania, Italy, 23–25 September 2020; IEEE: Piscataway, NJ, USA, 2020; pp. 1–6. [Google Scholar]
  115. Santamaria, C.; Sermi, F.; Spyratos, S.; Iacus, S.M.; Annunziato, A.; Tarchi, D.; Vespe, M. Measuring the impact of COVID-19 confinement measures on human mobility using mobile positioning data. A European regional analysis. Saf. Sci. 2020, 132, 104925. [Google Scholar] [CrossRef]
  116. Holden, E.; Banister, D.; Gössling, S.; Gilpin, G.; Linnerud, K. Grand Narratives for sustainable mobility: A conceptual review. Energy Res. Soc. Sci. 2020, 65, 101454. [Google Scholar] [CrossRef]
  117. Geels, F.W. A socio-technical analysis of low-carbon transitions: Introducing the multi-level perspective into transport studies. J. Transp. Geogr. 2012, 24, 471–482. [Google Scholar] [CrossRef]
Figure 1. Scheme of the conducted research.
Energies 15 00009 g001
Figure 2. Number of electric cars in EU countries in 2019 and 2020.
Energies 15 00009 g002
Figure 3. Number of electric cars per public charging point in EU countries in 2019 and 2020.
Energies 15 00009 g003
Figure 4. Lorenz concentration curves for number of electric cars in the EU countries in 2011–2020.
Energies 15 00009 g004
Table 1. Indicators assessing the development of electromobility in EU countries in 2019-2020.
Countries Electric Cars per Thousand InhabitantsElectric Cars Per Square KilometerElectric Cars Share in Total CarsElectric Cars per Kilometer of Motorway
20192020201920202019202020192020
Austria4.246.310.450.670.741.1021.5532.24
Belgium5.309.431.983.541.031.8134.4361.65
Bulgaria0.250.340.020.020.060.082.182.84
Croatia0.170.470.010.030.040.110.541.45
Cyprus0.510.640.050.060.080.101.752.22
Czechia0.490.920.070.120.090.164.097.61
Denmark4.269.830.581.330.932.1118.4042.58
Estonia1.221.520.040.040.200.2510.0212.58
Finland5.3210.010.090.160.831.5531.7159.74
France3.336.080.410.750.691.2519.1435.04
Germany2.967.160.691.660.511.2318.6145.09
Greece0.090.290.010.020.020.060.431.36
Hungary0.601.100.060.120.150.283.386.01
Ireland2.084.220.150.300.450.9210.2720.53
Italy0.661.670.130.330.100.255.6514.12
Latvia0.350.550.010.020.090.14--
Lithuania0.911.250.040.050.170.236.288.69
Luxembourg8.3513.651.973.291.201.9531.0651.81
Malta2.685.004.198.140.430.82--
Netherlands11.3915.685.277.302.273.1070.5697.18
Poland0.140.330.020.040.020.053.157.31
Portugal4.376.270.500.720.821.1814.6521.07
Romania0.180.380.010.030.050.114.068.13
Slovakia0.330.640.040.070.070.153.607.07
Slovenia1.282.130.130.220.230.384.267.15
Spain0.991.870.090.180.190.362.985.64
Sweden9.4818.460.220.431.983.8345.4589.40
United Kingdom4.096.671.121.830.861.3970.89116.20
Table 2. Gini coefficients for number of electric cars in the EU countries in 2011–2020.
Type of CoefficientGini Coefficients in Years
2011201520192020
from the sample0.830.790.720.73
estimated0.860.820.750.76
Table 3. Dynamics indicators for the number of electric cars in EU countries in 2011–2020.
CountriesDynamics of Changes in the Years
(Previous Year = 100)(Base Year = 100)
20112012201320142015201620172018201920202011–20202014–2020
Greece-1003002067200135213164171315313,5005056
Croatia---10036815711114117826743324332
Italy10065624717216915615417517125285,0593051
Germany10018217917216615414915316324312,7912298
Poland10018915625019015822118017223635,6434854
Denmark10020815221026011711314516023112,2891841
Romania100200480165197199218201258211148,2009380
Ireland10030212824119415914619619420532,7143513
Slovakia10010210046714612115326112619783481744
Sweden10034321126820518116415314719752,0982688
Malta-10012918613311413817340319467662825
Spain10019919515617016417417216219015,5882571
Finland10042319320317620121821618918898,7805974
Czechia10018815019716413713713613418858201053
EU-2810022234513219315014414614818616,8891673
Hungary1001189119146164203272223156185119,4785812
France10018918916817814114913713818377331293
Belgium10034313421721822417914713817932,0623201
Slovenia-10032527424719420516715116837,1424165
Luxembourg10041924822612513317814816016727,5741171
United Kingdom1002569765324018215415113816430,1252282
Latvia-10021093811911412915412815310,420529
Austria10015516216815717416314314215056821350
Portugal10013713312724524528222716914421,5319321
Netherlands-100136515320012410811714213912,995624
Lithuania--100128323620522818915713858,4004551
Bulgaria-10012516113515516218617913731011541
Cyprus-10060023331419123115515012757,1004079
Estonia10010801191541041031041121171263616184
Table 4. Coefficients of variation for the number of electric cars in EU countries in 2011–2020.
CountriesCoefficients of Variation for Number of Electric Cars in Years
2011–20192011–20202014–20192014–2020
Estonia0.440.470.140.22
Netherlands0.780.830.400.51
Latvia0.880.950.460.60
Czechia0.851.040.530.75
Austria0.991.050.670.75
France0.911.080.580.78
United Kingdom1.011.100.700.81
Cyprus1.251.180.850.83
Luxembourg1.041.160.690.84
EU0.981.150.650.85
Bulgaria1.181.190.850.88
Belgium1.131.220.750.89
Denmark0.921.240.570.93
Lithuania1.351.290.940.93
Sweden1.111.270.730.93
Slovenia1.241.290.850.94
Slovakia1.151.290.790.96
Spain1.151.310.810.99
Portugal1.461.381.071.04
Germany1.041.380.711.06
Hungary1.381.441.011.09
Croatia1.091.470.681.10
Ireland1.271.460.911.11
Finland1.441.501.051.14
Italy1.151.490.801.15
Poland1.291.530.921.17
Malta1.541.621.191.28
Romania1.581.671.181.29
Greece1.261.690.851.30
Table 5. Kendall’s tau correlation coefficients between the number of electric cars and social and economic parameters in EU.
Tested ParametersKendall’s Tau Correlation Coefficient in Years
2014–20192014–20202011–20192011–2020
τp-Valueτp-Valueτp-Valueτp-Value
Correlation coefficients between the number of electric cars and
Population (million)1.0000.009 **0.9050.007 **1.0000.001 ***0.9560.001 ***
Area of the country (square kilometer)−0.7300.037 *−0.7560.022 *−0.6240.028 *−0.6830.012 *
Number of cars1.0000.009 **1.0000.003 **1.0000.001 ***1.0000.001 ***
The length of the highways (kilometer)1.0000.009 **1.0000.003 **1.0000.001 ***1.0000.001 ***
Value of GDP (million euro)1.0000.009**0.8100.016 *1.0000.001 ***0.9110.001 ***
GDP per capita (euro per capita)1.0000.009 **0.9050.007 **1.0000.001 ***0.9560.001 ***
* p-value ≤ 0.05, ** p-value ≤ 0.01, *** p-value ≤ 0.001.
Table 6. Spearman’s rank correlation coefficients between the number of electric cars and social and economic parameters in EU.
Tested ParametersSpearman’s Rank Correlation Coefficient
2014–20192014–20202011–20192011–2020
τp-Valueτp-Valueτp-Valueτp-Value
Correlation coefficients between the number of electric cars and
Population (million)1.0000.010 **0.9640.010 **1.0000.010 **0.9880.010 **
Area of the country (square kilometer)−0.8280.050 *−0.8660.050 *−0.7250.050 *−0.7980.010 **
Number of cars1.0000.010 **1.0000.010 **1.0000.010 **1.0000.010 **
The length of the highways (kilometer)1.0000.010 **1.0000.010 **1.0000.010 **1.0000.010 **
Value of GDP (million euro)1.0000.050 *0.8930.050 *1.0000.010 **0.9640.010 **
GDP per capita (euro per capita)1.0000.010 **0.9640.010 **1.0000.010 **0.9880.010 **
* p-value ≤ 0.05, ** p-value ≤ 0.01, *** p-value ≤ 0.001.
Publisher’s Note: MDPI stays neutral with regard to jurisdictional claims in published maps and institutional affiliations.

