Abstract
The literature is replete with concerns on the environmental impact of steam-assisted gravity drainage (SAGD), but rigorous analysis of its improved environmental performance over the past 20 years remains unresolved, as well as the underlying technological reasons for this improvement. Here, we present an analysis of historical and future greenhouse gas (GHG) performance of SAGD operations in Alberta, Canada, considering for the first-time factors that affected technology deployment. Depending on the case, the results show a reduction of 1.4–24% of SAGD GHG intensity over the past 12 years. Improvements mainly arise from incremental changes adopted based on technical, environmental, socio-economic, and policy drivers. Considering these factors, we propose policy interventions to accelerate further reductions of GHG emissions. However, if similar behaviour from industry continues, anticipated GHG intensity reduction will range between 6.5–40% by 2030, leading to an intensity between 58 and 68 kgCO2e/bbl. It still remains unclear if in situ oil sands bitumen extraction will reach current conventional oil emission intensities. Thus, we suggest that the SAGD industry drastically accelerate its deployment of cleaner oil sands extraction technologies considering the policy insights proposed.
1. Introduction
With the global increase in energy demand and decline of conventional oil production, the focus has shifted toward transportation fuels from unconventional fossil resources, such as bitumen deposits [1]. One of the largest known petroleum resources globally are the oil sands deposits in Alberta, Canada, with ~1.7 trillion barrels (bbls) in place and ~161.3 billion bbls in oil reserves [2]. This significant amount of global oil sands reserves estimated, as over 6 trillion bbls constitute the oil sands in Alberta, the third largest proven reserves in the world after Saudi Arabia and Venezuela [3,4]. Canadian bitumen production has been increasing since 2006, reaching 2.67 million bbls/day in 2017 [5], making Canada the sixth largest producer of oil globally [2,4]. Concurrently, due to larger production, greenhouse gas (GHG) emissions have also grown [6]. Due to the nature of oil sands resources and the oil’s high viscosity, in situ production processes largely depend on steam injection—these processes are energy intensive with large consequent environmental impacts. According to Canada’s National Inventory Report (NIR), annual absolute oil sands direct emissions in Canada grew from 15 Mt (megatonnes) of CO2 equivalent (CO2e) in 1999 to 84 Mt CO2e in 2018. On a per barrel basis, the emissions intensity dropped from 119 kgCO2e/bbl in 1990 to 78 kgCO2e/bbl in 2018 [6]. Oil sands emissions account for ~11% of total GHG emissions reported in Canada in 2018 (729 Mt CO2e) [6]. The production of crude bitumen has been forecast to rise over the next decade [2] and thus, the increase of absolute GHG emissions due to production growth is concerning.
The two main techniques in bitumen extraction are surface mining and in situ extraction. Surface mining is used for <70 m deep resource and accounts for ~20% of current oil sands reserves [4]. In situ thermal techniques are used for deeper oil sands resources [2], with two commercial methods used: steam-assisted gravity drainage (SAGD), and cyclic steam simulation (CSS). In these technologies, high temperature steam injected into the reservoir heats the bitumen, lowering its viscosity, rendering it mobile enough to be produced to surface [7]. In 2017, CSS contributed 10% of total bitumen supply, whereas SAGD contributed 45%, with a forecast to increase to 56% by 2030 [4]. Compared to conventional crude oil recovery, SAGD operations have three times higher GHG emissions intensity [8,9]. Given steam and water processing costs and its environmental impact, SAGD must be improved with respect to economics and emissions [10,11].
Many life cycle assessment studies have been done on GHG emissions of oil sands in situ extraction and conversion to transportation fuels (e.g., Nimana et al. [12,13]; Bergerson et al. [14]; McCann and Magee [15]; Jacobs [16]). Public tools have been developed to assess oil sands pathways, e.g., El-Houjeiri et al. [17], GREET [18], NRC [19]. Charpentier et al. [20] and Orellana et al. [21] developed the GHG emissions of current oil sands technologies (GHOST) life cycle-based model to analyze direct and indirect emissions of diluted bitumen and synthetic crude oil from CSS and SAGD for cogeneration and no cogeneration. Orellana et al. [21] focused on projects producing >10,000 bbls/day. By using Monte Carlo simulations, they showed that the median cumulative weighted emissions intensity of SAGD and CSS projects (1999–2013) in Alberta has been relatively unchanged during this period. Their results were based on each project’s emissions intensity per year, not total industry data. The GHOST model was further enhanced by Sleep et al. [22] by including mining and upgrading. Gates and Larter [11] examined the energy efficiency and emissions intensity of SAGD: their results suggested the theoretical steam-to-oil ratio that could be attained is ~0.7 m3 steam (expressed as cold-water equivalent) per m3 bitumen produced, and that a few operations were moving towards this limit [11]. Pinto et al. [23] examined the ratio of energy produced to energy injected in SAGD. They found that early-stage operations have long term impacts on the efficiency of well’s recovery ratio and thus its GHG emissions. A study by IHS Markit [4] analyzed historical emission intensity of oil sands production from 2009–2017 for mining and in-situ operations. For SAGD, their analysis revealed an improvement of 24% of SAGD emission intensity from 2009–2017 considering only direct emissions—this directly contrasts with results of Charpentier et al. [20] and Orellana et al. [21]. In addition, IHS Markit [4] projected a reduction of 17–27% of GHG emissions intensity by 2030, considering the adoption of commercial and near commercial technologies related to well productivity, steam generation efficiency, and cogeneration. Although the IHS Markit [4] study results appear favourable, given the difference of other analyses (e.g., Charpentier et al. [20]; Orellana et al. [21]), the evolution and future of SAGD GHG intensity is still unclear.
Many analyses of SAGD GHG intensity focus on technologies to achieve lower GHG emissions, including the addition of solvents, electric submersible pumps, new well completion designs, new methods to characterize the resource, and energy use reduction strategies and carbon capture technologies etc. (e.g., Cheng et al. [24]; Charpentier et al. [20]; Nimana et al. [12]; Austin-Adigio and Gates [25]; Katta et al. [26]; Ashrafi et al. [27]). These changes have either been adopted or are being evaluated by industry. However, slow adoption has been an issue in the oil sands industry with respect to new technology [28]. At this point, it remains unclear what factors hinder technologies from being deployed at the pace that is required to make the oil sands industry sustainable. This is likely due to factors considered in decision-making within companies, including risks of technology working at scale (often technology is developed in labs at small scale, but the need for it to operate at massive scale leads to other unknown risks), costs of testing and implementation (a field experiment often costs tens of millions of dollars), regulatory requirements (it could take years to get approval from the regulatory authority to construct and operate the pilot to test the technology incurring both cost and competitiveness issues), and policy (what are the true benefits that motivate testing and adoption of the technology if policy does not reinforce it?). Proposing technical solutions are only one part of the picture to achieve cleaner more efficient SAGD operations. Investigating the different factors that affect technology adoption is needed to help accelerate improvements of the GHG performance in SAGD industry moving it towards sustainability.
The analysis of GHG emission intensity of SAGD operations in Canada is not new. However, here, we focus on the following two gaps: (1) the murkiness of the evolution of environmental GHG performance of SAGD industry given the different environmental performance results in previous studies; and (2) the exclusion of factors that affect the adoption of cleaner technological changes in decision-making of SAGD industry, focusing on technical improvements to reduce SAGD’s GHG emissions. Three different emission intensity cases integrating factors that affect technology deployment are examined. A table summary (Table S1 in Supplementary Material) comparing some examples of previous studies’ purpose, focus, and gaps with the current study’s purpose and focus presented in the Supplementary Material. The novelty of the analysis presented here is on the historical evolution and future of SAGD GHG intensity in Canada, considering for the first time three different cases of calculation of emissions intensity: (1) excluding electricity exported from cogeneration to the grid; (2) including electricity exported from cogeneration with no credit assigned; (3) and including electricity exported obtained from cogeneration with credit assigned, and examining factors affecting accelerated technology deployment.
2. Materials and Methods
2.1. Data Collection
The historical GHG emissions intensity analysis and data collection for SAGD industry is conducted in this study for the period of 1999 to 2018. The analysis is focused only on bitumen extraction using SAGD. Subsequent processing of produced bitumen, e.g., dilution and upgrading, is not included in this study. Publicly available data was used whenever possible in conducting the analysis. Bitumen production and steam injection data for all SAGD operations per month were collected from Alberta Energy Regulator’s (AER) Statistical reports “ST53: Alberta In Situ Oil Sands Production Summary” from 1999 to 2018. Under the province of Alberta’s Responsible Energy Development Act, all in situ oil sands project operators are required to report their monthly production and steam injection data [29]. The data collected from each individual operator’s ST53 reports for bitumen production and steam injection were summed to determine the total bitumen production and steam injection per year. Table S2 (Supplementary Material) lists the SAGD projects considered in this study. Operating parameters, such as boiler efficiency and cogeneration heat recovery rate, summarized in Table S3 (Supplementary Material), were collected from previous studies.
The cogeneration capacity for SAGD operations which have cogeneration facilities was obtained from public data sources (industry annual reports and websites). In addition, data for heat derived from cogeneration was obtained from Alberta’s Specified Gas Emitters Regulation (SGER) database, which lists the total heat available from SAGD facilities with cogeneration regulated under SGER from 2009–2017. From this data, the average heat from cogeneration was calculated for each year per MWh, assuming a 90% load factor [4]. To fill the gap in average heat data availability for remaining years in the analysis, some assumptions have to be made. The 2017 average heat of 7.5 GJ/MWh for 2018 was used. The same trend of the change of average heat per MWh calculated from 2009–2017 was used to fill in data gaps from 1999–2008. For electricity consumption, data from the Alberta SGER database was used, as calculated by IHS Markit [4], which gives a value of electrical intensity of 9.7 kWh per bbl bitumen. This value was checked with other values in literature and was found within the range of electricity consumption published.
2.2. Process Calculations
Figure 1 presents the flow diagram of material and energy flows with emissions categories considered in this study. The total steam demand for SAGD operations in each year is met by a combination of boiler (largely, once through steam generators or heat recovery steam generators) and cogeneration (if installed). The installed cogeneration capacity per year along with the average heat derived per MWh was used to calculate the total heat generated by SAGD cogeneration operations annually. From this amount, the steam delivered from installed cogeneration is calculated. The remaining amount of steam is considered delivered from boilers.
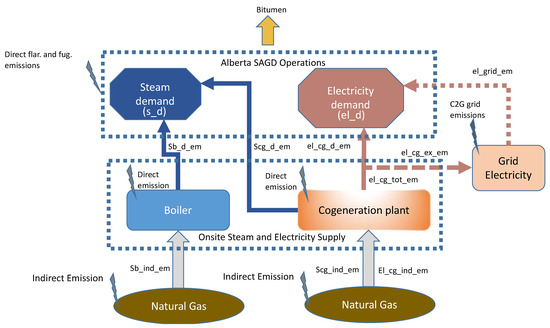
Figure 1.
Schematic flow diagram presenting the research methodology followed in the study with GHG emissions categories. (Abbreviations: Sb_ind_em: steam boiler indirect emissions; Sb_d_em: Steam boiler direct emissions; Scg_d_em: steam cogeneration direct emissions; Scg_ind_em: steam cogeneration indirect emissions; El_cg_ind_em: electricity cogeneration indirect emissions; el_cg_tot_em: electricity cogeneration total emissions; el_cg_d_em: electricity cogeneration direct emissions; el_cg_ex_em: electricity cogeneration exported emissions; el_grid_em: electricity from the grid emissions; Direct flar. and fug. Emissions: direct flaring and fugitive emissions).
The natural gas consumed by SAGD operations annually using boiler and cogeneration units is calculated by using the standard energy of reaction for methane combustion integrating unit efficiencies [11,30].
The GHG emissions associated with SAGD are divided into eight categories:
- Steam boiler direct emissions: direct emissions associated with combustion of natural gas to produce steam using boiler;
- Steam boiler indirect emissions: indirect (upstream) emissions associated with production of natural gas that is used to produce steam in boiler;
- Steam cogeneration direct emissions: direct emissions associated with combustion of natural gas to produce steam using cogeneration;
- Steam cogeneration indirect emissions: indirect (upstream) emissions associated with production of natural gas that will be used to produce steam using cogeneration;
- Electricity grid emissions: upstream emissions associated with electricity from grid production used in steam production;
- Electricity cogeneration direct emissions: direct emissions associated with production of electricity using cogeneration installed in SAGD facilities;
- Electricity cogeneration indirect emissions: indirect (upstream) emissions associated with production of natural gas that will be used to produce electricity using cogeneration installed in SAGD facilities;
- Flaring and fugitive emissions: direct flaring and fugitive emissions associated with operations of production of crude bitumen.
Emissions are calculated based on the amounts of fuel consumed and their direct and indirect emissions factors (summarized in Table S4, Supplementary Material). Flaring and fugitive emissions are based on data collected from Alberta’s SGER database, and converted to a production intensity value of 0.42 kgCO2e/bbl of bitumen. This is consistent with the value calculated by IHS Markit [4].
For electricity direct and indirect emissions, the displacement allocation method was used to calculate the amount of natural gas used to generate electricity [30]. In the case of cogeneration, the SGER provides credits for facilities that cogenerate a surplus amount of electricity that is exported to the grid. One case in our calculations was considered using the electricity emissions factor for cogeneration compliance adjustment as per the Government of Alberta [31]. Calculation details are described in the Supplementary Material.
3. Results
3.1. GHG Emission Intensity
The three cases examined for GHG emissions intensity for SAGD are as follows:
Case 1: This case excludes electricity exported (from cogeneration) to the grid.
Case 2: This case includes electricity exported from cogeneration with no credit assigned following the SGER.
Case 3: This case includes electricity exported obtained from cogeneration with credit assigned following the SGER.
3.1.1. Case 1
Figure 2 presents the annual historical total GHG emissions intensity results for SAGD from 1999 to 2018. The range is from 72 to 105 kgCO2e/bbl. The results show the different contributions of process components to total GHG emissions intensity. Natural gas combustion direct emissions from boiler and cogeneration are responsible for the largest amount (~75%) of total GHG emissions intensity followed by the indirect natural gas combustion emissions and electricity grid emissions. Looking at only direct GHG emissions intensity, the range is from 54 to 83 kgCO2e/bbl, where the combustion of natural gas is the main contributor. Note that direct and indirect emissions of electricity produced in this case are those associated with bitumen production, excluding the exported electricity (which is accounted for in the second case). Cumulatively for all SAGD operations, the GHG emissions intensity has dropped by 15.5% from 2007 to 2018; 2007 is the year where more than half of current SAGD projects are in operation, therefore this year is used for comparison purposes in this paper. For direct emissions, the reduction of GHG emissions intensity is 14.6% over the same period.
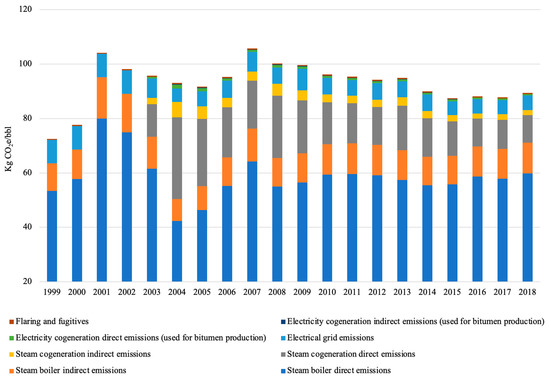
Figure 2.
Case 1—GHG emissions intensity of SAGD operations per year (with electricity produced and used for bitumen production and no electricity credit).
3.1.2. Case 2
In this case, all electricity produced from cogeneration is accounted for, including those exported to the grid. The range of total GHG emissions intensity in this case, displayed in Figure 3, is between 72.5 and 129 kgCO2e/bbl. By accounting for emissions of total electricity produced from cogeneration, the emissions intensity is greater than Case 1. However, the reduction of emissions intensity is higher compared to Case 1 results. This is due to the lower increase over time of electricity production and consequent electricity production emissions (as in Case 2), compared to the rate of increase of electricity produced and used in bitumen production (as in Case 1). In this case, SAGD operations achieved a reduction of GHG emissions intensity of 24% from 2007 to 2018. This is in agreement with the results of the his Markit study [4]. The direct emissions intensity of electricity from cogeneration reduced by ~63% from 2007 to 2018.
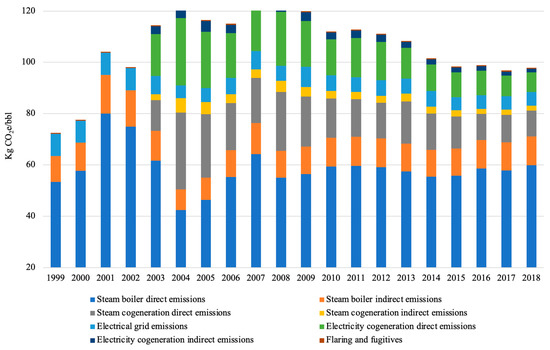
Figure 3.
Case 2—GHG emissions intensity of SAGD operations per year (with total electricity produced and no electricity credit).
3.1.3. Case 3
In this case, the results of total GHG emissions intensity of the SAGD operations along with the electricity credit accounted for as per the SGER is presented in Figure 4. Following the SGER guidelines, surplus electricity exported to the grid is assigned a credit leading to a reduction of the emissions intensity. However, this credit falls over time as seen in Figure 3 (by ~63% 2007–2018). This is due to the reduction in electrical generation capacity per unit volume bitumen produced. This reduction of the electrical power export credit intensity (from 0.06 MWh/bbl in 2007 to 0.02 MWh/bbl in 2018) offsets reductions in steam emissions from boiler and cogeneration, which made the total emissions intensity in this case flatter than that of the Cases 1 and 2. This confirms the results hisIHS Markit study [4]; in 2009 to 2017, cogeneration decreased due to price collapse causing cogeneration operations to tighten their capacity to meet steam demand only. This is also associated with lowering the steam-to-oil ratio (SOR). Based on the results in Figure 4, the GHG emissions intensity of SAGD, taking into account the electricity credit, ranges from 61.84 to 104 kgCO2e/bbl. It fell by 1.4% from 2007 to 2018 (81.34 to 80.23 kgCO2e/bbl).
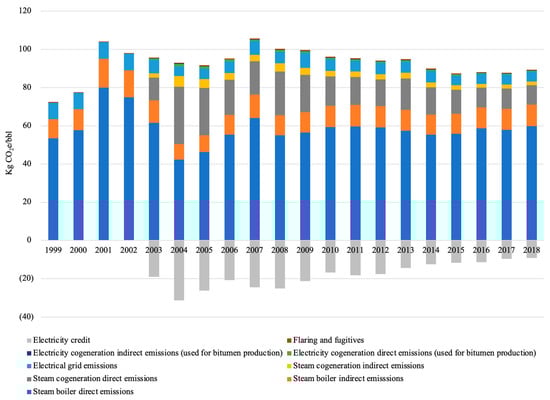
Figure 4.
Case 3—GHG emissions intensity of SAGD operations per year (with electricity credit).
The results show that exporting electricity production through cogeneration to the grid reduces the overall emissions intensity of SAGD as shown in Case 2. However, when considering existing crediting policies that incentivize excess electricity export to the grid, the emissions credit is not high enough to incentivize expansion of cogeneration capacity per bbl bitumen. This has led to the reduction of an emissions credit that offsets the reductions of emissions from boilers and cogeneration and thus, led the total emissions intensity in this case being relatively flat (Case 3). Therefore, cogeneration-based electricity production can reduce SAGD emissions intensity, but a rewarding policy incentive with appropriate emissions credit to incentivize more cogeneration is needed.
Table S5 in Supplementary Material presents some summary of the results in Case 1, 2 and 3.
3.2. GHG Emissions Intensity and Steam-to-Oil Ratio
Figure 5 presents the GHG emissions intensity of the SAGD operations by year (from 1999 to 2018) and cumulative steam-to-oil ratio (cSOR, steam expressed as cold-water equivalent) from Case 1. As shown in previous studies (e.g., Gates and Larter [11]), there is a direct relationship between cSOR and GHG emission intensity: the larger the cSOR, the greater the GHG emissions intensity. For all operations, the cSOR ranges from 2.10 to 3.21 m3/m3 reaching its peak in 2007, with an emissions intensity of 105.07 kgCO2e/bbl. This increase of cSOR and emission intensity in 2007 was caused by the start-up of new SAGD projects where steam was injected with relatively low oil produced, which occurs during the SAGD circulation phase. After circulation, the cSOR drops since greater volumes of oil are produced from the reservoir. In Case 1, the emission intensity from 2007 to 2018 dropped by 15% (105.07 kgCO2e/bbl in 2007 to 89.38 kgCO2e/bbl in 2018) and 15% in cSOR (3.21 in 2007 to 2.75 in 2018). The results are the same in terms of direct relationship between cSOR and emissions intensity in Cases 2 and 3.
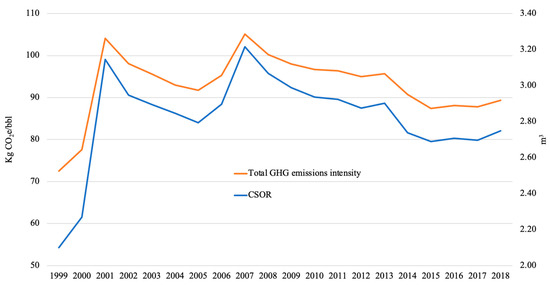
Figure 5.
GHG emissions intensity and cSOR per year for SAGD operations from 1999–2018 (from Case 1).
The same analysis was conducted without the first-year operation of SAGD projects (in other words, eliminating the circulation phase). The results, shown in Figure S1 (Supplementary Material), reveal that the large increase in emission intensity and cSOR in 2007 seen in Figure 5 has been reduced: this implies that the big jump of emission intensity and cSOR in 2007, shown in Figure 5, was caused by new project start-up. When the first year of operation of these new SAGD projects is removed, there is no big jump of emission intensity, rather a stabilisation, a reduction, or small increase of the emission intensity profile occurs.
The comparison of results between emission intensity from Case 1 and the seven biggest SAGD projects (responsible for ~76% of total bitumen production in 2018), presented in Figure S2 (Supplementary Material), reveals that, starting from 2002, the emission intensity from the seven largest operations is lower than the overall industry results. This shows that smaller or new SAGD projects are pushing the emission intensity higher.
3.3. Sensitivity Analysis
An analysis of the sensitivity of steam enthalpy (quality), feedwater enthalpy, electricity consumption, and electricity credit on emission intensity is conducted. A 43% increase of steam pressure to 10 MPa results in a very small effect on total emissions intensity. It reduces steam enthalpy and thus fuel consumption, lowering the emission intensity by 1.5–2% (Cases 1–3). A reduction of 28.5% to 5 MPa results in an increase of 0.6–1% of emission intensity (Cases 1–3). Thus, this sensitivity is small.
A reduction of 41% of the feedwater temperature to 100 °C also results in small increase of 0.04–0.07% in emission intensity (Cases 1–3), whereas an increase of 17.6% to 200 °C leads to a reduction of 0.02–0.04% in emission intensity (Cases 1–3). Thus, this sensitivity is small.
For electricity consumption, the electrical intensity was raised to 15 and 30 kWh/bbl, which are in ranges found in the literature: 7–30 kWh/bbl [32] and 8.7–39 kWh/bbl [21]. With 15 kWh/bbl bitumen, the emission intensity rises by 3.4–6% in Case 1 due to the increase in electricity grid emissions per bbl and electricity production emissions used for bitumen per bbl. For Case 2, the increase of emission intensity is between 2–6% due to the increase in electricity grid emissions only. For Case 3, the electricity credit reduces by 0.5–1.5%, but still the increase in electrical grid emissions and electricity production emissions used for bitumen results in an overall increase of emission intensity by 4–7%. However, the overall emissions intensity reductions are the same 15%, 24%, and 1.4% for Cases 1, 2, and 3, respectively. With electricity consumption of 30 kWh/bbl bitumen, the emission intensity increased 12–20% in Case 1, 5–20% in Case 2, and 14–20% in Case 3. This change raises emissions reductions to 17% for Case 1 and 6% for Case 3, whereas it remains the same (24%) for Case 2.
For electricity credit, the electricity credit of SAGD using the electricity displacement factors set up by the Government of Alberta for offset projects that result in a decrease of grid electricity usage was calculated [12,33,34]. This change increased the amount of electricity credit provided for facilities that cogenerate a surplus amount of electricity that is exported to the grid. This reduced the emission intensity for SAGD (44.5 to 104 kgCO2e/bbl). However, the reduction of the credit over time is the same at ~63% from 2007 to 2018, which offsets reductions of natural gas combustion emissions.
In summary, the sensitivity analysis reveals that none of the changes examined provides significant impacts on the results of this study.
3.4. Comparison of Results
Table 1 compares the emission intensity results from this study with that of the previous published literature. The comparisons show that the results are all consistent. In addition, this study’s emission intensities were compared to emissions values reported by SAGD facilities to the GHG reporting program in Alberta in 2016 and 2017 [35]. The average total direct GHG emissions intensity for those SAGD facilities was calculated as 65 and 67 kgCO2e/bbl bitumen for 2016 and 2017, respectively. This compares well to the total direct GHG emission intensity for the SAGD industry calculated in this study, which is equal to 60 kgCO2e/bbl bitumen (Case 3 with cogeneration and emissions credit).

Table 1.
Comparison of this study’s results with those of previous literature.
4. Discussion
The results presented in Section 3 show a reduction of 1.4–24% of emissions intensity of SAGD operations over the past 12 years with up to 15% improvement of cSOR. This improvement in emissions intensity performance and cSOR with time is also the case of the largest SAGD projects.
4.1. Factors Affecting SAGD Historical Performance
In general, the oil sands industry has undergone several technological development periods over the past 20 years. Gates and Wang [3] analyzed the evolution of in situ oil sands recovery technology by examining over 250 patents with respect to well designs and injectants. They concluded that new changes adopted by industry for in situ oil sands recovery processes are those that were relatively simple that built on existing functioning technologies. Their observation was that complex modifications presented in patents were not often adopted. A more recent study by IHS Markit [4] is consistent with Gates and Wang [3] observations; they found that SAGD operations have applied incremental relatively simple changes such as improving monitoring and well placement and maintenance for managing outages. Incremental evolution of technology is largely linked to political, environmental, and socio-economic factors and risks. These factors can be linked to the joint issues of fear of failure and the existence of a tangible path to deployment, as reported by Bunio and Gates [37].
Environmental and political factors depend on availability of different options that comply with environmental regulations and the cost of compliance achieved by a technological change that reduces environmental impact relative to the cost of using other compliance options. For example, the SGER that regulated large GHG emitters in Alberta from 2007 to 2017 provided three options of compliance in addition to the reduction in GHG emissions through a technological change. Hannouf and Assefa [38] showed that the SGER did not provide economic incentives for companies motivating lower GHG emissions via technological changes given the lower costs of compliance by other available options. Another example of not providing an appropriate policy incentive is the emissions credit provided for SAGD facilities that cogenerate electricity to the grid. As shown in Cases 1–3, this credit was not high enough to incentivize SAGD facilities to increase cogeneration capacity (that can reduce emissions intensity of SAGD).
Economic factors involve cost and risk of economic loss of adopting the new change (including capital and operating costs and cost of training or hiring if new skills needed) and potential commercial return gained based on the price of final products or materials used in the process and availability of supply/demand.
Social factors involve the level of complexity of change and risk and fear of failure, as the industry in general historically has adopted relatively simple technological changes [3]. In addition, the risk associated with change in terms of health and safety risk on workers or community (e.g., creating health problems for indigenous communities or surrounding communities). Moreover, the impact of the proposed change on the social image of the company given social pressure on companies from different stakeholder groups such as environmental groups and associations, local communities, or investment groups.
4.2. Role of Policy-Makers: Insights to Accelerate Improvements of SAGD GHG Performance
Policy intervention is considered an effective strategy to cause change leading to improvement of oil sands recovery process environmental performance. Therefore, despite the combination of environmental, and socio-economic factors that are involved in the historical process of choosing technological changes in SAGD operations, policymakers can play a major role to affect these factors as well as faster decision making and adoption of changes. Policy interventions can encourage and push SAGD operators and technology developers to accelerate adoption of new viable technologies.
As environmental regulation compliance is a key factor when choosing new technological options, policymakers must consider the efficiency of economic incentives that promote adoption of new technologies that reduce environmental impacts. For example, re-thinking the efficacy of the carbon tax and its consequent reactions from industry with respect to change may be linked to a threshold value that makes adoption of technological changes competitive [38]. Additionally, re-thinking an appropriate policy incentive with appropriate emissions credit that incentivizes the increase in cogeneration capacity is needed.
As technology complexity is a key factor for its deployment, developers need to consider this when creating new solutions. Simplicity can be hard to achieve in some cases, but technology developers must communicate with the oil sands industry at the early stages of development to explain and discuss how new technologies fit into the existing supply and value chains. This can simplify the understanding needed by industry and remove/reduce any fear of failure that would delay adoption of new technologies [37]. Adoption of new SAGD technologies is also constrained by social risks that arise in the early development stage. Therefore, decision-makers in SAGD operating companies need to collaborate further with technology developers to ensure that these factors are well considered and managed. To encourage this early communication and collaboration on barriers of technology adoption and development of effective technologies, policymakers can encourage more collaboration between oil sands industry and technology developers: one role might be to de-risk the costs of testing new technologies or by operating collaborative platforms or by funding these collaborations. However, competition may also play a role in stimulating progress.
Technology developers must consider the economic costs, commercial return, and social impact of technological changes in the development process. Economic aspects are normally considered when assessing new technological changes. However, when it comes to social risk, it is rarely considered despite the major role social aspects play in the successful implementation of technologies [39]. Policy-intervention associated with environmental aspects can be combined with economic and social aspects by requiring or incentivizing technology developers to consider economic costs, commercial return, and social impact of technological changes as important factors in the development process.
4.3. Projections for Future Performance of SAGD
If SAGD operations continue their reduction of GHG emissions intensity trajectory as in the past 12 years (2007–2018), a further reduction is expected between 6.5 and 24% (Case 1) and 8 and 40% (Case 2) by 2030, depending on how past performance is modeled (e.g., linear, exponential). Figure 6 presents an example for a linear projection model of the past performance with an outlook of SAGD GHG emissions intensity for 2019–2030 for Cases 1 and 2. Case 3 is not considered, since its trend is nearly flat.
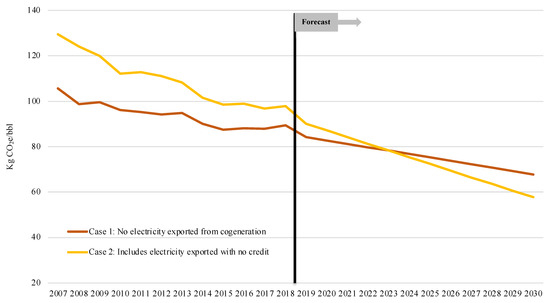
Figure 6.
GHG emissions intensity of SAGD operations: historical and outlook (2007–2030) with an example of linear modeling of past performance for Cases 1 and 2.
With business-as-usual (continuing on the same performance trend as historical performance improvements), SAGD GHG emissions intensity could reach 68 and 58 kgCO2e/bbl for Cases 1 and 2, respectively, by 2030. This would make SAGD emission intensity nearer the current average conventional crude oil emission intensity of 45 kgCO2e/bbl crude oil (from GHGenius, NRC [19]). There is a lot of variability in the emissions intensity results of conventional crude oil, where other values between 20 and 34 kgCO2e/bbl crude oil exist [8,9,18,36,40]. According to Englander et al. [41], this variability is due to different parameters such as flare rate, water-oil ratio, operation practices, and different types of crudes. Since Canadian conventional light crude is the one modeled by GHGenius and based on updated data [20], using the GHGenius value for conventional crude oil in this study is appropriate. The projected values in 2030 are still above the current average conventional crude oil emission intensity level (from all sources), which strongly suggests that the SAGD industry needs to accelerate the reduction of emission intensity beyond the historical trend.
5. Conclusions
The literature abounds with concerns of the environmental impact of SAGD, but its evolution of environmental performance remains unclear, given the differences of results from previous studies. In addition, the focus of previous studies was limited to proposing technological changes to improve SAGD GHG performance, which is only part of the solution, avoiding the discussion of factors affecting slow adoption of these cleaner technologies. This work is the first study to analyse SAGD GHG performance focusing on factors affecting accelerated technology deployment. In this study, a detailed analysis of the historical GHG emissions intensity of SAGD industry since 1999 to 2018 is provided. For the first time, the analysis considered three different cases of calculation of emissions intensity of SAGD industry to investigate the impact of specific factors on emissions reductions. The results show a reduction of 1.4 to 24% of SAGD emissions intensity over the 12-year time period from 2007 to 2018. This improvement was associated with a reduction of up to 15% in the steam-to-oil ratio during the same period. The results show that electricity production through cogeneration can reduce the emissions intensity of SAGD; this implies that a policy incentive with appropriate emissions credit that incentivizes more cogeneration capacity is needed. Historically, the emission intensity improvement of the SAGD industry was associated with incremental and relatively simple technological improvements. A starting discussion of environmental, political, and socio-economic factors affecting companies’ decision-making when adopting new technologies is conducted in this study. These factors include cost of technological change, risk and fear of failure, the potential benefit, economic incentive, and GHG policy that promotes testing and adoption of new technologies. Based on these factors, policy interventions are proposed to accelerate SAGD operators to adopt new technologies that result in lower emissions. Policy interventions accounting for the political, environmental, and socio-economic factors that impact the decision-making of adopting technological changes that can further reduce GHG emissions by SAGD operations need to be developed with the aim of accelerating future emissions reductions. Such interventions have the potential to encourage actions from SAGD operators and technology developers to enable better decision-making on changes that can lead to an improved performance in SAGD. For example, providing policy incentives such as allocating appropriate credits to increase cogeneration capacity in SAGD in the future to rise emissions intensity reductions in the industry to reach values closer to conventional oil emissions or even better. However, if future SAGD emission intensity reduction follows the same trend as the 12 years analyzed, a 6.5 to 40% reduction in GHG emissions intensity by 2030 is expected, depending on how past performance is modeled leading to an intensity between 58 and 68 kgCO2e/bbl.
The discussion of the socio-economic and environmental factors affecting technology adoption is conducted in this study in a qualitative way, as the main purpose is to initiate this discussion around the importance of these factors in future paths toward accelerating the adoption of cleaner oil sands extraction technologies. However, future research can go beyond this qualitative analysis into a deeper quantitative discussion of the impact of these factors on specific amounts of emissions reductions, using some examples.
Despite this, the results here are still alarming: if the current trend of emission intensity reduction incremental improvements continues moving forward, SAGD emission intensity will still remain above current conventional oil emission intensity by 2030—this suggests strongly that the SAGD industry must drastically accelerate its development of cleaner extraction technology if it is to be the cleanest barrel of oil globally. The policy insights identified here are needed to accelerate deployment of cleaner oil sands extraction technology. This requires a reconsideration of oil sands technology development from a sustainability point of view, with likely requirement for severe behavioral change from all stakeholders (industry, government, universities, and small-medium technology providers).
Supplementary Materials
The following are available online at https://www.mdpi.com/article/10.3390/en15010086/s1, Table S1: Comparison of some examples of previous studies’ purpose, focus and gaps with the current study’s purpose and focus, Table S2: List of SAGD projects considered in this study with starting operating date, steam cumulative average rate, bitumen cumulative production average rate, Table S3: List of efficiency parameters, Table S4: GHG emissions factors used in the calculation of historical GHG emissions from the SAGD operations, Table S5: Summary of results of case 1, 2 and 3 GHG emissions (kg CO2e/bbl) and cSOR (m3/m3), Figure S1: GHG emissions intensity and cSOR per year for SAGD operations without first year of operation of any new SAGD project, Figure S2: Comparison of overall SAGD operations GHG emissions intensity per year from 1999–2018 with the seven biggest SAGD projects emissions intensity.
Author Contributions
Conceptualization, M.H., G.A. and I.G.; methodology, M.H.; software, M.H.; validation, M.H., G.A. and I.G.; formal analysis, M.H.; investigation, M.H.; resources, M.H., G.A. and I.G.; data curation, M.H.; writing—original draft preparation, M.H.; writing—review and editing, G.A. and I.G.; visualization, M.H., G.A. and I.G.; supervision, G.A. and I.G.; project administration, G.A. and I.G.; funding acquisition, G.A. and I.G. All authors have read and agreed to the published version of the manuscript.
Funding
The authors acknowledge support from the University of Calgary’s Canada First Research Excellence Fund (CFREF) program, entitled the Global Research Initiative (GRI) in Sustainable Low Carbon Unconventional Resources.
Data Availability Statement
Data sharing not applicable: No new data were created or analyzed in this study. Data sharing is not applicable to this article.
Conflicts of Interest
The authors declare no conflict of interest.
References
- Brandt, A.R. Variability and uncertainty in life cycle assessment models for greenhouse gas emissions from Canadian Oil Sands production. Environ. Sci. Technol. 2011, 46, 1253–1261. [Google Scholar] [CrossRef]
- AER (Alberta Energy Regulator). Alberta Energy Outlook, ST98: Executive Summary. 2021. Available online: https://static.aer.ca/prd/documents/sts/ST98/2021/st98-2021-executivesummary.pdf (accessed on 25 September 2021).
- Gates, I.D.; Wang, J. Evolution of in situ oil sands recovery technology: What happened and what’s new? In Proceedings of the Society of Petroleum Engineers Heavy Oil Conference and Exhibition, Kuwait City, Kuwait, 12–14 December 2011. [Google Scholar]
- IHS Markit. Greenhouse Gas Intensity of Oil Sands Production: Today and in the Future. 2018. Available online: https://ihsmarkit.com/forms/contactinformation.html?efid=tFSzO+2aeGqpKuUQPMWZ3Q== (accessed on 15 February 2021).
- NRC (Natural Resources Canada). Crude Oil Facts. 2018. Available online: https://www.nrcan.gc.ca/energy/facts/crude-oil/20064#L6 (accessed on 5 March 2021).
- ECCC (Environment and Climate Change Canada). National Inventory Report 1990–2018: Greenhouse Gas Sources and Sinks in Canada. 2020. Available online: https://publications.gc.ca/collections/collection_2020/eccc/En81-4-2018-1-eng.pdf (accessed on 25 September 2021).
- Butler, R.M. Thermal Recovery of Oil and Bitumen; Prentice-Hall Inc.: Upper Saddle River, NJ, USA, 1991; ISBN 9780139149535. [Google Scholar]
- Layzell, D.B.; Narendran, M.; Shewchuk, E.; Sit, S.P. SAGD cogeneration: Reducing the carbon footprint of oilsands production and the Alberta grid. CESAR Scenar. 2016, 1, 1–37. [Google Scholar]
- Layzell, D.B.; Narendran, M.; Shewchuk, E.; Sit, S.P. Cogeneration options for a 33,000 BPD SAGD facility: Greenhouse gas and economic implications. CESAR Scenar. 2016, 1, 1–54. [Google Scholar]
- Giacchetta, G.; Leporini, M.; Marchetti, B. Economic and environmental analysis of steam assisted gravity drainage (SAGD) facility for oil recovery from Canadian Oil Sands. Appl. Energy 2015, 142, 1–9. [Google Scholar] [CrossRef]
- Gates, I.D.; Larter, S.R. Energy efficiency and emissions intensity of SAGD. Fuel 2014, 115, 706–713. [Google Scholar] [CrossRef]
- Nimana, B.; Canter, C.; Kumar, A. Energy consumption and greenhouse gas emissions in the recovery and extraction of crude bitumen from Canada’s oil sands. Appl. Energy 2015, 143, 189–199. [Google Scholar] [CrossRef]
- Nimana, B.; Canter, C.; Kumar, A. Life cycle assessment of greenhouse gas emissions from Canada’s oil sands-derived transportation fuels. Energy 2015, 88, 544–554. [Google Scholar] [CrossRef]
- Bergerson, J.A.; Oyeshola, K.; Charpentier, A.D.; Sleep, S.; Maclean, H.L. Life cycle greenhouse gas emissions of current oil sands technologies: Surface mining and in situ applications. Environ. Sci. Technol. 2012, 46, 7865–7874. [Google Scholar] [CrossRef] [PubMed]
- McCann, P.; Magee, T. Crude oil greenhouse gas life cycle analysis helps assign values for CO2 emissions trading. Oil Gas J. 1999, 97, 38–43. [Google Scholar]
- Jacobs Consultancy for Alberta Energy Research Institute. Life Cycle Assessment of North American and Imported Crudes. 2009. Available online: http://seeds4green.net/sites/default/files/life%20cycle%20analysis%20jacobs%20final%20report.pdf (accessed on 15 February 2021).
- El-Houjeiri, H.M.; Brandt, A.R.; Duffy, J.E. Open-source LCA tool for estimating greenhouse gas emissions from crude oil production using field characteristics. Environ. Sci. Technol. 2013, 47, 5998–6006. [Google Scholar] [CrossRef]
- GREET. The Greenhouse Gases, Regulated Emissions, and Energy Use in Transportation (GREET) Model, GREET1 2018, Argonne National Laboratories for U.S. Department of Energy. Available online: https://greet.es.anl.gov/ (accessed on 10 February 2021).
- NRC (Natural Resources Canada). GHGenius Version 5.0d; Natural Resources Canada: Ottawa, ON, USA, 2018. Available online: http://www.ghgenius.ca (accessed on 10 February 2021).
- Charpentier, A.D.; Kofoworola, O.; Bergerson, J.A.; MacLean, H.L. Life cycle greenhouse gas emissions of current oil sands technologies: GHOST model development and illustrative application. Environ. Sci. Technol. 2011, 45, 9393–9404. [Google Scholar] [CrossRef] [PubMed]
- Orellana, A.; Laurenzi, I.J.; MacLean, H.L.; Bergerson, J.A. Statistically enhanced model of in situ oil sands extraction: An evaluation of variability in greenhouse gas emissions. Environ. Sci. Technol. 2018, 52, 947–954. [Google Scholar] [CrossRef]
- Sleep, S.; Guo, J.; Laurenzi, I.J.; Bergerson, J.A.; Maclean, H.L. Quantifying variability in well-to-wheel greenhouse gas emission intensities of transportation fuels derived from Canadian oil sands mining operations. J. Clean. Prod. 2020, 258, 120639. [Google Scholar] [CrossRef]
- Pinto, H.; Wang, X.; Gates, I. On the ratio of energy produced to energy injected in SAGD: Long-term consequences of early stage operational decisions. J. Pet. Sci. Eng. 2021, 199, 108271. [Google Scholar] [CrossRef]
- Cheng, L.; Liu, H.; Huang, S.; Wu, K.; Chen, X.; Wang, D.; Xiong, H. Environmental and economic benefits of Solvent-Assisted Steam-Gravity Drainage for bitumen through horizontal well: A comprehensive modeling analysis. Energy 2018, 164, 418–431. [Google Scholar] [CrossRef]
- Austin-Adigio, M.; Gates, I. Cleaner production from steam-assisted gravity drainage using seismic-based automated control. J. Clean. Prod. 2019, 209, 1139–1151. [Google Scholar] [CrossRef]
- Katta, A.K.; Davis, M.; Subramanyam, V.; Dar, A.F.; Mondal, M.A.H.; Ahiduzzaman, M.; Kumar, A. Assessment of energy demand-based greenhouse gas mitigation options for Canada’s oil sands. J. Clean. Prod. 2019, 241, 118306. [Google Scholar] [CrossRef]
- Ashrafi, O.; Zamor, O.; Navarri, P. Impact of carbon capture technologies on GHG emissions from oil sands in-situ facilities: A system prospective. Appl. Therm. Eng. 2021, 188, 116603. [Google Scholar] [CrossRef]
- Gross, R.; Hanna, R.; Gambhir, A.; Heptonstall, P.; Speirs, J. How long does innovation and commercialization in the energy sectors take? Historical case studies of the timescale from innovation to widespread commercialization in energy supply and end use technology. Energy Policy 2018, 123, 682–699. [Google Scholar] [CrossRef]
- Province of Alberta. Responsible Energy Development Act General Regulation. 2019. Available online: http://www.qp.alberta.ca/1266.cfm?page=2013_090.cfm&leg_type=Regs&isbncln=9780779807345 (accessed on 10 February 2021).
- Doluweera, G.H.; Jordaan, S.M.; Moore, M.C.; Keith, D.W.; Bergerson, J.A. Evaluating the role of cogeneration for carbon management in Alberta. Energy Policy 2011, 39, 7963–7974. [Google Scholar] [CrossRef]
- Alberta Government. Standard for Completing Greenhouse Gas Compliance Reports. 2017. Available online: https://open.alberta.ca/dataset/8acc4e6f-6227-49d0-8a9b-14b8790c8e67/resource/b1fc8461-70b3-4bed-8d37-f64d22775780/download/standardghgcompliancereports-oct2017.pdf (accessed on 15 February 2021).
- CERI (Canadian Energy Research Institute). Oil Sands Industry Energy Requirements and Greenhouse Gas (GHG) Emissions Outlook (2015–2050). 2015. Available online: https://www.nrcan.gc.ca/sites/www.nrcan.gc.ca/files/energy/energy-resources/CERI_Study_151_Full_Report.pdf (accessed on 15 February 2021).
- Alberta Government. Notice of Change for Emission Factor for Increase Grid Electricity Usage. 2011. Available online: https://www.csaregistries.ca/files/projects/7758_5940_AEOR_OffsetProjectReport_20160101_20160930.pdf (accessed on 10 February 2021).
- Alberta Government. Carbon Offset Emission Factor Handbook. 2015. Available online: https://open.alberta.ca/dataset/dd23dec0-e408-49b7-8bdc-151cc1ce58f5/resource/18f3a5f5-6370-467b-be5a-664330014723/download/2015-carbonemissionhandbook-mar11.pdf (accessed on 10 February 2021).
- Government of Canada. Open Government, Greenhouse Gas Reporting Program (GHGRP) Facility Greenhouse Gas (GHG) Data. 2019. Available online: https://open.canada.ca/data/en/dataset/a8ba14b7-7f23-462a-bdbb-83b0ef629823 (accessed on 10 January 2021).
- Rosenfeld, J.; Pont, J.; Law, K.; Hirshfeld, D.; Kolb, J. Comparison of North American and Imported Crude Oil Lifecycle GHG Emissions; TIAX LLC for the Alberta Energy Research Institute: Cupertino, CA, USA, 2009. Available online: http://www.assembly.ab.ca/lao/library/egovdocs/2009/aleri/173913.pdf (accessed on 15 February 2021).
- Bunio, G.L.; Gates, I.D. Innovation, Motivation, and Fear: A Novel Perspective for Unconventional Oil. In Proceedings of the Society of Petroleum Engineers Unconventional Resources Conference and Exhibition-Asia Pacific, Brisbane, Australia, 11–13 November 2013. [Google Scholar]
- Hannouf, M.; Assefa, G. The role of sustainability resources of large greenhouse gas emitters: The case of corporations in Alberta, Canada. Sustainability 2017, 9, 182. [Google Scholar] [CrossRef]
- Lehmann, A.; Zschieschang, E.; Traverso, M.; Finkbeiner, M.; Schebek, L. Social aspects for sustainability assessment of technologies—challenges for social life cycle assessment (SLCA). Int. J. Life Cycle Assess. 2013, 18, 1581–1592. [Google Scholar] [CrossRef]
- Flint, L. Bitumen & Very Heavy Crude Upgrading Technology—A Review of Long Term R&D Opportunities LENEF Consulting Ltd. Available online: https://collections.lib.utah.edu/details?id=213965 (accessed on 10 February 2021).
- Englander, J.G.; Bharadwaj, S.; Brandt, A.R. Historical trends in greenhouse gas emissions of the Alberta oil sands (1970–2010). Environ. Res. Lett. 2013, 8, 044036. [Google Scholar] [CrossRef][Green Version]
Publisher’s Note: MDPI stays neutral with regard to jurisdictional claims in published maps and institutional affiliations. |
© 2021 by the authors. Licensee MDPI, Basel, Switzerland. This article is an open access article distributed under the terms and conditions of the Creative Commons Attribution (CC BY) license (https://creativecommons.org/licenses/by/4.0/).