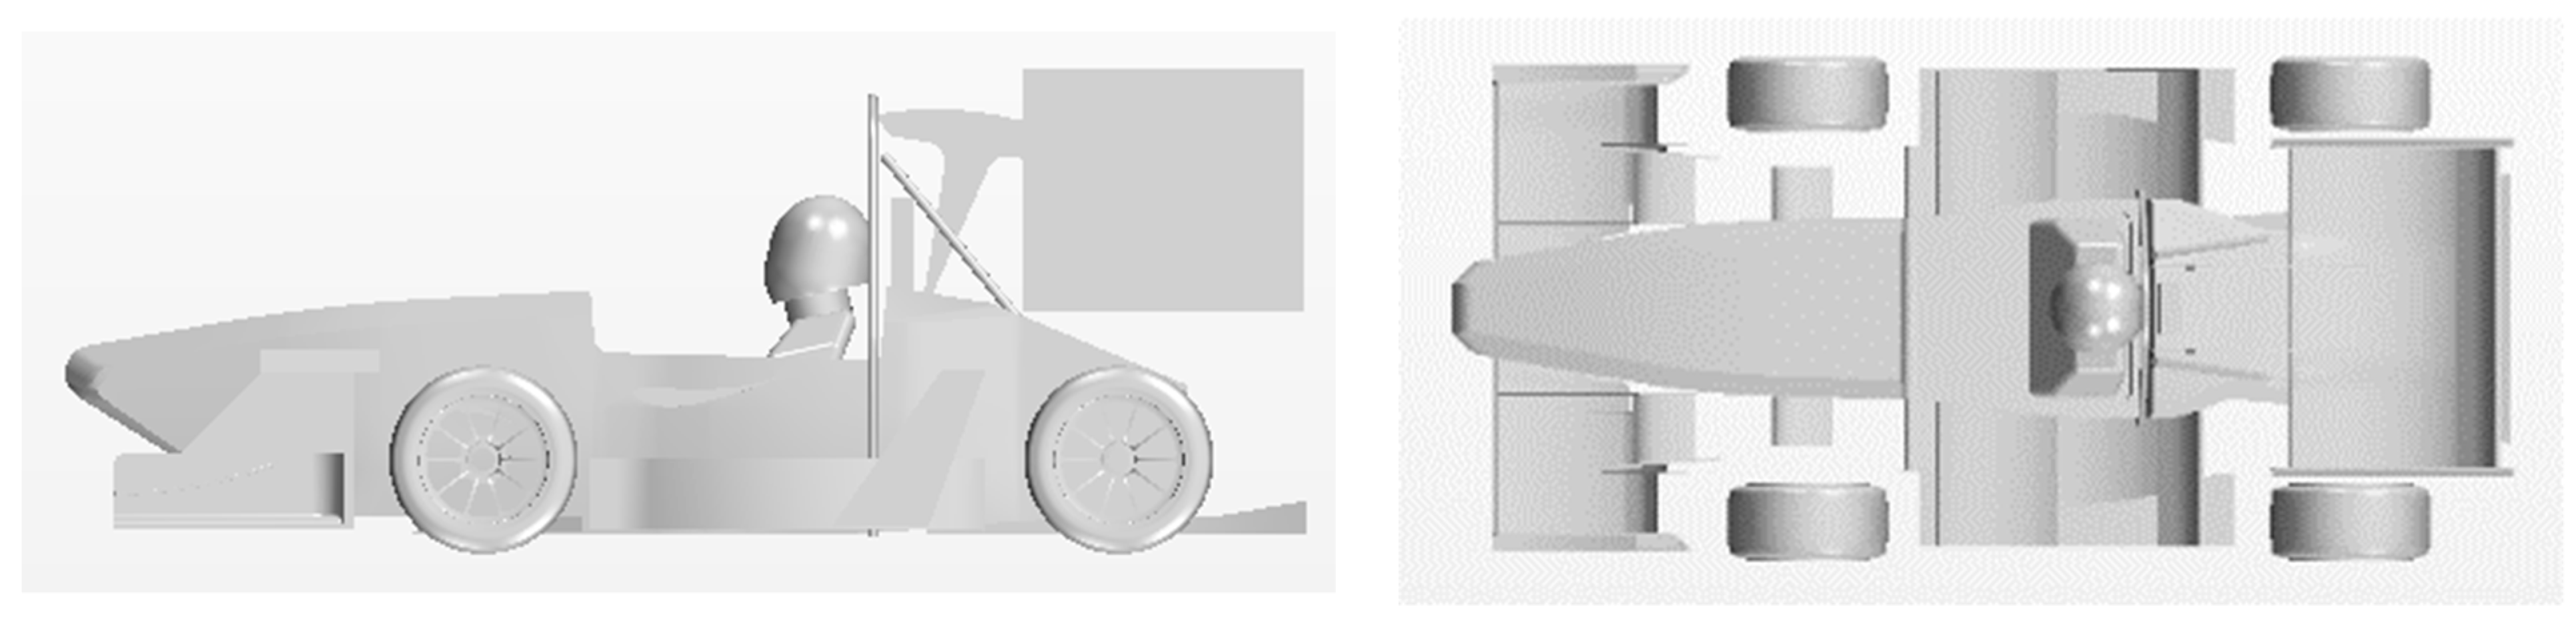
Article

Joint Research on Aerodynamic Characteristics and Handling Stability of Racing Car under Different Body Attitudes

State Key Laboratory of Automotive Simulation and Control, Jilin University, Changchun 130015, China
*
Author to whom correspondence should be addressed.
Energies 2022, 15(1), 393; https://doi.org/10.3390/en15010393
Submission received: 23 November 2021 / Revised: 6 December 2021 / Accepted: 29 December 2021 / Published: 5 January 2022
(This article belongs to the Section E: Electric Vehicles)

Abstract

:
With the rapid development of FSAE, the speed of racing cars has increased year by year. As the main research content of racing cars, aerodynamics has received extensive attention from foreign teams. For racing cars, the aerodynamic force on the aerodynamic device ultimately acts on the tires through the transmission of the body and the suspension. When the wheel is subjected to the vertical load generated by the aerodynamic device, the ultimate adhesion capacity of the wheel is improved. Under changing conditions, racing wheels can withstand greater lateral and tangential forces. Therefore, the effects of aerodynamics have a more significant impact on handling stability. The FSAE racing car of Jilin University was taken as the research object, and this paper combines the wind tunnel test, the numerical simulation and the dynamics simulation of the racing system. The closed-loop design process of the aerodynamics of the FSAE racing car was established, and the joint study of aerodynamic characteristics and handling stability of racing car under different body attitudes was realized. Meanwhile, the FSAE car was made the modification of aerodynamic parameter on the basis of handling stability. The results show that, after the modification of the aerodynamic parameters, the critical speed of the car when cornering is increased, the maneuverability of the car is improved, the horoscope test time is reduced by 0.525 s, the downforce of the car is increased by 11.39%, the drag is reduced by 2.85% and the lift-to-drag ratio is increased by 14.70%. Moreover, the pitching moment is reduced by 82.34%, and the aerodynamic characteristics and aerodynamic efficiency of the racing car are obviously improved. On the basis of not changing the shape of the body and the aerodynamic kit, the car is put forward to shorten the running time of the car and improve the comprehensive performance of the car, so as to improve the performance of the car in the race.

1. Introduction

With the popularity of Formula Student China [1] in China, the FSAE racing car pays more and more attention to aerodynamics. Using aerodynamic means to optimize the external flow field of racing car, we can make the vehicle obtain good power performance and handling stability, and then improve the overall performance of the vehicle. At present, the analysis of the aerodynamic characteristics of the racing car is still in the steady-state basic condition, and a few of the body attitude analysis and aerodynamic characteristics are under the action of unsteady wind analysis, but the influence of aerodynamic characteristics on the dynamics and handling stability of the racing car is ignored.
Most of the research studies on racing cars are to optimize their aerodynamics: In the 1970s, the lotus [2] was first to put forward the theory of ground effect and the application technology of ground effect on the car. With the imitation and improvement of other teams, the application of this technology is becoming increasingly mature. Since then, the research on the aerodynamics of racing cars has been gradually refined, and each aerodynamic component has been optimized and the influence of individual aerodynamic components on the aerodynamic characteristics of the vehicle has been studied. Al Muharrami et al. [3] conducted wind tunnel tests with wheels and ground moving on closed-wheel GT2 cars and open-wheel F1 cars. The test results showed that the downforce of the GT2 car is mainly provided by diffuser and rear wing, and the drag coefficient increases by more than 3% when the wind speed increases, while the lift coefficient decreases by more than 2%. The lift coefficient and drag coefficient of F1 car vary greatly under different tracks, and the angle of attack of the front and rear wings greatly affects the aerodynamic force of the car. Sneh [4] conducted a numerical study on a FSAE racing car with rear engine. The K -ε turbulence model was selected to reduce drag on the racing car under the premise of ensuring aerodynamic downforce and improve the running speed of the car, but the influence of aerodynamic torque on the racing process was not taken into account. Craig [5] used porous pressure probes to conduct wind tunnel tests to explore the potential airflow interaction between the driver’s helmet and tail and used data in two-dimensional CFD calculations to accurately predict possible downforce. Weingart [6] took FSAE racing cars of the 14th season as the research object and measured aerodynamic parameters through low-cost coasting tests and compared the measured data with simulation results. The results show that the difference between simulation results and test data is about 5%, and the downforce data deviation is up to 18%. He [7] studied the crosswind stability of racing cars and adopted active front-wheel steering to actively control the crosswind stability of racing cars. The simulation results show that, under crosswind conditions, the crosswind angular velocity and lateral displacement of the car can effectively follow the ideal model, the side-slip angle of the centroid is optimized, the crosswind stability of the car is improved and the driving track is ensured. In order to reduce the error of simulation calculation, Lu [8] established a more accurate CAD model and used a computational fluid dynamics method to simulate the fluid of a racing car. The influence of front and rear wings on the vehicle flow field was explored, and several suggestions for optimizing aerodynamic characteristics were put forward through the quantitative study of pressure distribution. The running time of the car was reduced, and the race performance was improved by optimizing aerodynamic characteristics. Zhang [9] studied the aerodynamic characteristics of F1 racing car models at different pitching angles; the aerodynamic performance of the car was comprehensively analyzed from aerodynamic characteristics analysis to flow field analysis, and the results showed that, with the increase of pitch angle, the drag and the lift decrease, the downforce of a car is mainly provided by the front and rear wings, and the lift is provided by the front, bottom and rear wings and gradually decreases as the pitch angle increases; the drag is more sensitive to the change of pitch angle. Wsik [10] reduces the impact of air flow on the wheel arch clearance by changing the shape of the front bumper and adding air intake channels and diversion plates, thus reducing the air drag of the vehicle.
There are also a few studies on the influence of system dynamics on FSAE racing performance: Ma et al. [11] established the aerodynamic model of FSAE racing car and the multi-body dynamics model of “double wish-bone suspension” and “rack and gear steering” after the simulation calculation of the aerodynamic parameters of the whole vehicle. After the track model is established, the optimal driving trajectory is optimized according to the minimum curvature of each bend and the weight distribution of the shortest bend. Through the simulation of endurance race, the influence of the aerodynamic effect on the control stability of the vehicle was analyzed, and the maximum lateral acceleration, roll angle and other performances of the vehicle were evaluated. According to the speed characteristic and the vertical distribution of lateral acceleration of the car to evaluate performance limits of the car, the comparison of aerodynamic device and aerodynamic device provided under pressure size vehicle performance index, but he did not put forward a specific adjustment improvement program to increase the car’s performance. Based on automobile dynamics, Li et al. [12], from Jilin University, established a car model and the corresponding aerodynamic model through CarSim, simulated the crosswind condition of high-speed cars, analyzed and studied the influence of the driver model on the stability of cars and showed the importance of studying crosswind condition of cars. Carbonne [13] predicted the sensitivity of vehicles to transient crosswind through numerical simulation, evaluated the full-dynamic coupling performance between aerodynamics and vehicle dynamics simulation and obtained the degree of complexity required to simulate vehicles passing crosswind. Jia et al. [14], from the Liaoning University of Technology, established the vehicle dynamics model of FSAE racing car through CarSim and conducted the transient response test simulation and snaking test simulation of steering-wheel angle step input in the software, according to the requirements of the race. The simulation results showed that the racing car had good stability characteristics. Huang T et al. [15] simulated and analyzed the pitch motion model of a car body through large eddy simulation, verified the accuracy of the numerical simulation, discussed the influence law of the pitch motion on aerodynamic lift in quasi-static simulation and transient simulation and analyzed the mechanism of the change of transient aerodynamic lift caused by the pitch motion of the car body.
The research of domestic and foreign scholars on racing cars mainly focuses on aerodynamics. They improve the running speed of racing cars by improving aerodynamic kits, and some scholars reduce aerodynamic drag to reduce the running time of racing cars by improving the appearance of car bodies, or study the working conditions of racing cars from the perspective of dynamics. However, the interaction between aerodynamic characteristics and handling characteristics is seldom considered in the simulation design stage, but this interaction happens all the time in the running process of the car, so the joint research on aerodynamic characteristics and dynamics system of the car becomes particularly important, as it has very important practical significance in guiding the car to adjust and improve the performance of the race.
This study took the FSAE racing car of Jilin University as the research object. It combined a wind-tunnel test, aerodynamic numerical simulation and dynamics simulation of racing car system; established a closed-loop design process for aerodynamic characteristics of the FSAE racing car; conducted joint research on aerodynamic characteristics and handling stability of FSAE racing car under different body attitudes; and adjusted the aerodynamic parameters of FSAE racing car based on handling stability. On the basis of not changing the shape of the body and the aerodynamic kit, the adjustment plan of the aerodynamic parameters of the car were put forward to shorten the running time of the car and improve the comprehensive performance of the car, so as to improve the performance of the car in the race.

2. Simulation Strategy Determination

2.1. Car Model

The car model studied in this paper is a simplified vehicle model of FSAE racing car in the 19th season of Jilin University, and its design conforms to the relevant rules of Formula Student China. In order to ensure the quality of the grid and save computing resources, the simplified model was simplified by removing the suspension, as shown in Figure 1.

2.2. Numerical Simulation

Using a triangular mesh model for the car surface mesh division, we set the vehicle body and the surface of the tire grid size to 0.016 m; the curvature for the vehicle surface grid refinement was set to 36.0 points, and the minimum size was set to 0.0005 m. Through the grid properly after repair, a better quality of a grid model was obtained. The overall surface grid number of this racing car model is 1.79 million cells, and the details of the body, the leading edge of the front wing and the rear wing are kept well. The vehicle surface grid and local detail surface grid of the racing model are shown in Figure 2.
Generally, the blockage ratio should be less than 5% [16,17,18,19]. In combination with the size of the simulation model in this paper, in order to improve the calculation accuracy and eliminate the influence of the boundary, the computational domain is 13 times as long as the vehicle and 11 times the width of the vehicle, as high as 5 times of the vehicle. The front end of the model is at least 4 times the model length from the entrance of the computing domain, the back end is at least 8 times the model length from the exit and the blocking ratio is 1.2%.
After the surface mesh was divided, the volume mesh was divided. The type of volume mesh is cut volume mesh, which ensures the accuracy of simulation calculation and coordinates the feasibility of simulation scheme. Encryption domains of different sizes were set. The following encryption strategy was adopted: a total of three layered body-grid encryption domains were set up to encrypt the model and computing domain layer by layer, as shown in Figure 3.
The grid size of the three encryption domains was set in a certain proportion based on the basic size, and different grid numbers were obtained by changing the basic size for grid independence verification. In this simulation, the cells number of the volume grid is 16 million to meet the requirements of grid independence, and the final generated grid number is about 16.15 million. The encrypted computing domain is shown in Figure 4.
The height ratio of each layer of boundary layer grid should be less than 1.4, and the height ratio of outermost boundary layer grid to the first layer grid should also meet this requirement [20]. Based on the above factors, the boundary layer grid expansion ratio was selected as 1.2, and the total boundary layer thickness is 0.008 m. The simulation calculation is carried out for models with different boundary layers. When the boundary layer number exceeds 11 layers, the lift coefficient tends to be stable, and the mesh number of the model body increases with the increase of the boundary layer number. Considering the problem of computing resources, the SST K -ω turbulence model with 11 layers of boundary layer grid is finally adopted.
Through numerical simulation calculation, the accuracy and reliability of numerical simulation are verified, and more accurate simulation strategies are determined for subsequent numerical simulation of various working conditions under different body attitudes and different crosswind effects. The overall determined simulation strategies are shown in Table 1.

3. Wind Tunnel Test and Aerodynamic Characteristics Analysis

3.1. Wind Tunnel Test

This test was carried out in the Automotive Wind Tunnel Laboratory of Jilin University. The FSAE racing car was placed in the open test section, and the overall layout scheme of four-wheel support was adopted [21,22]. The racing car model is shown in Figure 5.
First, the aerodynamic six-component force of the FSAE racing car was measured under linear conditions. The wind velocity was set to increase from 15 to 30 m/s, with an increment of 5 m/s, and the air density was 1.18415 kg/m3. The test results are shown in Figure 6. With the increase of wind velocity, aerodynamic downforce and aerodynamic drag of the car continued to increase, and the lift-drag ratio of the vehicle basically remained unchanged.
Then the crosswind angle of side-wind dynamic characteristics was tested from −15° to +15°. The yaw model method by changing the attitude of the car body to achieve the crosswind encountered in the driving process was adopted in the test, and the crosswind angle of the test model changed by 5° each time. The diagram of the yaw model method in the wind tunnel test is shown in Figure 7. During the driving process of the car, the angle β between the incoming flow direction and the car body is the crosswind angle of car, and it is also the yaw angle in yaw action. The angle β is divided into positive and negative angles, which defines the clockwise yaw of car in the top view, and the angle β is the positive crosswind angle. Now, by the yaw model method, in the car body coordinates for reference, the vector triangle method is adopted to decompose to flow velocity, v, according to the relative motion, along the X direction of the car body velocity component—vA equivalent to the car speed, vW along the Y direction of the speed car body components can be equivalent to crosswind velocity and the velocity of two equivalent velocities is the product of incoming velocity v and β angle trig function. The formula is expressed as follows:
v A = v · s i n β  
v w = v · c o s β
The aerodynamic parameters of the numerical simulation and wind-tunnel test under the condition that the wind velocity is 15 m/s, the crosswind angle is 0° and the body attitude is unchanged are shown in Table 2. The simulation data of the yaw model method and the aerodynamic characteristics data of the yaw model method in the wind tunnel test are shown in Table 3 for when the synthetic wind is 15 m/s and the crosswind angle is 10°.
According to the data in Table 2, under the same simulation and test conditions, the relative error of the lift coefficient is 6.14%, and the relative error of the drag coefficient is 4.94%. There is little difference between the aerodynamic parameters of the simulation and the test. According to the data in Table 3, the crosswind data simulated by the yaw model method are slightly larger than the test values, but the errors are kept within 5%. In addition, the lateral force of the racing car in crosswind condition conforms to the pretest value. In the wind-tunnel test, due to the influence of equipment, external interference and other factors, as well as the simulation accuracy of software, there are certain errors between the simulation and test, but the relative errors are within the allowable range of engineering practice, so the numerical simulation results have high accuracy.

3.2. Analysis of Aerodynamic Characteristics

Based on the actual racing conditions, the FSAE racing car’s aerodynamic simulation analysis was conducted under multiple working conditions by using STAR-CCM+ software. The aerodynamic characteristics of FSAE racing car were studied from the aspects of aerodynamic force, aerodynamic torque, vehicle flow field structure, etc., and we analyzed the reasons for the aerodynamic characteristics’ differences in each working condition. The influence of each aerodynamic component on the aerodynamic characteristics of the vehicle was explored. The aerodynamic parameters of the FSAE racing car in each working condition were collected to provide data support for the dynamics simulation.
This paper mainly studies some typical aerodynamic conditions of the figure-eight surround test and high-speed obstacle-avoidance test in FSAE. The influence of aerodynamic characteristics on the handling stability was deeply evaluated by using CarSim software. The aerodynamic six-component force data were obtained under various operating conditions in an input system module.

3.2.1. Analysis of Pitch Working Condition

According to the actual situation, the pitch-angle data of the car are −2.0°~1.0°, and the body pitching angle under acceleration is defined as positive. In the simulation analysis, the wind velocity was set as 15 m/s, the air density was 1.18415 kg/m³ and the angle increment of body attitude change was 0.5°.
When analyzing the pitch condition of the car, the range of pitch angle of the car was determined to be from −2.0° to 1.0°, the simulation wind velocity was set to 15 m/s and the increment of body pitch angle was 0.5°. A total of 14 conditions were simulated and analyzed. Figure 8 shows the trend of lift coefficient, drag coefficient and pitching moment variation curves in various working conditions.
By analyzing the change characteristic curves of lift and drag in various pitching conditions, it can be found that the change of drag is small in the pitching condition: −2.0° that the body leans forward, 2.0° in acceleration condition means the minimum drag, −1.0° that the body leans forward, 1.0° in acceleration condition means the maximum downforce and 0.5° that the body leans backward 0.5° in braking condition means the minimum downforce. It is calculated that the lift–drag ratio of the vehicle is the maximum at −1.0°, and the aerodynamic efficiency of the vehicle is the highest in various pitching conditions. The lift–drag ratio is the minimum at 0.5°, and the aerodynamic efficiency of the vehicle is the lowest in various pitching conditions. When the pitch angle is −1.0°, the pitching moment coefficient is the smallest, indicating that the pitching moment is the smallest, the front and rear axles of the car are least affected by aerodynamic force distribution, and the car is likely to run more stably. However, the pitching moment coefficient is the largest when the pitching angle is 1.0°, indicating that the pitching moment is the largest in this condition, and the front and rear axles of the racing car are most affected by the aerodynamic force distribution, and the stability of the racing car may be worse.
Table 4 compares the lift-drag characteristics of each component in the two working conditions and the basic working conditions under 15 m/s wind velocity. By analyzing the drag data of each component in the three pitching conditions in the table above, it can be found that compared with the pitch 0° in the basic condition, the downforce of the front wing and tail wing in the pitch −1.0° condition is greater than that in the basic condition, and the downforce of the front wing and body increases more than that of the tail wing. This is because the working condition of pitch −1.0° body attitude forward, front wing and body wing structure from the ground clearance is reduced, when the car speed racing car forward, car front wing and the wing near the optimum aerodynamic kit from regional, venturi jet effect strengthen, airflow velocity increases under the wing surface, negative pressure zone also increase, blade up and down surface of differential pressure increases, the downforce on the front and flanks also increases. When the car is in pitch of −1.0°, the car body leans forward, and the equivalent angle of attack of the main wing and flap of the rear wing increases; meanwhile, the area of the rear wing blocked by the driver’s head and other components decreases, and the aerodynamic efficiency of the single part of the rear wing increases. However, the up-flow angle of the front wing and the side increases as the front wing and the side approach the optimal departure area. Therefore, the downforce of the tail increases less in pitch of −1.0°.
The pitching condition of −1.0° and the pitching condition of 0.5° are compared and analyzed. The comparison of pressure cloud images of the two conditions is shown in Figure 9. By comparing the vehicle and local pressure cloud images, it can be seen that there is a pitch angle 1.5° difference in body attitude between the two working conditions. Due to the change of front wing position, the positive pressure area of front wheel increases and front wheel drag increases in pitch 0.5° working condition. In the pitch condition of −1.0°, the lower surfaces of the front wing and the side wing are closer to the optimal separation area, and the area of the negative pressure area increases as the flow velocity passing under the wing increases, and the downforce increases as the pressure difference between the upper and lower parts increases. In the pitch condition of −1.0°, the shield area of the tail decreases and the negative pressure area under the main wing increases. However, the negative pressure area of the tail flap decreases, due to the influence of the up-flow flowing through the front aerodynamic components. The downforce of the single tail part increases by combining the two different influences.

3.2.2. Analysis of Crosswind Condition

It is defined that the direction of environmental wind inflow is positive on the left side of the driving direction of the car. By default, the FSAE racing model is symmetric on the left and right, so the absolute values of the aerodynamic six components of the car are the same under the condition of the same absolute value of the crosswind angle. In order to save computing resources, this paper only simulates the working condition with positive crosswind angle, and the working-condition data with negative crosswind angle are obtained by the positive working condition. Now, the crosswind conditions corresponding to each coefficient are divided. The crosswind angle variation conditions of body attitude stability are shown in Table 5. In simulation analysis, the wind velocity was set as 15 m/s, the air density was 1.18415 kg/m³, the crosswind angle varied from 0° to 180° and the angle increment was 10°. The downflow velocity, vehicle velocity and crosswind velocity of some crosswind declination angles in the crosswind simulation are shown in Table 6.
According to the data analysis, when the absolute value of the angle β is the same, the lift and drag of the car are basically the same, and the aerodynamic characteristics of the car show a symmetric trend under the action of the positive and negative side wind. To simplify the calculation process, the aerodynamic six-component force data of the racing car are the same when the absolute value of the angle β is the same in the crosswind condition, and the crosswind simulation needs to be simulated at 0°~180° with increments of 10°. Figure 10 shows the variation curves of lift coefficient, drag coefficient and lateral force coefficient of the racing car at a 0°~180° crosswind angle.
Figure 10 shows that, with the increase of crosswind angle β, the car can gradually reduce aerodynamic downforce. When the angle β approaches 50°, the lift force of the car is 0; at this time, due to the crosswind effect, the aerodynamic kit of the car no longer provides additional downforce. When angle β is more than 50°, the lift of the car increases gradually, the ultimate adhesion capacity of the tire decreases gradually, and the ability of the wheel to bear the lateral and tangential reaction forces on the ground decreases; the car’s lift peaks when the angle β is around 130°, and then the car’s lift decreases with the increase of the crosswind angle β.
When the simulated wind velocity remains unchanged, the drag increases with the increase of the orthographic area, so the drag increases with increase of the crosswind angle β. When the angle β approaches 90°, the drag reaches the peak, and then it decreases due to the decrease of the orthographic area.
For lateral force, when the angle β is near 40° and 130°, the side force of the car reaches the peak, and the lateral force, for which the angle β is within the range of 0°~90°, is greater than lateral force that the angle β is in the range of 90°~180°.
It can be seen from the three sets of curves that, when the crosswind angle β is between 0° and 40°, the aerodynamic characteristics of the car are significantly reduced, but additional downforce can still be generated. The aerodynamic suite can improve the handling stability of the car. When the crosswire angle β is greater than 40°, the aerodynamic suite of the car fails. Moreover, 0°~40° can be regarded as the effective working range of racing aerodynamic kit under crosswind. Three representative crosswind deflection angles were selected in this study to analyze and study the vehicle outflow field structure.

4. Analysis of Vehicle Handling Stability under Multiple Operating Conditions

Based on the aerodynamic characteristics of the car, the vehicle outflow field simulation of FSAE car was carried out, and the aerodynamic data of the car under different body attitudes were obtained through the simulation. In order to analyze the influence of the aerodynamic characteristics on the vehicle handling stability, the aerodynamic parameters obtained from the numerical simulation were input into the dynamics model based on the characteristics of the racing car assembly. In the dynamic events of FSAE, the aerodynamic performance of the car has a crucial impact on the figure-eight loop test, high-speed obstacle avoidance test and endurance test, among which the high-speed obstacle avoidance test and endurance test can be simplified into multiple snaking driving and extreme steering. Therefore, based on the FSAE event and the characteristics of the car, this study carried out the car stability research, snaking test simulation and figure-eight surround test simulation under the crosswind effect to analyze the influence of the car aerodynamic characteristics on the vehicle handling stability.

4.1. Dynamic Simulation Model

The dynamics model of the racing car includes the body assembly, steering system and other systems. The specific parameters were set as shown in Table 7.

4.2. Snaking Test Simulation

The snaking test, also known as S-row round pile test, is an important index of vehicle stability. According to the national standard [23], the test speed should be half of the benchmark speed specified for small vehicles, rounded to an integer multiple of 10, and the speed should be driven in a stable and straight line until it passes the test area. After the test is completed, the test speed should be gradually increased, and the test should be repeated for a total of 10 times (excluding the times of knocking down the marker). The maximum speed shall not exceed 80 km/h. By comparing the real car data of FSAE racing car, we see that the initial speed of this test is 65 km/h, and the distance of road model L is 30 m. There are 3 tests, with each speed increment of 5.0 km/h, and the final speed of the test is 75 km/h, which meets the requirements of national standard test. The brake control adopts open-loop brake to control, and the brake pressure is 0. In order to simplify the test, closed-loop automatic shift control was adopted in this paper, and 0.15 s pre-sighting steering was adopted in steering control.
According to the test requirements of snaking test in GB/T 6233-2014 [23], the road modeling section is modeled according to the pile arrangement diagram. The ground friction system is 1.0, and the pile arrangement diagram is shown in Figure 11.
Considering the actual driving conditions, the simulation conditions can be divided into two types: one is the snaking test simulation under no crosswind action, and the other is the snaking test simulation under crosswind action. The influence of aerodynamic characteristics on vehicle handling stability under crosswind is judged by comparing the two working conditions.

4.2.1. Evaluation Criteria for Snaking Test

The simulation was evaluated according to the serpentine test evaluation method in the automobile handling and stability index limitation and evaluation method of QC/T 480–1999 automobile industry index of the People’s Republic of China [24]. The test was evaluated and scored according to the average crosswind offset velocity peak value, r, and the average steering-wheel-angle peak value, θ, at the reference speed.
The scoring formula of the average crosswind offset velocity peak value, r, is as follows:
N r = 60 + 40 r 60 r 100 ( r 60 r )
where Nr is the evaluation score value of the peak value of the average crosswind offset velocity; r is the experimental value, (°)/s; r100 is the upper limit, which is 10.0 (°)/s; and r60 is the lower limit, which is 25.0 (°)/s.
The scoring formula of the average steering-wheel-angle peak, θ, is as follows:
N θ = 60 + 40 θ 60 θ 100 ( θ 60 θ )
where Nθ is the evaluation score value of the average steering-wheel-angle peak; θ is the experimental value, (°); θ100 is the upper limit, which is 60.0 (°); and θ60 is the lower limit, which is 180.0 (°).
The comprehensive evaluation score of the car is the calculated value of the average crosswind velocity peak value, r, and the average steering-wheel-angle peak value, θ, at the reference speed.
The scoring formula for comprehensive evaluation of racing snake test is as follows:
  N s = 2 N r + N θ 3

4.2.2. Analysis of Results without Crosswind Action

According to the national standard evaluation method, the simulation of the snaking test needs to output the lateral acceleration curve, the peak curve of average crosswind angle velocity and the peak curve of average steering-wheel angle. The simulation curves of 65, 70 and 75 km/h without crosswind are shown in Figure 12 and Figure 13.
According to the requirements of national standard, the corresponding data of each parameter were intercepted into the simulation curve and data, and the simulation performance index data of 65, 70 and 75 km/h without crosswinds are shown in Table 8. According to the national standard, Nr, Nθ and Ns of snaking test are calculated. The performance index score of each working condition is shown in Table 9.
According to the data in Table 8 and Table 9, the lateral acceleration of the car increases and the passing time decreases with the increase of the vehicle speed in the three working conditions. The average steering-wheel angle peak, θ, of cars at different speeds is less than the θ range specified in national standard, leading to the scoring index of the peak angle θ greater than 100. Because the steering transmission ratio of the FSAE cars is smaller than that of civil cars, the steering-wheel-angle range of the cars is small.

4.2.3. Analysis of Simulation Results of Crosswind Action

This paper studies the snaking test simulation under crosswind action. For the open-loop snaking test, the steering system adopts a snaking test with direct input a speed of 65 km/h without crosswind. The variation curve of the steering-wheel angle is shown in Figure 14.
In order to realize the simulation study of handling and stability of the FSAE racing car with and without crosswind, the car speed was set at 65 km/h and the crosswind angle was set at 90°. The car was subjected to the slope step crosswind with crosswind speed of 12 m/s and ramp time of 0.1 s when driving for 0.2 s, and the acting time was until the end of the simulation. Figure 15 shows the comparison curves of aerodynamic forces and aerodynamic torque of racing cars with and without crosswind effects over time.
Figure 15 shows that, in the absence of crosswind, the aerodynamic side force is 0, and the values of aerodynamic drag and aerodynamic lift are consistent with those calculated by the fluid software; the aerodynamic lift and aerodynamic drag still have an impact on the handling stability of the car. In crosswind condition, the aerodynamic force of the car changes greatly. The aerodynamic lateral force changes the most, the aerodynamic lift is the second and the aerodynamic drag is less affected. The racing curve always fluctuates on both sides of the curve without crosswind. Influenced by the car’s serpentine driving, the crosswind angle changes constantly and presents serpentine fluctuation, and the aerodynamic curve also presents serpentine fluctuation.
Figure 15 shows the aerodynamic troque variation curve with and without crosswind effect over time. When there is no crosswind effect, the handling stability is only affected by the pitching moment, the roll moment and yaw moment of the car are both 0, the maximum pitching moment of the car is −64.883 N·m and the car presents an understeer state. When the car is affected by crosswind, the roll moment and yaw moment both change. Because the car is in the snaking test, the yaw moment changes the most, and the minimum value is −55.739 N·m. In the simulation, the aerodynamic sideslip angle is between 30° and 40°, the roll moment at this angle is small and the minimum value is −8.807 N·m. When the roll moment reaches the peak value, the pitching moment and yaw moment are the smallest, and the pitching moment changes little, and the numerical fluctuation is on both sides of the pitching moment curve in the non-crosswind condition.
Through Figure 16, it can be seen that lateral acceleration change with and without crosswinds is small. Lateral acceleration is mainly determined by the longitudinal velocity and driving radius under the action of the crosswind car longitudinal velocity change being smaller while the lateral displacement increases; however, the steering-wheel angle did not change, and the car driving radius basically remained unchanged, Therefore, the maximum lateral acceleration difference between the two conditions occurs at the wave peak of the serpentine driving route, and the maximum lateral acceleration difference is 0.2 m/s².
It can be seen from Figure 17 that the curve of roll speed change and its difference presents a sinusoidal trend: the roll speed curve of the racing car under the effect of crosswind fluctuates significantly when the crosswind is introduced. The maximum difference of the roll speed in the two working conditions also occurs in this period, and the maximum difference is −0.283 deg/s. When the attitude of the car tends to be stable, the rear-roll-speed curve basically coincides with that without crosswind.
As can be seen from Figure 18, the maximum difference between the crosswind angle velocity and the crest of the snaking track with and without crosswind is achieved. The peak value of the average crosswind angle velocity, Nr, is an important index to estimate the snaking track. Now, the performance index of the snaking track under the action of slope step crosswind at 12 m/s and slope time of 0.1 s is evaluated. As the steering-wheel angle is too small, the evaluation score of the average peak steering-wheel angle, Nθ, is 100 in both working conditions. The final-score data of the two working conditions are shown in Table 10. It can be seen from Table 10 that the comprehensive performance is reduced under the action of crosswind, and the crosswind has a great influence on the stability characteristics.
As communicated by the above analysis, when the crosswind direction changes, the movement track of the car has a tendency to go back, but the horizontal offset continues to increase. The car’s roll angle velocity and crosswind angle velocity in the same side of the monsoon period reached the maximum value. If the driver has improper operation, the car will leave the track, and the car’s stability will be affected severely.

5. Modification of Aerodynamic Characteristics

The aerodynamic and dynamics system of the FSAE racing car were joint simulated to explore the influence of different aerodynamic conditions on the handling stability of the racing car, and the performance indexes of the racing car under each working condition were evaluated and analyzed. The car model of the study was defined as base car, and the problem that aerodynamic parameters of the car fluctuated greatly when the body attitudes changed in the joint simulation of base car was summarized and analyzed. The aerodynamic parameters of the vehicle were adjusted built on the pitch angle of FSAE car based on the handling stability, and the dynamics simulation verification of the adjusted car was conducted to explore the influence of aerodynamic modification on the vehicle performance. After the modification plan was determined, the aerodynamic parameters after modification were analyzed and evaluated to explore the influence of each aerodynamic component on the aerodynamic coefficient. Finally, the aerodynamic parameters were allocated to each aerodynamic component of the racing car to obtain the downforce interval of the aerodynamic component of the adjusting plan, which provides guidance and suggestions for the design of the aerodynamic component of the racing car.

5.1. Aerodynamic Force Modification

Based on the aerodynamic force of the base car to analyze and adjust, the aerodynamic torque parameters remain unchanged. The pitch angle of the FSAE car varies from −2.0° to 1.0° in the process of movement. Figure 19 shows the curves of the lift coefficient, drag coefficient and lift-to-drag ratio of the car. In order to more intuitively display the variation trend of aerodynamic coefficient, the drag coefficient in Figure 19 is the negative of the simulation data.
Through Figure 19, with the decrease of pitch angle, the aerodynamic drag increases gradually, and the aerodynamic downforce coefficient increases first and then decreases. The lift–drag ratio curve reaches the extreme value of −1.888 when the pitch angle is −1.0°. The lift–drag ratio is defined as the ratio of lift coefficient to drag coefficient, and its calculation formula is shown in Equation (6):
S = L D = C l C d
According to the above formula, the lift-to-drag ratio can reflect the aerodynamic efficiency of the car. Under a certain downforce, the larger the lift-to-drag ratio is, the higher the aerodynamic efficiency of the vehicle is, and this is also the ultimate goal of aerodynamic design of FSAE racing car. Therefore, in the pitch angle range, the aerodynamic characteristics and aerodynamic efficiency are the best when the pitch is −1.0°.
After the optimal pitch angle of the aerodynamic efficiency of the car in the pitching range is obtained, the aerodynamic parameters are adjusted. After the modification, the working condition of the car is the base car that the pitch angle is −1.0; this plan is defined as modification play 1, and the aerodynamic parameters of the car after modification are shown in Figure 20.
According to Figure 20, after adjusting the aerodynamic parameters in pitch condition, the aerodynamic efficiency of the car is the best in the basic condition, indicating that the aerodynamic characteristics of the car remain in the best state most of the time in the driving process.
The influence of the adjusted aerodynamic parameters on the handling stability is verified by dynamics simulation. The speed-change interval of the car in the figure-eight surround project is small; under this condition, the test is the ultimate cornering speed of the car and the anti-roll ability of the car. When the aerodynamic downforce generated by the aerodynamic device acts on the tire, the ground lateral reaction force and tangential reaction force of the car wheel are increased, the ultimate lateral acceleration of the car is increased and the time of the figure-eight surround is shortened. Therefore, aerodynamic characteristics have a crucial impact on the figure-eight surround. The figure-eight surround layout is shown in Figure 21.
In this simulation, the radius of the figure-eight surround track is 10.625 m, and the road friction coefficient is set as 1.0. The test stops when the car passes the track smoothly. In order to simplify the test, closed-loop automatic shift control is adopted in this simulation. In steering control, 0.15 s pre-sighting steering is adopted. The longitudinal speed of the car is the same, 48.9 km/h.
Figure 22 and Figure 23 are the comparison curves of figure-eight surround simulation track route, aerodynamic force and steering-wheel angle before and after adjusting aerodynamic parameters. In Figure 22, the racing contrast curve can be seen; when two simulations of longitudinal velocity are 48.9 km/h, the basic condition of the car in the 7.975 s, the car pulls off the track and the simulation ends; after adjusting the aerodynamic parameters in pitch condition, the figure-eight surround simulation can be successfully completed under the same dynamic parameters and longitudinal velocity. According to the aerodynamic force comparison curve of the car in Figure 23, neither of the two simulated cars left the track in the first 7.0 s. Compared with the base condition, the aerodynamic parameter plan of the car under the pitch condition significantly improved the downforce of the car, with the maximum value of −303.364 N. Compared with the base condition, the downforce of the car increased by 8.56%. The drag of the adjusted plan is lower than the base condition, so the lift-drag ratio of the adjusted plan is much higher than the base condition, and the aerodynamic efficiency and aerodynamic characteristics of the adjusted plan are better than the base condition. It can be seen from the steering-wheel-angle curve that the steering-wheel-angle curves of the two simulations basically overlapped before 6.0 s, thus indicating that the aerodynamic parameter modification plan has little influence on the driver. When the car is actually running and the driver has similar skills, the performance of the car will be greatly improved.
According to the analysis and simulation, when the aerodynamic parameters are adjusted, the ultimate cornering speed of the car is improved when the dynamics parameters of the car are the same, the car of figure-eight surround project can drive at a faster speed on the track and the time is reduced.

5.2. Aerodynamic Torque Modification

Based on the modification of aerodynamic parameters, the aerodynamic torque parameters of the car are further adjusted. As can be seen from Figure 15, when there is no crosswind action, the yaw moment and roll moment of the dynamic simulation car are both 0, so only the pitching moment of the car is adjusted in this section. Figure 24 is the comparison curve of the pitching moment coefficient modification.
It can be seen from Figure 24 that two pitching moment coefficient adjustment plans with different understeering characteristics are proposed based on base conditions, and the understeering characteristics of Modification Plan 2 are slightly greater than that of Modification Plan 3. The coefficient fluctuation of the two plans is less than that of the base condition. The basic body attitude of the car is the best attitude of the aerodynamic characteristics of the car. The coefficient fluctuation of different pitching angles is small, the comprehensive adaptability of the car is stronger and the sensitivity is lower.
The influence of the adjusted aerodynamic torque parameters on the handling stability of the car was verified. In this simulation, the longitudinal speed of the car with different modification plans is the same, which is 49 km/h, and the speed increases by 0.1 km/h. Figure 25 shows the comparison curve between the pitching moment of the car adjusted by the pitching moment coefficient and the steering-wheel angle.
It can be seen from the curve of the steering-wheel angle that, when the car runs at a longitudinal speed of 49 km/h, the car in base condition rolls over at 7.975 s, and the car in Modification Plan 2 rolls off the track at 8.775 s. The simulation of Modification Plan 3 is successfully completed. Through the simulation, it can be seen that the limit cornering speed of the car in the base condition of the figure-eight surround simulation is less than 49 km/h. The car in Modification Plan 2 still drives off the track but runs 0.8 s more than that in the base condition, while the simulation of Modification Plan 3 is successfully completed. It can be seen from the curve of pitching moment comparison that the pitching moment of Modification Plan 3 is the smallest, but it is still negative, which indicates that, the greater the degree of understeer in the figure-eight surround condition, the worse the passing performance of the car, but the oversteer will still have a poor impact on the car, and the driver’s correction of the car will become worse.
The comprehensive analysis of the curves shows that the ultimate cornering speed of the car is further improved under the condition that the dynamics parameters and aerodynamic parameters of the car are the same after the modification of aerodynamic torque parameters, but the increase is less than that of the car after the modification of aerodynamic parameters.
In order to further explore the influence of modification of aerodynamic torque parameters on the handling stability of the car, the fixed closed-loop snaking test simulation was carried out for Modification Plan 2 and Modification Plan 3, and the longitudinal speed of the car is 65 km/h. Figure 26 shows the simulation steering-wheel angle and difference curve of snaking test adjusting pitching moment parameters.
It can be seen from the curve for the steering-wheel angle that the peak values of steering-wheel angle of Modification Plan 2 and Modification Plan 3 are both smaller than the base condition. According to the difference curve, the peak value of the steering-wheel angle of Modification Plan 3 is the smallest, and the maximum difference between Modification Plan 3 and base condition is 0.5756°, which indicates that other parameters of the car remain unchanged in the serpentine closed-loop test, the steering-wheel angle is reduced and the driver operates more conveniently after the modification of aerodynamic torque.
When the dynamics parameters of the car are the same, the ultimate cornering speed is increased slightly, the steering-wheel angle of the snaking test is reduced and the handling performance of the car is improved when other parameters remain unchanged.

5.3. Final Modification Plan

The aerodynamic parameter plan under the final modification pitching condition was analyzed by using dynamic simulation, and the car before modification was compared. Dynamics simulation is the figure-eight surround condition of FSAE race, the longitudinal speed of the car in base condition is 48 km/h and the modification plan is 49 km/h.
Figure 27 and Figure 28 show the comparison curves of aerodynamic force, steering-wheel angle, roll angle velocity and lateral acceleration before and after aerodynamic parameters under different pitch modification conditions. As can be seen from Figure 27, when the driving speed of the car is reduced by 1 km/h, the aerodynamic downforce in base condition is far less than that of the adjusted car, and the maximum difference of downforce is 29.05% of the pressure in base condition. As the wind speed decreases, the drag of the car in base condition is slightly less than that of the adjusted car. The aerodynamic force of the car fluctuates significantly in 0–2.0 s and 6.0–8.0 s. The aerodynamic force fluctuation of the car in 0–2.0 s is caused by the unstable speed control of the car in the initial stage. It can be seen from the steering-wheel-angle curve that the steering-wheel angle of the car around 6.0 s is close to 400° in a short time, and the car enters the right circle from the left circle; the aerodynamic force fluctuates slightly, due to the change of body attitude. According to the analysis of the roll-angle-velocity curve in Figure 28, the car body’s roll angle fluctuates significantly in the three stages of the car that include turning into the left lap, entering the right lap from the left lap and turning back out of the right lap. The adjusted car’s transient response is relatively rapid. The roll-angle-speed curve shows that the car tires with the ground appeared near 8.0 s brief separation after the modification. Since the longitudinal velocity is greater than that in base condition, when the car starts to turn, the lateral acceleration of the car after adjusting the aerodynamic parameters in pitch condition is greater than that in base condition.
Table 11 shows the comparison data of performance parameters of the figure-eight surround simulation before and after adjusting aerodynamic parameters in pitching condition. According to the comprehensive analysis of the curve and Table 11, after adjusting the aerodynamic parameters under pitching condition, the speed of the car’s figure-eight surround is increased by 1 km/h, and the downforce of the race car is increased by −53.693 N around 6.0 s; the difference is about 21.50% of the base race car’s downforce. The lateral acceleration of the car increases by 0.25 g at 4.0 s, and the increased lateral acceleration is about 15.11% of the base car’s lateral acceleration. Finally, after modifying the aerodynamic parameter scheme under pitching condition, the simulation time of the racing car is 11.3 s and the base condition is 11.825 s. After adjusting the aerodynamic parameters under pitching condition, the running time of the racing car is shortened by 0.525 s, about 4.40% of the total time. After adjusting the aerodynamic parameters under pitching condition, under the same dynamic parameters of racing car, the overall performance of the car is greatly improved.
In this section, after the analysis and study of the racing car with the aerodynamic parameters adjusted under the pitching condition, it can be known that the aerodynamic downforce of the whole vehicle increases by 11.39%, the drag decreases by 2.85%, the lift-to-drag ratio increases by 14.70% and the pitching moment decreases by 82.34%.

6. Conclusions

This study took the FSAE racing car of Jilin University as the research object. It combined the wind-tunnel test for the racing car, aerodynamic numerical simulation of the simplified model of the racing car and dynamics simulation of the racing car system; established the aerodynamic closed-loop design process of the FSAE racing car; and realized the joint research on aerodynamic characteristics and handling stability of the racing car in different body attitudes. The conclusions are summarized as follows:
(1)
As the pitch conditions of body attitude change, the vehicle aerodynamic characteristics undergo great changes: pitch racing drag under the condition of less change, least drag when the body forward 2.0°, maximum drag when the body back is 1.0°, body leaning forward negative lift is the largest, 1.0° in the car body back 0.5° in the least stressed nowadays and body leaning forward 1.0° vehicle lift-to-drag ratio is the largest. The aerodynamic efficiency was the highest, and the lift-drag ratio was the lowest when the body reclined 0.5°. By comparing the pressure cloud diagram, it can be seen that the aerodynamic characteristics of the vehicle change due to the change of the ground clearance of the front wing and tail wing after the body attitude change and the interaction between the aerodynamic components, thus indicating that the aerodynamic components have a great impact on the aerodynamic characteristics of the vehicle.
(2)
Through the simulation of crosswind condition, when the crosswind angle β is between 0° and 40°, the aerodynamic characteristics of the car are significantly reduced, but additional downforce can still be generated. The aerodynamic suite can improve the handling stability of the car. When the crosswire angle β is greater than 40°, the aerodynamic suite of the car fails. A crosswind angle β with 0°~40° can be regarded as the effective working range of racing aerodynamic kit under crosswind. Three representative crosswind deflection angles were selected in this paper to analyze and study the vehicle outflow field structure.
(3)
The aerodynamic parameters obtained from the numerical simulation were input into the dynamics model. Under the action of crosswind snaking test simulation, the results show that the aerodynamic lift and lateral force with the crosswind input generate step change, aerodynamic drag is relatively small, the influence of the aerodynamic yawing moment has the biggest change and the change of the car’s aerodynamic pitching moment is small. When the aerodynamic yaw moment reaches the peak value, the aerodynamic pitching moment and aerodynamic yaw moment are at the minimum. Under the crosswind effect, the car deviates from the predetermined track, and the lateral offset far exceeds the safety limit. The aerodynamic lateral force and yaw moment under the action of crosswind have a great influence on the handling stability of the car. When the driver encounters strong crosswind during driving, the car will leave the track if the operation is improper, and the stability of the car will be seriously affected.
(4)
After completing the modification of aerodynamic force, the results show that the critical cornering speed of the FSAE car is improved after the aerodynamic force adjustment. After completing the aerodynamic torque modification, the ultimate cornering speed is increased slightly under the condition of the same dynamics parameters of the car, the steering-wheel angle of the snaking test is reduced and the handling performance of the car is improved. In the final aerodynamic modification plan under the final modification pitching condition, the aerodynamic downforce of the whole car is increased by 11.39%, aerodynamic drag is reduced by 2.85%, lift-to-drag ratio is increased by 14.70% and pitching moment is reduced by 82.34%. The aerodynamic characteristics and aerodynamic efficiency of the car are significantly improved, and the aerodynamic performance of the car is greatly improved. The running time of the figure-eight surround test car is shortened by 0.525 s, about 4.40% of the total time, thus proving that aerodynamic modification can improve the handling stability of the car, and the overall performance of the car can also be greatly improved.

Author Contributions

Conceptualization, Y.Z. and Z.Z.; methodology, Z.Z. and S.S.; software, Q.W. and S.S.; validation, Z.Z.; formal analysis, Z.Z.; investigation, Y.Z.; resources, Z.Z.; data curation, S.S.; writing—original draft preparation, Q.W.; writing—review and editing, Q.W.; visualization, Q.W. and Z.Z.; supervision, Y.Z.; project administration, Y.Z.; funding acquisition, L.R. and C.Z. All authors have read and agreed to the published version of the manuscript.

Funding

This research was funded by National Key Research and Development Program of China (Grant No. 2018YFA0703300) and National Natural Science Foundation of China through (Grant No.11772140 and 11702109).

Data Availability Statement

Not applicable.

Conflicts of Interest

The authors declare no conflict of interest.

References

  1. Qiao, J. Formula SAE of China. Automot. Eng. 2012, 2, 146. [Google Scholar]
  2. Katz, J. Aerodynamics of race cars. Annu. Rev. Fluid Mech. 2006, 38, 27–63. [Google Scholar] [CrossRef] [Green Version]
  3. Al Muharrami, M.S.; Almousa, S.M.; Almutairi, A.F.M. Study of Open and Closed Wheels Aerodynamics of Racing Cars in Wind Tunnels with Movable Ground at Different Car Speeds. In Proceedings of the 18th Australasian Fluid Mechanics Conference Launceston, Launceston, Australia, 3–7 December 2012. [Google Scholar]
  4. Hetawal, S.; Gophane, M.; Ajay, B.K.; Mukkamala, Y. Aerodynamic Study of Formula SAE Car. Procedia Eng. 2014, 97, 1198–1207. [Google Scholar] [CrossRef] [Green Version]
  5. Craig, C.; Passmore, M.A. Methodology for the Design of an Aerodynamic Package for a Formula SAE Vehicle. SAE Int. 2014, 7, 575–585. [Google Scholar] [CrossRef] [Green Version]
  6. Weingart, R. On-Track Testing as a Validation Method of Computational Fluid Dynamic Simulations of a Formula SAE Vehicle. Master’s Thesis, The Graduate Faculty of the University of Kansas, Lawrence, KS, USA, 2015. [Google Scholar]
  7. He, H. Research on Crosswind Stability and Control Strategy of FSAE Racing Car; Harbin Institute of Technology: Harbin, China, 2017. [Google Scholar]
  8. Lu, X. Research on the Flow Field around a Formula SAE Car. SAE Tech. Pap. 2015, 26, 208. [Google Scholar]
  9. Zhang, Y.; Yang, C.; Wang, Q.; Zhan, D.; Zhang, Z. Aerodynamics of Open Wheel Racing Car in Pitching Position. SAE Tech. Pap. 2018, 1, 729. [Google Scholar]
  10. Wąsik, M.; Skarka, W. Aerodynamic Features Optimization of Front Wheels Surroundings for Energy Efficient Car. Adv. Transdiscipl. Eng. 2016, 4, 483–492. [Google Scholar]
  11. De Vita, A.; di Angelo, L.; Andreassi, L.; Romagnuolo, S. CFD-Aided Design of an Airbox for Race Cars. SAE Tech. Pap. 2002, 1, 2167. [Google Scholar]
  12. Li, J.; Zhang, Z.; Zhang, Y.; Jiang, Z. Research on Effects of Crosswind on Handling and Stability of Vehicle with High Speed. SAE-China 2010, 172, 1380–1383. [Google Scholar]
  13. Carbonne, L.; Winkler, N.; Efraimsson, G. Use of Full Coupling of Aerodynamics and Vehicle Dynamics for Numerical Simulation of the Crosswind Stability of Ground Vehicles. SAE Int. J. Commer. Veh. 2016, 9, 359–370. [Google Scholar] [CrossRef]
  14. Jia, L.J.; Han, Z.H.; Li, G. Simulation Study of FSC Racing Car Modeling and Handling Stability Based on CarSim. J. Liaoning Univ. Technol. (Nat. Sci. Ed.) 2015, 35, 172–176. [Google Scholar]
  15. Huang, T.M.; Gu, Z.-Q.; Chen, Z.; Wen, Q.; Luo, Z.-X. Influence of Vehicle Body in Pitching Motion on Aerodynamic Lift Force. China J. Highw. Transp. 2017, 30, 150–158. [Google Scholar]
  16. Guerrero, A.; Castilla, R. Aerodynamic Study of the Wake Effects on a Formula 1 Car. Energies 2020, 13, 5183. [Google Scholar] [CrossRef]
  17. An, Y. Research on the Aerodynamic Drag Reduction of the Passenger Car based on Rear Accessories; Jilin University: Changchun, China, 2012. [Google Scholar]
  18. Cheng, S.Y.; Tsubokura, M.; Nakashima, T.; Okada, Y.; Nouzawa, T. Numerical quantification of aerodynamic damping on pitching of vehicle-inspired bluff body. J. Fluids Struct. 2012, 30, 188–204. [Google Scholar] [CrossRef] [Green Version]
  19. Martins, D.; Correia, J.; Silva, A. The Influence of Front Wing Pressure Distribution on Wheel Wake Aerodynamic of a F1 Car. Energies 2021, 14, 4421. [Google Scholar] [CrossRef]
  20. Zhu, Z.-W. Feasibility Investigation on Prediction of Vortex Shedding of Flat Box Girders Based on 2D RANS Model. China J. Highw. Transp. 2015, 28, 24–33. [Google Scholar]
  21. Cao, H. Optimization of Aerodynamic Drag Reduction for Flat-head Commercial Vehicles considering the Influence of Crosswind; Jilin University: Changchun, China, 2020. [Google Scholar]
  22. Jessing, C.; Stoll, D.; Kuthada, T.; Wiedemann, J. New horizons of vehicle aerodynamics. Proc. Inst. Mech. Eng. Part D J. Automob. Eng. 2017, 231, 1190–1202. [Google Scholar] [CrossRef]
  23. GB/T 6323-2014; Automotive industry standard. Controllability and Stability Test Procedure for Automobile Snaking Test. AQSIQ: Beijing, China, 2014.
  24. QC/T 480-1999; Automotive industry standard. Criterion Thresholds and Evaluation of Controllability and Stability for Automobiles. State Machinery Industry Bureau: Beijing, China, 1999.
Figure 1. Simplified racing model.
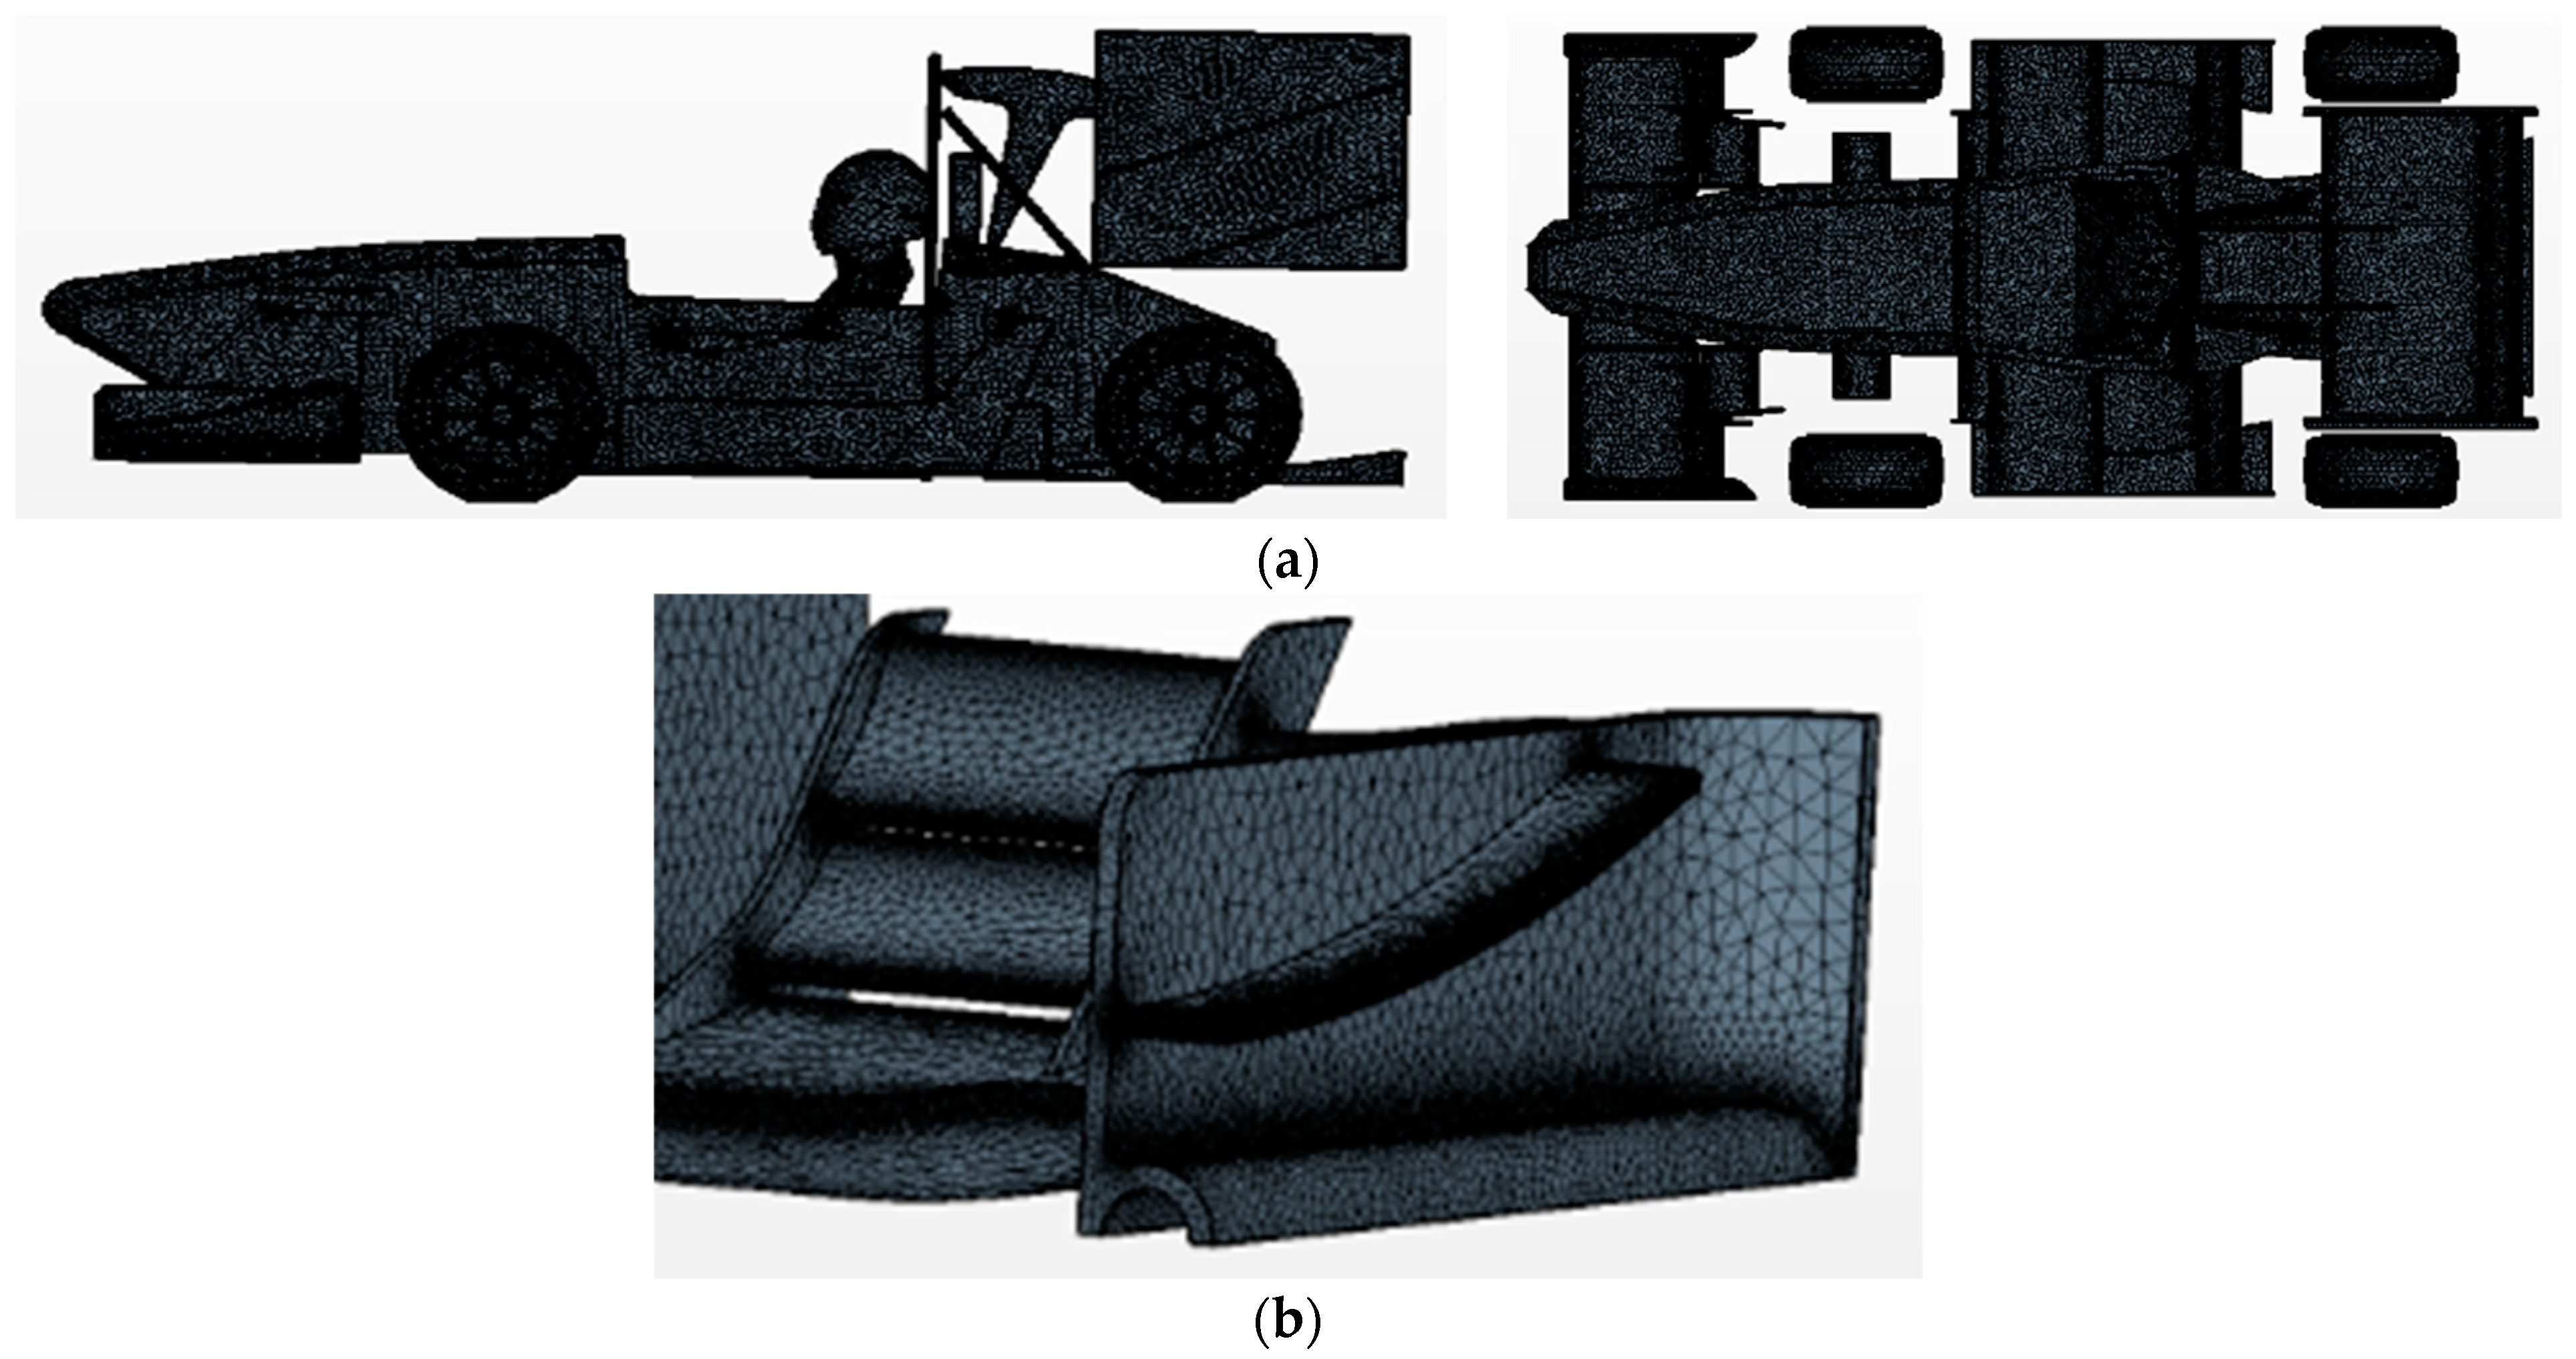
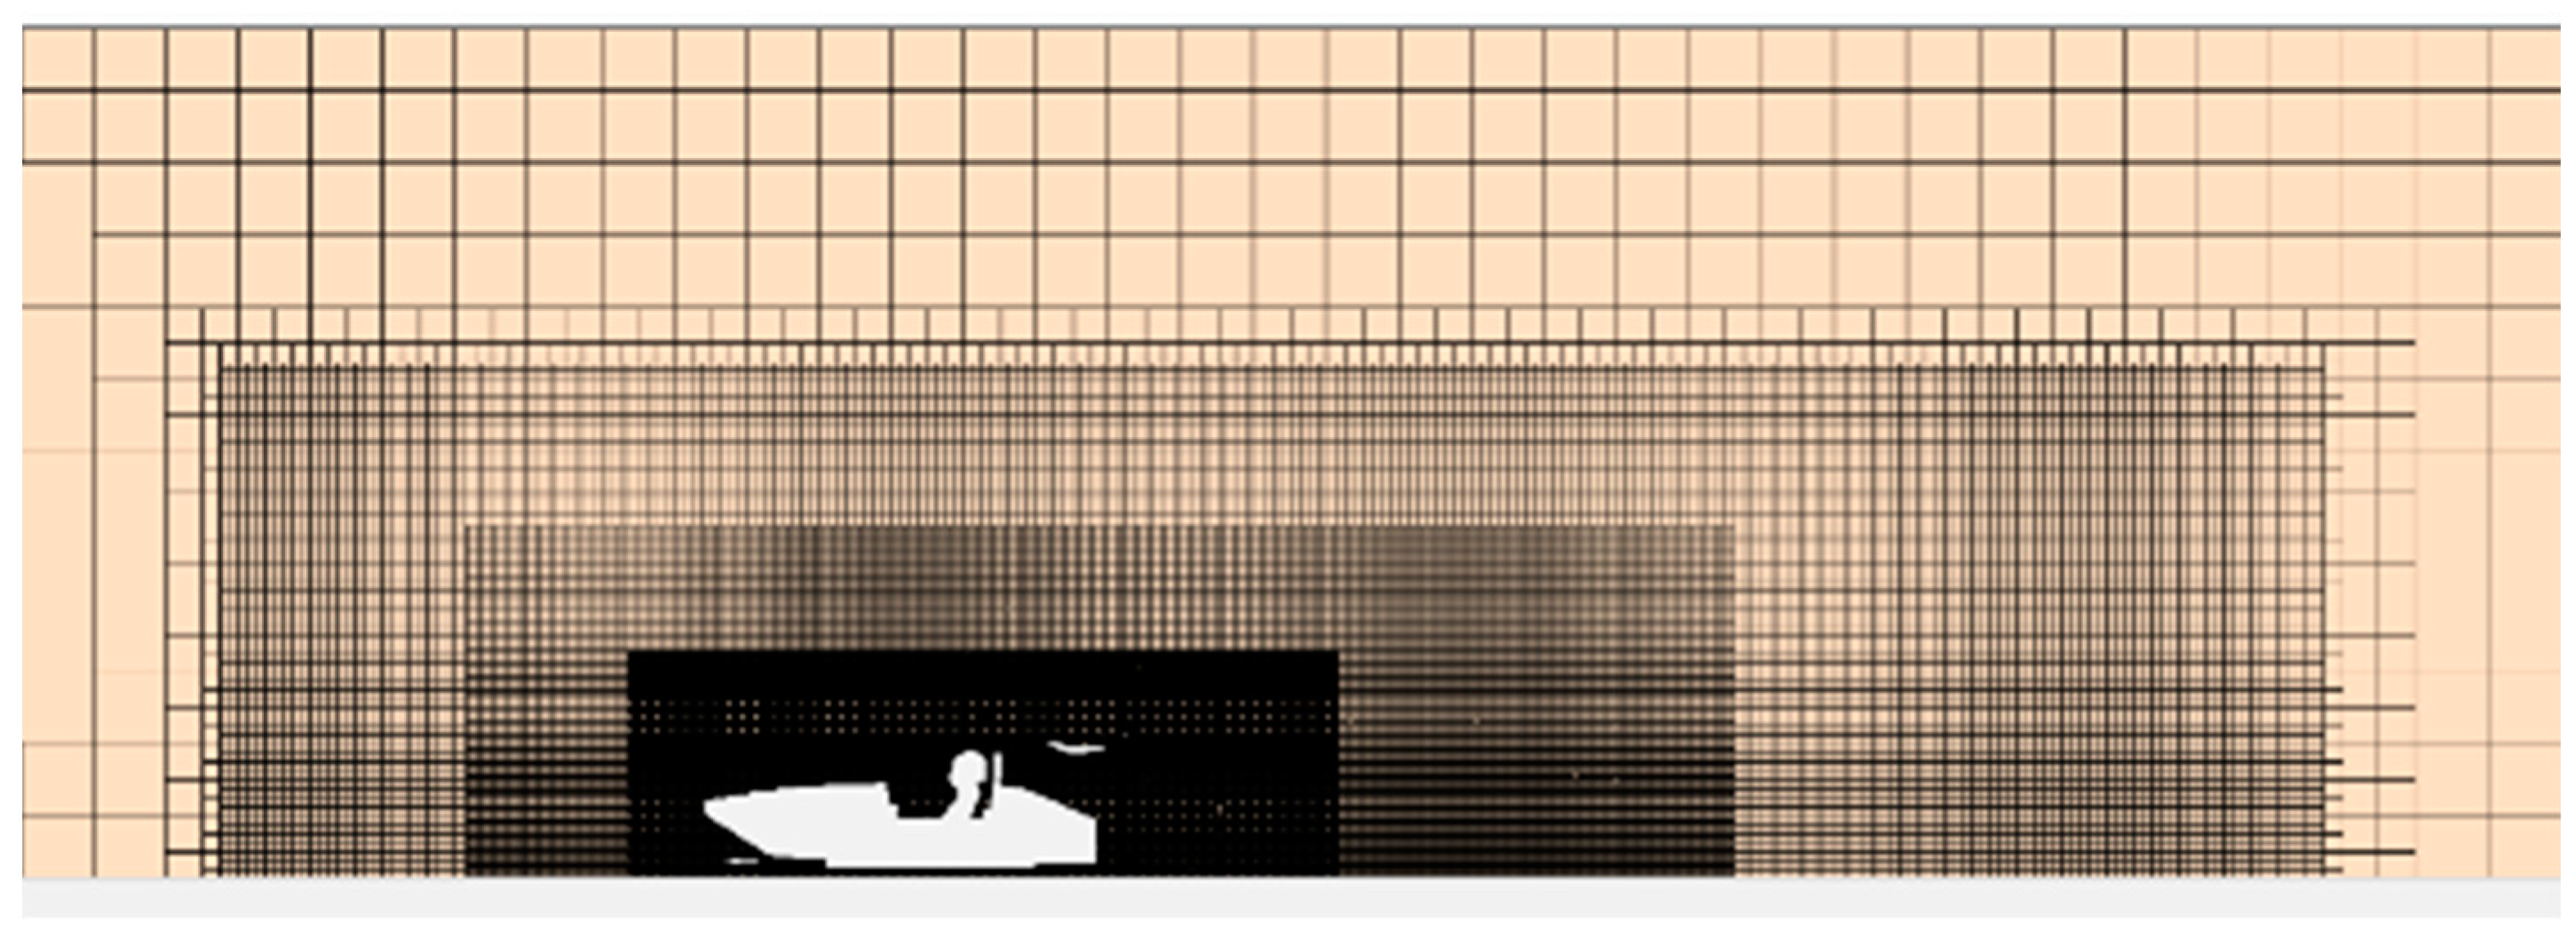
Energies 15 00393 g001
Figure 2. Surface mesh and local detail surface mesh of simplified racing model: (a) vehicle surface grid and (b) front wing local surface mesh.
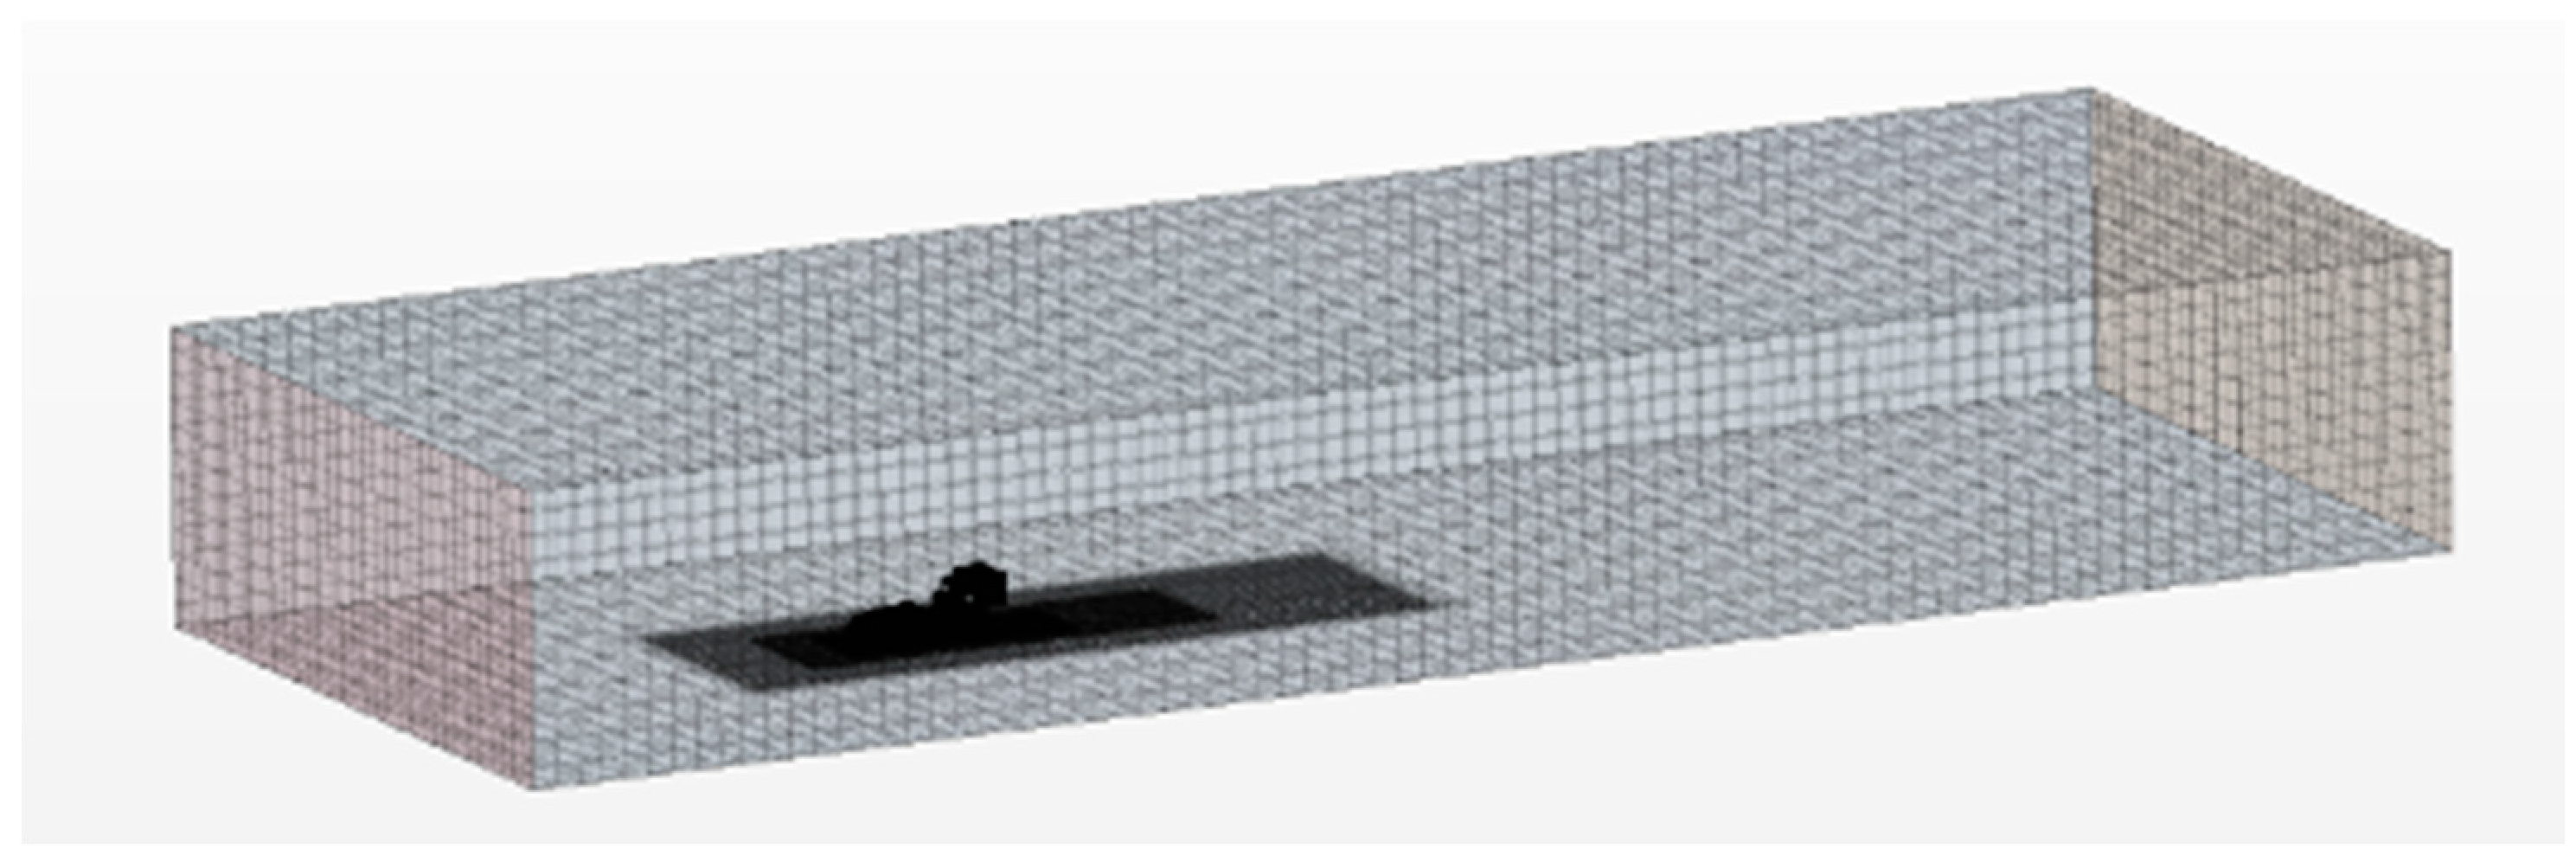
Energies 15 00393 g002
Figure 3. Volume mesh encryption domain.
Energies 15 00393 g003
Figure 4. Encrypted computing domain.
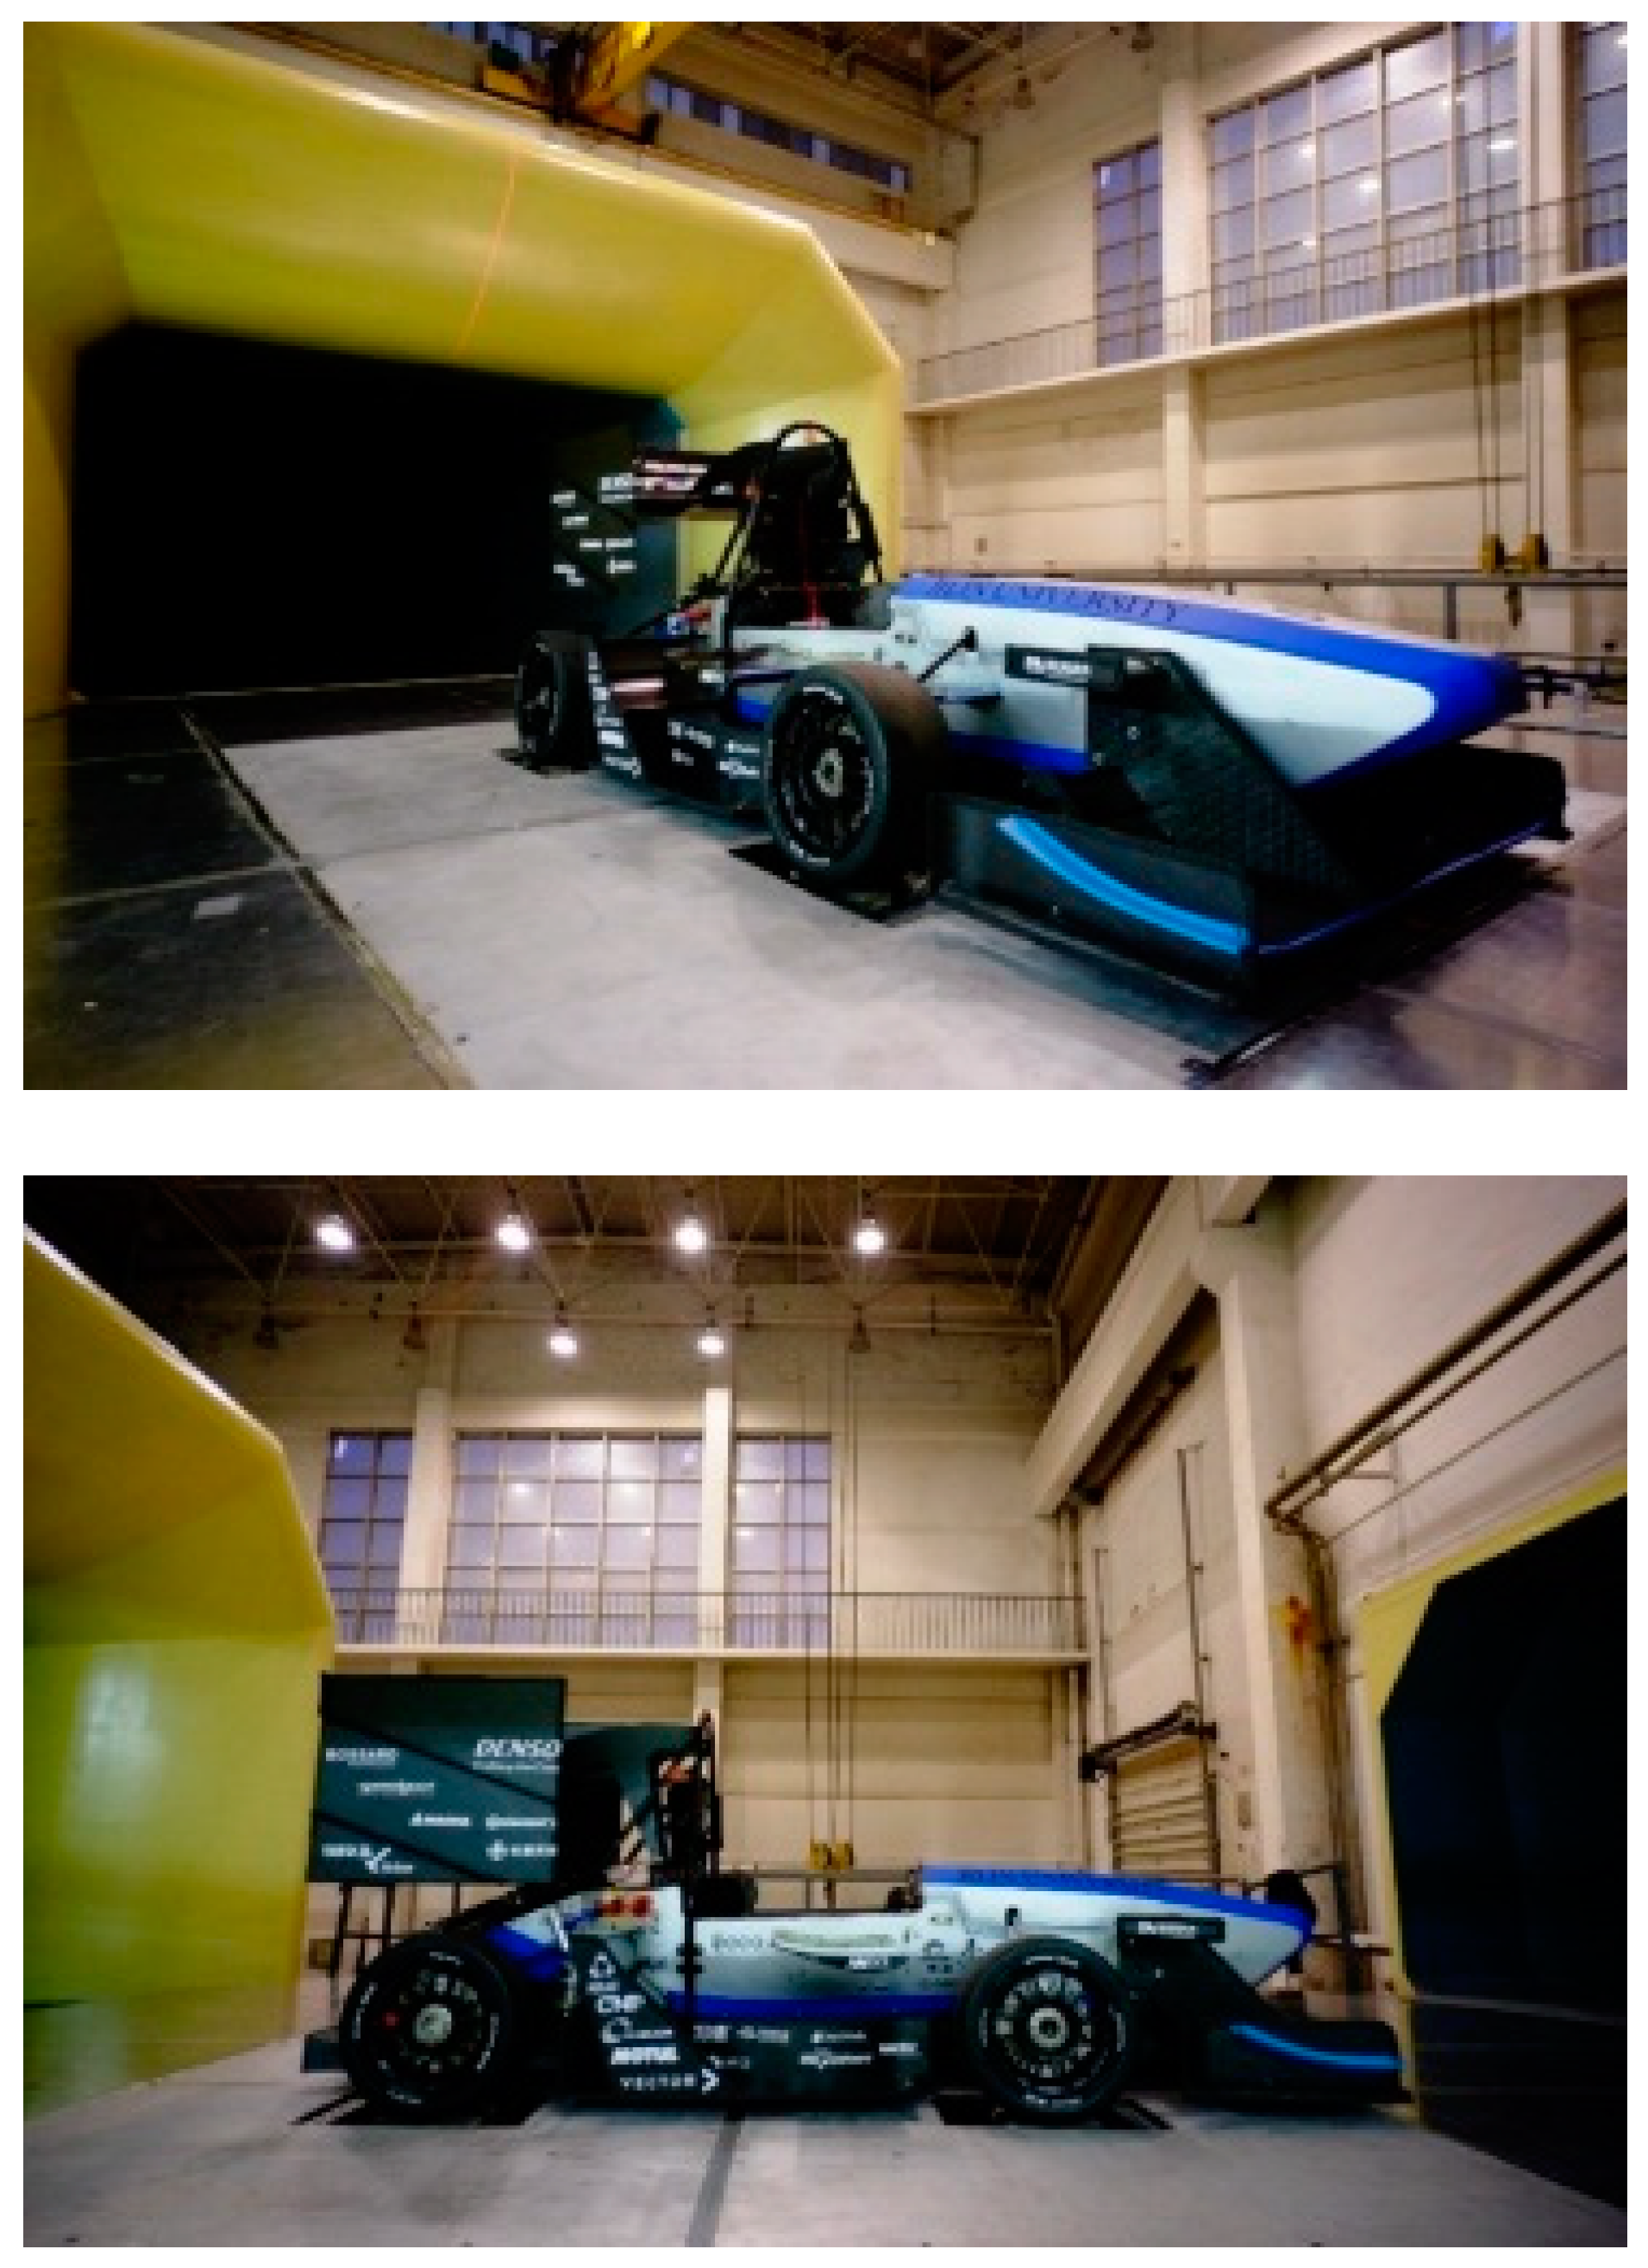
Energies 15 00393 g004
Figure 5. FSAE racing car of Jilin University.
Energies 15 00393 g005
Figure 6. Lifting drag characteristic curve at 15–30 m/s wind velocity in straight-line condition.
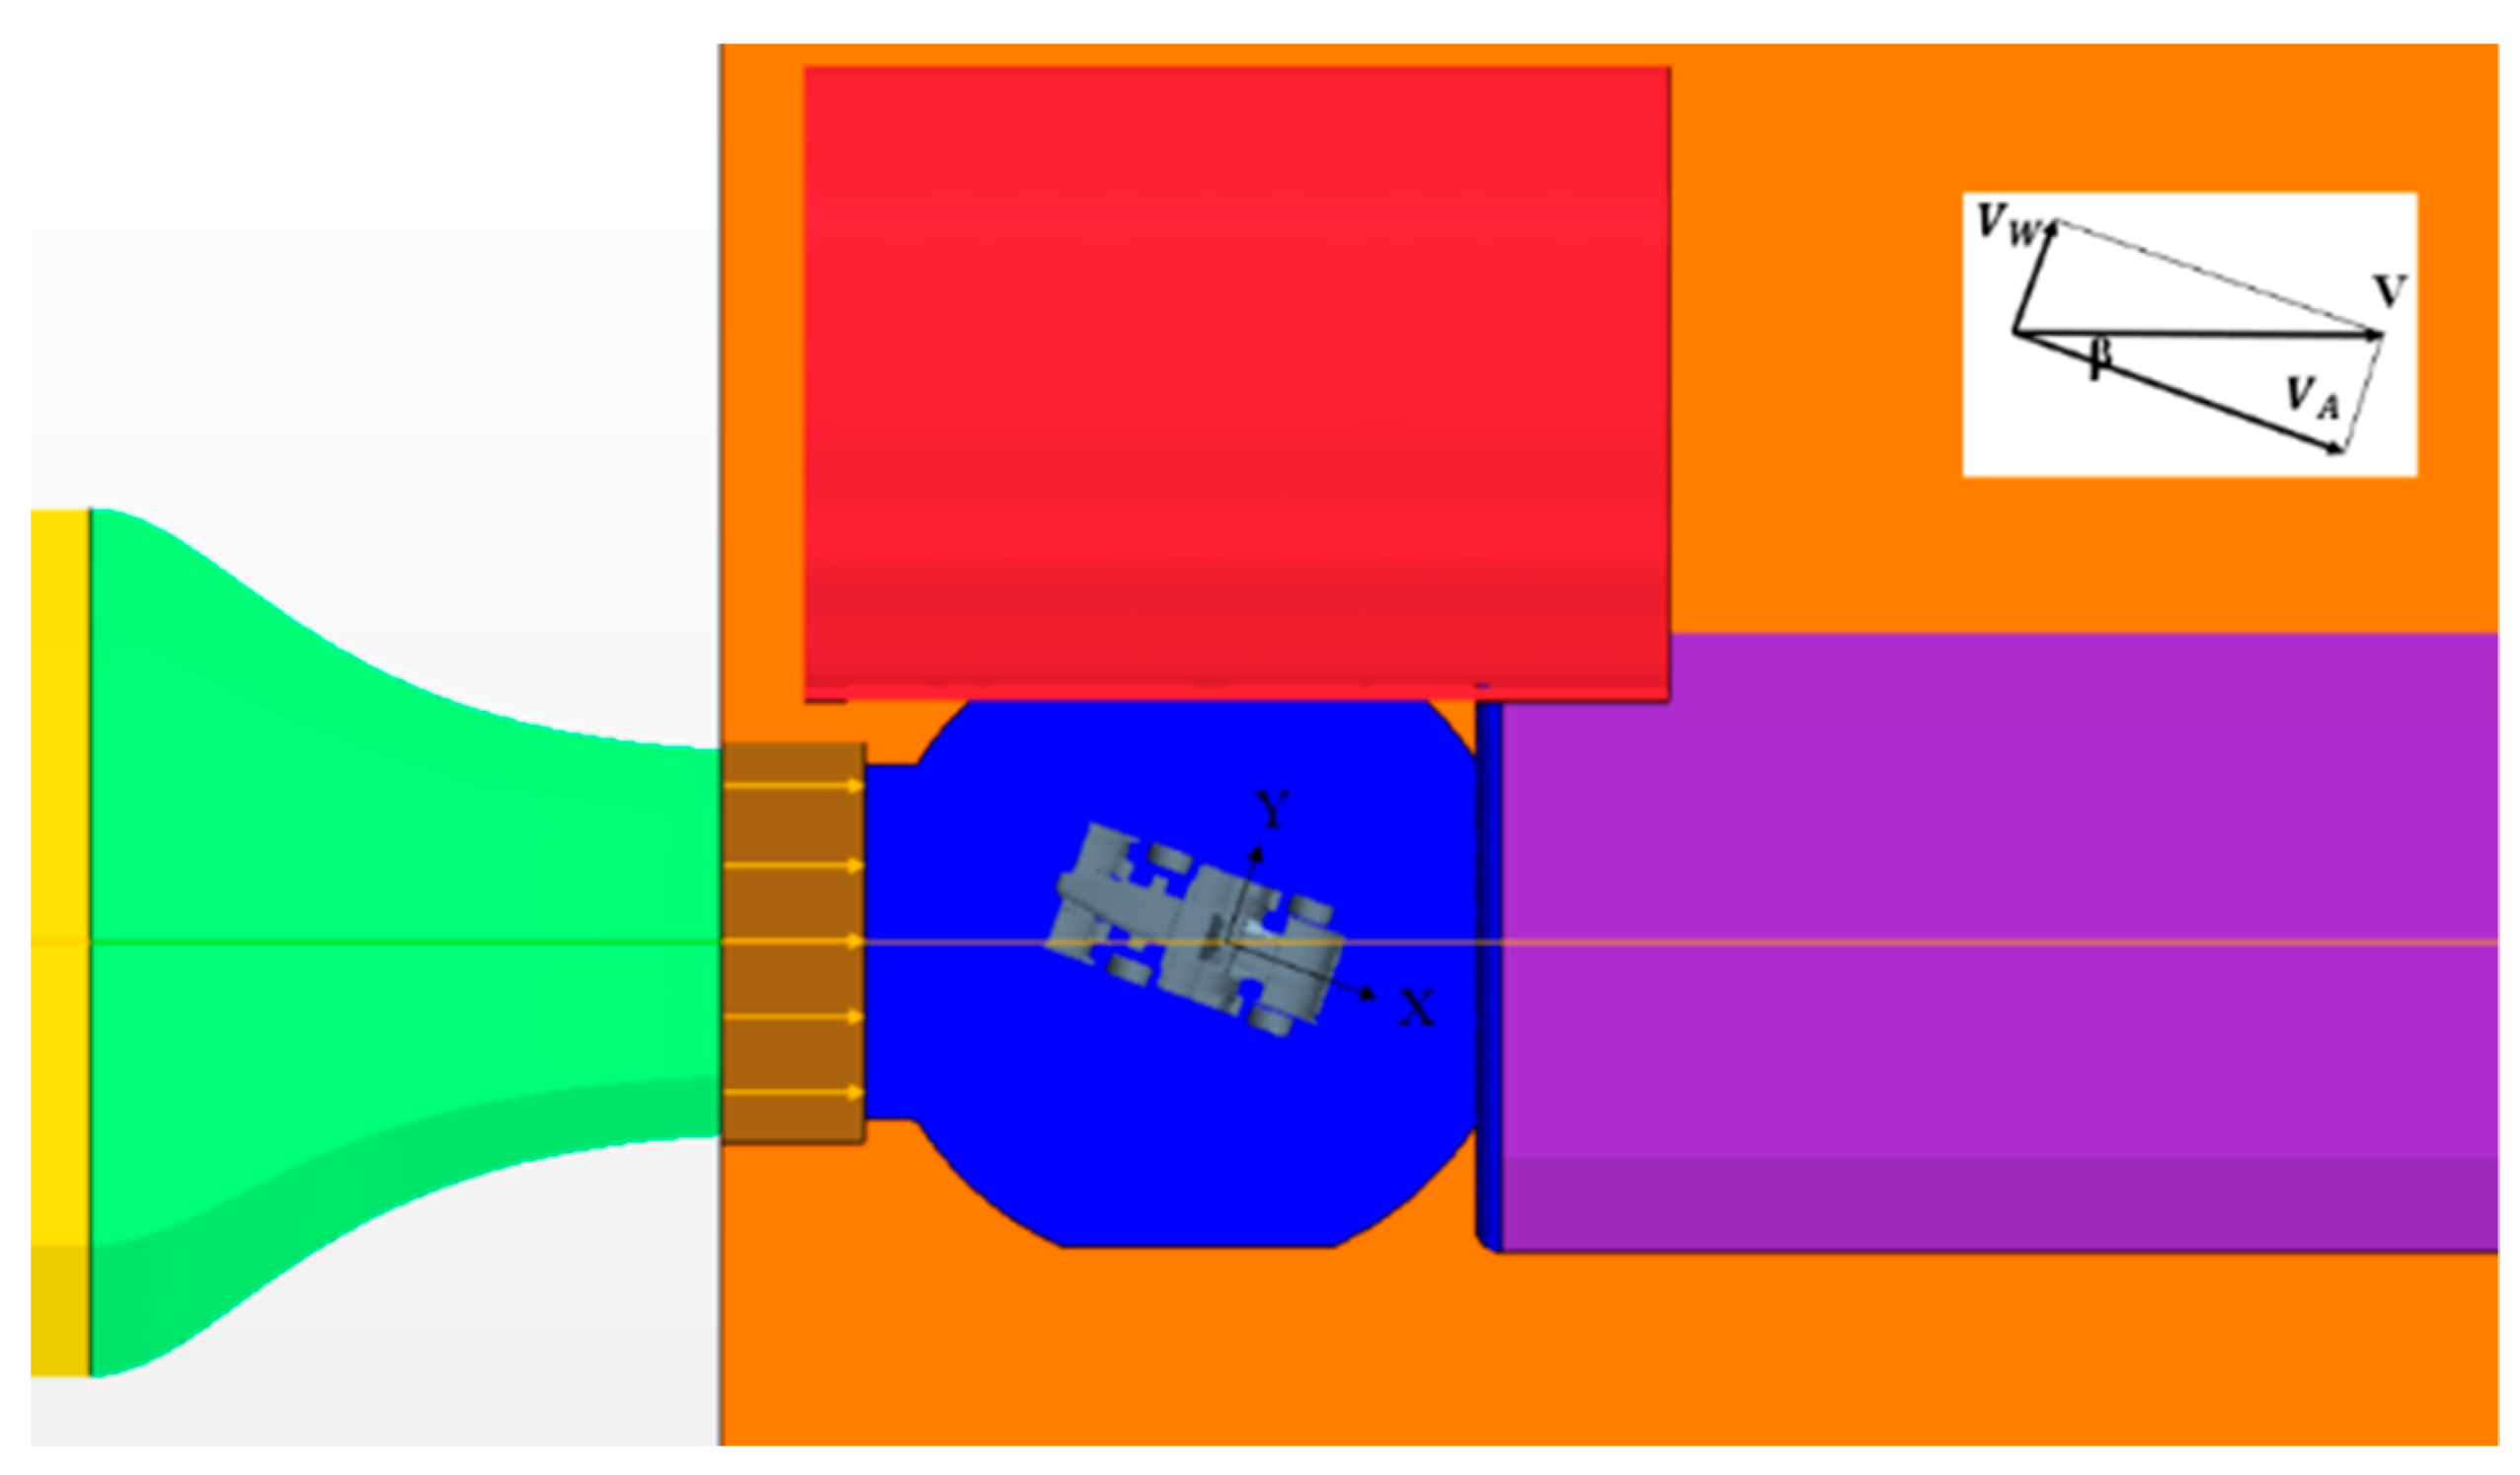
Energies 15 00393 g006
Figure 7. Yaw model method for wind tunnel test.
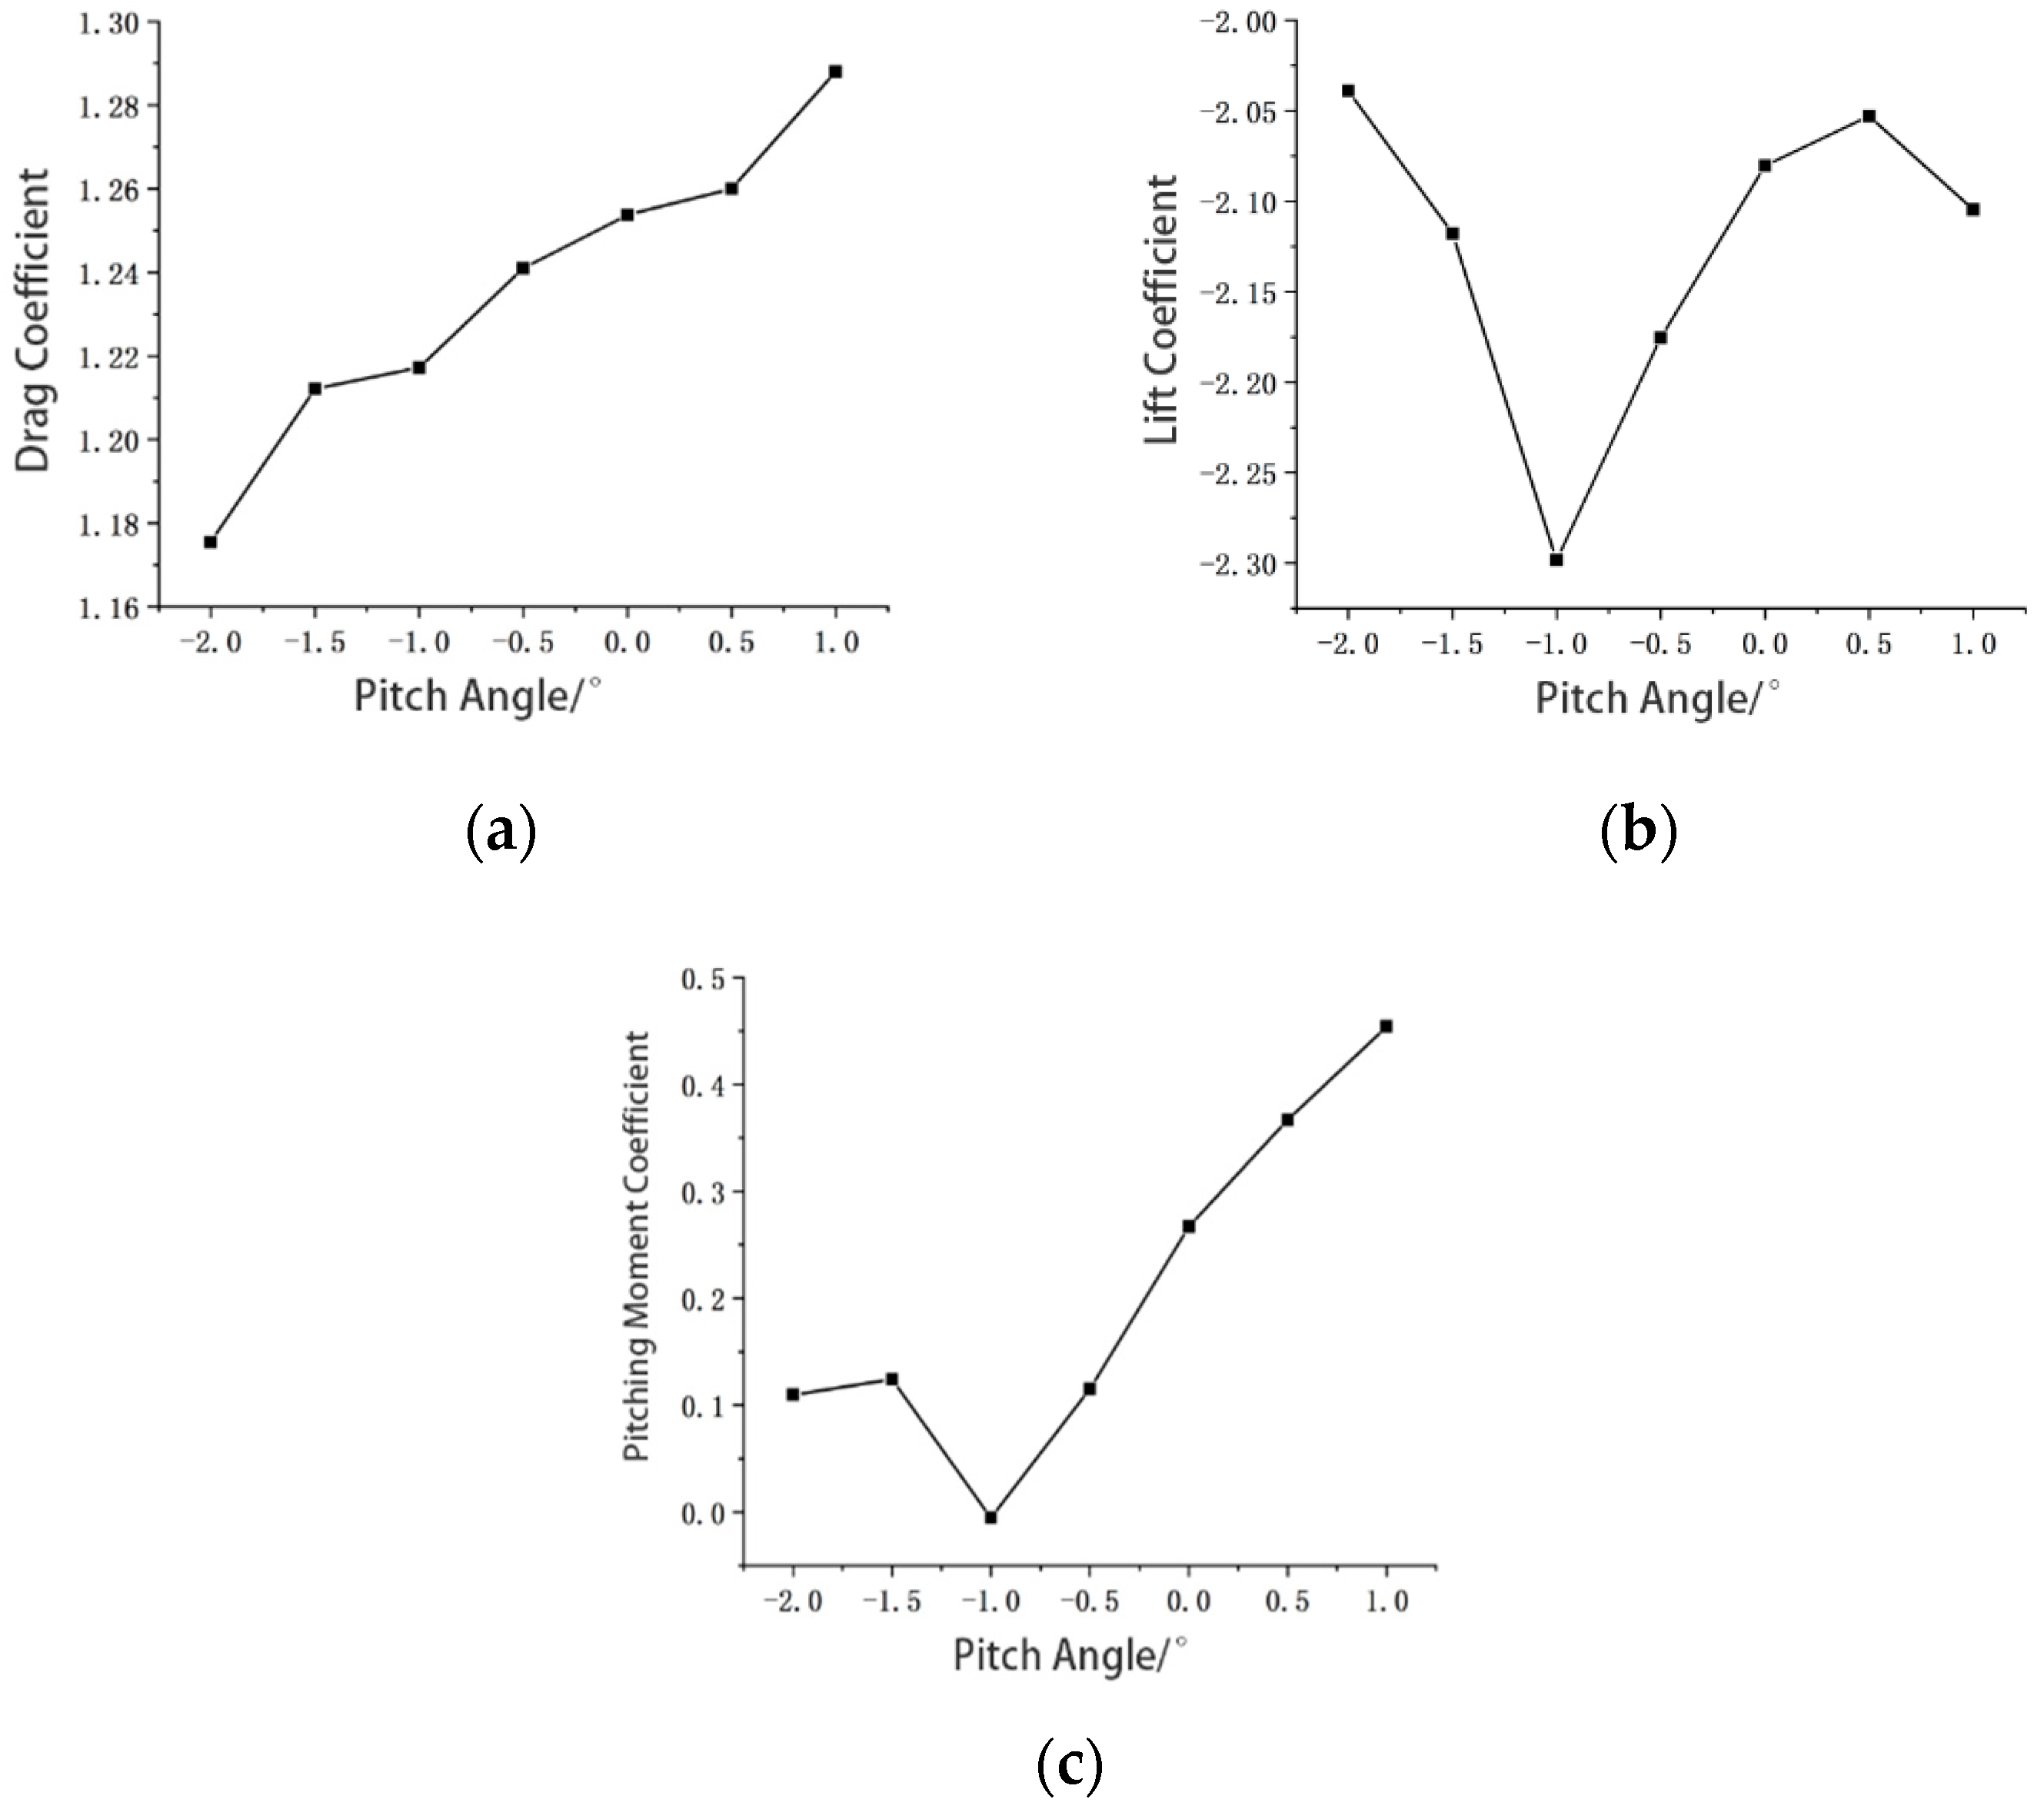
Energies 15 00393 g007
Figure 8. Pitch working condition of the car drag coefficient, lift coefficient and pitching moment curve: (a) drag coefficient, (b) lift coefficient and (c) pitching moment.
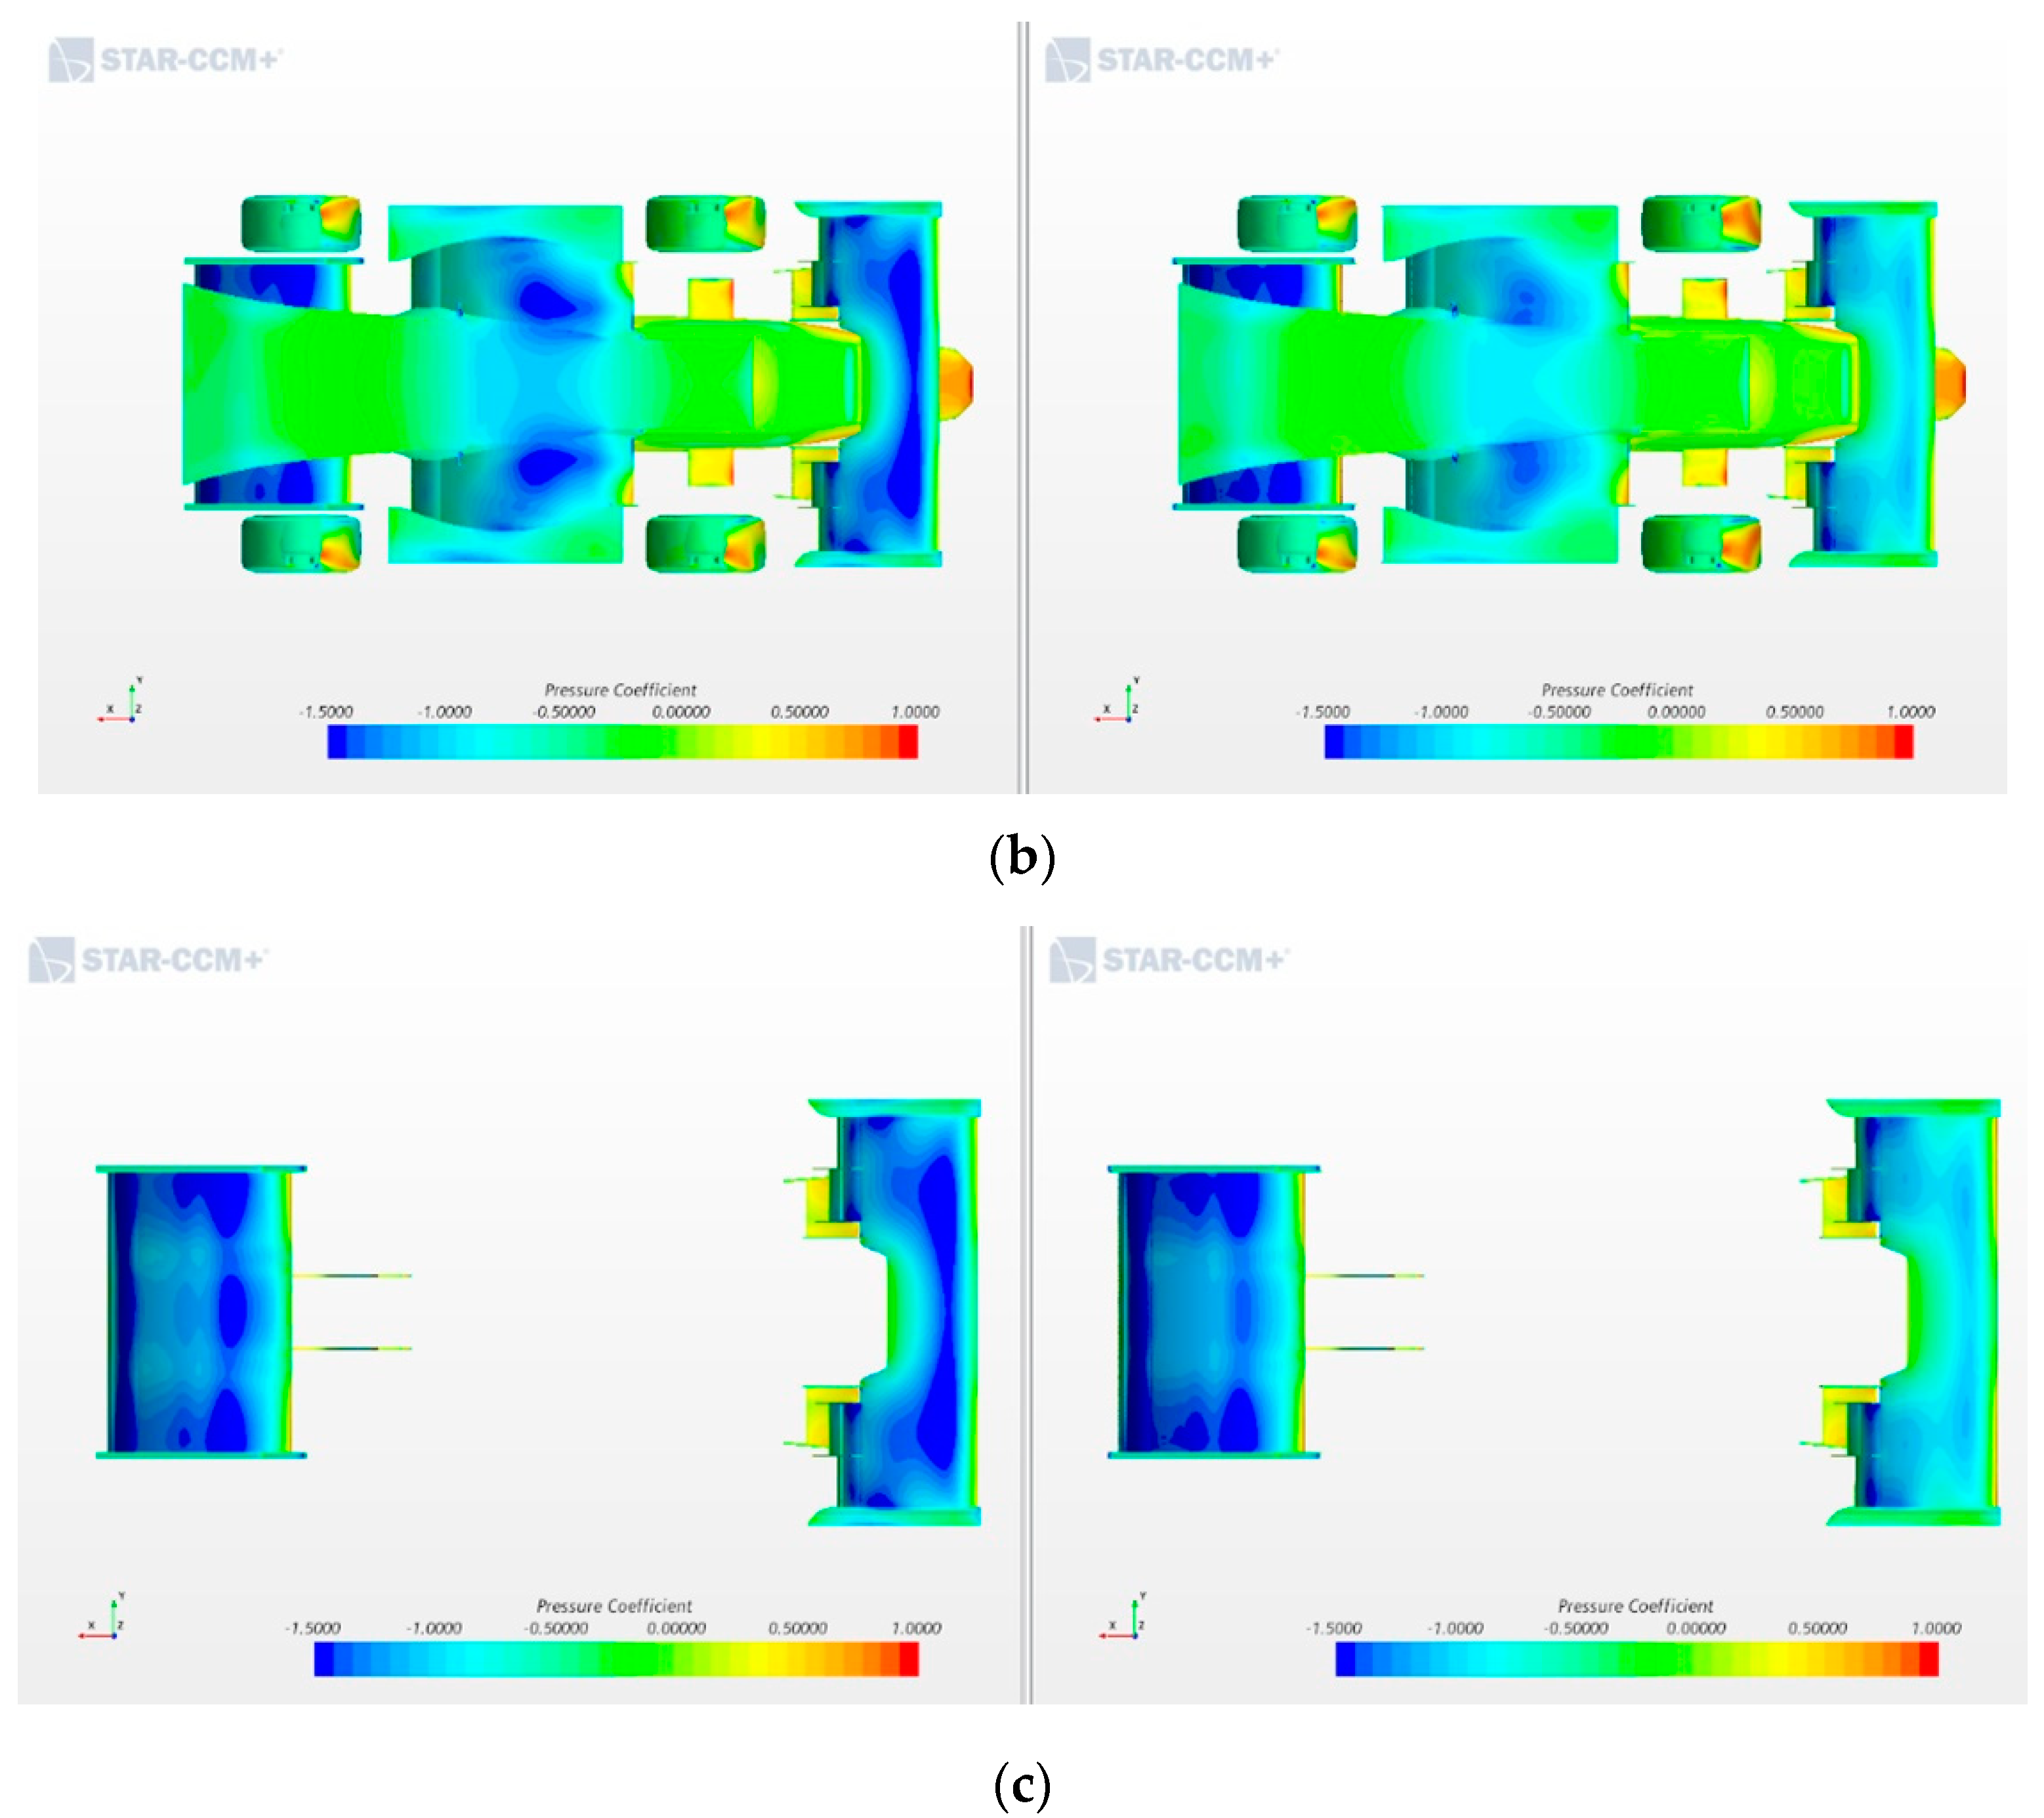
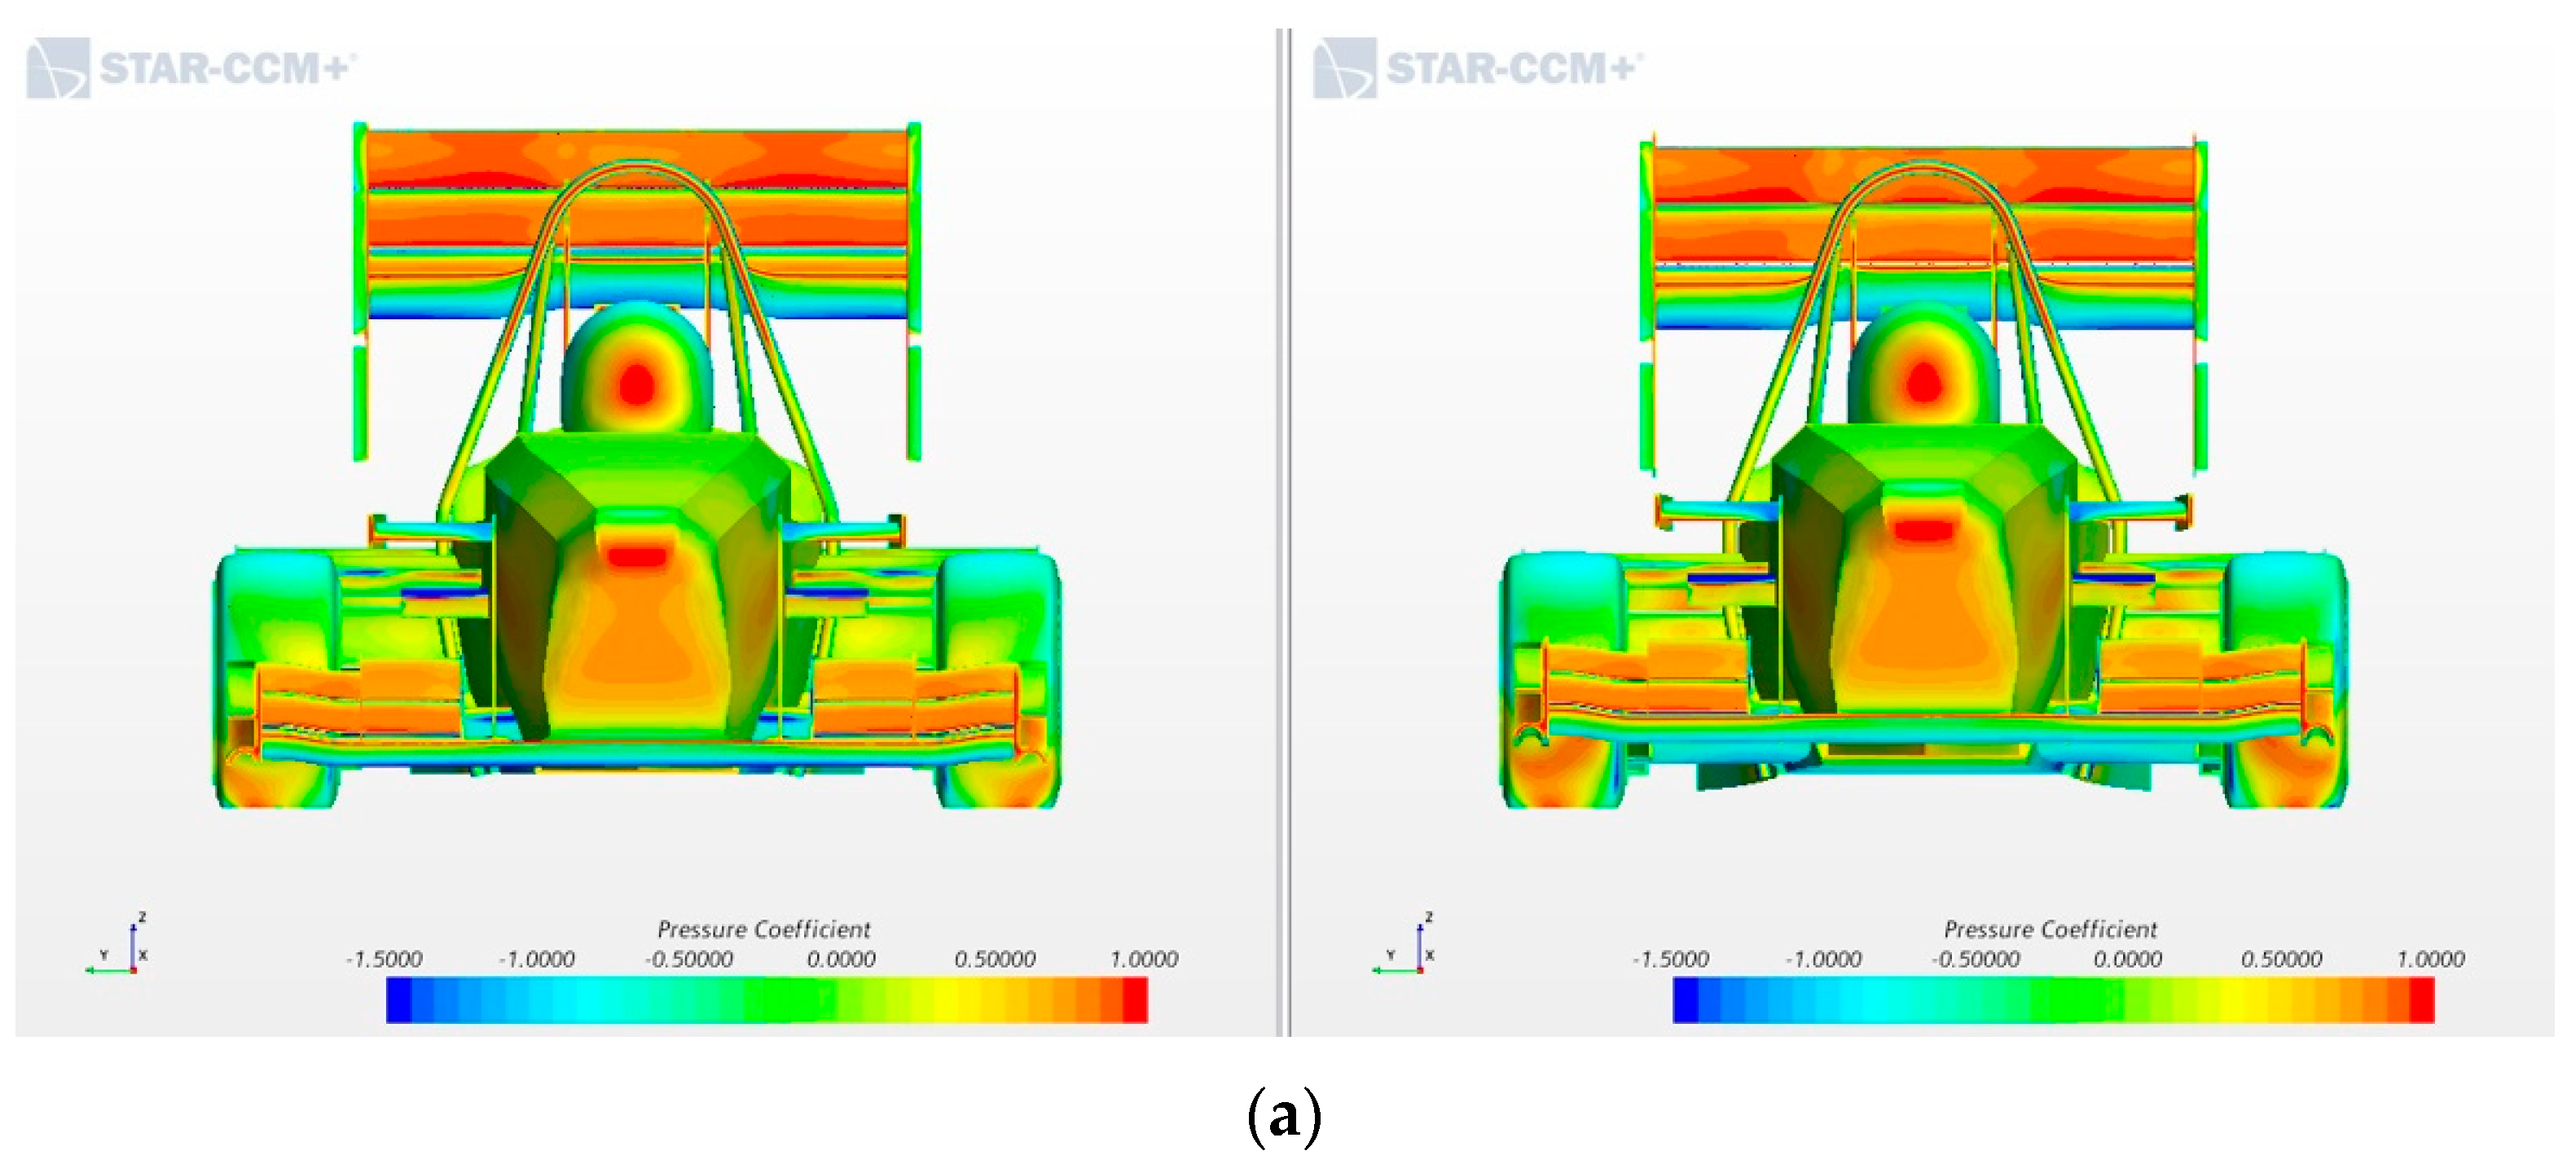
Energies 15 00393 g008
Figure 9. Comparison of pressure cloud images of racing cars in pitching condition of −1.0° (left) and 0.5° (right): (a) the main view of the vehicle, (b) the vehicle and (c) the front wing and the side wing.
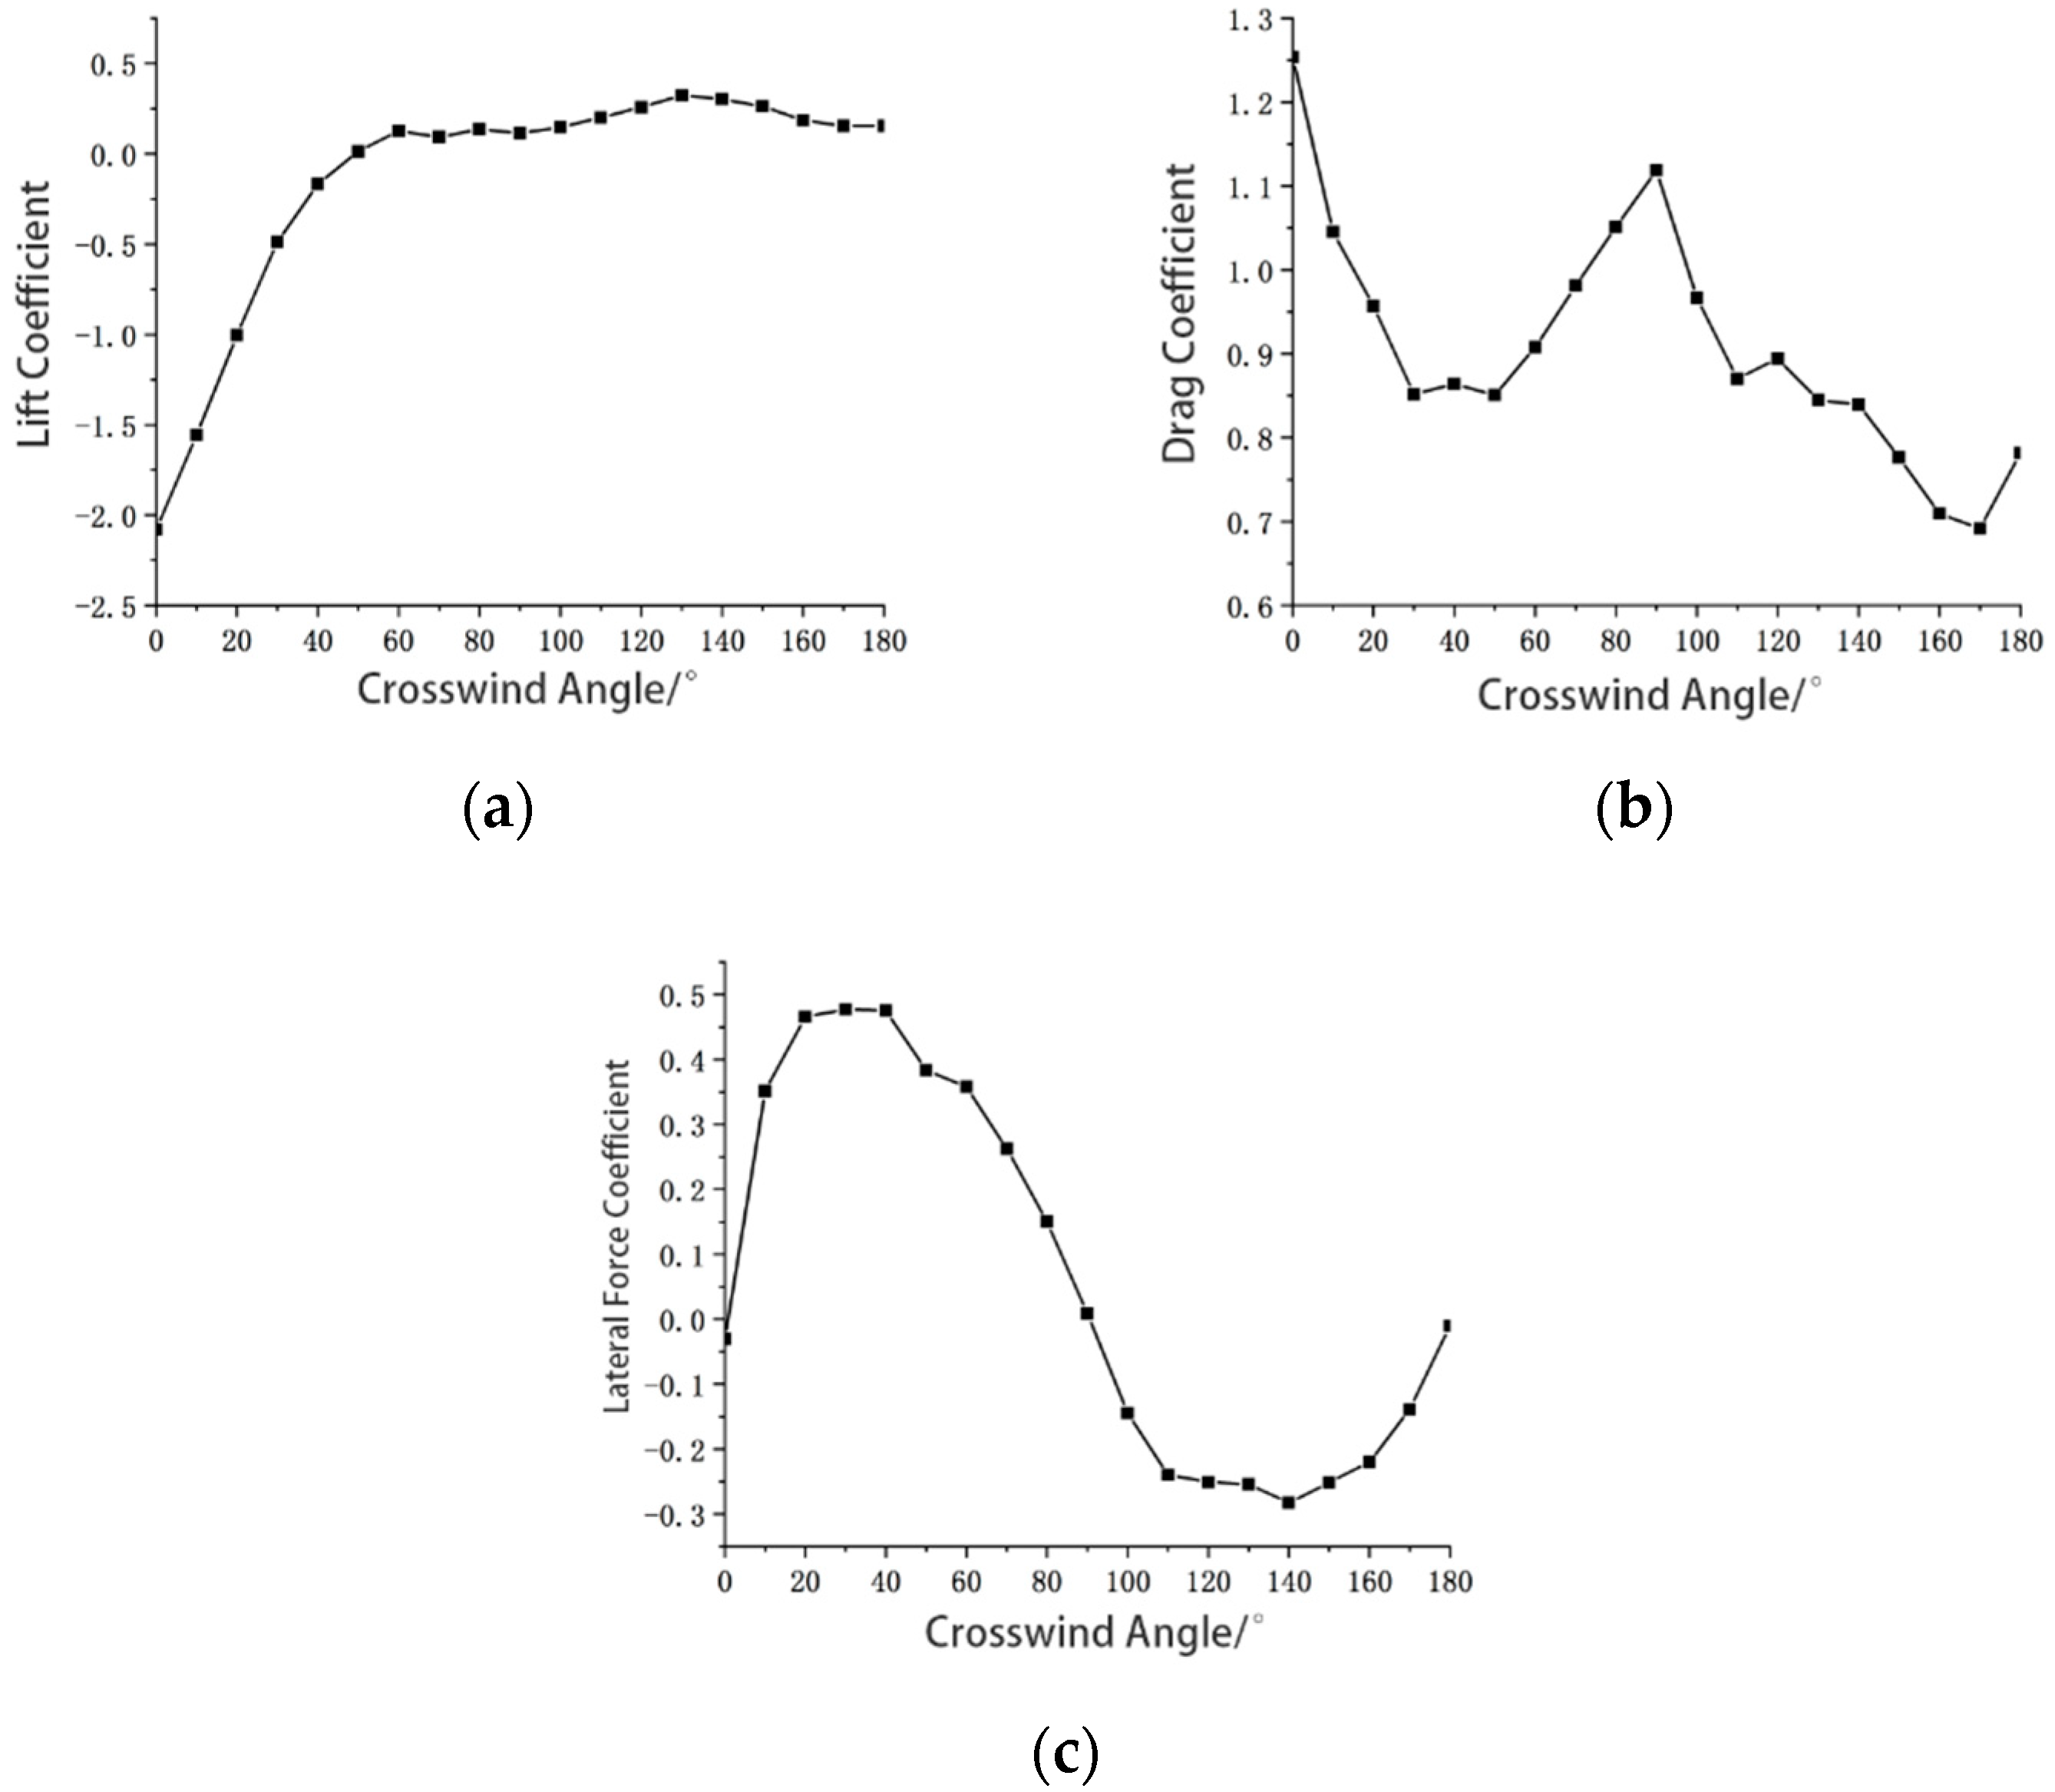
Energies 15 00393 g009aEnergies 15 00393 g009b
Figure 10. Variation curves of lift coefficient, drag coefficient and lateral force coefficient at 0°~180° crosswind angle: (a) lift coefficient, (b) drag coefficient and (c) lateral force coefficient.
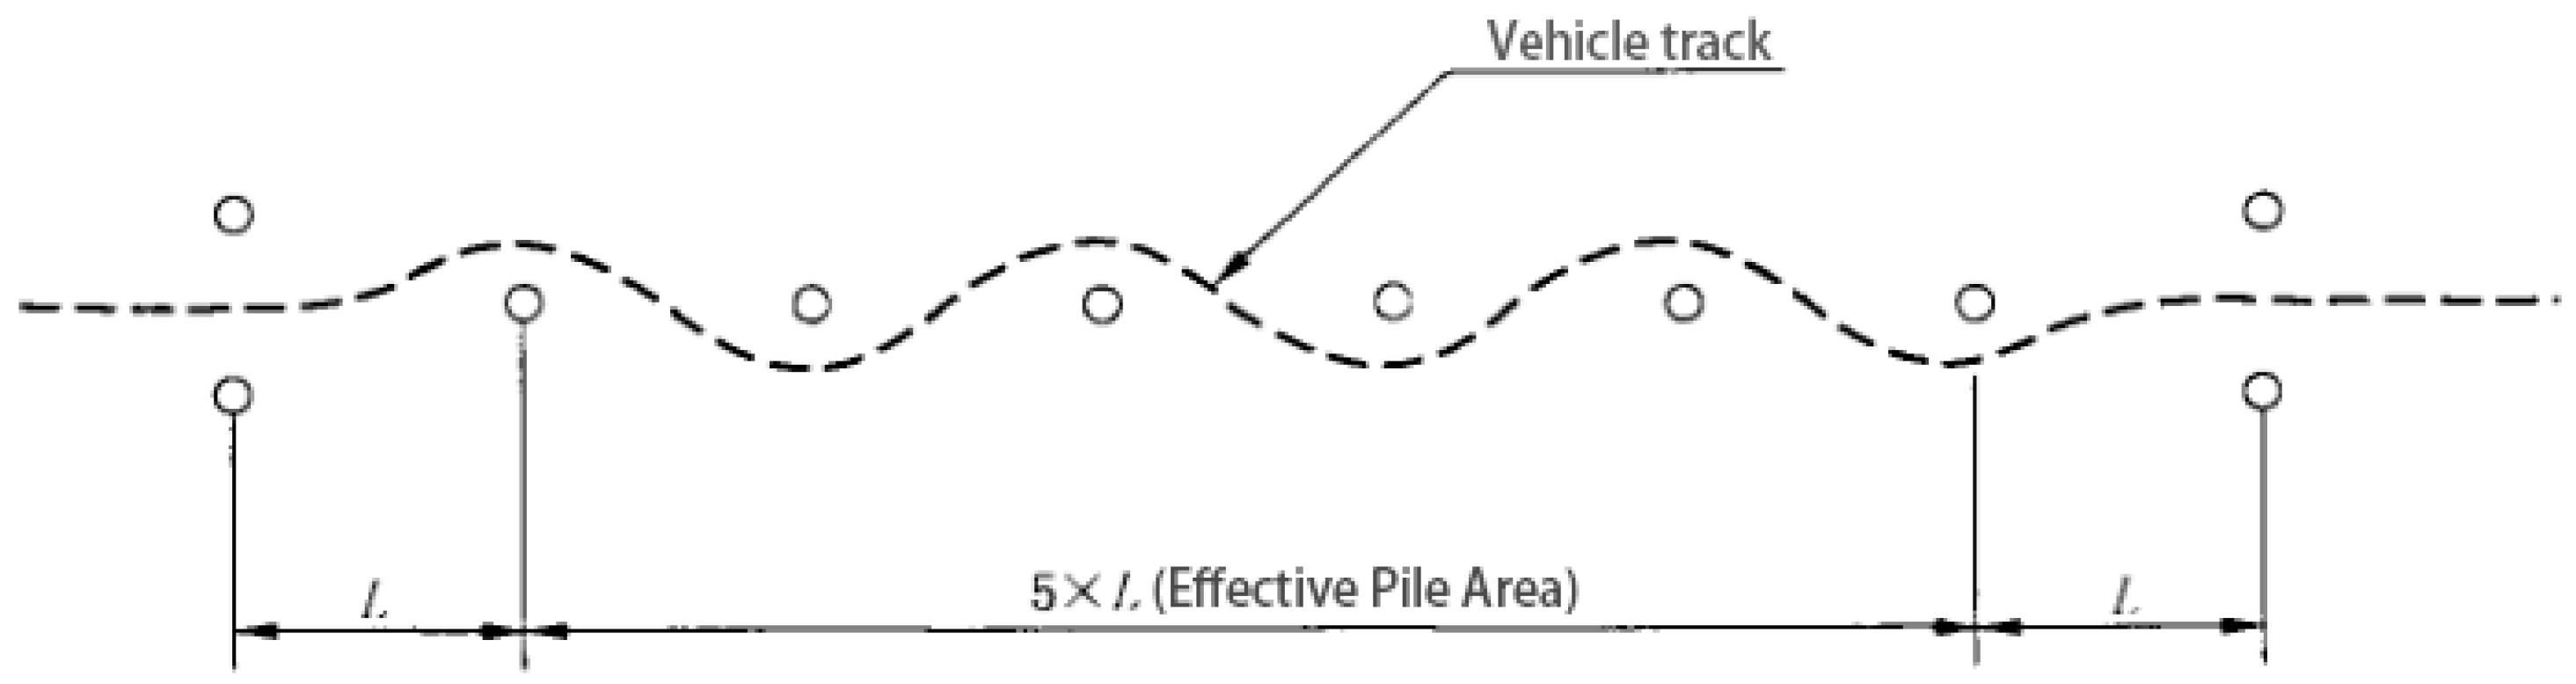
Energies 15 00393 g010
Figure 11. Pile-arrangement diagram of snake test.
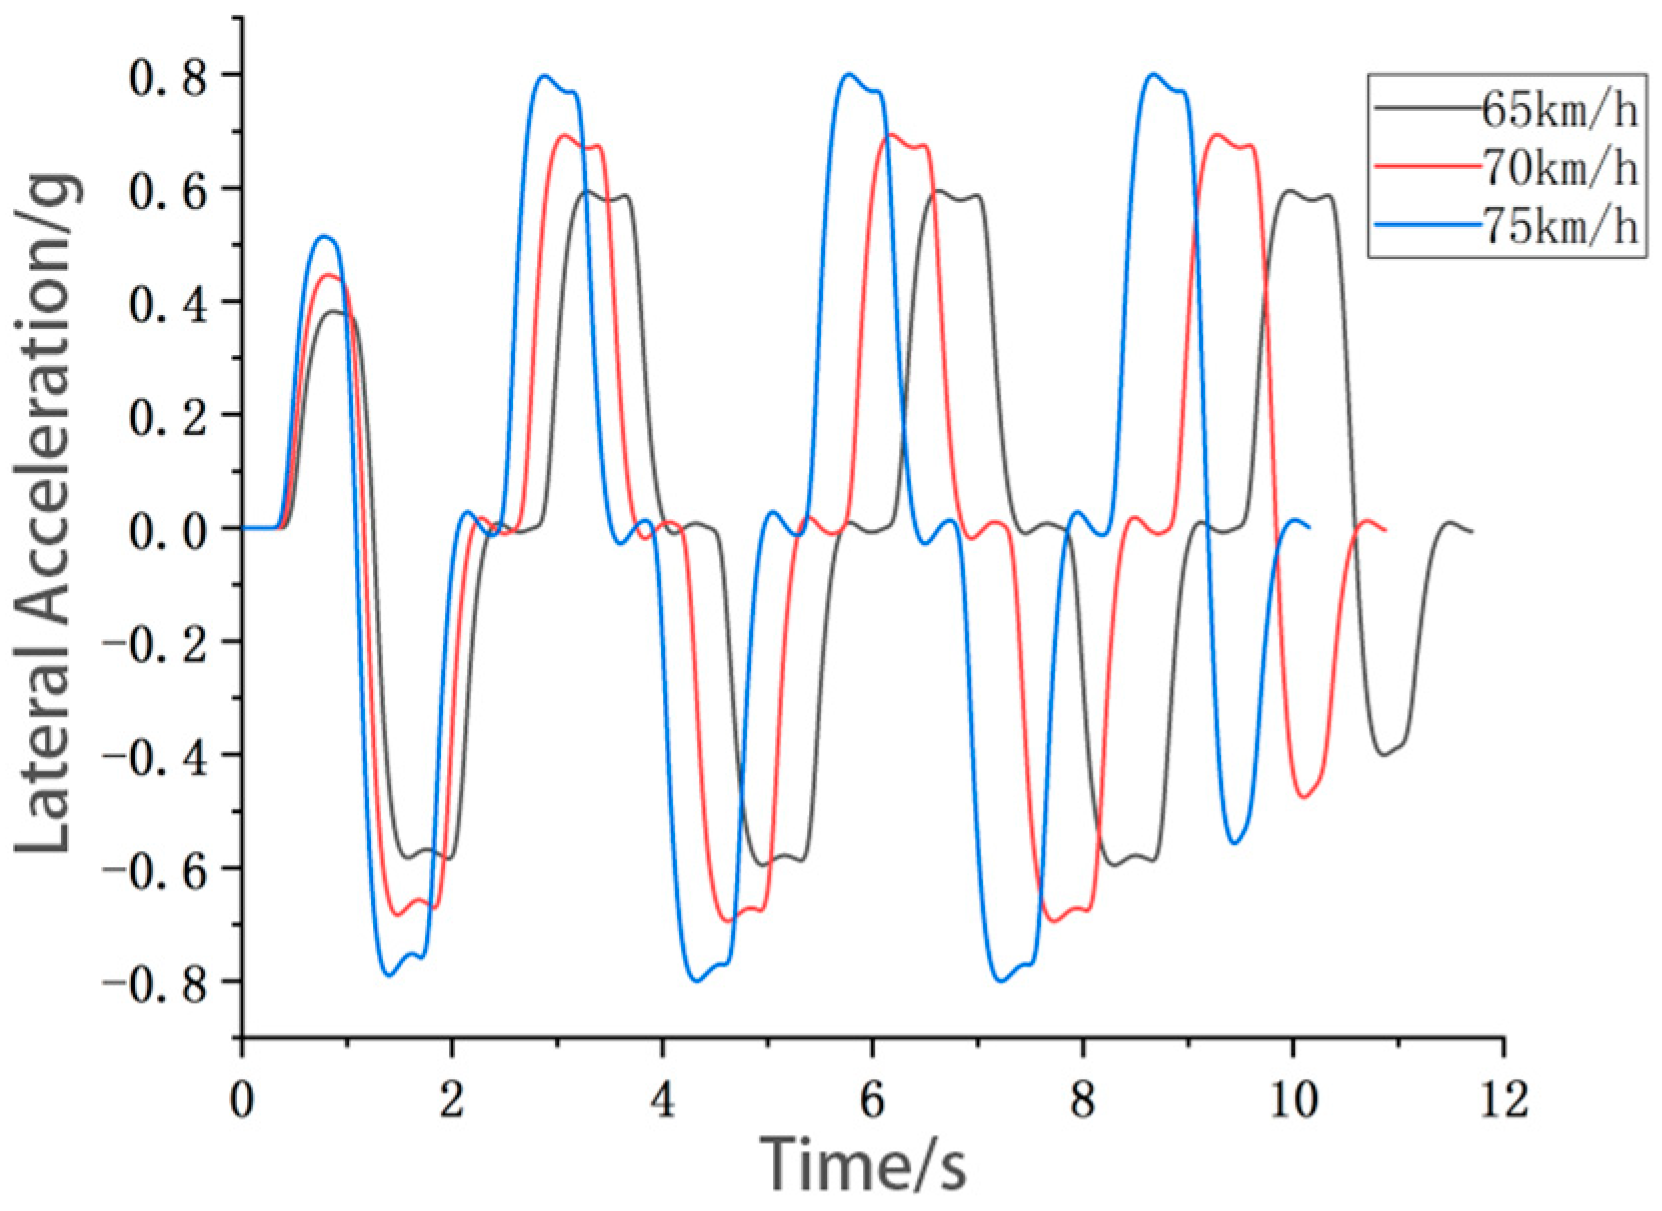
Energies 15 00393 g011
Figure 12. Simulation curve of lateral acceleration without crosswind effect.
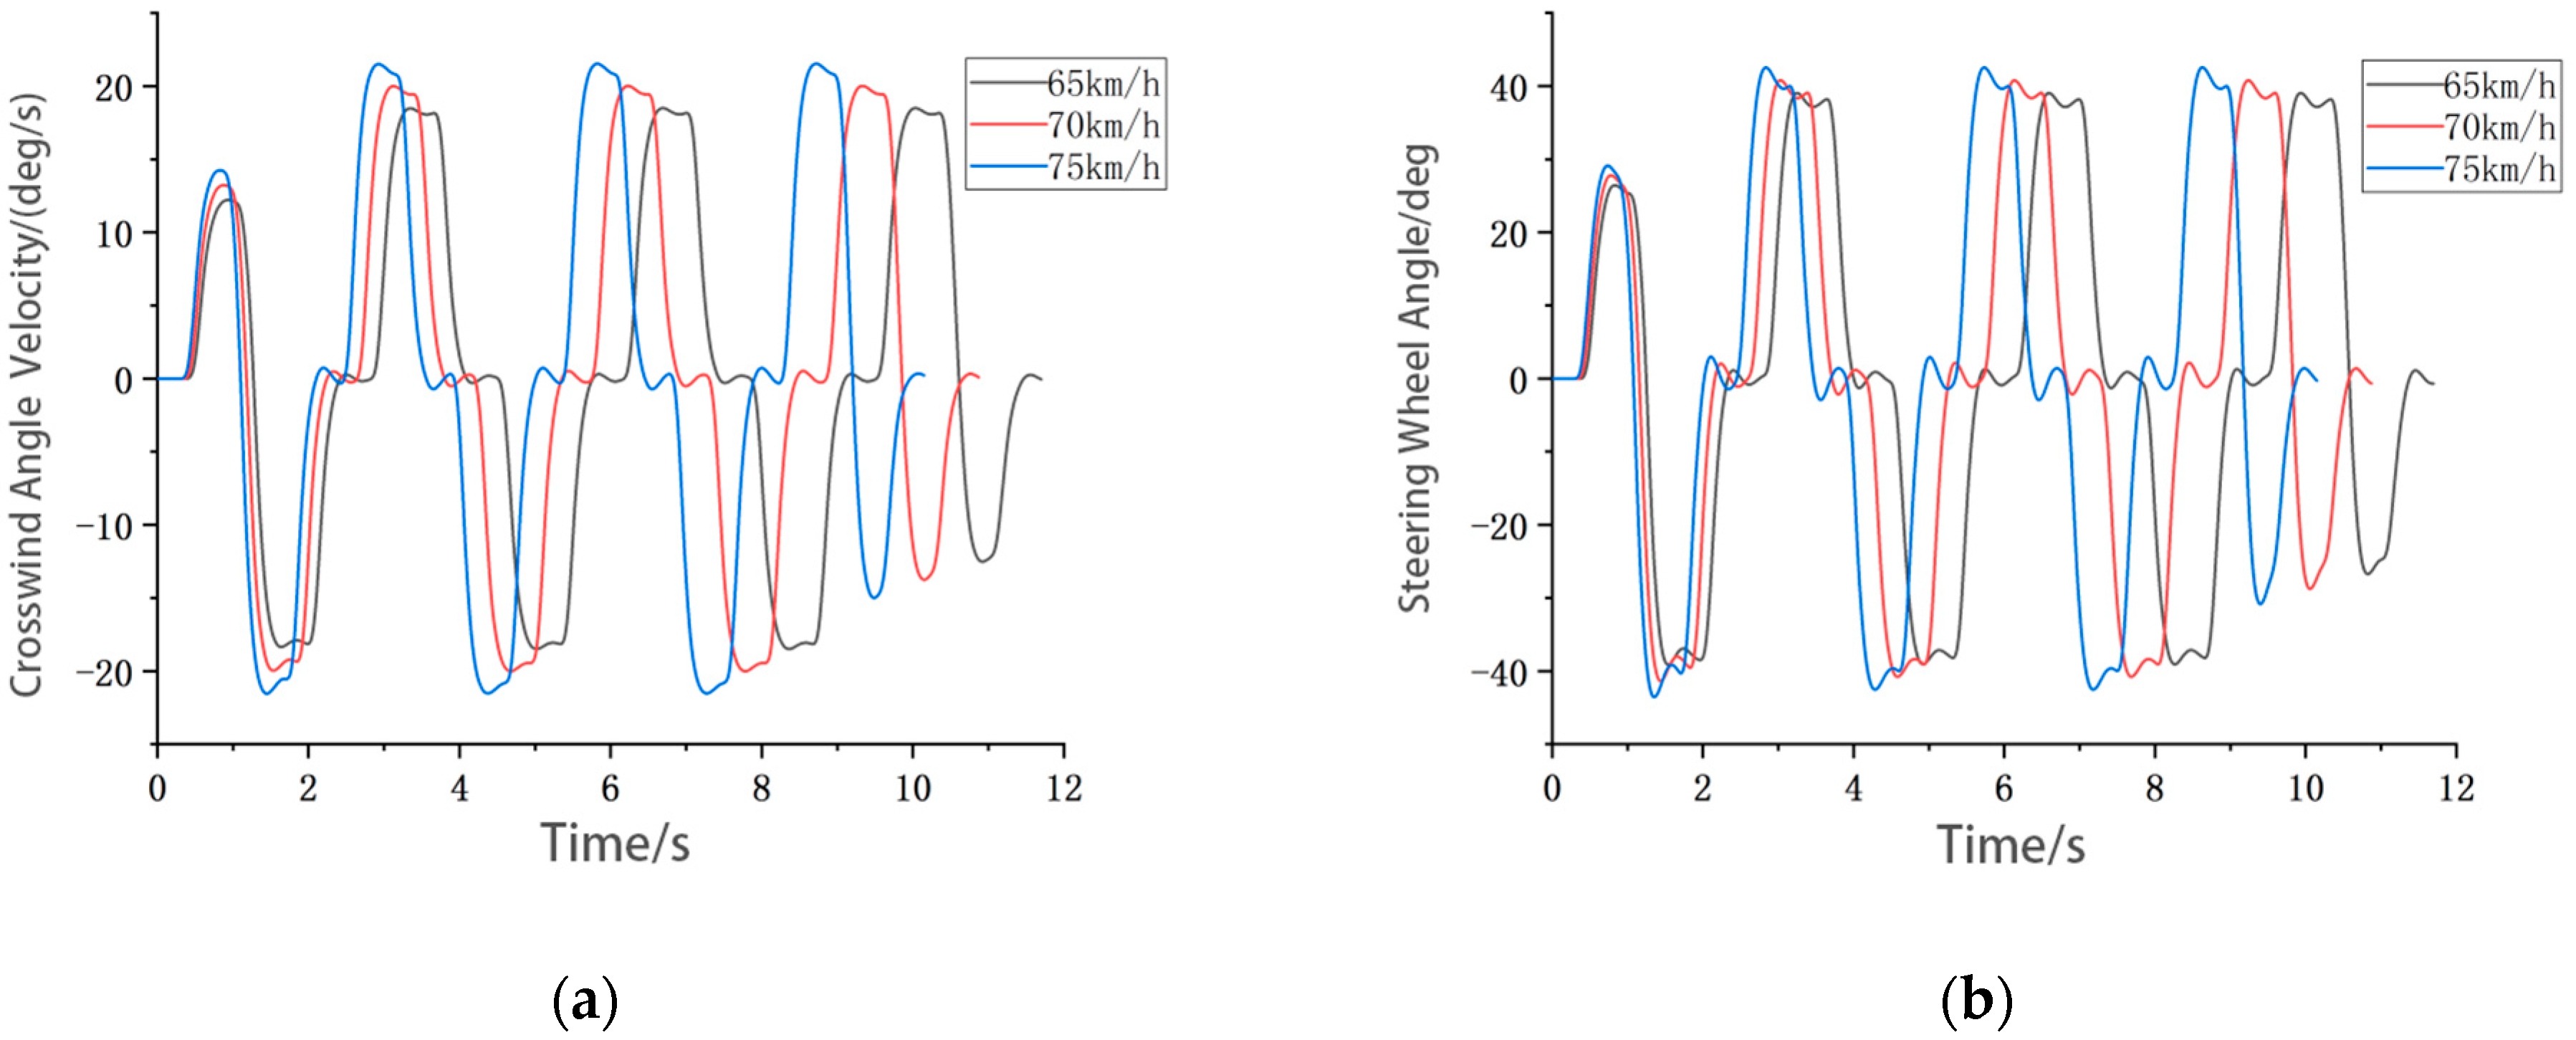
Energies 15 00393 g012
Figure 13. Peak curve without crosswind effect: (a) average crosswind angle velocity and (b) average steering-wheel angle.
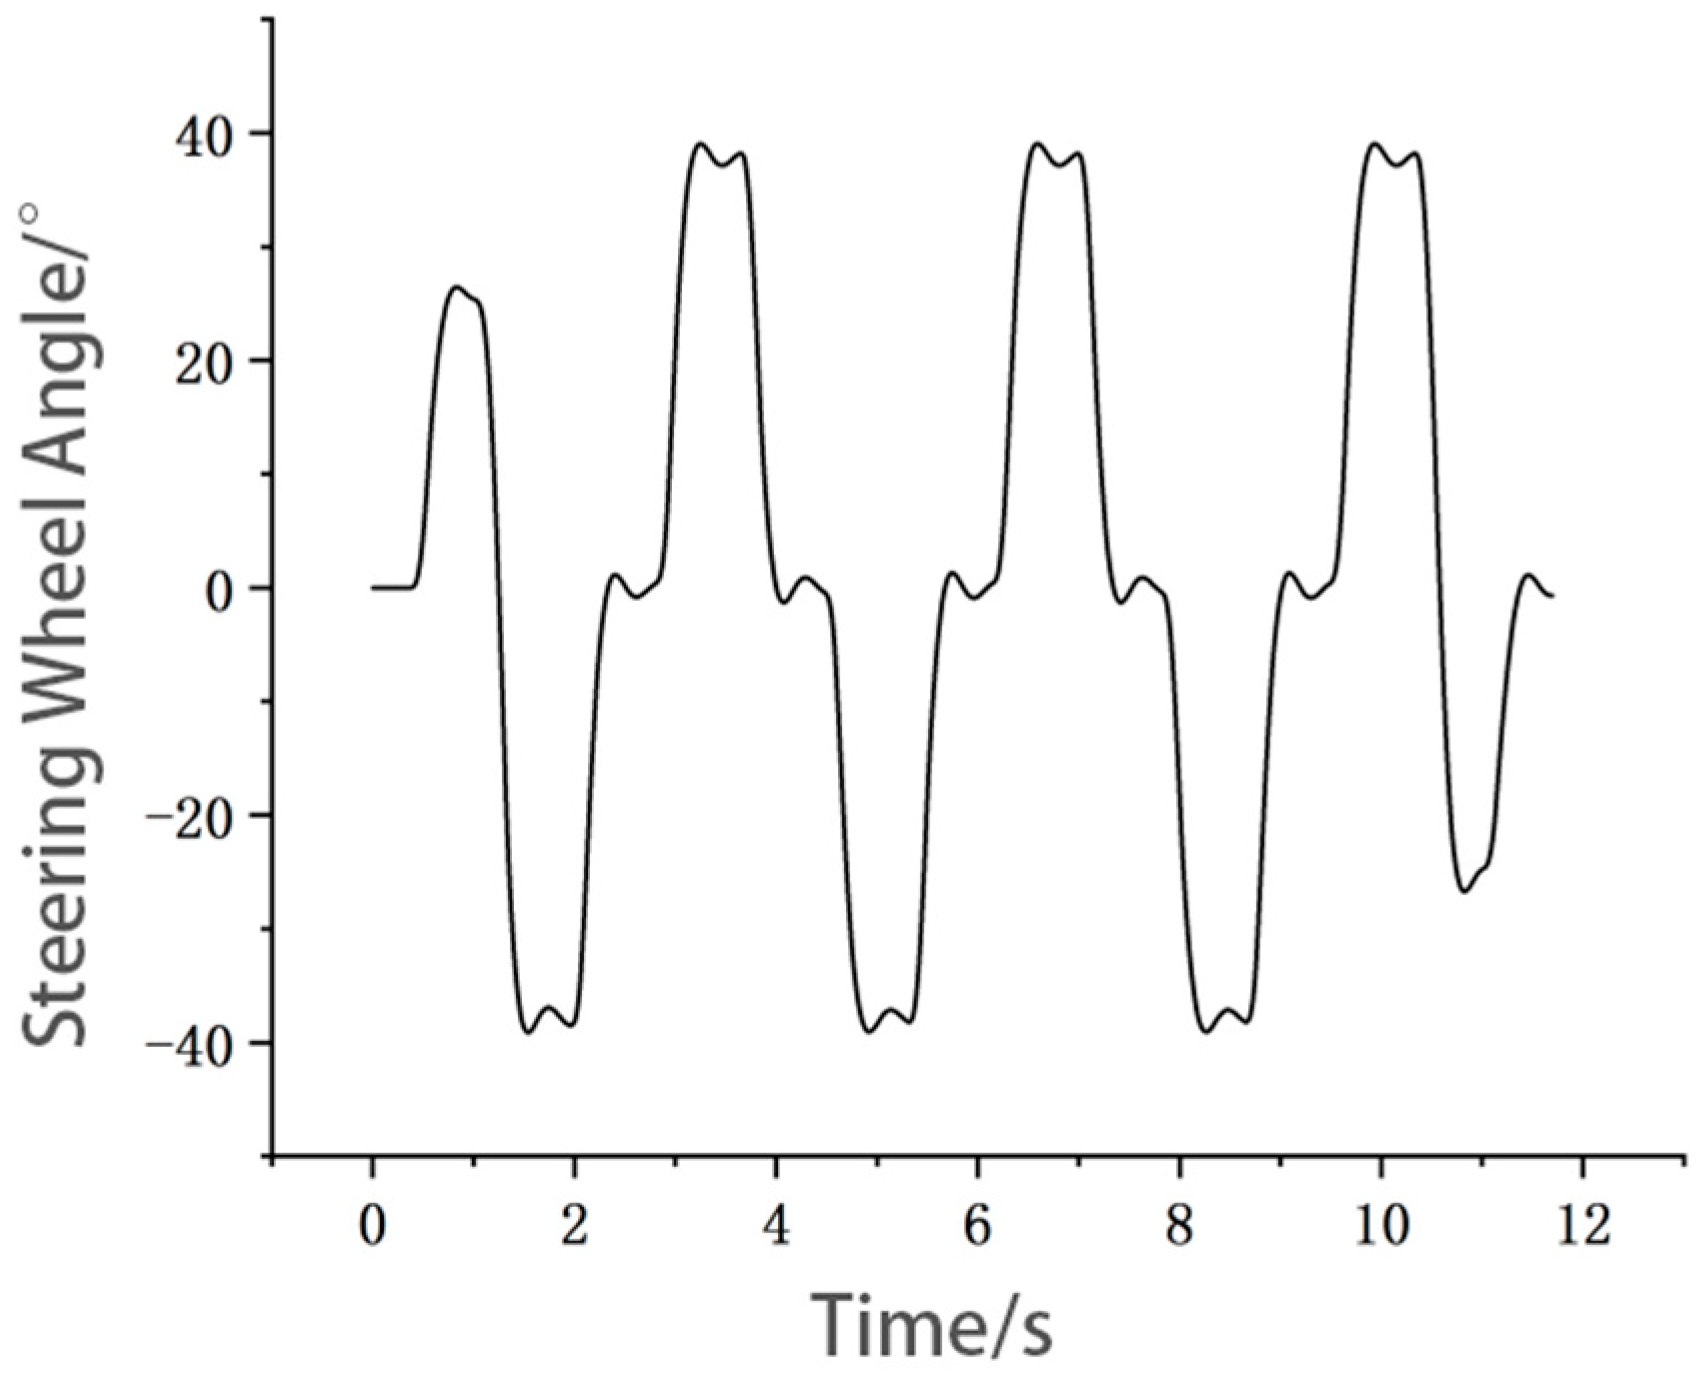
Energies 15 00393 g013
Figure 14. Input curve of steering-wheel angle in open-loop test.
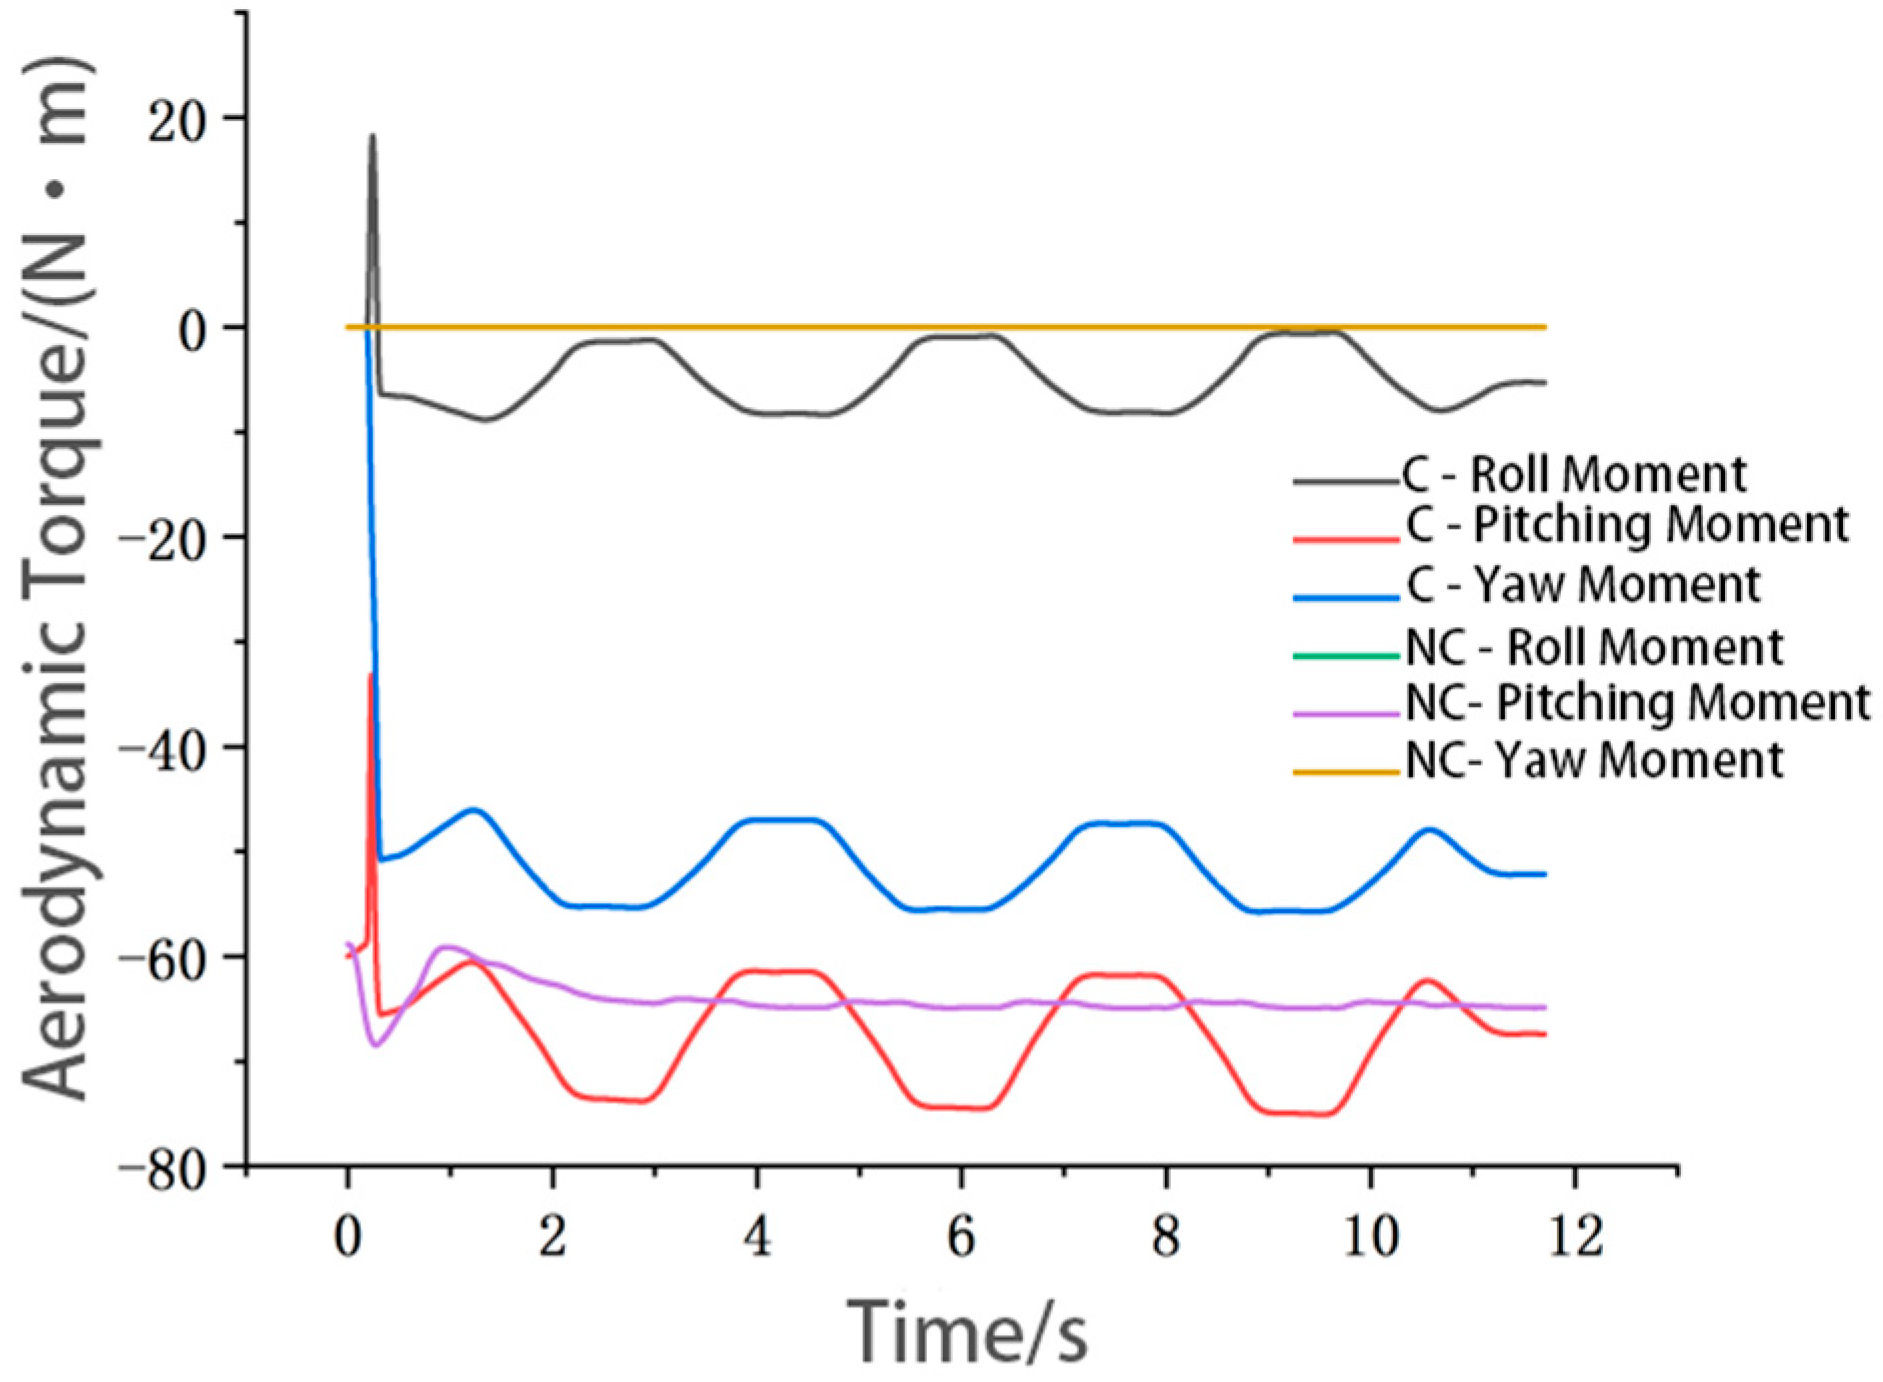
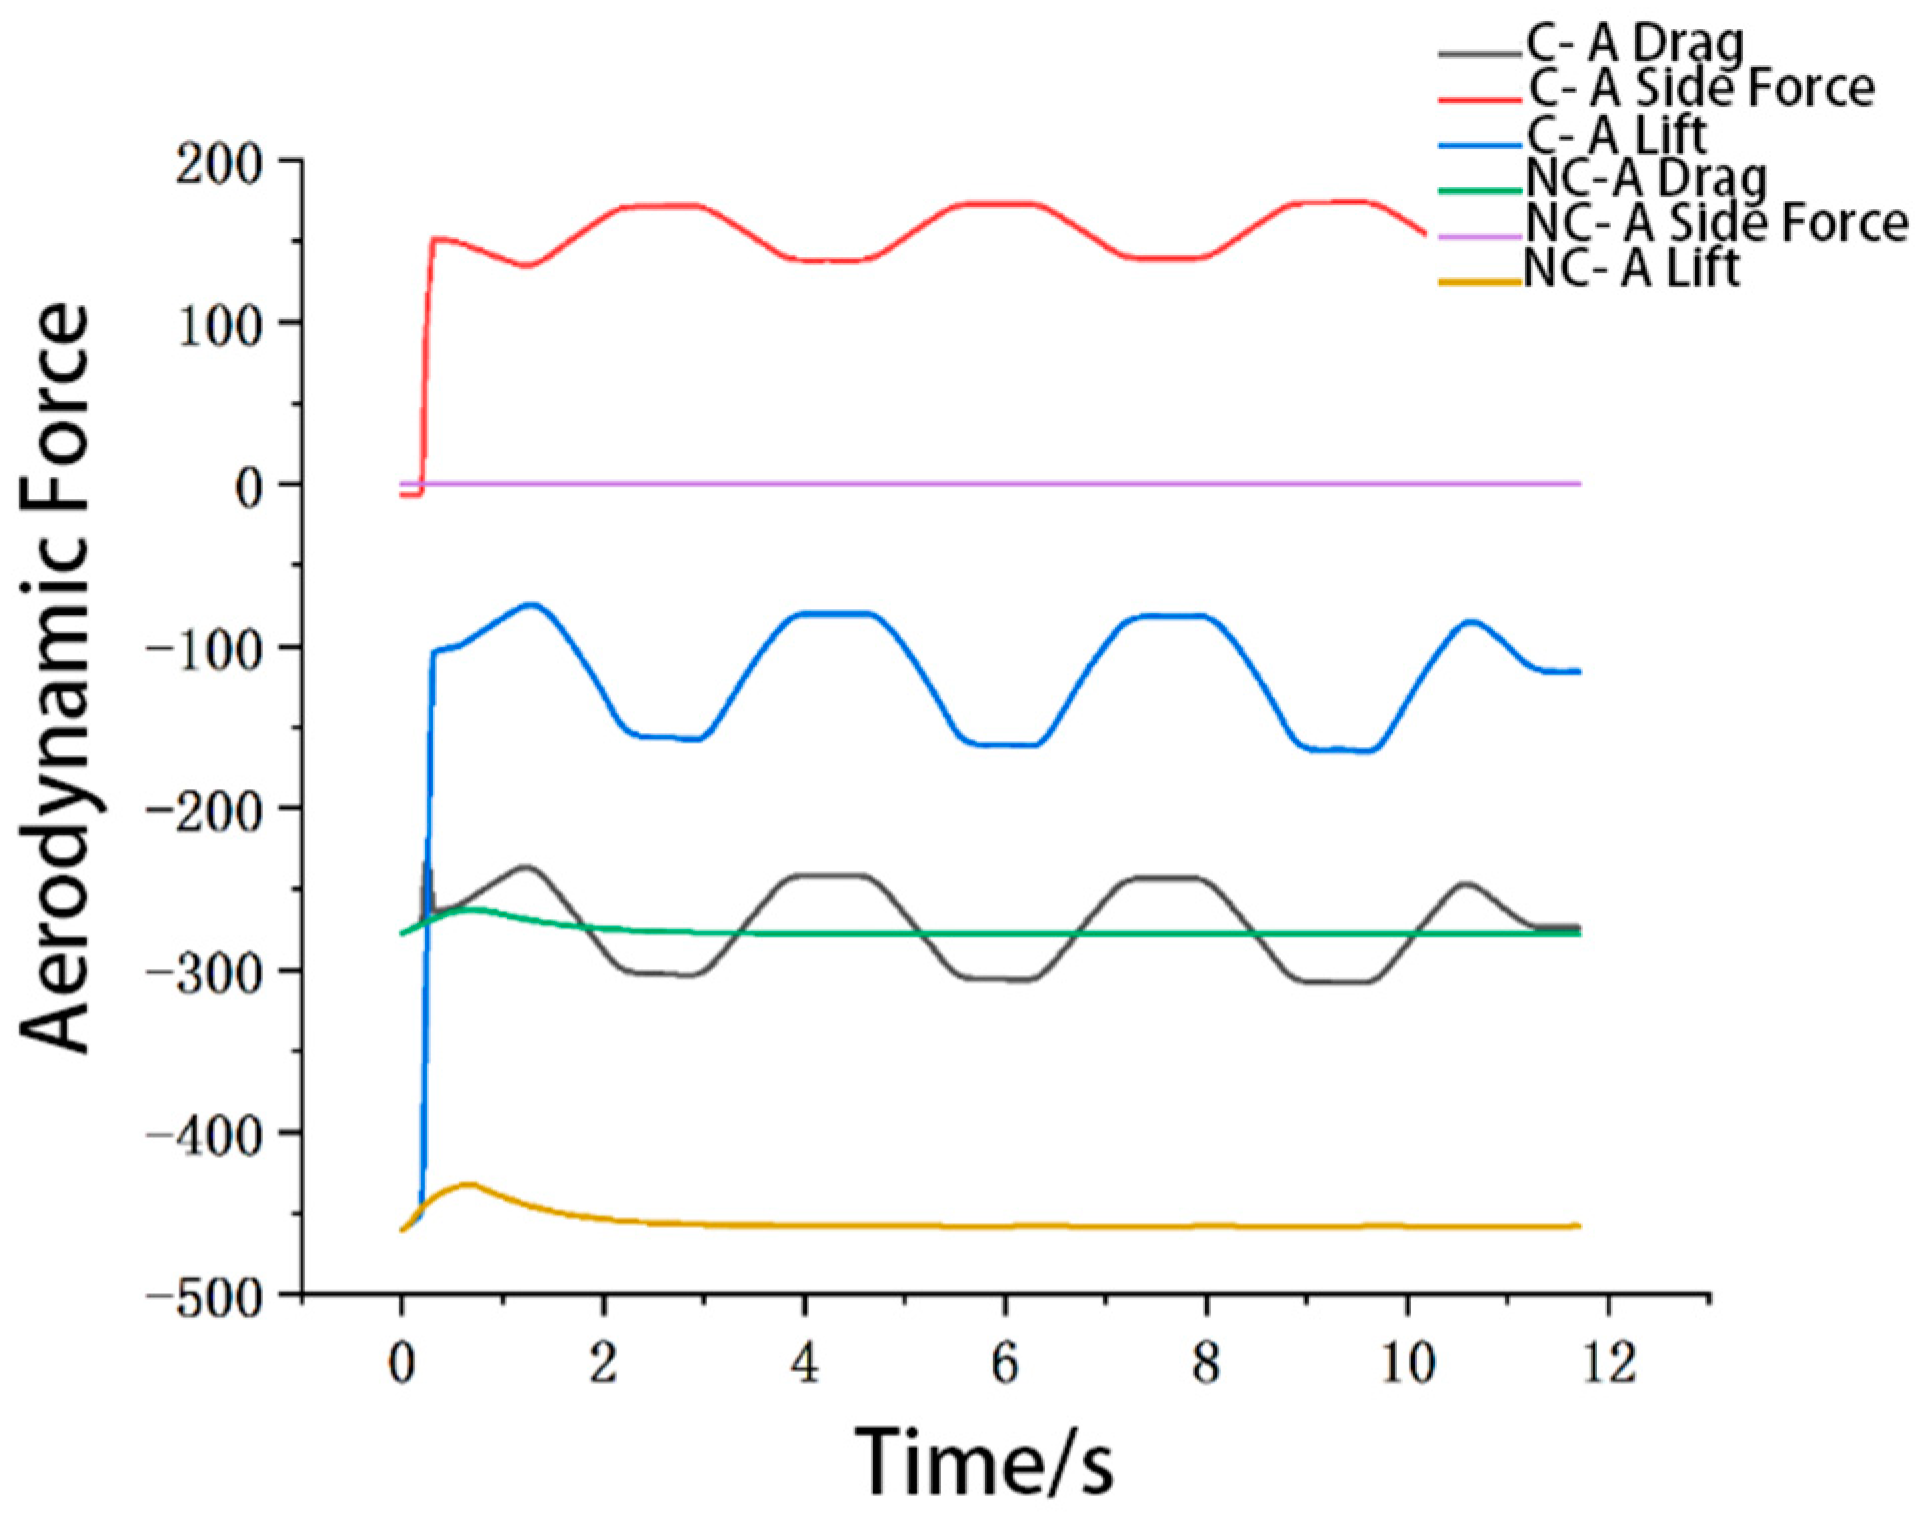
Energies 15 00393 g014
Figure 15. Comparison curves of aerodynamic force and aerodynamic torque with and without crosswind over time: C—A is the crosswind-aerodynamic, NC—A is the no crosswind aerodynamic, C is the crosswind and NC is the no crosswind.
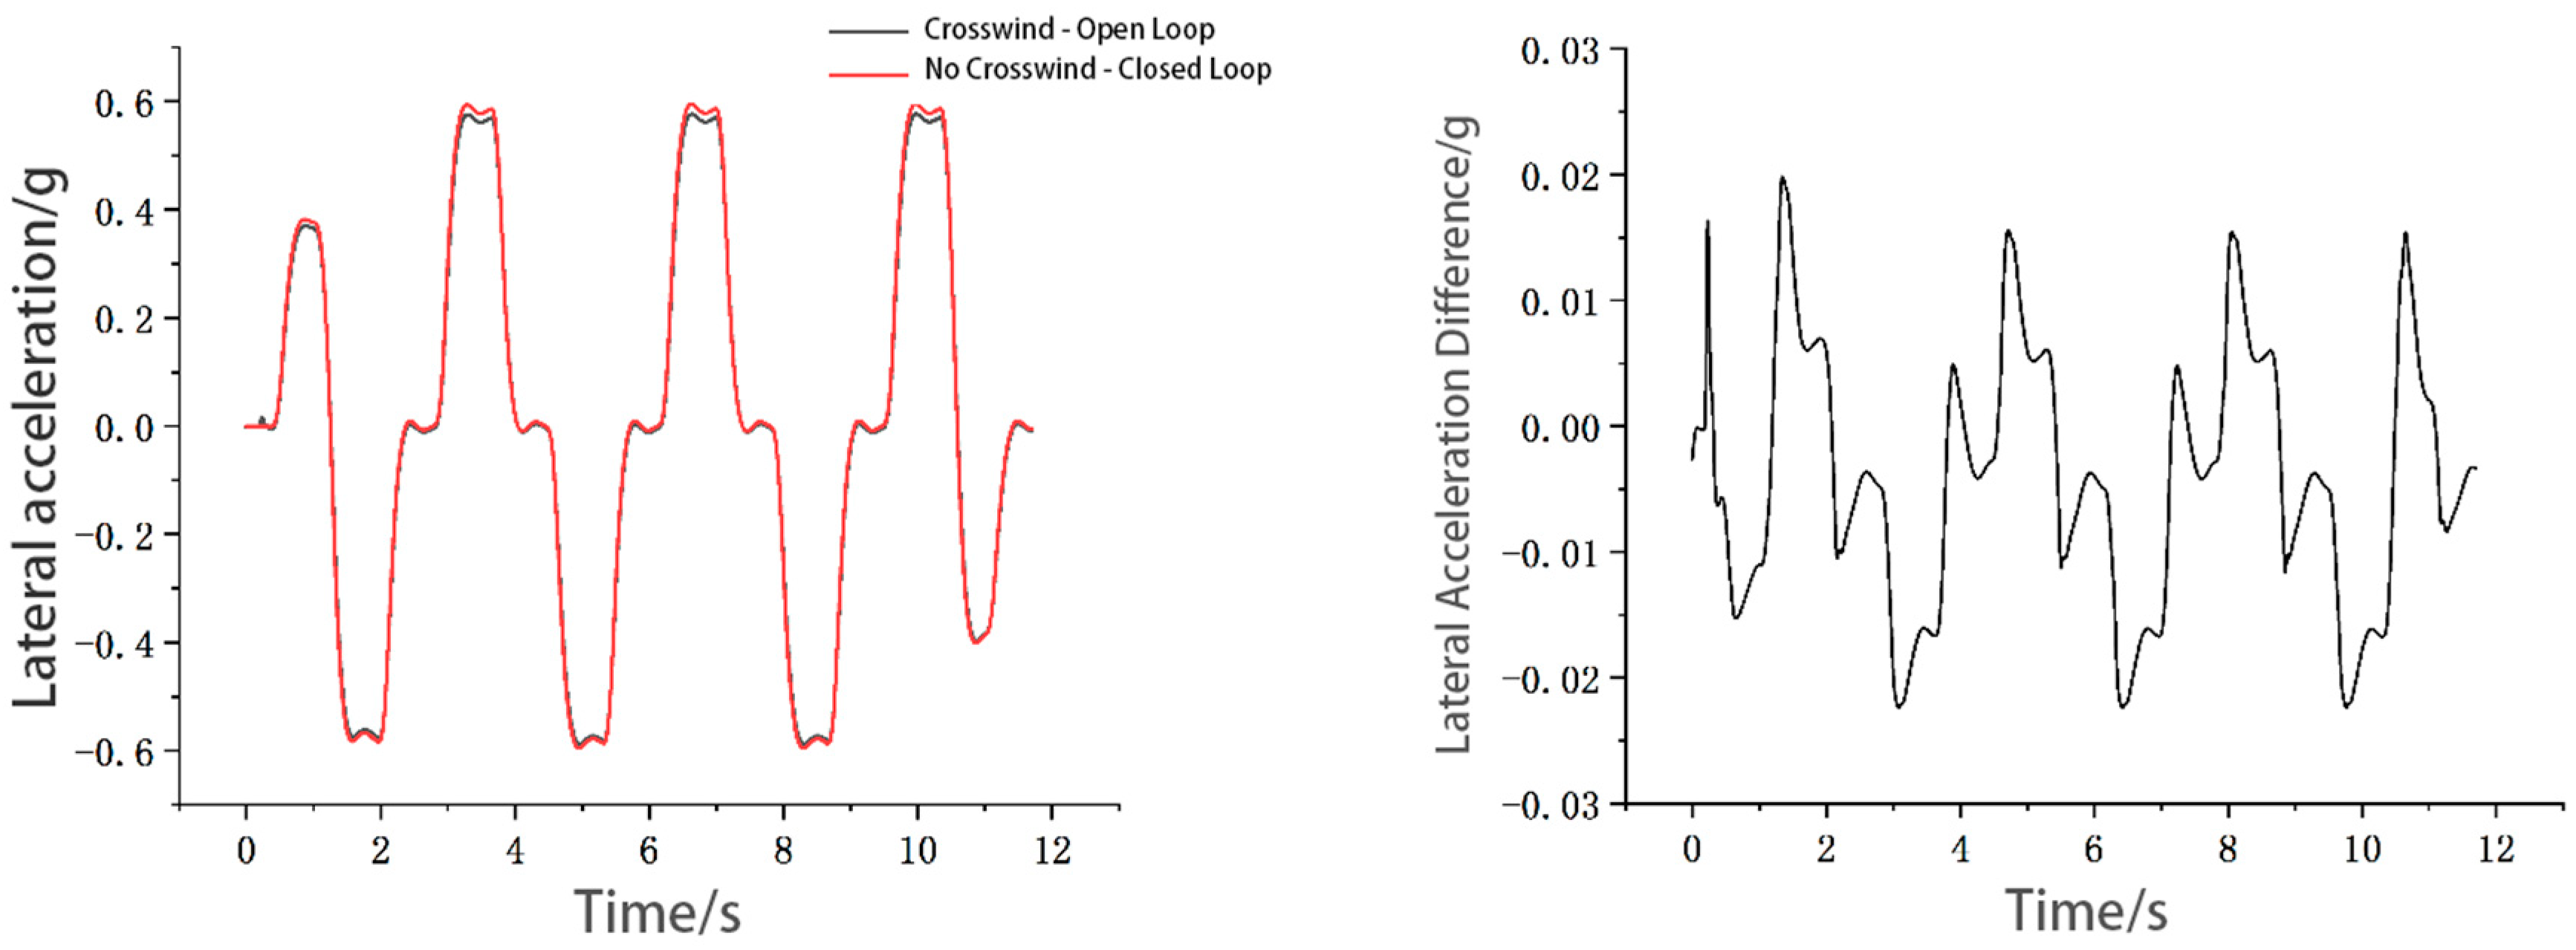
Energies 15 00393 g015aEnergies 15 00393 g015b
Figure 16. Comparison curve and difference curve of lateral acceleration with and without crosswind effect.
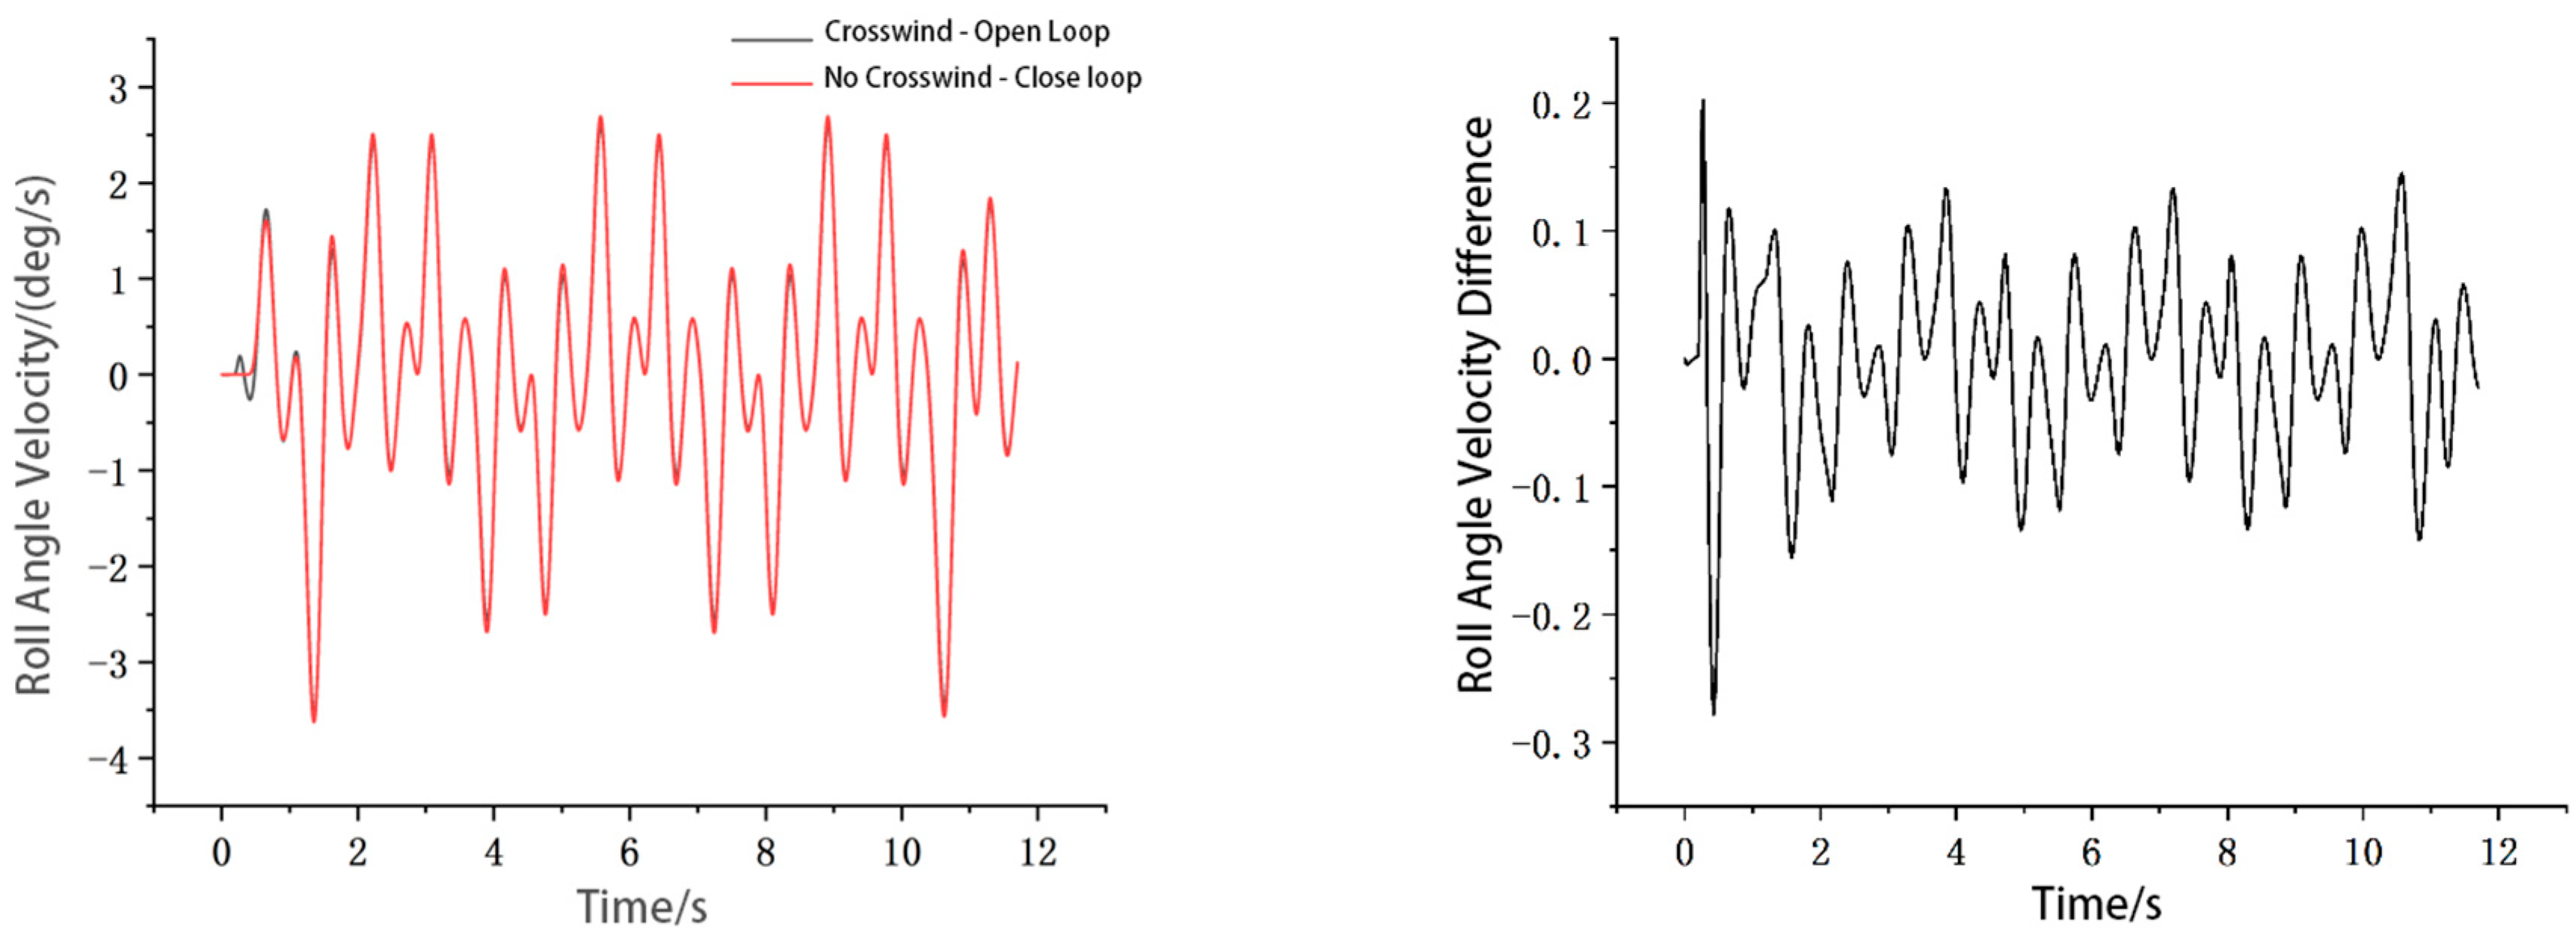
Energies 15 00393 g016
Figure 17. Comparison curves and difference curves of roll angle velocity with and without crosswind effect.
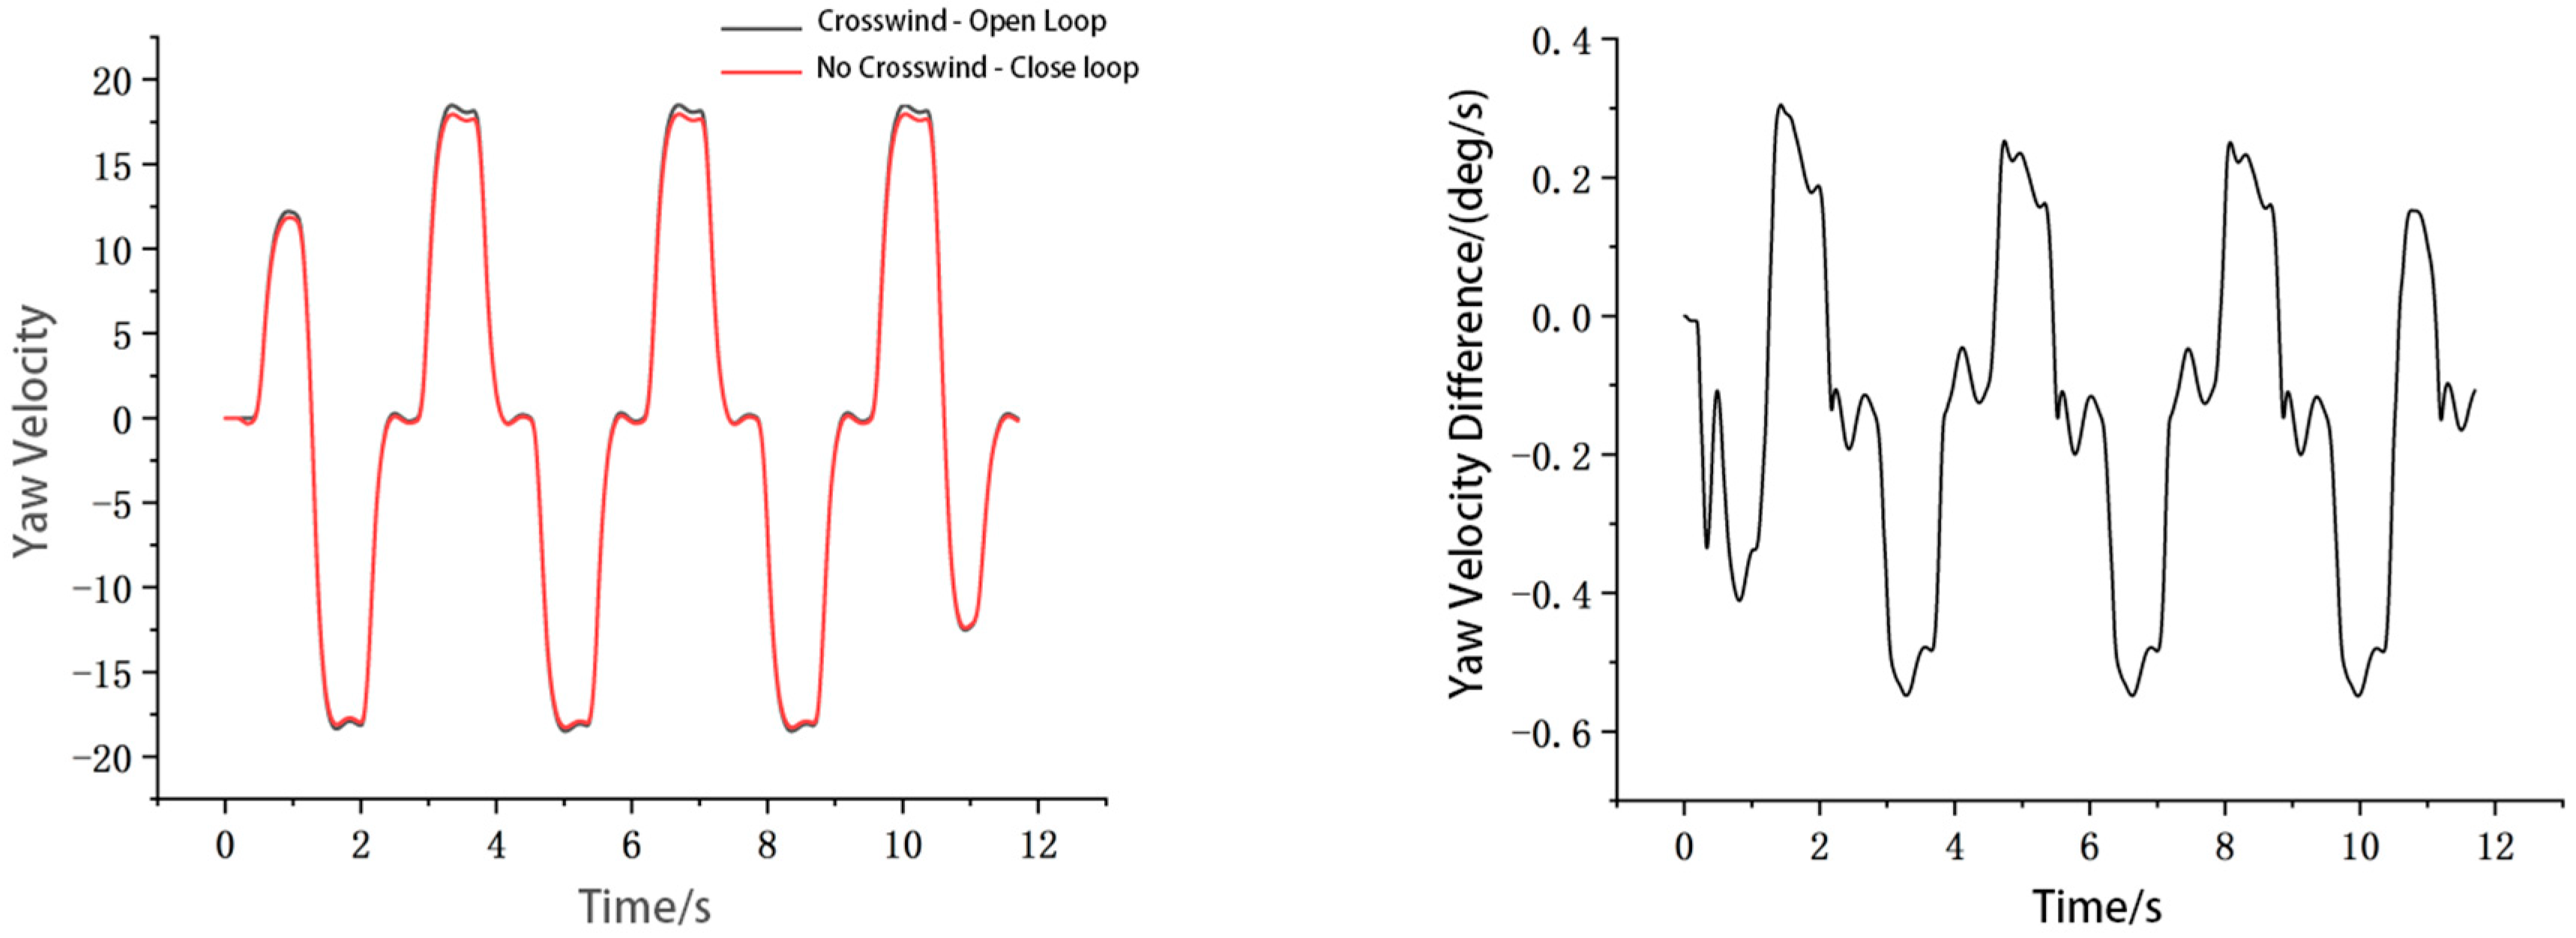
Energies 15 00393 g017
Figure 18. Comparison curves and difference curves of crosswind offset velocity with and without crosswind action.
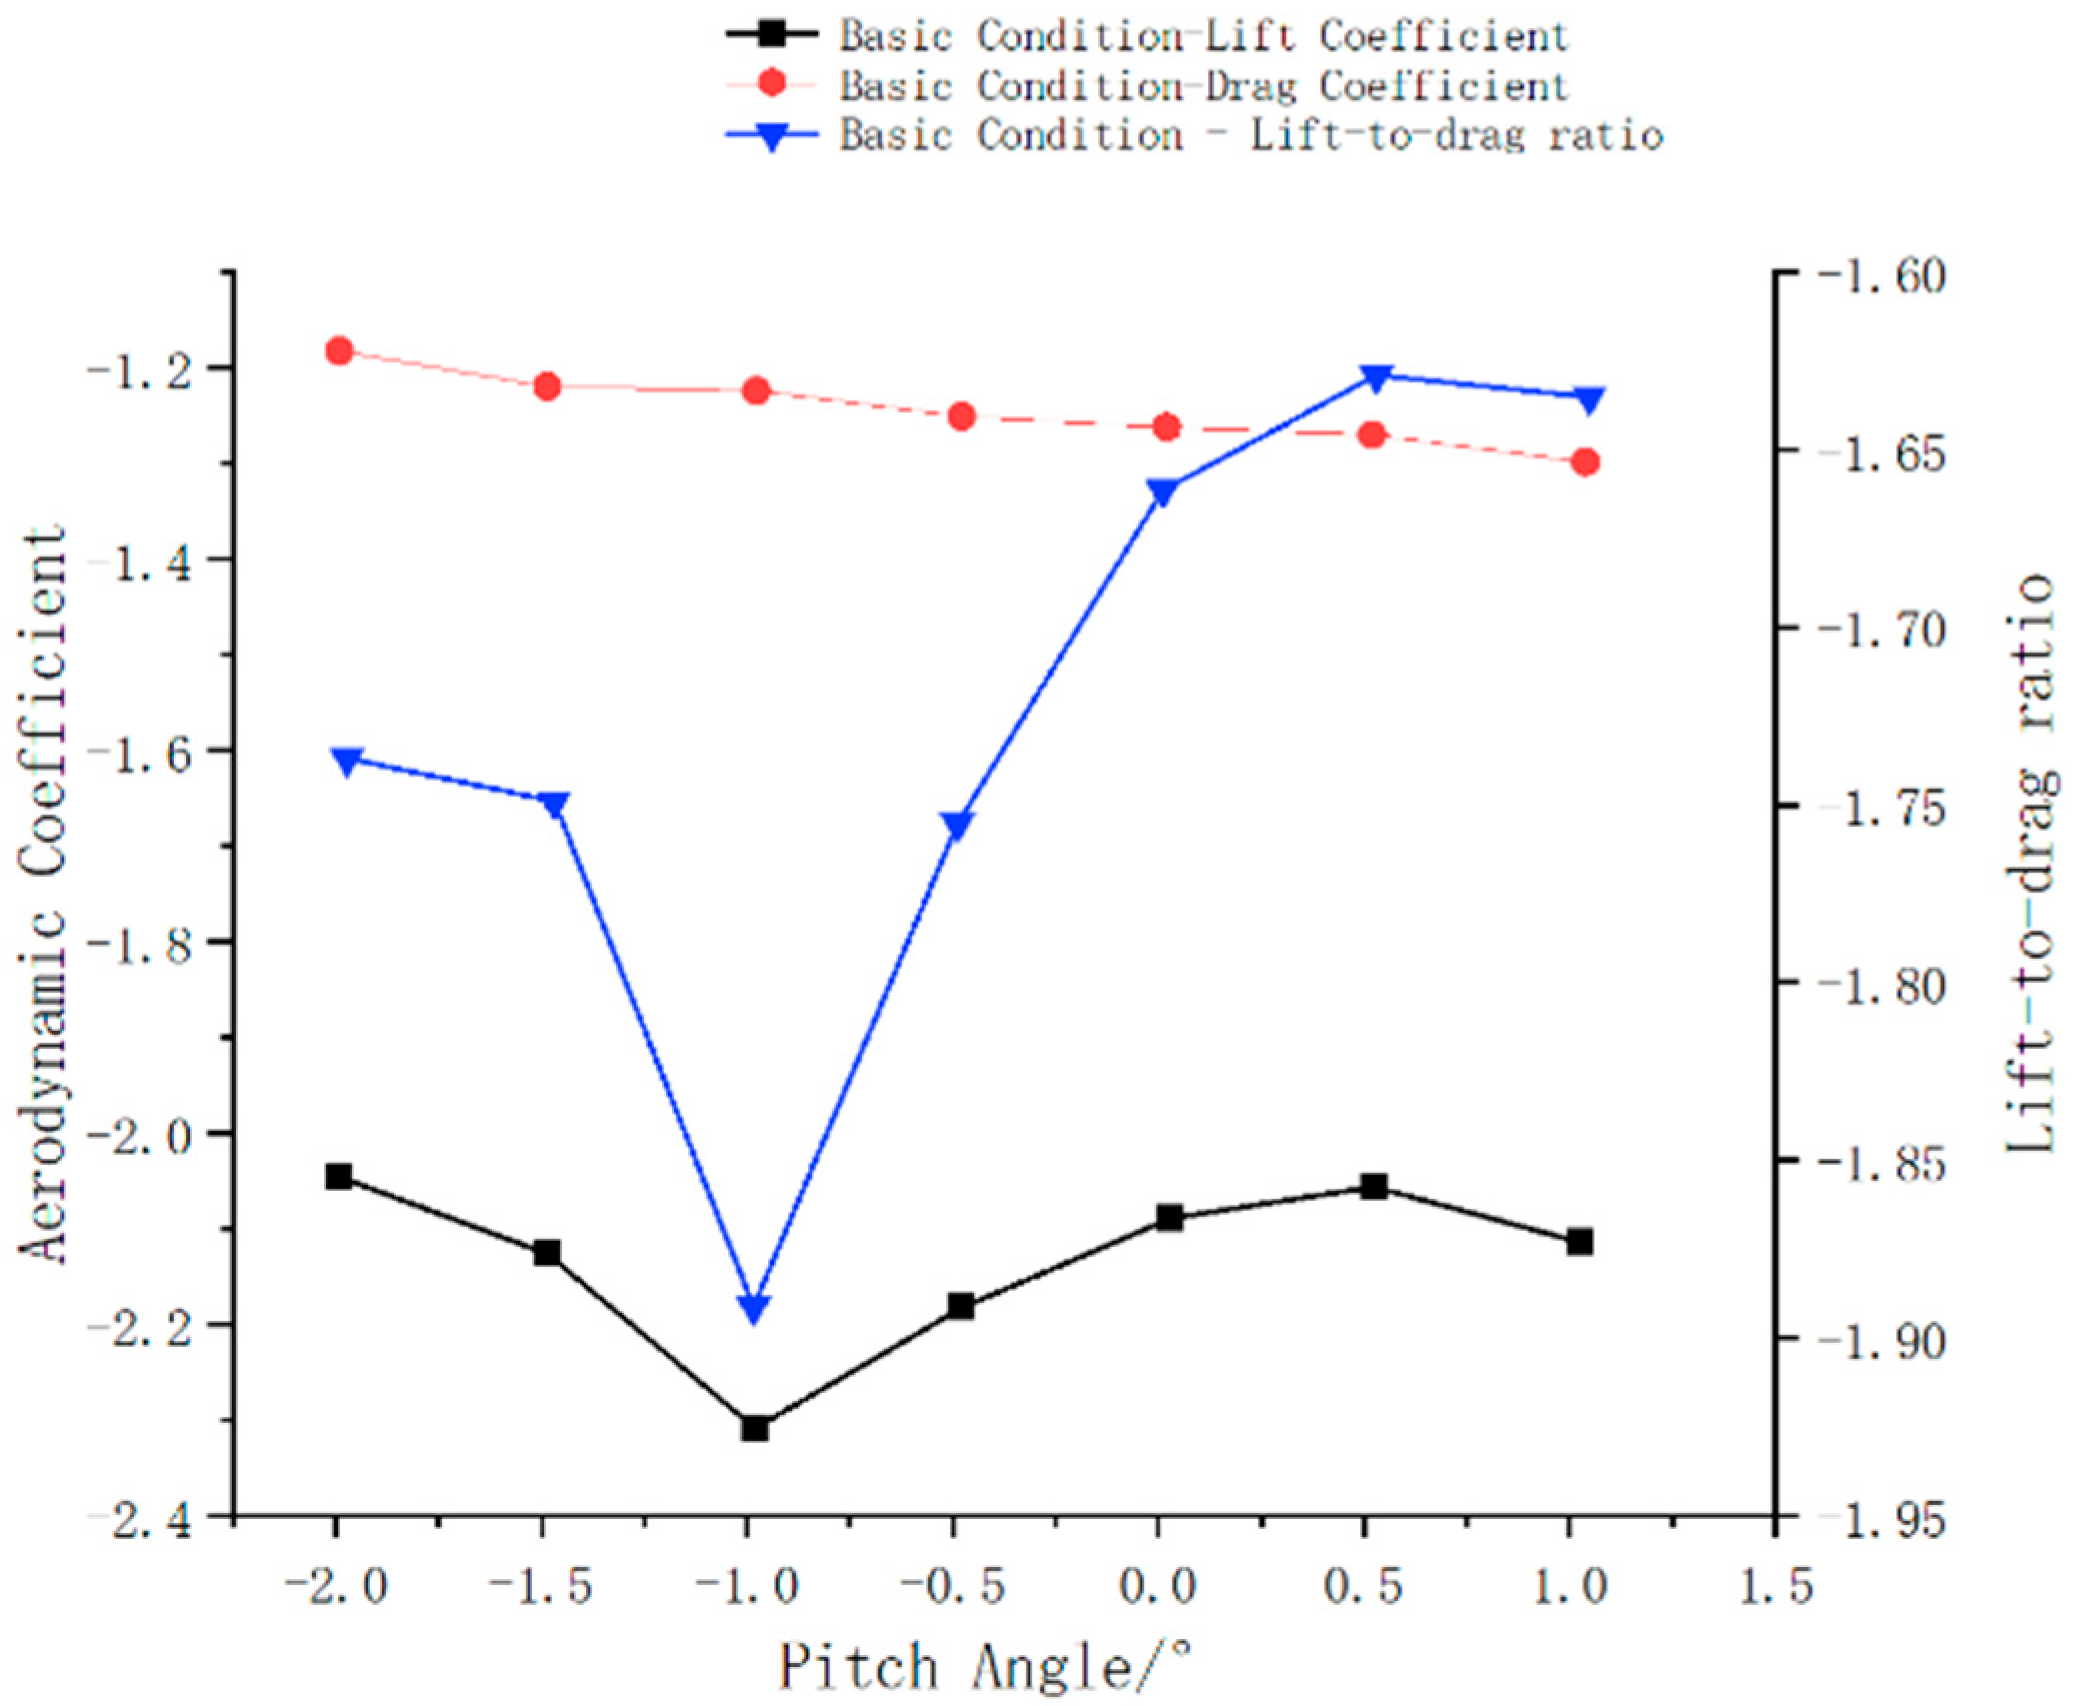
Energies 15 00393 g018
Figure 19. Curves of lift coefficient, drag coefficient and lift–drag ratio.
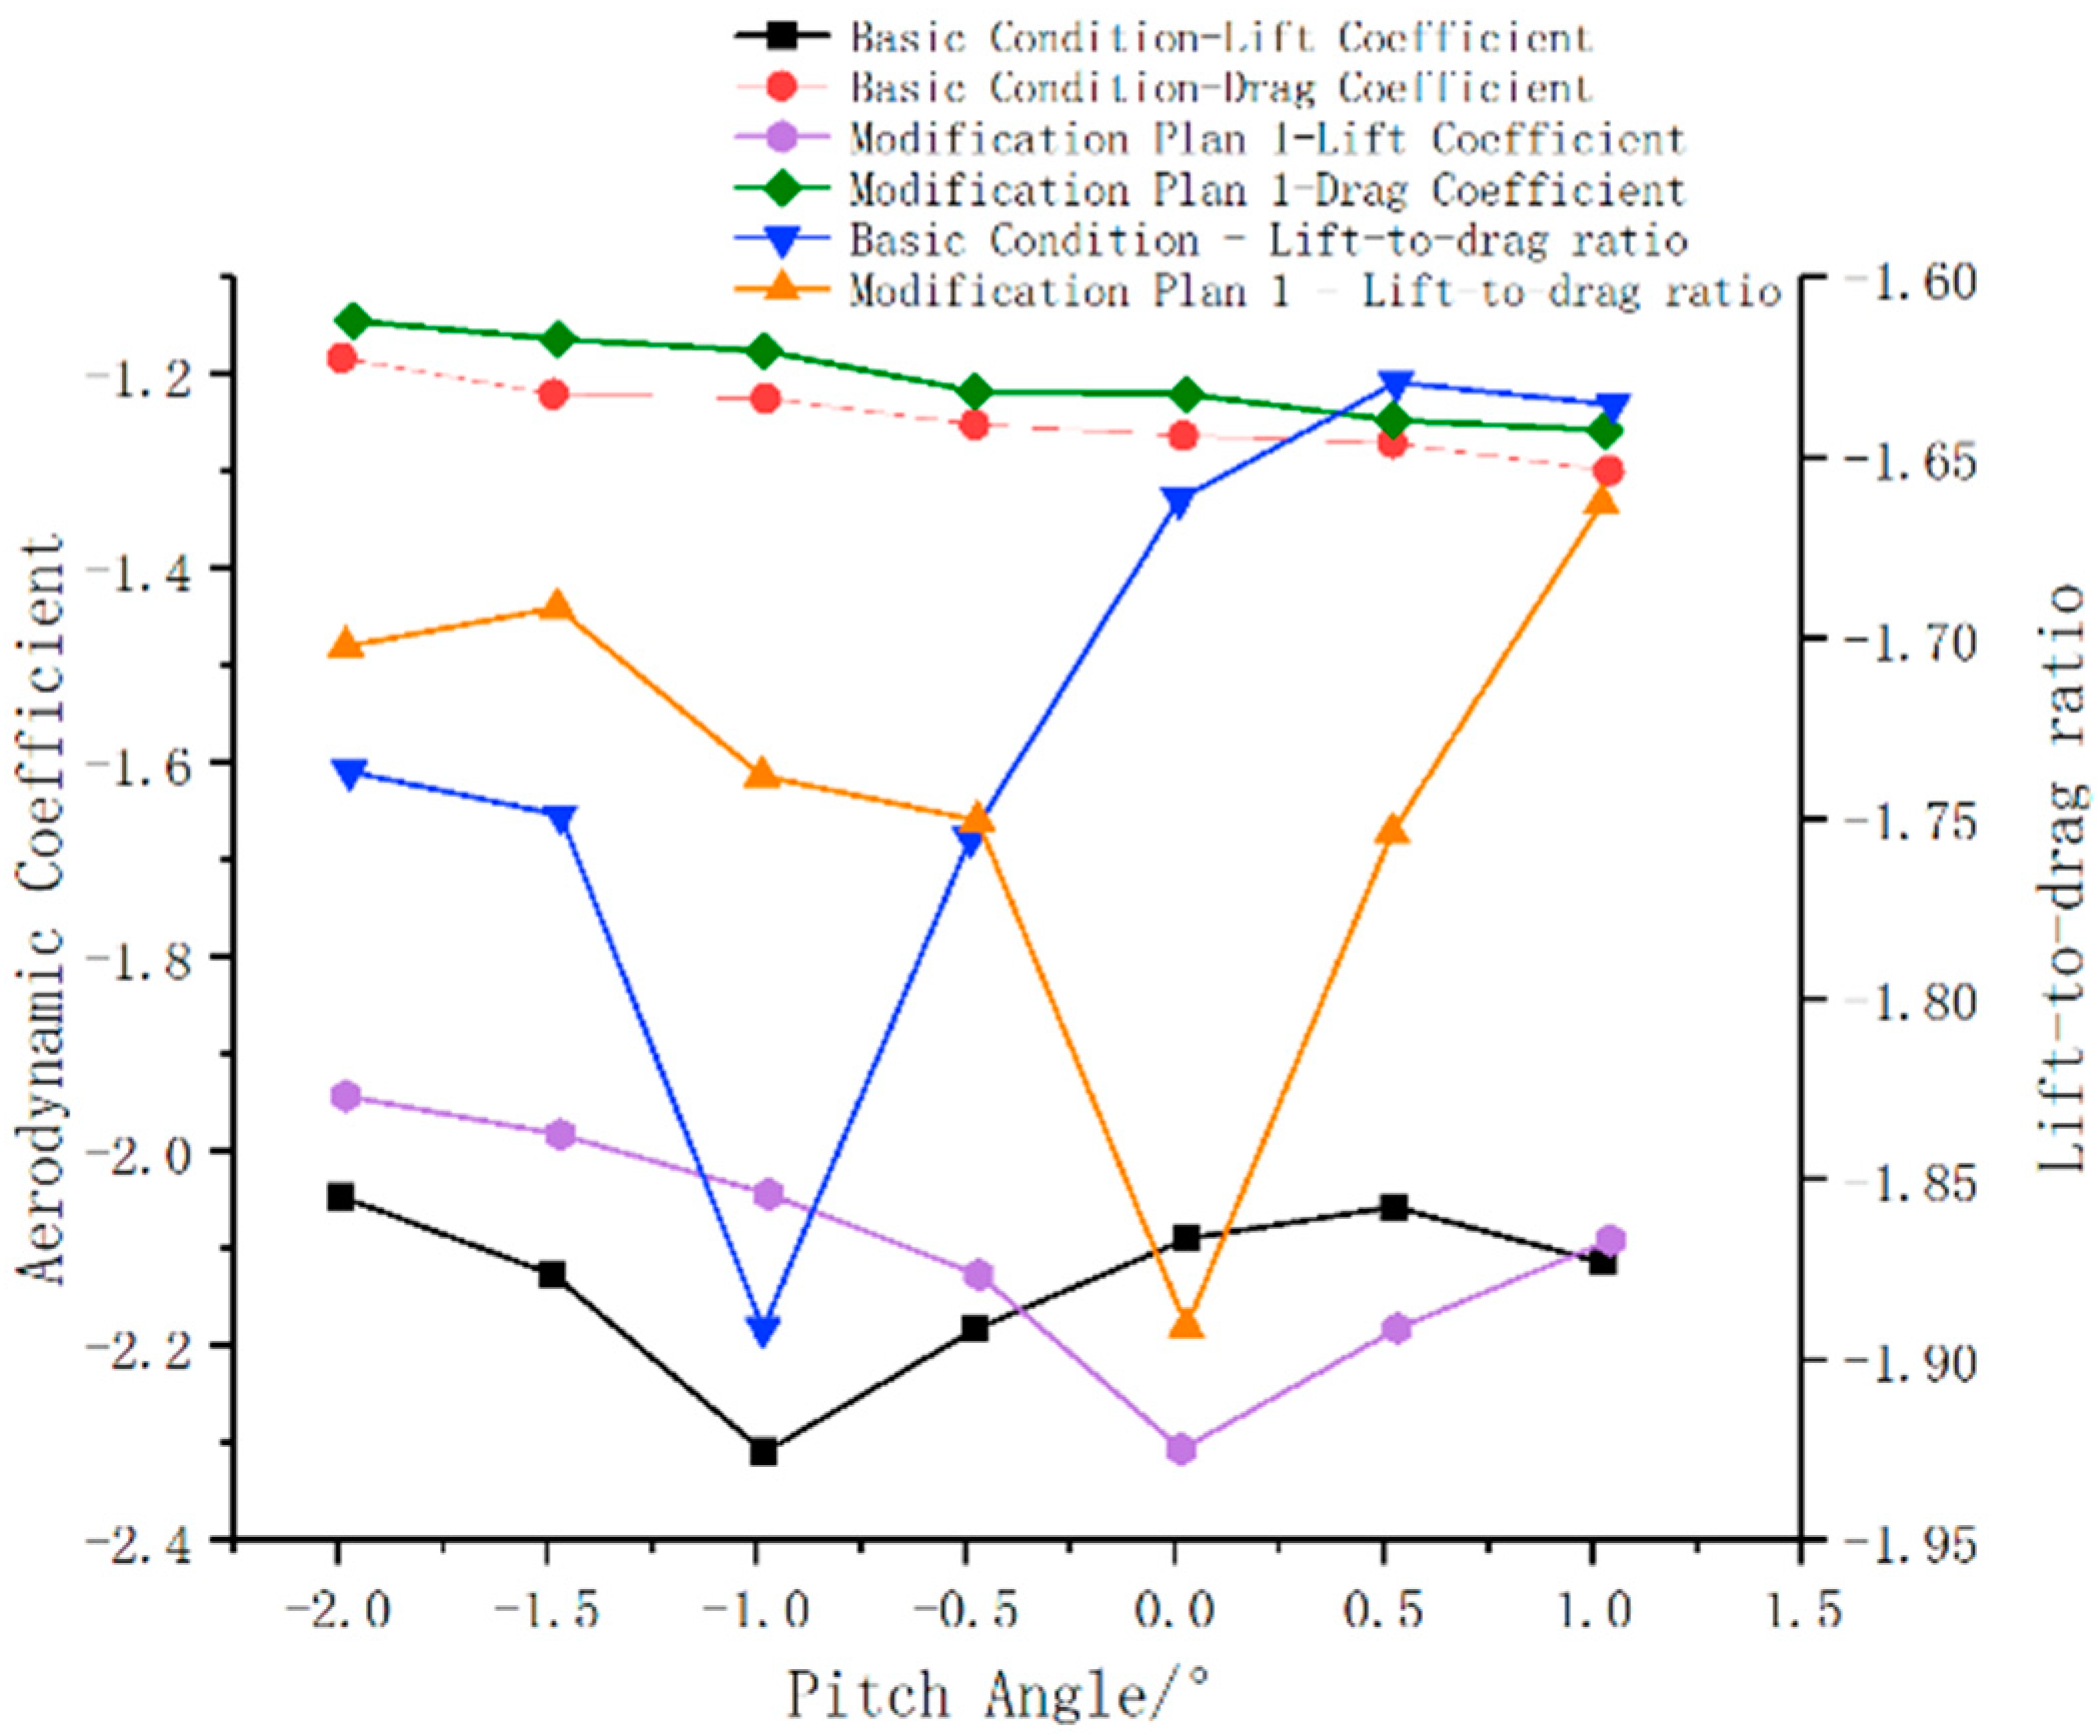
Energies 15 00393 g019
Figure 20. Curves of lift coefficient, drag coefficient and lift-to-drag ratio after adjusting aerodynamic parameters in pitching condition.
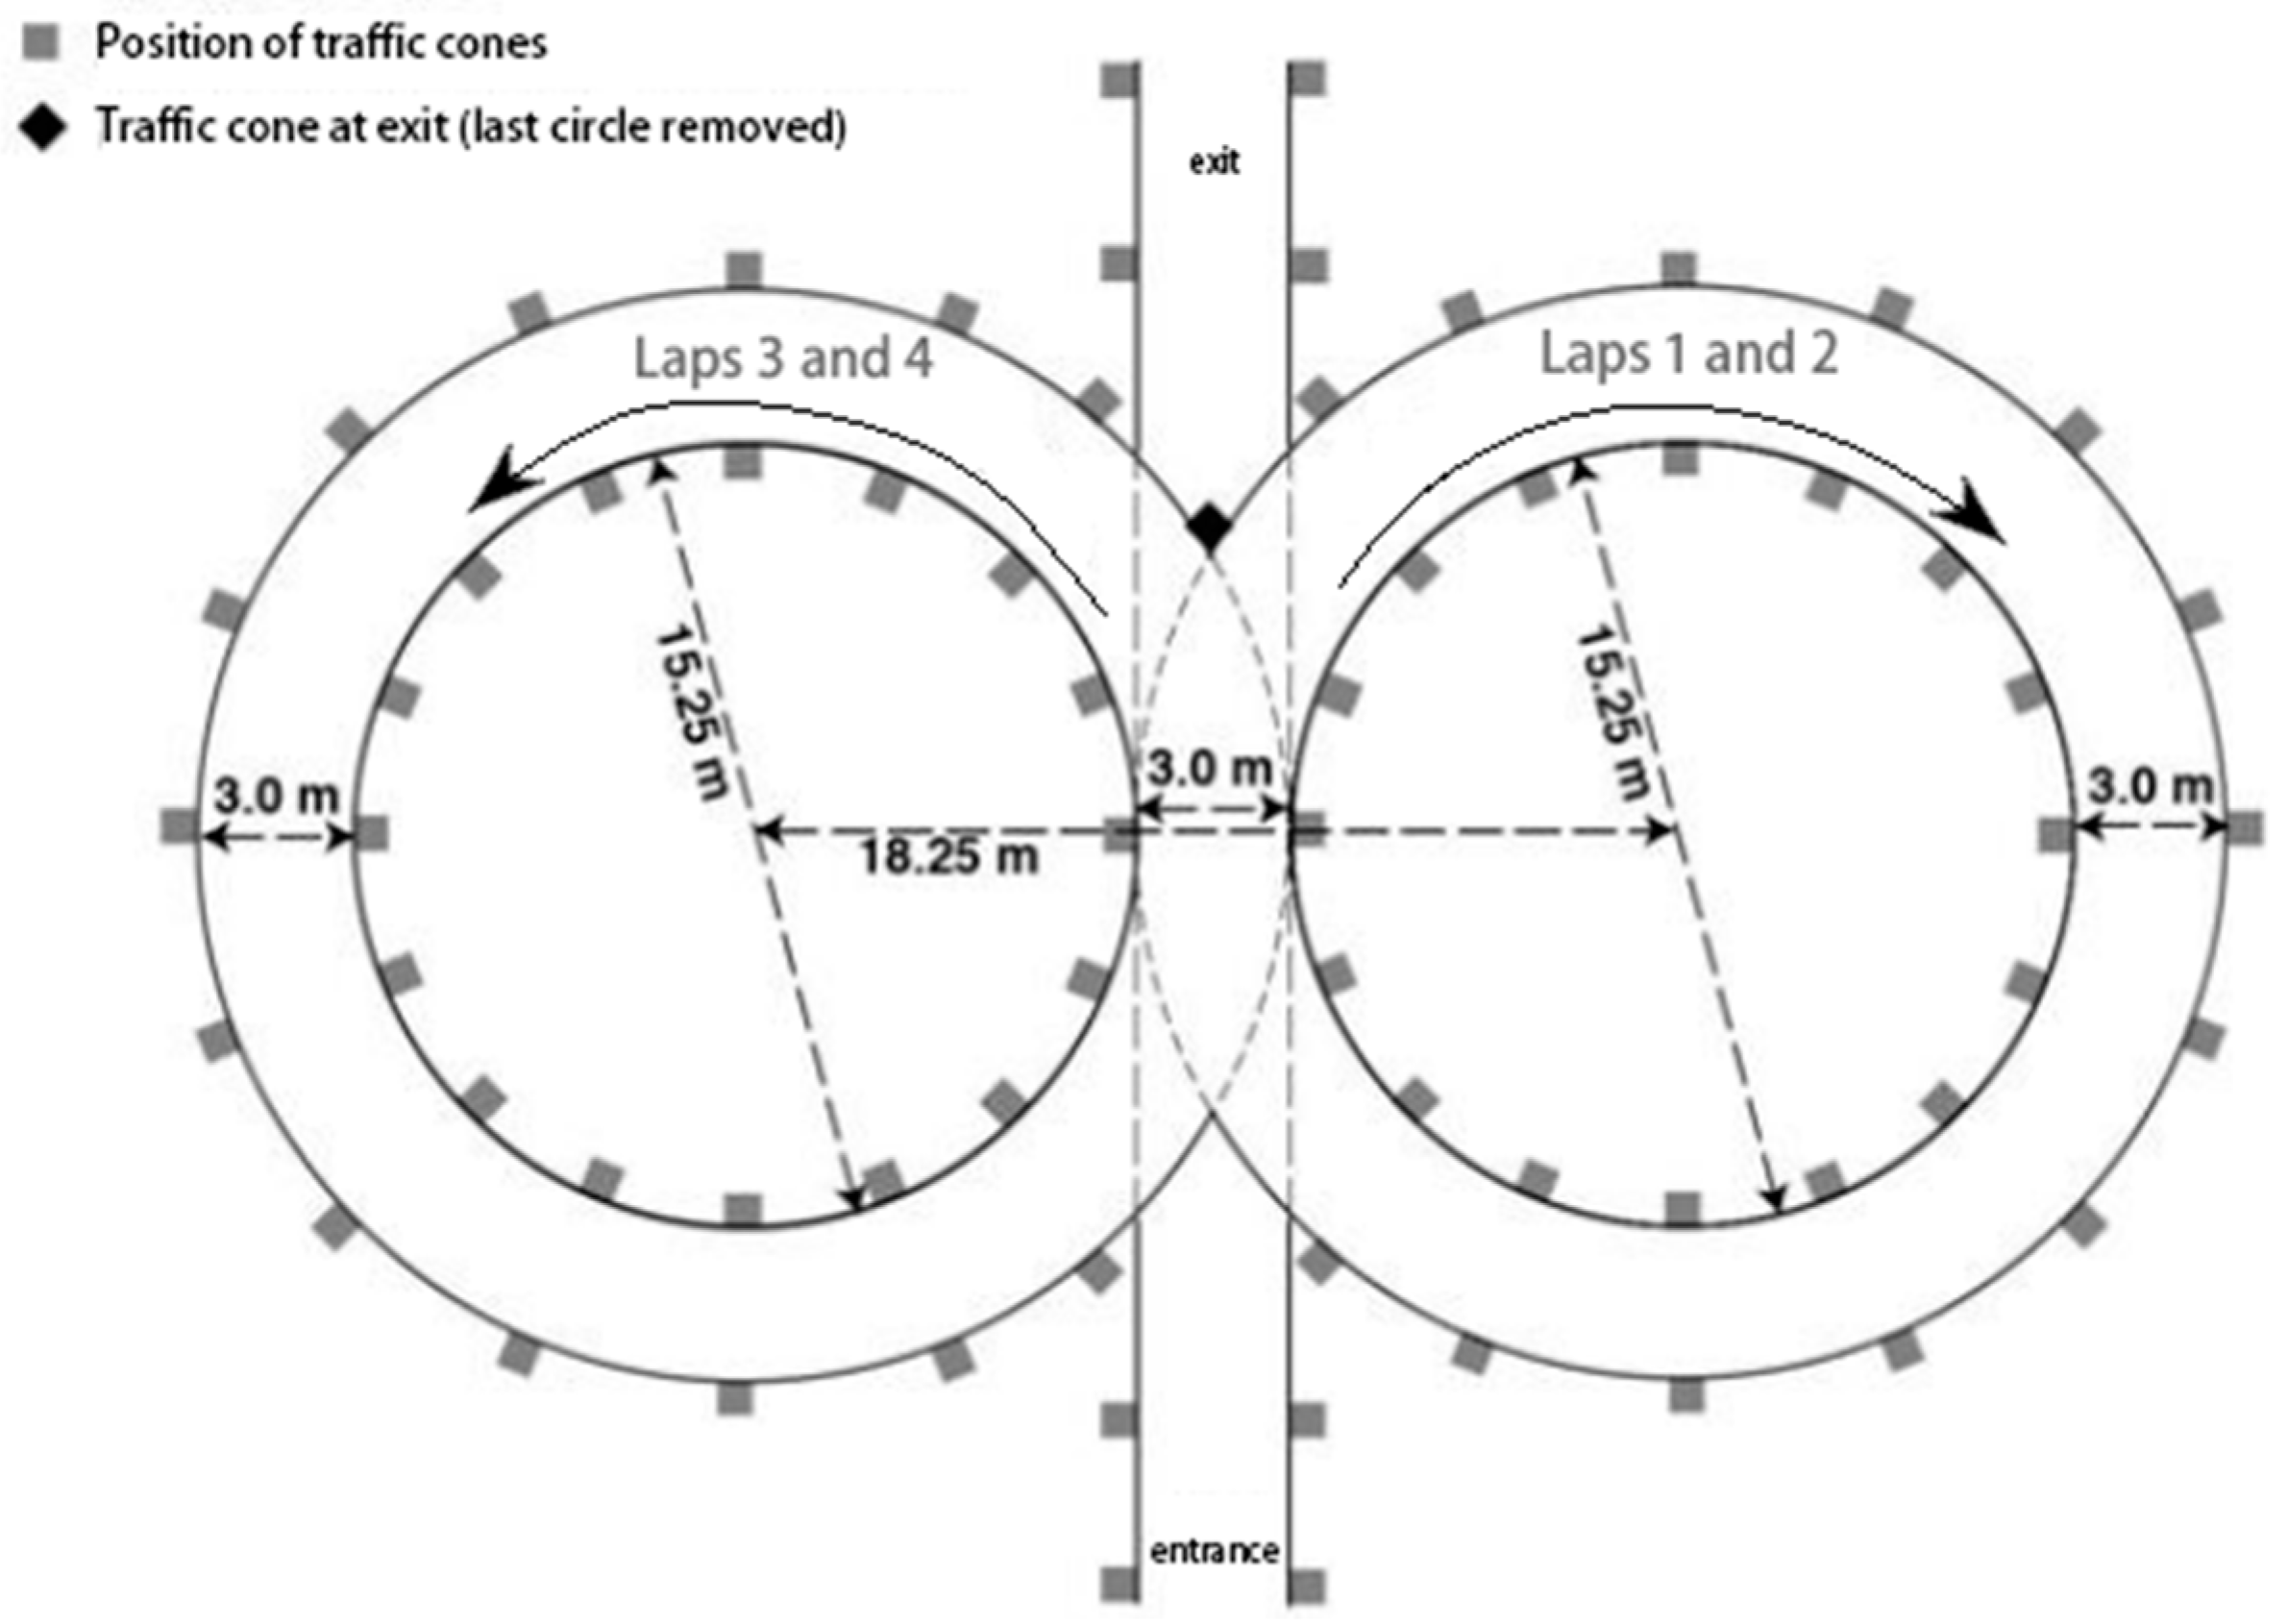
Energies 15 00393 g020
Figure 21. Figure-eight surround test layout.
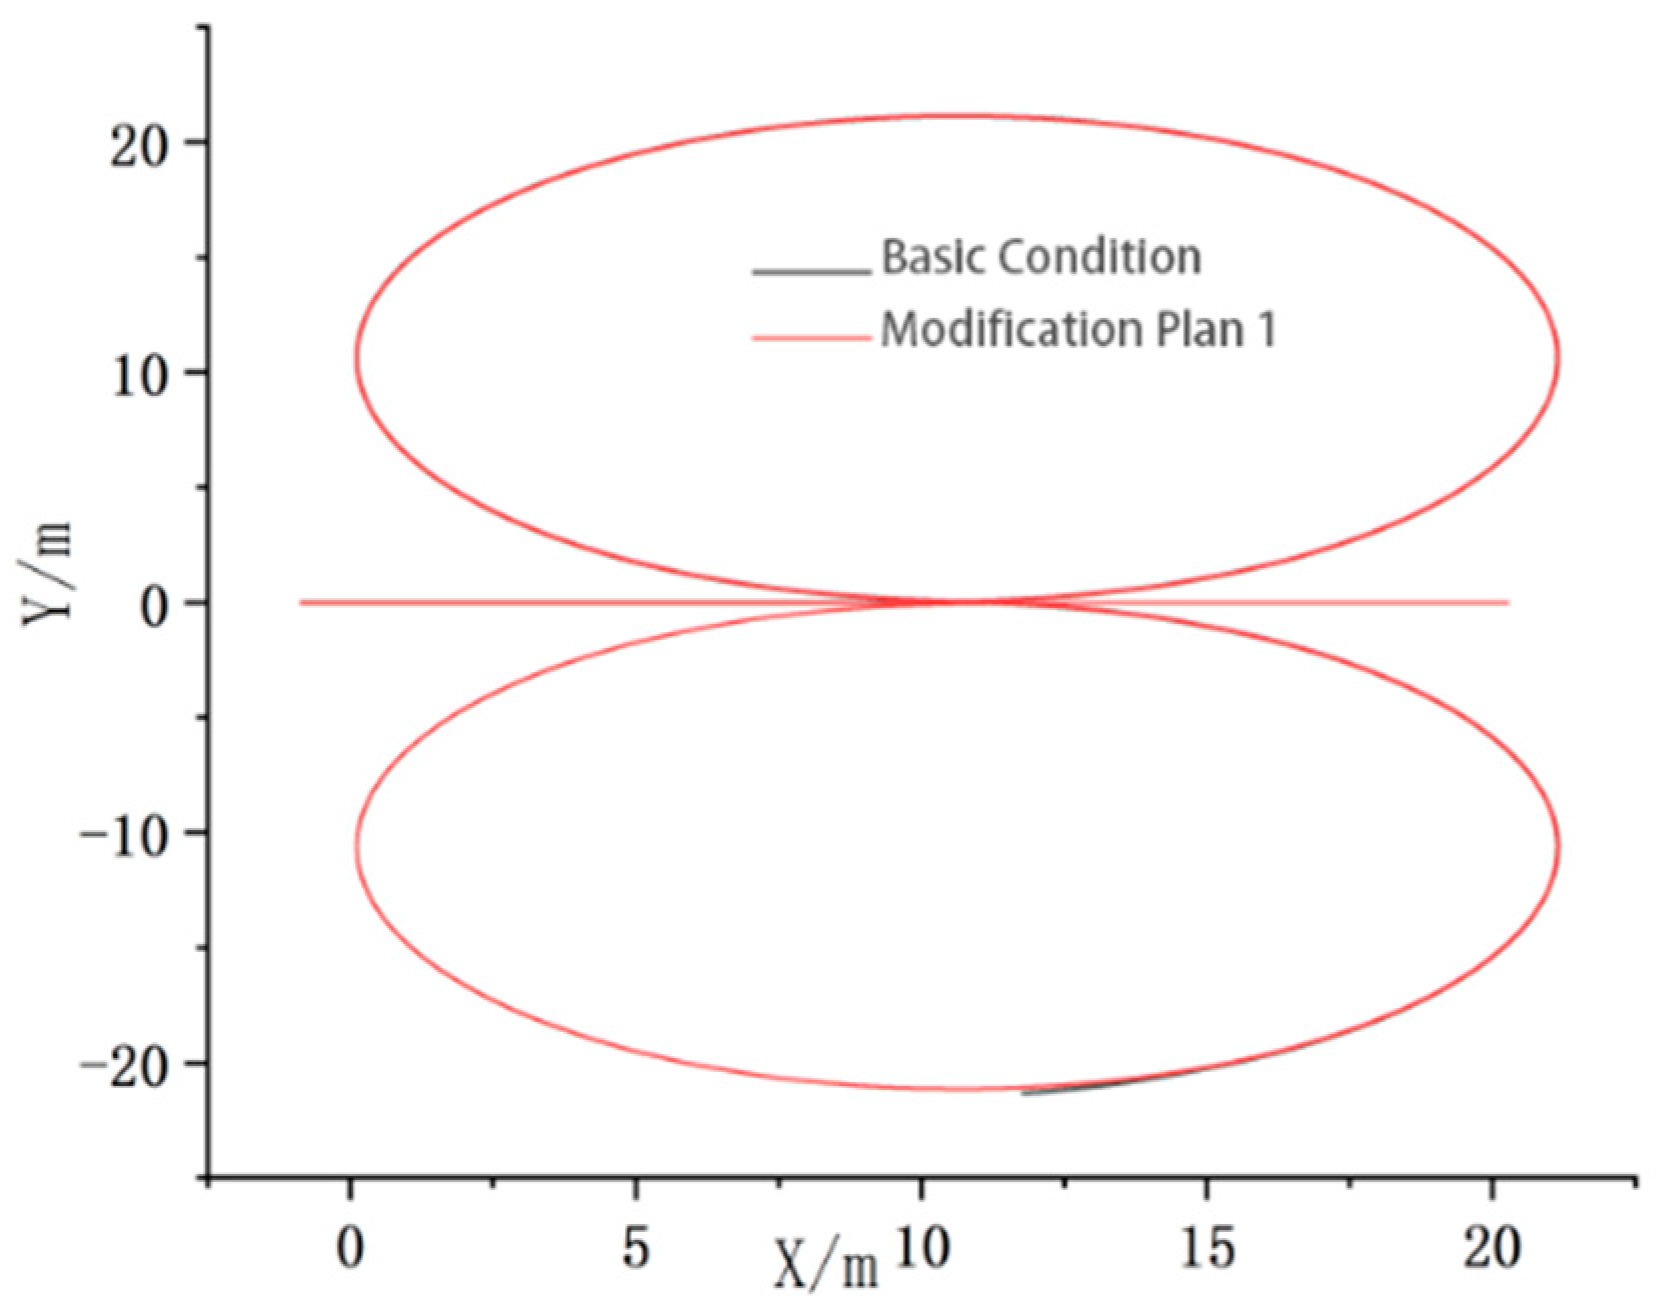
Energies 15 00393 g021
Figure 22. Comparison curve of simulation trajectory of figure-eight surround with aerodynamic parameters modification.
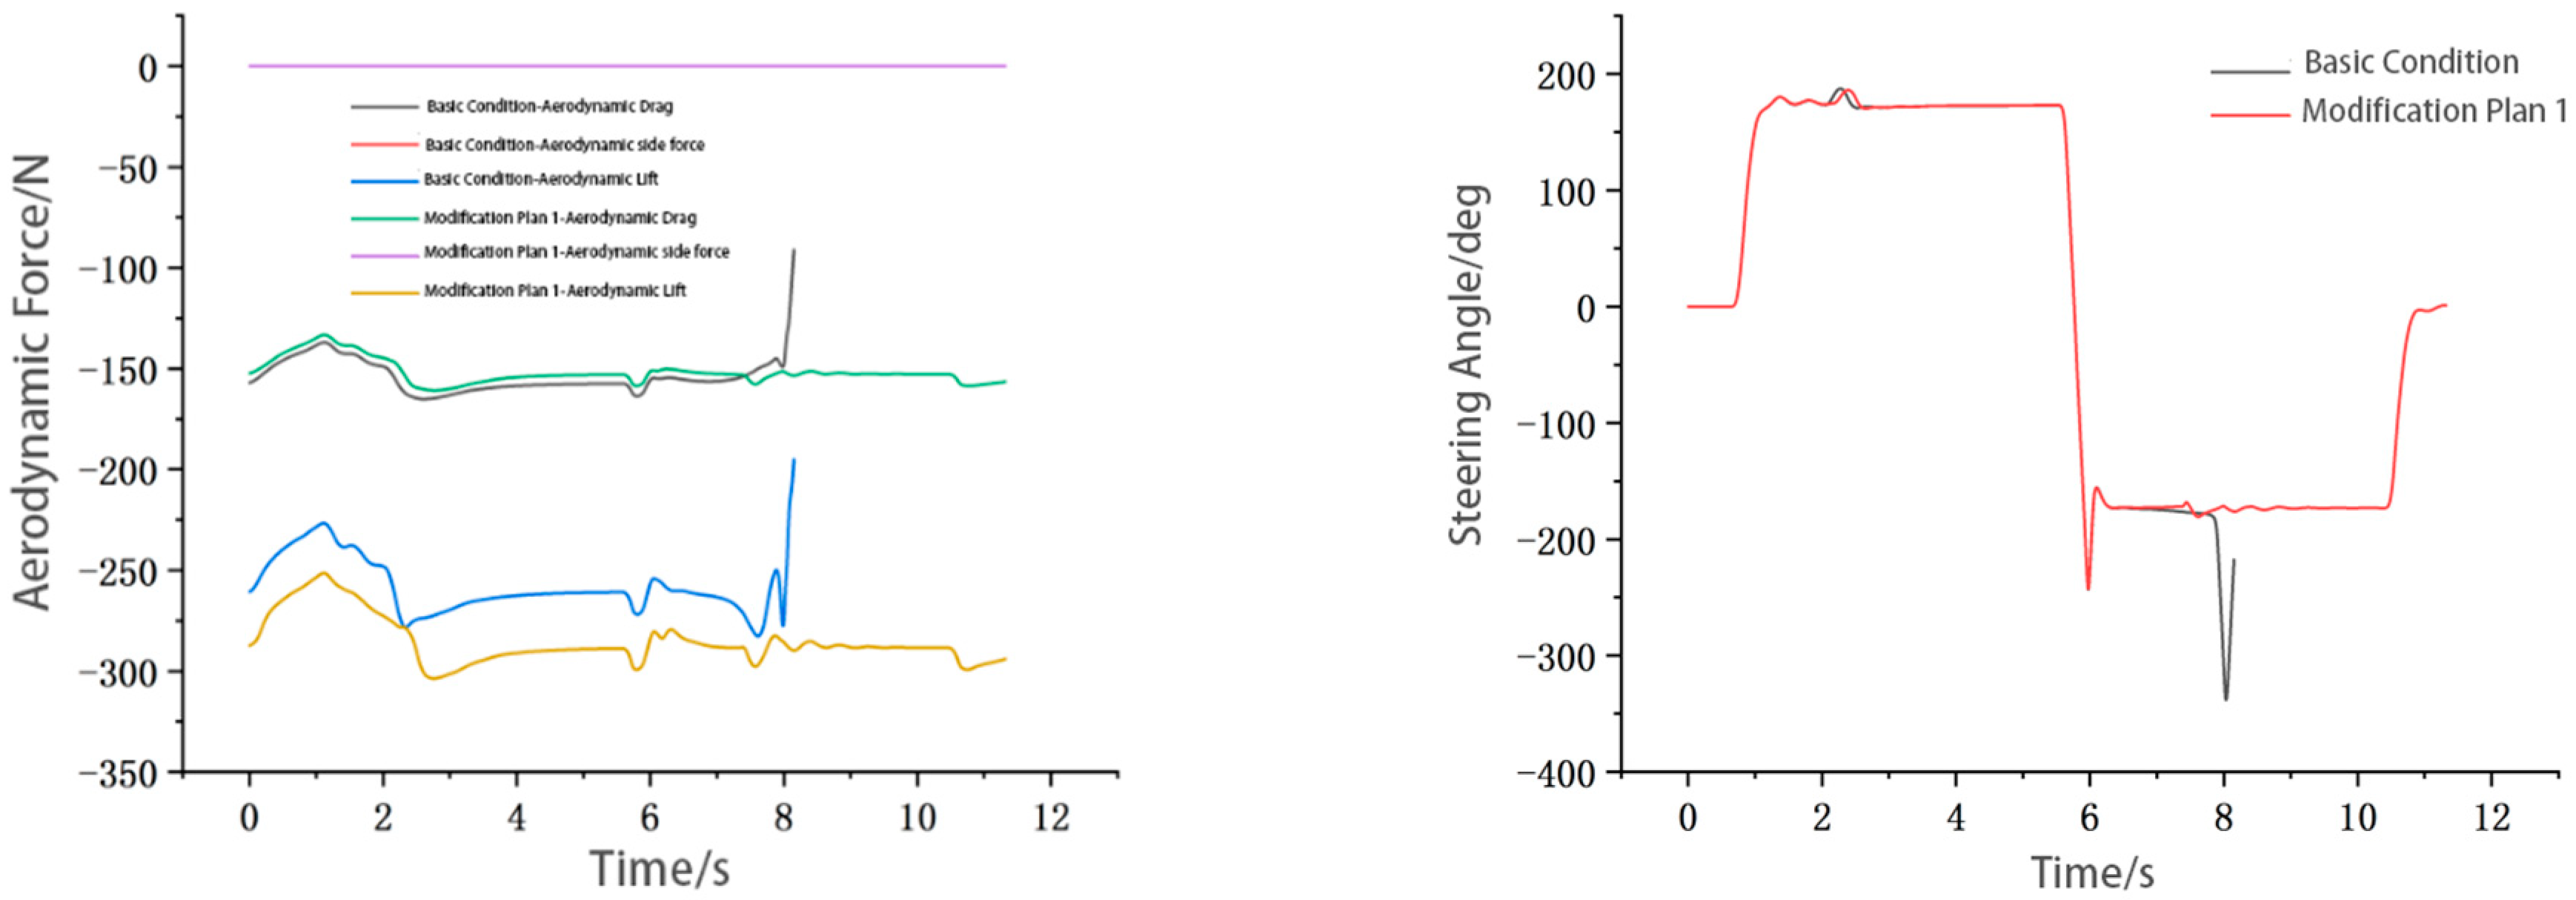
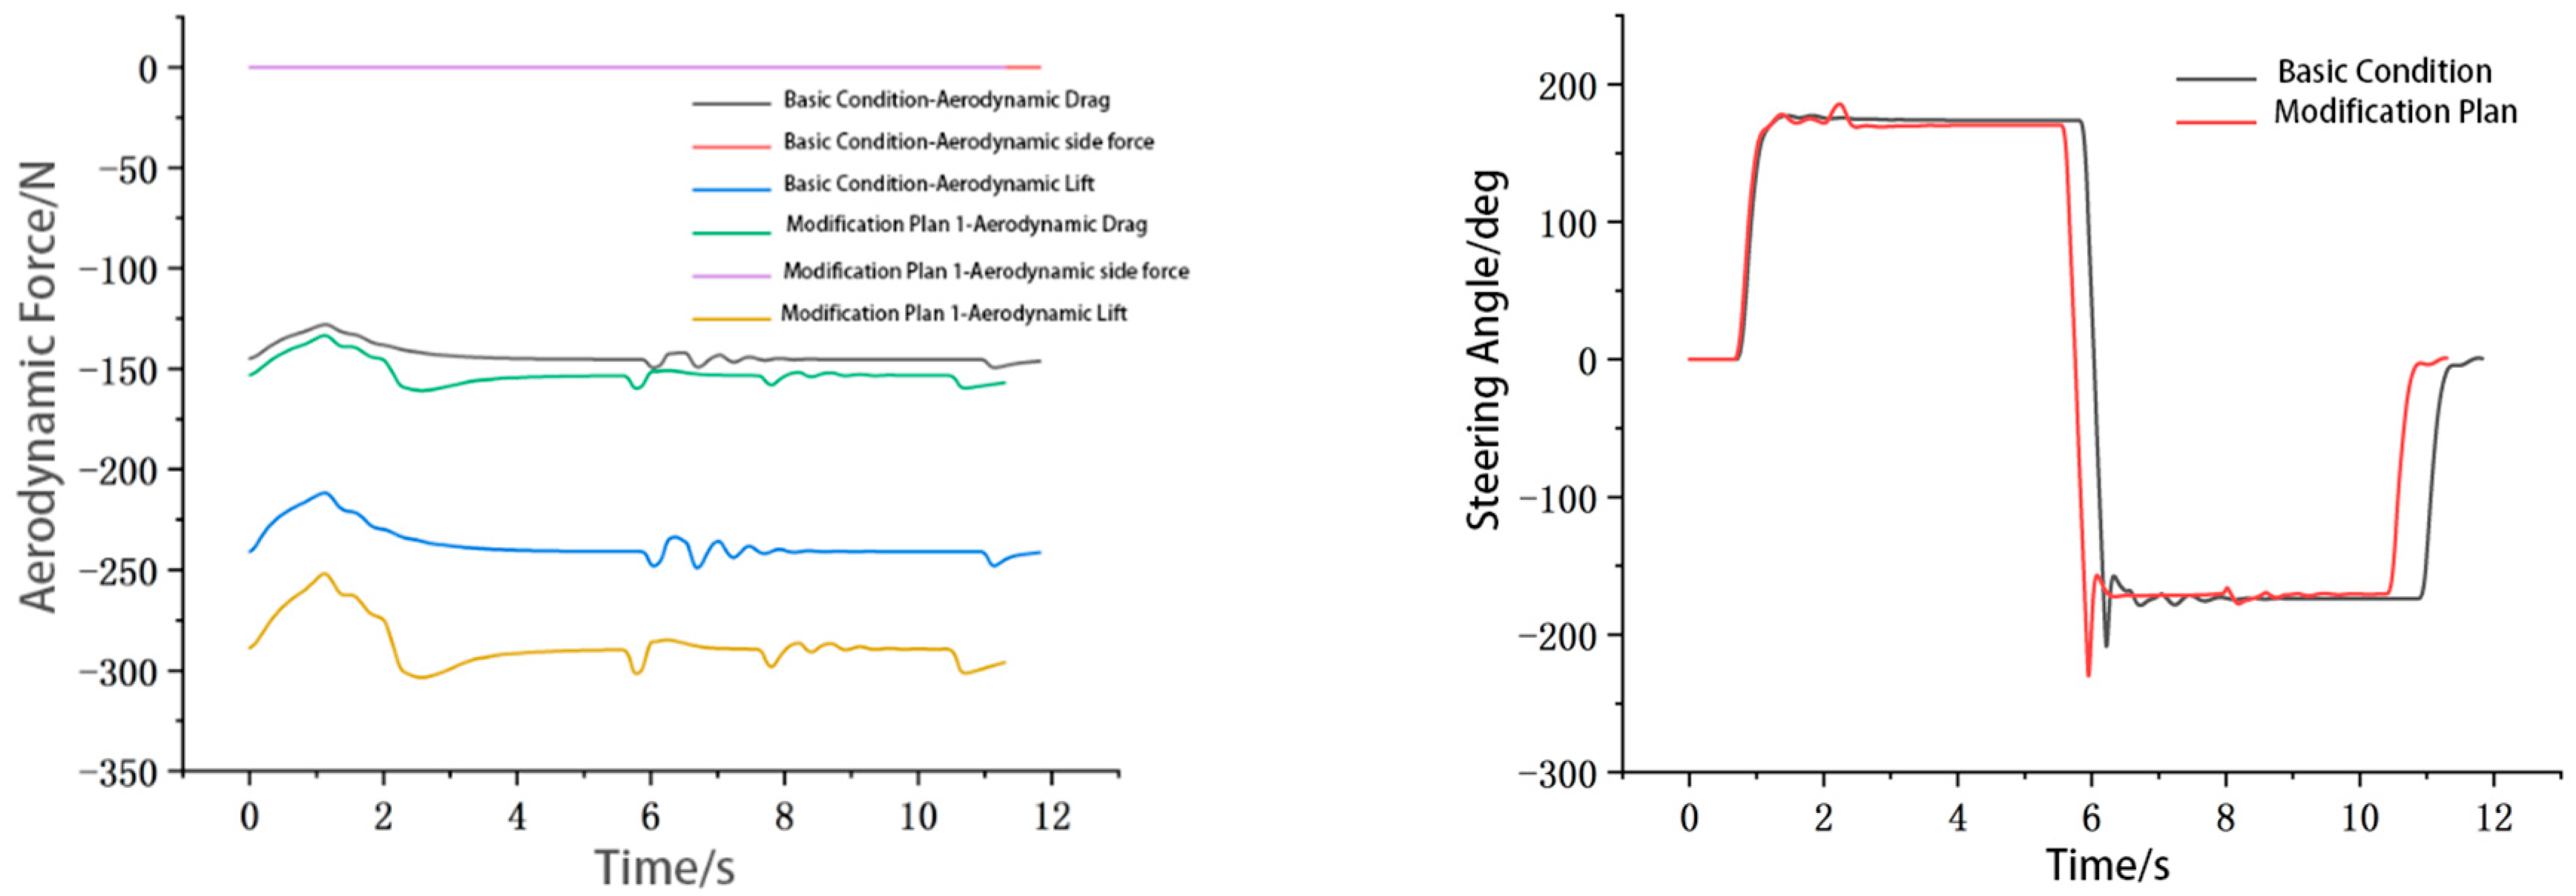
Energies 15 00393 g022
Figure 23. Comparison curve of aerodynamic force and steering–wheel angle in figure-eight surround simulation.
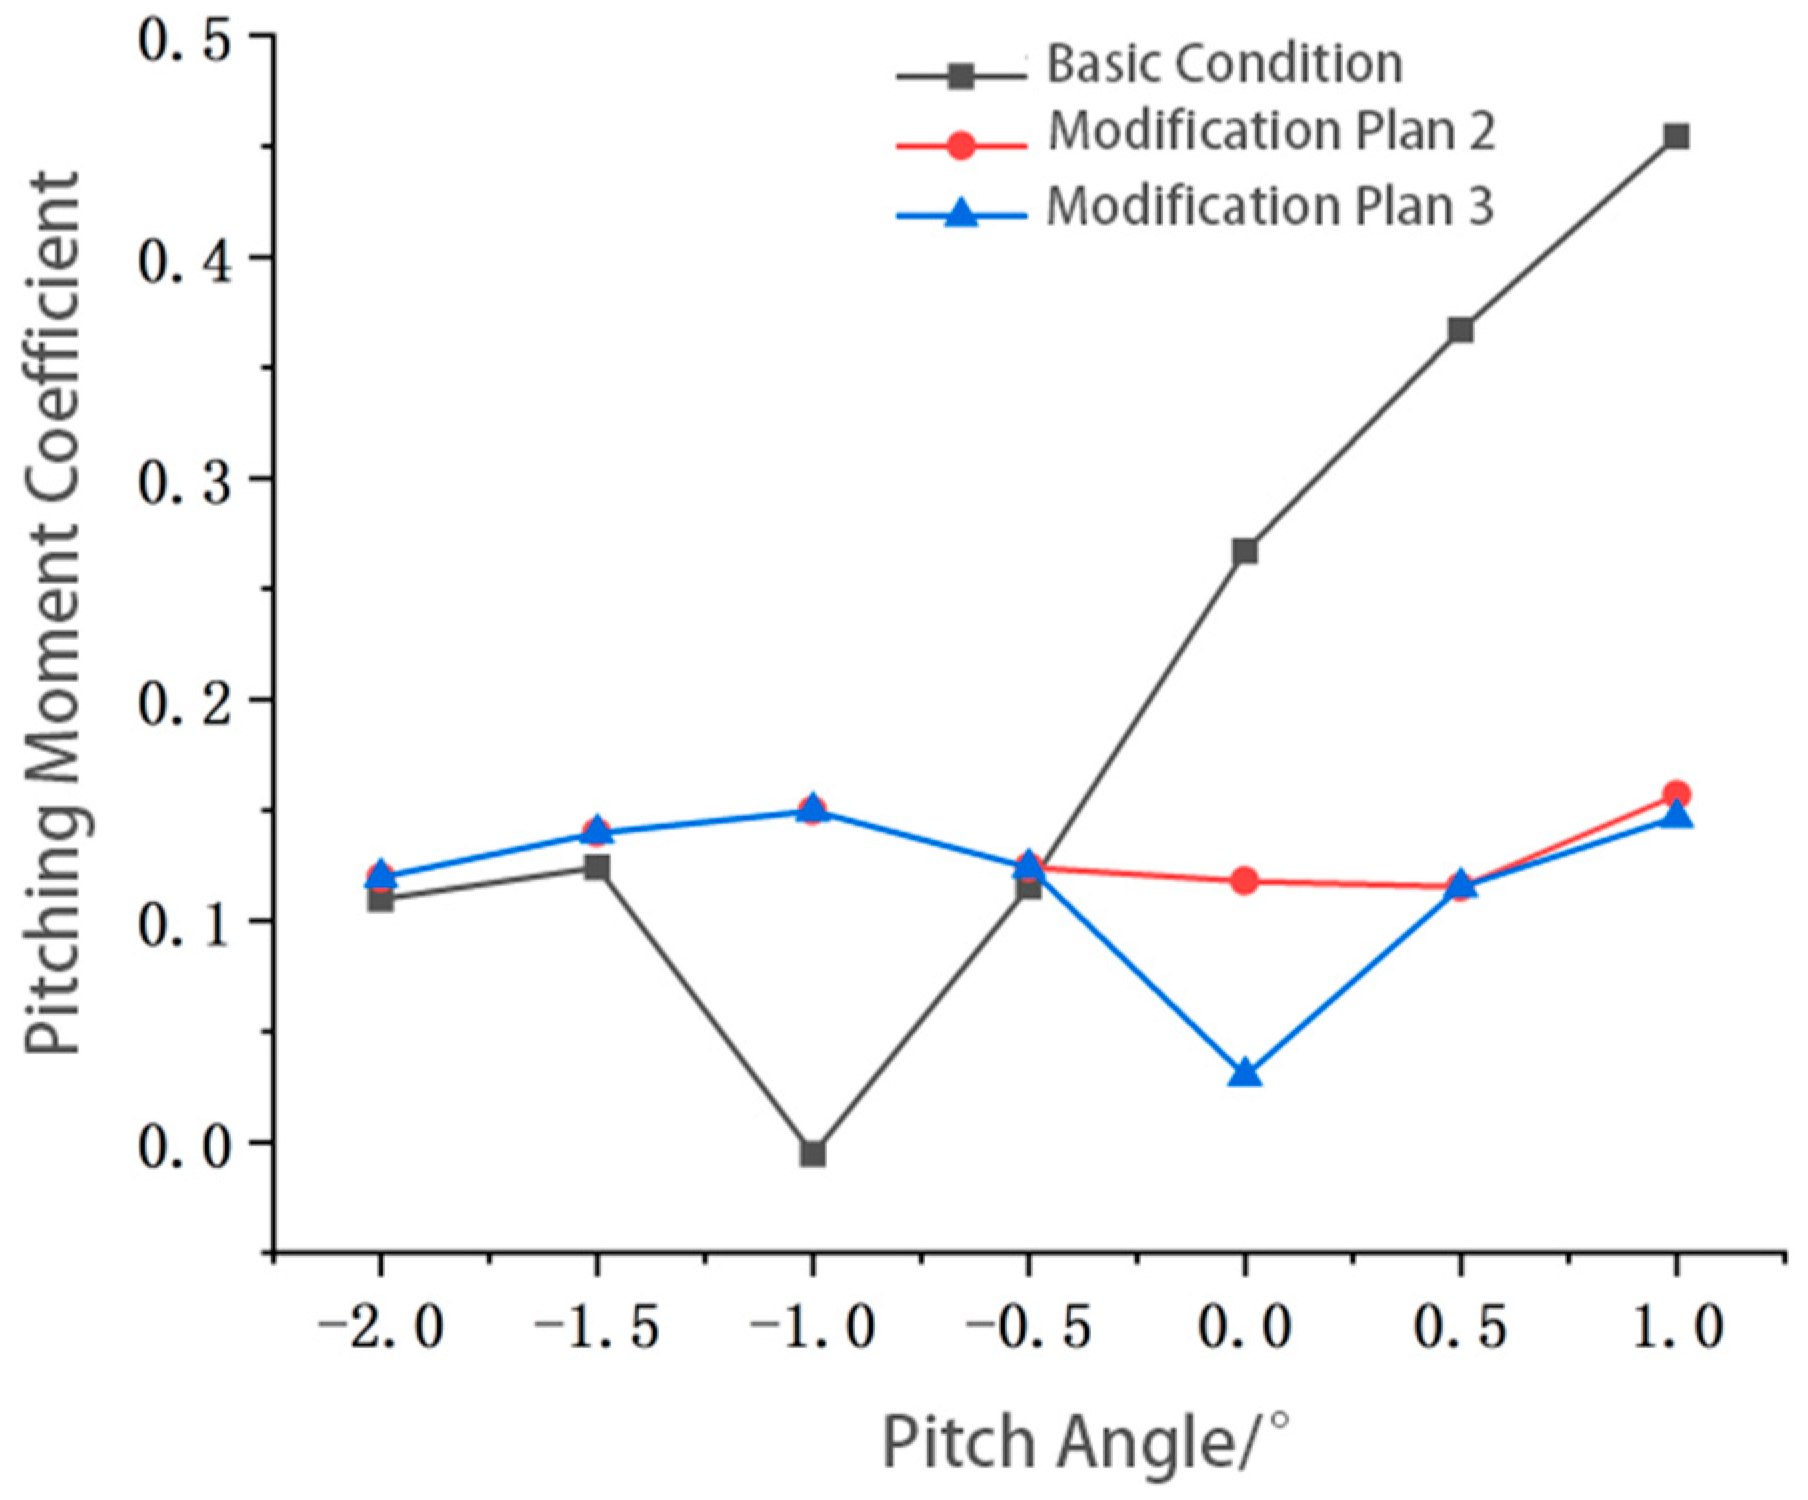
Energies 15 00393 g023
Figure 24. Comparison curve of pitching moment coefficient modification.
Energies 15 00393 g024
Figure 25. Comparison curve of pitching moment and steering-wheel angle.
Energies 15 00393 g025
Figure 26. Comparison curve of steering-wheel angle and difference of snaking test.
Energies 15 00393 g026
Figure 27. Comparison curves of aerodynamic force and steering-wheel angle of figure-eight surround simulation with different aerodynamic parameters.
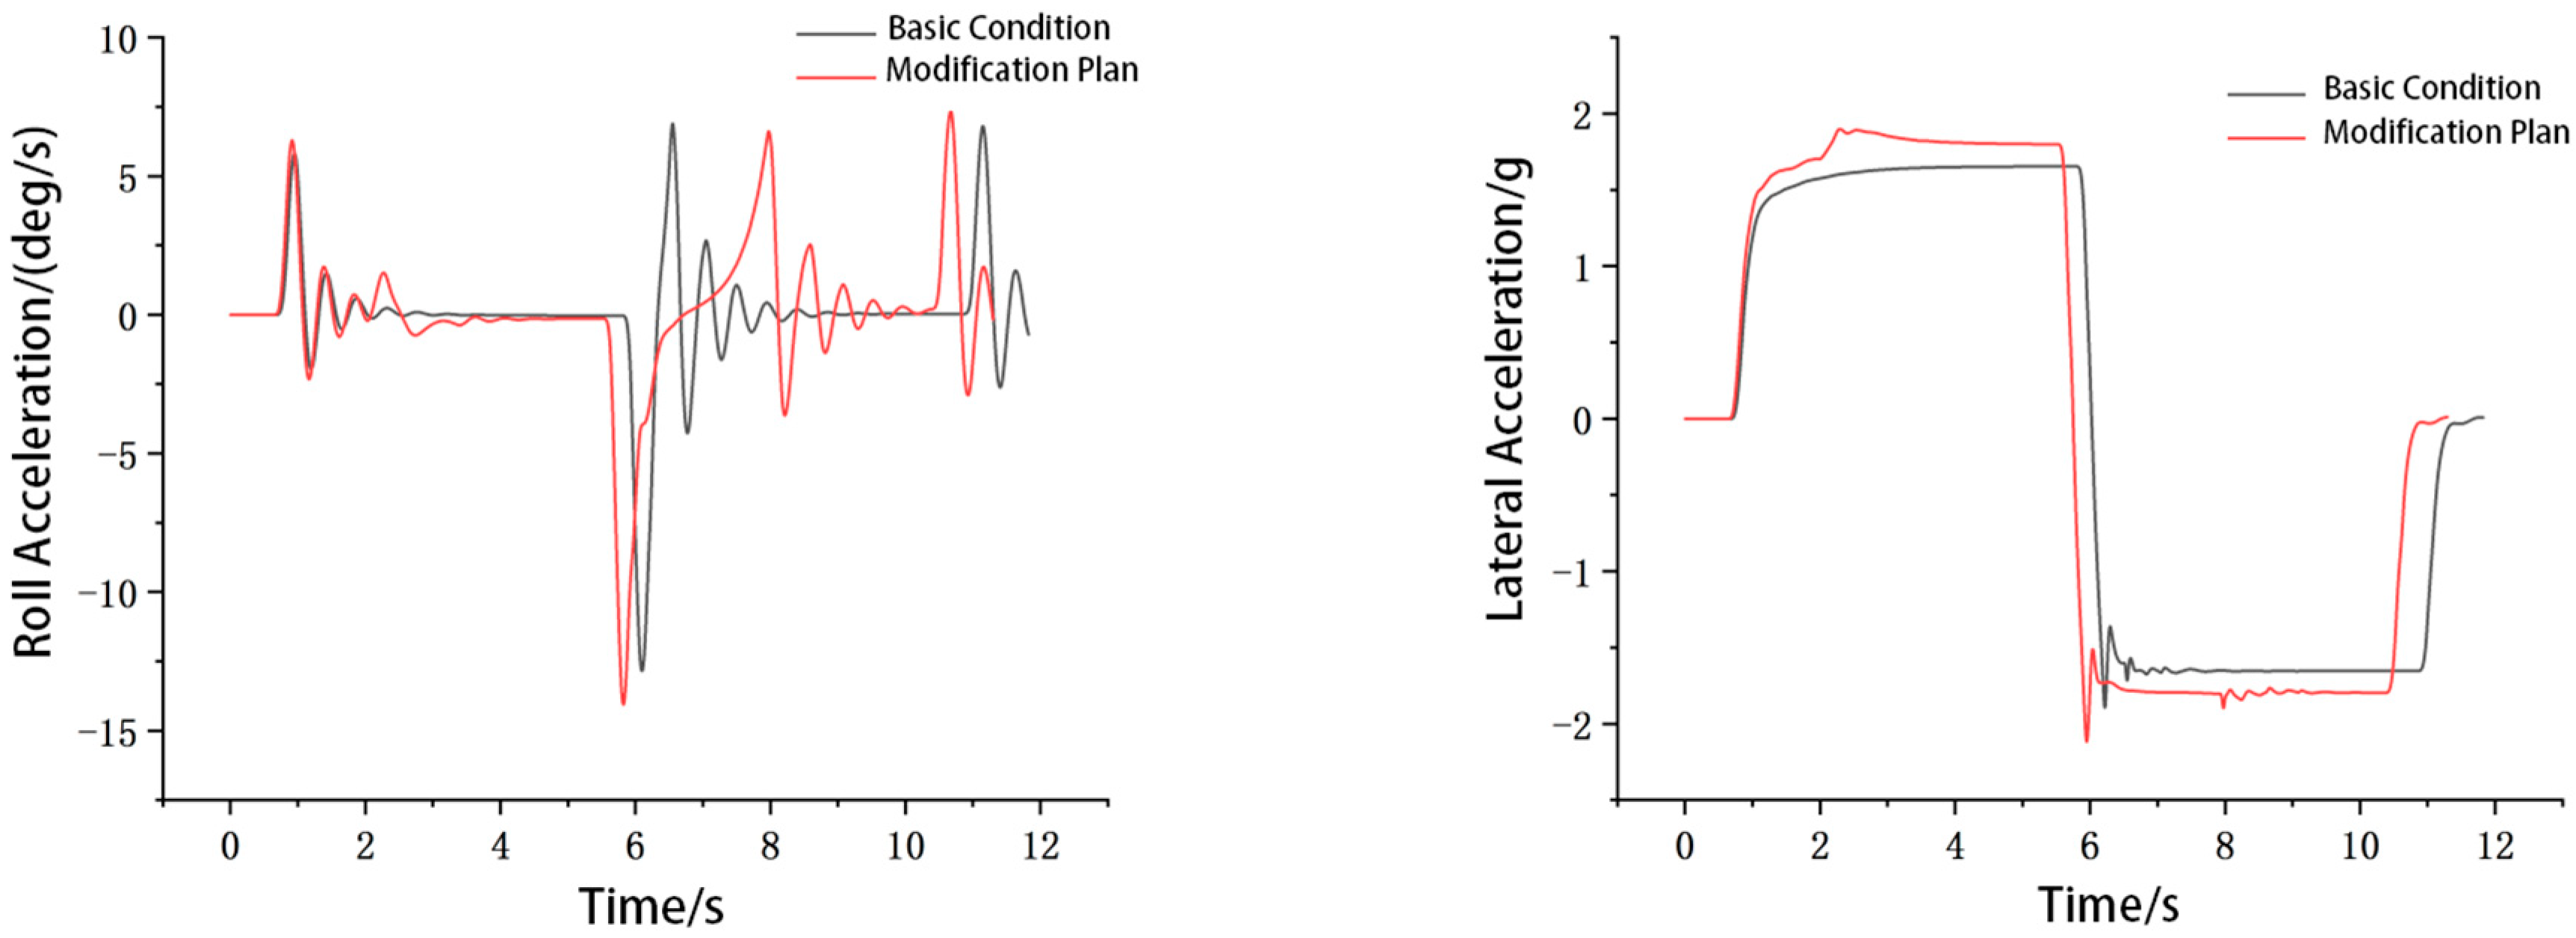
Energies 15 00393 g027
Figure 28. Comparison curves of roll angle velocity and lateral acceleration of figure-eight surround simulation with different aerodynamic parameters.
Energies 15 00393 g028
Table 1. Final simulation strategy.
TypeRelated Parameter
Turbulence modelSST k-ω model
Boundary conditionInlet velocity v = 15 m/s
Outlet pressure p = 0 Pa
Air density ρ = 1.18415 kg/m3
Sliding surface
Ground slip
TypeRelated Parameter
Boundary layerLayer number 11
Thickness 8 mm
Expansion ratio 1.2
Grid base size0.512 m
Calculation domain11 length × 12 width × 5 height
Table 2. Comparison of lift coefficient and drag coefficient between numerical simulation and wind tunnel test.
Numerical SimulationWind Tunnel TestRelative Error
Lift coefficient−2.089−1.9686.14%
Drag coefficient1.2541.1954.94%
Table 3. Aerodynamic characteristics of FSAE racing car under the action of 10° crosswind angle.
Lift/NDrag/NLateral Force/N
Wind-tunnel-test data−280.389182.319−87.743
Yaw-model-method simulation−292.389194.784−85.709
Table 4. Lift data and drag data of racing components in pitching conditions of −1.0°, 0° and 0.5°.
Component NamePitch −1.0° (Lift/N)Pitch 0° (Lift/N)Pitch 0.5° (Lift/N)Pitch −1.0° (Drag/N)Pitch 0° (Drag/N)Pitch 0.5° (Drag/N)
Body−110.806−97.763−95.09676.60381.68981.517
Front wheel10.19810.66013.7979.02310.65112.136
Front wing−114.849−94.890−93.48224.11721.99022.133
Rear wheel10.52712.74610.83411.42812.06810.953
Tail−148.934−145.772−140.72366.25464.89065.166
Total−353.866−315.027−304.670187.425191.299191.904
Table 5. Variation conditions of crosswind angle of vehicle attitude stability.
Vehicle AttitudeLevel of Stability
Crosswind angle/°0, ±10, ±20, ±90, ±160, 180
Table 6. Data of downflow velocity, vehicle velocity and crosswind velocity at crosswind angle in crosswind simulation part.
Crosswind angle β±10°±0°±0°±160°180°
Wind velocity V (m/s)1515151515
Vehicle velocity VA (m/s)14.77214.0950−14.095−15
Crosswind velocity VW (m/s)±2.605±5.13015±5.1300
Table 7. Parameters of dynamic simulation model.
Component/SystemParameter NameUnitNumerical
Body assemblyTotal weightkg260.000
Height of the center of massmm280.000
Moment of inertia about the X axiskg.m2304.763
Moment of inertia about the Y axiskg.m2109.800
Moment of inertia about the Z axiskg.m2122.875
Longitudinal position of center of mass from front axismm866.250
Center of mass to the longitudinal plane in a transverse positionmm0
Steering systemKingpin inclination angle°7.000
Kingpin rake angle°25.000
Steering force ratio 1/3.800
Suspension systemFront overhangUnsprung masskg18
Front-wheel camber −0.500
Front-wheel beam Angle −0.700
Stiffness of suspension spring 30.000
Shock absorber dampingN/(mm/s)3.600
Rear overhangUnsprung masskg22.000
Stiffness of suspension springN/mm45.000
Shock absorber dampingN/(mm/s)2.400
TyreOuter diameterinch18.300
Tread widthinch7.500
Applicable rim widthinch7.000–8.000
Weightkg4.540
AerodynamicsAerodynamics reference point XYZmm(−866.250,0,46.100)
Orthographic areaA/m²1.145
WheelbaseL/mm1575.000
Air density Dkg/m³1.184
Table 8. Performance indexes of snaking test at 65, 70 and 75 km/h without crosswind.
Average Velocity/(km/h)Transit Time/sAverage Peak Lateral Acceleration/(m.s−2)Peak of Average Crosswind Angle Velocity/(deg.s−1)Peak of Average Steering-Wheel Angle/deg.
64.80511.75.83418.49739.087
69.77210.8756.80420.02040.833
74.73410.1507.84521.53842.572
Table 9. Performance index scores of 65, 70 and 75 km/h serpentine tests without crosswind.
Working Condition N r N θ N s
65 km/h77.341100 (106.971)84.894
70 km/h73.280100 (106.389)82.187
75 km/h69.891100 (105.809)79.927
Table 10. Performance index score of snaking test with and without crosswind effect.
Working Condition N r N θ N s
No crosswind 65 km/h77.34110084.894
Crosswind 65 km/h74.87610083.251
Table 11. Comparison of performance parameters of figure-eight surround simulation before and after adjusting aerodynamic parameters under pitching condition.
Aerodynamic Lift /NLateral Acceleration/gSimulation Time/s
Base car−249.7821.65411.825
Modification plan−303.4751.90411.3
Parameter difference−53.6930.25−0.525
Differential ratio21.50%15.11%−4.40%
Publisher’s Note: MDPI stays neutral with regard to jurisdictional claims in published maps and institutional affiliations.

