Article

Development and Test of a Novel Electronic Radiator Thermostat with a Return Temperature Limiting Function

1
Department of Civil Engineering, Technical University of Denmark, Brovej, Building 118, DK-2800 Kongens Lyngby, Denmark
2
PlanEnergi, A.C. Meyers Vænge 15, SV-2450 Copenhagen, Denmark
*
Author to whom correspondence should be addressed.
Energies 2022, 15(1), 367; https://doi.org/10.3390/en15010367
Submission received: 2 December 2021 / Revised: 31 December 2021 / Accepted: 2 January 2022 / Published: 5 January 2022

Abstract

:
Automated hydronic balancing in space heating systems is crucial for the fourth-generation district heating transition. The current manual balancing requires labor- and time-consuming activities. This article presents the field results of an innovative electronic radiator thermostat tested on two Danish multi-family buildings. The prototypes had an additional return temperature sensor on each radiator and an algorithm was used to accurately control valve opening to ensure automated hydronic balancing. The results highlighted that the new thermostat performed as expected and helped secure the cooling of district heating temperatures —defined as the difference between supply and return temperature—4–12 °C higher during the test compared to results obtained in 2020, when the prototypes were replaced with state-of-the-art thermostats in the first building. The measurements from the other building illustrated how only two uncontrolled radiators out of 175 could contaminate the overall return temperature. The remote connection of the thermostats helped pinpoint the faults in the heating system, although the end-users were not experiencing any discomfort, and secure, after fixing the problems, a return temperature of 35 °C. Future designs may consider integrating a safety functionality to close the valve or limit the flow in case of damage or malfunction to avoid a few radiators compromising the low-temperature operation of an entire building before the cause of the problem has been identified.

1. Introduction

Heating and cooling in buildings account for almost half of the total final energy consumption in the EU [1] and represent a strategic area to focus on for the ambitious EU targets of reducing CO2 emissions and moving towards a sustainable energy system. The new EU strategy on the adaptation to climate changes is aiming to achieve a climate-resilient society by 2050 [2].
District heating is among the key technologies that can sustain the green transition of the energy system due to its flexibility to integrate several energy sources. For district heating systems to provide the most economical transition to renewable energy sources, it is essential that the technology is continuously improved to reduce the operating temperatures and increase the efficiency of the systems [3]. The district heating technological development aims to lower the operating temperature to an average of 55/25 °C, with the possibility of increasing the supply temperature if necessary during extreme low outdoor temperatures. This is defined in the literature as fourth-generation district heating (4GDH) [4]. Lower operating temperatures will reduce the distribution heat losses in the networks, increase flue gases condensation and the power-to-heat ratio in combined heat and power (CHP) plants, increase the heat production from renewable sources—such as solar heating, geothermal heat, and excess industrial heat recovery—and the coefficient of performance of the heat pumps [3,4,5].
However, the current supply and return temperatures in the heating installations in buildings supplied by the district heating system pose a limit to reducing the networks’ temperatures. If supply temperature requirements in buildings remain high, this limits the reduction of the networks’ temperatures and the use of renewable heat sources. Professionals design space heating systems based on extremely low outdoor temperatures and no heat gains to secure indoor comfort in the most severe conditions. These conditions rarely occur in normal heating system operations, so the heating elements are typically oversized, ensuring the possibility of implementing lower supply temperatures [6,7]. In addition, existing buildings undergo—or will have undergone—a certain amount of renovation over the years, further enhancing the ability to comfortability heat them with lower temperatures [8,9]. Some Danish case studies investigated the possibility of heating existing buildings with low supply temperatures for the most significant part of the heating season [10,11]. Similarly, in a Swedish survey, Jangster et al. [12] showed that 109 existing buildings with radiators were comfortably heated with average supply and return temperatures of 64/42 °C at an outdoor temperature of −16 °C and that 55 °C or lower was sufficient for all radiators for outdoor temperatures equal or above 5 °C.
Rämä et al. [13] illustrated that return temperatures in the range of 25–35 °C should be expected from well-controlled and -operated heating systems. The low-end range would be adequate for single-family houses, whereas return temperatures up to 35 °C should be obtained in multi-story buildings [14]. Nonetheless, this is seldom the case, as in European district heating systems it is common to experience supply temperatures in the range of 75–90 °C and return temperatures of 40–50 °C [15]. High return temperatures also have the effect of causing a small temperature difference between supply and return in the networks. This can be detrimental to the hydraulic capacity of the networks, forcing the district heating operators to maintain unnecessary high supply temperatures to deliver the heat demand, in particular during peak heat demand conditions [16].
Among the main causes of such high operating temperatures in the networks is the accumulated effect of faults and poor control in the substations and heating systems. Gadd and Werner [17] found that 74% of the surveyed substations were beset by certain errors and highlighted the importance of automation and data analysis to cost-effectively locate them. Another survey of over 246 Swedish district heating substations documented that faults with secondary side components and incorrect temperature set-points and regulation accounted for more than 60% of the total number of errors [3]. Similarly, Månsson et al. [18] showed that the most common issues were faults in the customers’ internal heating systems.
Radiators are the most used heating element in Europe, and they are typically controlled with thermostatic radiator valves. These passive control devices regulate the flow through the radiators according to the indoor temperature set-point selected by the end-users. The test of low supply temperature in five Danish single-family houses showed high return temperatures from the space heating systems in two of them due to a combination of poor flow control from the thermostatic radiator valves in some rooms and a few, too small radiators [19]. By addressing those deficiencies, the heating system could be operated with a supply and return temperature of 55/30 °C. Ziang et al. the authors of [20] found that 65% of thermostatic radiator valves, from a survey on 35 buildings in the UK, were performing poorly due to end-user misuse leading to thermal discomfort and higher energy consumption. Common examples of tenants’ inadequate control of local thermostatic radiator valves are on/off or proportional control. The former consists of keeping some radiators closed, leaving only a few of them to heat the entire flat; the latter is the wrong assumption that a higher thermostat setting would correspond to higher heat output [21]. Both incorrect controls will inevitably lead to higher return temperatures. A simple solution is to couple a pre-set function with the thermostats to limit the maximum flow allowed through the radiators when the valve is fully open [22].
In large space heating systems, further control is achieved by adding pressure-balancing valves to the vertical pipes—typically referred to as riser pipes or simply risers. The risers distribute the water flow from the basement to all radiators/flats in the building. The valves control the pressure change to secure a balanced hydronic system and a correct flow distribution in all building areas independently from the distance of the circulation pump. Averfalk and Werner [23] listed seven essential improvements desirable for the fourth-generation district heating (4GDH) transformation. One key improvement concerns explicitly the possibility of achieving automated hydronic balancing in space heating systems in buildings to efficiently ensure the lowest possible district heating return temperatures. The shortcomings of the current manual hydronic balancing include that it is labor- and time-consuming. The balancing should be performed regularly to maintain optimal functionality continuously [14]. However, it can be challenging to adjust the heating system accurately based on simplified calculations and manual work. At the same time, hydronic balancing is an important tool to secure the comfort of occupants while ensuring energy efficiency in the heating system operation with low heat consumption, low pump pressure, and low heating system supply and return temperatures [24,25,26].

1.1. Novelty

The novelty presented in this article is the product development of a new smart electronic thermostat. Compared to the existing electronic thermostat design available in the market, this new one is equipped with an additional temperature sensor connected to the return side of each radiator and an algorithm to secure more accurate control of the opening or closing of the valve based on a maximum return temperature setting. The purpose of this functionality is two-fold. First, it should help ensure low return temperatures from the space heating systems by keeping them below the set point. This will help obtain a low district heating return temperature and be convenient for the occupant since it will ensure proper heating system operation even when windows are open or there are holiday setbacks. Second, due to the automatic flow-limiting effect of the return temperature control, the thermostat should help provide automatic hydronic balancing of the heating system. This new thermostat could thereby provide one combined solution for some of the essential issues in space heating systems in buildings connected to future low-temperature district heating systems.

1.2. Aim

The aim of this project was to develop a prototype of this new thermostat and perform field tests to document the potential improvements. Field tests were carried out in two different apartment buildings in Frederiksberg, Denmark. The goal was to demonstrate:
  • That the new thermostat can help limit the return temperature from the space heating system in apartment buildings and thus ensure a low district heating return temperature; and
  • That the new thermostat can serve to provide automated hydronic balancing in smaller apartment buildings, and thereby ensure that all occupants can maintain the preferred indoor air temperature without the necessity of string balancing valves.
This paper reports the findings from the new thermostat tests and discusses the potential improvements that can be obtained by applying this type of thermostat in buildings heated by district heating.

2. Methods and Case Studies

To test the functionality of the new thermostat in two apartment buildings, the prototypes were installed on all radiators in part of the buildings and measurements on the heating system operation before, during, and after the test were collected and analysed to document how the thermostats performed in terms of limiting the return temperature to the district heating substation and ensuring hydraulic balancing in the heating systems.

2.1. Case Buildings

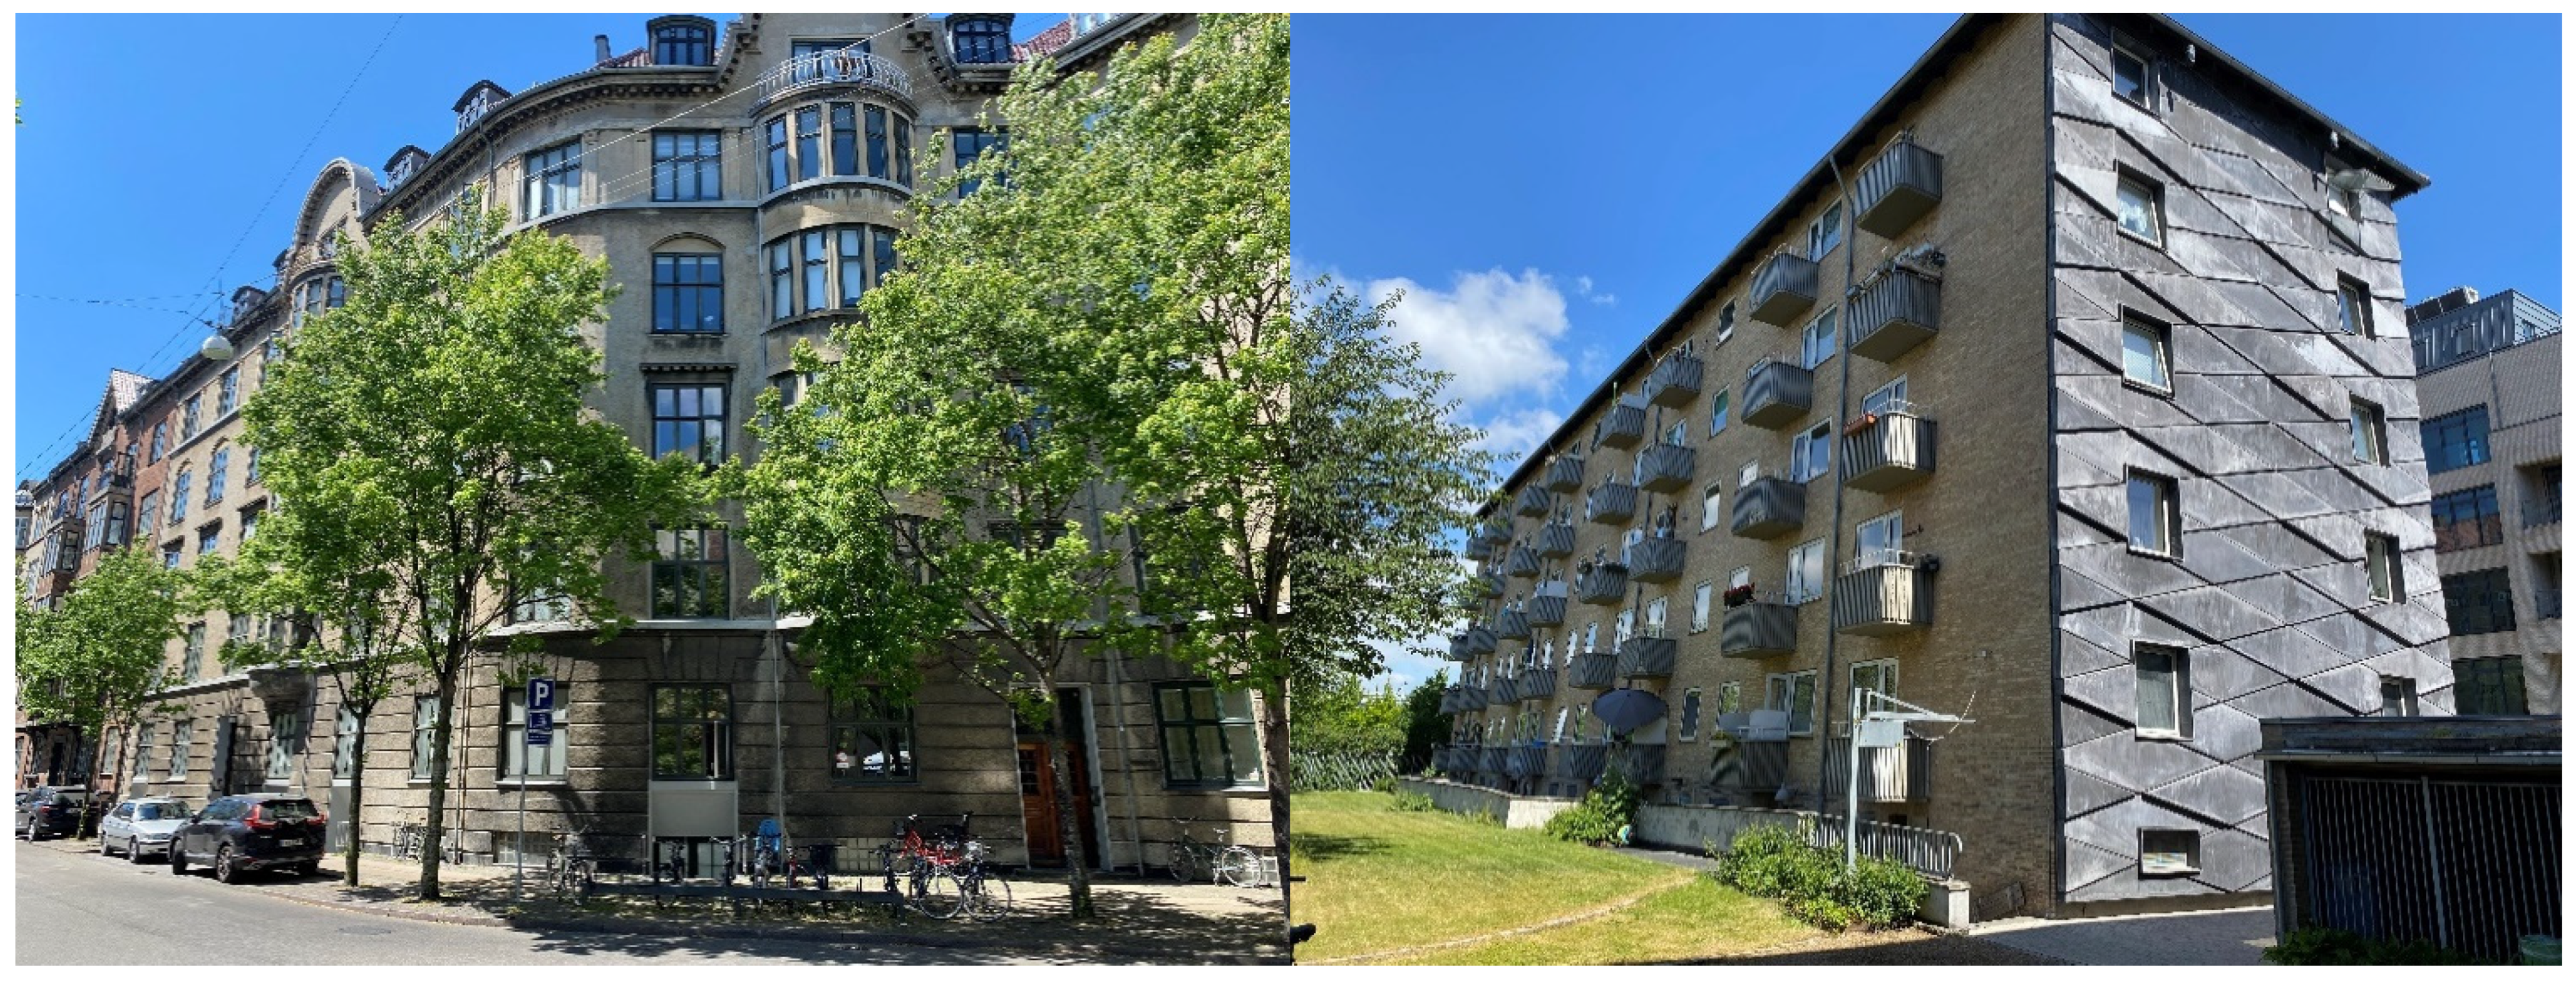
The prototypes of the new thermostat were installed and tested on two different building sites in Frederiksberg, Denmark. The first test building (A) is an old classic apartment building from 1905. The building is owned by a private housing association and consists of 20 apartments split on two staircases and has a total heated dwelling area of approximately 2900 m2. The second test building (B) is an apartment building from 1947. The building is owned by a municipal social housing company and consists of 40 apartments and has a total heated dwelling area of approximately 2600 m2. The sites thereby represent two examples of typical apartment buildings with different apartment sizes and occupant demography. The buildings are seen in Figure 1.
Both buildings are heated by district heating through central apartment substations that are located in a plant room in the basement. The district heating substations consist of separate heat exchangers for space heating and domestic hot water. In Building A, the space heating system is a traditional two-pipe radiator system. In some of the rooms in the apartments, the occupants have installed hydraulic floor heating systems that are connected to the same space heating distribution pipes. In Building B, the space heating system is a two-pipe reversed return system with radiators. The domestic hot water systems in both apartment buildings have domestic hot water circulation. In Building B, a mixing shunt was installed on the primary side of the domestic hot water heat exchanger, with the purpose of reducing the district heating temperature to reduce the risk of lime precipitation.
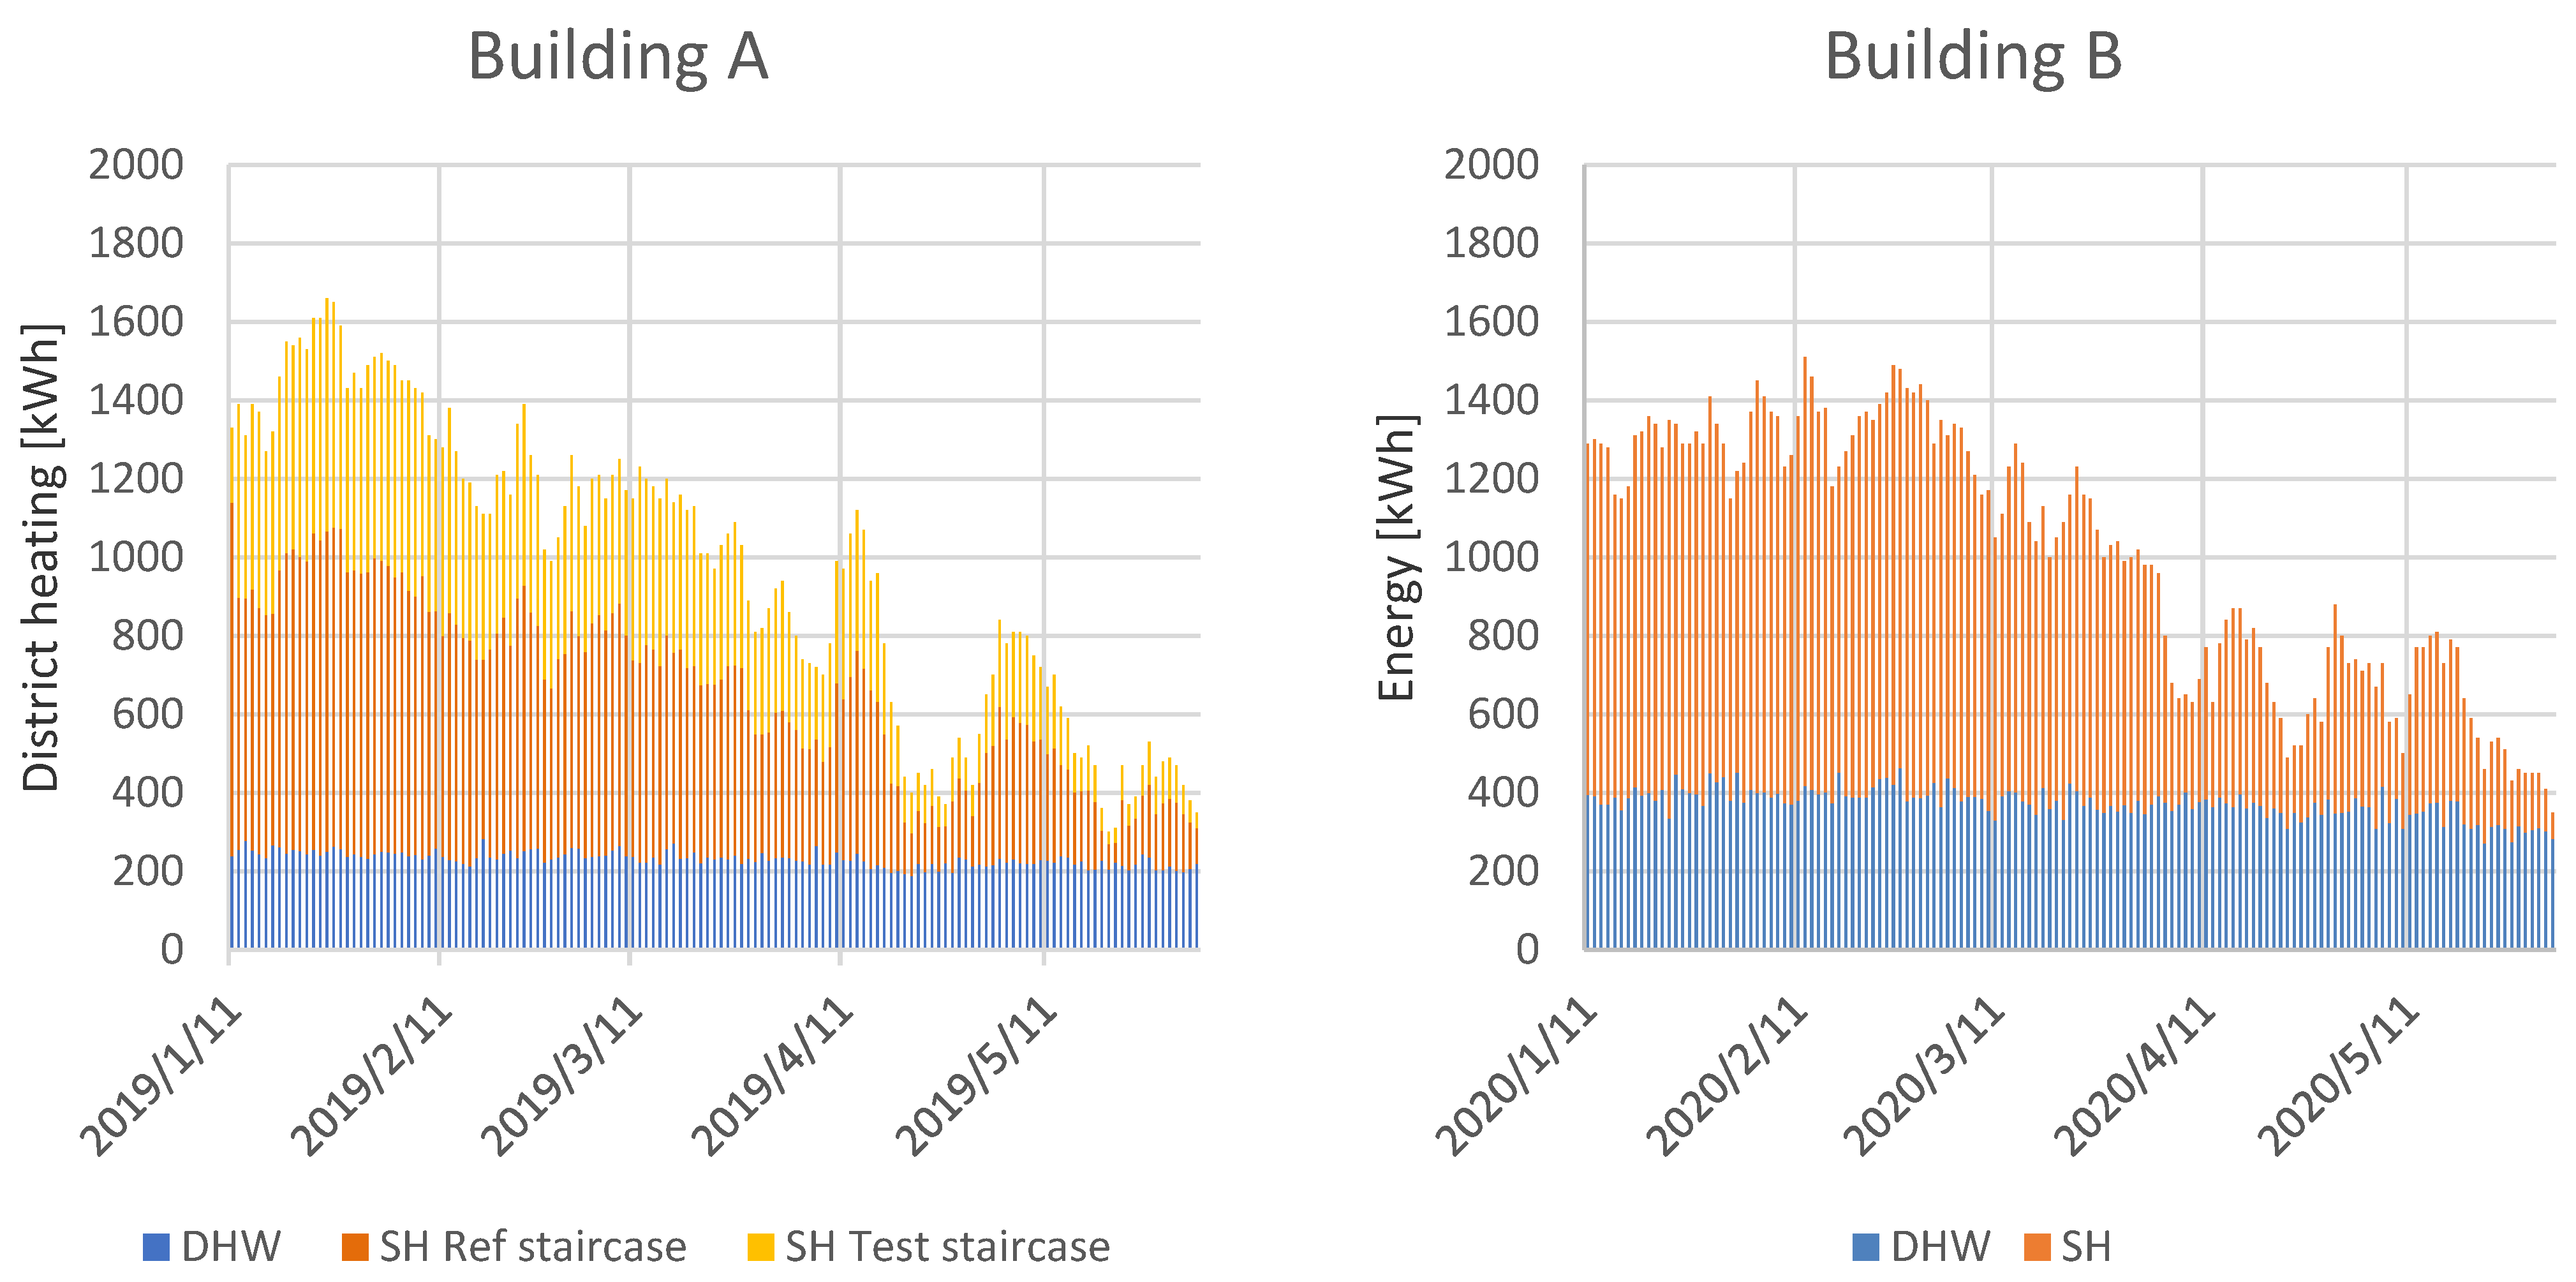
The domestic hot water consumption in the test buildings was measured to 220 kWh/day on average in Building A and 326 kWh/day in Building B. This means that domestic hot water stood for 25–28% of the district heating demand in Building A and 39–43% in Building B in the past five years. In Building A, the thermostats were only tested on the radiators in half of the building and the space heating consumption was measured specifically for this one half. Figure 2 shows the measured energy consumption for space heating and domestic hot water in the buildings during the test periods from 11 January–2 June 2019 (Building A) and 11 January 2020–2 June 2020 (Building B). In Building A, 41% of the total space heating during this period was consumed in the apartments around the test staircase whereas the larger share of 59% was spent in the reference staircase. Measurements showed that these shares were similar for the reference period in the fall of 2020.

2.2. Measurements

The functionality of the thermostats was analyzed based on measurements conducted in the test buildings. The analyses were based on the following measurements and measurement equipment:
  • Main energy meter measuring the total primary district heating consumption and temperatures in the building substation;
  • Additional energy meter installed to measure flow and temperatures in the secondary space heating system;
  • Additional energy meter installed on the primary side of the domestic hot water installation.
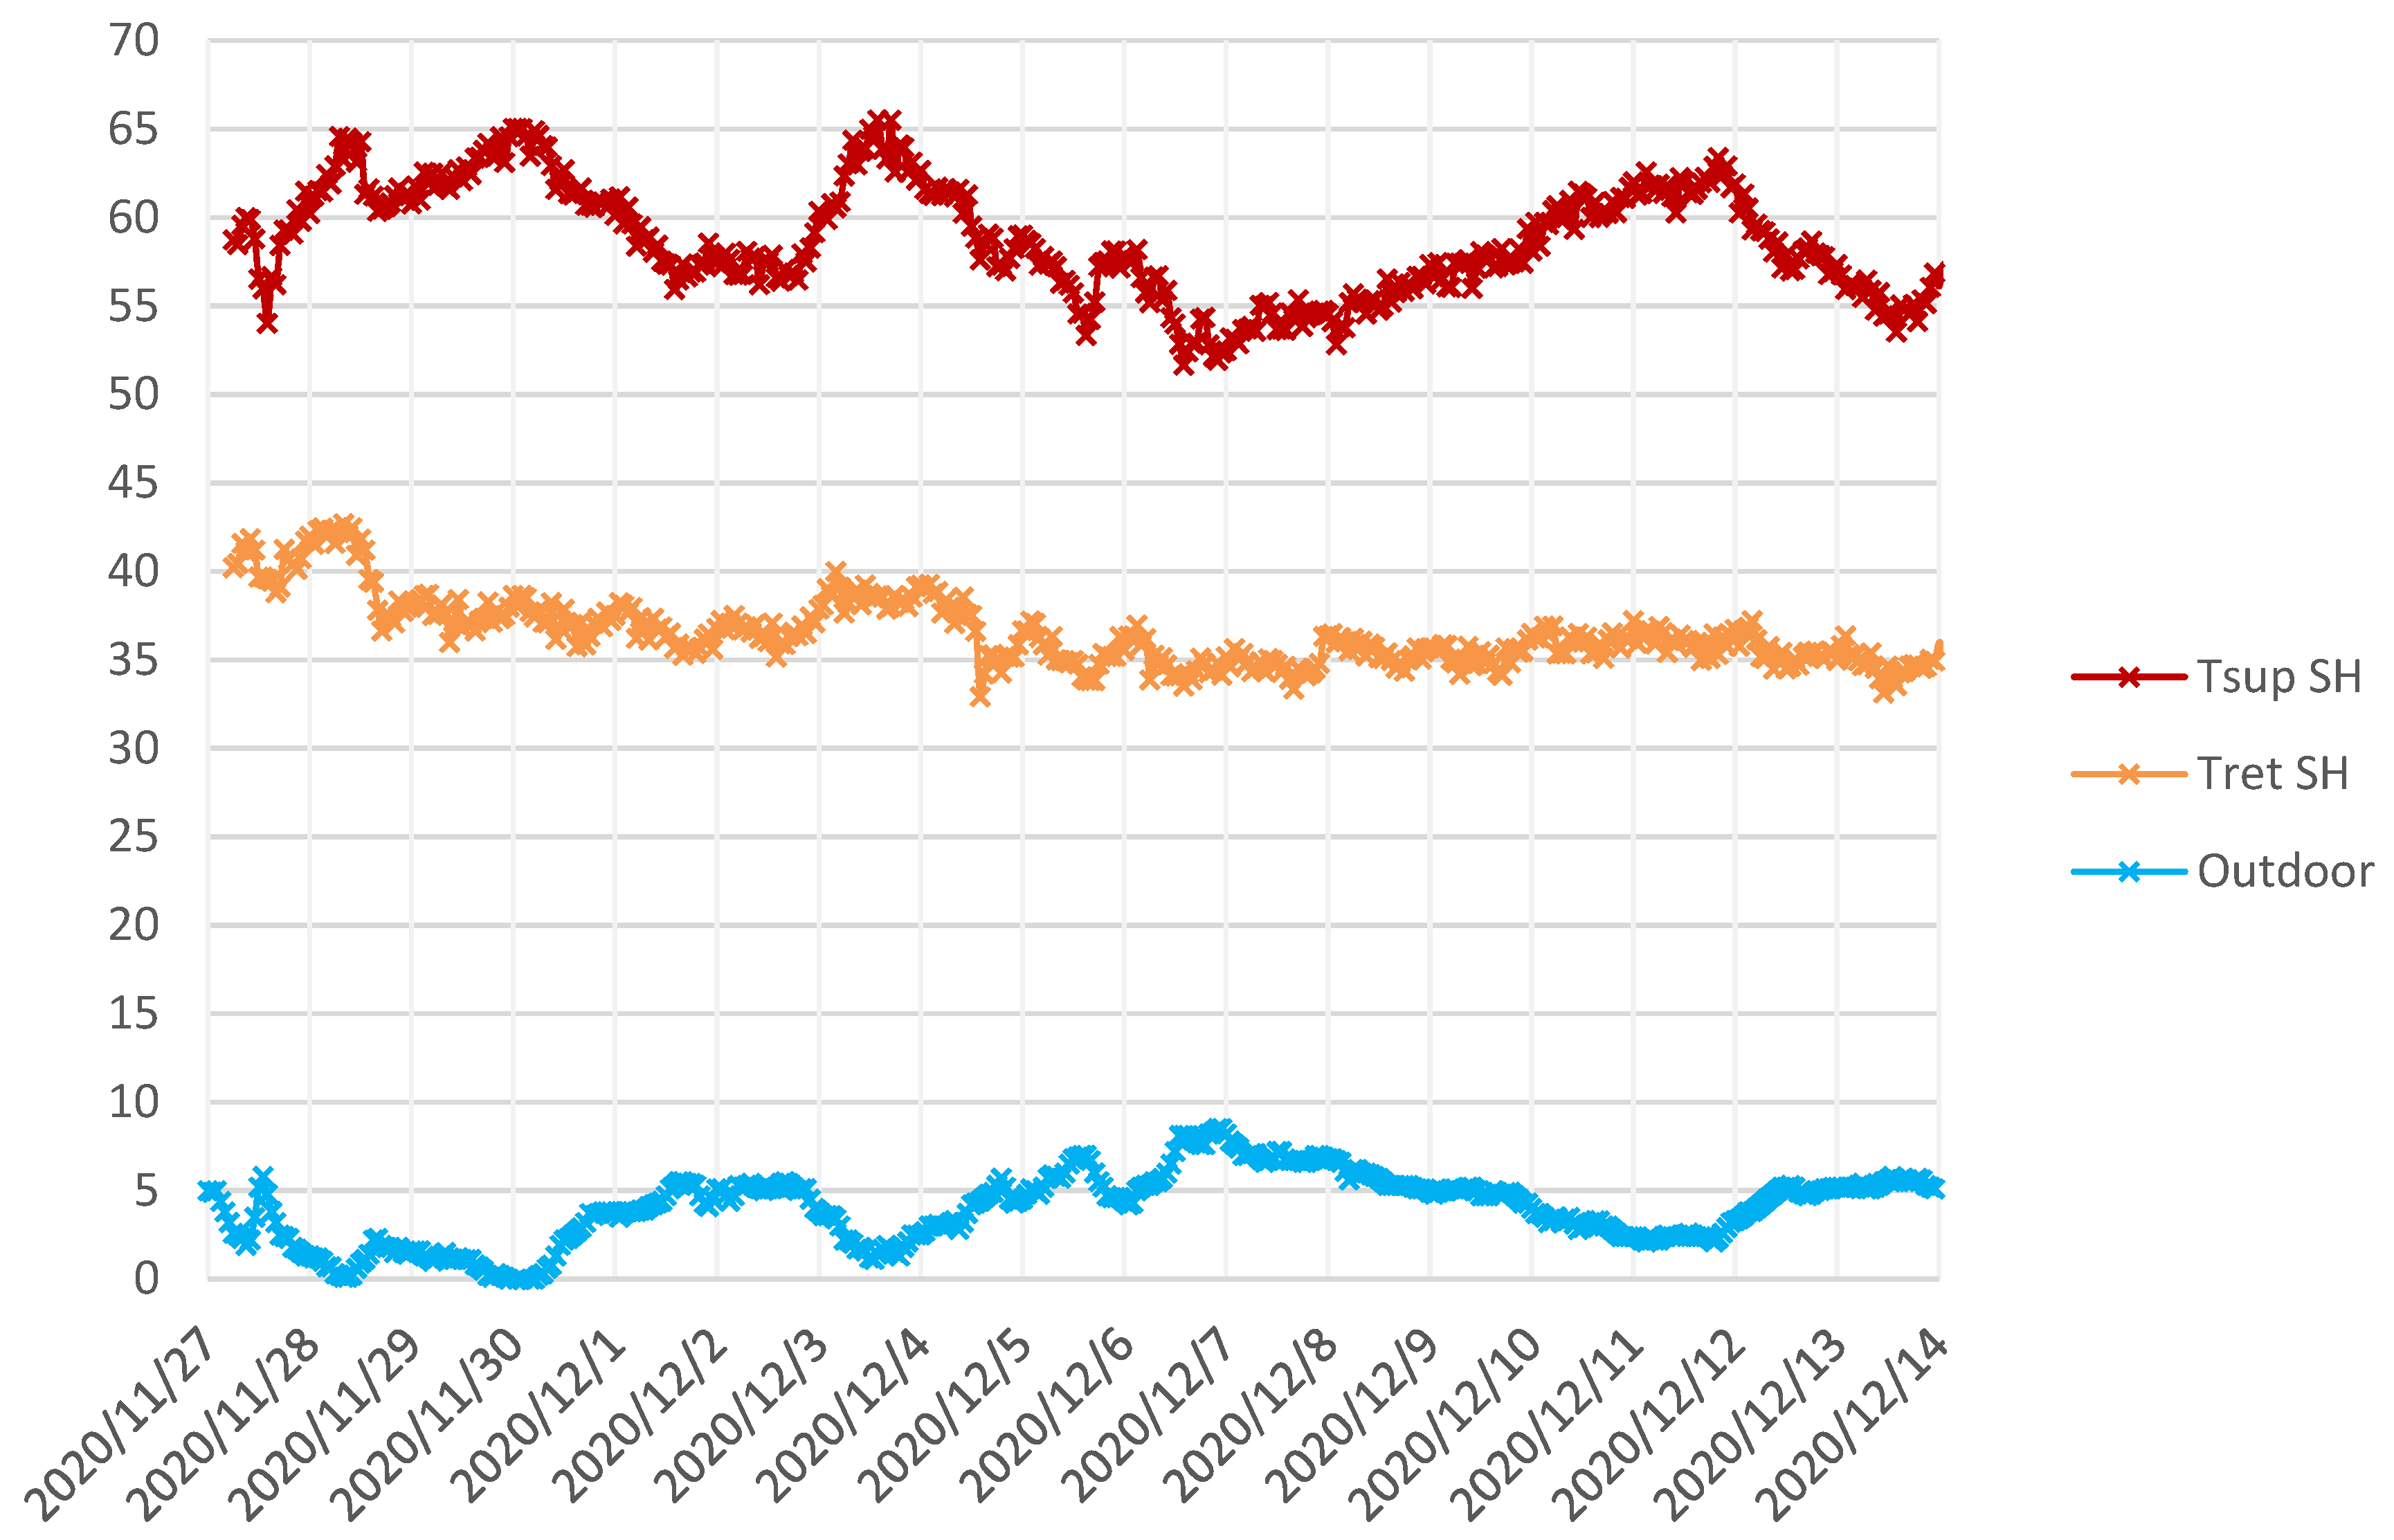
The main energy meters in the buildings provide data on overall district heating supply and return temperatures from the district heating substation, primary side flow, and total consumption of district heating. These measurements are normally used for billing and are available for long time periods on a monthly basis, whereas for the test period hourly values were made available for a more detailed overview.
The additional energy meters were installed into the central piping of the secondary side of the space heating system and on the primary side of the domestic hot water heat exchanger in order to document performance in the space heating system.
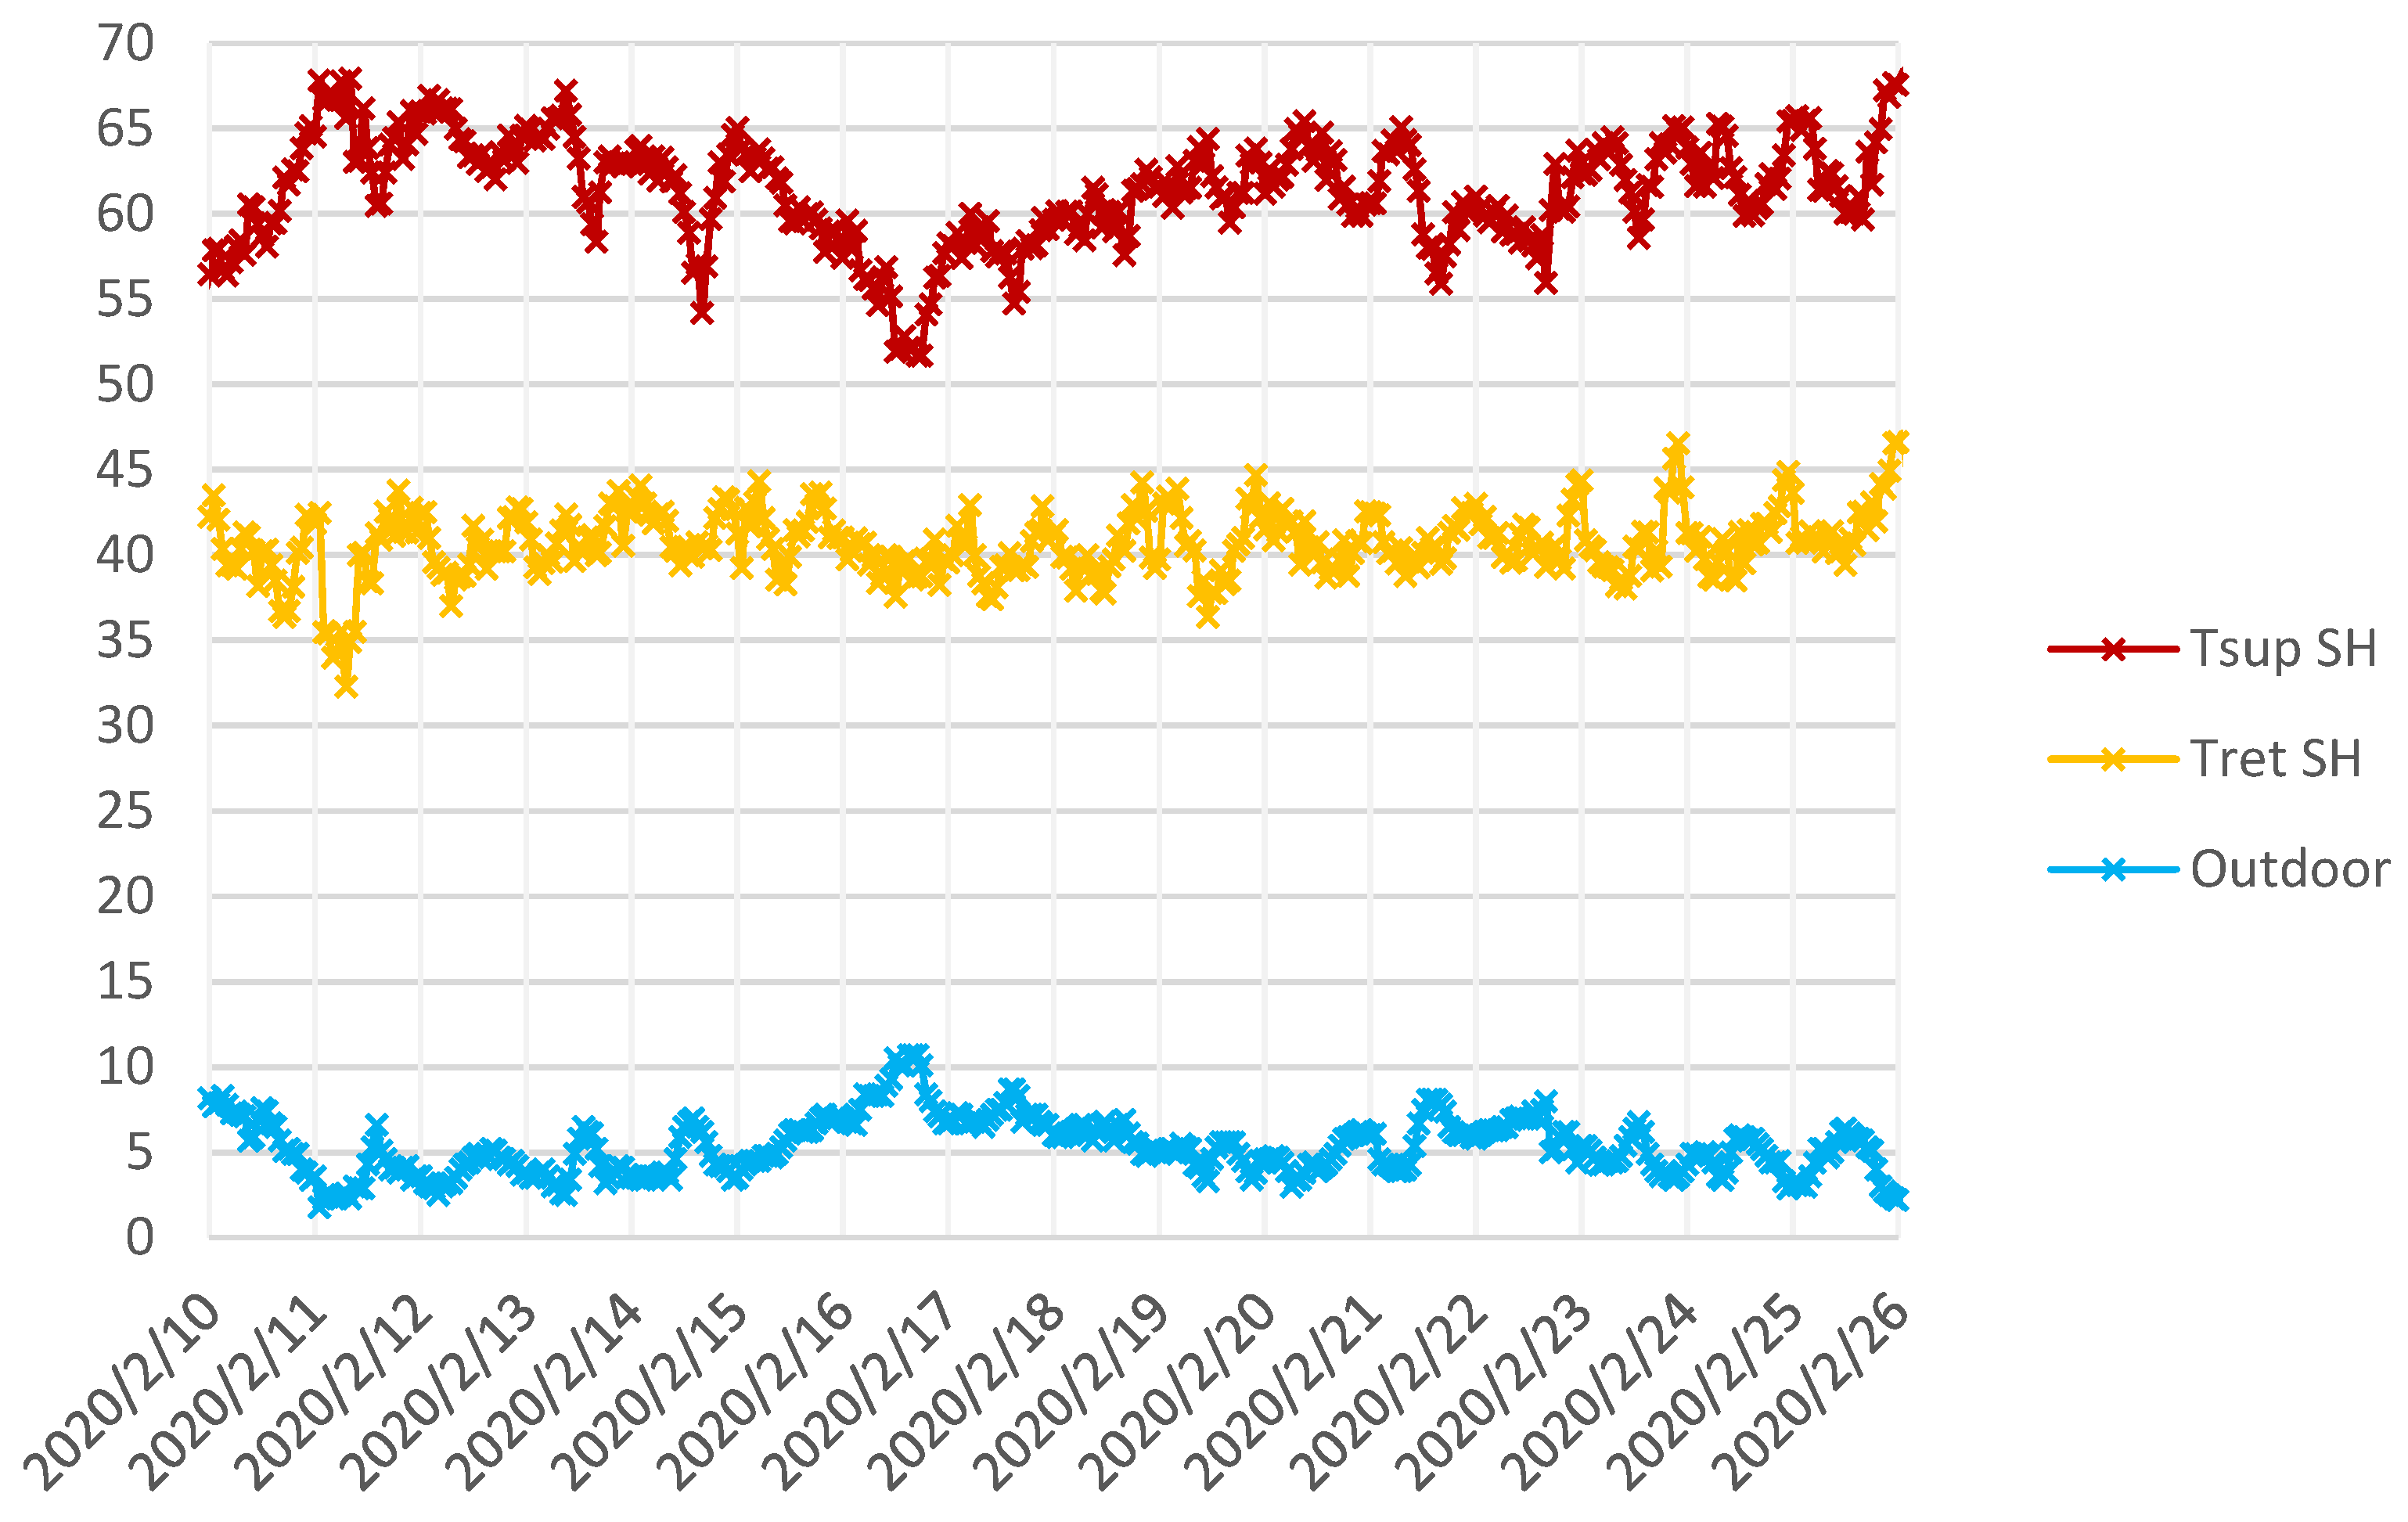
The energy meter in the space heating system provided hourly measurements of supply and return temperatures, energy consumption, and mass flow rate. These measurements were analyzed to see if the prototype thermostats were able to limit the return temperatures as expected and to identify any variation in the operation of the space heating system during the test period. The additional energy meter was available during the test period. In Building A, where the test of the prototype was carried out in half of the building, the energy meter was located only for the pipes supplying heating to that part of the building.
The energy meter on the primary side of the domestic hot water heat exchanger provided hourly measurements of primary side supply and return temperatures to the domestic hot water system and heat consumption for domestic hot water. This made it possible to analyse the share of heating used for space heating in the buildings and the effect on the overall district heating return temperature when changes were made in the space heating system. In addition, it made it possible to verify that changes in the secondary side return temperature in the space heating system had the expected effect on the primary side return.
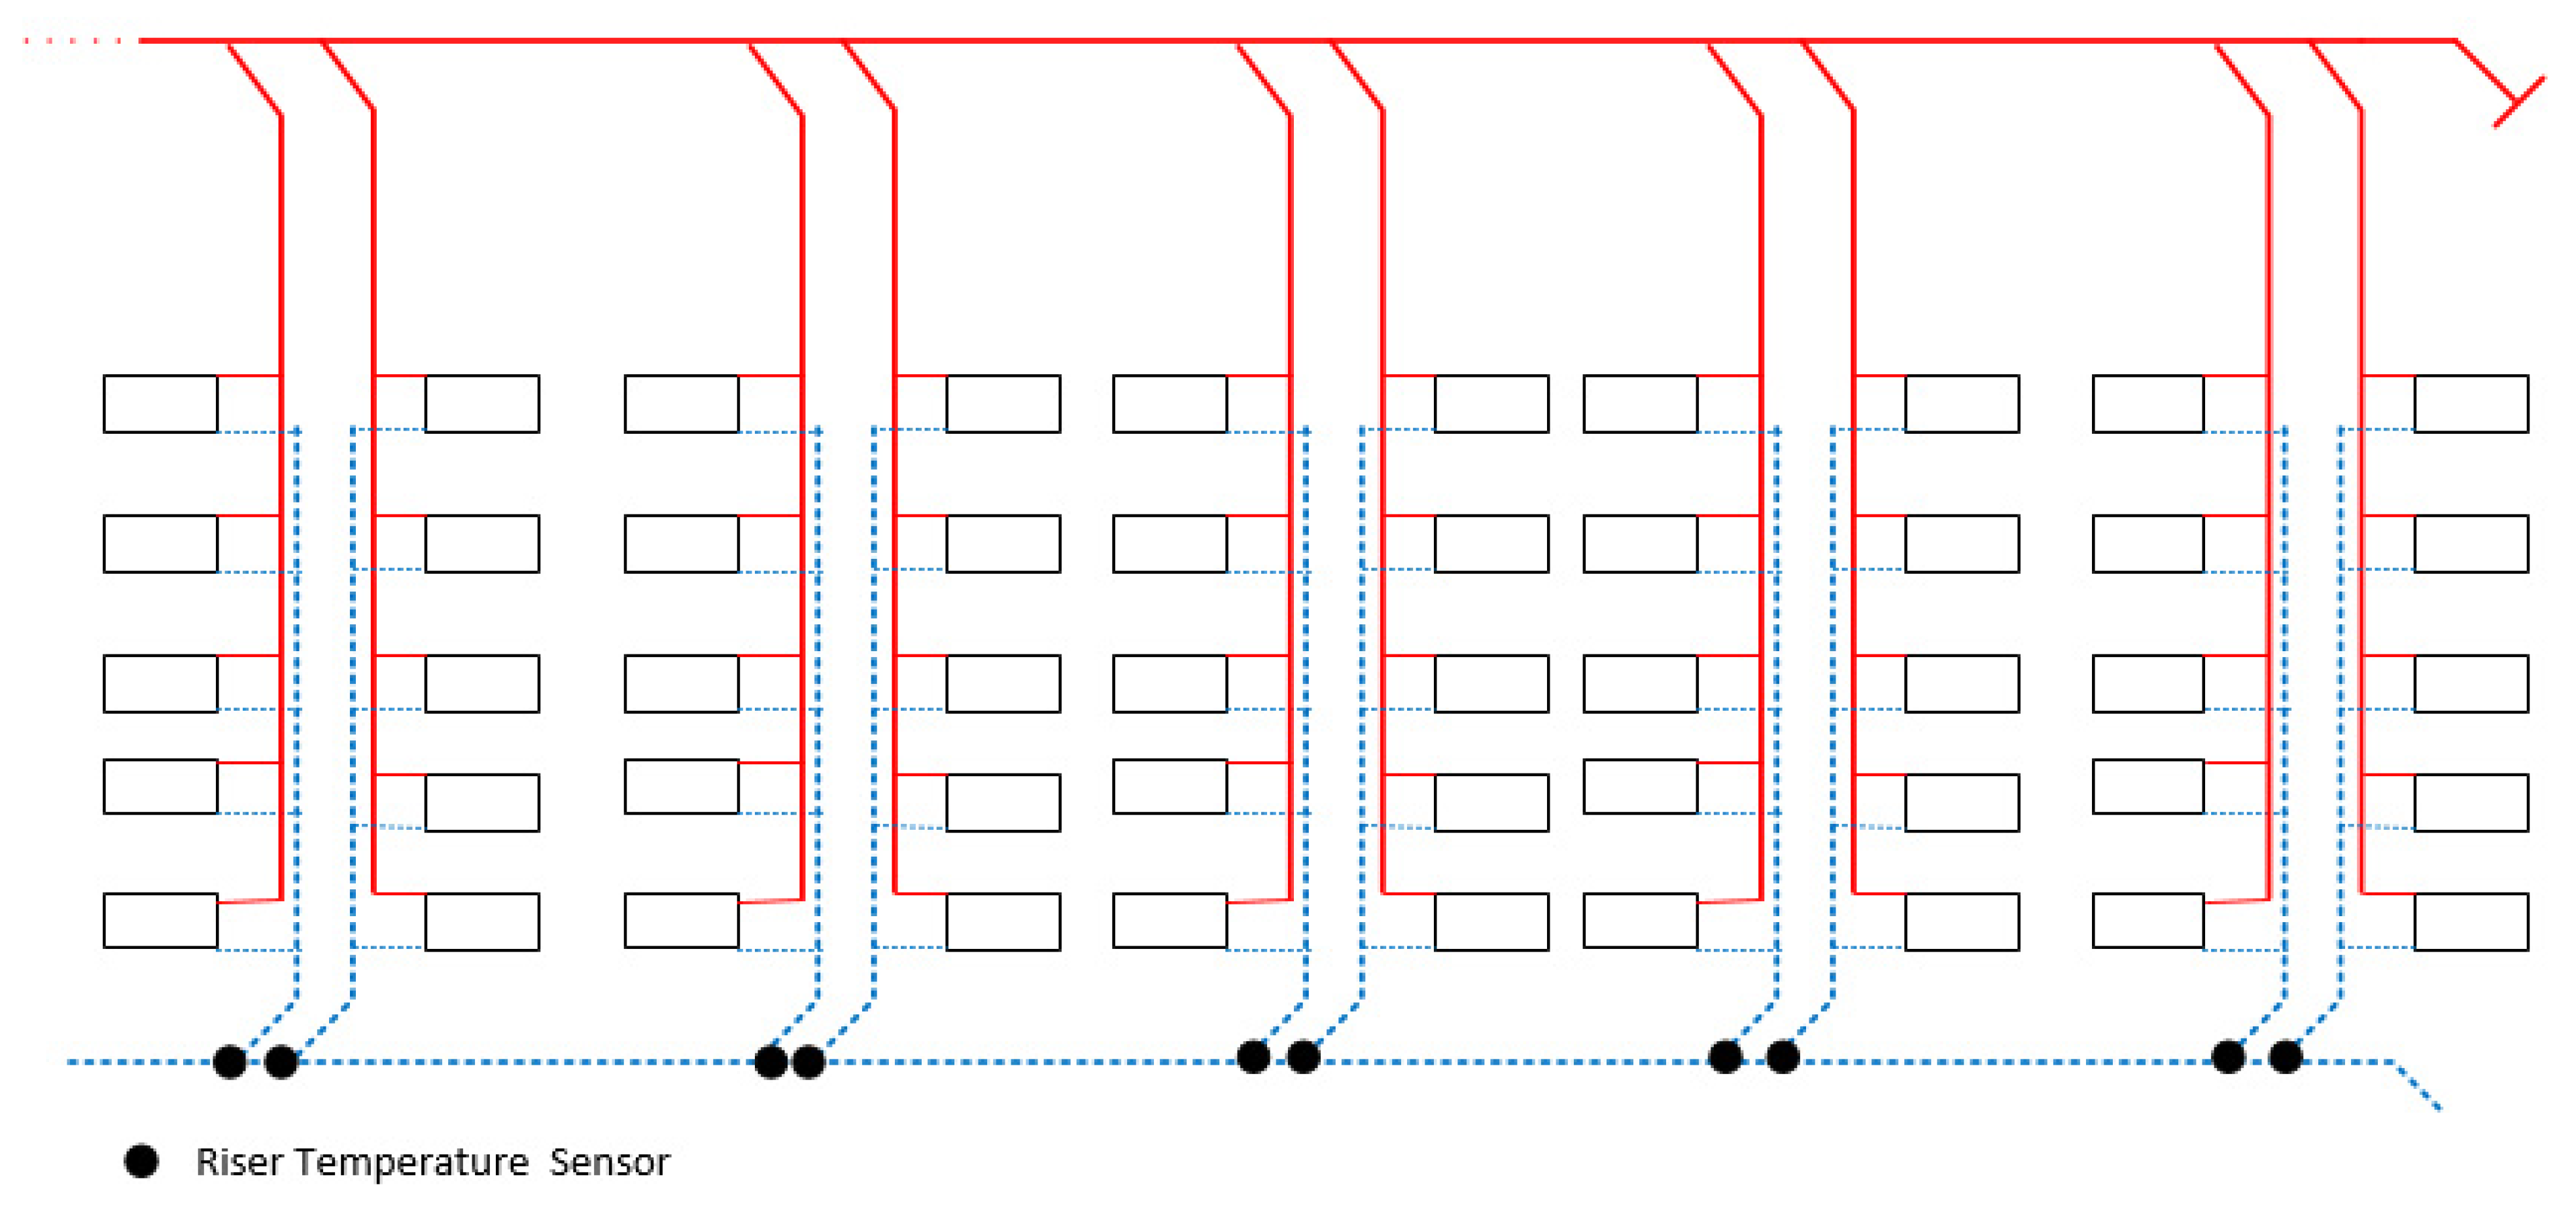
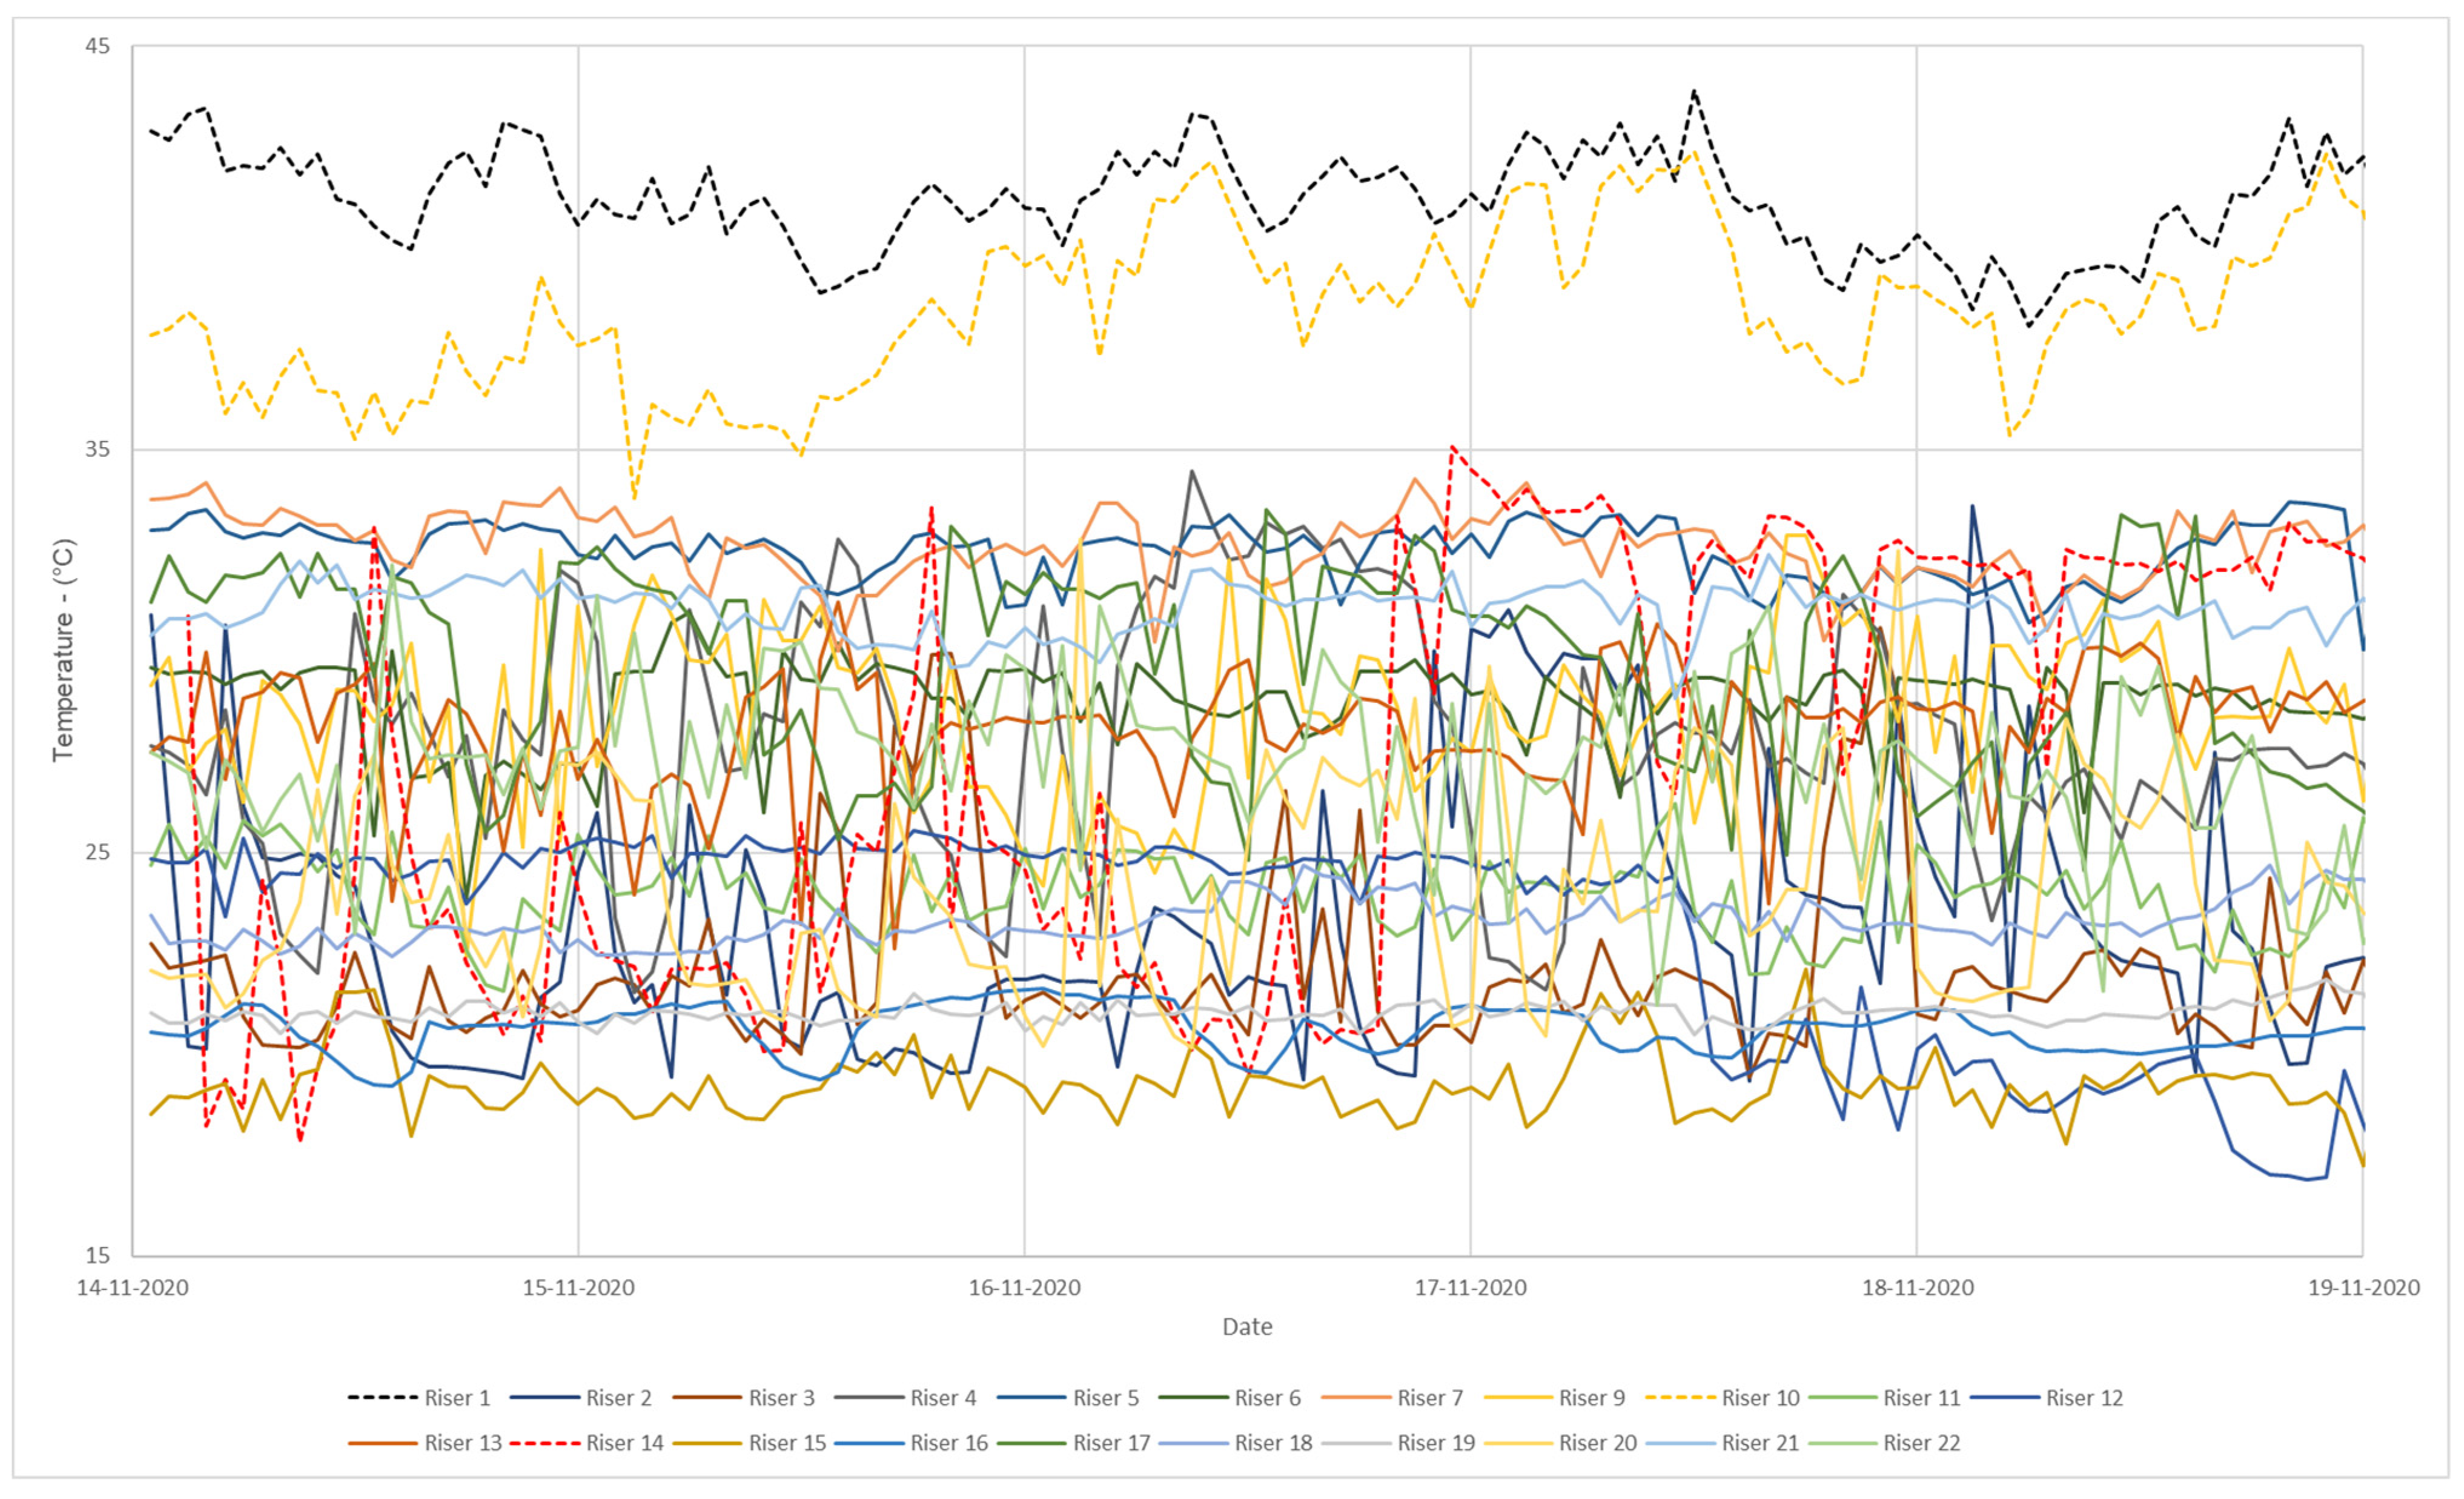
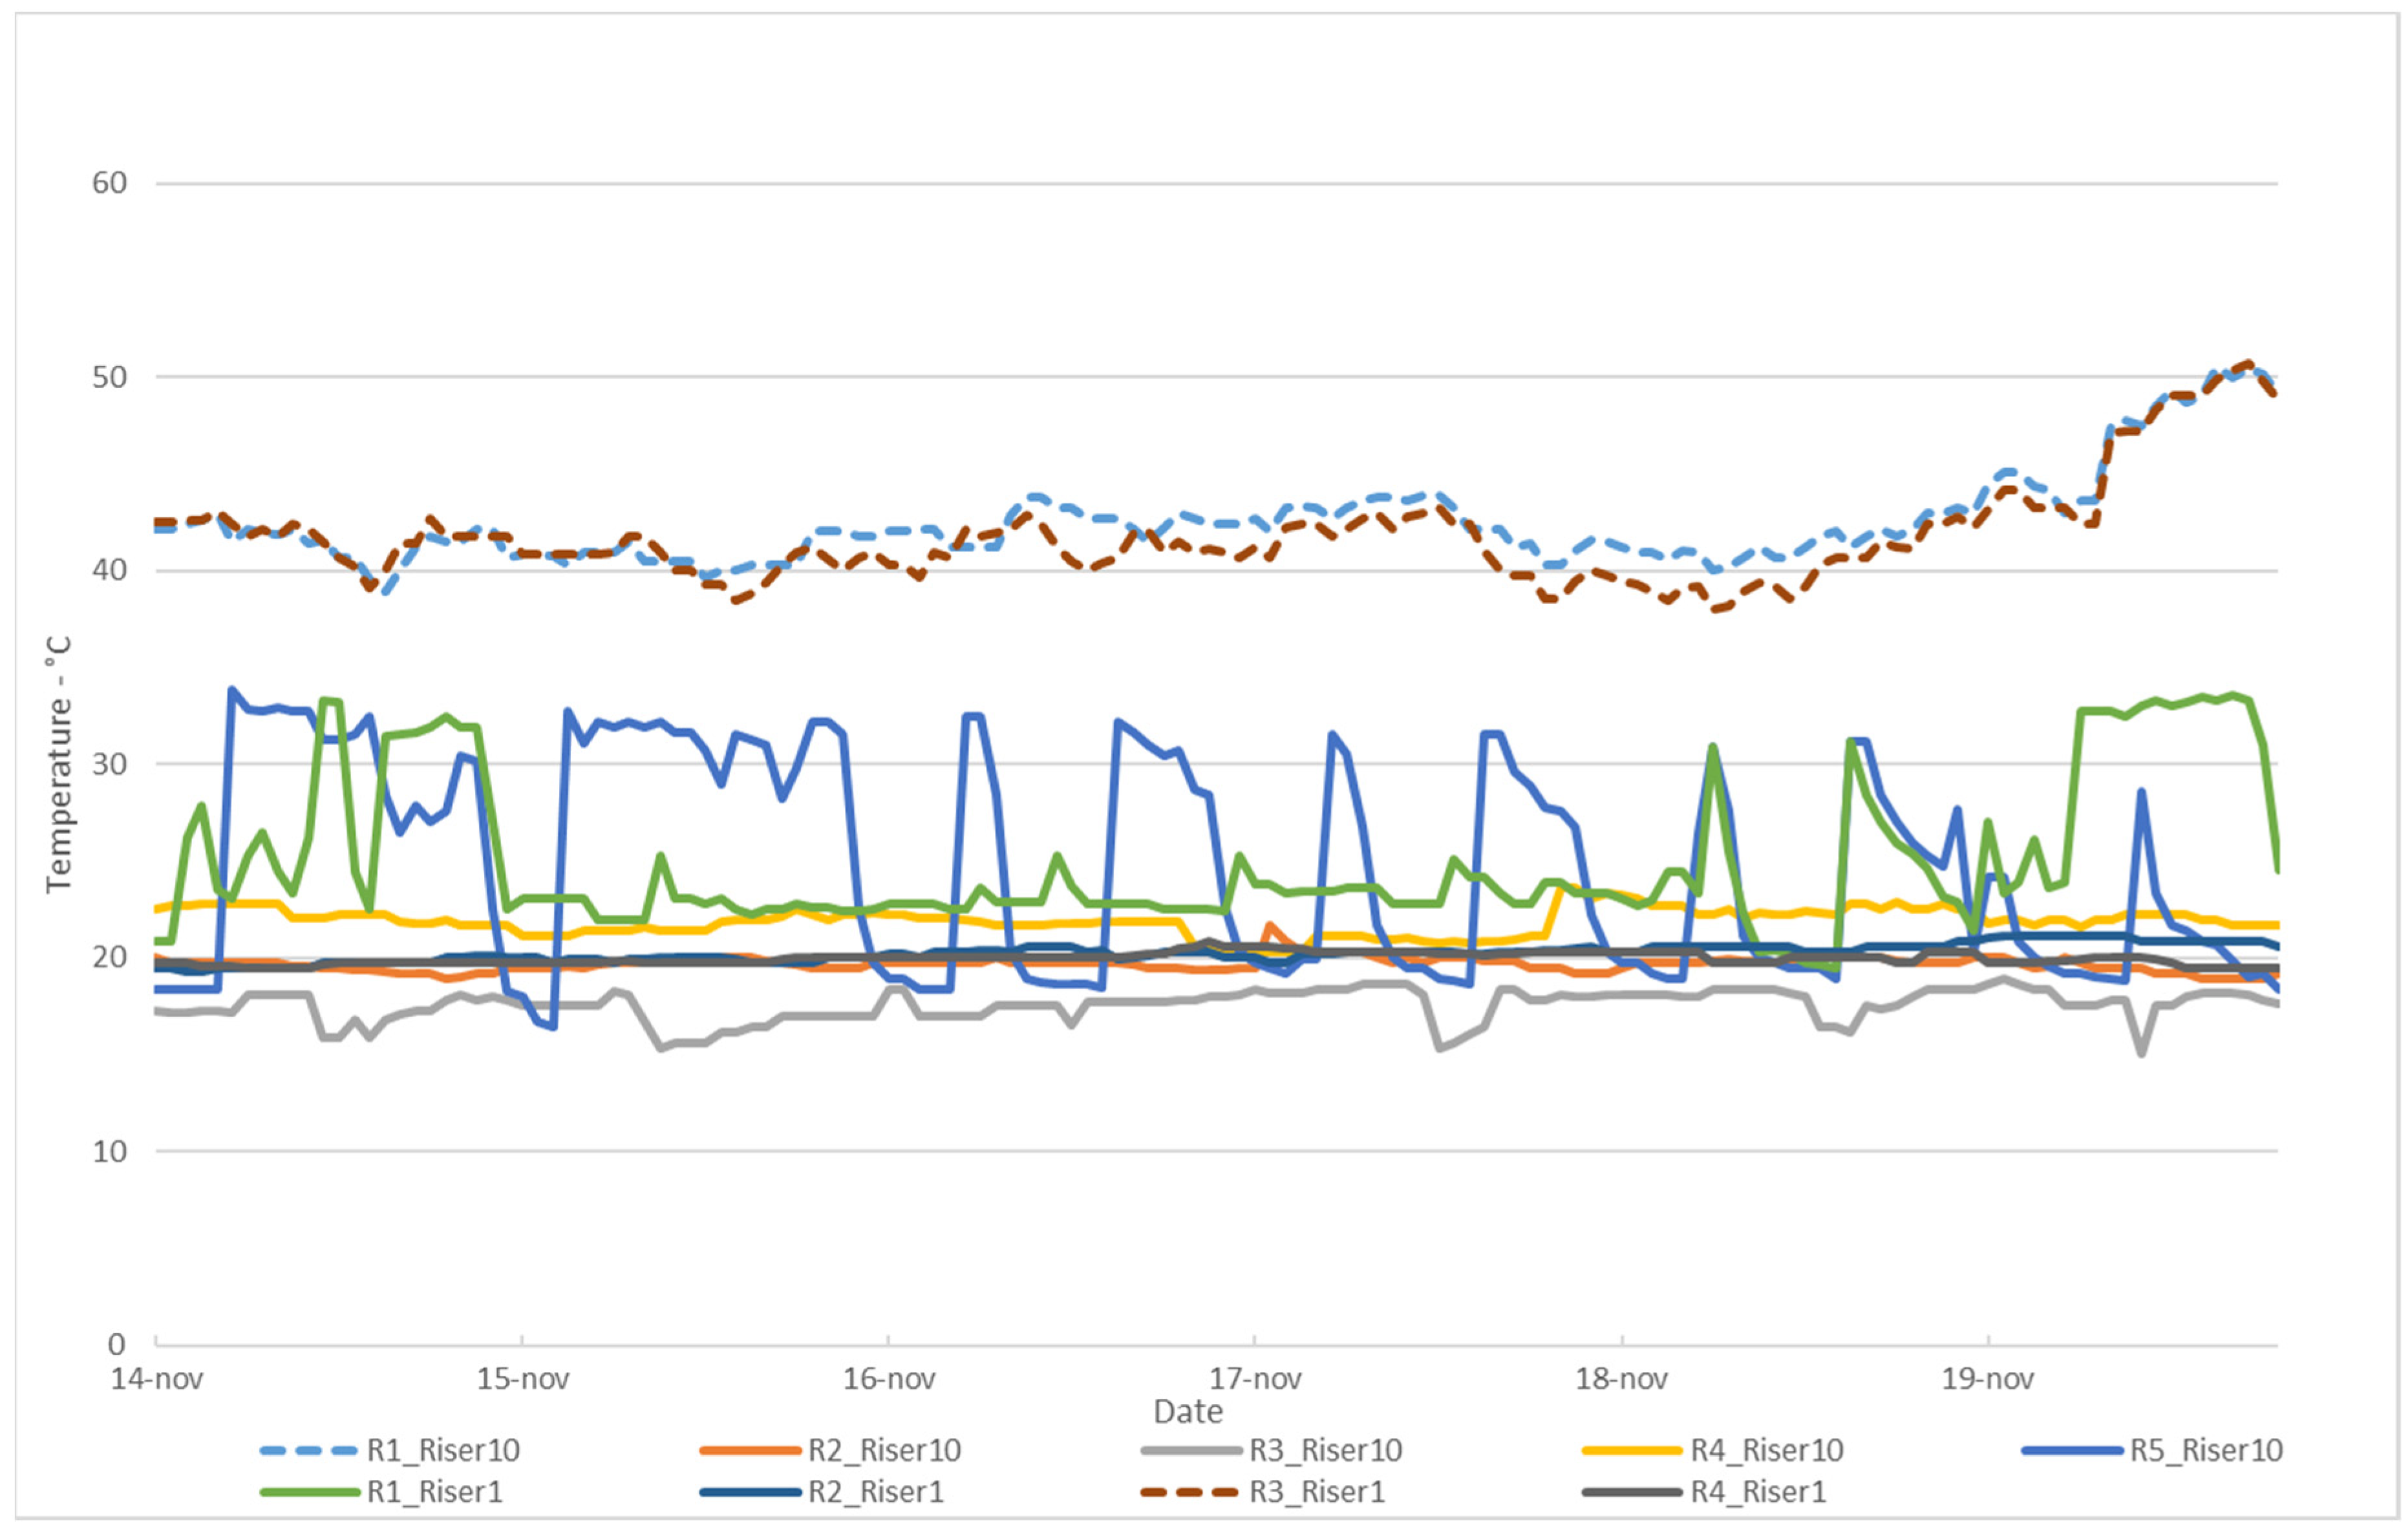
More temperature sensors were installed in the buildings’ risers and on the return pipe of each radiator to give a detailed overview of the heating systems’ operation. The outdoor temperatures were also collected during the test period. A schematic overview of the sensors’ locations on the return risers in both buildings is included in Figure 3 and Figure 4.

2.3. Thermostat Prototypes

The new thermostat prototypes were electronic and looked similar to other electronic thermostats already available in the market. The novelty of these new thermostats is that they are equipped with an additional temperature sensor—to be attached to the lower part of the radiator for the most accurate return temperature measurement—and an improved control algorithm able to limit the return temperature by controlling the thermostat opening based on feedback from the return temperature sensors. The return temperature set-point is derived from the supply temperature and a differential temperature over the radiator to emit the heat power within a suitable range. The set-point is determined based on:
  • An absolute maximum value of a dimensioned system; and
  • A potential of extra lowering based on the actual room conditions during the elapsed time.
The controller analyses the return temperature each minute and responds immediately to exceedances of the set-point limit by closing the valve until the return temperature is within the limit. 
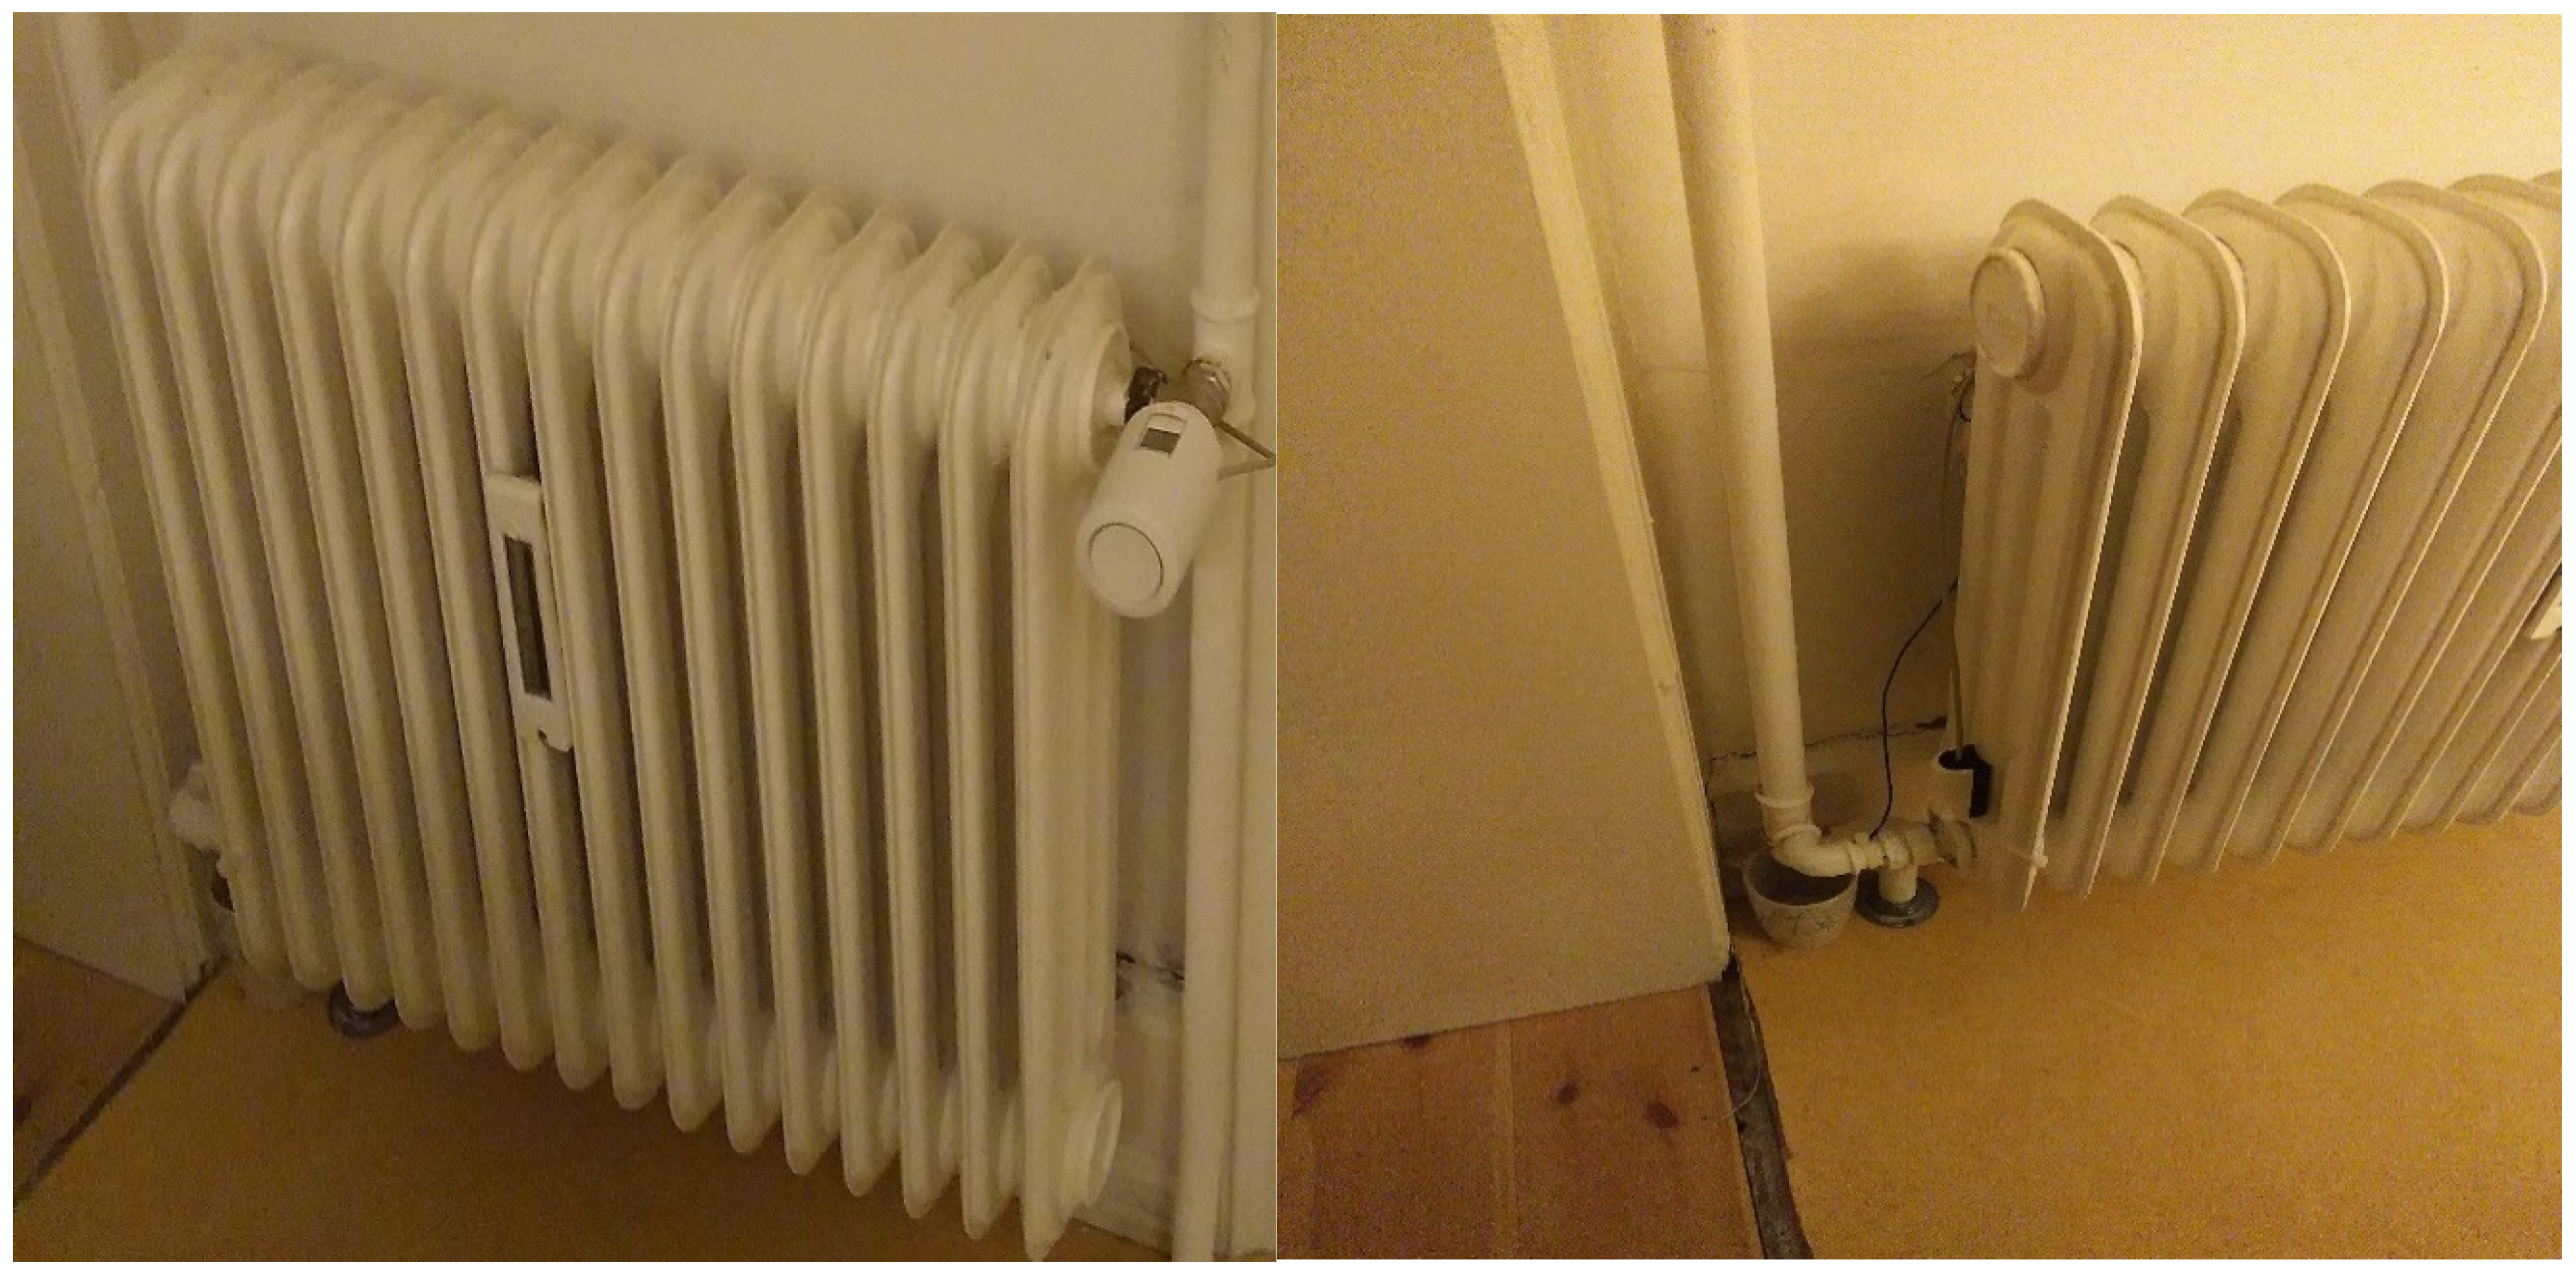
Figure 5 shows the pictures of one prototype thermostat and how it was mounted on the radiators in the test buildings.
Two different prototypes were developed and tested during the length of this project. The first one had only one return temperature control profile that controls this temperature according to the supply temperature and the part-load operation of the radiator. Instead, the second one was implemented with five new adjustable profiles. The improved version of the return temperature profiles was necessary to better take into account the differences in room/building heating losses and the possibility for the end-users to choose between a comfort and economy mode. A common feature kept in both prototypes is the adaptive dynamic control of the return temperature. This functionality prevents a rapid change in room temperature—i.e., due to the opening of a window—which would require more flow through the radiator, from a steady-state situation that will result in unnecessary high return temperatures. Additionally, in the second version, the prototype’s robustness was improved against end-user misuse of the controllers. Essentially, users cannot override the thermostat control curves by increasing the flow through the radiators once they set the thermostat to the expected indoor comfort level.

2.4. Test Periods

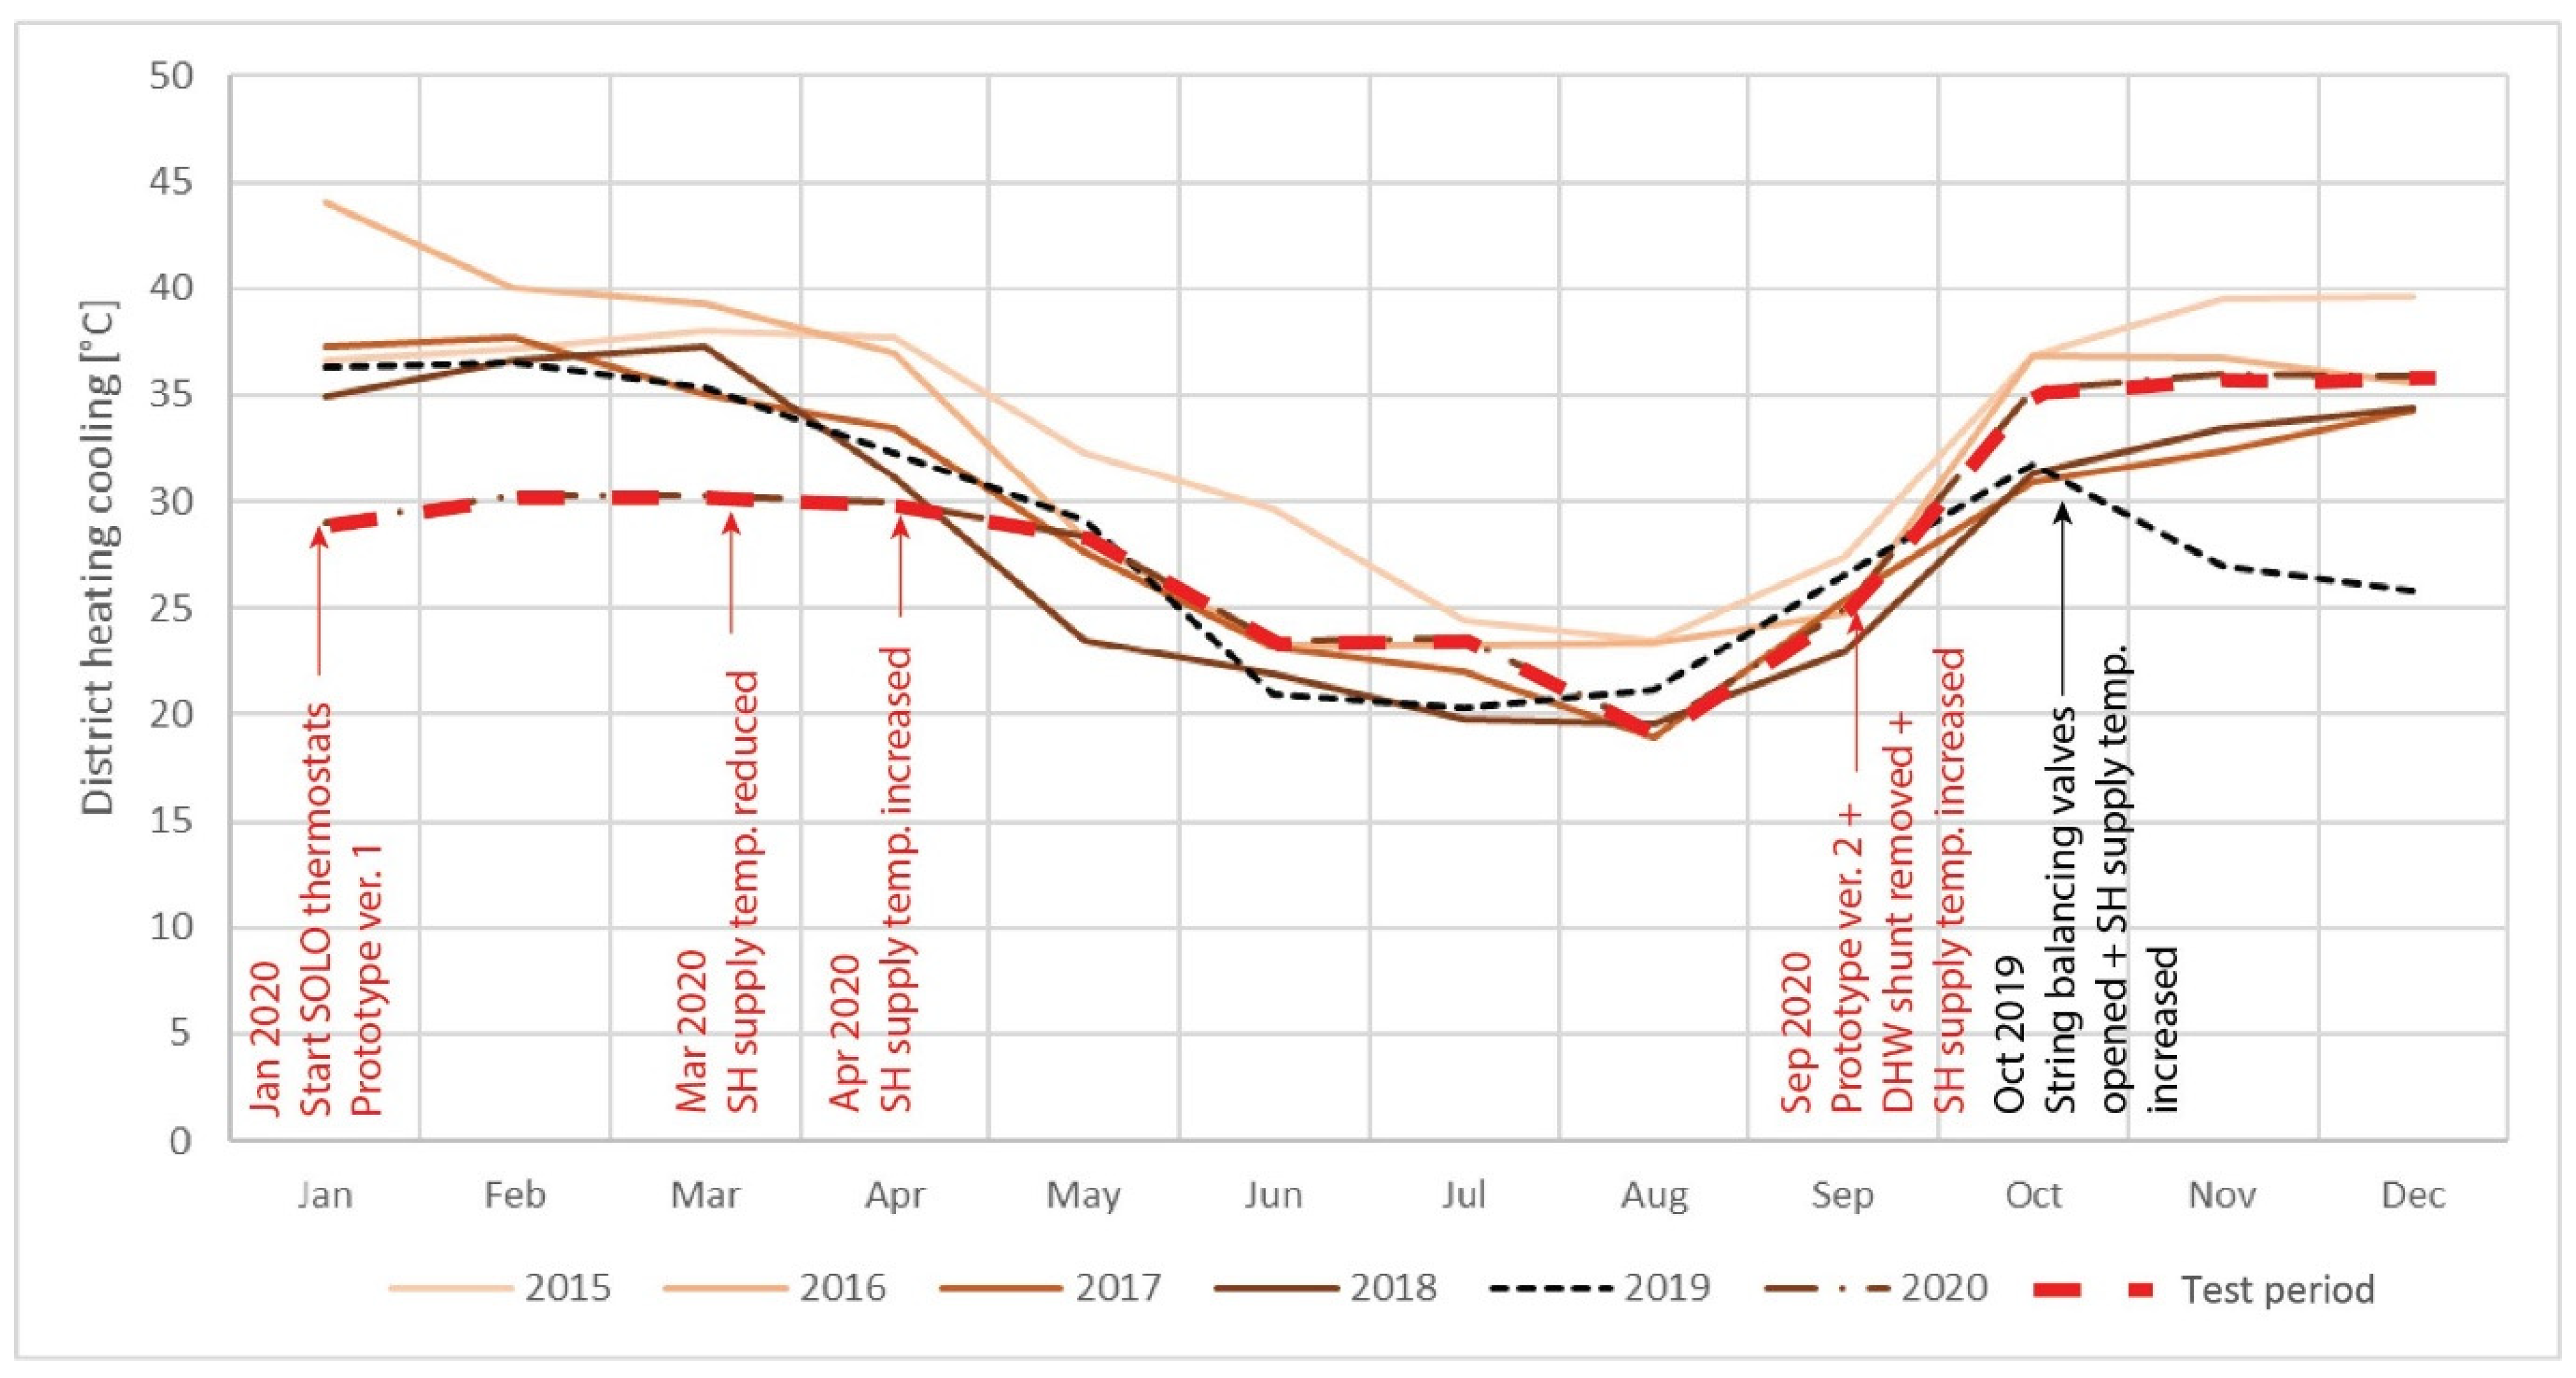
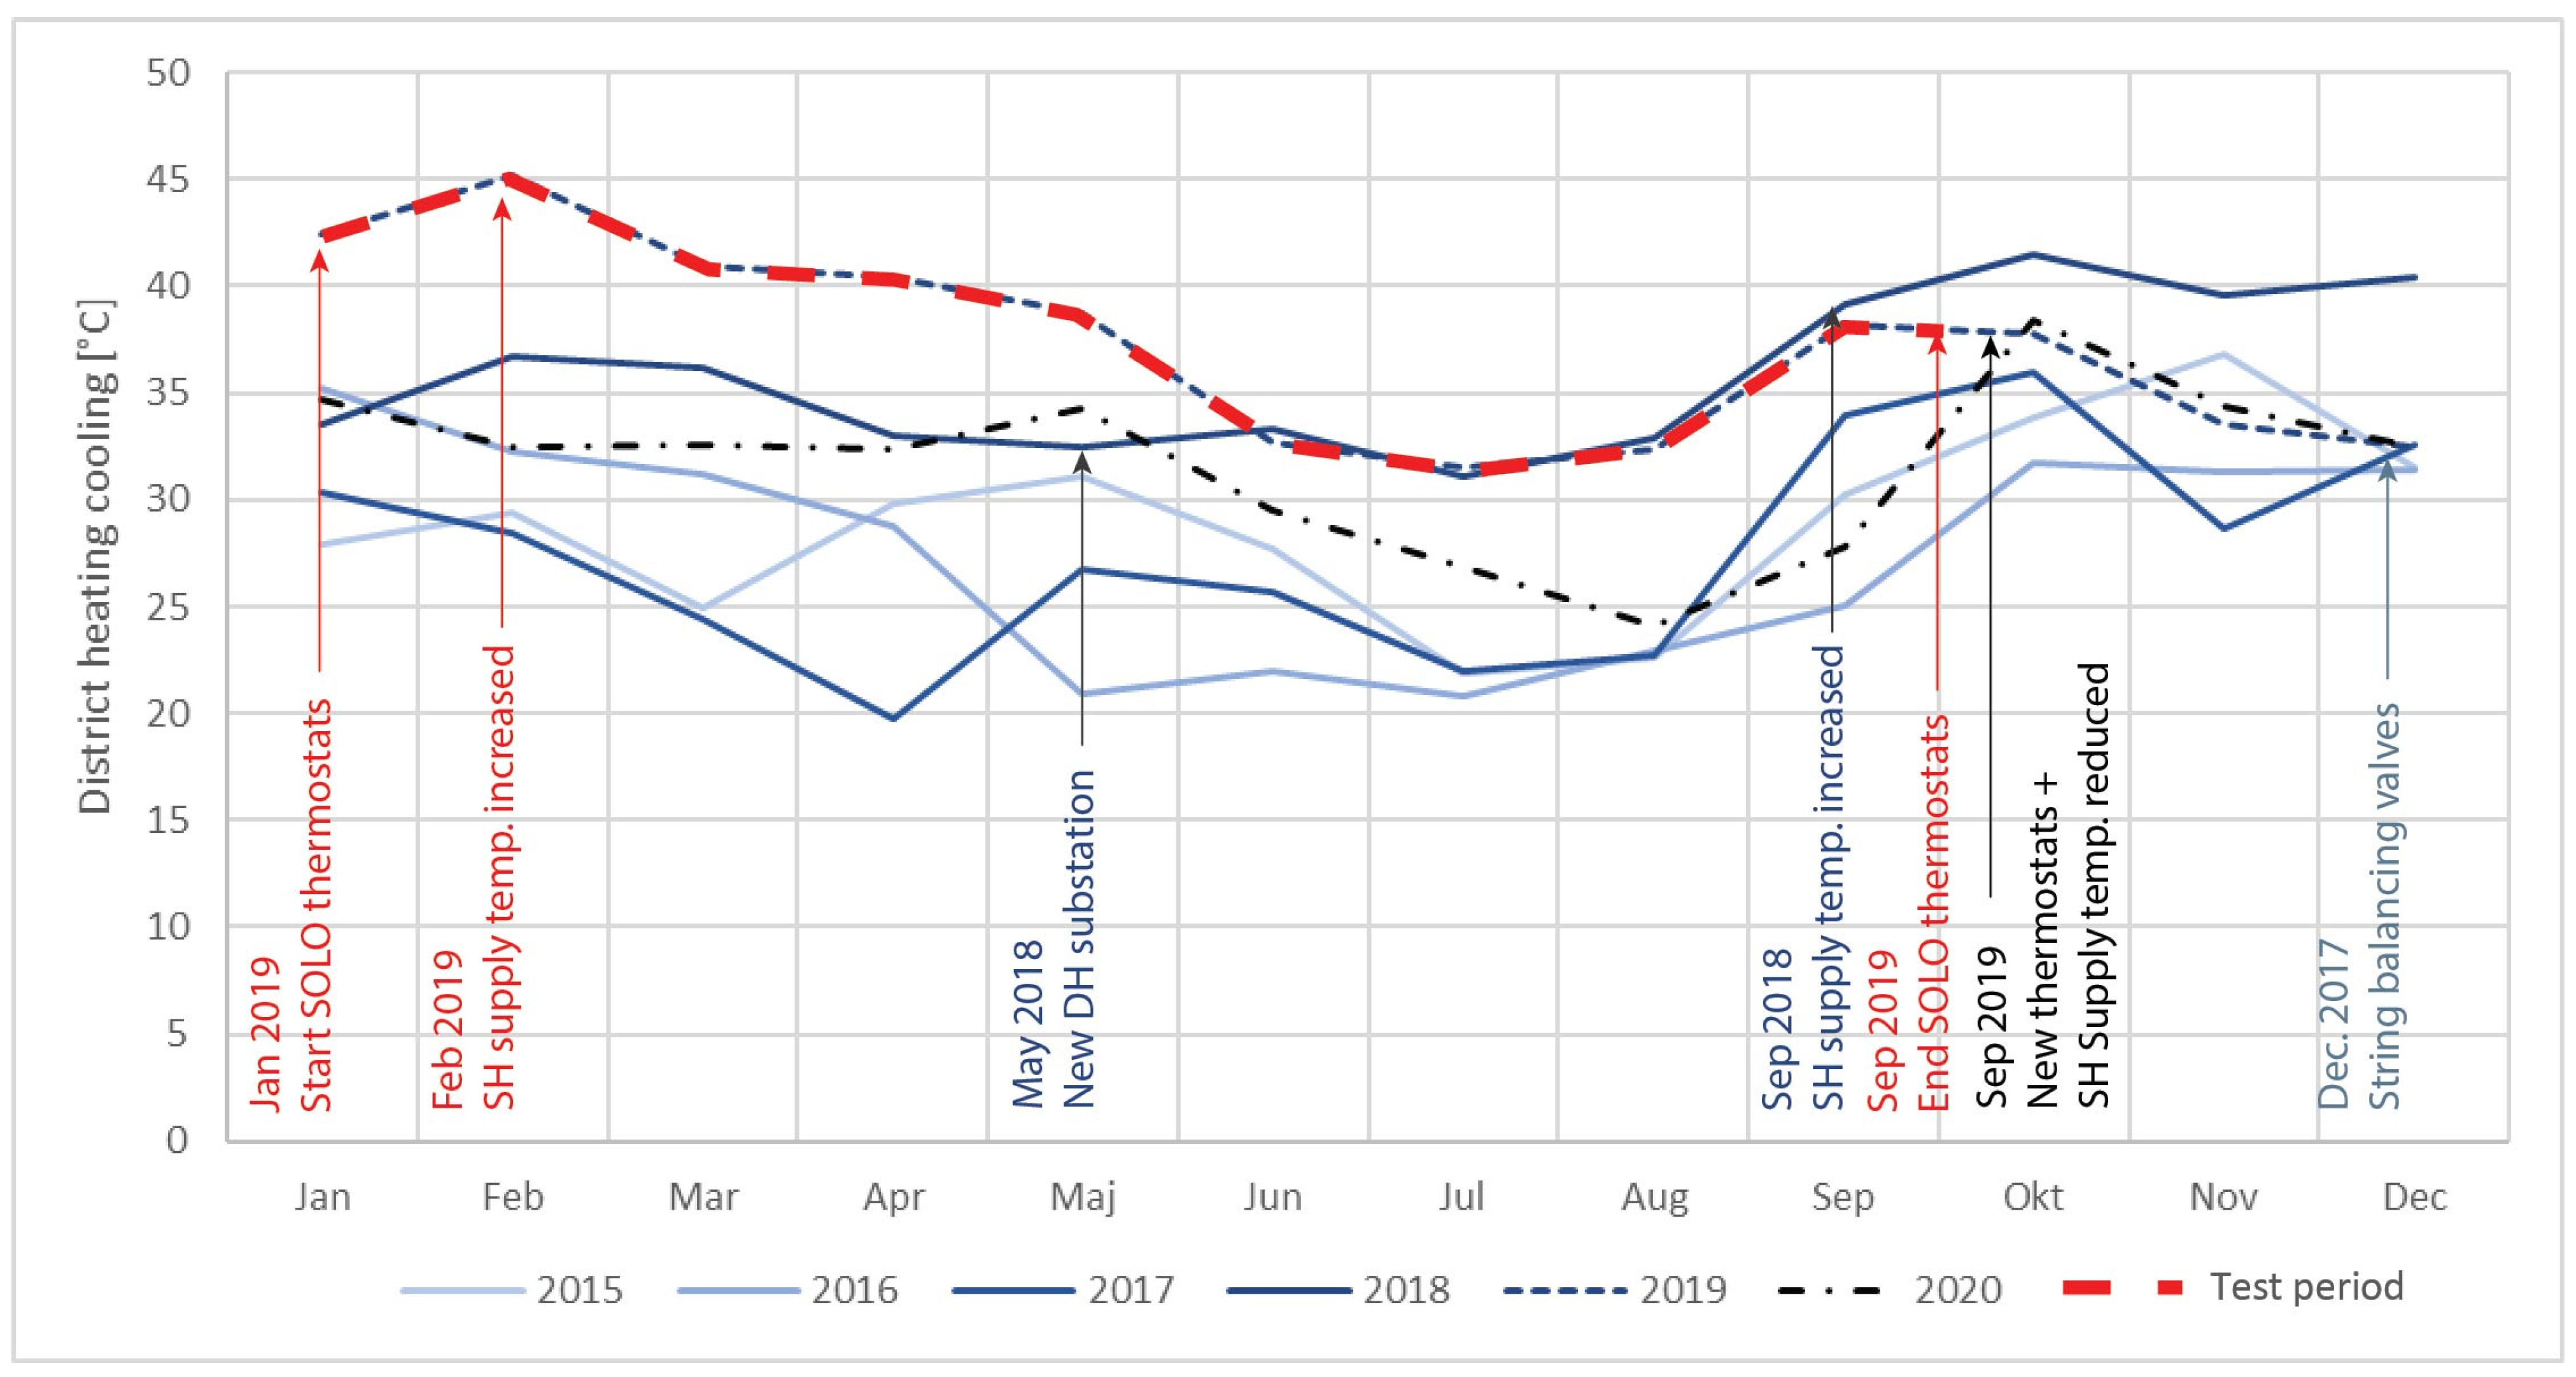
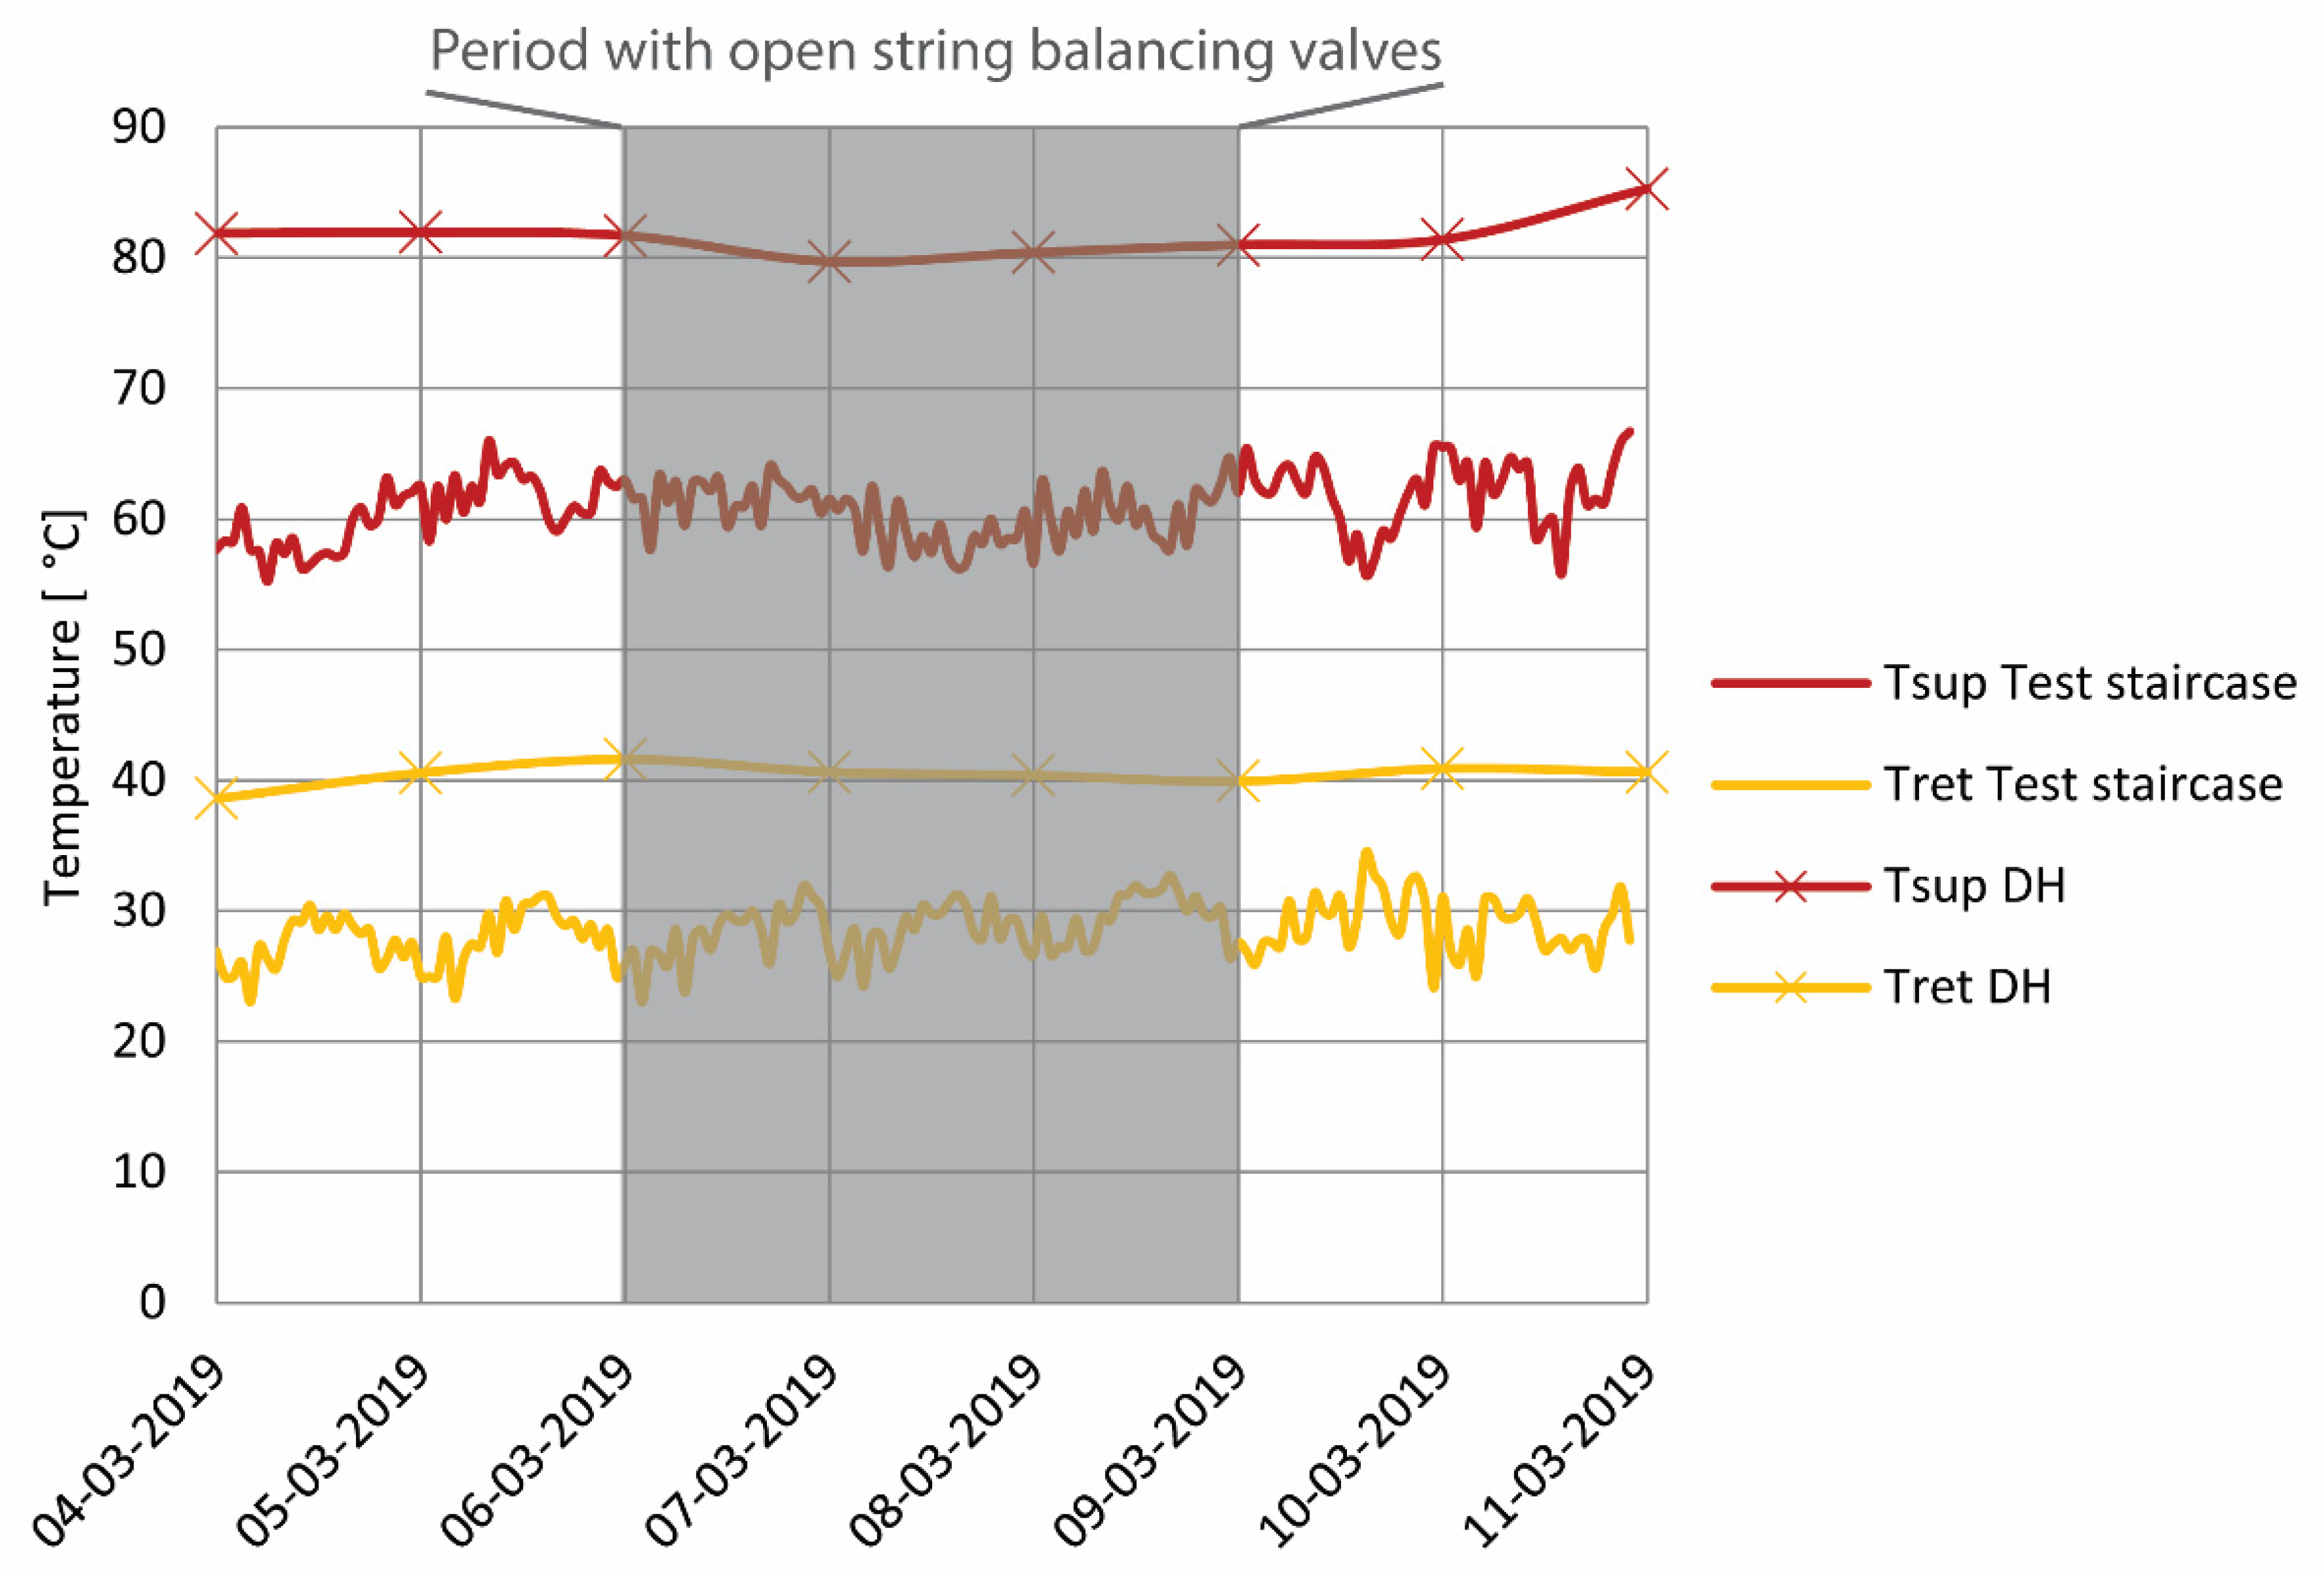
The test of the first thermostat prototype started in early 2019 in Building A. Shortly before the building was chosen for the test, it had been equipped with new string balancing valves (at the end of 2017), and a new district heating heat exchanger unit (May 2018). The first version of the prototype thermostats was installed on all radiators in half of the building from January 2019 to September 2019. This meant that all radiators in 10 apartments around one of the two staircases in the building were equipped with the new thermostats. During the test period, the space heating supply temperature was increased to test the return limiting functionality. In March 2019 a small test was also made where the string balancing valves in the heating system were opened up completely for a few days to test the balancing capabilities of the thermostats. In September 2019 after the thermostats were taken down, the occupants were offered new state-of-the-art thermostats as a replacement. Approximately two thirds of the occupants, therefore, had electronic thermostats, while the rest of the occupants chose to install mechanical radiator thermostats.
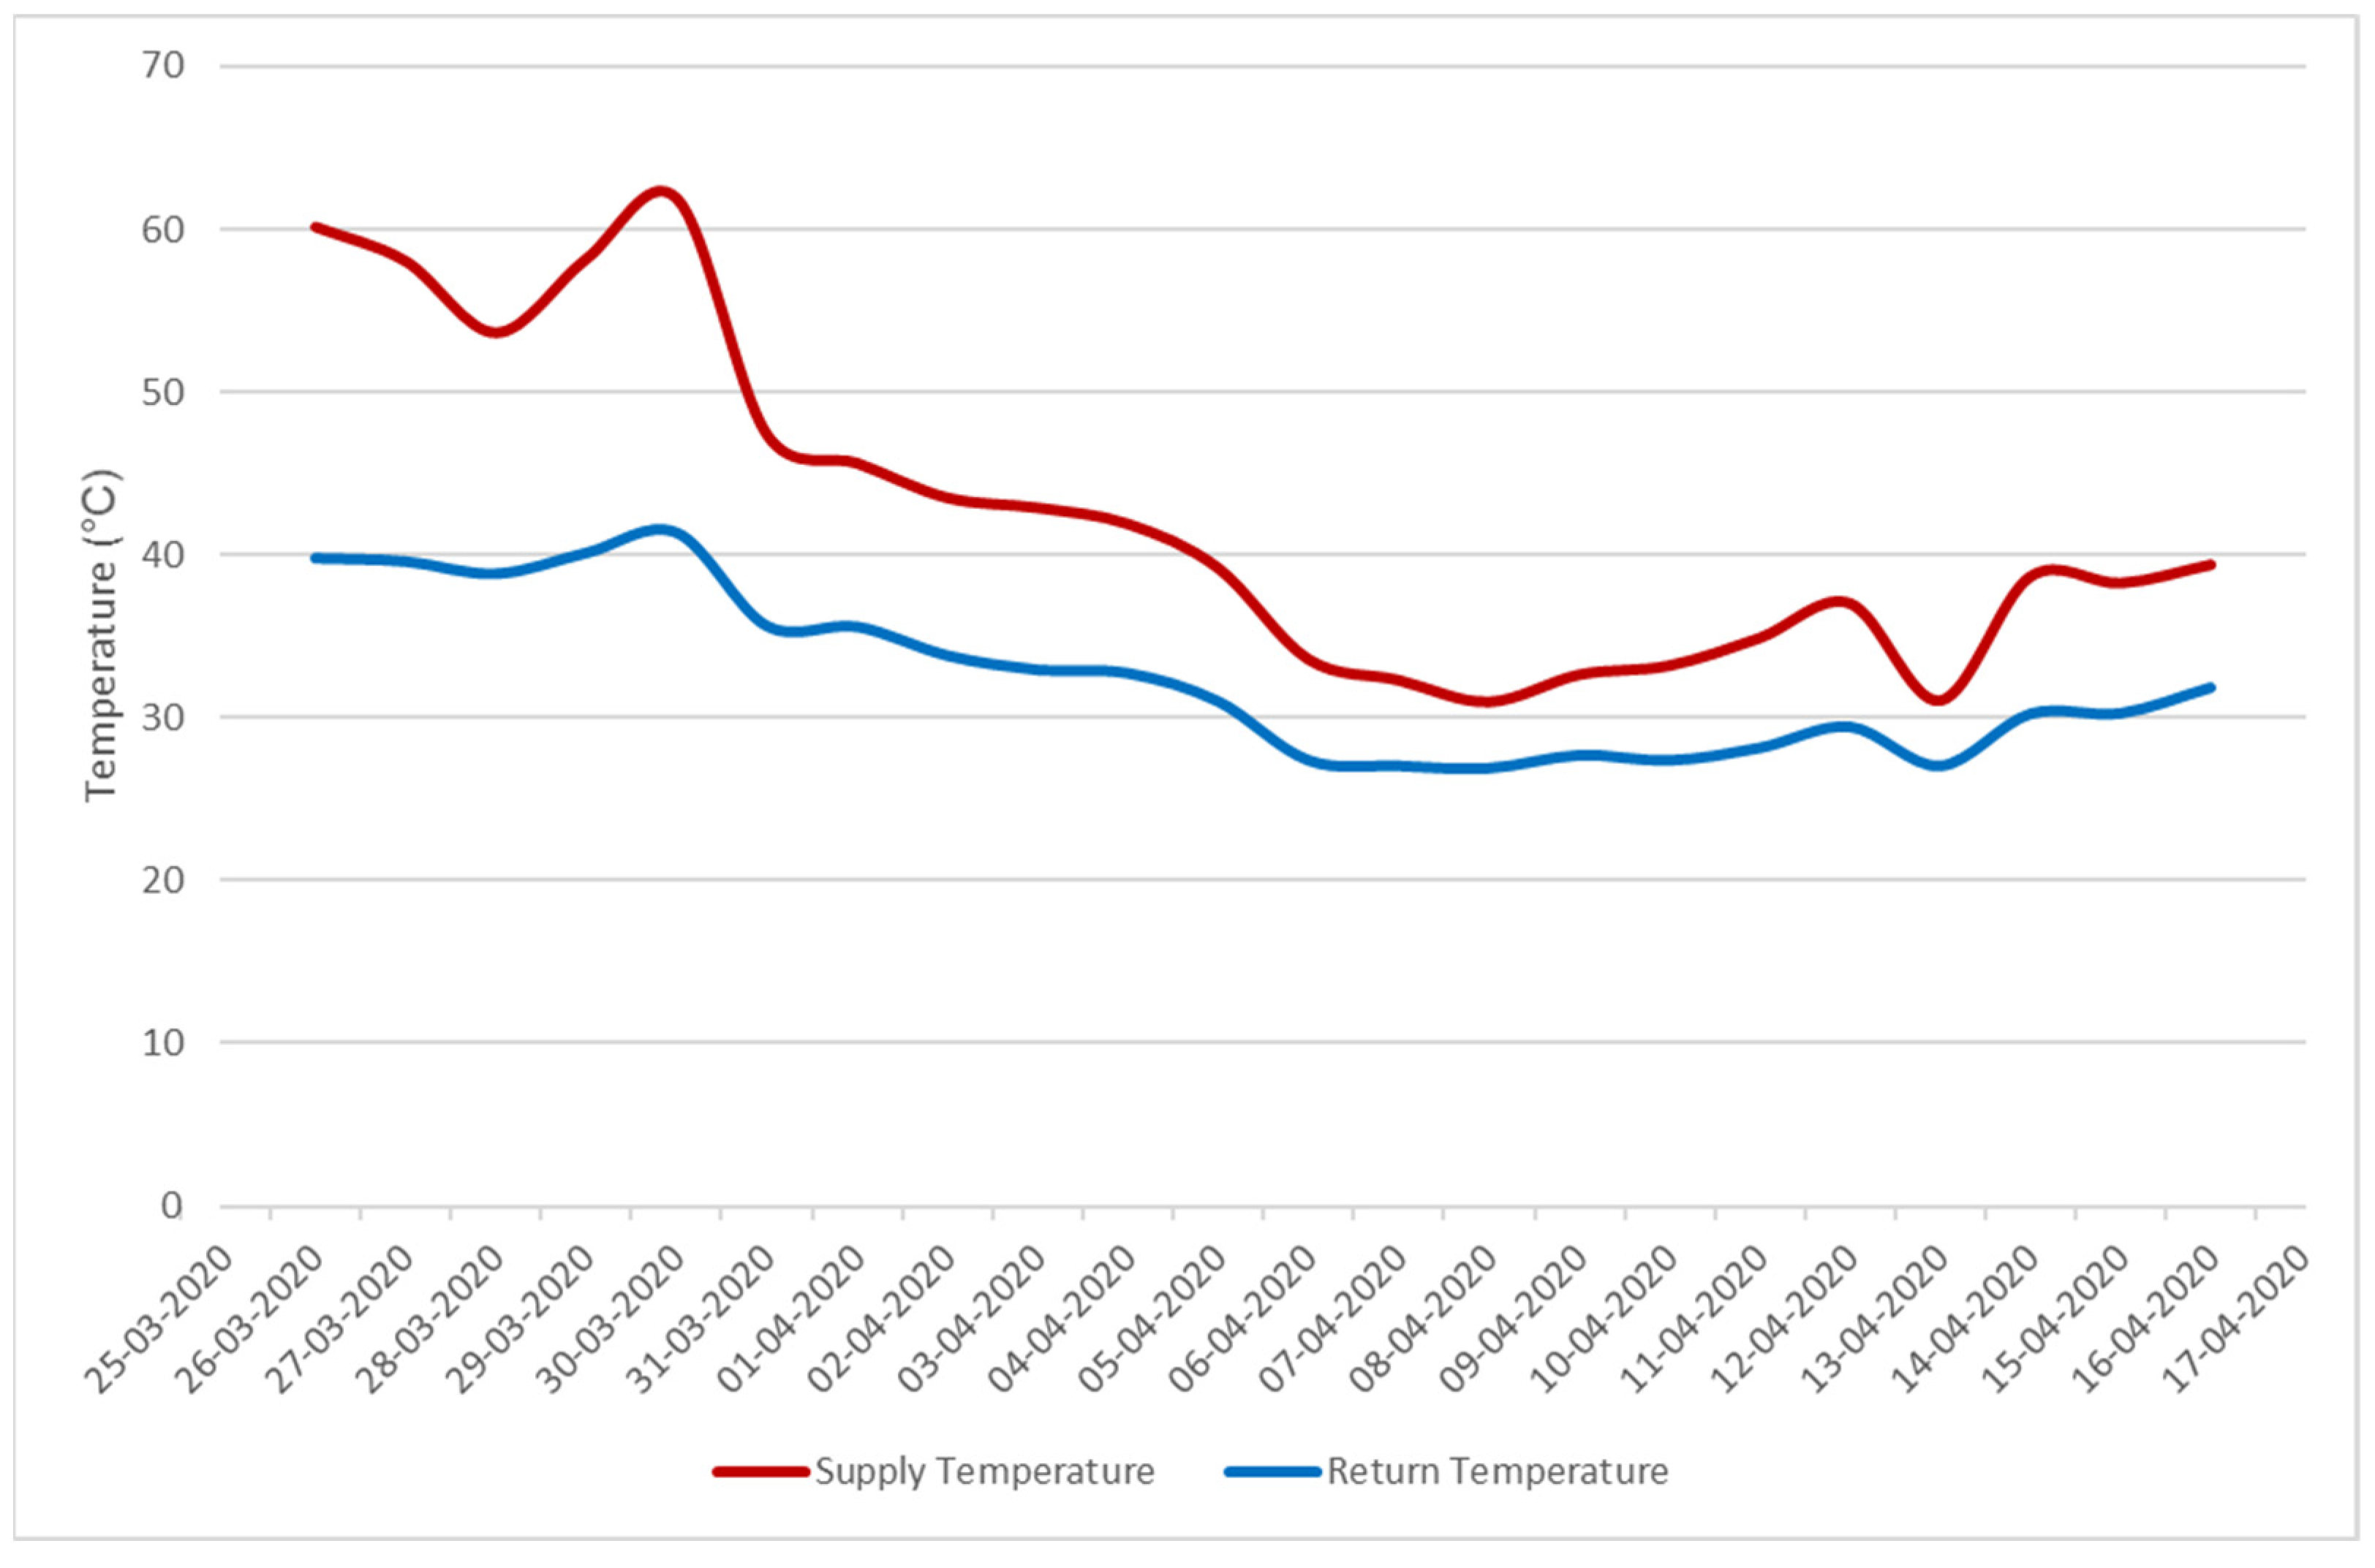
In Building B, the test of the first version prototype started in early 2020. In October 2019, before the beginning of the test, the string balancing valves in the space heating system were opened up completely to test the thermostats’ balancing functionality. The thermostats were installed on all radiators in the whole building in January 2020 and the test lasted until September 2020. During the test period, a small test was made to see how a reduction in the supply temperature affected the operation of the heating system. This was performed over a period of a couple of weeks in the beginning of April 2020. In September 2020, the first prototype thermostats were taken down and replaced with the second prototype version. The new test was carried out from September 2020 to December 2020. Similar to Building A, after the thermostats were taken down, the occupants were offered new state-of-the-art thermostats as a replacement; two thirds decided on electronic thermostats, the rest on mechanical ones.

3. Results

3.1. Building A

Figure 6 shows the monthly average measurements of the cooling of the district heating temperatures—defined as the difference between supply and return temperatures—from the main meter in Building A for the past five years. Significant changes in the heating installations are marked in the graph and the test period is highlighted in red. The figure illustrates that the cooling of the district heating flow was 4–12 °C higher during the winter and spring of 2019 when the new prototype thermostats were tested compared to the winter and spring of 2020 when the prototypes were substituted with state-of-the-art thermostats after the test. However, as can be seen from the graph, the cooling seems to increase already in the fall of 2018 before the prototype thermostats were installed in January 2019, when the new substation and string balancing valves were installed in the system.
Figure 7 and Figure 8 show the measured supply/return temperatures and the flow rates in the space heating system in the test staircase of Building A during the test period and a reference period between fall and winter 2020. The measured space heating temperatures and flow rates are plotted according to the outdoor temperature to compare them between the two periods while considering the fact that outdoor temperatures can vary and affect the operating conditions of the system. As can be seen from both Figure 7 and Figure 8, the supply temperatures in the space heating system were higher during the test period compared with the reference one, while return temperatures were lower. This resulted in lower mass flow rates due to the larger temperature difference.
This illustrated that the thermostat prototypes positively control the flow through the radiators and that the space heating is hydraulically balanced and can therefore be operated with high supply temperatures to obtain the lowest possible return temperature.
Figure 9 shows the measured space heating supply and return temperatures in the test staircase during the test of the prototype. The measurements highlight that the space heating return temperatures were generally below 35 °C and that these were limited according to the change in the supply temperature. The supply temperatures were around 60–70 °C during an extended period, where the prototype was able to provide good cooling of the space heating water flow.
Figure 10 shows the measured supply and return temperatures in the space heating system of the test staircase and from the main district heating meters during a period where the string balancing valves in the space heating system were opened up. This test aimed to investigate whether the prototype thermostats would be sufficient to ensure hydraulic balance in the space heating system, thus leaving redundant string balancing valves. Measurements from the space heating system are based on hourly values, while the district heating measurements are daily averages. As seen from the figure, there was no apparent difference between the two periods. This indicates that the thermostats helped provide hydronic balance in the heating system. However, the return temperature from both staircases influenced the district heating return temperature. The fact that it did not change during this test highlights that even the reference staircase, where no prototypes were installed, was well-controlled and -operated. During this period, the domestic hot water demand constitutes 20% of the total energy consumption. Instead, the heat demand in the test staircase constitutes approximately 30%, the space heating consumption in the reference staircase the remaining 50%. Nevertheless, comparing the cooling of the district heating in the building before and after the string balancing valves were installed—in 2017 and 2018, respectively—these clearly increased the cooling of the district heating water. This highlights the importance of hydronic balancing of heating systems to secure low-temperature operations.

3.2. Building B

Similar to what is presented for Building A, Figure 11 shows the monthly average measurements of the district heating temperature difference from the main meter in Building B for the past five years. Significant changes in the heating installations are marked in the graph and the test period for the two prototypes is highlighted in red. The figure illustrates that the cooling of the district heating—defined as the difference between supply and return temperatures—significantly dropped when the string balancing valves in the heating system in the building were opened up and the supply temperature increased in October 2019. This suggested some problematic control and operation of the heating system. Similarly, the cooling of district heating flow did not increase when the first thermostat prototypes were installed in January 2020. The overall district heating return temperature from the building was high during the test period for prototype 1 until spring 2020. Instead, the cooling of the district heating flow increased by 5 °C since the second prototype thermostats were installed in all radiators in September 2020.
Figure 12 shows the average hourly supply and return temperatures measured in the space heating system in Building B during the test of prototype 1 in February 2020. As can be seen from the graph, the return temperatures in the space heating system fluctuated around 40 °C. The main reason for such high return temperatures was that some users found how to override the control curve of the thermostats—by holding down the control button for long enough to put the thermostat in mounting mode, which leads to a fully open valve—allowing more flow through the radiators.
Another test was performed during the first two weeks of April, before the end of the heating season. The supply temperature was decreased to assess the impact on the return temperatures. Unlike the measurements presented in Figure 5 for Building A, where the thermostats were able to correctly control the return temperatures according to the variation of the supply temperature, the results summarized in Figure 13 showed that, contrary to what was expected, the supply reduction led to a drop in the return temperature. This underlined the presence of uncontrolled radiators affecting the overall return temperature from the space heating system.
After summer 2020, the second version of the thermostat prototype was installed in all radiators. The more robust design and the updated control curves to limit the return temperature improved the situation compared to prototype 1. However, the overall return temperature was still above 35 °C, as presented in Figure 14 from 27 November to 3 December 2020.
It was investigated whether poorly controlled and operated parts of the heating system could have been identified and improved. Figure 15 presents the return temperatures from all the risers. It pinpoints that only two risers (riser 1 and riser 10) had high return temperatures in the range of 36–44 °C and that they contaminated the overall return temperature in the building.
Ten radiators out of 175 are connected in the two risers. Figure 16 shows the return temperatures at radiator level. In the presentation of the measurements, the return temperature from one radiator is missing due to a problem with the remote connection. The data depicted that only one uncontrolled radiator on each riser caused such high return temperatures in the risers and building. In one case, it was found that the underperforming radiator was due to a manufacturing problem with the thermostat, which was not able to control the flow properly. Hence, higher flow through the radiator led to higher return temperatures. Instead, in the other radiator, the thermostat was tampered with by the end-users in the flat. It was unclear if the occupants were experiencing some issues or were less likely to interact with a modern electronic thermostat and compromise its functionality by tampering with it, as the return temperature sensor was dismounted. Although it was of great interest, this could not be investigated further due to the COVID-19 restrictions which prevented meeting the occupants in person during the test. The rest of the radiators were correctly controlled and operated.
In order to enhance the situation, a couple of actions were implemented by the building’s operator. First, the string balancing valves that controlled the water flow through risers 1 and 10 were slightly closed off to reduce excessive flows. Secondly, the pressure difference was measured over a pair of risers in the far end of the building and it was found to be above the desired 0.1 bar. On 4 December 2020, the space heating pump pressure setting was changed from 0.65 bar at proportional control to 0.25 bar at constant pressure. This was a correct pump setting to mitigate the effect of overflow in a few uncontrolled radiators. Figure 14 presents the measurements for the period before and after the pump settings’ adjustments. The data shows that after 4 December the operation of the entire heating system was improved, and the changes helped secure a return temperature of 35 °C. None of the occupants had any complaints about discomfort during the test in 2020.

4. Discussions

4.1. Field Test of New Thermostats in Building A

The test of the prototype in Building A showed the capability of the new thermostat to limit and effectively control the return temperature from the radiators. The monthly average measurements of the cooling of the district heating temperatures—defined as the difference between supply and return temperatures—were 4–12 °C higher than winter and spring 2020 when the prototypes were substituted with state-of-the-art thermostats. This was also evident when the supply temperature was increased during the test, as presented in Figure 7, showing that the thermostats correctly controlled the radiators, leading to the lowest return temperature. In addition, the comparison with measurements from 2015 to 2017 in Figure 4 illustrated a higher cooling of the district heating supply temperature, although in those years the space heating system did not have the new substation and the string balancing valves. In fact, the higher cooling of the district heating temperatures tendency started in 2018 when the new substation and string balancing valves were installed in the system. This suggested that, regardless of the control technology, having a balanced hydraulic system is crucial to secure the expected comfort level and achieve lower operating temperatures in the heating system.
The ability of the new electronic thermostats to ensure automated hydronic balance was tested—during 6–9 March 2019—by fully opening the string balancing valves in all risers of the staircase where the new thermostats were installed. The measurements presented in Figure 10. provide no difference in the operations of the heating system, highlighting that the string balancing valves would be redundant if the thermostats were mounted on all radiators. In addition, it was also clear that no changes occurred in the district heating temperatures, emphasizing that the radiators in the staircase not included in the test of the new thermostats were also well controlled and operated.

4.2. Field Test of New Thermostats in Building B

The test in Building B was performed on 175 thermostat prototypes mounted on each radiator. The second prototype version, installed in September 2020, had a more robust design—to avoid the end-users possibly overriding the control curves—and new adjustable profiles to increase the accuracy of controlling and limiting the return temperature from the radiators compared to the first version. Figure 11 highlights an increase of 5 °C in the cooling of district heating flow. Despite these improvements in the upgraded prototype, the overall return temperature from the space heating system was still above 35 °C. Figure 16 summarizes the results of the operation of the radiators connected to the poorly performing risers and documents how only two uncontrolled radiators could increase the overall return temperature in the building. In one case, a manufacturing problem with the thermostat was found—which was an acceptable error in the development of a new product; in the second case, the issue was associated with end-user misuse of the local controller. The latter is a typical problem that could be encountered in any heating system, and it documented how low temperatures in heating systems are sensitive to well-controlled and -operated radiators. Just a few uncontrolled radiators can affect overall operations. Two possible straightforward solutions to limit the impact of uncontrolled flows through the radiators can be: securing the correct pump setting to avoid unnecessary high flow in the system; and installing a hydraulic pre-set function in combination with the thermostats. These valves can effectively constrain the flow passing through the radiators.
Typically, higher supply temperatures in well-controlled radiators correspond to lower return temperatures, as the thermostats limit the flow through the radiators resulting in larger temperature differences, as documented by the temperature and flow rate measurements in Figure 7 and Figure 8 for Building A. Instead, in the presence of a few uncontrolled radiators, the effect of having a high supply temperature would lead to high return temperatures affecting the overall operation of the heating system. The test performed in Building B during the first two weeks of April 2020 documented that, on the contrary, the minimization of the supply temperature could be a promising control strategy to reduce the negative effect of the high return temperature from those radiators with uncontrolled flows as presented in Figure 13. Lower supply temperatures are possible in existing space heating systems because the radiators are typically oversized and operated in part-load modes [6,12]. Hence, this control strategy should be prioritized because lower supply temperatures are crucial to exploiting the full potential of renewable energy sources, recovering waste heat, improving heat pumps’ coefficient of performance, and reducing the distribution heat losses in the networks and buildings. However, the minimization of the supply temperature should be tested over an entire heating season to assess its robustness further and solve operating problems that might arise and affect end-user comfort.

4.3. Future Thermostat Design and the Digitalization of the Demand-Side

The results from Building B highlighted two key elements: the importance of remote monitoring; and how optimal operations in buildings are sensitive to interactions between the control of the heating systems and the end-users. Although problems may always arise in everyday operations of the heating systems, it is always possible to improve them. The measurements from the remotely connected thermostats were crucial to demonstrate how to locate and fix the errors in the heating system in Building B, even though the end-users were not experiencing any discomfort. In addition, by securing the correct setting of the pump and closing off the string balancing valves only in the poorly performing risers, the negative effect of the uncontrolled radiators was mitigated, and the overall return temperature in the building dropped to 35 °C after 4 December, as illustrated in Figure 14. Although those improvements had a positive effect, they were temporary solutions, and faulty/damaged thermostats always need to be repaired or replaced if necessary. Therefore, developing new, wirelessly connected products for automatic local control of the heating elements is an essential step in the future digitalization of the demand side. This will support building service personnel to secure better control and the lowest possible operating temperatures according to the specific characteristics of the building due to the continuous and remote monitoring of the heating systems.
Finally, the future development of new products to locally control radiators or any other heating element has to secure the most robust design possible to minimize the negative impact of the end-users in the operation of their space heating systems. The end-users should freely decide their comfort level. Still, they must not be allowed to override the local control or remove essential components to maintain the optimal heating system operation over time. If that is the case, future thermostats may prevent any flow through the specific uncontrolled radiators by closing the valves or limiting the flow to a minimum with a new safety functionality. This would not be detrimental to the overall indoor temperature in the flats and would avoid the low-temperature operation of an entire building being compromised by a few radiators before the causes of problems can be identified.

5. Conclusions

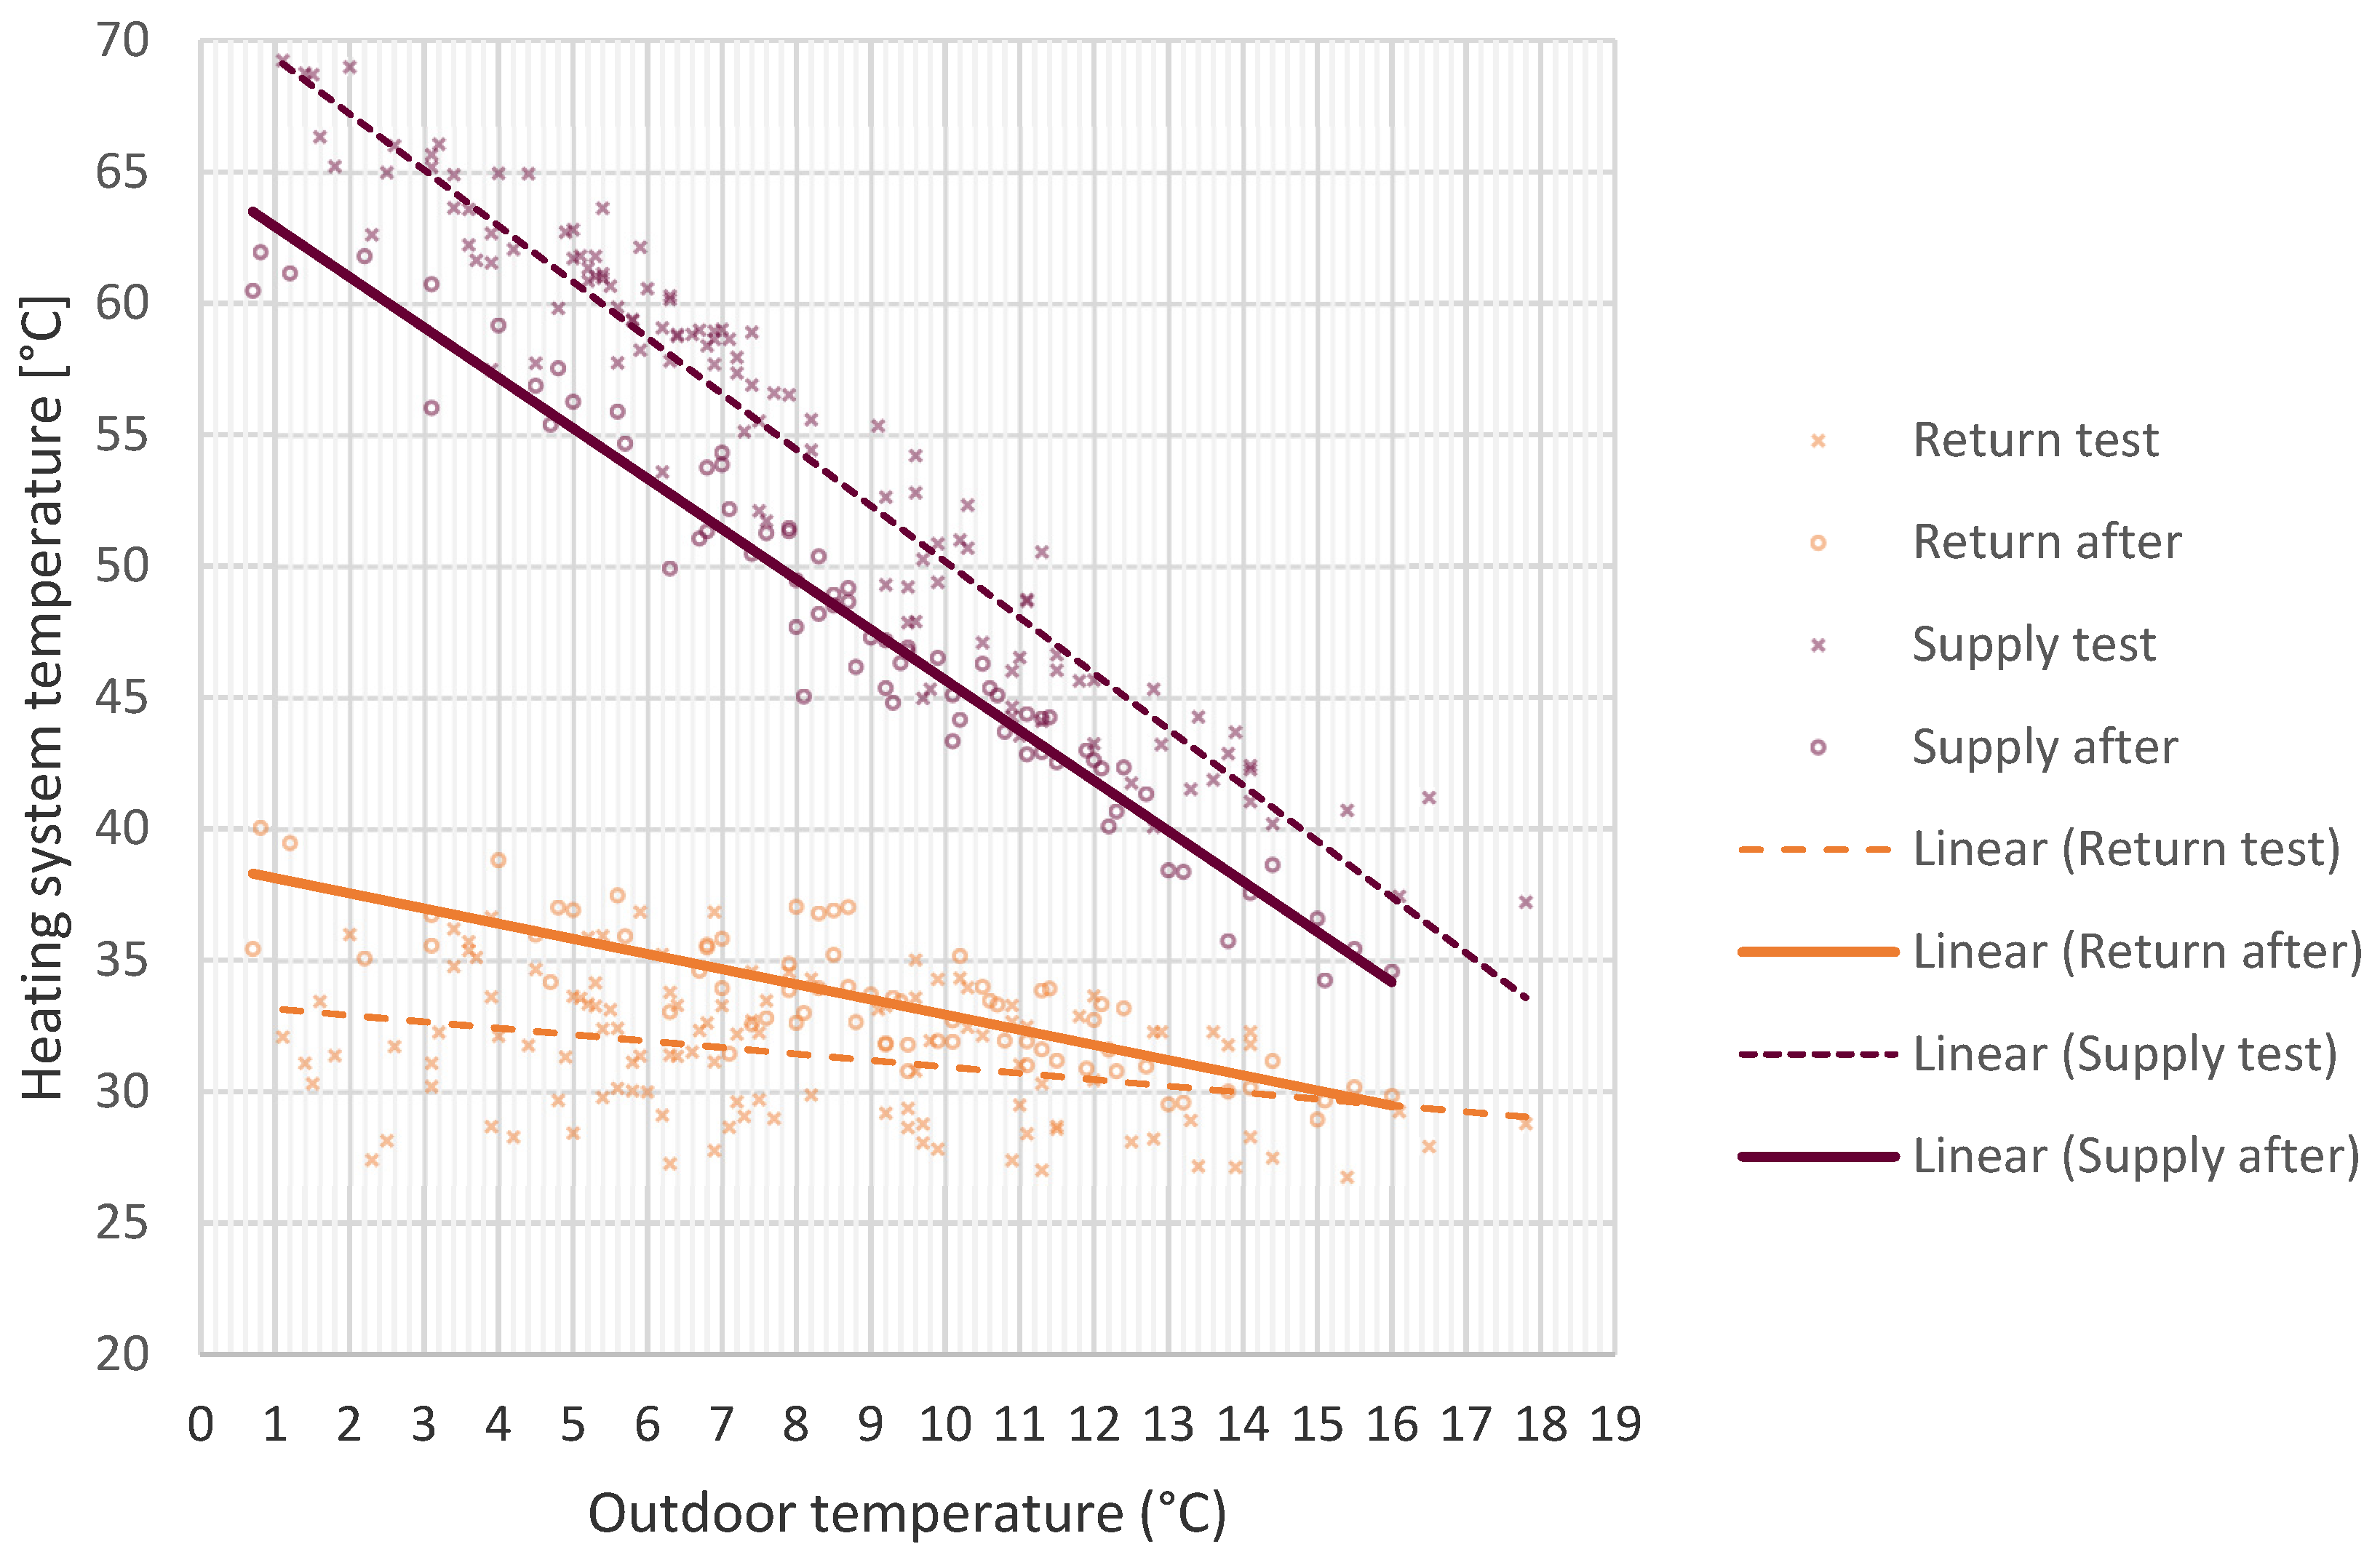
New electronic thermostats were tested in two multi-family buildings in Denmark, both connected to the local district heating network. The results documented that this prototype thermostat can embed the functionalities of the traditional thermostatic radiator valve and the riser balancing valves in the same design. In particular, integrating an extra return temperature sensor ensured better flow control through the radiators and the lowest possible return temperature. In addition, installing these thermostats can allow the automatic hydronic control of the heating system, making the risers’ balancing valves redundant. It was found in Building A that the cooling of the district heating temperatures —defined as the difference between the supply and return temperature—was 4–12 °C higher in 2019 during the test compared to winter and spring 2020 when the prototypes were replaced with state-of-the-art thermostats.
The measurements also suggested that optimal operation in large buildings is sensitive to well-controlled heating systems. Only two uncontrolled radiators out of 175 were able to contaminate the overall return temperature in Building B. In one case, the reason was a manufacturing problem—which was an acceptable issue in the development of a new product—whereas, in the second one, it was due to the end-users tampering with the thermostat. This last aspect can be potentially critical for any space heating system control. The results highlighted two main elements. Firstly, the importance of remotely connected devices. The measurements from the thermostats helped pinpoint the faults in the heating system, although the end-users were not experiencing any discomfort. By also correcting the pump setting and closing the string balancing valves in the two risers to limit the flow to the uncontrolled radiators, it was possible to reduce the overall return temperature to 35 °C, neutralizing the negative effect of the malfunctioning thermostats. Hence, the digitalization of the demand side represents a critical element for the transition towards low-temperature operations and can support the activities of building service personnel, which are labor- and time-consuming because they have to be manually performed.
Secondly, the test in April 2020 suggested that the minimization of the supply temperature may be a promising strategy to mitigate the negative effect of uncontrolled radiators in the space heating systems without compromising indoor comfort in the apartments. This control strategy should be tested further and prioritized in space heating systems because, in addition to increasing robustness against the effect of uncontrolled radiators, low supply temperatures are important to exploit the potential of renewable sources, to recover waste heat, and increase the coefficient of performance of heat pumps in future low-temperature district heating networks.
Lastly, the key finding for future product development is to secure the most robust design that could minimize the negative impact of end-user misuse of local controllers in heating elements. An improved design may integrate a new safety functionality that closes the valve or limits the flow to a minimum in case of damage to thermostats or incorrect signals from the sensors. This would not be detrimental for the indoor comfort in flats and would avoid a few radiators compromising the low-temperature operation of an entire building.

Author Contributions

Conceptualization, D.S.Ø. and S.S.; methodology, D.S.Ø., M.T and S.S; formal analysis, D.S.Ø. and M.T.; investigation, D.S.Ø. and M.T; resources, D.S.Ø. and M.T.; data curation, D.S.Ø. and M.T.; writing—original draft preparation, D.S.Ø.; writing—review and editing, M.T.; visualization, D.S.Ø. and M.T.; supervision, S.S.; project administration, D.S.Ø. and M.T.; funding acquisition, D.S.Ø. and S.S. All authors have read and agreed to the published version of the manuscript.

Funding

This work was funded by the EUDP—J.nr 64017-05140—and carried out in close collaboration with partners from Damgaard Consulting Engineers, Danfoss A/S, and Frederiksberg Utility.

Informed Consent Statement

Not applicable.

Acknowledgments

The authors would like to thank these partners Damgaard Consulting Engineers, Danfoss A/S, and Frederiksberg Utility for their hard work and engagement in developing the project.

Conflicts of Interest

Through the ‘Energy Technology Development and Demonstration Program’ (EUDP), the Danish Energy Agency funded this project that was carried out in collaboration with Damgaard Consulting Engineers, Frederiksberg Utility, and Danfoss A/S, who was responsible for the development of the new thermostat prototype. However, the contents of this article and its conclusions were solely written and investigated by the academic staff of the Technical University of Denmark (DTU), who were not censored or influenced by any of the project’s partners.

References

  1. European Commission An EU Strategy on Heating and Cooling. 2016. Available online: https://ec.europa.eu/energy/en/topics/energy-efficiency/heating-and-cooling (accessed on 10 August 2018).
  2. European Commission. Forging a climate-resilient Europe-the new EU Strategy on Adaptation to Climate Change. Eur. Comm. 2021, 6, 951–952. [Google Scholar]
  3. Averfalk, H.; Benakopoulos, T.; Best, I.; Dammel, F.; Engel, C.; Geyer, R.; Gudmundsson, O.; Lygnerud, K.; Nord, N.; Oltmanns, J.; et al. Low-Temperature District Heating Implementation Guidebook; IEA DHC Report; Fraunhofer Verlag: Stuttgart, Germany, 2021. [Google Scholar]
  4. Lund, H.; Werner, S.; Wiltshire, R.; Svendsen, S.; Thorsen, J.E.; Hvelplund, F.; Mathiesen, B.V. 4th Generation District Heating (4GDH). Integrating smart thermal grids into future sustainable energy systems. Energy 2014, 68, 1–11. [Google Scholar] [CrossRef]
  5. Lund, H.; Østergaard, P.A.; Chang, M.; Werner, S.; Svendsen, S.; Sorknæs, P.; Thorsen, J.E.; Hvelplund, F.; Mortensen, B.O.G.; Mathiesen, B.V.; et al. The status of 4th generation district heating: Research and results. Energy 2018, 164, 147–159. [Google Scholar] [CrossRef]
  6. Lauenburg, P. Temperature optimization in district heating systems. In Advanced District Heating and Cooling (DHC) Systems; Elsevier Ltd.: Amsterdam, The Netherlands, 2016; pp. 223–240. ISBN 9781782423744. [Google Scholar]
  7. Østergaard, D.S.; Svendsen, S. Theoretical overview of heating power and necessary heating supply temperatures in typical Danish single-family houses from the 1900s. Energy Build. 2016, 126, 375–383. [Google Scholar] [CrossRef] [Green Version]
  8. Brand, M.; Svendsen, S. Renewable-based low temperature district heating for existing buildings in various stages of refurbishment. Energy 2013, 62, 311–319. [Google Scholar] [CrossRef]
  9. Østergaard, D.S.; Svendsen, S. Case study of low-temperature heating in an existing single-family house-A test of methods for simulation of heating system temperatures. Energy Build. 2016, 126, 535–544. [Google Scholar] [CrossRef] [Green Version]
  10. Danish Energy Agengy. Demonstration i Tilst Fuldskalademonstration af lavtemperaturfjernvarme i eksisterende bebyggelser; Danish Energy Agengy: København, Denmark, 2014.
  11. Danish Energy Agency. Demonstration i Sønderby–Fuldskalademonstration af lavtemperaturfjernvarme i eksisterende bebyggelser; Danish Energy Agengy: København, Denmark, 2014.
  12. Jangsten, M.; Kensby, J.; Dalenbäck, J.O.; Trüschel, A. Survey of radiator temperatures in buildings supplied by district heating. Energy 2017, 137, 292–301. [Google Scholar] [CrossRef] [Green Version]
  13. Rämä, M.; Lindroos, T.J.; Svendsen, S.; Østergaard, D.S.; Tunzi, M.; Sandvall, A.; Holmgren, K. Stepwise Transition Strategy and Impact Assessment for Future District Heating Systems; IEA DHC: Frankfurt, Germany, 2019. [Google Scholar]
  14. Østergaard, D.S.; Tunzi, M.; Svendsen, S. What does a well-functioning heating system look like? Investigation of ten Danish buildings that utilize district heating ef fi ciently. Energy 2021, 227, 120250. [Google Scholar] [CrossRef]
  15. Frederiksen, S.; Werner, S. District Heating and Cooling; Studentlitteratur: Lund, Sweden, 2013; p. 408. ISBN 978-91-44-08530-2. [Google Scholar]
  16. Brange, L.; Englund, J.; Sernhed, K.; Thern, M.; Englund, J.; Lauenburg, P. Bottlenecks in district heating systems and how to address them. Energy Procedia 2017, 116, 249–259. [Google Scholar] [CrossRef]
  17. Gadd, H.; Werner, S. Fault detection in district heating substations. Appl. Energy 2015, 157, 51–59. [Google Scholar] [CrossRef] [Green Version]
  18. Månsson, S.; Johansson Kallioniemi, P.O.; Thern, M.; Van Oevelen, T.; Sernhed, K. Faults in district heating customer installations and ways to approach them: Experiences from Swedish utilities. Energy 2019, 180, 163–174. [Google Scholar] [CrossRef]
  19. Østergaard, D.S.; Svendsen, S. Experience from a practical test of low-temperature district heating for space heating in five Danish single-family houses from the 1930s. Energy 2018, 159, 569–578. [Google Scholar] [CrossRef]
  20. Liao, Z.; Swainson, M.; Dexter, A.L. On the control of heating systems in the UK. Build. Environ. 2005, 40, 343–351. [Google Scholar] [CrossRef]
  21. Benakopoulos, T.; Tunzi, M.; Salenbien, R.; Svendsen, S. Strategy for low-temperature operation of radiator systems using data from existing digital heat cost allocators. Energy 2021, 231, 120928. [Google Scholar] [CrossRef]
  22. Benakopoulos, T.; Salenbien, R.; Vanhoudt, D.; Svendsen, S. Improved Control of Radiator Heating Systems with Thermostatic Radiator Valves without Pre-Setting Function. Energies 2019, 12, 3215. [Google Scholar] [CrossRef] [Green Version]
  23. Averfalk, H.; Werner, S. Essential improvements in future district heating systems. Energy Procedia 2017, 116, 217–225. [Google Scholar] [CrossRef]
  24. Averfalk, H.; Werner, S.; Felsmann, C.; Rühling, K.; Wiltshire, R.; Svendsen, S.; Li, H.; Faessler, J.; Mermoud, F.; Quiquerez, L. IEA Annex XI Final Report: Transformation Roadmap from High to Low Temperature District Heating Systems; International Energy Agency: Paris, France, 2017. [Google Scholar]
  25. Cholewa, T.; Siuta-Olcha, A.; Balaras, C.A. Actual energy savings from the use of thermostatic radiator valves in residential buildings–Long term field evaluation. Energy Build. 2017, 151, 487–493. [Google Scholar] [CrossRef]
  26. Trüschel, A. Värdet av Injustering [The Value of Balancing]; Research Report 2005:134; Svensk Fjärrvärme AB: Stockholm, Sweden, 2005. [Google Scholar]
Figure 1. Pictures of the two test buildings: Building A (left) and Building B (right).
Energies 15 00367 g001
Figure 2. Measurements of energy consumption for domestic hot water and space heating in Building A (in the two staircases) and Building B during the period where the prototypes were tested.
Energies 15 00367 g002
Figure 3. Building A plan and schematic view of the pipelines and risers; temperature sensors are installed on each return riser.
Energies 15 00367 g003
Figure 4. Building B section of the pipelines, risers and radiators; temperature sensors are installed on each return riser.
Energies 15 00367 g004
Figure 5. Pictures of the prototype thermostat and return temperature sensor and how they were installed on the supply (left) and on the side of the radiator (right) in the test buildings.
Energies 15 00367 g005
Figure 6. Monthly average district heating temperature difference during the past five years in Building A including timeline for adjustments.
Energies 15 00367 g006
Figure 7. Space heating supply and return temperatures vs. outdoor temperature during the prototype test and during the reference period afterward.
Energies 15 00367 g007
Figure 8. Comparison of the measured hourly average flow rates in the space heating system during the test and in the reference period afterward.
Energies 15 00367 g008
Figure 9. Supply and return temperatures in the space heating system during the test of prototype version 1.
Energies 15 00367 g009
Figure 10. Supply and return temperatures in the space heating system of the test staircase and from the main district heating meter during a period where string balancing valves are opened up.
Energies 15 00367 g010
Figure 11. Monthly average cooling of district heating temperatures during the past five years in Building B, including timeline for adjustments.
Energies 15 00367 g011
Figure 12. Hourly measurements of supply and return temperatures in the space heating system during the test of prototype 1 in February 2020.
Energies 15 00367 g012
Figure 13. Daily average measurements of supply and return temperatures in the space heating system during the test of prototype 1 in April 2020, where the supply temperature was reduced.
Energies 15 00367 g013
Figure 14. Hourly measurements of supply and return temperatures in the space heating system during the test of prototype 2.
Energies 15 00367 g014
Figure 15. Return temperature measurements from all risers in Building B, 14/11/2020–19/11/2020.
Energies 15 00367 g015
Figure 16. Return temperature measurements from the radiators connected to risers 1 and 10.
Energies 15 00367 g016
Publisher’s Note: MDPI stays neutral with regard to jurisdictional claims in published maps and institutional affiliations.

