1. Introduction
The problem of multivalued dynamic series (in particular, interval data analysis) is the most important problem facing the modern e-business industry and technological development [
1,
2]. An industry company can and should take its rightful place if it has a high potential in terms of internal factors, external conditions and financial leverage [
2,
3,
4,
5,
6,
7]. Due to the recent avalanche-like growth [
8] of the volume of information, both internal and external, well-known data processing methods, such as methods of adaptive time series forecasting, one-dimensional and multidimensional GARCH models, copula models, methods of wavelet analysis, neural networks, and many others [
9,
10,
11,
12,
13], are no longer applicable. Moreover, with an increase in the volume of heterogeneous and unstable information, these methods can produce significant and uncritical results, while the use of filtering and smoothing of data leads to a decrease in the quality of the obtained model due to the loss of significant information about the analyzed process [
14], so it cannot be used as the basis of the toolkit [
15,
16,
17]. The problems of modeling a time series using various methods were studied by many authors, including, D.A. Dickey, W.A. Fuller [
18]), C.A. Sims et al. [
19], and Schumaker L.L. [
20]. However, the question of mathematical modeling of the multivalued dynamic series regardless of the distribution law, with additional restrictions, has received little attention from researchers. In this paper, multivalued dynamic series is the term used to define a sequence ordered in time ranges of the numerical values of a given object. Current research does not consider the criterion of uniform approximation for use in multivalued mappings using the Hausdorff distance [
21], including the restrictions on the approximating function. One of the effective methods for the analysis of unambiguous time series of different natures is the criterion of uniform approximation described by Chebyshev [
22]. However, when considering the ranks of the specified ranges, there is a problem with the rationale behind the selection of the point inside the range, which makes it possible to achieve the most adequate model approximation. It is especially difficult [
23] to resolve this issue if there is no information about the law distribution of the financial indexes within the range.
Reducing approximation errors makes it possible to produce a forecast using standard technical analysis indicators (MA, ROC, MACD, ETC.). However, the use of technical analysis indicators does not solve the problem of creating a noise-resistant decision-making model, with justification based on mathematical trend optimization. The trend in technical analysis is perceived so narrowly that it can be the result of an intuitive decision or the successful selection of a graphical scale, designed in terms of an interval or line chart. The high level of competition in the energy and oil and gas industries requires a model that allows the investor to apply a buy signal-oriented approach when they wish to buy new shares in the company of interest.
As an assumption, it is necessary to take into account the regular receipt of dividends and the desire to invest more money in the company in order to increase the well-being and the success of the company. This approach is not a form of technical analysis; on the contrary, it is part of fundamental analytics in terms of applying technical analysis signals to replenish the portfolio with new shares in the company of interest at a good price.
Of course, the sale is also possible if the investor needs money. Such decisions are rare; the main goal is confidence in stability. Stability can be achieved by a competent approximation, according to the key data identified in the complex analysis based on the Minimax criterion and the Hausdorff metric. This approach is fundamentally new and has not previously been considered in research. The fundamental basis of Minimax and algorithmization is laid down in [
24,
25,
26]. Econometric analyses of robust (noise-resistant) estimates based on standard methods are presented in the works of many authors [
27], but the criterion of noise filtering refers to the OLS zone or fuzzy logic; in this paper, we offer a reliable and balanced method and guarantee its high stability compared to standard methods, confirmed by practice. The new method can be safely applied in practice; there is not a single limitation, except for the presence of an algorithmic database and qualified programmers-analysts who are able to perform the data processing according to the author’s methodology.
In [
28], the emphasis is on econometric forecasts, taking into account the apparatus that existed earlier. The authors propose a fundamentally new apparatus that makes it possible to take into account non-stationary influences and noises (several of the most important), based on sound mathematical tools. The advantage of this approach is the ability to do without other tools; that is, integrity and self-sufficiency increase the accuracy of problem-solving. There are no contradictions with standard approaches; however, standard approaches do not always work, and our goal is to expand the fundamental base of analysis and evaluation and make a reasonable decision on forecasting.
In earlier works, we considered methods for modeling interval data and spline approximation models based on the Hausdorff distance and the Minimax criterion. We proposed a mathematical justification for a new method for modeling the estimated characteristics of time series using the Minimax criterion for a linear multiple regression model. The approach of modeling dynamic series of interval data in the Hausdorff metric is applied, differences are revealed in comparison with other works where distances between graphs are considered, and a uniform metric is adopted when the deviation of the segment (interval) from the value of the polynomial is taken point-by-point, after which the maximum of these values is calculated, which should be minimized by choosing the coefficients of the polynomial. The approach featured alternative properties, which include a far-reaching continuation of the properties of the Chebyshev model, by selecting a number of nodes that carry all the key information about the process, the number of which does not exceed the power of the polynomial by two. The fundamental difference was the construction of the so-called amplitude functions proposed by the author and the complete solution of the problem, even if it is ambiguous. This model already makes it possible to select the joining points of the splines. Further, the constraints made it possible not only to improve the model mathematically, but also to proceed to the approximation by combined splines with exact moments of joining. However, in this earlier paper, the restrictions on the joining of splines were precise, in contrast to the current study, in which the restrictions were reduced to ranges, thereby increasing the accuracy of the model. In addition, in contrast to previous studies, we propose a hierarchical procedure for finding the points of joining of splines. Each subsequent spline receives an improved mode of joining, which makes it possible to build a high-precision model suitable for identifying graphic shapes and forecasting. The novelty of this study lies in the use of the Hausdorff distance in the model, the improvement of the approximation model due to splines with dynamic (interval) constraints, and the iterative procedure for selecting the points of joining of splines.
We propose not only a method, but also a computerized system of the computational process and an algorithm for implementing the approach.
The statistical apparatus of interval data is developed in [
29,
30]. The proposed apparatus of mathematical statistics of interval data allowed us to create a mathematical basis for processing dynamic series of interval data. However, the methods of analysis, approximation, estimation, and forecasting contain a set of data regularization techniques, fuzzy logic principles, and probabilistic approaches that make it possible to obtain a solution to a particular problem by taking into account the interval setting of the parameters. The task becomes more complex, data processing slows down, and decision-making cannot contain clear recommendations. However, the solution to these problems is obtained in terms of the theory of fuzzy sets; it retains a high degree of uncertainty, and its reliability depends on the values of the argument. As an approximation criterion, we use a modified Minimax, which requires the introduction of weight coefficients for different points, the evaluation of which introduces an additional error into the resulting solution. When working with noisy data obtained as a result of superimposing a signal over different time periods, the problem of choosing an approximation criterion that is resistant to the type of noise arises. Traditionally, data are transformed to filter or smooth out noise effects, because it is believed that they create the maximum volatility. However, it is possible to lose useful information about the process, since the law governing the distribution of the indicator within different noise intervals may not be known or defined, which prevents the use of mixed probabilistic models. In such cases, it is advisable to use methods that are more resistant to the influence of local noise approximation methods. One of these is the Minimax criterion. When approximating a dynamic series of interval data, it is advisable to minimize the maximum distance from the approximating function to the far end of the range (that is, the maximum of the Hausdorff distances between the values of the function and the fixed ranges of the indicator).
The purpose of this article is to develop a methodology and tools for decision-making based on the use Minimax approximation multivalued [
31,
32] dynamic series of financial indexes in the Hausdorff metric.
The object of the study is the interval data obtained from the results of trading Novatec shares.
The subject of the research is instrumental tools in financial markets and mathematical programming of decisions, based on the Hausdorff metric.
The research hypothesis is as follows. The high level of uncertainty in stock market dynamics can be overcome by using the Hausdorff metric and Minimax approximation principle; the economic effect will be an increase in the investor’s profit [
33]. This model can be used for forecasting in isolation or in conjunction with other known methods of processing dynamic series.
Many works are devoted to the construction of financial and practical models in the field of financial management of large companies that create the oil and gas base of a given country. Such companies as PJSC Gazprom, PJSC Rosneft, PJSC Lukoil, PJSC Surgutneftegaz, and PJSC Novatek provide an opportunity to analyze the current level of the created energy structure and to understand the optimal form of managerial influence on the process in order to improve the development of promising companies. Many modern scientists are engaged in research in the field of financial monitoring and energy policy. Thus, in the work by Sun et al. (2021), an effective predictive model of risk factors associated with volatility was developed based on the statistical apparatus and modeling of an expert system based on neural network technology. However, the stability parameters of this model depend on the mode of forecasting oil price fluctuations caused by changes in both fundamental and transient risk factors. Achieving the disintegration of the multi-scale risk structure of the crude oil market using the decomposition of the variation mode is a very difficult task, even taking into account modern computerized systems; the solution must be repeatedly tested, and the statistical parameters may change, which is a separate problem. Other modeling approaches that serve as high-stability filters, such as the Minimax model, are needed. The Hausdorff metric makes it possible to take into account the noise-tolerant filter mode for constructing a multi-mode spline model in the interval data mode.
Aguirre and Ibikunle (2014) examined the factors influencing the growth of renewable energy sources at the level of raw material supplier countries, applying a sample analysis and evaluation of the backbone companies of the partner companies in the raw material structural complexes, including Brazil, Russia, India, China and South Africa. We use methods based on the far-reaching generalization and development of the least squares method (OLS) and its modifications, in terms of improving the FEVD model to PCSE, for sampling data on long and short ranges. However, these methods are not without the disadvantages inherent in all statistical estimates: strong dependence on changes in data, the complexity of diagnosing the key moments of trend changes to obtain a spline approximation, and low resistance to the interference associated with random errors and external factors. The use of interval data in the implementation of this model is not possible, which shows the feasibility of our approach.
A fundamentally new approach based on robust (noise-resistant) risk assessments is considered in [
34]. Related models are based on the principles of Minimax optmimization over a non-smooth convex functional. These include, for example, a model based on the Chebyshev problem, a far-reaching generalization to interval data, which is our novel approach to the research problem of estimating, approximating, and modeling interval data, taking into account the constraints for both single-valued and multi-valued data. However, the problems associated with the complexity of modeling interval data in the spline approximation of stock market dynamics for an oil and gas company are not considered in this paper.
The authors of [
35,
36,
37,
38] diagnose the fact that in the Russian energy and gas complex, many system-forming companies and raw materials structures are unable to raise capital for the development of high technologies, and therefore are required to sell raw materials at the minimum market price. The pricing policy is also not significantly aimed at the development of high-tech exports, due to the fragmented valuation base. The authors touch upon the problems of the policy in the field of the energy complex, aimed at decentralization, efficiency, and economy. As for the oil industry, such problems are particularly acute. We need mathematical models that implement the solution to the problem in the optimization mode.
In the works of the mathematicians, Subbotin et al., the spline approximation is based on achieving an optimal function over the entire analytical segment [
39,
40,
41]. Unlike similar works, the authors focus on econometric forecasts, taking into account their own Minimax methodology, which are localized and improved (due to limitations) when new data appear; it is the improvement of fragmentary dynamics, and not revision, that makes it possible to make optimal decisions. Our approach does not contradict the known methods; it is an independent theoretical and reliable method, worthy of existence on a par with other methods of approximation of dynamic processes. Practice shows that at present, our methodology works better than standard methods based on MNCs, approximation by trigonometric polynomials, wavelets, and fuzzy logic methods.
We indicate the need to introduce mathematical models, such as the wavelet analysis of dynamic series [
42]. This method is advisable to use when evaluating dynamic series. The disadvantage is the high complexity of the model problem and the need to use unique software. The Minimax approach, like the wavelet analysis, allows us to evaluate problem situations and key points (“bursts” of changes), but it features a noise-resistant zone, the possibility of using interval data, the introduction of limiting conditions, and high-level algorithms with a highly efficient block of software calculations, which we mathematically justify.
2. Mathematical Model of Minimax
Designations: tk—the number of the period when stock prices were fixed (trading days), from the minimum y1,k up to the maximum y2,k. We have the multivalued dynamic series of financials (Hall and Lemer, 2010), market index (for example, price of share). For every point, , we introduce into consideration the set of points (grid): . The following stock price values are recorded in each node of the grid T: is the top and the bottom bound of price, so the range (all boundaries included) is , so , k = 0,…,N.
A mathematical model of multivalued time series (interval time series) is represented as algebraic polynomial of n degree with coefficients as components of vector A (unknown variables in the problem):
Therefore, we need to determine [
35] the coefficients of the polynomial
Consider at each point (node) of the discrete grid T the Hausdorff distance between the price range and the value of the polynomial (the coefficients of which should be calculated). Given that the value of the polynomial is a single point, this distance can be written as:
In our approach, the polynomial coefficients are found based on the problem of minimizing the maximum of the Hausdorff distance for a given discrete time series [
43].
Next, we select the maximum of such distances and obtain the objective function
, which should be minimized:
In expression (1), the minimum is the objective function containing the maximum of their components, each of which expresses the maximum deviation of the value of the approximating function from the upper bound of the approximated range, and is the main criterion (Minimax).
Note that prior research did not consider the application of the criterion of uniform approximation for multivalued mappings using the Hausdorff distance.
In [
44], solving the problem without constraints does not satisfy the required constraints; that is, the constraints are significant.
Problem (1) belongs to the field of non-smooth convex analysis, but the solution is achieved using our approach, which is a far-reaching generalization of the problem of approximating a single-valued discrete function by an algebraic polynomial of fixed degree.
The purpose of the further analysis was to develop a method of approximation for ranges that would be more successful than the one obtained using the method of least squares.
To this end, as the approximation criterion we use the distance (metric) Hausdorff. Hausdorff distance for some discrete values equals the maximum of the difference between the highest value of the index and the value of the algebraic polynomial, and the difference between the value of algebraic polynomial and the lowest value of the index .
The use of the least squares method does not always lead to success, since the indicator prediction is aimed at the latest data, which is used to verify the significance of the process. However, the data could be fundamentally larger and the level of significance and the forecast change after each new event, which we perceive as a projection of the data sample on the real picture of the dynamic series. The subsequent errors are high, and the key points of changing dynamics have to be found among the nodes of the revision of the trend indicators of the technical analysis.
We conducted a series of experiments aimed at developing the Minimax approach (the Nausdorff metric) and improving it for predicting dynamic series of interval data with limiting conditions and modified data ranges, aimed at the accurate joining of splines.
It should be noted that the Minimax method for interval data and “range” type constraints was tested in practice (ten solid companies were identified, in terms of financial condition, with market indicators worthy of investors’ attention (the opportunity to buy shares in an open sale)).
Currency markets, due to the restrictions adopted in 2020, were not considered in this study.
Thus, important companies were filtered out and experiments were performed. The highest level of success was demonstrated by the company PJSC Novatek, which showed a growth in the indicators used in the fundamental analysis (rating, financial integral index, return on equity). At the same time, the ratio of borrowed sources of financing of PJSC Novatek to its own sources of financing, as an indicator of risk, was lower than that of the leading companies of competing industries (PJSC Gazprom is certainly better in all the indicators; however, this is not a struggle for a place in the oil and gas industry, on the contrary, orientation towards the market leader makes it possible to create a healthy position in the industry for each company and turn competitors into friendly developing parties to the overall process of knowledge-intensive technological development for leading Russian industries).
3. Methodology
3.1. Constraints of Type Equality
In order to obtain a significant approximation and identify key points, the general trend, and significant trend breaks, as well as to obtain a long-term forecast, we propose to use a combined methodology based on the search for key events for the moments of coupling of the saplines and the choice of the optimal mode of coupling within the range of constraints, assuming the dynamic inclusion of the coupling moment from the bottom to the upper limit of the range of constraints. We substantiate the essential role of the bounds that allow us to find the n solution in a finite number of iterations of the method. The internal points of the docking ranges do not significantly affect the solution of the problem, as in the “interrupted range” alternance. We introduced the term to interpret the phenomenon of alternation in the maximum deviation from the lower (upper) boundaries of the initial dynamic series, taking into account changes in each subsequent node; the interruption of the alternation is caused by a constraint and depends on the nature of the deviation in the last node.
The introduction of modifications related to additional constraints requires the introduction of a new algorithmic solution to problem (1).
Such a solution to the problem of approximation modeling of a nonstationary noisy process is obtained in the work of [
45]. This article proposes a methodology for predicting the stabilization level of a chaotically developing system based on Minimax estimates of the model quality and our indicators of the instantaneous elasticity of the process, which allow us to judge the dynamics of the global trend.
The system of formation of spline forecasting on the last segment of the analysis using the Minimax approach is developed, the joining of splines for conditional approximation occurs according to a mathematically based algorithm.
Such a solution to the problem of approximation modeling of a nonstationary noisy process is obtained in the work of [
46]. The resulting solution is tested for evaluating the parameters of economic functions, for making informed decisions in the field of financial management, and for approximating non-standard, noisy and stepwise developing dynamic processes (demography, financial markets, medicine, mechanics, communications and telecommunications.
In [
46], we propose a methodology for predicting the stabilization level of a chaotically developing system based on Minimax estimates of the model quality and the author’s indicators of the instantaneous elasticity of the process, which allow us to judge the dynamics of the global trend.
In [
47], analytical experiments were performed for the company PJSC ROSSETI. The “Rosseti” experiments provided real data; the aim of investigation was the development of a system for the formation of spline forecasting in the last segment of the analysis using the Minimax approach. The joining of splines for conditional approximation occurs according to a mathematically based algorithm.
The proposed methods are based on splines (n-polynomial, n-1,2 at maximum, at combination) in the Minimax approach to optimal prognozation. We attempted to prove these theoretical propositions, so we created numerical methods of data analysis and approximation of data through complex decisions, but with several splines, which we developed the basis of Minimax approach and its application. The suggested method makes it possible to detect trends in the stock market at an early stage of analysis and to create reasonable trading strategies for shareholders and investors, as well as a procedure for predicting the stability loss and transition into chaos of a network of oscillators lying on a curve, where each of the oscillators can move in two perpendicular directions. The dynamics of the coupled oscillators are governed by the sixth-order PDE, which is directly derived using the classical hypotheses of a curvilinear flexible beam movement theory [
48]. Was applied the FDM (Finite Difference Method) to reduce PDEs into ODEs, and reach an optimal number of calculation studies and algorithm steps, as well as to obtain spatial coordination of a number oscillators that were involved in the approximating methodology due to the dynamics of our continuous structural member, as important key positions, with the overall aim of achieving stability.
The new methodology and procedure offer many advantages over the classical approaches, and make it possible to approach the connection of splices using complex algorithms and the Minimax approach, presiding in real time over key moments (connection points). The new methodology is illustrated and discussed through a fundamental analysis of the company PJSC Novatek.
Consider the criterion (1), for example, for the limits associated with the condition of a fixed location of a point in an algebraic polynomial at a grid node,
:
[
49]:
Give algorithm for the situation when
. In [
50] it is proven that this is the only decision. The solution to the problem (2) consists of two main stages: (1) the problem (1) is solved if the solution belongs to the set D, then the process is completed; the case when such a condition is not fulfilled is fundamentally interesting.
Let us introduce the notation. The basis is an ordered set of (
n + 2) points of the form
We consider the bases for which .
With the amplitude on the basis of
, we call the functions
defined by the formulas:
We formulate discrete Chebyshev problems for amplitude functions [
51]:
By the criterion of solving a discrete Chebyshev problem, the numbers for problems (3) are uniquely determined
and
, satisfying the equalities (for
or
):
Next, as follows from [
52], problem (2) features an unambiguous solution. A subtask of the problem (2) is considered on each basis. To find the coefficients of the approximating polynomial in problem (2) it is necessary to carry out the iterative solution of systems of linear equations (to avoid redundancy in characters, the argument
by
omit, use
and
):
or
The solution will be polynomial coefficients , for which turned out for i = 0 or i = 1.
From the original multivalued time series, (n + 2) selector corresponding to a discrete ascending points in time , is selected arbitrarily; the knot must necessarily be present among these nodes.
Were considered two variants of the choices from among the tops and bottoms of the ranges.
Each time alternates the upper, the lower bound of the range, as before, by considering the two choices of bound of the range directly left and right of the point constraints: the first option is taken from the upper bounds of the ranges, and, in the second embodiment, from the lower bounds of the ranges. The procedure for changing the basis is optimized [
53].
3.2. Splines by Range Constraints
Considering the criterion (1), the next constraints are used [
54], so we receive the following problem:
where
The polynomial at (4)–(5) in the all points must be included in the ranges .
From the original multivalued time series (n + 2) selector corresponding to a discrete ascending points in time , is selected arbitrarily; the knot all must necessarily be among these nodes necessarily.
The choice of the selector of a multivalued mapping from (n + 2) is similar to paragraph 2. When we consider the top bound of the constraint “from left and from right”, we use the top bounds of the ranges, but when considering the lower bound of constraint “from left and from right”, we use the lower ends of the ranges.
In [
55] it is proven that to obtain the coefficients of the approximating polynomial at (4)–(5), it is necessary to carry out the iterative solution of systems of linear equations. The iterative process is finite and leads to a decision that is proven through the optimal provided analysis of financial data.
4. Computational Experiments Splines, DSS (Decision Support System)
Spline approximation includes three stages (the decision support system, DSS, presented in
Figure 1):
Stage 1. Selection of spline joining points.
- 1.1
Finding points of change in the trend by using of model (1).
- 1.2
First approximation by model (2).
Stage 2. Improving the approximative properties of splines using range constraints.
- 2.1
Identification of ranges of changing graphical figures of technical analysis is justified [
56].
- 2.2
Improving the approximative properties of splines by using model (3).
Stage 3. Forecast by last period.
- 3.1
Finding signal to buy shares.
- 3.2
Justification of signal.
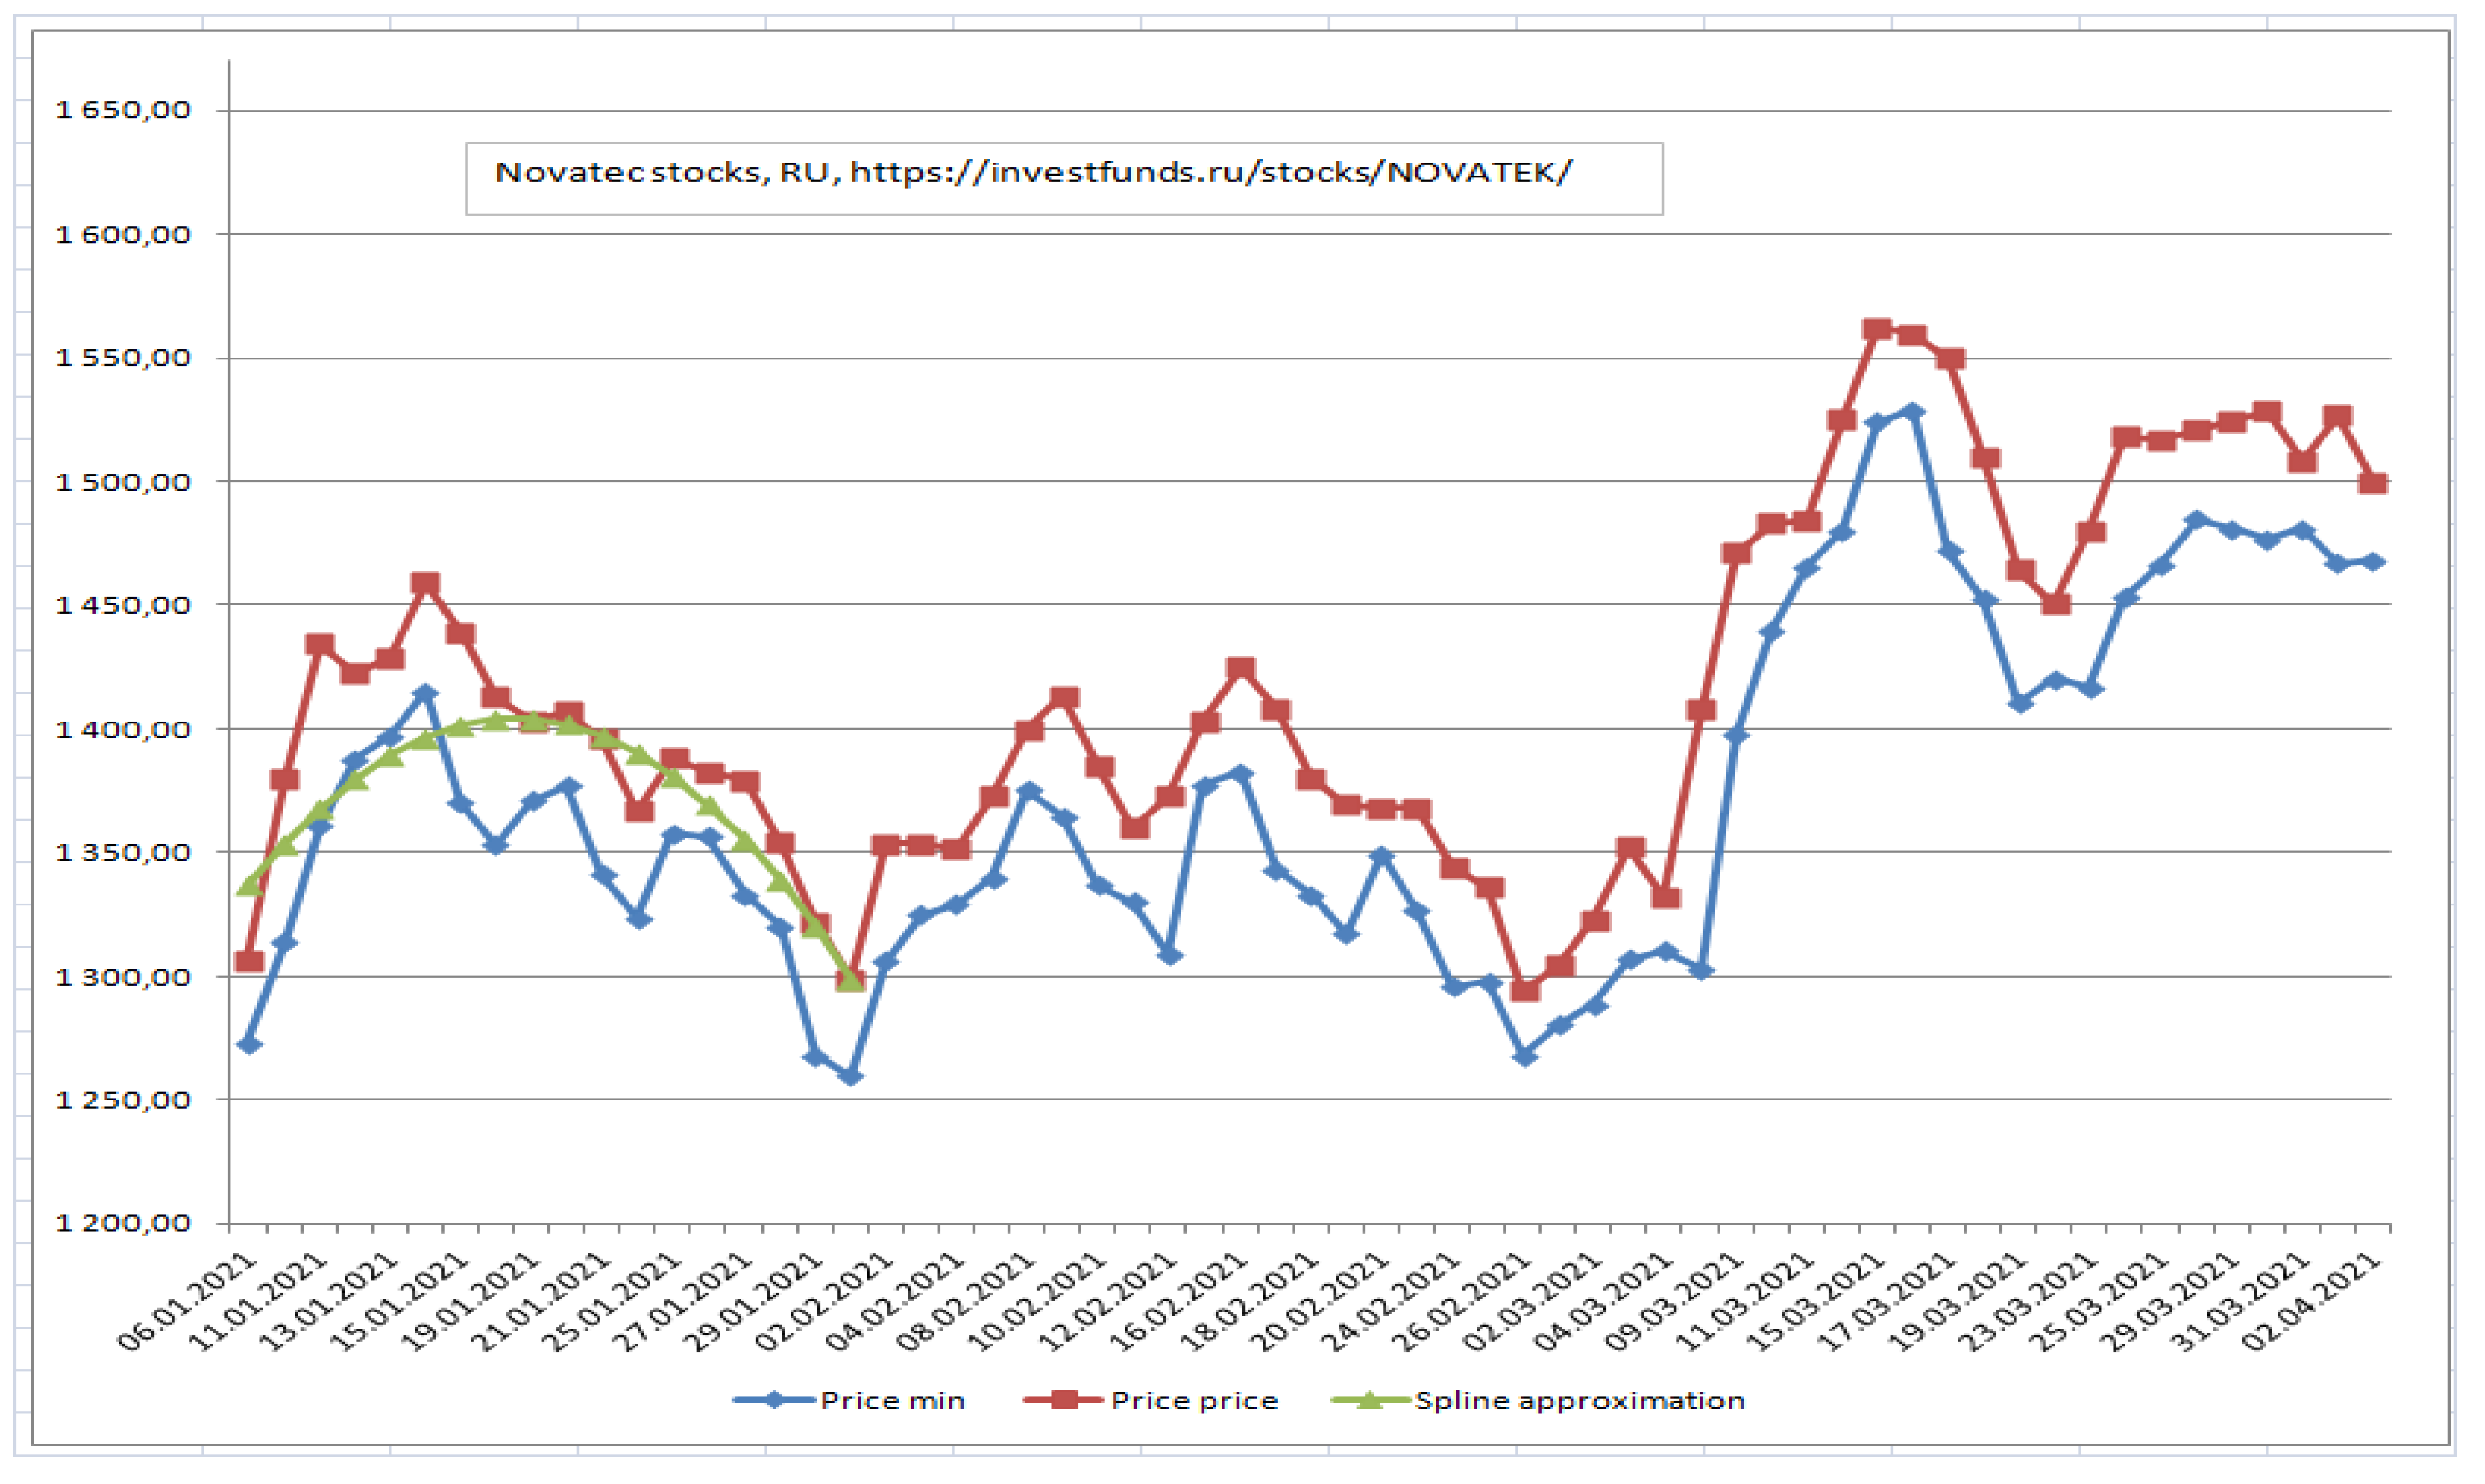
Consider PJSC Novatek’s stock trading history. The following prices are used: minimum and maximum for each day of trading as y1 and y2, respectively.
Stage 1. Selection of spline joining point,
Figure 2.
Explaining this procedure, it is necessary to note the presence of five important conditional operators that are in the mode of hierarchical data analysis. At each stage, a full assessment of the basic solutions is performed, key points are found, and general data processing is performed, taking into account the specific interpretation of the constraints. The specificity makes it possible to remove unnecessary noise influence already at the second stage of data processing. The undoubted advantage of the model is the determination of the key process parameters to which the forecasting model is tied, and its stability at each stage, since the calculations performed are workable and involve the development in the implementation mode of spline coupling with optimal limiting parameters that preserve the integrity of the model.
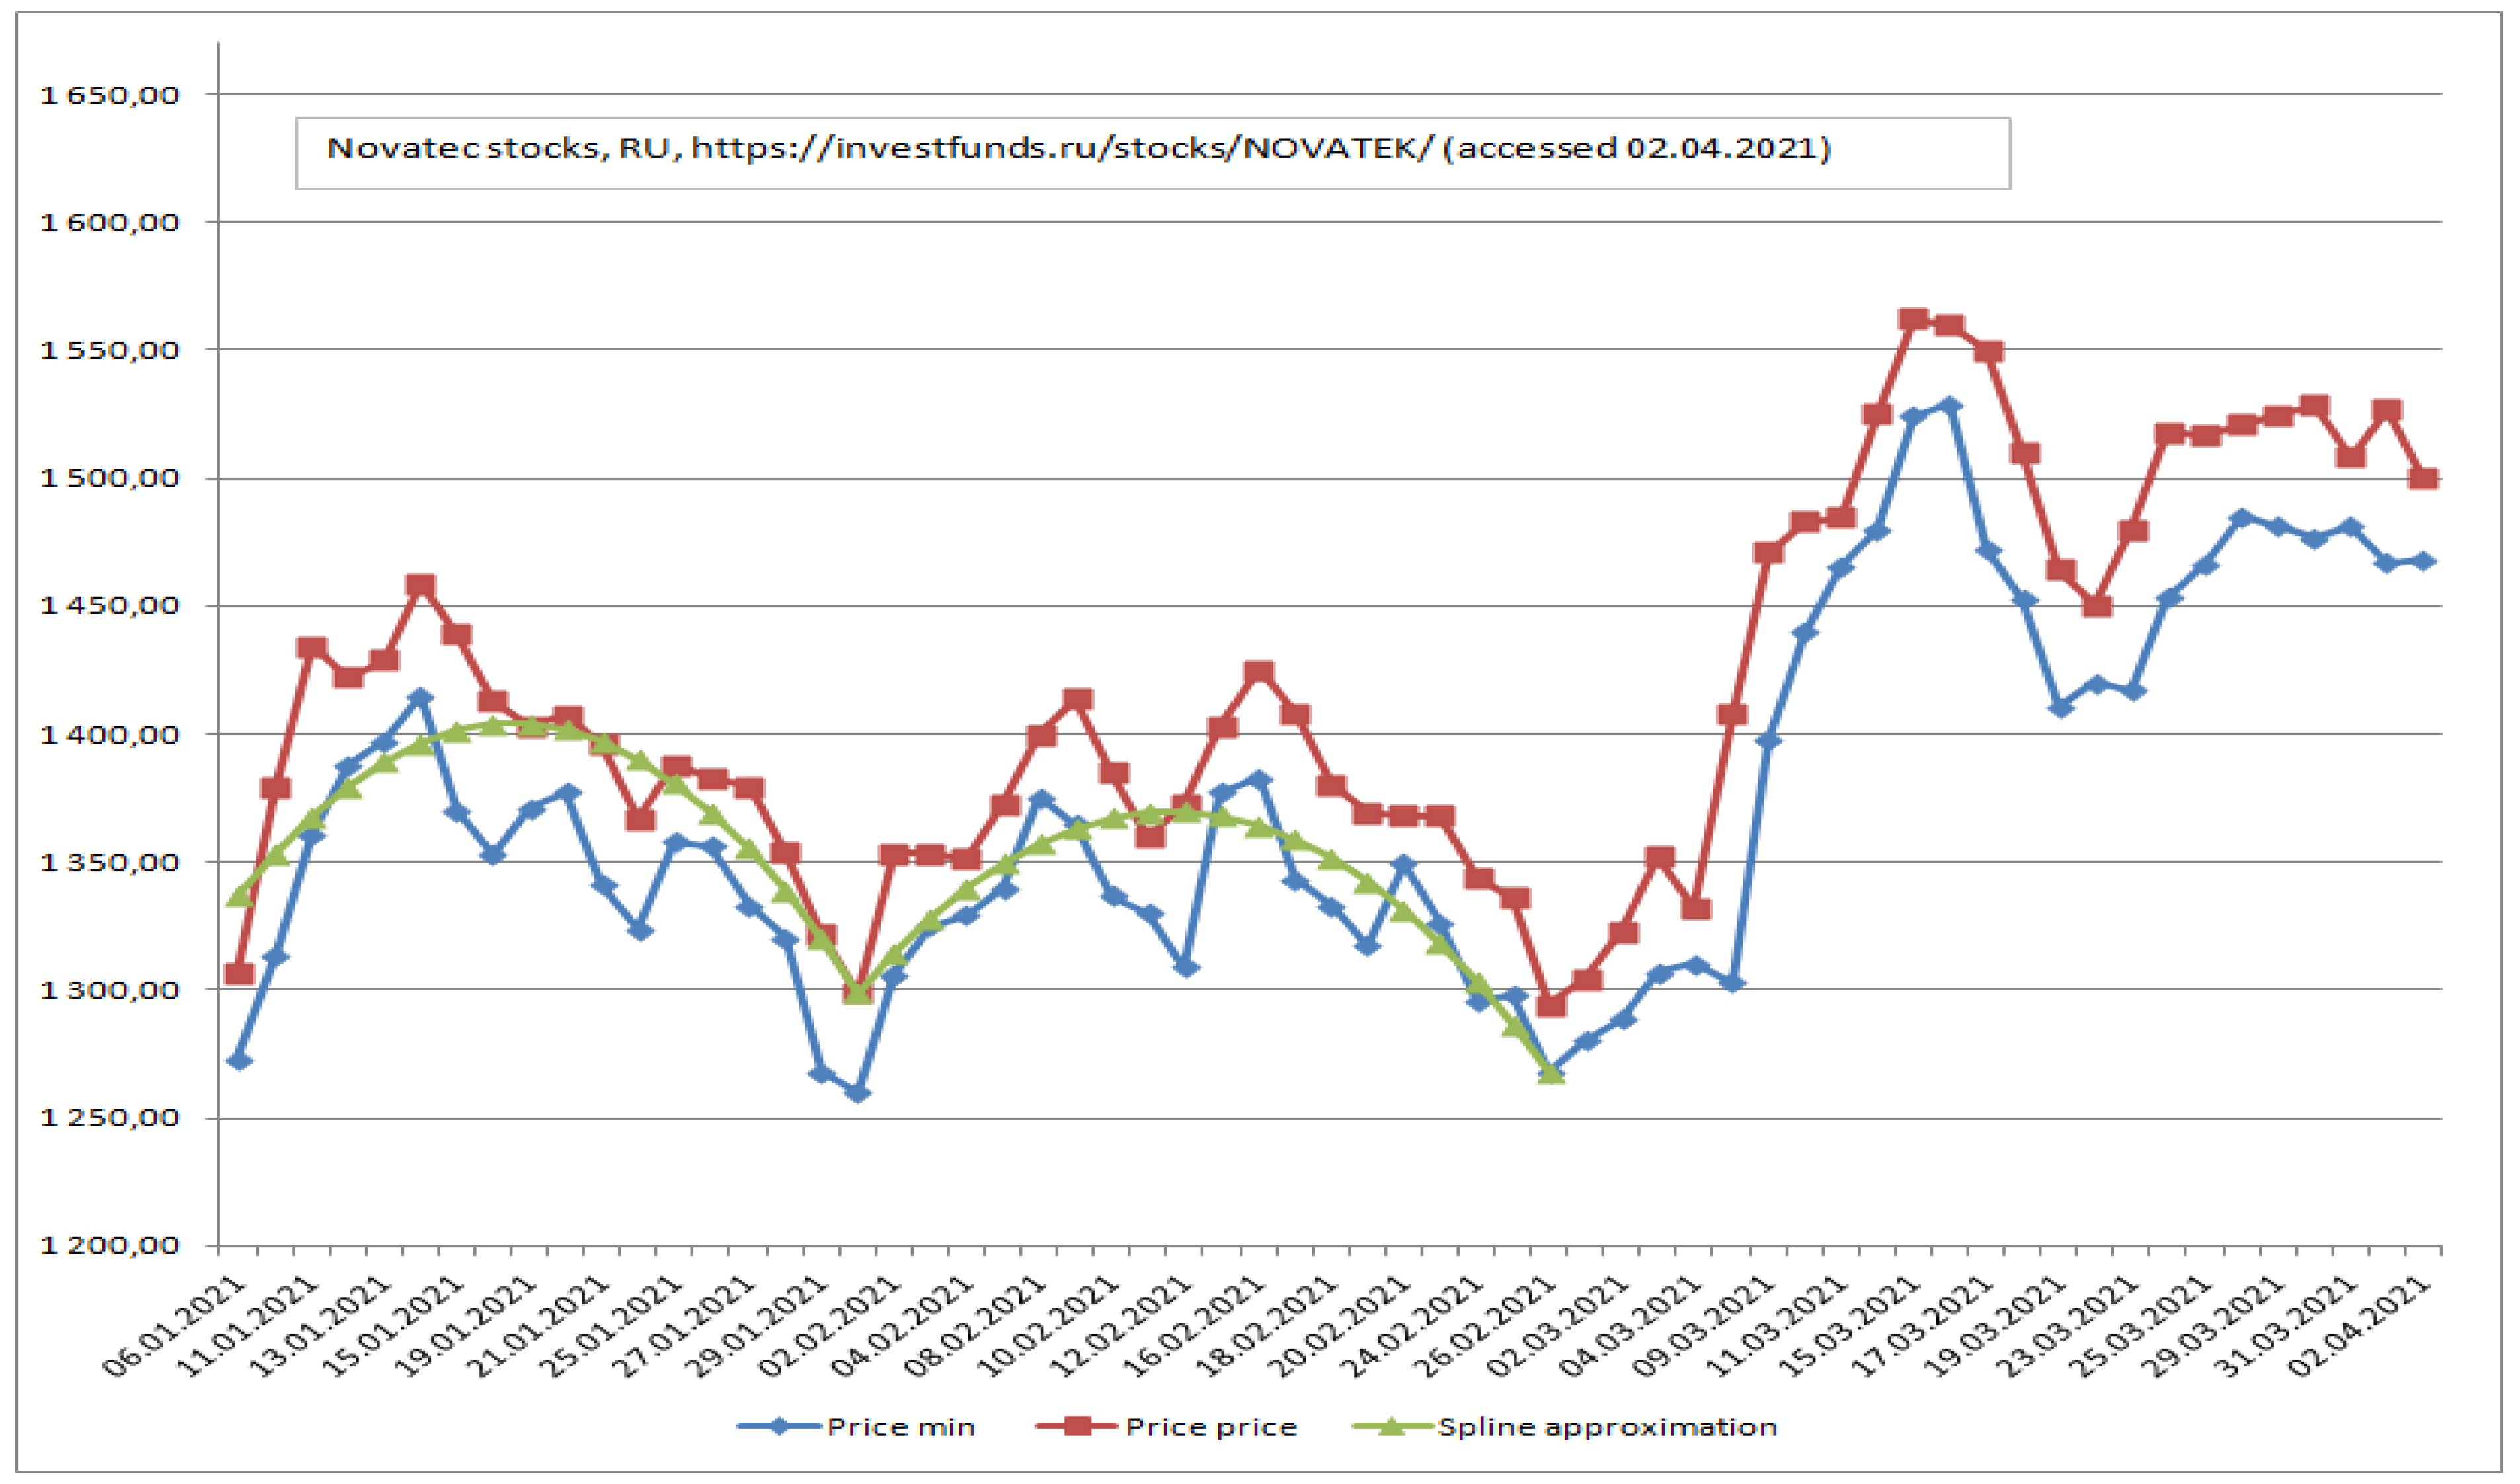
5. Results
Since the approximation of the ranges PJSC Novatek was the most effective, it was used in the subsequent computation experiments.
Stage 2. Improving the approximative properties of splines using range constraints,
Figure 3 and
Figure 4.
Stage 3. Forecast by last period, stage by stage, to finish.
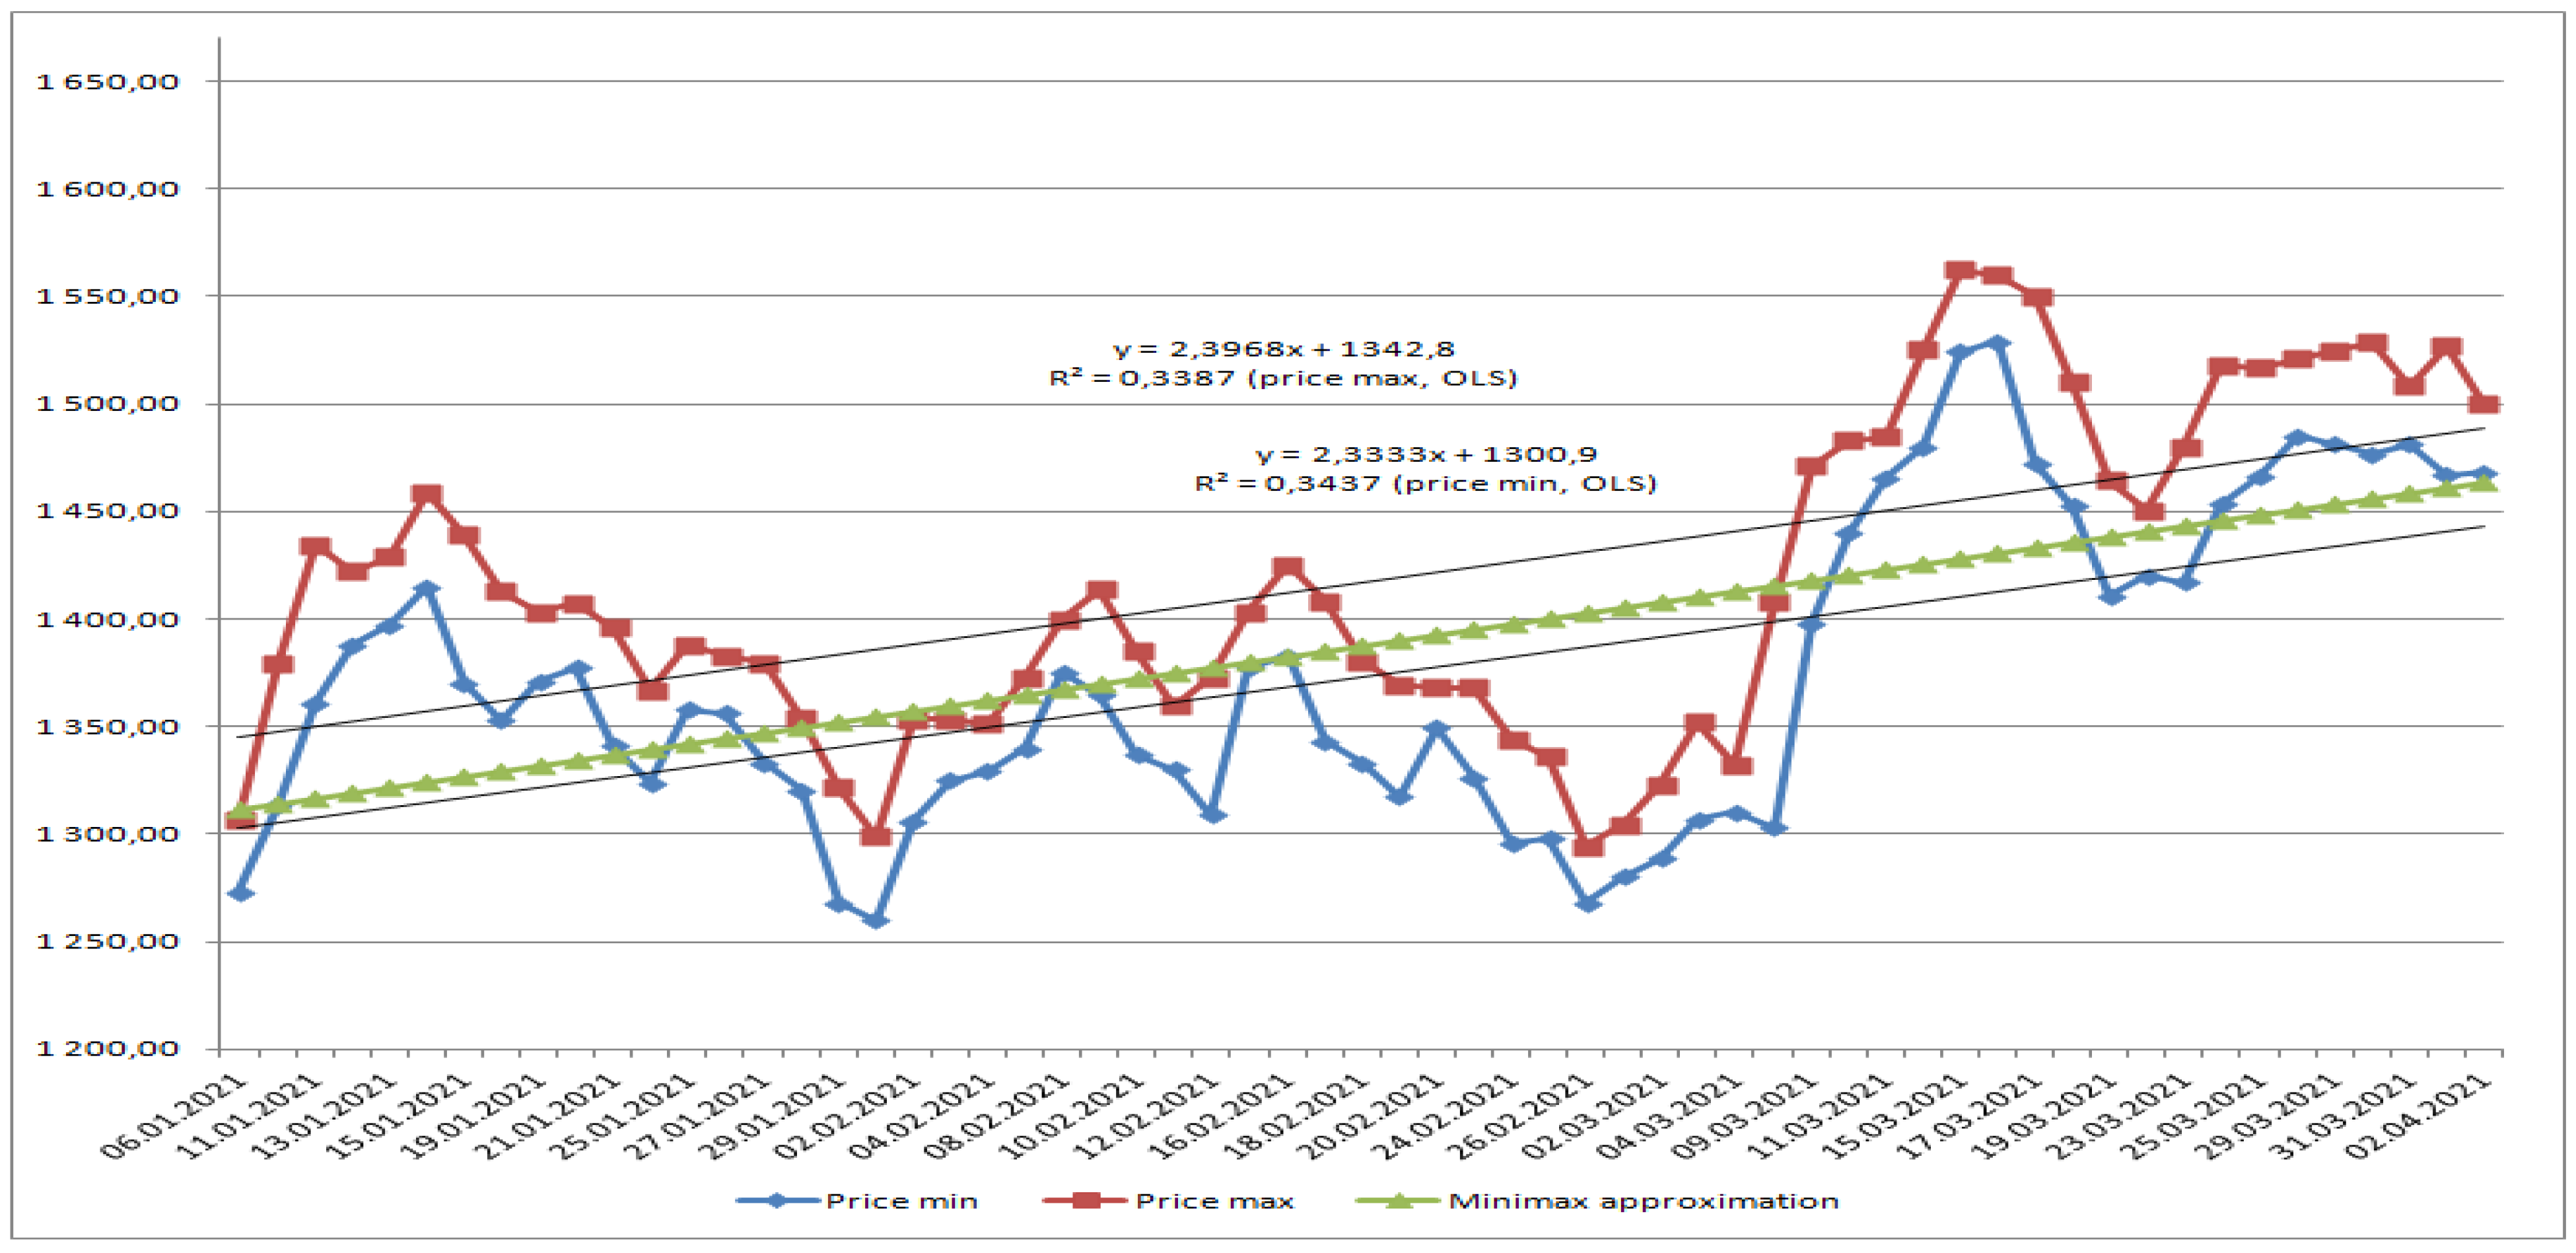
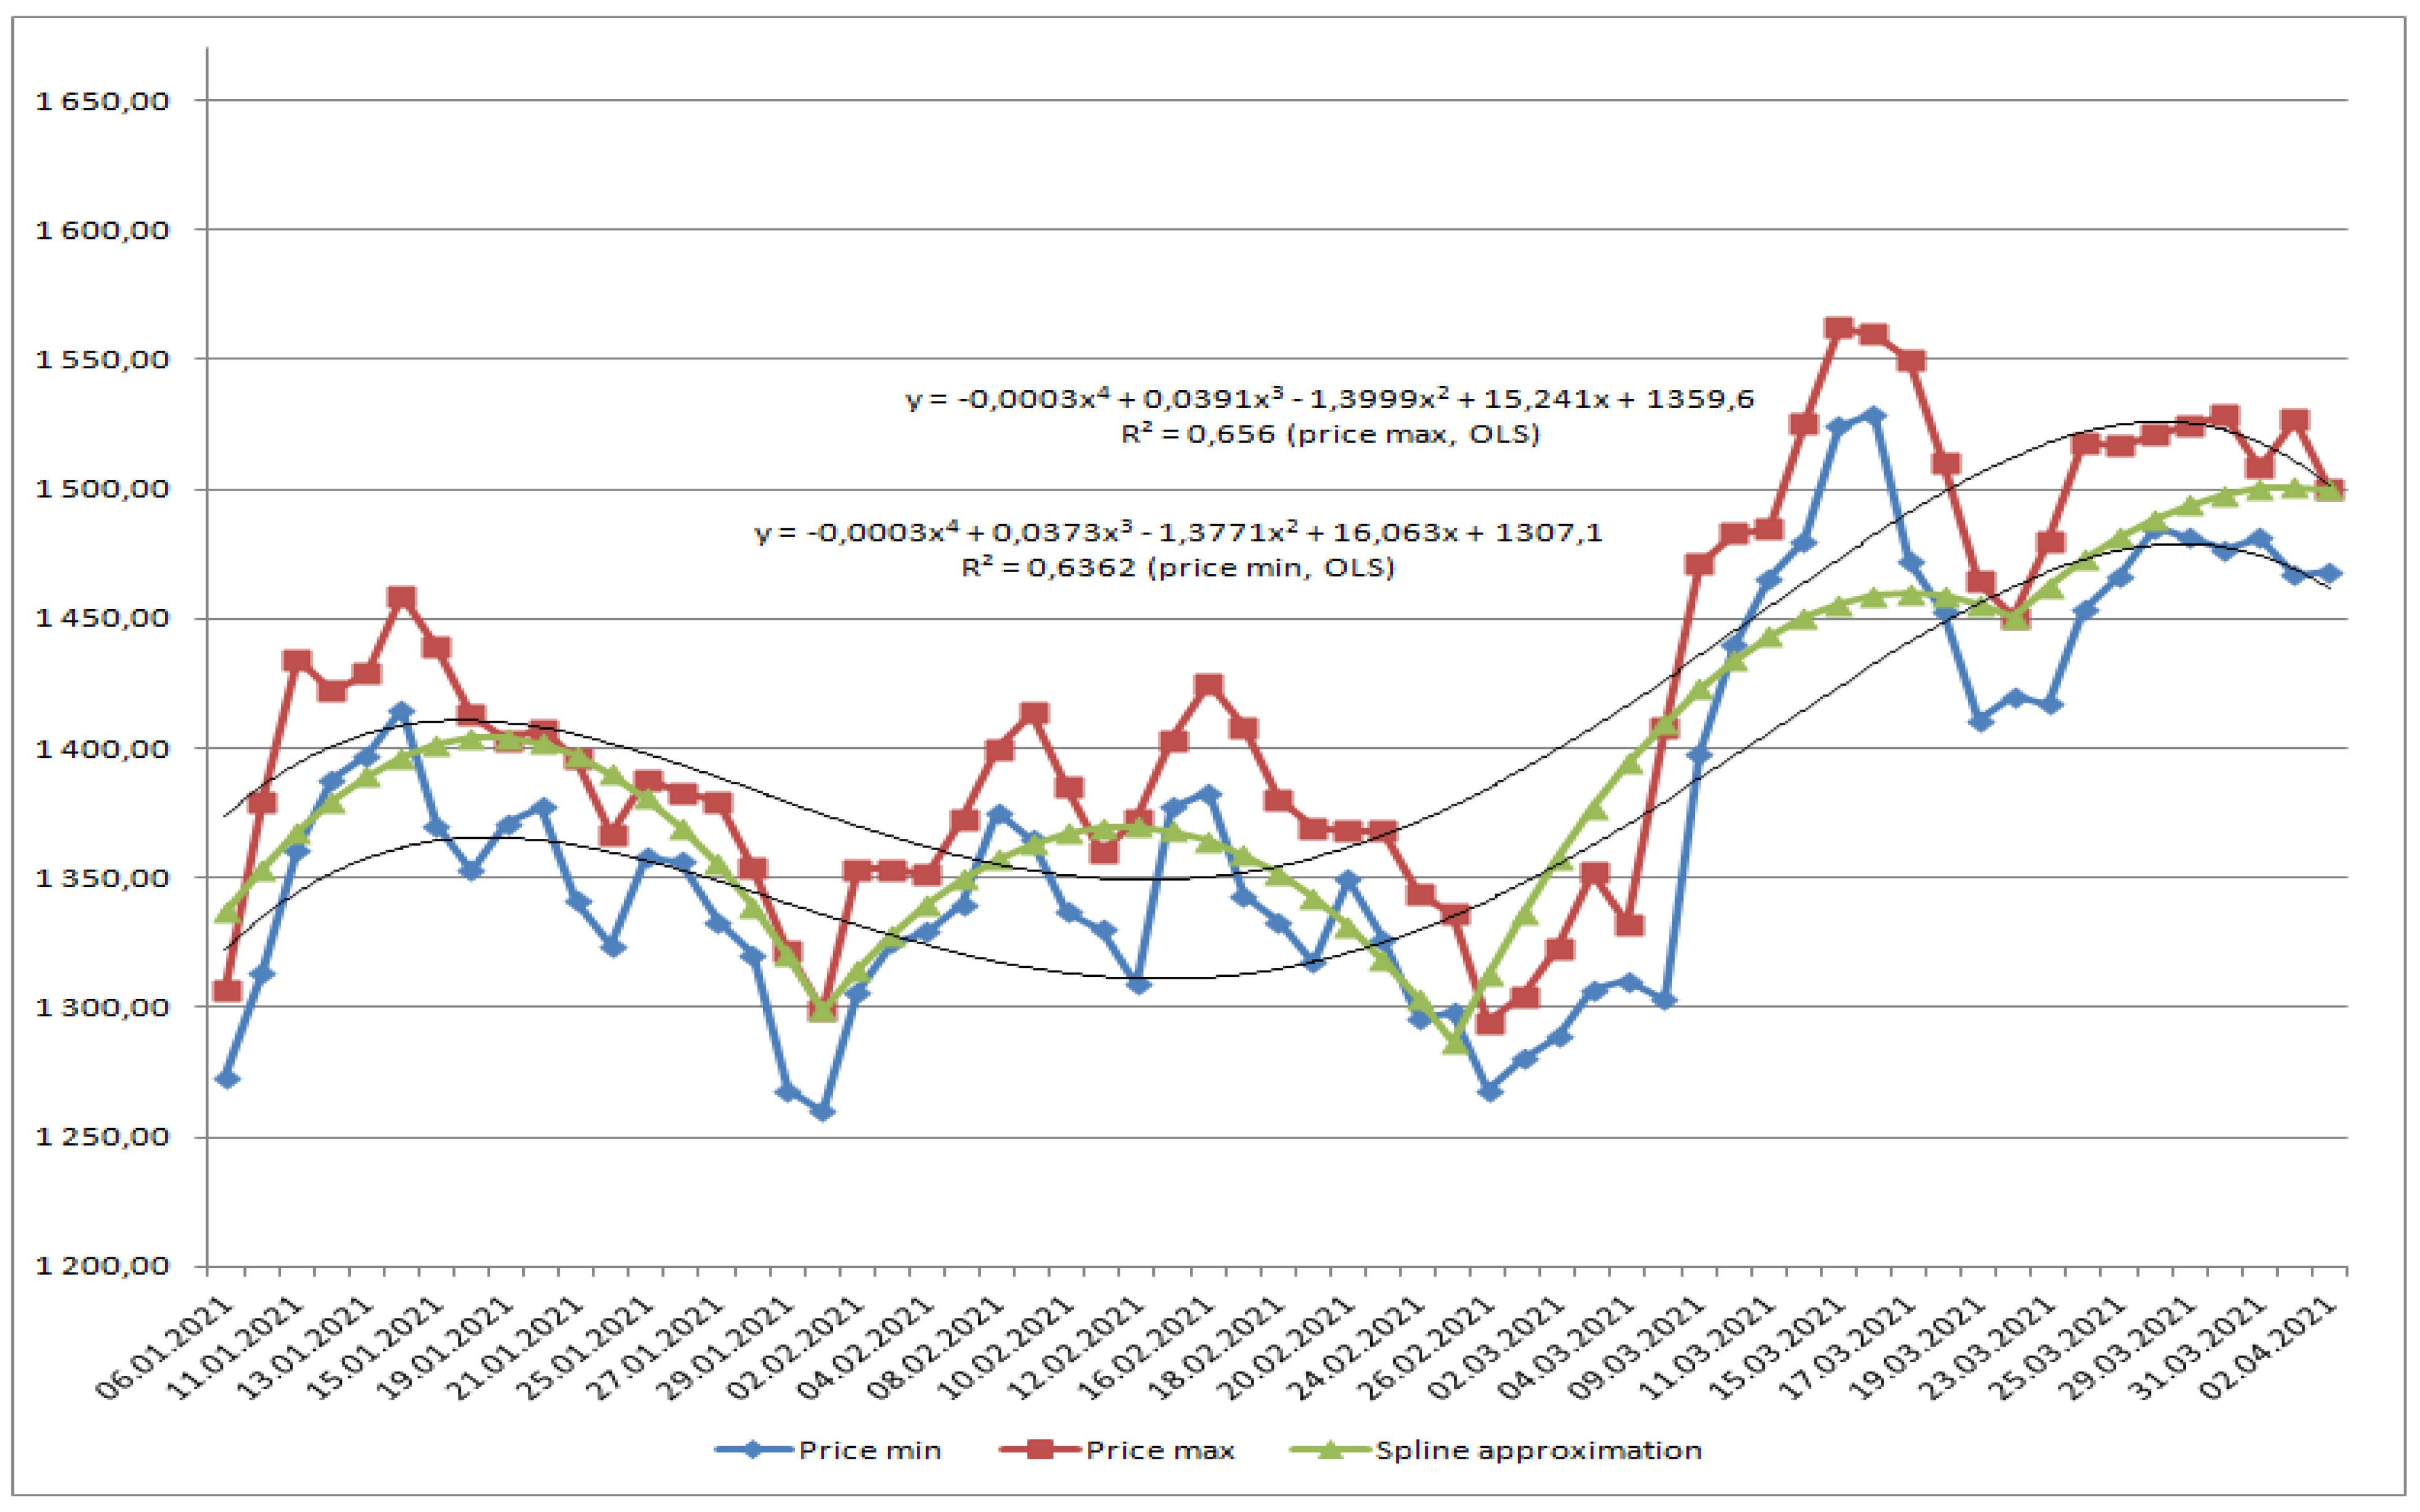
To justify the signal, until the end of the formation of the figure at the last stage, the investor should follow the current signals. Therefore, the investor should refrain from buying PJSC Novatek shares. If the round top is completed, the stock price will decline within 10 days, after which the investor should consider buying. If the stock price rises, investors should wait for the end of the formation of the “Head and Shoulders” figure, about a month or two; when they receive a stable signal, they should buy shares.
Furthermore, according to the last calculations, if Ordinary Least Squares, OLS, is applied with constraints, for time series, composed of the midpoints of the ranges, we obtain the following results. Assessments of the adequacy of the approximation models obtained using the three methods, for model illustration (PJSC Novatek), are presented in
Figure 5,
Figure 6 and
Figure 7 and
Table 1.
6. Discussion
Our approach to solving the problem of approximation in a dynamic series is fundamentally different in the form of an objective function, an independent solution to the problem, a new algorithm, which is a significant development of standard techniques.
In this article, we propose a fundamentally new apparatus that makes it possible to take into account non-stationary influences and noises (several of the most important), based on sound mathematical tools.
The advantage of the approach is the ability to work without other tools; that is, the integrity and self-sufficiency of solving the problem of data analysis and forecasting.
Note that there are no contradictions with standard approaches, but standard approaches do not always work, because the noise effect obscures data analysis and in some cases, the forecast is not possible due to high and rare outliers in the data. In this context of problems related to the energy sector of the economy, our strategic goal is to expand the fundamental base of analysis and evaluation to make an informed decision on forecasting.
Expert systems (tree-like, neural network, logical, rules-oriented “what-if” productions, etc.) rarely include the developed algorithm; usually the rules are executed on a heuristic basis and multiple approximations. Therefore, fundamental methods, especially in the field of financial analytics, where the value of a solution is lost by the minute, are not significantly developed in scientific practice. The energy market requires clear, reasonable, and quick decisions that do not need to be changed during a period of stability (at least a month, preferably six months). We developed exactly such a device, which is reflected in the presented examples in our methodology.
A number of experiments have shown a high continuity with our approach to the well-known methodology of econometric analysis and forecasting. Our approach is not an addition to these othr approaches; it makes it possible to solve the problem and describe the process without using standard approaches, completely independently. A significant advantage is the focus on reducing errors from significant deviations in the data and on the ability to exclude a number of events without losing the quality of the forecast. The only drawback compared to methods based on MNCs is the complexity of solving problems (we solved this problem), as well as the lack of requirements for the stability of the process as a basis (Gauss–Markov theorem), although such conditions are rarely observed. The analysis was performed, a dynamic picture of the process was constructed, and a high-quality approximation was obtained. The process can develop in fragments; the method is appropriate for a wide range of applications in practice.
It is advisable to implement the methodology in the field of energy policy and resource conservation, at all levels of Russian practice, from the center, across the leading regions of Russia. We reasonably believe (according to the experiments performed) that the economic effect of the introduction of the mathematical apparatus will increase yearly profits by at least 40%, on the basis of the rational distribution of investments, as well as the fact that the decision is made by a financial analyst (group leader). We do not consider it right to accord the final decision-making to a robotic system; we believe that a key figure in the management of a financial service at any level (state, region, bank, holding, or company), qualified and able to correctly interpret the recommendations of the program block, is the key to the prosperity of the energy economy of Russia.
7. Conclusions
(1) This article presented a dynamic energy system based on the Minimax criterion of optimality.
(2) We optimally designed a structure in accordance with energy and financial policy.
Our approach can be used as a fully fledged independent resource to assess and forecast the development of companies. As a result of the application of our methodology, a purposeful political strategy was developed, which should include certain risk assessment parameters, predictive models, and algorithmized structures based on program packages.
(3) We considered a model of approximation of price ranges by algebraic polynomial.
The model is based on the far-reaching generalization of the Minimax criterion of Chebyshev. We took into account the possibility of applying the approximation of data represented by ranges, as well as additional restrictions on the approximating function. We developed a methodology to solve optimization problems, allowing us to obtain high-quality approximations. The algorithm was developed for solving discrete problems of the best uniform approximation of multivalued mapping within specified ranges, as well as algebraic polynomial with constraints on the value of the approximating polynomial on the top and bottom in several nodes of the grid. Our computational experiments showed the high quality of the suggested method of approximation. We fulfilled a three-stage approximation with polynomial splines, connected within ranges for improving the model, for PJSC Novatek stocks.
Despite numerous works on the statistical study of interval data required by such approaches, the complexity of the model, useful in engineering and technology, has not been extended to economics, where it is necessary to accurately determine a reasonable and reliable path of action. Noise-resistant filters, tuned to the Chebyshev model and its far-reaching generalizations, created a high resonance in society. Questions arose as to why the method produces similar results to the standard Minimax, why the key points created a zone of noise immunity, and why there are no such tools in statistical analysis programs, but only robust estimates based on the type of rounding of data due to the enlargement of modified structures. The answers are very simple: Minimax is based on the procedure for analyzing data using the traditional optimization method (partial derivatives, the possibility of using convex analysis and constraints, ready-made formulas); and Minimax requires a non-smooth approximation, subdifferential calculus problems are set, the apparatus of non-strict analysis from the point of view of mathematics is fundamentally complex.
In this article we proposed methods of constraints on Minimax using hierarchal decision making. In contrast to the classical models, we use volatility as a parameter for solving the optimization problem and producing a forecast based on a multi-stage hierarchical evaluation of data and a theoretically based problem of non-smooth analysis, which allows us to achieve the research goal in an optimal way, by saving time on the procedures of multiple data processing and the revision of the solution. The stability of the solution for the average period of the analytical procedure is an undoubted advantage of the analytical core. The problem of complex analysis, evaluation, and modeling of decision-making in the oil and gas industry forces us to look for a solution in an optimal way, taking into account the highest-quality forecast.
The authors of the work created and tested a multi-stage decision-making system in the field of financial and political dynamic structures. The company under study (PJSC Novatek) received a very high status according to the estimates of world experts according to the following criteria: basis of production, image policy, prospect of financial development, and improvement of financial policy in the field of the Russian oil and gas complex.
We used Minimax and the Hausdorff metric as the focus of the policy decision on innovation in view of the successful prediction of the modeled data structure. This paper presents a comprehensive analysis of situational approaches. Thus, the state could, but does not always have time to place emphasis on financial policy for high-tech industries. The Minimax approach will save significant time for making important investment decisions.
To attract an investor aiming to develop the status and technology of a company, it is necessary to clearly indicate the graphical figure of the analysis background and provide high-level estimates of the trend dynamics with key positions, which is an optimal approximation of the process and serves as a basis for decision-making. This was performed in this article.


