Article

Quantifying Environmental and Economic Impacts of Highly Porous Activated Carbon from Lignocellulosic Biomass for High-Performance Supercapacitors

1
Division of Forestry and Natural Resources, West Virginia University, Morgantown, WV 26506, USA
2
Center for Sustainable Biomaterials and Bioenergy, West Virginia University, Morgantown, WV 26506, USA
3
Department of Chemical and Biomedical Engineering, West Virginia University, Morgantown, WV 26506, USA
4
Department of Mechanical and Aerospace Engineering, West Virginia University, Morgantown, WV 26506, USA
*
Author to whom correspondence should be addressed.
Energies 2022, 15(1), 351; https://doi.org/10.3390/en15010351
Submission received: 29 November 2021 / Revised: 24 December 2021 / Accepted: 30 December 2021 / Published: 4 January 2022

Abstract

:
Activated carbons (AC) from lignocellulosic biomass feedstocks are used in a broad range of applications, especially for electrochemical devices such as supercapacitor electrodes. Limited studies of environmental and economic impacts for AC supercapacitor production have been conducted. Thus, this paper evaluated the environmental and economic impacts of AC produced from lignocellulosic biomass for energy-storage purposes. The life cycle assessment (LCA) was employed to quantify the potential environmental impacts associated with AC production via the proposed processes including feedstock establishment, harvest, transport, storage, and in-plant production. A techno-economic model was constructed to analyze the economic feasibility of AC production, which included the processes in the proposed technology, as well as the required facility installation and management. A base case, together with two alternative scenarios of KOH-reuse and steam processes for carbon activation, were evaluated for both environmental and economic impacts, while the uncertainty of the net present value (NPV) of the AC production was examined with seven economic indicators. Our results indicated that overall “in-plant production” process presented the highest environmental impacts. Normalized results of the life-cycle impact assessment showed that the AC production had environmental impacts mainly on the carcinogenics, ecotoxicity, and non-carcinogenics categories. We then further focused on life cycle analysis from raw biomass delivery to plant gate, the results showed that “feedstock establishment” had the most significant environmental impact, ranging from 50.3% to 85.2%. For an activated carbon plant producing 3000 kg AC per day in the base case, the capital cost would be USD 6.66 million, and annual operation cost was found to be USD 15.46 million. The required selling price (RSP) of AC was USD 16.79 per kg, with the discounted payback period (DPB) of 9.98 years. Alternative cases of KOH-reuse and steam processes had GHG emissions of 15.4 kg CO2 eq and 10.2 kg CO2 eq for every 1 kg of activated carbon, respectively. Monte Carlo simulation showed 49.96% of the probability for an investment to be profitable in activated carbon production from lignocellulosic biomass for supercapacitor electrodes.

1. Introduction

Lignocellulosic materials such as energy grasses and woody biomass are widely recognized as environmentally friendly feedstocks for value-added bioproducts [1], including for bioenergy products [2] and carbon sequestration [3], and as an essential element for the production of active carbon-based material [4]. Utilizing biomass to develop alternative energy-storage devices with high energy densities is a viable solution due to the uncertainty of fossil fuels and increased environmental concerns [5]. Supercapacitors are intermediate systems between electrochemical batteries and dielectric capacitors, which can deliver high power practically instantaneously during a few milliseconds [6]. Carbon supercapacitors are one of the three different types of supercapacitors [7]. Among the variety of carbonaceous materials such as carbon aerogel, activated carbon [8], and carbon nanotubes [9] studied for supercapacitor electrodes, activated carbon is the most widely used material, mainly because of its cost effectiveness, good conductivity, and potential environmental sustainability [10]. Despite the fact that carbon electrodes are mostly produced from nonrenewable materials such as coal and petroleum, lignocellulosic biomass is known as a renewable and inexpensive feedstock for Activated Carbon (AC)-based supercapacitor electrodes [11,12]. In particular, using biomass as feedstock for carbon of energy storage has advantages. First, compared to fossil fuels, renewable biomass material is more sustainable in terms of producing activated carbon in the future. Second, biomass-based products are becoming more and more accepted by the public. Specifically, the growth and production of biomass feedstock would sequestrate carbon and provide other ecosystem services. Third, the value-added utilization of biomass could also facilitate the development of the rural bioeconomy.
The fundamentals behind activation of carbon materials are well studied. The activation of carbon materials is generally conducted either by a physical or chemical process [13,14]. In the case of physical activation process using, typically, steam or carbon dioxide, a large amount of the internal carbon mass in carbon structures is removed [15], while in chemical activation process, the structure of raw material is degraded or dehydrated by chemical-activating agents [16]. The synthesis techniques of the biomass-based AC capacitors usually include pyrolysis (for carbonization) and activation processes [17]. Various studies on AC-based supercapacitors integrating the pyrolysis and activation processes showed high specific capacitances of biomass-derived carbon [18,19,20].
Though several studies have been conducted on biomass-based activated carbon for energy-storage applications [10,21], the production of lignocellulosic activated carbon for energy storage still faces technical, economic, and environmental challenges. While lignocellulosic materials offer large volume [22] and are environmentally friendly [23], they suffer from low carbon yield during AC production [21], leading to poor economics. Producing low-cost activated carbon compared to other electrode materials is one of the key challenges for the commercial success of the carbon-based supercapacitors [24].
Life Cycle Assessment (LCA) is an approach that accounts and manages environmental impacts by considering all the aspects of resource uses and emissions associated with an industrial system from either cradle-to-gate or cradle-to-grave [25]. A full LCA study typically includes four steps: the goal and scope, the inventory analysis, the impact assessment, and the interpretation of results [26]. LCAs were widely applied to analyze the environmental impacts of the utilization of biomass for various biomass-based products [1,27]. Liu et al. (2017b) [2] compared three bioenergy products from three lignocellulosic feedstocks and found that pellet production presented lower greenhouse gas (GHG) emissions and fossil energy consumption compared to the production of biopower and biofuels. LCA of an ethanol production process via the bioconversion of willow biomass showed 1.69-times higher water consumption compared to gasoline production using the same feedstock, while this process presented 1.41-times less in fossil fuel input [27]. Environmental impacts associated with the activated carbon production vary depending on different feedstocks and synthetic processes. A cradle-to-gate LCA study of activated carbon from woody biomass showed that the cumulative energy demand would potentially decrease by 35% compared to coal-based activated carbon [4]. A study on the environmental impacts of activated carbon from olive-waste cakes showed that the impregnation using H3PO4 as a chemical activation agent is a major process responsible for the majority of the impacts [23]. LCA of activated carbon from coconut shells showed that the use of renewable resources for the production of AC would reduce both human toxicity and global warming [28].
Few studies have focused on the economic analysis of biomass-derived activated carbon [29,30]. For AC production from pecan shells in a plant with a capacity of 10,000 kg/day, the production cost was estimated to be USD 2.89/kg [29]. Considering various feedstocks, the production cost was estimated to be USD 1.56–2.24 per kg of activated carbon [30].
However, a comprehensive assessment of the economic feasibility and LCA of lignocellulosic-based activated carbon for supercapacitors is still lacking. As the production of electrodes continues to grow, it is critical to develop a baseline analysis of the biomass-derived AC for energy storage and evaluate its performance economically and environmentally. The objectives of this study were to: (1) perform LCA analyzing the environmental impacts of biomass-based activated carbon; (2) conduct a techno-economic analysis of AC-based supercapacitors utilizing the energy crops; (3) compare the environmental impacts of different AC production scenarios; and (4) quantify the economic uncertainty of AC production.

2. Materials and Methods

In this study, energy crops, mainly switchgrass and miscanthus, were utilized to produce highly porous activated carbon for supercapacitor electrodes following a number of steps including biomass establishment, harvest, transport, storage, and in-plant production.
Raw feedstocks, switchgrass, and miscanthus were established in the field, harvested, and stored before delivery to the activated carbon plant. The feedstock was ground and blended to obtain the small particle size in order to facilitate the carbonization and activation thereafter. Similar to the existing works on biomass-based AC production, biochar was prepared by intermediate pyrolysis in a fixed bed with raw materials [17]. For chemical activation, potassium hydroxide (KOH) solution at a constant precursor-to-KOH ratio of 1:4 by weight was used. The intermediate carbon was then activated at 850 °C.
For economic analysis and LCA, the plant production rate was specified to be 3000 kg per day, which was based on the expected demand of a small-to-medium supercapacitor electrode market, and aligned well with the economical procurement radius of a disperse biomass feedstock [19].
In addition to the base case, two different scenarios were investigated for LCA. In the base case, KOH was used as an activation agent, but the KOH was not recycled, which affects environmental sustainability due to chemical consumption and waste water production [31]. In the first scenario, KOH was recycled with a mass loss of 10%. In the second scenario, steam activation, as opposed to activation by KOH, was used. It can be noted that steam activation is a commercial process for the production of AC used for general purposes [32].
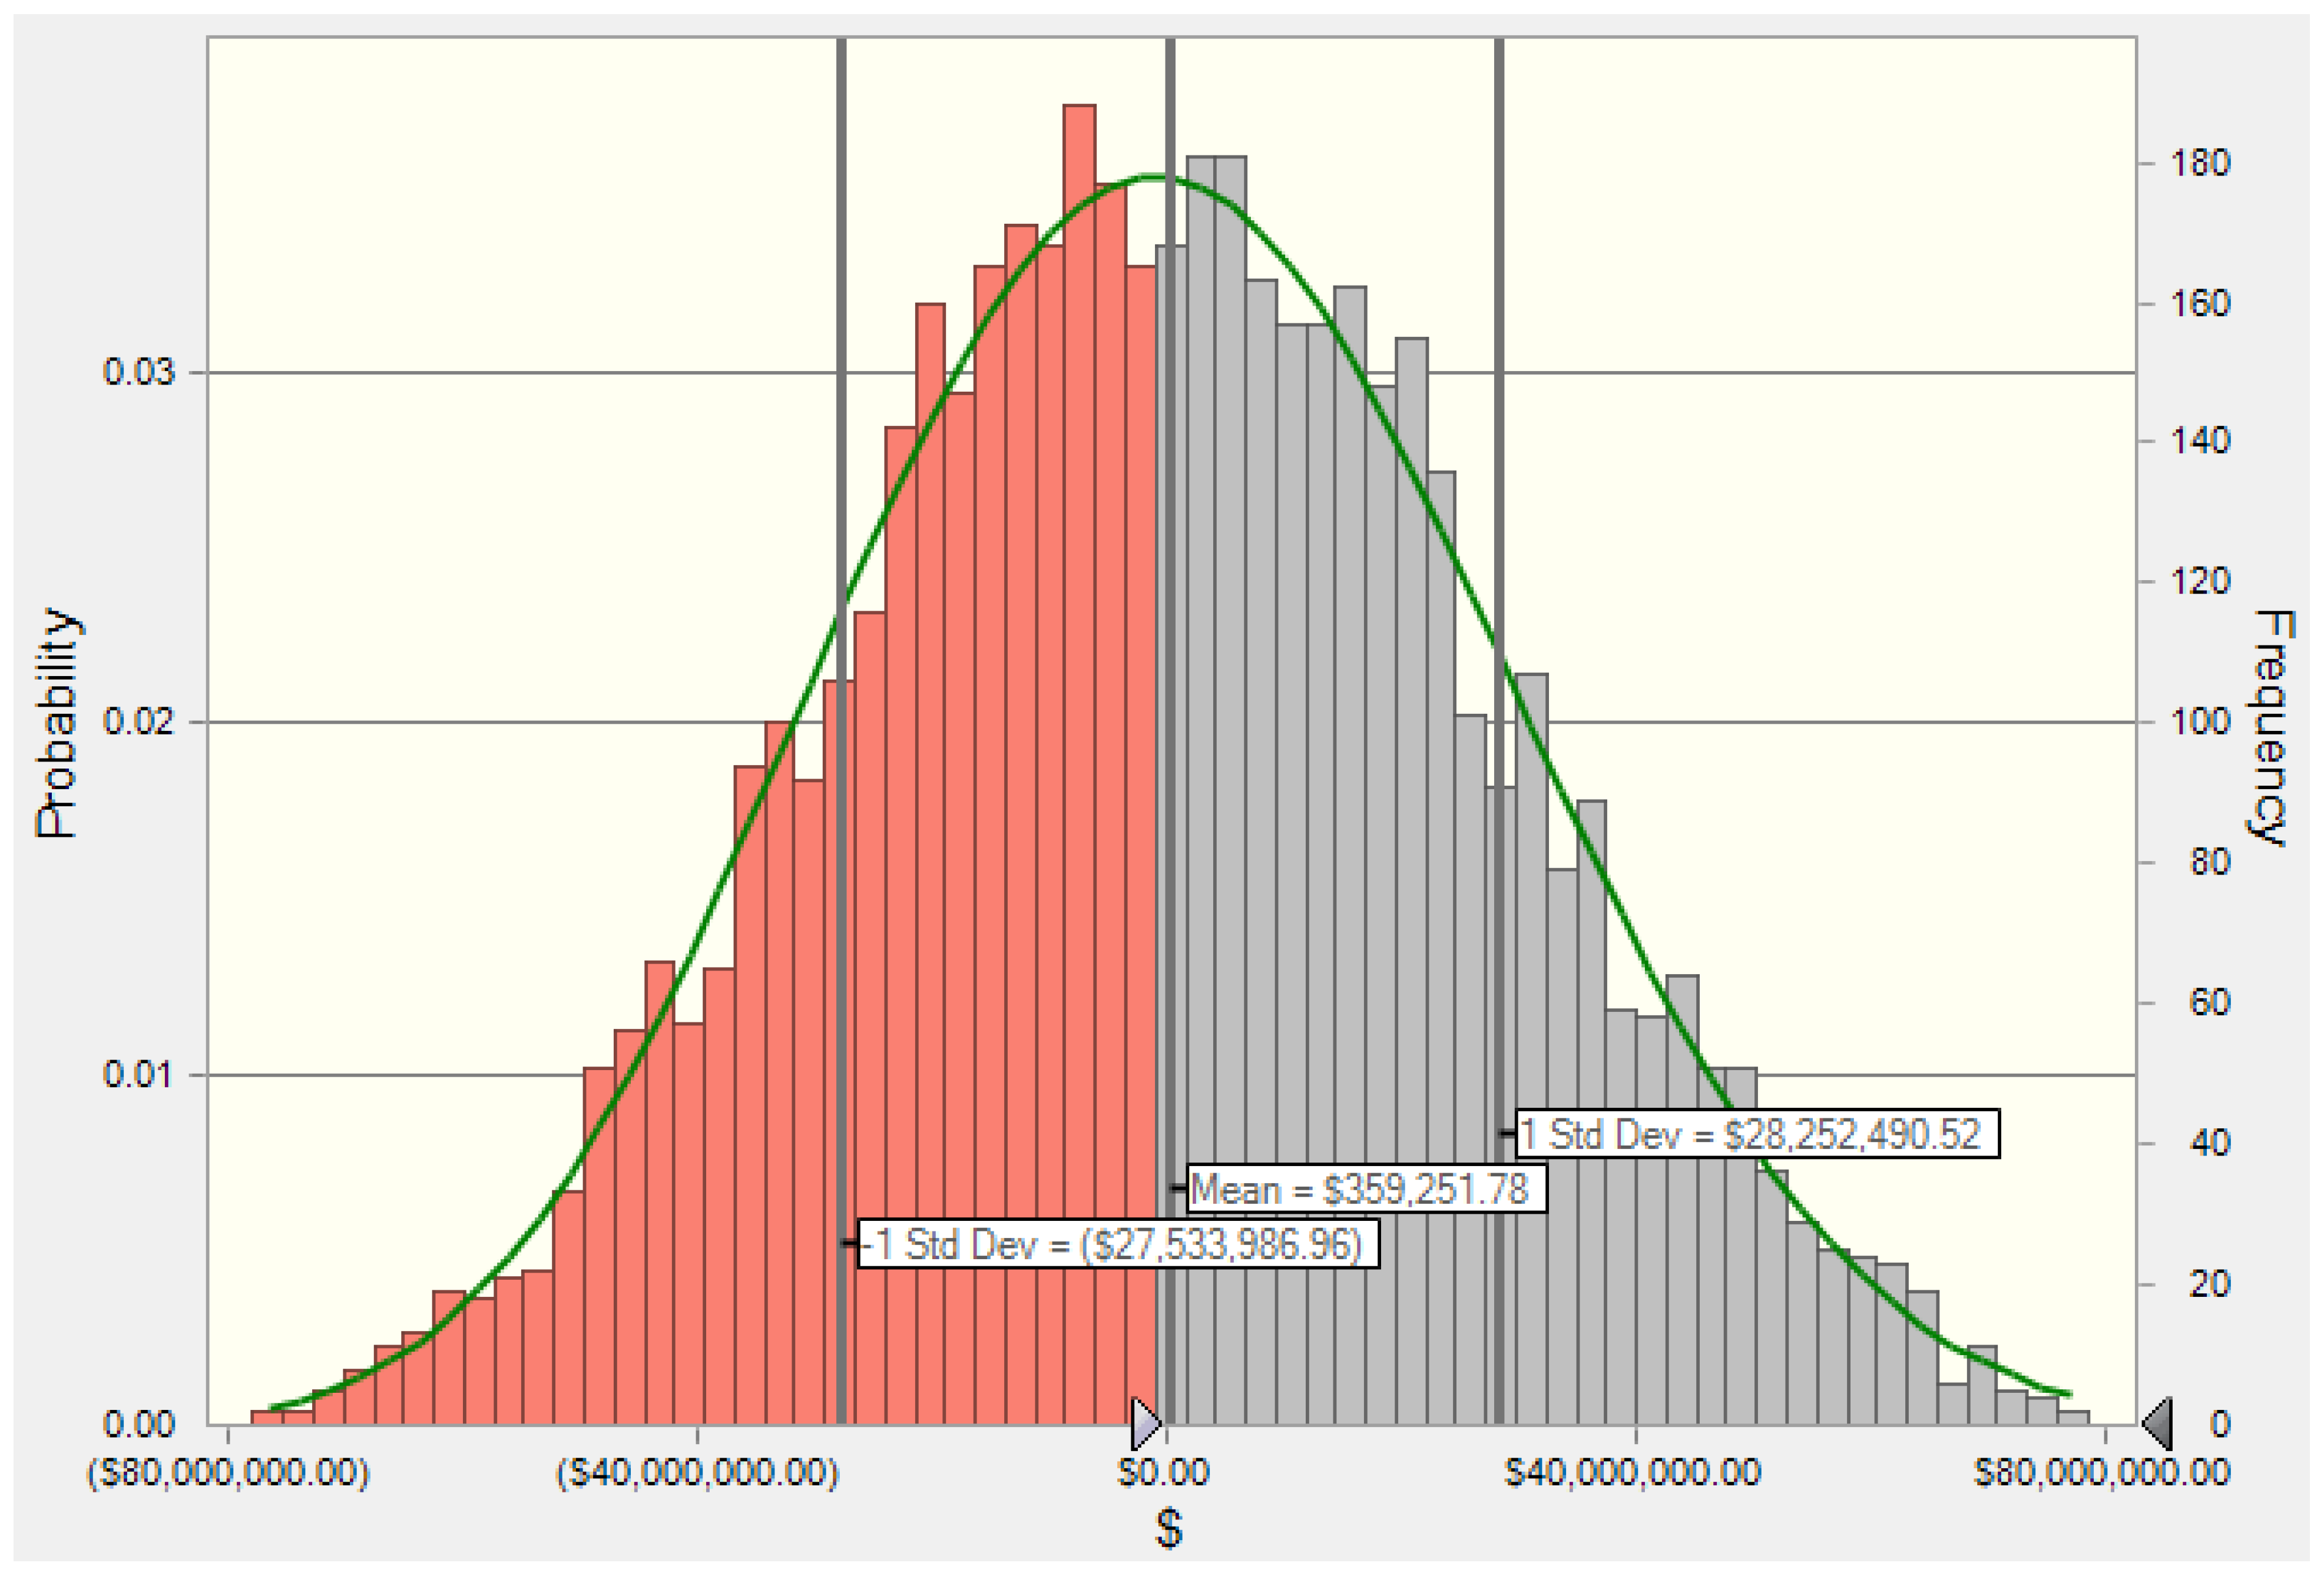
Monte Carlo (MC) simulations were conducted to quantify the uncertainties in the net present value (NPV) due to uncertainties in the production rate, sale price, equipment salvage price, and discount rate, as listed in Table 1. Uniform distributions were considered for the price of KOH and the discount rate since, for these two factors, all outcomes were equally likely to occur. For other factors with uncertainties, Beta distributions were applied.

2.1. Life Cycle Assessment

2.1.1. Goal and Scope Definition

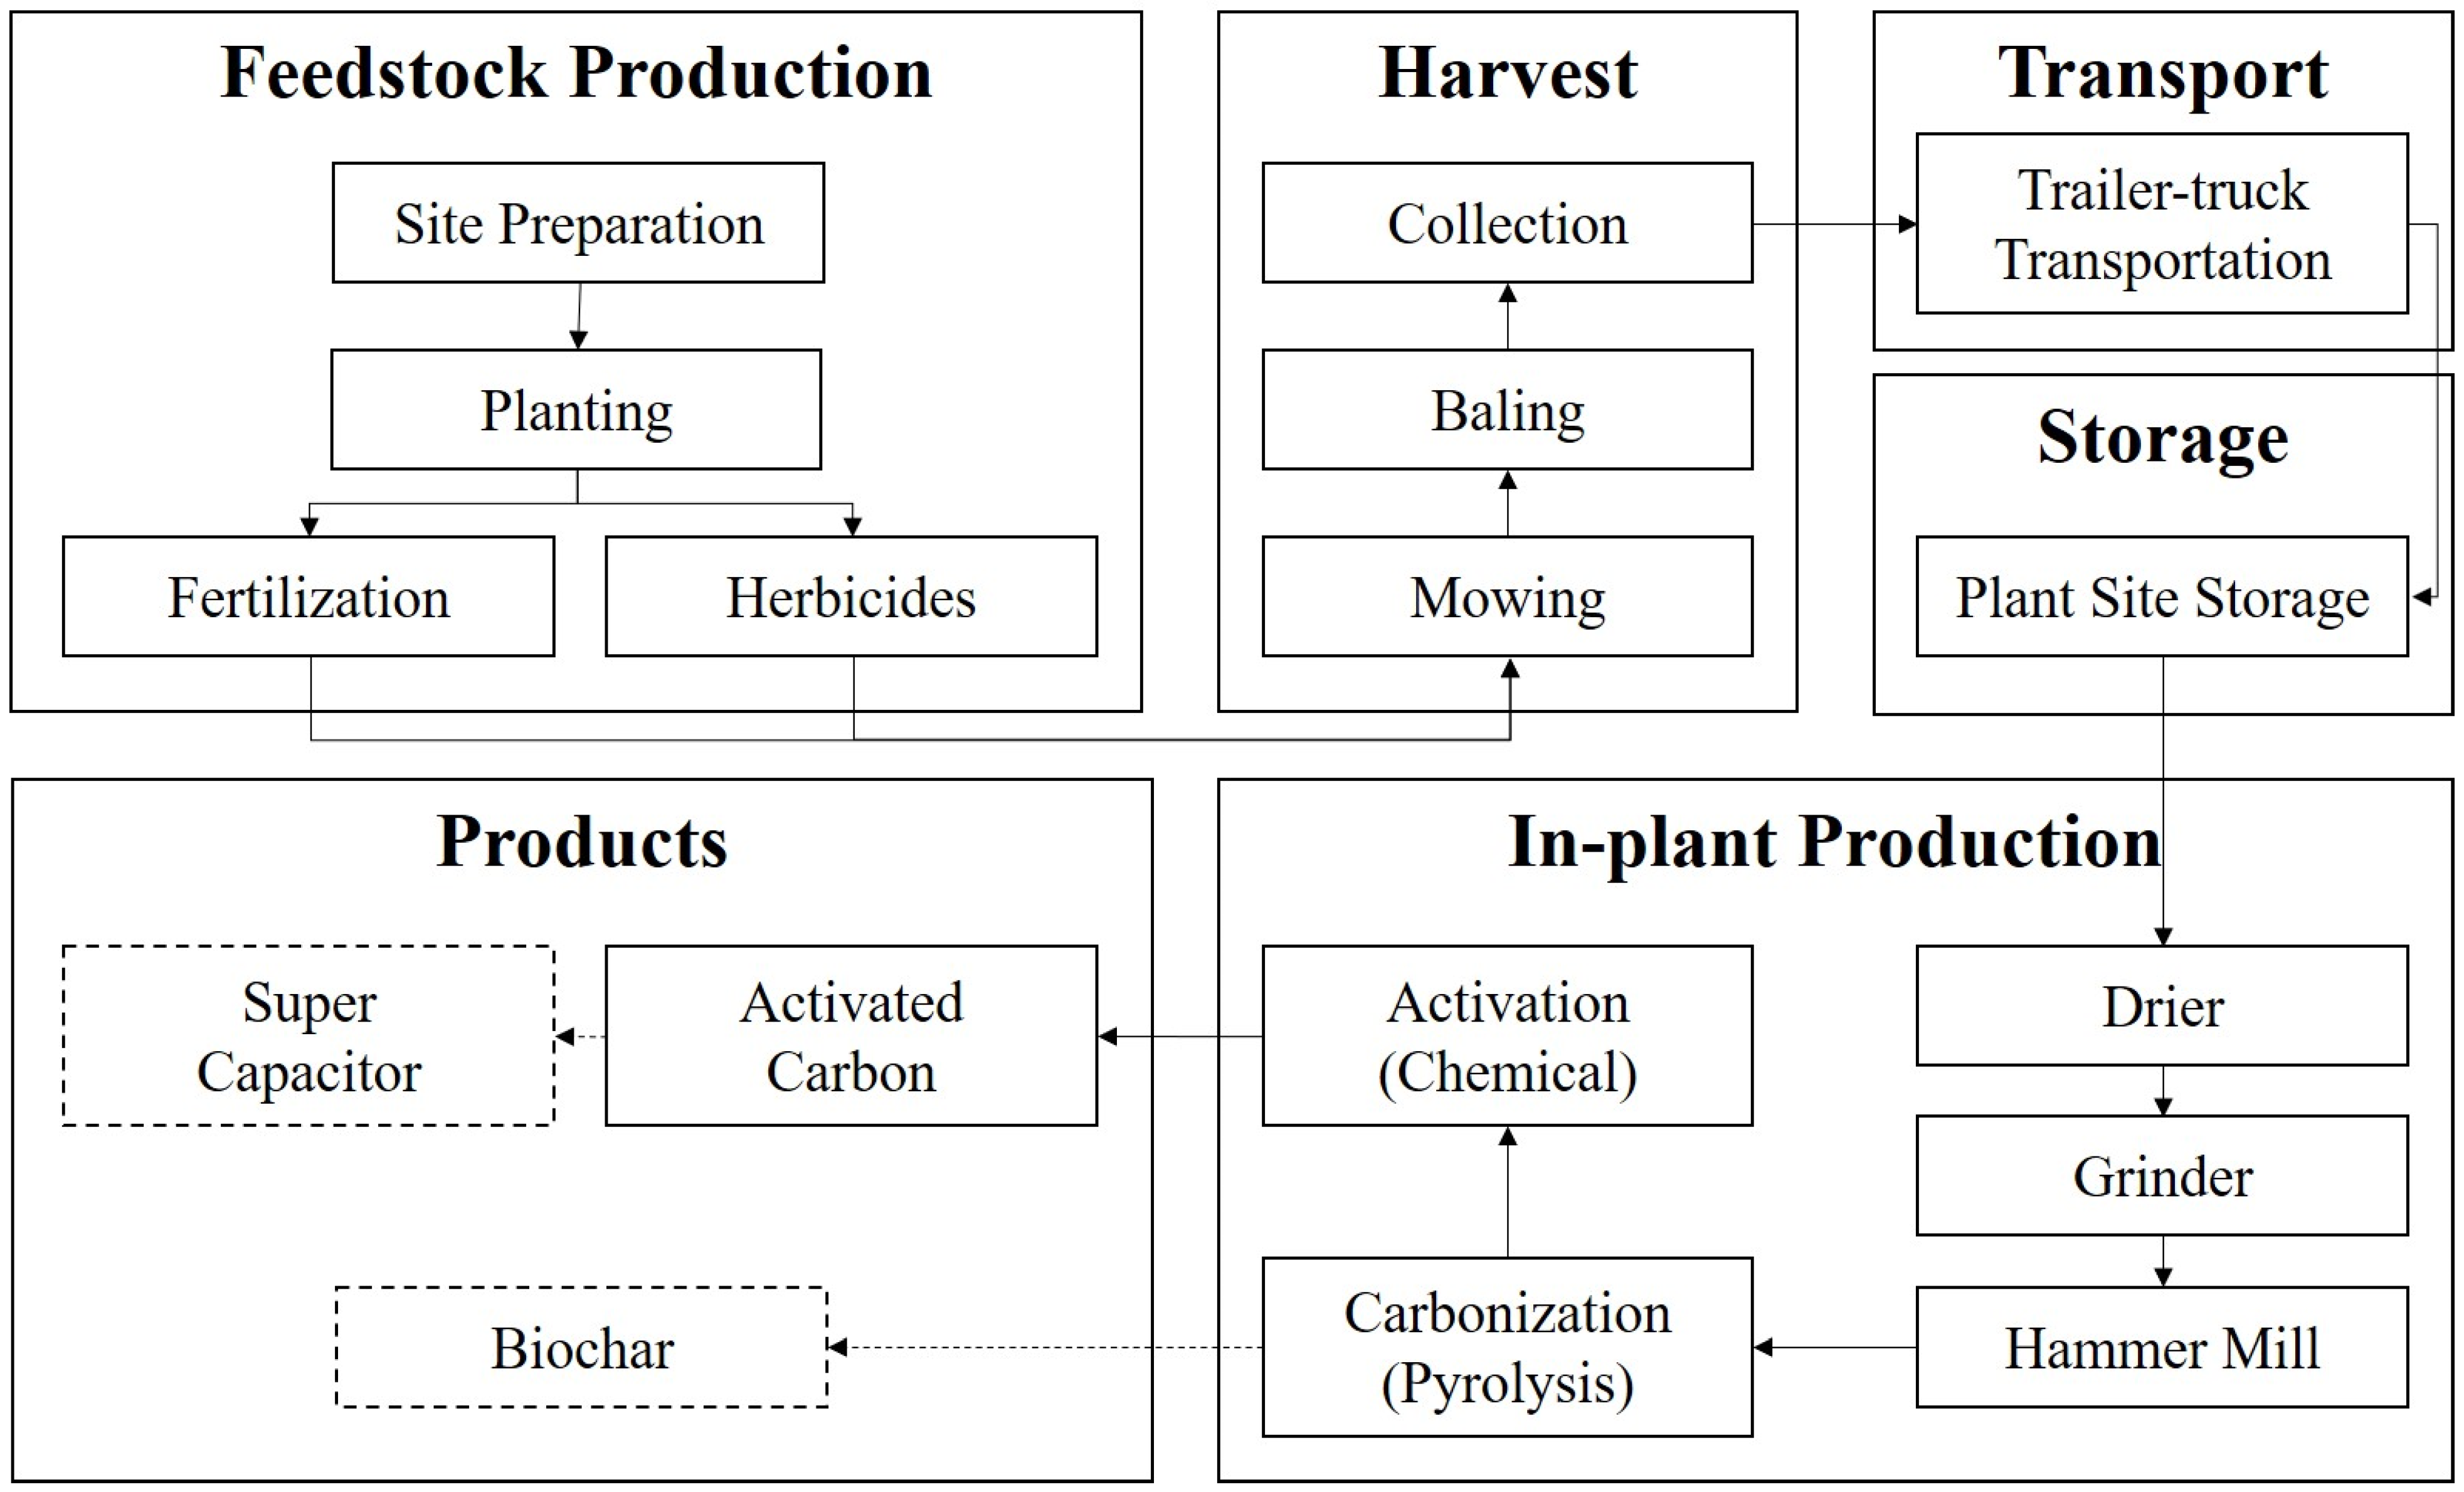
A cradle-to-gate LCA model was developed to estimate the environmental impacts of AC production for supercapacitors from lignocellulosic biomass. For LCA, two major components for production of AC are biomass feedstock preparation and in-plant AC production, as shown in Figure 1. Biomass feedstock preparation includes feedstock establishment, harvest, transportation, and storage. In-plant AC production includes size reduction, thermochemical conversion into biochar via pyrolysis, and chemical activation. The functional unit (f.u.) of the system was 1000 kg of energy-storage activated carbon.

2.1.2. Life Cycle Inventory

With the production of 1000 kg of highly porous AC, the material inputs were carried out to estimate the environmental output for AC production (Table 2). Diesel and lubricating oil were consumed by machines used for handling feedstock in all processes. Fertilizer and herbicides were considered for feedstock establishment causing potential environmental impact. Electricity and KOH were the inputs to the size-reduction, carbonization, and activation steps. Input data were obtained from the field studies, experiments outcomes, and previous studies by [1,17,28,33].
The establishment and collection of switchgrass and miscanthus includes site preparation, planting, fertilization and the addition of herbicides, mowing, baling, and collection. The equipment used in these processes included a plow, a disk, a harrow, a hopper, a tedder, a rake, a baler, a wheel loader, and a tractor [2]. Feedstock was then transported by truck to the storage at the processing facility. Driers, grinders, and hammer mills were included for preprocessing. Feedstocks were pyrolyzed at 450 °C for carbonization process, and then activated by being mixed and heated with KOH at 850 °C. The fuel and materials consumption in the harvest system was modified from the study by Liu et al. (2017a) [1] to be consistent with this study. The utility and transportation were estimated using the USLCI database [33]. The fuel and materials consumption of carbonization and activation process were adjusted based on the studies by Arena et al. (2016). and Yakaboylu et al. (2019) [17,28].

2.2. Economic Feasibility Analysis

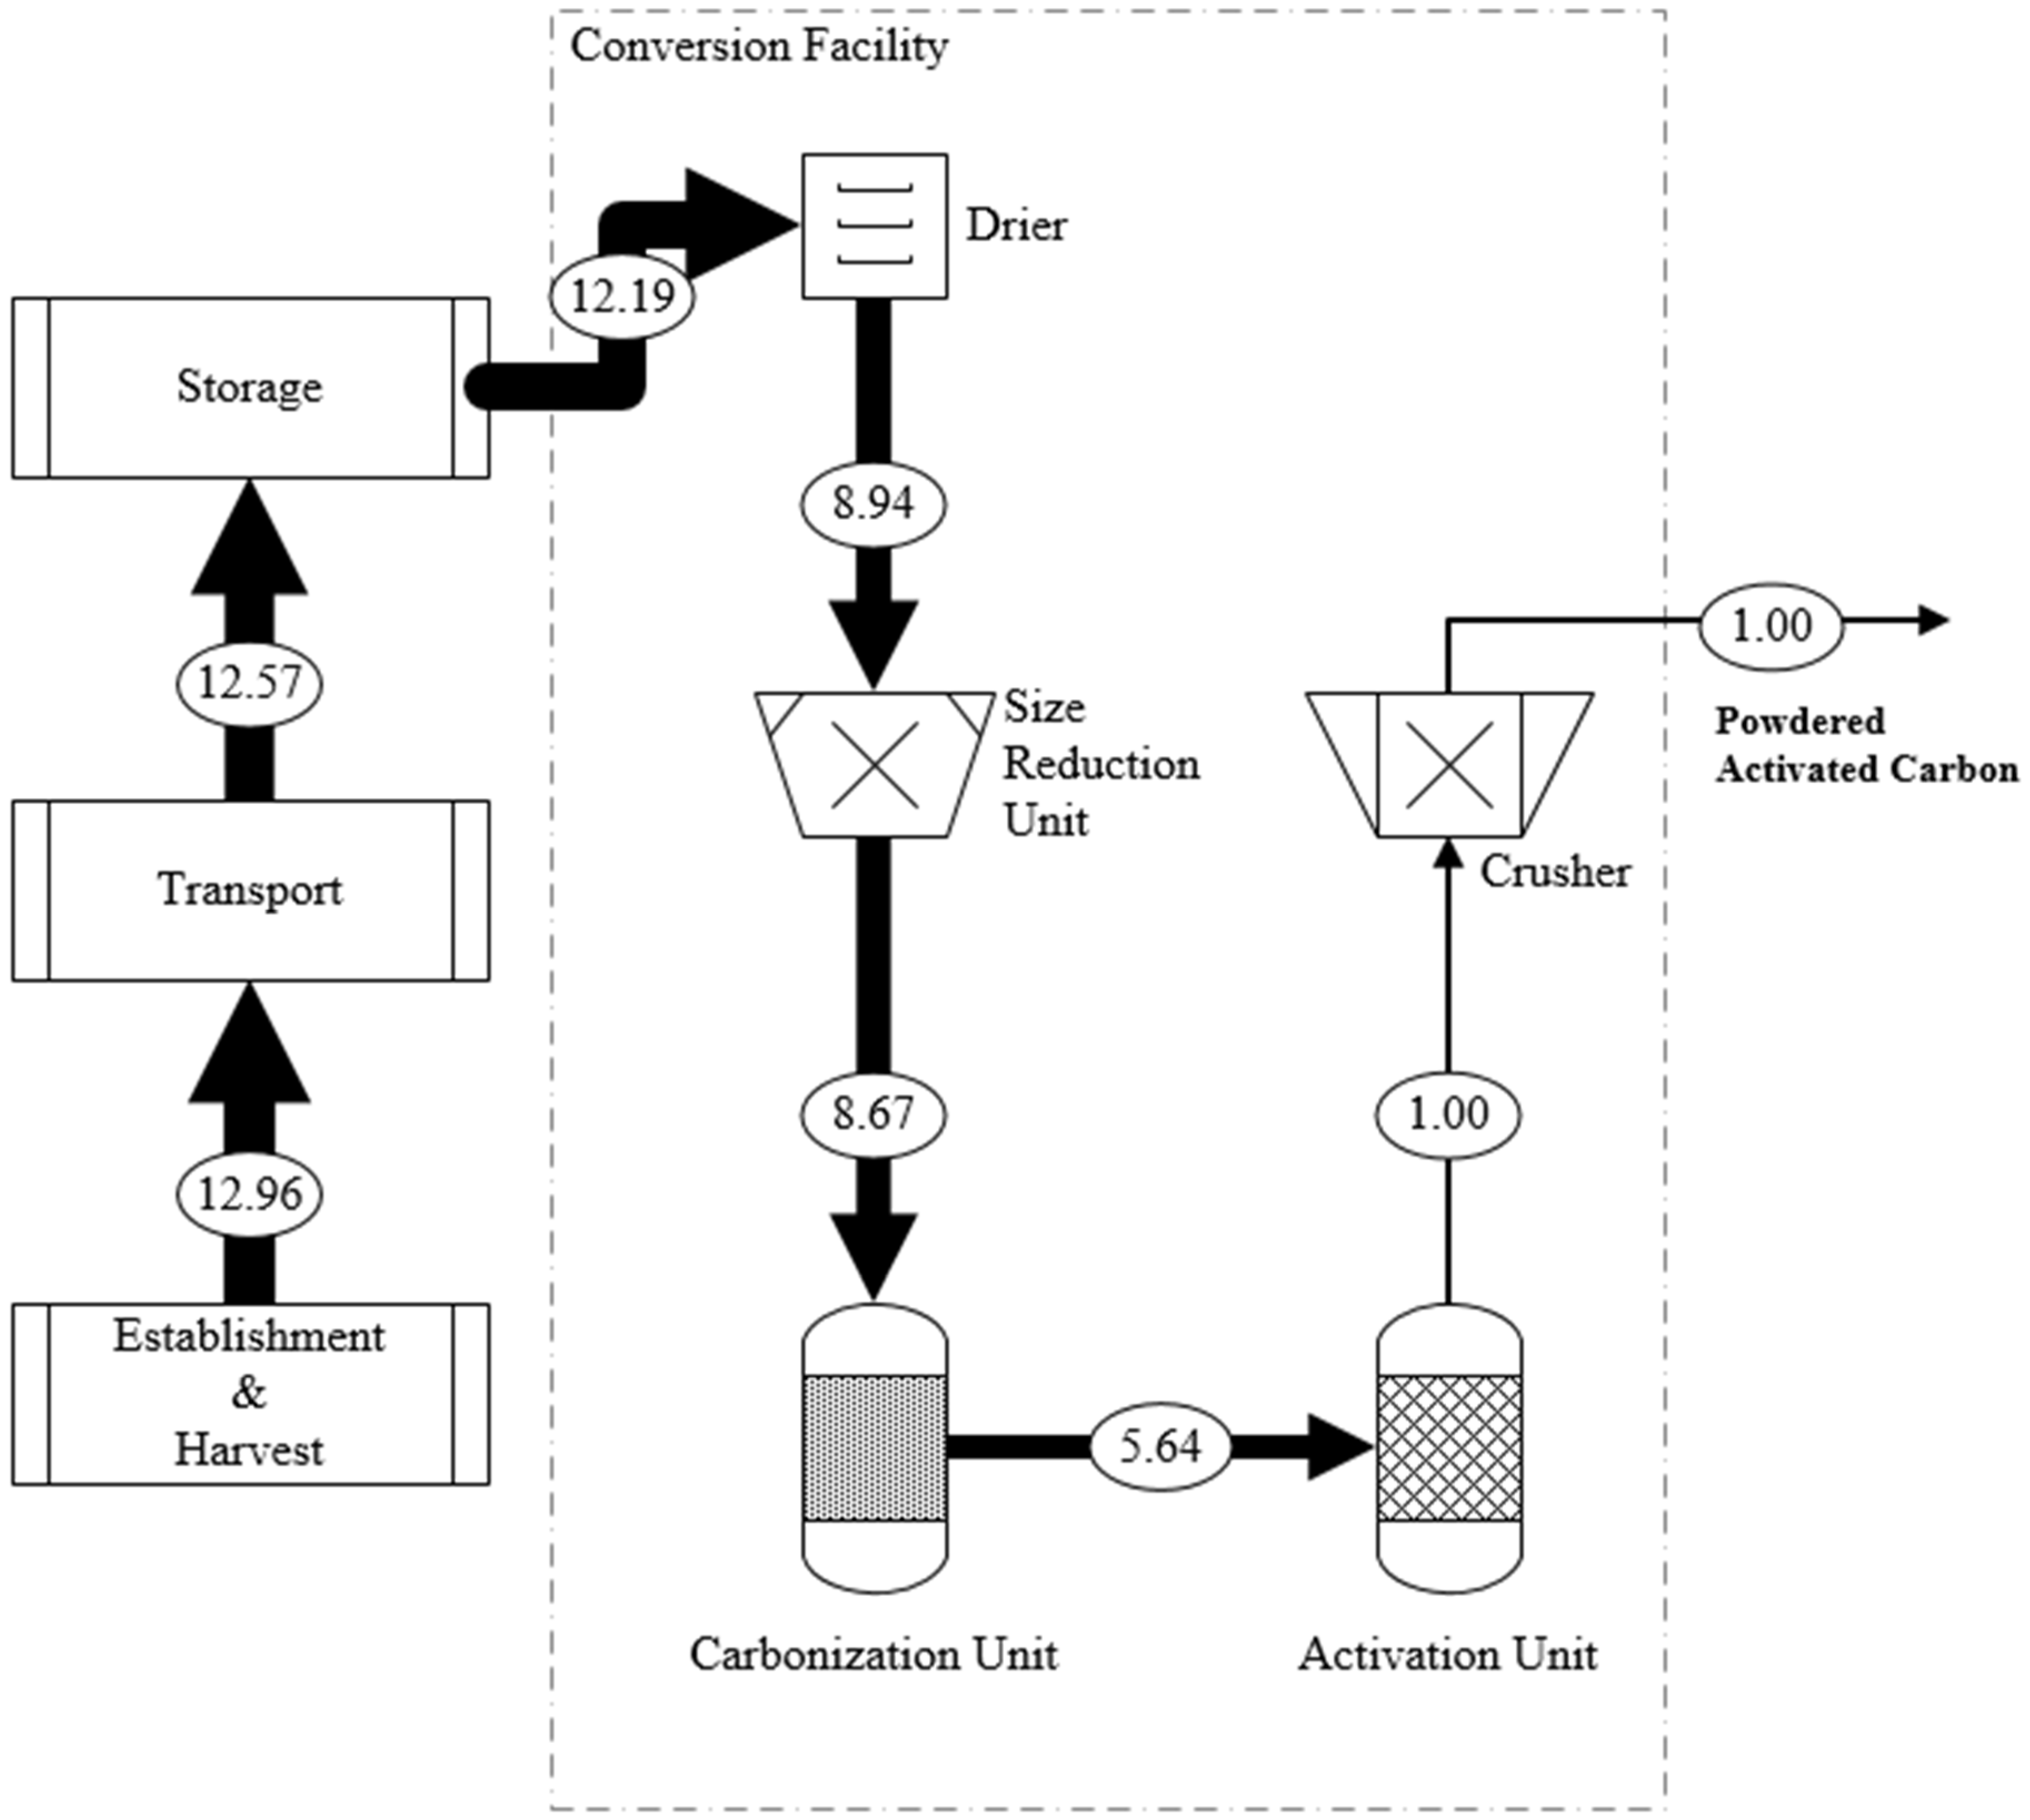
A mass balance and flow diagram was developed (Figure 2) based on field investigations and our previous studies [1,17,34,35,36,37]. It specifies the yield at each step in the carbon production and activation process and identifies the key process equipment items for the manufacturing facility (Figure 2). This entire diagram was jointly verified by forest operation experts and chemical engineering experts. As seen in this diagram, producing one kg of powdered activated carbon requires 12.96 kg of raw materials on a wet basis. A loss of 3% of dry matter is considered at each stage of feedstock establishment and harvesting, transportation, and storage [34].

2.2.1. Cost Estimation

In the base case, it was assumed that the plant life was 10 years with a discount rate of 5%, and an annual production yield of 960,000 kg (3000 kg per day for 320 days of operation) of high-performance ACs (Table 3). To support an AC plant of this size, a supply of 8579 dry Mg of lignocellulosic biomass was required as feedstock.
Equipment cost was estimated based on a combination of vender quotes and literature sources [29,30], and capital cost was estimated for all major technical components and processes within the plant using the Lang Factor method [38]. The total cost was determined by multiplying the total purchase cost for all the major items of equipment by a constant called Lang factor.
C T M = F L a n g i = 1 n C P , i
where C T M   is the capital cost of the plant, C P , i is the purchase cost of the major equipment unit i , n is the total number of individual units, and F L a n g is the Lang Factor. The Lang factor varies regarding three process plant types: solid processing plants ( F L a n g = 3.10 ), solid-fluid processing plants ( F L a n g = 3.63 ), and fluid processing plants ( F L a n g = 4.70 ) [38]. In this study,   F L a n g = 3.63 was used for this combined fluid–solid system. Equipment costs derived from the literature were adjusted to year 2019 by multiplying the Producer Price Index (by Commodity for Machinery and Equipment: General Purpose Machinery and Equipment) [39].
The cost of manufacturing ( C O M ) could be obtained by adding together three cost components: direct manufacturing cost, fixed manufacturing cost, and total general manufacturing cost [38]. It is denoted in the following equation:
C O M ( C o s t   o f   M a n u f a c t u r e ) = 0.280 C T M + 2.73 C O L + 1.23 ( C R M + C U T )
where C T M   is the capital cost of the plant, C O L is the labor cost for plant operation, C R M is the raw material costs for feedstock and chemical solution, and C U T is the utility cost for electricity, water, and natural gas. In this equation, the coefficients for each variable were derived from “total general manufacturing cost” by [38].
With the assumption that a single operator works 40 h per week for 49 weeks annually, the amount of required labor ( N O L ) was calculated based on [38]:
N O L = 4.5 ( s h i f t s ) × ( 6.29 + 31.7 P 2 + 0.23 N n p ) 0.5
where P = 0 is the number of processing steps involving particulate solids, and N n p = 10 is the number of other processing steps. In this study, there were ten non-particulate processes: hammer mill, soak tanks, rotary dryer, two rotary kilns, rotary cooler, wash tanks, recovery tanks, storage tanks, rotary dryer, and sieve. For each of the N O L operators assigned an 8-h shift with a typical 3-week leave, there are 4.5 operators required for a plant that runs 24 h per day. After calculation, the amount of labor per shift was 2.93, and this was rounded up to 3 for later calculation.

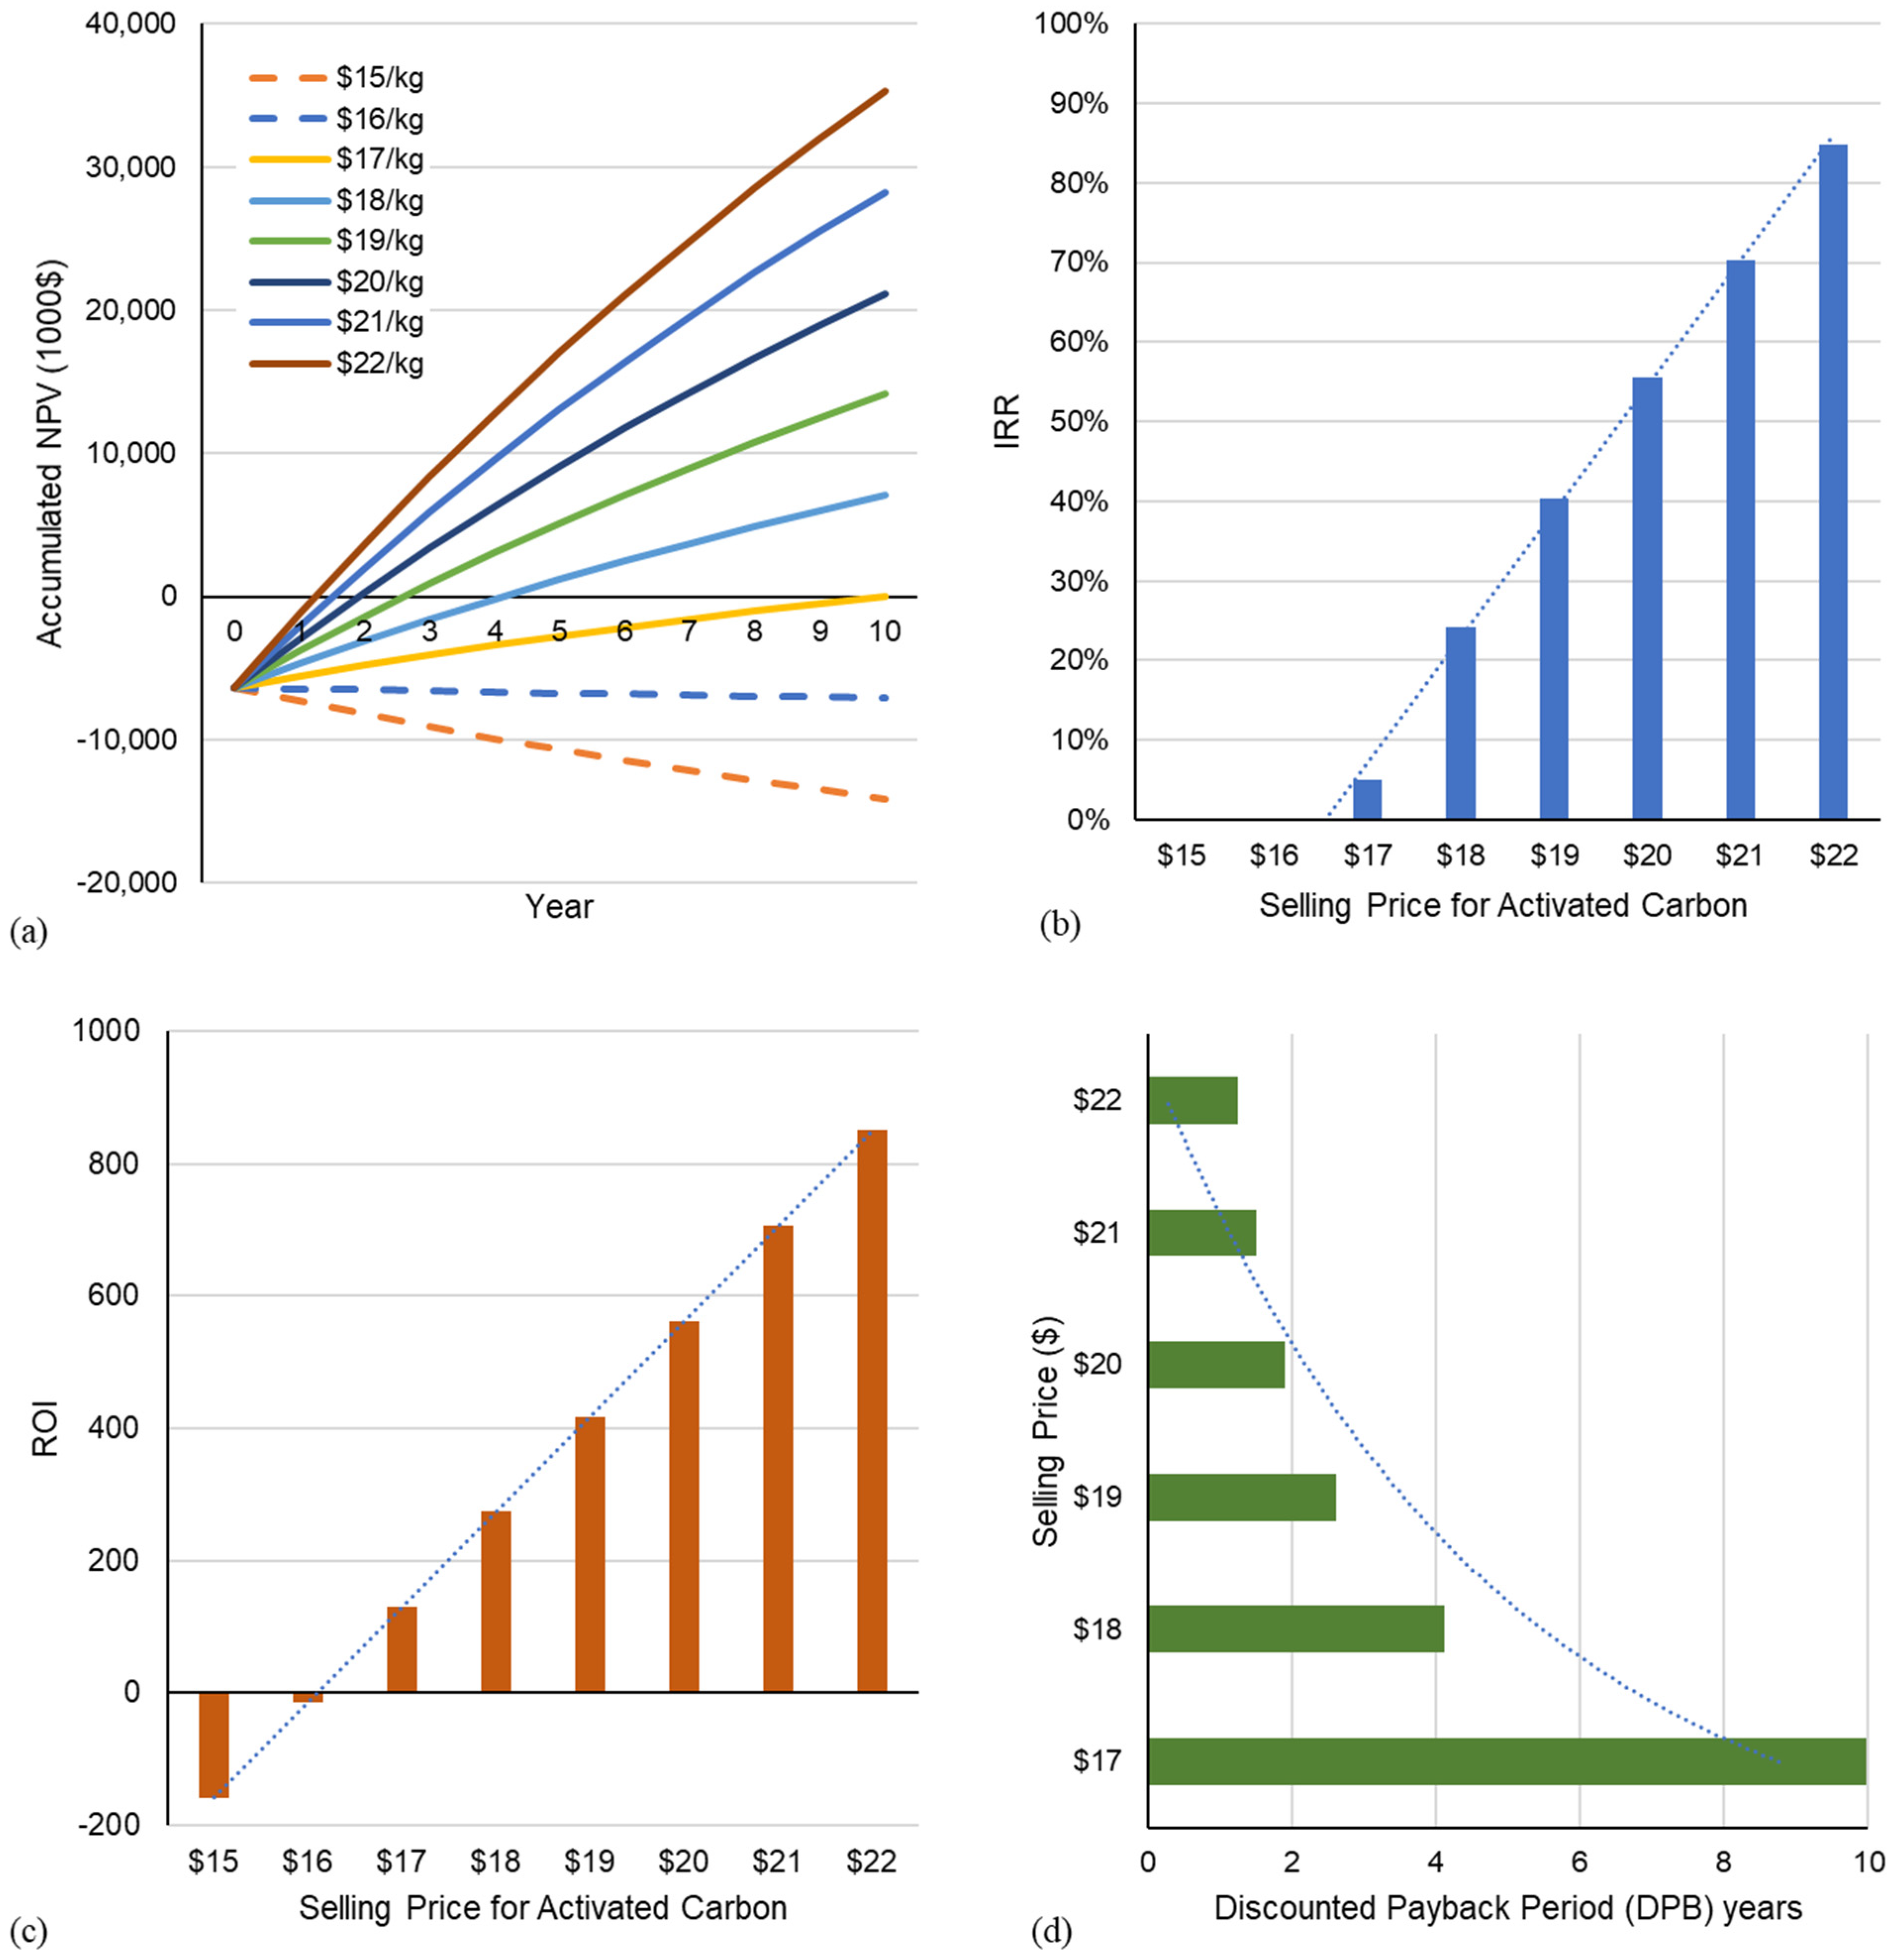
2.2.2. Economic Evaluation

Several economic indicators including return on investment (ROI), NPV, internal rate of return (IRR), and discount pay-pack period (DPB) were computed. The ROI was computed as follows:
ROI = I t C p C T M
where:
  • C p is the total production cost;
  • I t is the total income during the time period t ;
  • C T M is the total investment cost.
The NPV can be computed by considering the difference between the present value of cash inflows and outflows over the entire plant life [40] and is given by:
NPV = C T M + t = 1 N I t ( 1 + d ) t
where:
  • C T M is the total investment cost;
  • I t is the cash flow at a single period t ;
  • d is the discount rate.
The internal rate of return (IRR) measures the return performance of an investment calculated over the whole plant life and is expressed as a percentage [41].
The discounted pay-pack period (DPB) is the time period required for the pay-back of investment and interest, and it takes the present value of cash flow into account. It is calculated by setting NPV = 0 and a trial and error procedure is applied. The shorter the payback, the more desirable the investment. The DPB was formulated using the logarithm with consideration of the time value of money, which is superior compared to the simple payback period formula [42].
DPB = ln ( 1 1 C T M × d C F ) ÷ ln ( 1 + d )
where:
  • C T M is the total investment cost;
  • d is the discount rate;
  • C F is the cash flow during the whole period.

3. Results

3.1. Life Cycle Impacts

The cradle-to-gate LCA for producing 1000 kg of supercapacitor electrode carbon products was conducted using SimaPro 9 [43] with the TRACI 2.1 LCA method [44]. The environmental impacts were assessed considering the following 10 categories: ozone depletion, global warming, smog, acidification, eutrophication, carcinogenics, non-carcinogenics, respiratory effects, and ecotoxicity (Table 4). The total global warming potential when producing 1000 kg of high-performance AC was 62.78 tons of CO2 equivalent, including greenhouse gases CO2, N2O, NH4, and volatile organic compounds (VOCs). The contribution of the emitted gases to the depletion of the ozone layer was 2.62 × 10⁻³ Kg CFC-11 equivalent. The measurement of smog indicated the photochemical ozone creation potential (POCP) [45], accounting for 2226.50 kg O3 equivalent. The acidification emission to the atmosphere along with subsequent deposits on surface soil and water [46] was 206.37 kg SO2 equivalent. The eutrophication potential was 106.73 kg N equivalent, which referred to the over-fertilization in aquatic ecosystems over the entire life cycle. Both carcinogenics and non-carcinogenics are human-toxicological effect factors for LCA purposes [47], and they were 2.27 × 10⁻³ and 1.04 × 10⁻² CTUh (Comparative Toxic Unit for humans), respectively. The respiratory effects caused by inorganic substances were recorded as 14.09 kg PM 2.5 equivalent, and the ecotoxicity potential was 2.26 × 10⁵ CTUe (Comparative Toxic Unit for ecotoxicity). The amount of consumed fossil fuel was 7.18 × 10⁴ MJ surplus.
Environmental indicators were normalized for each impact category at the midpoint level (Figure 3). Midpoint results include a large number of impacts and more details (ten factors in this study), and endpoint impacts are usually shown as the impact on human health, global warming, and resource depletion [48]. Normalized factors relate the impact scores to the average impact due to the exposure of a human being to the environment per year. Our results showed that the top three categories with higher potential impacts are carcinogenics, ecotoxicity, and non-carcinogenics, with scores of 43.01, 20.39, and 9.89 per person per year equivalent, respectively. Ozone depletion, respiratory effects, and smog were affected the least under the environmental category.
Among the five components—establishment, harvest, transportation, storage, and AC production—the process of AC production (carbonization and activation) resulted in the highest environmental impacts in all ten impact categories, with 95.8 to 99.6% of the total normalized environmental impacts while 96.70% of the GHG emission occurred in the process of the “carbon production” phase at a facility site (Table 5).
Further analysis of environmental impacts on feedstock logistics (Figure 4) showed that the “feedstock establishment” process presented the most significant impact, ranging from 50.3 to 85.2%. In the “feedstock establishment” process, site preparation, fertilizing, and herbicide application were counted in the life-cycle inventory. According to a study by [49], the use of fertilizer (ammonium sulphate) and herbicide (glyphosate) could affect the climate change, eutrophication, acidification and ecotoxicity, which appeared to be the major cause of the environmental impacts by feedstock establishment. The top three impact categories for feedstock harvesting were smog (32.43%), acidification (28.17%), and greenhouse gas emission (16.29%). With the assumption of a 50-mile transportation radius/distance for the base case, feedstock transport caused 15.12% of the environmental impacts in the feedstock logistics component. This could have increased as the transportation distance of biomass increased. Global warming, fossil fuel depletion, and ecotoxicity accounted for more than one fifth of the total environmental impacts by feedstock logistical activities.

3.2. Techno-Economic Impacts

Equipment costs were estimated by updating those reported in a study by [29] using the producer price index for machinery and equipment [39], which accounts for the average change of the purchase costs of required machines over time for AC production (Table 6). The equipment costs for a total of 16 machines were USD 1.83 million for an AC plant with a productivity of 3000 kg/day. The total capital costs for this AC plant were estimated to be USD 6.66 million.
The total operation cost for producing highly porous activated carbon was USD 15.45 million annually (Table 7). Annually, the raw materials cost was estimated at USD 12.60 million for lignocellulosic feedstock and KOH, and it accounted for 81.53% of the total operating cost. The total direct manufacturing costs, including the costs of utility, operating labor, direct supervisory and clerical labor, operating supplies, maintenance and repairs, laboratory charges, and plant overhead costs, were estimated to be USD 13.85 million. The fixed manufacturing costs, accounting for local taxes and insurance, patents, and royalties, were estimated to be USD 981,069. Furthermore, the general manufacturing expenses were USD 1.29 million.

3.3. Economic Feasibility

Based on the economic assessments of the activated carbon production in this study, the required selling price (RSP) was USD 16.79 per kg (USD 16,794.02/ton). Even though the price for general-purpose activated carbon could be as low as USD 1.65/kg, the market price of carbon for supercapacitor electrodes can be higher, with its premium grade ranging from USD 15 to 50/kg [50].
The economic performance of the activated carbon production plant was evaluated in terms of ROI, NPV, IRR, and DPB (Table 8). It was assumed that all activated carbon products were characterized with the same surface area and sold on a weight basis of USD 17/kg.
The return on investment (ROI) of 129.7%, (or annual ROI of 12.97%) shows that the net return of the AC plant could bring financial gain and that the project would be potentially profitable. The NPV was estimated to be USD 9613, indicating a financially feasible project. The IRR was estimated to be 5%. The DPB was found to be 9.98 years, showing the potential profitability of the AC plant. However, these indicated that the investment would be only marginally viable.
The impact of the selling prices of the product on the economic performance were analyzed considering an uncertainty of −15%–30% with respect to the base case price of USD 17 per kg (Figure 5). The resulting AC selling price ranged from USD 12 to 22/kg. When the selling price dropped below USD 16/kg, it led to a negative NPV and ROI, and a longer DPB (longer than the plant’s lifetime), indicating that the AC plant would not be economically viable. As the selling price increased, it was found that the IRR and ROI would increase linearly, and the DPB would be reduced logarithmically. Each USD 1 increase in the AC selling price led to an increase in the IRR by 13.26%, an increase in the ROI by 144.20%, and a nonlinear decrease in the DPB varying from 10.890 to 141.65%. It was found that the discounted payback period would be less than two years once the product selling price reaches USD 20/kg and above. At USD 20/kg, the IRR would be greater than 50%, ranging from 56% to 85%.

4. Discussion

4.1. Sensitivity of Life-Cycle Impacts

The results of the life-cycle assessment showed the differences in GHG emissions, as compared to other studies [4,14,29], because of the use of different activation technologies. It was found that the use of KOH without recycling would lead to a great environmental impact not only on GHG emission, but also on human toxicity. Meanwhile, wastewater containing KOH in an aqueous mix is a source of hazardous waste [31]. Thus, recovering the KOH for reuse could benefit the AC production economically and environmentally. If 50% of KOH could be recycled, the annual material cost could be reduced by 52.70% from USD 12.60 to 5.96 million. If an AC plant could reuse 90% of KOH, it would save USD 10.72 million annually.
The normalized results of the environmental impacts for the two alternative scenarios were compared with the base case (Figure 6). The two alternative scenarios demonstrated significant decreases in environmental impacts in each of the 10 categories. Specifically, for GHG emissions, both partial-recycling of KOH and steam activation had emissions of 15.4 kg CO2 eq and 10.2 kg CO2 eq for every 1 kg AC production, respectively. These are 13.33% and 42.30% lower than the coal-based activated carbon, which had emissions of 18.3 kg CO2 eq/kg [4], and are also similar to the GHG emission of 11.15 kg CO2 eq from wood-chip-based AC [4].
According to a study by González-García (2018) [22], steam-activated carbon products yield only 776–1122 m2/g of surface area, which is not sufficient to meet the energy-storage requirement for supercapacitors. On the other hand, KOH-activated carbon products showed high specific surface areas of up to 3265 m2/g, and exhibited great performance in terms of electricity capacitance [17]. However, problems may occur in KOH recycling related to impurities and immature potassium recovery. During the chemical activation process, the ratio between KOH and the precursor mass, temperature time, and stirring need to be strictly controlled [51], which can be challenging in cases of recycling and reuse.

4.2. Economic Uncertainty

The selling price of activated carbon was assumed to be USD 17/kg for the base case in this study, which was intended to constitute a “worst scenario” of economic feasibility in terms of the selling price. Thus, the IRR of 5% in this study demonstrated a lower bound limit of return rather than an expected value. Of note, the IRR of 5% was a real rate rather than a nominal rate, because we excluded the inflation rate in the TEA analysis in this study. Given the inflation rate in the US in the past years, this real rate of IRR would be equivalent to the nominal return rate of 7–9%. Beyond this scenario, the IRR would go up to more than 50% when the selling price increases to USD 20/kg. Given the promising energy-storage market and bioproduct market, the selling price is expected to go higher. Therefore, this process demonstrates incentives for potential investors to some degree. In addition, the emitted CO2 handling or capture was not considered at this point in the study, because it is not yet regulated in the US, especially for small-size plants such as that proposed in this study. However, considering the present net-zero goal and strategies, CO2 handling or capture will be included in our future studies. With consideration of the CO2 handling cost, the economics of this process would be changed accordingly to some degree. As reported, using the most-ready MEA technology, the capture cost of CO2 from flue gas ranges from USD 53 to 86/ton [52,53].
With the production yield rate at 3000 kg of AC per day, and a minimum annual demand of 8579 dry Mg of lignocellulosic biomass as feedstock, a reasonable capital cost was estimated to be USD 6.66 million. According to Stavropoulos and Zabaniotou (2009) [30], a wood-based chemical activated carbon plant with 4500 kg/day capacity needs a total investment of USD 6.29 million. The capital cost for the AC plant in this study was 5.56% higher, due primarily to the higher feedstock delivery price. Meanwhile, the required selling price at the break-even point for highly porous AC was USD 16.79 per kg, which was in the range of the market price of supercapacitor carbon of USD 15 to 50. The RSP of this study provides a considerable margin for the actual potential selling price of activated carbon products intended for electrode-based purposes. In addition, the energy density of the supercapacitor based on a specific AC plays an important role in the economic evaluation of the AC production. It would influence the economic feasibility by affecting the market price of the AC for supercapacitors.
Uncertainties in NPV were quantified through MC simulation [54]. The MC simulation was conducted using Crystal Ball [55,56] by considering uncertainties in the parameters listed in Table 1 (Figure 7). After 5000 iterations of Monte Carlo simulation to calculate the NPVs, the values converged to a properly scaled Beta distribution of the NPVs ranging from USD −80 to 80 million. The average NPV was USD 9612.86 from MC simulation, which was close to the predicted mean value (USD 359,251) from the fitted Beta distribution, with 49.96% probability that this investment will be economically viable.

5. Conclusions

An integrated life cycle and techno-economic analysis was carried out for the production of AC from lignocellulosic biomass catering to a small-to-medium market of supercapacitors. In the entire process, the AC conversion process resulted in the highest impacts in all ten environmental categories. Carcinogenics, ecotoxicity, and non-carcinogenics were the top three impacts of AC production related to human health and ecosystem quality. Among all of the steps involved in the biomass feedstock preparation, the feedstock establishment step had the highest impact on the environment, especially for ozone depletion, respiratory effects, and carcinogenics. The RSP of USD 16.79/kg for activated carbon from lignocellulosic biomass was found to be comparable with the market price of USD 15–50 per kg for supercapacitor carbons. Our base case study indicated that for an investment of USD 6.66 million, the estimated ROI, NPV, IRR, and DPB would be 129.7%, USD 9613, 5%, and 9.98 per year, respectively.
The alternative scenarios suggested that the sustainability of activated carbon for the production of supercapacitors could be improved greatly by reducing the environmental emissions through the recycling of KOH. For instance, the GHG could be further lowered to 83.76%, with the potential upgrading of the AC conversion technology in the alternative cases. However, further research is needed to evaluate the practical feasibility of the suggested alternative routes, especially to investigate the recycling of KOH. As an important source of chemical consumption in the process, the recycling of KOH would not only reduce the environmental burden, but also lower the production cost of the activated carbon. At the same time, the biomass harvesting and logistics are also critical to AC production. The optimization of biomass harvesting and logistics could significantly improve the production of activated carbon from the perspective of the overall feedstock supply chain. In addition, we will also investigate the potential applications of the supercapacitors derived from biomass-based carbon.

Author Contributions

Conceptualization, J.W. and Y.W.; methodology, Y.W. and X.Z.; software, Y.W. and X.Z.; formal analysis, Y.W. and X.Z.; writing—original draft preparation, Y.W.; writing—review and editing, J.W., Y.W., X.Z., D.B. and E.M.S.; project administration, J.W.; funding acquisition, J.W. All authors have read and agreed to the published version of the manuscript.

Funding

This research was partially supported by the USDA National Institute of Food and Agriculture with the Agriculture and Food Research Initiative Competitive Grant No. 2015-67021-22995, 2019-67020-29287, and 2020-68012-31881.

Acknowledgments

We also thank Chirag Mevawala of the Department of Chemical and Biomedical Engineering at West Virginia University for providing valuable advice.

Conflicts of Interest

The authors declare no conflict of interest.

References

  1. Alhashimi, H.A.; Aktas, C.B. Life Cycle Environmental and Economic Performance of Biochar Compared with Activated Carbon: A Meta-Analysis. Resour. Conserv. Recycl. 2017, 118, 13–26. [Google Scholar] [CrossRef] [Green Version]
  2. Arena, N.; Lee, J.; Clift, R. Life Cycle Assessment of Activated Carbon Production from Coconut Shells. J. Clean. Prod. 2016, 125, 68–77. [Google Scholar] [CrossRef] [Green Version]
  3. Bare, J. TRACI 2.0: The tool for the reduction and assessment of chemical and other environmental impacts 2.0. Clean Technol. Environ. Policy 2011, 13, 687–696. [Google Scholar] [CrossRef]
  4. Bergna, D.; Varila, T.; Romar, H.; Lassi, U. Comparison of the Properties of Activated Carbons Produced in One-Stage and Two-Stage Processes. C 2018, 4, 41. [Google Scholar] [CrossRef] [Green Version]
  5. Budsberg, E.; Rastogi, M.; Puettmann, M.E.; Caputo, J.; Balogh, S.; Volk, T.A.; Gustafson, R.; Johnson, L. Life-Cycle Assessment for the Production of Bioethanol from Willow Biomass Crops via Biochemical Conversion. For. Prod. J. 2012, 62, 305–313. [Google Scholar] [CrossRef] [Green Version]
  6. Cao, Y.; Wang, K.; Wang, X.; Gu, Z.; Fan, Q.; Gibbons, W.; Hoefelmeyer, J.D.; Kharel, P.R.; Shrestha, M. Hierarchical Porous Activated Carbon for Supercapacitor Derived from Corn Stalk Core by Potassium Hydroxide Activation. Electrochim. Acta 2016, 212, 839–847. [Google Scholar] [CrossRef] [Green Version]
  7. Chen, Y.; Zhu, Y.; Wang, Z.; Li, Y.; Wang, L.; Ding, L.; Gao, X.; Ma, Y.; Guo, Y. Application Studies of Activated Carbon Derived from Rice Husks Produced by Chemical-Thermal Process—A Review. Adv. Colloid Interface Sci. 2011, 163, 39–52. [Google Scholar] [CrossRef]
  8. Curran, M.A. Life-Cycle Assessment. In Encyclopedia of Ecology; Jørgensen, S.E., Fath, B.D., Eds.; Academic Press: Oxford, UK, 2008; pp. 2168–2174. [Google Scholar] [CrossRef]
  9. Dissanayake, N.P.; Summerscales, J. Life Cycle Assessment for Natural Fibre Composites. Green Compos. Nat. Resour. 2013, 8, 157–186. [Google Scholar]
  10. Meijer, E. Consider Your Audience When Doing Impact Assessment|PRé Sustainability. Quantifying Sustainability. 24 March 2014. Available online: https://www.pre-sustainability.com/news/consider-your-audience-when-doing-lca (accessed on 10 July 2020).
  11. Gallo, A. A Refresher on Payback Method. 2016, Volume 16. Available online: https://hbr.org/2016/04/a-refresher-on-payback-method (accessed on 10 November 2021).
  12. Gamby, J.; Taberna, P.; Simon, P.; Fauvarque, J.; Chesneau, M. Studies and Characterisations of Various Activated Carbons Used for Carbon/Carbon Supercapacitors. J. Power Sources 2001, 101, 109–116. [Google Scholar] [CrossRef]
  13. Goldman, L.L. Crystal Ball Software Tutorial: Crystal Ball Professional Introductory Tutorial. In Proceedings of the 34th Conference on Winter Simulation: Exploring New Frontiers, San Diego, CA, USA, 8 December 2002; pp. 1539–1545. [Google Scholar]
  14. González-García, P. Activated Carbon from Lignocellulosics Precursors: A Review of the Synthesis Methods, Characterization Techniques and Applications. Renew. Sustain. Energy Rev. 2018, 82, 1393–1414. [Google Scholar] [CrossRef]
  15. Gu, H.; Bergman, R.; Anderson, N.; Alanya-Rosenbaum, S. Life Cycle Assessment of Activated Carbon from Woody Biomass. Wood Fiber Sci. 2018, 50, 229–243. [Google Scholar] [CrossRef] [Green Version]
  16. Hassan, M.F.; Sabri, M.A.; Fazal, H.; Hafeez, A.; Shezad, N.; Hussain, M. Recent Trends in Activated Carbon Fibers Production from Various Precursors and Applications—A Comparative Review. J. Anal. Appl. Pyrolysis 2020, 145, 104715. [Google Scholar] [CrossRef]
  17. Hjaila, K.; Baccar, R.; Sarra, M.; Gasol, C.; Blánquez, P. Environmental Impact Associated with Activated Carbon Preparation from Olive-Waste Cake via Life Cycle Assessment. J. Environ. Manag. 2013, 130, 242–247. [Google Scholar] [CrossRef] [PubMed]
  18. Huijbregts, M.A.J.; Rombouts, L.J.A.; Ragas, A.M.J.; Van De Meent, D. Human-Toxicological Effect and Damage Factors of Carcinogenic and Noncarcinogenic Chemicals for Life Cycle Impact Assessment. Integr. Environ. Assess. Manag. 2005, 1, 181–244. [Google Scholar] [CrossRef]
  19. Jiang, C.; Yakaboylu, G.A.; Yumak, T.; Zondlo, J.W.; Sabolsky, E.M.; Wang, J. Activated carbons prepared by indirect and direct CO2 activation of lignocellulosic biomass for supercapacitor electrodes. Renew. Energy 2020, 155, 38–52. [Google Scholar] [CrossRef]
  20. Jiang, Y.; Bhattacharyya, D. Techno-economic analysis of a novel indirect coal–biomass to liquids plant integrated with a combined cycle plant and CO2 capture and storage. Ind. Eng. Chem. Res. 2016, 55, 1677–1689. [Google Scholar] [CrossRef]
  21. Kötz, R.; Carlen, M. Principles and Applications of Electrochemical Capacitors. Electrochim. Acta 2000, 45, 2483–2498. [Google Scholar] [CrossRef]
  22. Li, X.; Xing, W.; Zhuo, S.; Zhou, J.; Li, F.; Qiao, S.Z.; Lu, G. Preparation of Capacitor’s Electrode from Sunflower Seed Shell. Bioresour. Technol. 2011, 102, 1118–1123. [Google Scholar] [CrossRef] [PubMed]
  23. Li, K.; Leigh, W.; Feron, P.; Yu, H.; Tade, M. Systematic study of aqueous monoethanolamine (MEA)-based CO2 capture process: Techno-economic assessment of the MEA process and its improvements. Appl. Energy 2016, 165, 648–659. [Google Scholar] [CrossRef]
  24. Liu, W.; Wang, J.; Richard, T.; Hartley, D.; Spatari, S.; Volk, T. Economic and life cycle assessments of biomass utilization for bioenergy products. Biofuels Bioprod. Biorefining 2017, 11, 633–647. [Google Scholar] [CrossRef]
  25. Liu, W.; Wang, J.; Bhattacharyya, D.; Jiang, Y.; DeVallance, D. Economic and environmental analyses of coal and biomass to liquid fuels. Energy 2017, 141, 76–86. [Google Scholar] [CrossRef]
  26. Montes, V.; Hill, J. Activated Carbon Production: Recycling KOH to Minimize Waste. Mater. Lett. 2018, 220, 238–240. [Google Scholar] [CrossRef]
  27. Muralikrishna, I.V.; Manickam, V. (Eds.) Chapter Five—Life Cycle Assessment. In Environmental Management; Butterworth-Heinemann: Oxford, UK, 2017; pp. 57–75. Available online: https://www.sciencedirect.com/science/article/pii/B9780128119891000051?via%3Dihub (accessed on 20 July 2020).
  28. Ng, C.; Marshall, W.E.; Rao, R.M.; Bansode, R.R.; Losso, J.N. Activated carbon from pecan shell: Process description and economic analysis. Ind. Crops Prod. 2003, 17, 209–217. [Google Scholar] [CrossRef]
  29. Nor, N.M.; Lau, L.C.; Lee, K.T.; Mohamed, A.R. Synthesis of activated carbon from lignocellulosic biomass and its applications in air pollution control—A review. J. Environ. Chem. Eng. 2013, 1, 658–666. [Google Scholar]
  30. Obreja, V.V. On the performance of supercapacitors with electrodes based on carbon nanotubes and carbon activated material—A review. Phys. E Low-Dimens. Syst. Nanostruct. 2008, 40, 2596–2605. [Google Scholar] [CrossRef]
  31. Phillips, J.J. Return on Investment in Training and Performance Improvement Programs; Routledge: London, UK, 2012. [Google Scholar]
  32. Portet, C.; Taberna, P.L.; Simon, P.; Flahaut, E. Influence of Carbon Nanotubes Addition on Carbon-Carbon Supercapacitor Performances in Organic Electrolyte. J. Power Sources 2005, 139, 371–378. [Google Scholar] [CrossRef]
  33. PRé Consultants. DatabaseManualMethods 9.0. 2020. Available online: https://simapro.com/wp-content/uploads/2020/10/DatabaseManualMethods.pdf (accessed on 10 August 2020).
  34. Rivera, X.C.S.; Bacenetti, J.; Fusi, A.; Niero, M. The influence of fertiliser and pesticide emissions model on life cycle assessment of agricultural products: The case of Danish and Italian barley. Sci. Total Environ. 2017, 592, 745–757. [Google Scholar] [CrossRef] [Green Version]
  35. Ross, S.; Randolph, W. Corporate Finance. In Times Mirror Magazine; McGraw-Hill Inc.: New York, NY, USA, 1988; Volume 1. [Google Scholar]
  36. Rufford, T.; Hulicova-Jurcakova, D.; Zhu, Z.; Lu, G. Nanoporous carbon electrode from waste coffee beans for high performance supercapacitors. Electrochem. Commun. 2008, 10, 1594–1597. [Google Scholar] [CrossRef]
  37. Shaffie, S.S.; Jaaman, S.H. Monte Carlo on Net Present Value for Capital Investment in Malaysia. Procedia Soc. Behav. Sci. 2016, 219, 688–693. [Google Scholar] [CrossRef] [Green Version]
  38. Simon, B.; Tamaska, L.; Kováts, N. Analysis of Global and Local Environmental Impacts of Bus Transport by LCA Methodologies. Hung. J. Ind. Chem. 2010, 38, 155–158. [Google Scholar]
  39. Sinan, N.; Unur, E. Hydrothermal conversion of lignocellulosic biomass into high-value energy storage materials. J. Energy Chem. 2017, 26, 783–789. [Google Scholar] [CrossRef] [Green Version]
  40. Singh, D.; Croiset, E.; Douglas, P.L.; Douglas, M.A. Techno-economic study of CO2 capture from an existing coal-fired power plant: MEA scrubbing vs. O2/CO2 recycle combustion. Energy Convers. Manag. 2003, 44, 3073–3091. [Google Scholar] [CrossRef]
  41. Stavropoulos, G.; Zabaniotou, A. Minimizing activated carbons production cost. Fuel Process. Technol. 2009, 90, 952–957. [Google Scholar] [CrossRef]
  42. Subramanian, V.; Luo, C.; Stephan, A.M.; Nahm, K.S.; Thomas, S.; Wei, B. Supercapacitors from Activated Carbon Derived from Banana Fibers. J. Phys. Chem. C 2007, 111, 7527–7531. [Google Scholar] [CrossRef]
  43. Sun, L.; Tian, C.; Li, M.; Meng, X.; Wang, L.; Wang, R.; Yin, J.; Fu, H. From coconut shell to porous graphene-like nanosheets for high-power supercapacitors. J. Mater. Chem. A 2013, 1, 6462–6470. [Google Scholar] [CrossRef]
  44. Świątkowski, A. Industrial Carbon Adsorbents. In Studies in Surface Science and Catalysis; Dąbrowski, A., Ed.; Adsorption and Its Applications in Industry and Environmental Protection; Elsevier: Amsterdam, The Netherlands, 1999; Volume 120, pp. 69–94. [Google Scholar] [CrossRef]
  45. Teo, E.Y.L.; Muniandy, L.; Ng, E.-P.; Adam, F.; Mohamed, A.R.; Jose, R.; Chong, K.F. High surface area activated carbon from rice husk as a high performance supercapacitor electrode. Electrochim. Acta 2016, 192, 110–119. [Google Scholar] [CrossRef] [Green Version]
  46. Tran, H.N.; You, S.-J.; Chao, H.-P. Fast and efficient adsorption of methylene green 5 on activated carbon prepared from new chemical activation method. J. Environ. Manag. 2017, 188, 322–336. [Google Scholar] [CrossRef]
  47. Turton, R.; Bailie, R.C.; Whiting, W.B.; Shaeiwitz, J.A. Analysis, Synthesis, and Design of Chemical Processes, 5th ed.; Prentice Hall: Upper Saddle River, NJ, USA, 2018. [Google Scholar]
  48. U.S. Bureau of Labor Statistics, Producer Price Index by Commodity for Machinery and Equipment: General Purpose Machinery and Equipment [WPU114], Retrieved from FRED, Federal Reserve Bank of St. Louis. Available online: https://fred.stlouisfed.org/series/WPU114 (accessed on 5 November 2019).
  49. U.S. Life Cycle Inventory Database. National Renewable Energy Laboratory. 2012. Available online: https://www.lcacommons.gov/nrel/search (accessed on 19 November 2019).
  50. Veeramani, V.; Sivakumar, M.; Chen, S.-M.; Madhu, R.; Alamri, H.R.; Alothman, Z.A.; Hossain, S.A.; Chen, C.-K.; Yamauchi, Y.; Miyamoto, N.; et al. Lignocellulosic biomass-derived, graphene sheet-like porous activated carbon for electrochemical supercapacitor and catechin sensing. RSC Adv. 2017, 7, 45668–45675. [Google Scholar] [CrossRef] [Green Version]
  51. Wang, Y.; Wang, J.; Zhang, X.; Grushecky, S. Environmental and Economic Assessments and Uncertainties of Multiple Lignocellulosic Biomass Utilization for Bioenergy Products: Case Studies. Energies 2020, 13, 6277. [Google Scholar] [CrossRef]
  52. Wang, Y.; Wang, J.; Schuler, J.; Hartley, D.; Volk, T.; Eisenbies, M. Optimization of harvest and logistics for multiple lignocellulosic biomass feedstocks in the northeastern United States. Energy 2020, 197, 117260. [Google Scholar] [CrossRef]
  53. Wernet, G.; Bauer, C.; Steubing, B.; Reinhard, J.; Moreno-Ruiz, E.; Weidema, B. The ecoinvent database version 3 (part I): Overview and methodology. Int. J. Life Cycle Assess. 2016, 21, 1218–1230. Available online: http://link.springer.com/10.1007/s11367-016-1087-8 (accessed on 1 January 2020). [CrossRef]
  54. Yakaboylu, G.A.; Jiang, C.; Yumak, T.; Zondlo, J.W.; Wang, J.; Sabolsky, E.M. Engineered hierarchical porous carbons for supercapacitor applications through chemical pretreatment and activation of biomass precursors. Renew. Energy 2021, 163, 276–287. [Google Scholar] [CrossRef]
  55. Yakaboylu, G.A.; Yumak, T.; Jiang, C.; Zondlo, J.W.; Wang, J.; Sabolsky, E.M. Preparation of Highly Porous Carbon through Slow Oxidative Torrefaction, Pyrolysis, and Chemical Activation of Lignocellulosic Biomass for High-Performance Supercapacitors. Energy Fuels 2019, 33, 9309–9329. [Google Scholar] [CrossRef]
  56. Zhao, M.; Yang, J.; Zhao, N.; Liu, Y.; Wang, Y.; Wilson, J.P.; Yue, T. Estimation of China’s Forest Stand Biomass Carbon Sequestration Based on the Continuous Biomass Expansion Factor Model and Seven Forest Inventories from 1977 to 2013. For. Ecol. Manag. 2019, 448, 528–534. [Google Scholar] [CrossRef]
Figure 1. Study system boundary of the activated carbon production from lignocellulosic biomass.
Energies 15 00351 g001
Figure 2. A mass balance and flow of activated carbon production for high-performance supercapacitor.
Energies 15 00351 g002
Figure 3. Normalized results of life-cycle impact assessment of energy-storage activated carbon, in ten impact categories.
Energies 15 00351 g003
Figure 4. Percentage of life-cycle environmental impacts of environmental indicators by process components, for biomass feedstock logistics only.
Energies 15 00351 g004
Figure 5. The impacts of activated carbon selling price on economic indices: (a) accumulated NPV, (b) IRR, (c) ROI, and (d) DPB.
Energies 15 00351 g005
Figure 6. Normalized results of life-cycle impacts of activated carbon production using alternative scenarios: (1) non-recycling of KOH activation—baseline case; (2) partial recycling KOH activation; and (3) Steam activation for general-purpose AC.
Energies 15 00351 g006
Figure 7. Net present value (NPV) uncertainty for an AC plant using lignocellulosic biomass.
Energies 15 00351 g007
Table 1. Impact factors for the TEA uncertainty analysis.
ItemBase Case ValueProbability Distribution
Labor rate (USD per hour)18.58Beta (4.8,2.7) min = 7.25 max = 25
Raw materials delivered cost (USD per dry Mg)80Beta (2,9) min = 69 max = 130
KOH price (USD per dry Mg)750Uniform (500,1000)
Lang factor3.63Beta (2.3,5) min = 3 max = 5
Days operated (day)320Beta (3,3) min = 310 max = 330
Production price (USD per Kg)17Beta (6,6.5) min = 5 max = 30
Discount rate (%)5Uniform (5,10)
Table 2. Environmental inputs and outputs for energy-storage activated carbons (ACs) from cradle-to-gate, on a per ton (1000 kg) basis.
AmountUnit
Product
AC1000kg
Feedstock consumed
Multiple Lignocellulosic Biomass8940Dry kg
Input
Diesel80.56L
Lubricating oil0.78kg
Ammonium sulphate, as N51.00kg
Glyphosate0.18kg
Electricity669.83kWh
Potassium hydroxide (KOH)22,560.00kg
Output
Butadiene3.39 × 10−5kg
Acetaldehyde6.65 × 10−4kg
Acrolein8.02 × 10−5kg
Benzene8.09 × 10−4kg
Carbon dioxide, fossil1.03 × 104kg
Carbon monoxide, fossil4.58kg
Formaldehyde1.02 × 10−3kg
Methane, fossil8.31 × 10−3kg
Nitrogen oxides3.35kg
Nitrogen oxides2.76kg
PAH, polycyclic aromatic hydrocarbons1.46 × 10−4kg
Particulates, >2.5 µm, and <10 µm9.57 × 10−2kg
Propene2.24 × 10−3kg
Toluene3.55 × 10−4kg
Sulfur monoxide4.96 × 10−2kg
VOC, volatile organic compounds, unspecified origin9.79 × 10−2kg
Xylene2.47 × 10−4kg
Dinitrogen monoxide2.08 × 10−3kg
water3.21 × 103kg
Oxygen1.14 × 103kg
Nitrogen3.15 × 10−4kg
Dust92.4g
Tar (as naphthalene)9.23kg
Table 3. Assumptions of the base case for a plant producing energy-storage AC.
ParameterUnitAmount
Plant CapacityDry Tons/day3
Days OperatedDays/year320
Plant LifeYear10
Feedstock Delivery CostUSD/dry Mg80
KOH Purchase PriceUSD/dry Mg750
AC Yield Rate% of dry feedstock11.19
Table 4. LCA impact indicators for the activated carbon production.
Impact CategoryUnitTotal
Ozone depletionkg CFC-11 eq2.62 × 10−3
Global warmingkg CO2 eq6.28 × 104
Smogkg O3 eq2.23 × 103
Acidificationkg SO2 eq2.06 × 102
Eutrophicationkg N eq1.07 × 102
CarcinogenicsCTUh2.27 × 10−3
Non carcinogenicsCTUh1.04 × 10−2
Respiratory effectskg PM2.5 eq14.1
EcotoxicityCTUe2.26 × 105
Fossil fuel depletionMJ surplus7.18 × 104
Table 5. Percentage of life-cycle environmental impacts of environmental indicators by process components.
Impact CategoryEstablishment %Harvest %Transport %Storage %AC Conversion %
Ozone depletion0.33110.00510.00660.045999.6112
Global warming0.40910.11350.15740.016799.3033
Smog2.10941.36090.70720.019295.8034
Acidification0.86470.45160.26480.022298.3966
Eutrophication0.30110.06780.04860.023799.5588
Carcinogenics0.34990.05410.06970.026899.4996
Non carcinogenics0.48910.11220.14520.028299.2253
Respiratory effects0.58470.13130.06070.027699.1957
Ecotoxicity0.52180.13190.17100.023999.1513
Fossil fuel depletion0.69070.19950.25860.016098.8352
Table 6. Capital costs for a biomass-derived AC plant used for energy storage.
Item AmountCost (USD)
Hammer mill 228,657
Two glass-lined soak tanks 2254,727
Rotary dryer 123,881
Two rotary kilns 2652,739
Rotary cooler 1103,483
Two glass-lined wash tanks 2254,727
Two glass-lined recovery tanks 2264,280
Two glass-lined storage tanks 2222,886
Rotary dryer 123,881
Sieve 14776
Equipment Cost 1,834,037
Capital Cost C T M 6,657,555
Table 7. Annual operating costs for an AC plant used for energy-storage purposes.
Item Annual Cost (USD)
Lignocellulosic feedstock 686,327
KOH 11,915,401
Raw Materials C R M 12,601,728
Electricity 77,000
Water 14,000
Natural gas 268,000
Utility C U T 359,000
Operating labor C O L 94,944
Direct supervisory and clerical labor 0.18 × C O L 17,090
Operating supplies 0.009 × C T M 59,918
Maintenance and repairs 0.06 × C T M 399,453
Laboratory charges 0.015 × C O L 14,242
Plant overhead costs 0.708 × C O L + 0.036 × C T M 306,892
Local taxes and insurance 0.032 × C T M 213,042
Patents and royalties 0.03 × C O M 102,272
Depreciation 0.1 × C T M 665,755.50
a. Administration costs 0.177 × C O L + 0.009 × C T M 76,723
b. Distribution and selling costs 0.11 × C O M 374,997
c. Research and development 0.05 × C O M 170,453
General Manufacturing Expenses 1,287,929
Total Operation Costs 15,456,509
Table 8. Economic evaluation for an AC plant used for energy-storage purposes.
Economic IndicesAmount
Total Investment Cost (USD) 6,657,555
Total Operating Cost (USD) 154,565,090
Total Income (USD) 163,200,000
Return on Investment (ROI) 129.70%
Net Present Value (NPV) (USD) 9613
Internal Rate of Return (IRR)5%
Discounted Payback Period (DPB) (years)9.98
Publisher’s Note: MDPI stays neutral with regard to jurisdictional claims in published maps and institutional affiliations.

