Article

Numerical Analysis of Thermal Stress for a Stack of Planar Solid Oxide Fuel Cells †

1
Faculty of Maritime and Transportation, Ningbo University, Ningbo 315211, China
2
Marine Engineering Institute, Jimei University, Xiamen 361021, China
3
Department of Energy Conversion and Storage, Technical University of Denmark, 2800 Lyngby, Denmark
*
Author to whom correspondence should be addressed.
This paper is an extended version of our paper in proceedings of the 17th International Symposium on Solid Oxide Fuel Cells (SOFC-XVII), Digital Meeting, 18–23 July 2021.
Energies 2022, 15(1), 343; https://doi.org/10.3390/en15010343
Submission received: 8 December 2021 / Revised: 28 December 2021 / Accepted: 30 December 2021 / Published: 4 January 2022

Abstract

:
In this work, a 3D multi-physics coupled model was developed to analyze the temperature and thermal stress distribution in a planar solid oxide fuel cell (SOFC) stack, and then the effects of different flow channels (co-flow, counter-flow and cross-flow) and electrolyte thickness were investigated. The simulation results indicate that the generated power is higher while the thermal stress is lower in the co-flow mode than those in the cross-flow mode. In the cross-flow mode, a gas inlet and outlet arrangement is proposed to increase current density by about 10%. The generated power of the stack increases with a thin electrolyte layer, but the temperature and its gradient of the stack also increase with increase of heat generation. The thermal stress for two typical sealing materials is also studied. The predicted results can be used for design and optimization of the stack structure to achieve lower stress and longer life.

1. Introduction

As a new power generation technology, a solid oxide fuel cell (SOFC) converts chemical energy directly into electrical energy through electrochemical reactions at a high temperature [1,2,3,4]. Compared with other new energy technology, SOFCs have obvious advantages, such as high thermal efficiency with good fuel flexibility [5]. However, in the operating temperature range of 700~1000 °C, cracks and structure damage may occur in SOFC stacks due to a mismatch of thermal expansion coefficients (CTE) of the various functional components involved [6,7,8,9,10]. In the operating process, high temperature gradients and thermal stress generated by the electrochemical reactions may lead to performance degradation and even failure [11,12,13,14]. Therefore, it is of great significance to analyze the maximum thermal stress and its distribution, as well as influencing factors.
At present, experimental determination of the thermal stress is limited to non-in situ testing by scanning electron microscopy and X-ray methods after SOFC stack operating, cooling and disassembly; however, the obtained results do not accurately reflect the real evolution process during the operation [15,16,17]. The in situ study of the thermal stress is mainly based on theoretical analysis, modeling and numerical simulation. There are some previous investigations analyzing the thermal stress distributions in the SOFC stack by considering the temperature gradient, the mismatch of CTE and the sealing material behavior, etc. [18,19,20,21]. Lin et al. developed a 3D model for a 3-cell SOFC stack, taking into account for the first time the complete structure including electrodes, interconnect, Ni grid and seal, aiming to analyze effects of the supporting as well as seal material properties on the potential failure locations of the SOFC stack based on the coupled CFD/FEM method [19]. The results show that the seals may be damaged by shear stress at the room temperature, and the mismatch in CTE of the components contributes more to the thermal stress than the temperature gradient. Chang et al. obtained the temperature distribution function and thermal stress characteristics of a planar SOFC stack through the simulation by star-CD commercial software [18]. Their results show that, under the higher current and temperature gradient, PEN (Positive/Electrolyte/Negative) can increase the maximum principal stress. Selimovic et al. established the electrochemical, thermal and structural coupling models for both the steady-state and transient thermal stress of SOFC stack. The location where the maximum thermal stress occurs with reforming methane as the fuel is identified, the thermal stress values at different heating rates are also predicted [20]. Xu et al. studied the influence of gas flow channel designs and external constraints on the thermal stress; it was found that the co-flow design arrangement can reduce the thermal stress, and the additional stress generated by a fixed external force may be one of the factors causing the stack fracture [21].
The effects of the assembly force were also investigated. The findings indicate that the deformation of PEN can be reduced and good sealing performance can be maintained with a suitable compressive loading of 0.6 MPa [7]. Pekson et al. developed a full-scale model for a SOFC short stack to reveal the thermomechanical response in the furnace environment, as well as to analyze the long-term creeping behavior of the critical components under the different environments [22]. Fang et al. analyzed the influence of the stack temperature distribution on the mechanical stress and the creep strain, as well as the mechanical failure probability of the key components. The effects of the electrode materials and the oxidation process on the stack mechanical properties were studied [23]. The effect of the volume fraction of Ni employed in the anodes on the thermal stress was investigated by Song et al. by considering the physical and chemical properties of various temperature-dependent materials [24].
In the SOFC stack, the interface between the adjacent cells requires a sealant as a gasket to prevent the leakage of gas [25,26]. Glass or glass-ceramic are rigid seals that can achieve a good sealing effect during the operation without a compress load [7,10]. In the recent years, the flexible mica-based compression seals have also attracted some attention. If the seal is not glued and not compatible, individual stack components can expand and contract freely during a thermal cycling. The interface between the cell and the interconnect is easily separated by the stress and creep of the material [27,28,29], which may cause the leakage of the gas, and further the overall performance degradation [30].
A lot of research work has been presented on the thermal stress of SOFC stacks, but most of these studies focus on the analysis of the thermal stress distribution characteristics. There are few studies on the key parameters of the geometric dimensions and comparative analysis under different flow modes. In order to save calculation time and improve the convergence of the model, many previous simulations adopted the method of simplifying the heat source. In this work, a multi-physics coupling model of the entire stack structure is established to solve the flow, electrochemical reactions, heat and mass transfer processes in the stack. The purpose of this paper is to present a numerical approach for evaluating the distribution of the thermal stress inside the SOFC stack, as well as to identify the locations of the stack that is prone to rupture and failure, which play a guiding role in the design of the stack. A finite element method for a three-cell SOFC stack is applied in this paper. Based on the thermo-electrochemical processes coupled in the developed model, the distribution of the temperature and its gradient, the produced current density, as well as the gas distribution within the stack are predicted and presented for various typical operating circumstances. The impacts of the gas flow channel design and the thickness of the electrolyte layer on the overall performance and the stress distributions are assessed and analyzed. The results of this work have a better understanding of the potential rupture and failure caused by the thermal stress inside the SOFC stack, and will also be helpful to the design of the stack.

2. Model Description and Governing Equations

2.1. Model Geometry and Assumptions

In this work, three flow channel configurations were studied (co-, counter- and cross-flow), as shown in Figure 1. PEN, a sealing component, and a bipolar plate make up the repeating unit cell for the stack. The PEN active size is 91 mm x 91 mm, with a thickness of 400 μm for the anode (Ni-YSZ), 70 μm for the cathode (LSM-YSZ), and 10 μm for the electrolyte layer (YSZ). The ribs have a width of 2 mm and a thickness of 1 mm, while the width of flow channels is 5 mm. Since the average flow velocity of fuel gas inside the stack is less than 1 m/s, and the average flow velocity of air is less than 3 m/s, the calculated Reynolds numbers are 2 and 36, respectively. Therefore, the flow is set to be laminar, and both fuel and air are considered as the ideal gas.

2.2. Governing Equations

2.2.1. Electrochemical Reaction Model

The reactions that occur inside the cell can be expressed as:
2 H 2 + 2 O 2 2 H 2 O + 4 e
O 2 + 4 e 2 O 2
The oxidation of hydrogen occurs in the anode activation region, and oxygen is converted into oxide ions at the cathode which further transfers to the anode side through the electrolyte layer. The redox reactions are accompanied by charge transfer reaction, in which one mole of oxygen reacts with the transfer of 4 moles of electrons.
The operating voltage of the cell is calculated by open circuit voltage (EOCV), activation loss ( η a c t ), concentration loss ( η c o n c ) and ohmic loss ( η o h m ):
E = E O C V η a c t + η o h m + η c o n c
where the open circuit voltage can be calculated as:
E O C V = E 0 + R T 2 F ln c r e f H 2 c r e f O 2 0.5 c r e f H 2 O + R T 4 F ln p
E0 is only a function of temperature, independent of the pressure and concentration of the reactants, obtained by the following formula:
E 0 = 1.253 2.4516 × 10 4 T
The model employs the Butler–Volmer formula to express the relationship between the activation current and the activation polarization as well as the concentration polarization [31], as follows:
i a = A v a i 0 a c H 2 c r e f H 2 exp α a n a F η a c t a + η c o n c a R T c H 2 O c r e f H 2 O exp 1 α a n a F η a c t a + η c o n c a R T
i c = A v c i 0 c exp α c n c F η a c t c + η c o n c c R T c O 2 c r e f O 2 exp 1 α c n c F η a c t c + η c o n c c R T
where the superscript a and c refer to the anode and cathode, respectively. Av represents the effective reaction specific surface area of the active electrode (m2/m3) with relation to the TPB (Three-Phase Boundary) length. α denotes the transfer coefficients, and n represents the number of electrons transferred by the electrochemical reactions. The concentration of the gas component i is represented by ci. i0 characterizes the reactivity of the electrode under the effect of the equilibrium potential, which is one of the critical factors controlling the cell overall efficiency, the expressions are as follows [32]:
i 0 = R T n F A i × exp E a R T
in which Ai is the pre-referential factor for the electrodes, while Ea is the reaction activation energy given in Table 1.
The transfer process of the electrons and ions inside SOFC can be described by the equation of t conservation of the electric potentials:
i i = σ i e Φ i
i e = σ e e Φ e
where Φ e and Φ i refer to the electric potentials of electrons and ions, respectively. σ i e and σ e e refer to the ionic conductivity and electronic conductivity, respectively. i refers to the activation current generated when electrons and ions exchange charges. Among the SOFC functional materials, the main electron-conducting materials are LSM in the porous cathode, Ni in the porous anode, as well as the collector plate. The ion-conducting materials are YSZ in the electrode and electrolyte. Their conductivity is the temperature dependent, expressed as follows:
σ e l e c t r o n , a = 4.2 × 10 7 T exp 1200 T
σ e l e c t r o n , c = 9.5 × 10 7 T exp 1150 T
σ i o n = 3.34 × 10 4 × exp 10300 T
While in the porous electrodes, the effect of porosity on the conductivity also needs to be taken into account, resulting in an effective expression for the electron/ion conductivity:
σ e f f = 1 ε τ σ × V e f f
where τ is the tortuosity for the electron/ion conduction (i.e., the ratio of the actual path length inside the porous electrode to the straight-line distance), ε is the porosity. Veff is the volume ratio of various materials in the porous structures, i.e., the volume percentage occupied by Ni, YSZ and LSM, respectively. The parameters employed in these electrochemical reactions are listed in Table 1.

2.2.2. Gas Flow

The Navier-Stokes equation is applied for the gas flow in the channels, while the Darcy term is added to represent the momentum conservation in the porous electrodes:
· ρ v = S m a s s
ρ v · v = p + · μ v + v 2 3 μ v ε μ v k
where v is the velocity vector and k is the permeability. For the fuel and generated H2O at the anode and the air at the cathode side, the average density ( ρ ) and dynamic viscosity ( μ ) of the gas mixture can be calculated from the average of the individual gas component:
ρ = p x i M i R T
μ = x i μ i
where x represents the molar fraction, M represents the molar mass, and the subscript i represents the substance component.
The mass source terms for two electrodes are formulated as:
S m a s s a n = M H 2 O M H 2 i 2 F
S m a s s c a = M O 2 i 4 F

2.2.3. Gas Species Transport

The electrochemical reactions take place at the electrode TPB regions. The gas must diffuse through the porous electrodes to reach the active reaction regions, in which the Knudsen diffusion is prominent. The governing equation for the mass conservation in the diffusion of gas species is given as:
· j i + ρ ε v · ω i = S i
S H 2 = M H 2 i 2 F
S H 2 O = M H 2 O i 2 F
S O 2 = M O 2 i 4 F
j i = ρ D i m k ω i
D i m k = ε τ 1 D i m + 1 D i k 1
where S represents the mass source term, which represents the change in the mass of the gas species due to the electrochemical reactions, ω is the mass fraction, j is the mass flow rate, and Dmk is the effective diffusion coefficient determined from Fick’s diffusion coefficient (Dm) and Knudsen’s diffusion coefficient (Dk) [6].

2.2.4. Heat Transfer

The governing equation of the heat transfer is:
ρ C p v · T = λ e f f T + Q
where Q is the heat source term from the electrochemical reactions, Cp is the specific heat capacity, and λ e f f is the effective thermal conductivity determined by:
λ e f f = 1 ε λ s + ε λ g
where the subscripts s and g represent the solid materials and gases, respectively.
The heat source term mainly consists of the electrochemical reaction generated heat and the ohmic heat generated when the current passes through the solid materials in the porous electrodes, electrolytes and connectors:
Q = Q o h m + Q a c t
Q o h m = σ i e Φ i 2 + σ e e Φ e 2
Q a c t = η a c t S V i
where SV is the ratio between the electrochemical reaction active area to the volume. Table 2 lists the parameters applied:

2.2.5. Thermal Stress-Strain Relation

All the solid materials used for the SOFC stack are assumed to be linearly elastic materials, and the deformation produced by the thermal stress is minimal. The thermal stress tensor is written as:
σ = D ε e l + σ 0
where σ is the stress tensor, σ 0 is the initial stress, ε e l is the elastic strain and D is the elastic matrix.
The elastic matrix of the isotropic materials is determined by elastic modulus (E) and Poisson’s ratio (v):
D = E 1 + v 1 2 v 1 v v v 0 0 0 v 1 v v 0 0 0 v v 1 v 0 0 0 0 0 0 1 2 v 2 0 0 0 0 0 0 1 2 v 2 0 0 0 0 0 0 1 2 v 2
The total strain consists of the elastic strain, thermal strain ( ε t h ), creep strain ( ε c r ) and initial strain:
ε = ε e l + ε t h + ε c r + ε 0
where ε can be expressed by displacement vector (u):
ε = u + u 2
while the thermal strain can be calculated by the following formula:
ε t h = α T T r e f
where α is the thermal expansion coefficient, and Tref is the stress-free temperature.
After heated, the stack will experience a gradual relaxation of the thermal tension during the reduction phase. Table 3 lists the parameters used:
Where Young’s modulus represents the ratio of the stress in the unidirectional stress state to the strain in that direction, CTE is a physical quantity that measures the degree of thermal expansion of a solid material and Poisson’s ratio is the elastic constant reflecting the transverse deformation of the material.

2.3. Boundary Condition and Validation of the Model

The inlet boundary conditions are assumed to be the same for the stack with the different flow configurations, which is also true for the initial conditions. The fuel composition is 97% hydrogen and 3% water, with an inlet rate of 1500 sccm. While the gas flow rate of air is 4500 sccm. The SOFC stack is operated at 800 °C and the inlet temperature is also 800 °C. The top and bottom surfaces of the stack are set as adiabatic boundaries, the other surfaces as the natural convection and radiation heat transfer with the environment. The convective heat transfer coefficient is 2 W∙m−2∙K−1 [37] and the emissivity coefficient 0.3 [38], respectively.
An important setting parameter for calculating thermal stress is the free stress temperature Tf. The recent investigations have shown that the reduction of the nickel oxide to nickel under a reducing atmosphere at 800 °C releases all strains [39]. Consequently, Tf = 800 °C is employed in the current work.
The commercial software COMSOL Multiphysics 5.5 was used for the simulation in this work including geometry, mesh and solve. To assess the reliability of the model, grid-independent tests were carried out. The maximum temperature of a single-layer stack is predicted for various grid numbers. It is found that the variance range of the highest temperature is less than 1% when the number of grids surpasses 0.5 × 10⁶, as shown in Figure 2b), i.e., the simulation results are independent of the number of the grids employed.
The predicted I-V curve is compared with the relevant experimental data at the same condition [34], as shown in Figure 2. The prediction is also presented in Table 4. It is found that the associated root mean square error (RMSE) is around 1%, indicating that the simulation and experimental results are in good agreement. The following equation is used to evaluate the RMSE:
R M S E = x 1 x e 1 x e 1 2 + x 2 x e 2 x e 2 2 + + x n x e n x e n 2 n
where xn is the simulated value, while xe is the experimental one.

3. Results and Discussion

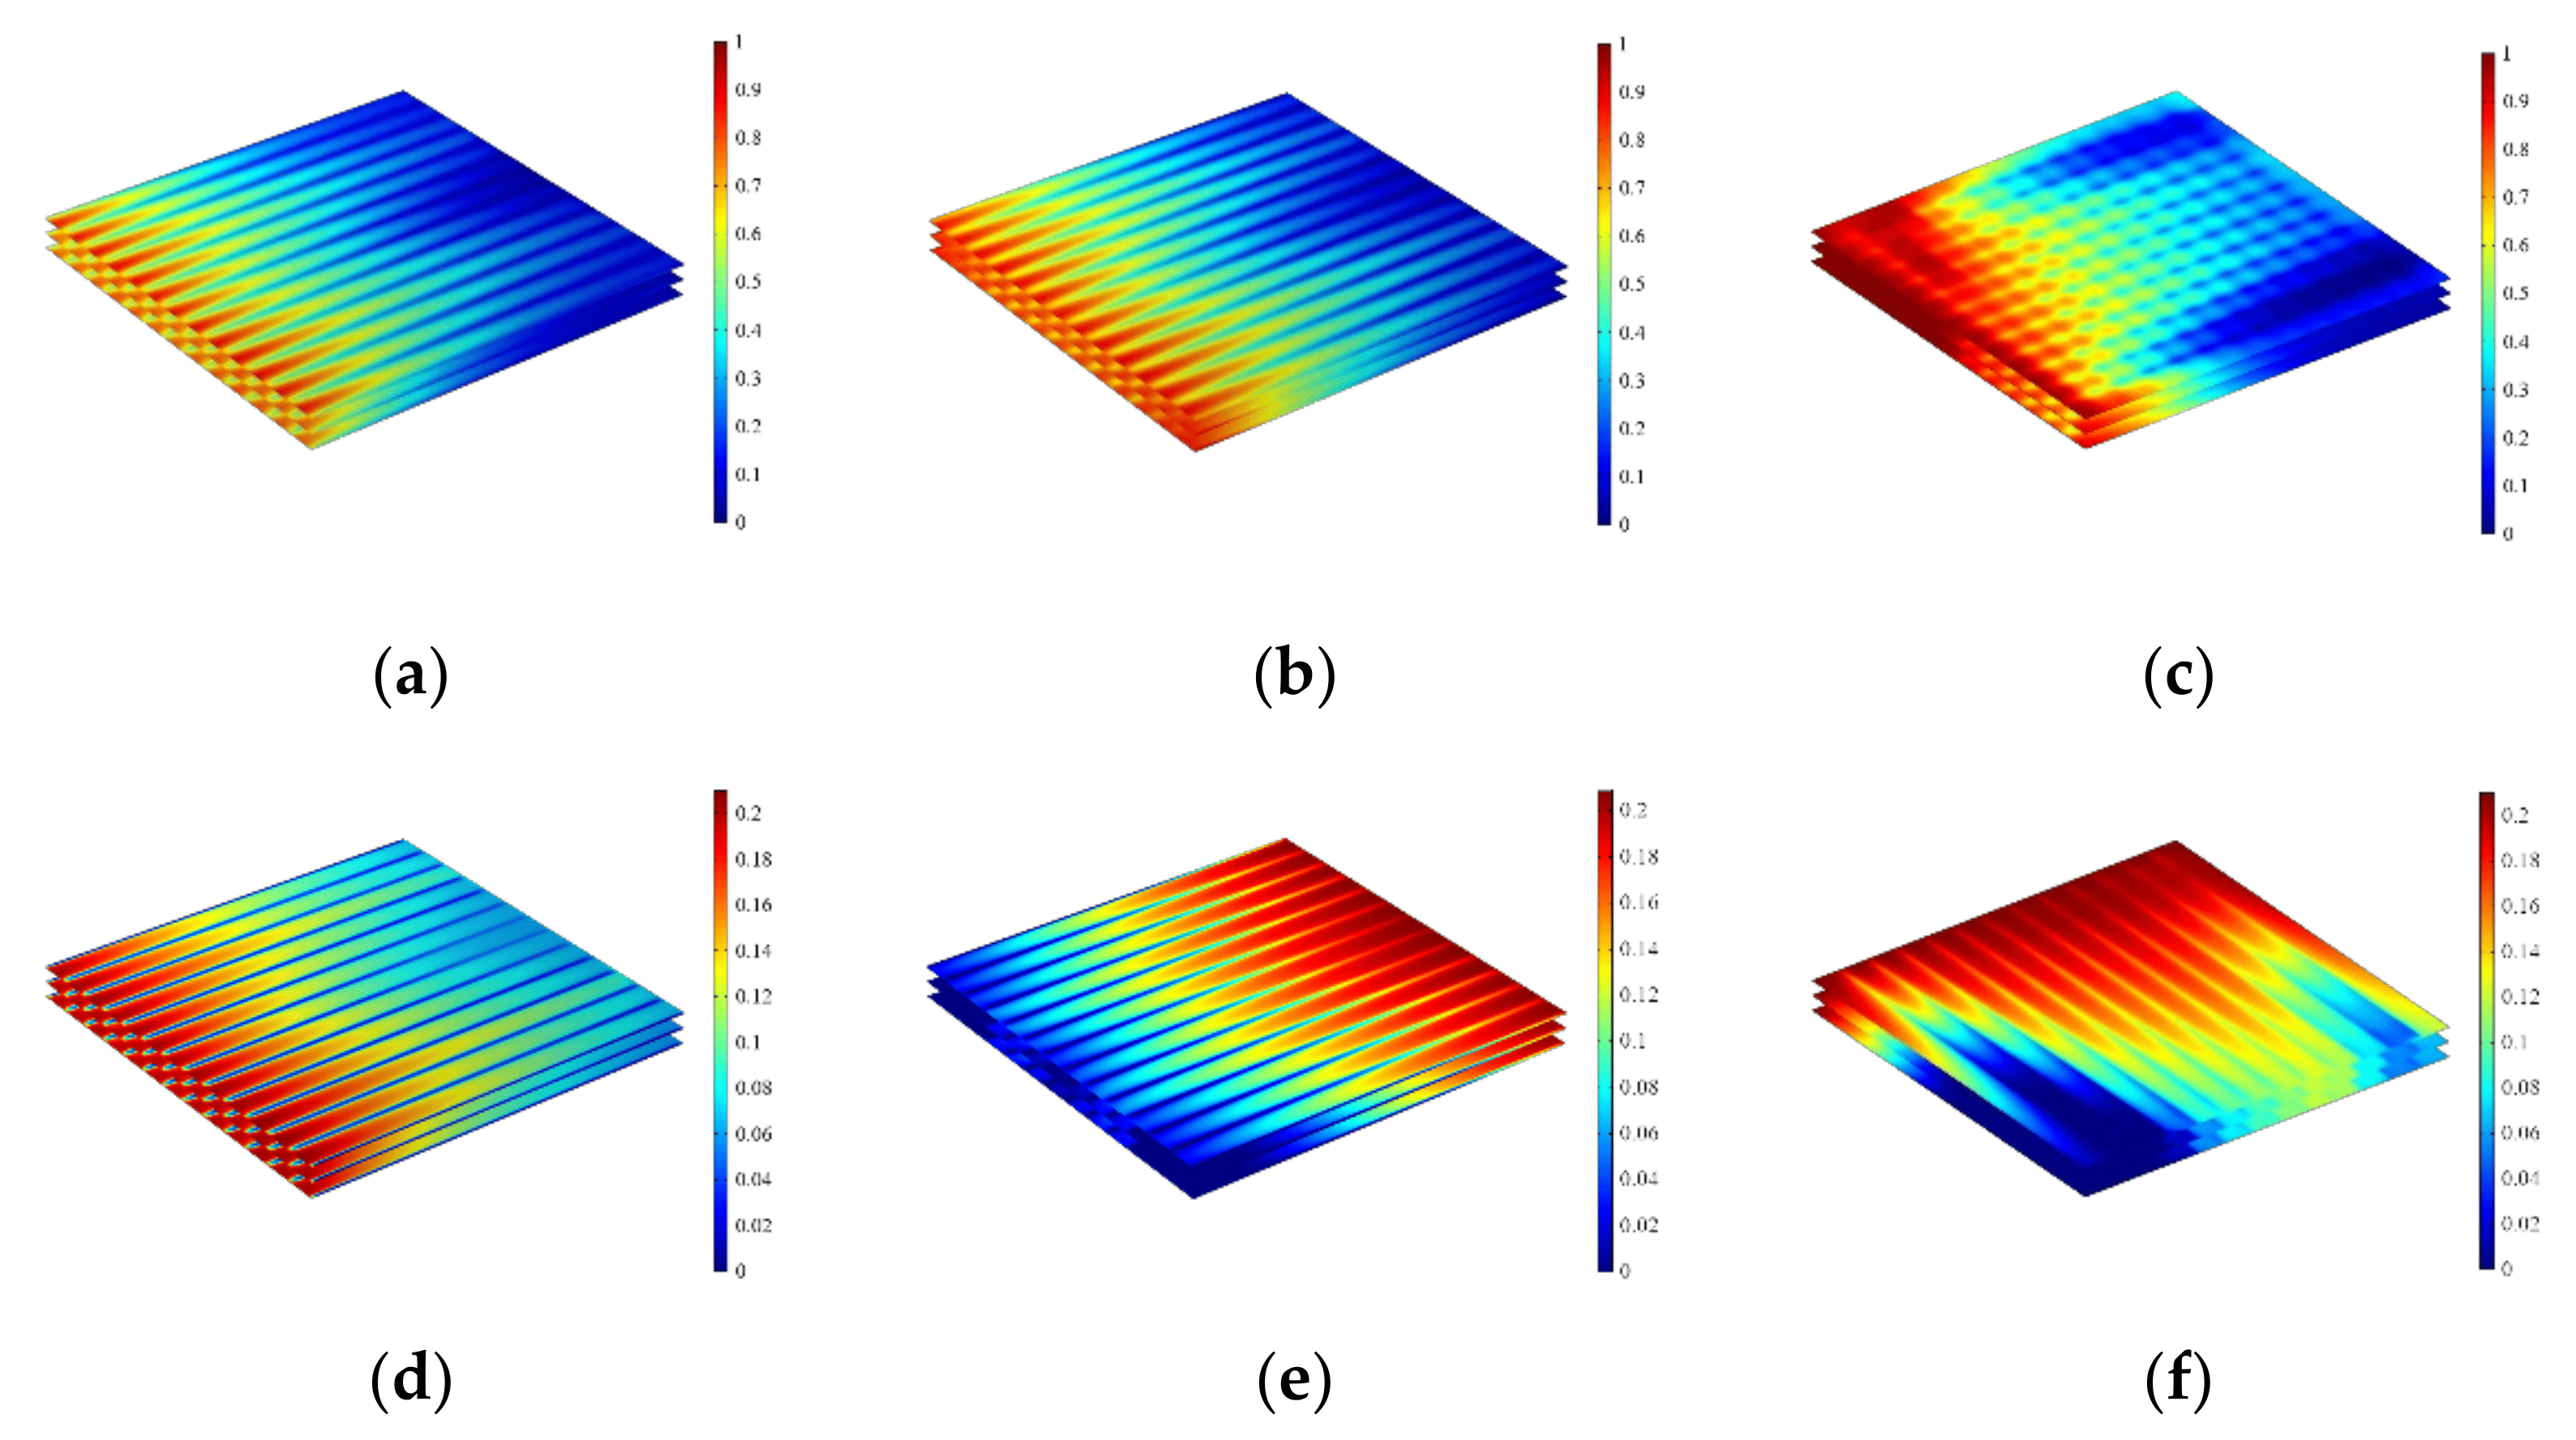
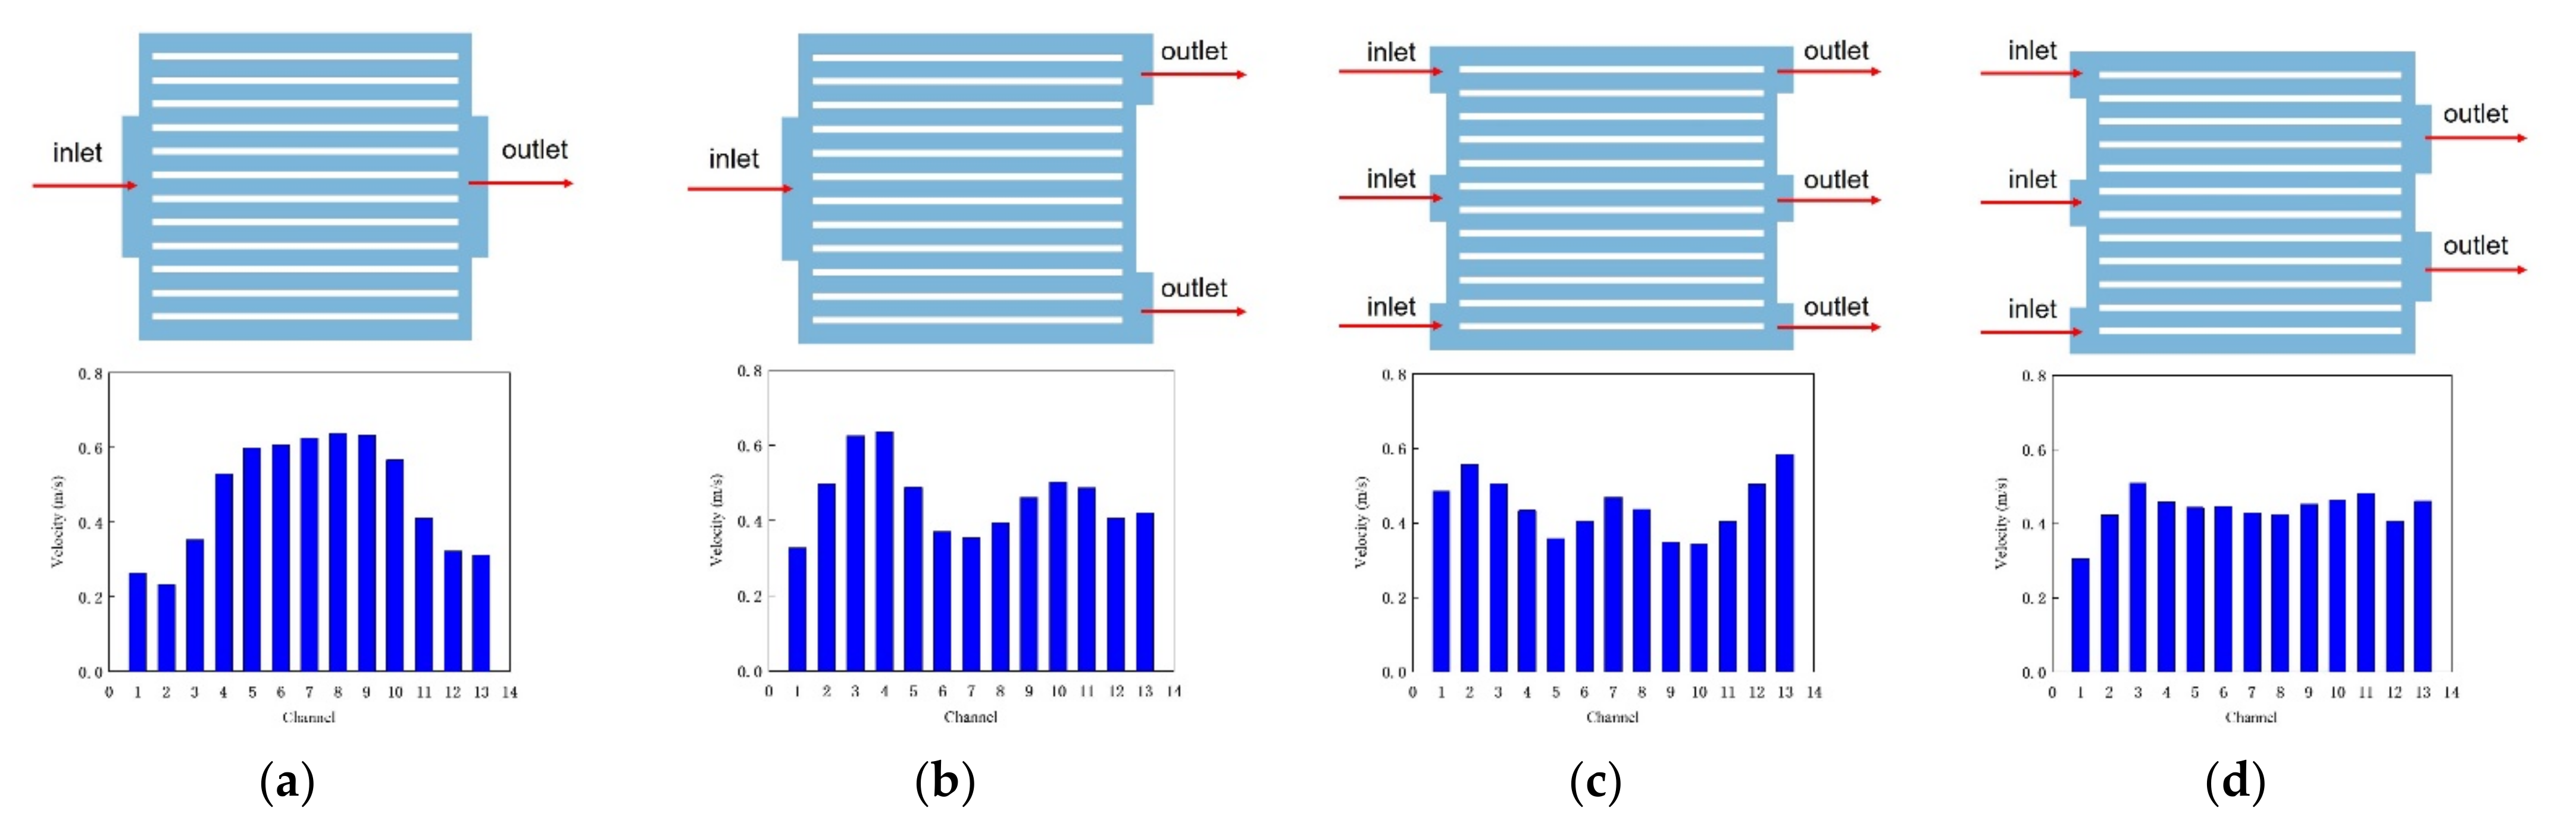
3.1. The Effect of Flow Configurations

Figure 3(a1–a3) shows the predicted temperature distribution of the SOFC stack under three different flow modes (i.e., the co-, counter-, and cross-flow configuration). In the co-flow mode, the averaged current density is 0.758 A/cm2 and the maximum temperature is 893 °C, while the current density for the counter-flow case is averaged to be 0.826 A/cm2 and the maximum temperature is 918 °C. This shows that the counter-flow mode is more effective for the electrochemical reactions, but it also generates more heat. In terms of the electricity generated, the cross-flow mode is least effective, with a predicted average current density of 0.711 A/cm2 and the maximum temperature of 900 °C. In all the three cases, the maximum temperature is found to be concentrated in the cell central region of the stack.
The first principal stress is the maximum normal stress at a point over a specific discretized element, which can lead to the fracture within the materials and is often employed to predict the lifetime of SOFC stacks. Figure 3(b1–b3) shows the distribution of the first principal stress for the stack with various flow arrangements under the operational circumstances. As shown in Figure 3(b1–b3), the thermal stress distribution in the counter-flow mode is similar to that in the co-flow mode. It is observed that the first principal stress in the stack is concentrated on both sides of the stack, and the stress at the rib is higher than the surrounding stress. This is mainly due to the thermal expansion of the channel ribs squeezing the PEN, resulting in the stress concentration under the channel ribs. For the co-flow, counter-flow and cross-flow conditions, the highest thermal stress in the electrolyte layer is 111 MPa, 143 MPa, and 120 MPa, respectively.
The predicted thermal stress in the cross-flow stack is highest in the air outlet flow region, which is different from the prediction in the parallel flow stacks. This is because air flowing with a higher velocity is able to take away more heat to the environment through the side surfaces. The temperature is lowest at the four corners of PEN, and the corresponding first principal stress is also lower. Under the same conditions, the average current density of the co-flow stack is 6.6% higher than that of the cross-flow stack, while its maximum principal stress is lower. Under the three flow arrangements, the temperature and the distribution of the first principal stress between the cells are not much different because the top and bottom surfaces are in adiabatic conditions. The principal stress of the cell near the gas inlet is slightly higher than that of the other cells. This is because the low-temperature fuel and air inlets are close to the first cell, resulting in a relatively large temperature gradient.
The distribution of hydrogen and oxygen species at the electrolyte-electrode interface under the three flow modes is shown in Figure 4. It is found that the concentration distribution of hydrogen at the anode is similar to each other in the co-flow and counter-flow stack, i.e., its concentration decreases gradually along the main flow direction. In the outlet flow region of the channels on both sides of the cross-flow stack, the hydrogen concentration is lower, which affects the stack overall performance as described in the previous section.
It is predicted that, in the parallel-flow stacks, the oxygen distribution in the cathode is relatively uniform, and the O2 concentration gradually decreases along the main flow direction. In the contrast, in the cross-flow stack, uneven distribution of the gases appears in the channels, and a low O2 concentration occurs in some regions, which greatly reduces power generation performance. It is also found that the flow rate in the channels is smaller in the central area on both sides of the cross-flow stack. Optimization of the inlet manifold structure is essential in order to achieve a uniform air distribution.
In order to make the flow rate more uniform in the channels, the numbers and positions of the inlet and outlet are varied for the stack, as shown in Figure 5. Four modes are proposed, such as: (a) one inlet and one outlet, (b) one inlet and two outlets, (c) three inlets and three outlets, and (d) three inlets and two outlets, respectively. It should be noted that the total area is the same in all the above cases. Under 0.7 V operating condition, the averaged fuel flow velocity in each channel is predicted for various design cases, as shown in Figure 5. It is revealed that the standard deviation of the averaged flow velocities is about 0.1492 for the case (a), 0.0913 for (b), 0.0742 for (c) and 0.0465 for (d), respectively. In other words, the mode (d) is the one with the best uniformity (i.e., the smallest deviation) for the flow rate distribution among the four modes.
Figure 6 shows the temperature distributions predicted for the stack with four in-and outlet design cases. The maximum temperature in all design cases is similar to each other in terms of its distribution shape. However, the predicted average current density is quite different, as shown in Table 5. For the design (d), the averaged current density is about 10% higher than that for the design (a), while the maximum first principal stresses are even lower. Compared with the base case in Figure 5a, the maximum thermal stress is reduced by 6.7%. It indicates that the three-inlet and two-outlet design mode in the design (d) can generate a higher current density, while its internal temperature difference is lower with a small thermal stress, caused by better heat dissipation due to better flow uniformity.

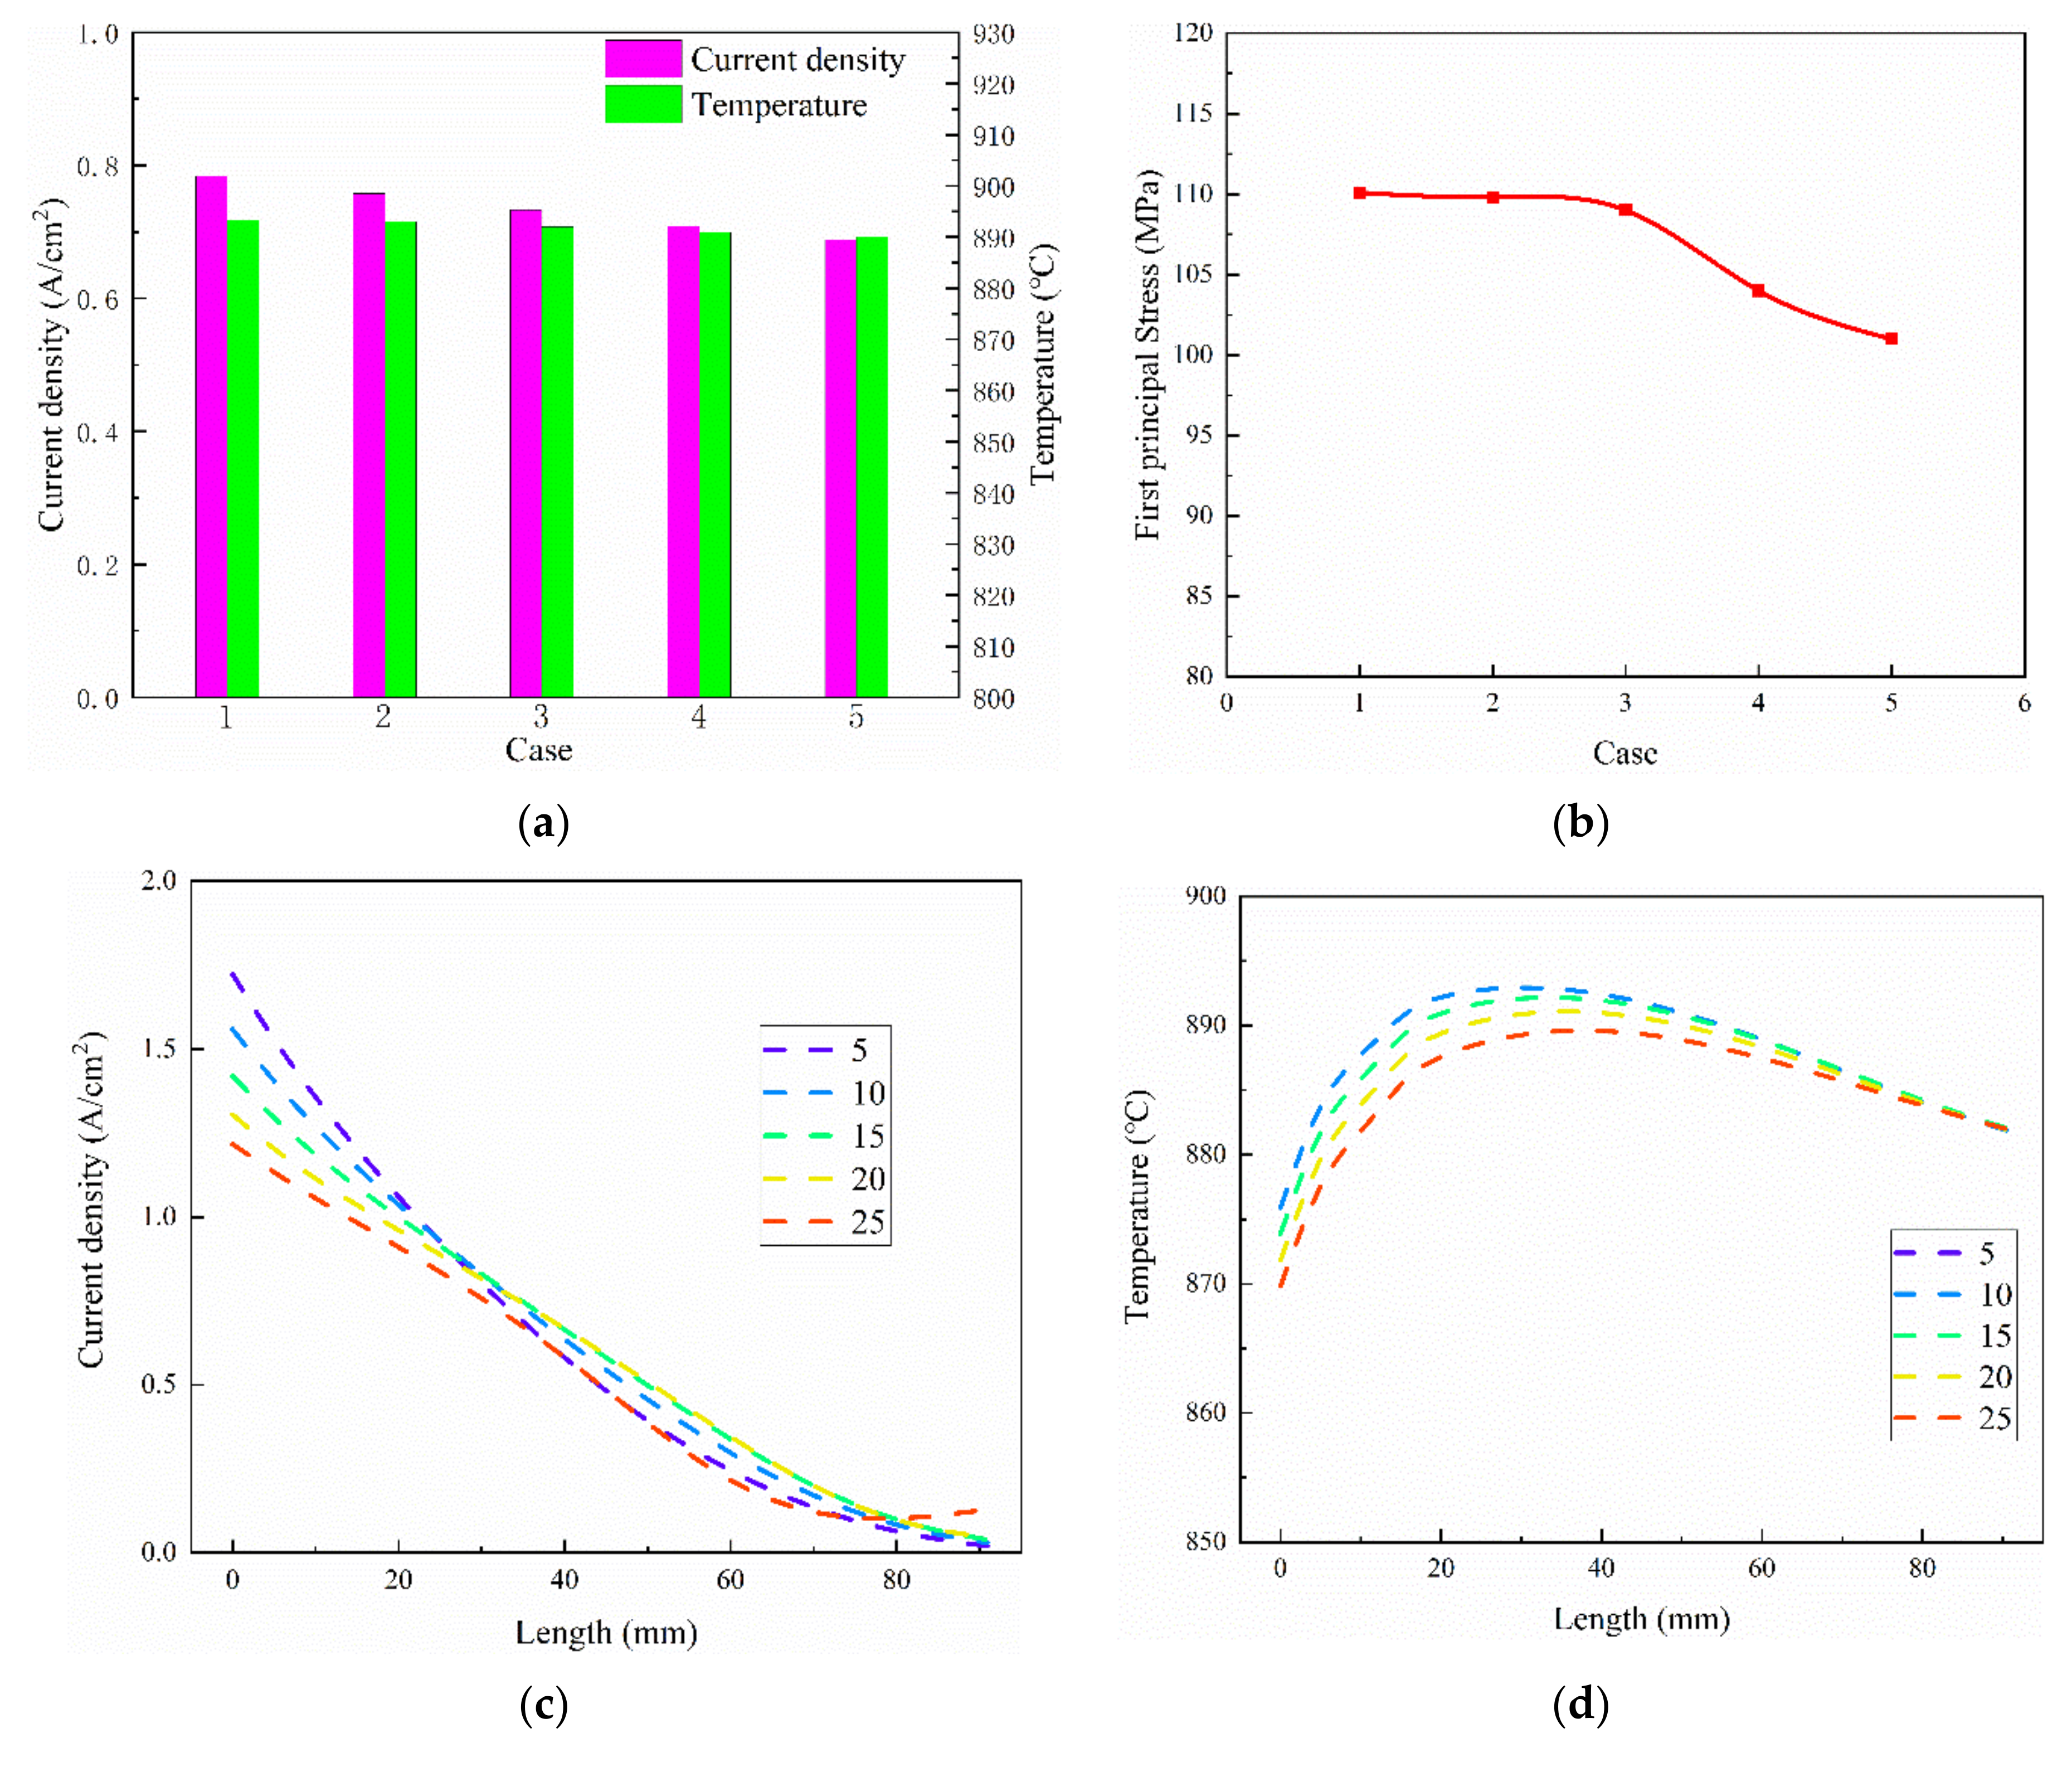
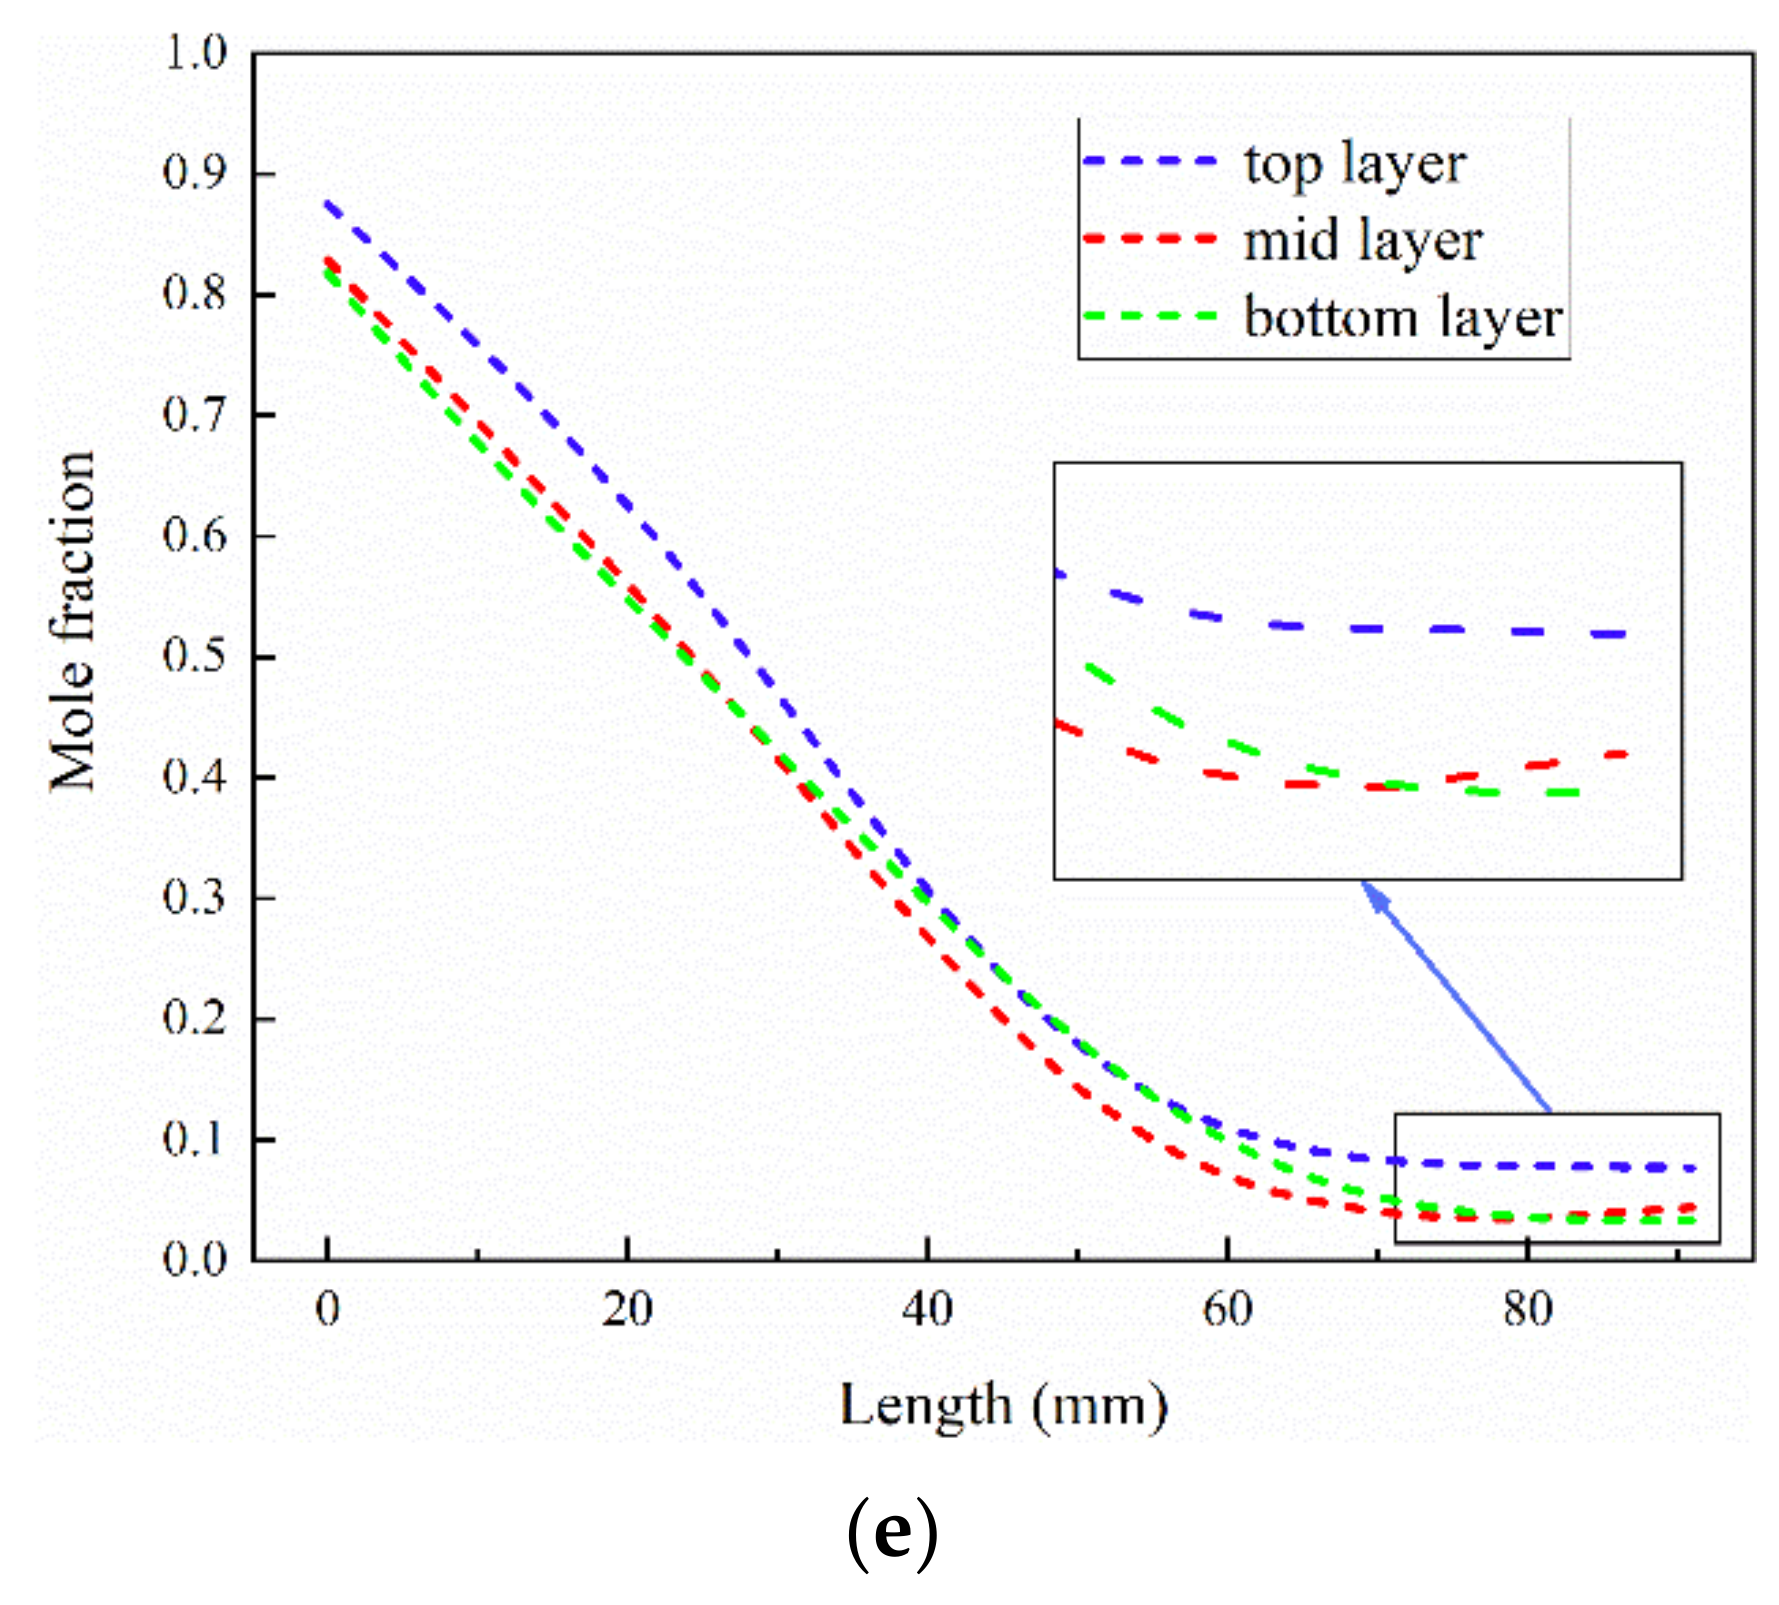
3.2. The Effect of Electrolyte Layer Thickness

The thermal stress in the co-flow stack is predicted for five electrolyte layer thicknesses, as shown in Table 6, while the thickness of the anode is also varied to keep the total thickness unchanged (i.e., 410 μm). The case 2 is assigned as the baseline one, as shown in Table 6.
Figure 7a compares the predicted average current density and the highest temperature for various electrolyte thicknesses. As the thickness decreases, the resistance to oxide ion transfer path decreases, but the fuel utilization rate reaches 86%, which correspondingly leads to a slight increase in both the average current density of the SOFC stack and the heat generated by the electrochemical reaction. In the case 1, the current density reaches to 0.7834 A/cm2, while in case 5, the current density is about 0.6882 A/cm2 and the maximum stress is 101 MPa when the thickness increases to 25 μm. However, when the electrolyte is too thin, the increase in the heat production leads to an increase in the thermal stress.
Figure 7b presents the maximum first principal stress predicted for a function of the electrolyte layer thickness. As the thickness of the electrolyte layer increases from 5 to 25 μm, the current density is reduced by 12%, and the first principal stress is also reduced by 6.5%. For the longer stacks with more cells involved, the temperature and its gradient may be even higher, and the decrease in the thickness of the electrolyte layer may cause an even bigger thermal stress, which is under investigation.
Figure 7c,d also presents the temperature and current density predicted for different cases with varied electrolyte layer thicknesses in the middle cell along the main flow direction. It is clear that the gas is continuously consumed and the generated current density gradually decreases along the main flow direction. In case 5, when the electrolyte thickness is the largest, it is found that the current density increases slightly at the end of the channel. This is because the hydrogen concentration in the top and bottom cell channels is higher than that in the middle cell, which causes the hydrogen concentration in the exhaust manifold to be higher than that at the end of the middle cell, as shown in Figure 7e. This may cause a backflow to slightly increase the hydrogen concentration at the end of the channel. In other cases, this phenomenon is not obvious. When the electrolyte layer thickness is set to 5 μm, the current density in the inlet region is larger than that predicted for the other design cases with the thick electrolyte layer, however it decreases more rapidly along the main flow direction. This is due to the strong electrochemical reactions, i.e., the strong oxygen consumption in the first half of the channel, followed by a formation of a lower oxygen concentration zone in the second half of the channels. As a result, the heat production in the second half of the channel is greatly reduced, causing the temperature to increase first and then decrease along the main flow direction, as shown in Figure 7d.

3.3. The Effect of Sealing Material

The stack seal provides excellent material compliance to accommodate large misalignment strains between the components due to mismatched coefficients of thermal expansion [40,41]. However, apart from the gasket-type seals, the rigid adhesive seal design does not require a load frame. Furthermore, the rigid adhesive seal will not leak easily after a long-term usage. However, these materials are less flexible compared to compression seal designs [25,42,43]. In this work, the thermal stress distribution of the stacks with two types of seals is studied, i.e., G18 (Glass-ceramic) [44] and Flexitallic 866 (gasket) [42], respectively. The two sealing materials are applied for different sealing methods, and the Young’s modulus and Poisson’s ratio are quite different, which will greatly affect the stress. The related parameters of the two sealing materials are summarized in Table 7.
Figure 8a,b show the stress distribution of G18 sealing materials during the stack operating condition. It is found that the maximum first principal stress and the third principal stress are 16.9 and 12.8 MPa, respectively. It is also clear that the maximum tensile and compressive stresses are concentrated in the air inlet region.
Figure 8c,d show the stress distribution predicted for the Flexitallic 866 sealing materials. Different from that predicted for the glass sealing materials, Flexitallic 866 has a small form modulus as a mica-based material, so the predicted stress level is much lower than that of the glass materials and the color scale range of the predicted picture is different. It is clear that the tensile and compressive stresses are concentrated at the outer region. Under these materials, the maximum first principal stress of the electrolyte layer is 116 MPa and 111 MPa, respectively.

4. Conclusions

A multi-physics coupled numerical model is developed for a planar SOFC short stack aiming to determine the distribution of the gas species, current density, temperature and thermal stress. The effects of different flow configuration and the electrolyte layer thickness are investigated for the performance, temperature and its gradient, as well as thermal stress of the stack. According to the calculation results, the thermal stress is concentrated at the edge-side ribs of the electrolyte layer, when the co-flow mode is compared with the counter-flow mode, the co-flow mode shows the current density being 8% lower but the thermal stress 22% lower. The current density in the co-flow mode is 6.6% higher than that in the cross-flow mode, while the thermal stress is 7.5% lower. For the cross-flow stack, the thermal stress is concentrated in the gas outlet regions. An uneven flow distribution is found in the different channels, and various numbers and locations are investigated for the inlet and outlet designs to improve the flow distribution. The current density increases as the electrolyte thickness decreases, resulting in an increase in temperature and its gradient, as well as the thermal stress. In general, the thermal stress of case5 in the co-flow mode is the lowest, which is about 30% lower than that in the counter-flow mode, while the current density is reduced by 17%. Two sealing materials (glass/gasket) were also investigated to analyze the effects on the thermal stress distribution in the electrolyte layer. These results show that the selection of the sealing material is important because the gasket sealing material is beneficial to alleviate thermal stress concentration. It should be noted that pure hydrogen is used as the fuel, i.e., only exothermic electrochemical reactions occur inside the stack. If syngas is used as the fuel, there will be both endothermic and exothermic reactions inside, and the temperature gradient may be higher, which is worthy of our further study.

Author Contributions

Conceptualization, J.Z., M.C. and J.Y.; methodology, L.X. and J.Y.; validation, J.Z. and Z.Z.; data curation, M.W. and S.L.; writing—original draft preparation, J.Z.; funding acquisition, J.Y. and L.X. All authors have read and agreed to the published version of the manuscript.

Funding

This work was funded by the National Key Research and Development Project of China (2018YFB1502204), the Ningbo major special projects of the Plan “Science and Technology Innovation 2025” (2019B10043) and the Natural Science Foundation of Fujian Province, China (2018J01490).

Institutional Review Board Statement

Not applicable.

Informed Consent Statement

Not applicable.

Data Availability Statement

Not applicable.

Conflicts of Interest

The authors declare no conflict of interest.

References

  1. Cheng, C.; Chang, Y.; Hong, C. Multiscale parametric studies on the transport phenomenon of a solid oxide fuel cell. J. Fuel Cell Sci. Technol. 2005, 2, 219–225. [Google Scholar] [CrossRef]
  2. Khazaee, I.; Rava, A. Numerical simulation of the performance of solid oxide fuel cell with different flow channel geometries. Energy 2017, 119, 235–244. [Google Scholar] [CrossRef]
  3. Kornely, M.; Leonide, A.; Weber, A.; Ivers-Tiffee, E. Performance limiting factors in anode-supported cells originating from metallic interconnector design. J. Power Sources 2011, 196, 7209–7216. [Google Scholar] [CrossRef]
  4. Cui, D.; Cheng, M. Thermal stress modeling of anode supported micro-tubular solid oxide fuel cell. J. Power Sources 2009, 192, 400–407. [Google Scholar] [CrossRef]
  5. Xu, H.; Chen, B.; Tan, P.; Cai, W.; He, W.; Farrusseng, D.; Ni, M. Modeling of all porous solid oxide fuel cells. Appl. Energy 2018, 219, 105–113. [Google Scholar] [CrossRef]
  6. Jiang, C.; Gu, Y.; Guan, W.; Zheng, J.; Ni, M.; Zhong, Z. 3D thermo-electro-chemo-mechanical coupled modeling of solid oxide fuel cell with double-sided cathodes. Int. J. Hydrog. Energy 2020, 45, 904–915. [Google Scholar] [CrossRef]
  7. Lin, C.K.; Huang, L.H.; Chiang, L.K.; Chyou, Y.P. Thermal stress analysis of planar solid oxide fuel cell stacks: Effects of sealing design. J. Power Sources 2009, 192, 515–524. [Google Scholar] [CrossRef]
  8. Zeng, S.; Xu, M.; Parbey, J.; Yu, G.; Andersson, M.; Li, Q.; Li, B.; Li, T. Thermal stress analysis of a planar anode-supported solid oxide fuel cell: Effects of anode porosity. Int. J. Hydrog. Energy 2017, 42, 20239–20248. [Google Scholar] [CrossRef]
  9. Villanova, J.; Sicardy, O.; Fortunier, R.; Micha, J.S.; Bleuet, P. Determination of global and local residual stresses in SOFC by X-ray diffraction. Nucl. Instrum. Methods Phys. Res. Sect. B-Beam Interact. Mater. At. 2010, 268, 282–286. [Google Scholar] [CrossRef]
  10. Zhao, Y.; Malzbender, J.; Gross, S.M. The effect of room temperature and high temperature exposure on the elastic modulus, hardness and fracture toughness of glass ceramic sealants for solid oxide fuel cells. J. Eur. Ceram. Soc. 2011, 31, 541–548. [Google Scholar] [CrossRef]
  11. Fan, P.; Li, G.; Zeng, Y.; Zhang, X. Numerical study on thermal stresses of a planar solid oxide fuel cell. Int. J. Therm. Sci. 2014, 77, 1–10. [Google Scholar] [CrossRef]
  12. Miao, X.-Y.; Rizvandi, O.B.; Navasa, M.; Frandsen, H.L. Modelling of local mechanical failures in solid oxide cell stacks. Appl. Energy 2021, 293, 116901. [Google Scholar] [CrossRef]
  13. Xiang, Y.; Da, Y.; Zhong, Z.; Shikazono, N.; Jiao, Z. Thermo-mechanical stress analyses of solid oxide fuel cell anode based on three-dimensional microstructure reconstruction. Int. J. Hydrog. Energy 2020, 45, 19791–19800. [Google Scholar] [CrossRef]
  14. Serincan, M.F.; Pasaogullari, U.; Sammes, N.M. Effects of operating conditions on the performance of a micro-tubular solid oxide fuel cell (SOFC). J. Power Sources 2009, 192, 414–422. [Google Scholar] [CrossRef]
  15. Amiri, A.; Vijay, P.; Tadé, M.O.; Ahmed, K.; Ingram, G.D.; Pareek, V.; Utikar, R. Planar SOFC system modelling and simulation including a 3D stack module. Int. J. Hydrog. Energy 2016, 41, 2919–2930. [Google Scholar] [CrossRef] [Green Version]
  16. Canavar, M.; Mat, A.; Celik, S.; Timurkutluk, B.; Kaplan, Y. Investigation of temperature distribution and performance of SOFC short stack with/without machined gas channels. Int. J. Hydrog. Energy 2016, 41, 10030–10036. [Google Scholar] [CrossRef]
  17. Wu, C.; Yang, Z.; Huo, S.; Najmi, A.-U.-H.; Du, Q.; Jiao, K. Modeling and optimization of electrode structure design for solid oxide fuel cell. Int. J. Hydrog. Energy 2018, 43, 14648–14664. [Google Scholar] [CrossRef]
  18. Chiang, L.K.; Liu, H.C.; Shiu, Y.H.; Lee, C.H.; Lee, R.Y. Thermal stress and thermo-electrochemical analysis of a planar anode-supported solid oxide fuel cell: Effects of anode porosity. J. Power Sources 2010, 195, 1895–1904. [Google Scholar] [CrossRef]
  19. Lin, C.K.; Chen, T.T.; Chyou, Y.P.; Chiang, L.K. Thermal stress analysis of a planar SOFC stack. J. Power Sources 2007, 164, 238–251. [Google Scholar] [CrossRef]
  20. Selimovic, A.; Kemm, M.; Torisson, T.; Assadi, M. Steady state and transient thermal stress analysis in planar solid oxide fuel cells. J. Power Sources 2005, 145, 463–469. [Google Scholar] [CrossRef]
  21. Xu, M.; Li, T.; Yang, M.; Andersson, M. Solid oxide fuel cell interconnect design optimization considering the thermal stresses. Sci. Bull. 2016, 61, 1333–1344. [Google Scholar] [CrossRef] [Green Version]
  22. Peksen, M. A coupled 3D thermofluid–thermomechanical analysis of a planar type production scale SOFC stack. Int. J. Hydrog. Energy 2011, 36, 11914–11928. [Google Scholar] [CrossRef]
  23. Fang, X.; Lin, Z. Numerical study on the mechanical stress and mechanical failure of planar solid oxide fuel cell. Appl. Energy 2018, 229, 63–68. [Google Scholar] [CrossRef]
  24. Song, M.; Wang, W.; Du, C.; Wang, B.; Jiang, W. Thermomechanical Behavior of Planar Solid Oxide Fuel Cell. J. Chin. Ceram. Soc. 2021, 49, 476–482. [Google Scholar] [CrossRef]
  25. Weil, K.; Koeppel, B. Thermal stress analysis of the planar SOFC bonded compliant seal design. Int. J. Hydrog. Energy 2008, 33, 3976–3990. [Google Scholar] [CrossRef]
  26. Huang, K.; Goodenough, J.B. Materials for solid oxide fuel cells (SOFCs). Solid Oxide Fuel Cell Technol. 2009, 50, 220–268. [Google Scholar] [CrossRef]
  27. Laurencin, J.; Delette, G.; Usseglio-Viretta, F.; Di Iorio, S. Creep behaviour of porous SOFC electrodes: Measurement and application to Ni-8YSZ cermets. J. Eur. Ceram. Soc. 2011, 31, 1741–1752. [Google Scholar] [CrossRef]
  28. Molla, T.T.; Kwok, K.; Frandsen, H.L. Efficient modeling of metallic interconnects for thermo-mechanical simulation of SOFC stacks: Homogenized behaviors and effect of contact. Int. J. Hydrog. Energy 2016, 41, 6433–6444. [Google Scholar] [CrossRef] [Green Version]
  29. Molla, T.T.; Kwok, K.; Frandsen, H.L. Transient deformational properties of high temperature alloys used in solid oxide fuel cell stacks. J. Power Sources 2017, 351, 8–16. [Google Scholar] [CrossRef]
  30. Nguyen, X.-V.; Chang, C.-T.; Jung, G.-B.; Chan, S.-H.; Lee, W.-T.; Chang, S.-W.; Kao, I.C. Study of sealants for SOFC. Int. J. Hydrog. Energy 2016, 41, 21812–21819. [Google Scholar] [CrossRef]
  31. Yang, C.; Wang, J.; Zhao, J.; Wu, Y.; Shu, C.; Miao, H.; Wang, F.; Ye, W.; Yuan, J. CFD modeling and performance comparison of solid oxide fuel cell and electrolysis cell fueled with syngas. Int. J. Energy Res. 2018, 43, 2656–2677. [Google Scholar] [CrossRef]
  32. Patcharavorachot, Y.; Arpornwichanop, A.; Chuachuensuk, A. Electrochemical study of a planar solid oxide fuel cell: Role of support structures. J. Power Sources 2008, 177, 254–261. [Google Scholar] [CrossRef]
  33. Andersson, M.; Yuan, J.L.; Sunden, B. SOFC modeling considering electrochemical reactions at the active three phase boundaries. Int. J. Heat Mass Transf. 2012, 55, 773–788. [Google Scholar] [CrossRef] [Green Version]
  34. Zhang, Z.; Yue, D.; Yang, G.; Chen, J.; Zheng, Y.; Miao, H.; Wang, W.; Yuan, J.; Huang, N. Three-dimensional CFD modeling of transport phenomena in multi-channel anode-supported planar SOFCs. Int. J. Heat Mass Transf. 2015, 84, 942–954. [Google Scholar] [CrossRef]
  35. Nakajo, A.; Kuebler, J.; Faes, A.; Vogt, U.F.; Schindler, H.J.; Chiang, L.-K.; Modena, S.; Van herle, J.; Hocker, T. Compilation of mechanical properties for the structural analysis of solid oxide fuel cell stacks. Constitutive materials of anode-supported cells. Ceram. Int. 2012, 38, 3907–3927. [Google Scholar] [CrossRef]
  36. Nakajo, A.; Van herle, J.; Favrat, D. Sensitivity of Stresses and Failure Mechanisms in SOFCs to the Mechanical Properties and Geometry of the Constitutive Layers. Fuel Cells 2011, 11, 537–552. [Google Scholar] [CrossRef]
  37. Li, Q.; Xu, Z.; Cheng, M.; Ma, Y.; Zhang, X.; Li, G. Transient thermomechanical analysis of a solid oxide fuel cell stack based on 3D multiphysical field model. Mod. Phys. Lett. B 2020, 34, 2050158. [Google Scholar] [CrossRef]
  38. Banerjee, A.; Wang, Y.; Diercks, J.; Deutschmann, O. Hierarchical modeling of solid oxide cells and stacks producing syngas via H2O/CO2 Co-electrolysis for industrial applications. Appl. Energy 2018, 230, 996–1013. [Google Scholar] [CrossRef]
  39. Frandsen, H.L.; Makowska, M.; Greco, F.; Chatzichristodoulou, C.; Ni, D.W.; Curran, D.J.; Strobl, M.; Kuhn, L.T.; Hendriksen, P.V. Accelerated creep in solid oxide fuel cell anode supports during reduction. J. Power Sources 2016, 323, 78–89. [Google Scholar] [CrossRef] [Green Version]
  40. Jiang, T.L.; Chen, M.H. Thermal-stress analyses of an operating planar solid oxide fuel cell with the bonded compliant seal design. Int. J. Hydrog. Energy 2009, 34, 8223–8234. [Google Scholar] [CrossRef]
  41. Zhang, Y.-C.; Jiang, W.; Tu, S.-T.; Wang, C.-L.; Chen, C. Effect of operating temperature on creep and damage in the bonded compliant seal of planar solid oxide fuel cell. Int. J. Hydrog. Energy 2018, 43, 4492–4504. [Google Scholar] [CrossRef]
  42. Nakajo, A.; Mueller, F.; Brouwer, J.; Van herle, J.; Favrat, D. Mechanical reliability and durability of SOFC stacks. Part II: Modelling of mechanical failures during ageing and cycling. Int. J. Hydrog. Energy 2012, 37, 9269–9286. [Google Scholar] [CrossRef] [Green Version]
  43. Weil, K.S.; Koeppel, B.J. Comparative finite element analysis of the stress–strain states in three different bonded solid oxide fuel cell seal designs. J. Power Sources 2008, 180, 343–353. [Google Scholar] [CrossRef]
  44. Stephens, E.V.; Vetrano, J.S.; Koeppel, B.J.; Chou, Y.; Sun, X.; Khaleel, M.A. Experimental characterization of glass–ceramic seal properties and their constitutive implementation in solid oxide fuel cell stack models. J. Power Sources 2009, 193, 625–631. [Google Scholar] [CrossRef]
Figure 1. Geometric schematic in different modes: (a) co/counter-, and (b) cross-flow; flow channels of: (c) co/counter-, and (d) cross-flow stack.
Energies 15 00343 g001
Figure 2. (a) Generated meshes; (b) Grid independence testing, and (c) comparison between the predicted and experimental performance.
Energies 15 00343 g002aEnergies 15 00343 g002b
Figure 3. Temperature of: (a1) co-, (a2) counter-, (a3) cross-flow configurations; and the first principal stress of: (b1) co-, (b2) counter-, (b3) cross-flow configurations.
Energies 15 00343 g003
Figure 4. Concentration distribution of H2 in: (a) co-, (b) counter-, and (c) cross-flow stack and that of O2 in: (d) co-, (e) counter-, and (f) cross-flow stack.
Energies 15 00343 g004
Figure 5. Averaged fuel flow velocity in each channel predicted for (a) 1 in and 1 out, (b) 1 in and 2 out, (c) 3 in and 3 out, (d) 3 in and 2 out design cases.
Energies 15 00343 g005
Figure 6. Temperature distribution predicted for four design: (a) 1 in and 1 out, (b) 1 in and 2 out, (c) 3 in and 3 out, (d) 3 in and 2 out.
Energies 15 00343 g006aEnergies 15 00343 g006b
Figure 7. Comparison for: (a) current density and the highest temperature, (b) maximum first principal stress, (c) current density, (d) temperature, (e) mole fraction of hydrogen at different layer in case 5 along the main flow direction in middle cell.
Energies 15 00343 g007aEnergies 15 00343 g007b
Figure 8. The first principal stress predicted for sealing materials of: (a) G18 and (c) Flexitallic 866; the third principal stress for (b) G18 and (d) Flexitallic 866.
Energies 15 00343 g008
Table 1. Parameters applied for electrochemical reactions [33].
ParameterCathodeAnode
A i 2.35 × 10116.54 × 1011
E a kJ / mol 137140
ε 0.30.3
τ 33
A v 1 / m 1.3 × 1051.3 × 105
Table 2. Properties for different SOFC components [34].
ParameterPorosityPermeability (m2)Thermal Conductivity (W·m−1·K−1)Thermal Capacity (J·kg−1·K−1)
Anode layer0.32 × 10−1111450
Cathode layer0.32 × 10−116430
Electrolyte--2.7550
Interconnect--44.5475
Seal--0.0641050
Table 3. Mechanical parameters of SOFC components [35,36].
ParameterYoung’s Modulus (GPa)CTE
(10−6·K−1)
Poisson’s Ratio
Anode58.113.20.39
Cathode98110.3
Electrolyte148.610.30.32
Interconnect6015.50.3
Seal0.01913.90
Table 4. Comparison between simulation and experimental data [34].
Current
Density (A·cm−2)
Experimental Data
(Voltage/V)
Simulation Data
(Voltage/V)
Relative ErrorRMSE
0.02025391.049811.058220.81%0.89%
0.08521871.000291.01431.41%
0.1467670.9653990.9784821.36%
0.2117370.9379870.9454630.80%
0.3405380.8900160.8853440.53%
0.4049390.8647850.8619820.33%
0.466490.8417340.8336350.97%
0.534310.8161920.8140110.27%
0.5987110.7928290.7890910.48%
0.6636810.7688440.7654180.45%
0.7280820.7454820.7482850.38%
0.7924830.7214960.7252340.52%
0.8585940.69720.7043641.03%
0.9218540.6735260.6831821.44%
0.9908140.6470490.6548361.21%
Table 5. Averaged current density and first principal stress predicted for various design cases.
ModeCase 1Case 2Case 3Case 4
Current density
(A/cm2)
0.710.760.720.78
The first principal thermal stress
(MPa)
120113113112
Table 6. Electrolyte layer thickness varied in this work (μm).
CaseCase 1Case 2 (Baseline)Case 3Case 4Case 5
Anode405400395390385
Electrolyte510152025
Table 7. Mechanical parameters of the sealing materials [42,44].
SealsYoung’s Modulus (GPa)Poisson’s RatioCTE
(10−6·K−1)
G1814.40.2811.1
Flexitallic 8660.019013.9
Publisher’s Note: MDPI stays neutral with regard to jurisdictional claims in published maps and institutional affiliations.

