Abstract
Due to the complex microscope pore structure of shale, large-scale hydraulic fracturing is required to achieve effective development, resulting in a very complicated fracturing fluid flowback characteristics. The flowback volume is time-dependent, whereas other relevant parameters, such as the permeability, porosity, and fracture half-length, are static. Thus, it is very difficult to build an end-to-end model to predict the time-dependent flowback curves using static parameters from a machine learning perspective. In order to simplify the time-dependent flowback curve into simple parameters and serve as the target parameter of big data analysis and flowback influencing factor analysis, this paper abstracted the flowback curve into two characteristic parameters, the daily flowback volume coefficient and the flowback decreasing coefficient, based on the analytical solution of the seepage equation of multistage fractured horizontal Wells. Taking the dynamic flowback data of 214 shale gas horizontal wells in Weiyuan shale gas block as a study case, the characteristic parameters of the flowback curves were obtained by exponential curve fittings. The analysis results showed that there is a positive correlation between the characteristic parameters which present the characteristics of right-skewed distribution. The calculation formula of the characteristic flowback coefficient representing the flowback potential was established. The correlations between characteristic flowback coefficient and geological and engineering parameters of 214 horizontal wells were studied by spearman correlation coefficient analysis method. The results showed that the characteristic flowback coefficient has a negative correlation with the thickness × drilling length of the high-quality reservoir, the fracturing stage interval, the number of fracturing stages, and the brittle minerals content. Through the method established in this paper, the shale gas flowback curve containing complex flow mechanism can be abstracted into simple characteristic parameters and characteristic coefficients, and the relationship between static data and dynamic data is established, which can help to establish a machine learning method for predicting the flowback curve of shale gas horizontal wells.
1. Introduction
Multistage fracturing of horizontal wells is widely used in the exploration and development of shale gas. It typically takes tens of thousands of square meters of fracturing fluids and thousands of tons of sand to fracture a shale gas horizontal well, and the flowback of the fracturing fluids directly affects shale gas production. Hence, the flowback curve of fracturing fluids is a key issue in shale gas exploration [1]. The pores and fractures in shale gas reservoirs have different scales [2], and new multiscale pore-split systems are created by multistage fracturing. Thus, the shale gas flow mechanism is very complex, including pressure sensitivity, adsorption, diffusion, slip, imbibition, and seepage [3,4,5,6]. Currently, no consensus has been reached on this flow mechanism. Moreover, there is gas–water two-phase flow in the formation after large-scale fracturing. At present, there is no commercial software to realize the numerical simulation of flowback curve. It may take several years to develop such software because, when developing such calculation programs, the solutions of the flow equations, unstructured meshing, equation discretization, and large-scale irregular sparse matrix are very complex. The gas flow equation for shale gas involves many flow mechanisms. The solution of this equations requires many known parameters which are difficult to obtain directly or measure experimentally. For example, shale gas is a multicomponent mixture containing hydrocarbons and nonhydrocarbon gases (CO2 and N2) [7], and its molecular free path at a high temperature and pressure cannot be obtained for unknown component proportions. Even if there is a perfect numerical simulation program, inaccurate parameters will affect the reliability of the results.
In recent years, with the development of big-data-related technology, researchers began to introduce machine learning into the research of oil and gas development and have mainly used it as a prediction tool. Kohli et al. [8] took well-log data as input parameters and trained the multilayer forward neural network by using the least square Levenberg–Marquardt optimization algorithm to predict the formation permeability; the predicted permeability is consistent with field data. Jia et al. [9] studied the water channel problem resulting from long-term water injection. A density peak clustering algorithm based on streamline clustering was used to quantify the flow area for water flooding in the oil reservoir and thereby effectively identify the invalid water injection circulation channels between the injection and production wells, as well as areas with development potential. Adibifard et al. [10] carried out a Chebyshev polynomial interpolation of pressure derivative data and input the results to an artificial neural network to estimate reservoir parameters. Ghaffarian et al. [11] processed the pseudo pressure of gas wells and used the pseudo pressure derivative data as the input of single and coupled multilayer perceptron network to identify the condensate gas reservoir model. Tian et al. [12] used recurrent neural network learning to train the data collected by permanent downhole pressure gauge (PDG) for the inversion of reservoir permeability and other parameters and production prediction. Hung et al. [13] introduced the application of Gaussian process regression (GPR), support vector machine (SVM), and random forest (RF) to predict CO2 trapping efficiency in saline formations.
As the fracturing fluids flowback is influenced by many factors, big data technology has attracted increasing attention. Bai et al. [14] used exponential and harmonic functions to fit the water production in the flowback stage and produced the water stages of 32 wells and developed a prediction tool for accumulated water production based on the fitting results. Zhou et al. [15] used various binary and multivariate methods to analyse the data from 187 wells in the Marcellus block in the USA. The flowback rate during the first three weeks of data collection was found to increase with the thermal maturity and decrease with increasing strata thickness. Lin et al. [16] used a back propagation neural network to model the static data and flowback rate for 74 wells in Sichuan Province, China. The flowback rate and gas production in the first month were estimated using six parameters with relatively high weights in the model. Liu et al. [17] developed two neural networks with different structures to predict the flowback rate at specific time points and compared the predictions. In summary, current big data-based methods used to determine the flowback pattern focused on static or dynamic data of many wells for a given block, and a combined analysis of static and dynamic data has not been conducted. Some studies have been performed by using a fixed data point or a periodic average of dynamic data, which is a static data methodology in essence. All these lead to incomplete data utilization and limited application scope of the method.
In order to simplify the time-dependent flowback curve into simple parameters, as the target parameters of big data analysis and flowback influencing factor analysis, this paper combined the flowback dynamic data and static data of shale gas fracturing horizontal wells to study the flowback curve. The approaches and processes used in this study are shown in Figure 1. The first part of this paper briefly introduces the geological background of the research area and the relevant data collected. In the second part, the multi-stage fracturing physical model of shale gas horizontal wells was established. The flow equation in Laplace space was obtained from the convolution formula, and the time-dependent flowback rate was obtained. In the third part, the flowback data of 214 horizontal wells in the Weiyuan block were fitted to obtain the characteristic parameters. The calculation formula of characteristic coefficient including characteristic parameters was established. Then, the correlation analysis was carried out by using a flowback characteristic coefficient, and the influencing factors of the flowback characteristic coefficient were comprehensively studied. Through the method established in this paper, the shale gas flowback curve containing complex flow mechanism can be abstracted into simple characteristic parameters and characteristic coefficients, and the relationship between static data and dynamic data is established, which can help to establish a machine learning method for predicting the flowback curve of shale gas horizontal wells.
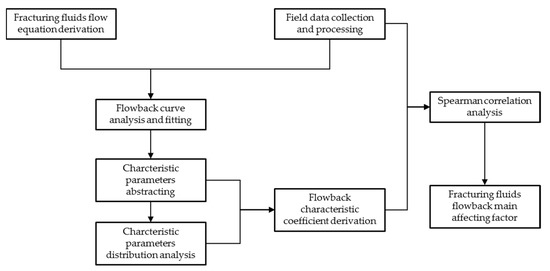
Figure 1.
Schematic diagram of the approach used in the study 2. Research area background and analysis data.
Weiyuan shale gas block is located in the southwest of Sichuan Basin of China. The whole Weiyuan block has a monoclinic structure inclined to the southeast. The Longmaxi Formation (LF) is the main exploration target layer. The LF can be divided into two layers: L1 and L2. The first layer of L1 can be subdivided into two sublayers, namely, L11 and L12. The L11 sublayer can be further subdivided into four layers, namely, L111, L112, L113 and L114, from bottom to top. The middle and lower parts of L111 have the best reservoir quality.
Table 1 shows the data from the study area. A total of 20 different types of data were collected from 282 wells in Weiyuan shale gas block, including the fracturing lateral length, the number of fracturing stages, first-year average daily production rate, vertical depth, TOC, porosity, high-quality reservoir thickness, gas saturation, pressure coefficient, brittle mineral content, average fracturing stage interval, fracturing fluid intensity, proppant intensity, average hydraulic fracturing fluid displacement, drilling length in high-quality reservoir, EUR (Estimated Ultimate Recovery), 30 day flowback rate, 90 day flowback rate, 180 day flowback rate, 360 day flowback rate, and peak gas production flowback rate. The data volume ranges from 214 to 282. The minimum data volume is 214, and the corresponding data of these 214 wells is used in subsequent analysis. The 30 day flowback rate, 90 day flowback rate, 180 day flowback rate, 360 day flowback rate, peak gas production flowback rate, and first-year average daily production rate are taken from the daily production reports of the horizontal wells. The fracturing lateral length, number of fracturing stages, average fracturing stage interval, fracturing fluid intensity, proppant intensity, and average hydraulic fracturing fluid displacement are taken from the drilling and completion reports of horizontal wells. The vertical depth, TOC, porosity, high-quality reservoir thickness, gas saturation, pressure coefficient, brittle mineral content and drilling length in high-quality reservoirs are taken from well logging interpretation.

Table 1.
Statistical tables of data for the study area. Copyright permission: The copyright of Table 1 belongs to the publisher and authors.
2. Basic Theory
The time-dependent daily flowback volume curve for the Weiyuan shale gas block in southern Sichuan Province, China, shows that the daily flowback volume is large during the early stages of continuous production and decreases to a stable value during the late stage of production. The daily flowback volume during early-stage production is two to three orders of magnitude higher than that during the later stage, and the relationship between daily flowback and time is generally exponential. The flowback of a fracturing fluid after large-scale fracturing is essentially the seepage of fluid from the stimulated reservoir volume (SRV) area to the wellbore. The corresponding law can also be obtained from the seepage equation of fracturing fluid.
2.1. Bottomhole Flow Equation
The formula derivation in this paper considers single-phase liquid seepage, assumes constant flowing bottom hole pressure (FBHP) and continuous production, and is based on the multi-stage fracturing seepage equation of horizontal well [18]. The following dimensionless parameters are defined:
Dimensionless pressure:
Dimensionless time:
Dimensionless distance:
where K denotes the permeability, m2; ϕ denotes the porosity; μ denotes the viscosity, Pa.s; Ct denotes the comprehensive compressibility coefficient, 1/Pa; xfi denotes the half-length of the ith fracture, m; and denotes the sum over the half-lengths of n fractures, m.
For multistage fractured horizontal wells, the total flowback volume is the sum of the flowback volumes of all the individual fractures. The flowback volume can be related to the FBHP in Laplace space as follows:
where:
The expressions for GxD and GyD vary with the external boundary conditions. For enclosed strata with rectangular boundaries, GxD and GyD are defined as follows [19]:
Equations (5) and (6) can be used to obtain the following linear equation:
The solution of Equation (11) without considering the wellbore storage and the skin factor yields the FBHP as the dimensionless pressure . The dimensionless pressure is obtained considering the skin factor and wellbore storage for multistage fracturing of horizontal wells in low permeability reservoirs as:
where C is the wellbore storage constant, Pa/m3; denotes the dimensionless wellbore storage constant; S is the total skin factor of the fracture system; u is the Laplace transform variable; and f(u) is a function that characterizes the properties of the strata. For a homogeneous stratum, f(u) = u.
For production wells with a variable flowback volume, the dimensionless pressure can be expressed in the following convolution form:
where denotes the dimensionless pressure of multistage fractured horizontal wells per unit flowback volume; denotes the dimensionless flowback volume; and qI represents the unit flowback volume.
Using the properties of Laplace transform for convolutions yields the relationship between the pressure and flowback volume in Laplace space:
Equation (14) can be used to obtain the flowback volume in Laplace space:
Equation (15) can also be expressed in terms of the FBHP as follows:
where is the obtained by solving Equation (11) for a unit flowback using GxD and GyD, which are both exponential functions of time. Therefore, the flowback can be simplified to . Thus, the time-dependent flowback curve is defined by two characteristic parameters, α and β. Figure 2 shows the flowback volume versus time for horizontal segments of a 1000-m horizontal well with 20 stages, an effective fracture half-length of 40 m, and an effective fracture permeability of 0.25 mD. Fitting the curve yields the following equation for the flowback volume:
where t denotes the flowback time, (d); and q(t) is the daily flowback volume, (m3/d).
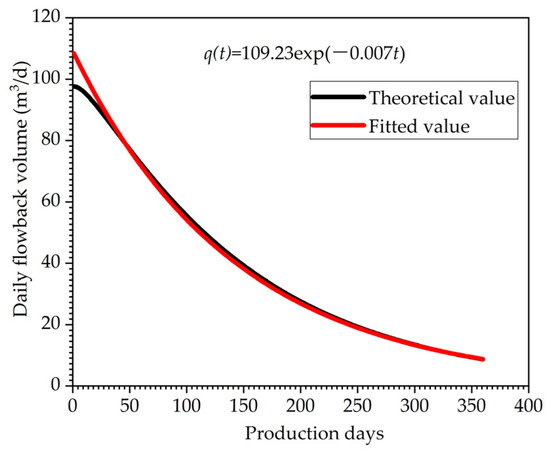
Figure 2.
Theoretical flowback curve for multistage fracturing of horizontal wells.
Equation (9) accurately describes the characteristics of the flowback curve of horizontal wells, which indicates that α and β can be effectively used to parametrize the dynamic flowback curves. In addition, the flowback pattern is consistent with field measurements (Figure 3). The field data in Figure 3 are from one of the 282 Wells in Table 1. The abscissa is production days, the ordinate is daily fracturing fluid flowback volume, and the blue dot represents the daily flowback volume of a specific day.
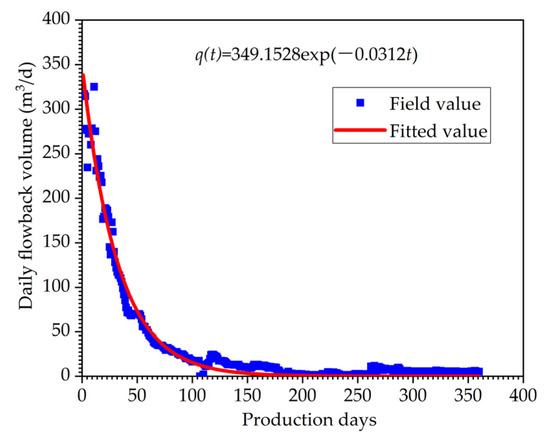
Figure 3.
Field flowback curve for multistage fracturing of horizontal wells.
2.2. Fitting
The exponential expression for the flowback volume can be used to obtain the daily flowback rate Rl for a single well as follows:
where q denotes the daily flowback volume, m3/d; Qtotal denotes the total quantity of injected fracturing fluid, m3; α is a daily flowback volume coefficient, m3/d; β is a decreasing flowback coefficient, 1/d, which is a fitting parameter; γ = α/Qtotal is the daily flowback rate coefficient, 1/d, which is also a fitting parameter; and t denotes the production time (d).
The curves for the daily flowback rate and daily flowback volume have the same shape but different magnitudes. For a total daily flowback volume that is recorded only once a day, the range of t in Equation (18) is {t ≥ 1,t∈Z}. The cumulative flowback rate for the previous N days can be then calculated as:
The cumulative flowback rates on the 30th, 90th, 180th and 360th day of production for a shale gas well are used as the characteristic flowback rates, and the estimated values of α and β are obtained by solving Equation (20):
The values on the left and right sides of Equation (20) correspond to measured data and the calculation results from Equation (19), respectively. As there are fewer unknowns than equations in Equation (20), exact solutions for γ and β cannot be obtained. Therefore, γ and β are estimated by minimizing the sum of squares of the differences between the two sides of Equation (20):
where the values of N are 30, 90, 180, and 360.
2.3. Big Data Analysis
A large quantity of data is generated during the exploration and development of shale gas, i.e., from drilling to fracturing and from well closing in to flowback. Various factors affect the flowback, which cannot be solved using currently available mathematical equations. Big data can be used to solve this problem. In this study, the Spearman correlation coefficient and distribution estimation were used to perform a big data analysis.
2.3.1. Correlation Analysis
The Spearman correlation coefficient has two advantages. First, sortable variables are assumed, and a normal sample distribution of the samples is not required, which is appropriate for the dataset used in this study. Second, the Spearman correlation corresponds to a monotonous, rather than linear, correlation between two random variables X and Y and is therefore likely to reveal a nonlinear relationship between the variables. The Spearman correlation coefficient is defined as follows [18]:
where N denotes the number of samples, and rank denotes the rank number of an observed value of X or Y.
The range of ρXY is [−1, 1]. A positive or negative ρXY indicates a positive or negative correlation between X and Y, respectively. The higher the absolute value of ρXY is, the stronger the correlation is. The significance of the Spearman correlation coefficient can be tested by the following hypotheses [20]:
If H0 is satisfied, then:
Generally, if p ≤ 0.05, H0 is rejected, and ρXY is considered significant, whereas p > 0.05 indicates there is insufficient evidence to reject H0, and ρXY may be false.
2.3.2. Estimation of Distribution of Fitted Parameters
In order to test whether the study sample is statistically significant, it is necessary to analyse the probability distribution of parameter fitting results. Consider a candidate distribution for the set of fitted parameters with a probability density function f(x/p) and a log-likelihood function l(p/x). The optimal parameter of this candidate distribution can be obtained using the following equation:
Let denote the optimal estimate of the probability density function The quality of the estimate can be tested using the following equation:
where SSE denotes the sum of the squares of the errors; h(x) denotes the probability density obtained from a histogram; and NH denotes the number of bins of the histogram.
The optimal estimate minimizes SSE and is denoted as . The correctness of the estimation can be evaluated by the Kolmogorov–Smirnov test. For a dataset with a sample size n and a reference distribution , the Kolmogorov–Smirnov test is [20]: and have the same distribution and and have different distributions.
The tested statistics are as follows:
where Fn (x) is an empirical distribution function for the data, and F(x) is the cumulative distribution function of the reference distribution . Let the fitted parameters corresponding to the dataset and denote the optimal reference distribution for the reference distribution . When p ≤ 0.05 in Equation (28), H0 is rejected, that is, the estimated results may not conform to the distribution of the fitted parameters. For p > 0.05, H0 cannot be rejected, that is, the estimated results may conform to the distribution of the fitted parameters.
3. Results and Discussion
The Weiyuan shale gas block was considered as a case study. Flowback, production, fracturing, drilling, and geological data were collected for 214 horizontal wells as shown in Table 1. The flowback data of each well was fitted to yield the following daily flowback rate:
where 0.0121 and 0.0293 are the mean values of and . The mean R2 for all the fitting results is 0.9212, and the mean value of the mean absolute error is 0.0157, indicating a good fit. The distributions of the fitted parameters, and , are asymmetrical. Therefore, it is inappropriate to use normal distributions for and . The theoretical domain of and is (0,+∞). To obtain the distributions of and , seven candidate distributions with support sets of (0,+∞) or (0,+∞) were selected, and the optimal parameters of each distribution were calculated by considering scaling but not translation, as shown in Table 2.

Table 2.
Estimated probability densities for and .
Table 2 shows that the F distribution is the optimal distribution for and , and the estimated results and optimal parameters are shown in Figure 4.
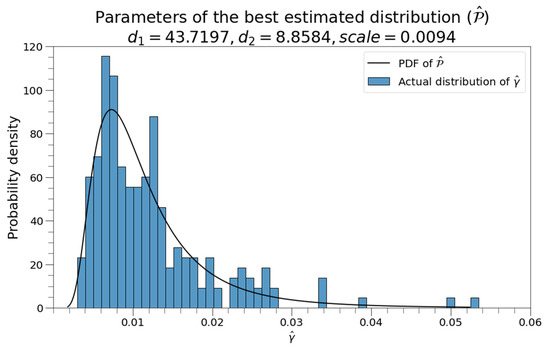
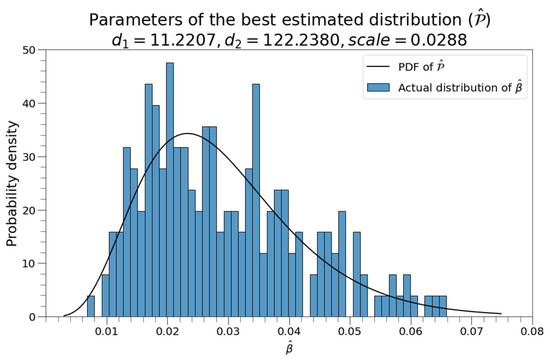
Figure 4.
Best estimated distribution of and .
The Kolmogorov–Smirnov test was conducted on the empirical distributions of and , and the optimal distributions had p values of 0.8209 and 0.4793, respectively, which were both above 0.05. Therefore, the distributions in Figure 3 can be used as empirical distributions of and . As can be seen from Figure 3, the fitting results of 214 wells are statistically significant and can be further used for big data analysis. For the Weiyuan shale gas block, this empirical distribution can be used to predict the most likely distribution range of γ and β of wells that are about to be put into production and further predict the flowback curve.
A physical interpretation of the results is that γe(−β) corresponds to the flowback rate on the first day, which is also the peak daily flowback rate, and β corresponds to the speed at which the theoretical daily flowback decreases. Thus, the larger γ is, the higher the starting point of the flowback curve is; the larger β is, the lower the starting point of the flowback curve is, and the more rapidly the flowback decreases. Figure 5 shows the relationship between and .
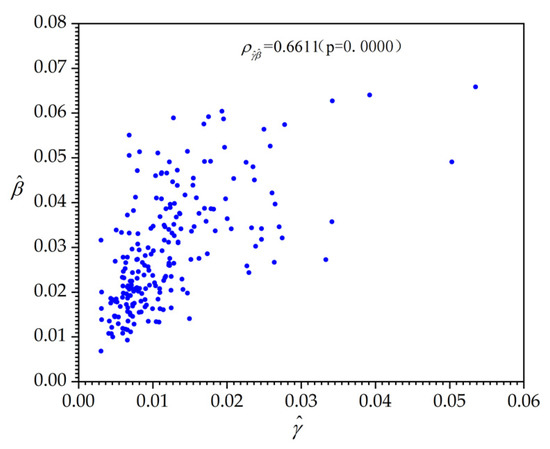
Figure 5.
Correlation between and .
Figure 5 shows a strong and significant correlation between and . Both parameters are related to the shape of the theoretical flowback curve and are therefore very likely to depend on each other. As the curve shape is jointly determined by two factors, the height of the starting point and the speed of decrease, neither factor can fully reflect the flowback volume. Hence, a variable composed of γ and β was used in this study to directly describe the flowback volume or flowback rate and is used in conjunction with static variables to perform a binary analysis. The fitting results are as follows: the minimum and maximum values of are 0.0068 and 0.0658, respectively, and the 0.01th and 99.99th percentiles of the estimated distribution are 0.0052 and 0.0686, respectively.
Figure 6 shows that the higher the value of β is for the theoretical curve, the more rapidly converges to 1. For β = 0.0052, f(N;β) reaches 0.9945 at N = 1000, and for β = 0.0686, f(N;β) reaches 0.9990 at N = 100, indicating that there is a minimal fracturing fluid volume after 1000 days of flowback for most shale gas wells. In Equation (19), γ/(eβ − 1) corresponds to the approximate long-term cumulative flowback rate; thus, a flowback characteristic coefficient is defined, η = γ/(eβ − 1), that reflects the flowback potential of a horizontal well.
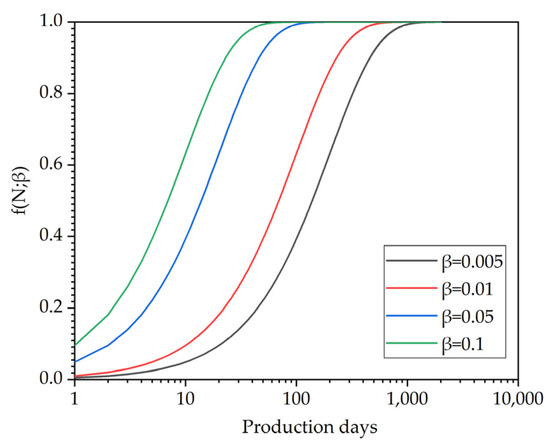
Figure 6.
Sensitivity analysis of f(N;β).
The flowback curve can be simplified by flowback characteristic coefficient. With η as the analysis object, the Spearman coefficient can be used to analyse the correlation between flowback rates and geological and engineering parameters and find the main affecting factors.
The correlation between η and the 14 static parameters in Table 1 was analysed using the Spearman correlation coefficient method. For comparison, the correlation between the first-year average daily production rate and 14 static parameters was also studied. Table 3 shows the correlations between these two variables and the static parameters, where the p value is given in parentheses. Static parameters with nonsignificant correlations with the two variables were excluded.

Table 3.
Correlations between η, first-year average daily production rate, and static parameters.
Table 2 shows that the first-year average daily production rate is highly correlated with the thickness × reservoir drilling length of high-quality reservoir, and the correlation coefficient exceeds 0.5, indicating that the larger the thickness × drilling length of the high-quality reservoir, the higher the first-year average daily production rate, which is consistent with the results of Ma et al. [21]. The correlation between the static parameters and the first-year daily production rate can be sorted by the correlation coefficient as follows: thickness × drilling length of high-quality reservoir > fracturing lateral length > number of fracturing stages > brittle mineral content > gas saturation > fracturing stage interval > pressure coefficient × vertical depth. The drilling length of the high-quality reservoir, the fracturing lateral length, the number of fracturing stages, and the fracturing stage interval are engineering parameters. The better the drilling effect, the better fracturing effect and the higher the first-year average daily production rate. High-quality reservoir thickness, brittle mineral content, gas saturation and pressure coefficient × vertical depth are geological parameters. The better physical properties of shale gas reservoir, the higher first-year average daily production rate. This is why there is a good correlation between the first-year average daily production rate and various parameters.
Although the correlation coefficients between η and the static parameters are less than 0.5, relatively speaking, η and the thickness × drilling length of high-quality reservoir are best correlated, and the correlation symbol is opposite to that of the first-year daily production rate, which means that the higher the first-year average daily production rate, the lower the flowback rate. The correlation between static parameters and η is sorted by coefficient, which is basically consistent with that of first-year average production rate, but the positions of individual parameters are interchanged. The order according to the absolute value of correlation is thickness × drilling length of high-quality reservoir > number of fracturing stages > pressure coefficient× vertical depth > fracturing stage interval > fracturing lateral length > brittle mineral content > gas saturation. η is positively correlated with the fracturing stage interval, which means that the larger the fracturing stage interval, the worse the fracturing effect. The hydraulic fracturing process does not create complex fracture networks, and the fracturing fluids mainly concentrate near the main fracture and wellbore, resulting in high flowback rate. η is positively correlated with the pressure coefficient × vertical depth. The pressure coefficient × vertical depth represents the formation pressure. The higher the formation pressure, the stronger the liquid carrying capacity of the shale gas well and the higher the flowback rate. η is negatively correlated with the fracturing lateral length, the number of fracturing stages, and the content of brittle minerals. The higher the brittle minerals, the easier the reservoir is to be fractured; the longer the fracturing lateral length is and the more the number of fracturing stages is, the more complex the fracture network will be formed after hydraulic fracturing and the larger the SRV will be. The fracturing fluids are bound in complex micro fractures and cannot be discharged, resulting in a low flowback rate.
Table 4 shows the correlations between η and the whole static parameters in Table 1. Figure 6 shows the hot map of correlations between η and static parameters. From Table 1 and Figure 7, it can be seen that η is well correlated with the 30 day, 90 day, 180 day, 360 day, and peak gas production flowback rates. The longer the flowback time, the better the correlation between η and the flowback rate. The correlation between η and the 30 day, 90, 180, and 360 day flowback rate confirmed that it is reasonable and scientific to use η to characterize the flowback rate. η is positively correlated with vertical depth, TOC content, porosity, pressure coefficient, and average fracturing intervals, which means the higher these parameters are, the higher the flowback rates are. η is negatively correlated with high-quality reservoir thickness, gas saturation, brittle mineral content, fracturing fluid intensity, proppant intensity, average hydraulic fracturing fluid displacement, and drilling length in high-quality reservoirs, which means the higher these parameters are, the lower flowback rates are. η is negatively correlated with the first-year average daily production rate and EUR, but the correlation coefficients are low. It means that flowback rate is not merely correlated with gas production.

Table 4.
Correlations between η and static parameters.
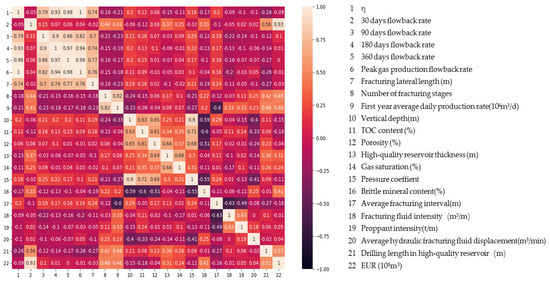
Figure 7.
Hot map of correlations between η and static parameters.
From the correlation between various static parameters and the first-year average daily production rate and η, it is reasonable to simplify and characterize the flowback characteristics of shale gas wells by the flowback characteristic coefficient η. In our previous study [17], based on the actual data in the Weiyuan shale gas block, combined with a deep learning algorithm, two different depth feedforward neural networks were designed, which are the single output neural network and the multi-output neural network, to predict the shale gas well flowback rate. The 30 day, 90, 180, 360 day, and peak gas production flowback rates of shale gas wells were predicted. This method can predict the flowback rate of a specific day, but the main factors affecting the flowback rate at any time cannot be obtained. Combining the deep learning algorithm and the backflow characteristic coefficients proposed in this article, the flowback rate at any time in the future can be predicted. The method proposed in this paper also has some limitations. For gas wells with intermittent shut-in or long-term shut-in or for long-term flooded gas wells, there will be large errors in the prediction of the flowback rate. In addition, the research does not consider the impact of gas–liquid two-phase flow on flowback.
4. Summary and Conclusions
Based on the seepage theory of fracturing fluid in multi-stage fractured horizontal wells, the study uses convolution and Laplace transform methods to abstract the flowback curve into two characteristic parameters, the daily flowback rate coefficient γ and the flowback decline coefficient β. Taking the Weiyuan shale gas block as a study case, the flowback data of 214 wells were fitted, and the distribution characteristics of the fitted characteristic parameters were studied. The flowback characteristic coefficients to characterize the flowback potential of shale gas wells were established. The Spearman correlation coefficient method was used to study the correlation between the geological and engineering static parameters of 214 wells, the characteristic flowback coefficients, and the first-year average daily production rate. There are several conclusions obtained from this research:
(1) The fitting results of the flowback curve for 214 production wells show that the average daily flowback rate coefficient and the flowback decline coefficient of all wells are 0.0121 and 0.0293, and the average value of R2 of all fitting results is 0.9212, the mean value of the mean absolute error is 0.0157, and the fitting effect is better. Both the daily flowback rate coefficient γ and the flowback decline coefficient β are right-skewed distributions.
(2) The comparative study on the correlation between the flowback characteristic coefficient and the first-year average daily production rate and static parameters shows that the thickness × the drilling length of a high-quality reservoir is best correlated with the characteristic flowback coefficient and the first-year average daily production rate, and their correlation symbol is opposite, which means that the larger the thickness × the drilling length of the high-quality reservoir, the higher the average first-year daily production rate and the lower the flowback rate of the shale gas well. The factors affecting the flowback rate mainly include geological factors and engineering factors. The order of correlation coefficients is as follows: thickness × drilling length of high-quality reservoir, number of fracturing stages, pressure coefficient × vertical depth, fracturing stage interval, fracturing lateral length, brittle mineral content, and gas saturation.
(3) Through the method established in this paper, the shale gas flowback curve containing complex flow mechanism can be abstracted into simple characteristic parameters and characteristic coefficients. The method proposed in this paper can provide a novel way for machine learning and other big data analysis methods to study the flowback characteristics of shale gas horizontal wells. In future studies, the time-dependent gas output will be related to the flowback rate. Combining with machine learning, the flowback rate and gas output at any time can be predicted in the future.
Author Contributions
Conceptualization, W.G.; methodology, X.Z.; formal analysis, L.K.; investigation, Y.L.; resources, J.G.; data curation, W.G.; writing—original draft preparation, W.G.; writing—review and editing, X.Z. All authors have read and agreed to the published version of the manuscript.
Funding
This research was financially supported by the R&D Department of Petrochina (No. 2021DJ2005).
Institutional Review Board Statement
Not applicable.
Informed Consent Statement
Not applicable.
Data Availability Statement
Not applicable.
Conflicts of Interest
The authors declare no conflict of interest.
Nomenclature
| K | permeability, m2 |
| Φ | porosity, dimensionless |
| t | time, day |
| μ | viscosity, pa.s |
| Ct | comprehensive compressibility coefficient, dimensionless |
| xfi | half-length of the ith fracture, m |
| P | pressure, pa |
| PD | dimensionless pressure, dimensionless |
| tD | dimensionless time, dimensionless |
| xD | dimensionless distance in x direction, dimensionless |
| yD | dimensionless distance in y direction, dimensionless |
| C | wellbore storage constant, Pa/m3 |
| CD | dimensionless wellbore storage constant, dimensionless |
| S | total skin factor of the fracture system, dimensionless |
| u | Laplace transform variable |
| α | daily flowback volume coefficient, m3/d |
| β | decreasing flowback coefficient, 1/d |
| q | daily flowback volume, m3/d |
| Qtotal | total quantity of injected fracturing fluids, m3 |
| γ | daily flowback rate coefficient, 1/d |
| ρ | Spearman correlation coefficient, dimensionless |
| Rl | daily flowback rate, dimensionless |
| η | flowback characteristic coefficient, dimensionless |
References
- Williams-Kovacs, J.D.; Clarkson, C.R. A modified approach for modeling two-phase flowback from multi-fractured horizontal shale gas wells. J. Nat. Gas Sci. Eng. 2016, 30, 127–147. [Google Scholar] [CrossRef]
- Liu, J.; Li, P.; Sun, Z.; Lu, Z.; Du, Z.; Liang, H.; Lu, D. A new method for analysis of dual pore size distributions in shale using nitrogen adsorption measurements. Fuel 2017, 210, 446–454. [Google Scholar] [CrossRef]
- Rongze, Y.; Xiaowei, Z.; Yanan, B.; Yang, L.; Mingxiang, H. Flow mechanism of shale gas reservoirs and influential factors of their productivity. Nat. Gas. Ind. 2012, 32, 10–15. [Google Scholar]
- Zoback, M.D.; Kohli, A.; Das, I.; McClure, M. The importance of slow slip on faults during hydraulic fracturing stimulation of shale gas reservoirs. In Proceedings of the SPE Americas Unconventional Resources Conference, Pittsburgh, PA, USA, 5–7 June 2012. [Google Scholar]
- Du, W.Y.; Fu, J.; Sun, Z.; Qiao, N. Shale gas seepage mechanism and transient pressure analysis. Chin. J. Comput. Phys. 2015, 32, 51–57. [Google Scholar]
- Jia, B.; Chen, Z.; Xian, C. Investigations of CO2 storage capacity and flow behavior in shale formation. J. Pet. Sci. Eng. 2022, 208, 109659. [Google Scholar] [CrossRef]
- Dai, J.; Zou, C.; Liao, S.; Dong, D.; Ni, Y.; Huang, J.; Wu, W.; Gong, D.; Huang, S.; Hu, G. Geochemistry of the extremely high thermal maturity Longmaxi shale gas, southern Sichuan Basin. Org. Geochem. 2014, 74, 3–12. [Google Scholar] [CrossRef]
- Kohlia, A.; Arora, P. Application of artificial neural net-works for well logs. In Proceedings of the International Petroleum Technology Conference, Doha, Qatar, 19 January 2014. [Google Scholar]
- Hu, J.; Lihui, D. Oil reservoir water flooding flowing area identification based on the method of streamline clustering artificial intelligence. Pet. Explor. Dev. 2018, 45, 312–319. [Google Scholar]
- Adibifard, M.; Tabatabaei-Nejad, S.; Khodapanah, E. Artificial Neural Network (ANN) to estimate reservoir parameters in Naturally Fractured Reservoirs using well test data. J. Pet. Sci. Eng. 2014, 122, 585–594. [Google Scholar] [CrossRef]
- Ghaffarian, N.; Eslamloueyan, R.; Vaferi, B. Model identification for gas condensate reservoirs by using ANN method based on well test data. J. Pet. Sci. Eng. 2014, 123, 20–29. [Google Scholar] [CrossRef]
- Tian, C.; Horne, R.N. Recurrent neural networks for permanent downhole gauge data analysis. In Proceedings of the SPE Annual Technical Conference and Exhibition, San Antonio, TX, USA, 9–11 October 2017. [Google Scholar]
- Thanh, H.V.; Lee, K.K. Application of machine learning to predict CO2 trapping performance in deep saline aquifers. Energy 2021, 239, 122457. [Google Scholar] [CrossRef]
- Bai, B.; Goodwin, S.; Carlson, K. Modeling of frac flowback and produced water volume from Wattenberg oil and gas field. J. Pet. Sci. Eng. 2013, 108, 383–392. [Google Scholar] [CrossRef]
- Zhou, Q.; Dilmore, R.; Kleit, A.; Wang, J.Y. Evaluating fracture-fluid flowback in Marcellus using data-mining technologies. SPE Prod. Oper. 2016, 31, 133–146. [Google Scholar] [CrossRef]
- Lin, B.; Guo, J.; Liu, X.; Xiang, J.; Zhong, H. Prediction of flowback ratio and production in Sichuan shale gas reservoirs and their relationships with stimulated reservoir volume. J. Pet. Sci. Eng. 2020, 184, 106529. [Google Scholar] [CrossRef]
- Yuyang, L.; Xinhua, M.; Xiaowei, Z.; Wei, G.; Lixia, K.; Rongze, Y.; Yuping, S. Shale gas well flowback rate prediction for Weiyuan field based on a deep learning algorithm. J. Pet. Sci. Eng. 2021, 203, 108637. [Google Scholar] [CrossRef]
- Li, Q.; Li, P.; Pang, W.; Li, D.; Liang, H.; Lu, D. A new method for production data analysis in shale gas reservoirs. J. Nat. Gas Sci. Eng. 2018, 56, 368–383. [Google Scholar] [CrossRef]
- Lu, D.T. Modern Well Testing Theory and Application; Petroleum Industry Press: Beijing, China, 2009. [Google Scholar]
- Zwillinger, D.; Kokoska, S. Standard Probability and Statistics Tables and Formulae; Chapman & Hall/CRC: Boca Raton, FL, USA, 2000; pp. 346, 366–367. [Google Scholar]
- Xinhua, M.A.; Xizhe, L.I.; Liang, F.; Yujin, W.A.N.; Qiang, S.H.I.; Yonghui, W.A.N.G.; Zhang, X.; Mingguang, C.H.E.; Wei, G.U.O. Dominating factors on well productivity and development strategies optimization in Weiyuan shale gas play, Sichuan Basin, SW China. Pet. Explor. Dev. 2020, 47, 594–602. [Google Scholar]
Publisher’s Note: MDPI stays neutral with regard to jurisdictional claims in published maps and institutional affiliations. |
© 2022 by the authors. Licensee MDPI, Basel, Switzerland. This article is an open access article distributed under the terms and conditions of the Creative Commons Attribution (CC BY) license (https://creativecommons.org/licenses/by/4.0/).