
Analysis of Indoor Air Pollutants and Guidelines for Space and Physical Activities in Multi-Purpose Activity Space of Elementary Schools

Abstract
:1. Introduction
1.1. Background and Objectives of Research
1.2. Scope and Methodology of Research
2. Domestic System and Class Status of the MPA-Space of Elementary Schools
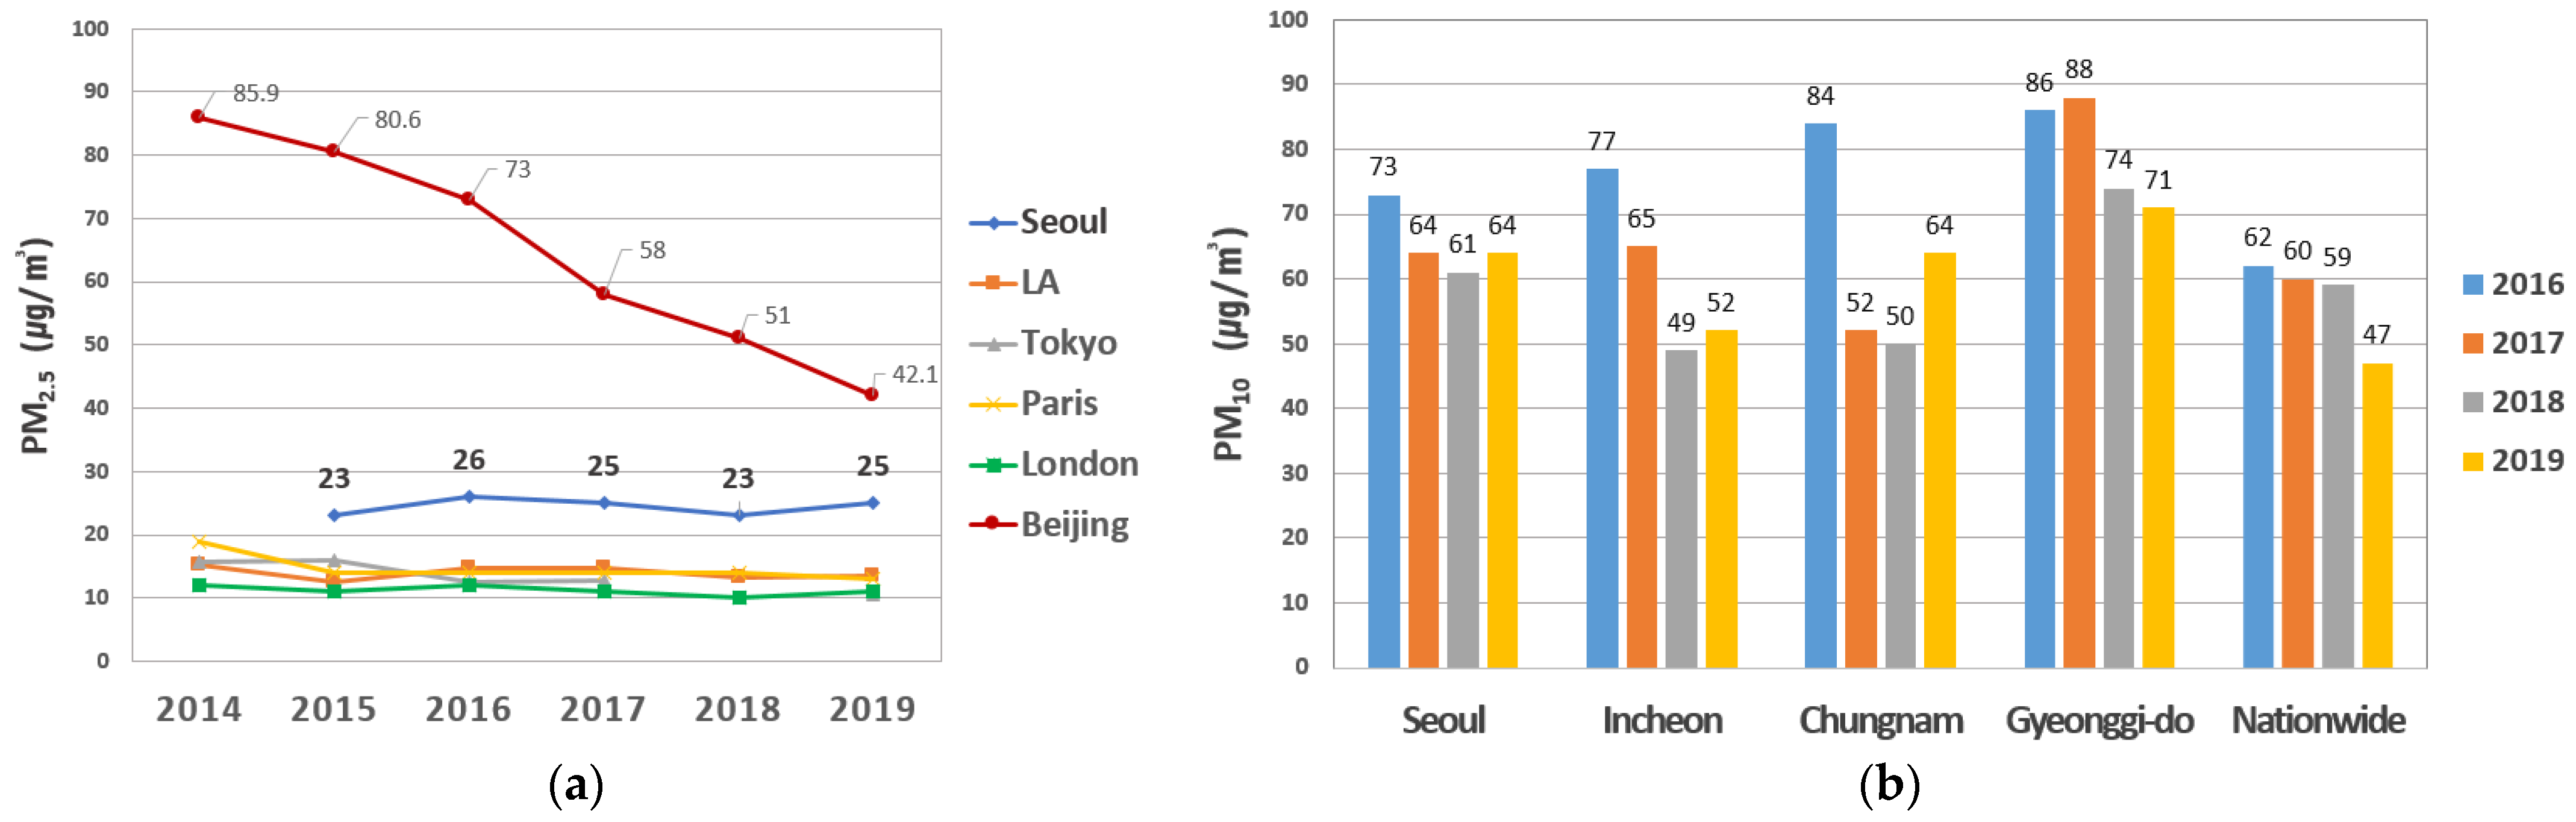
2.1. Comprehensive Measures for Reducing the Concentration of Fine Dusts in South Korea
2.2. Current Status of Physical Education Classes According to the Domestic System in Response to Fine Dusts
3. Current Status of Indoor MPA-Spaces in Elementary Schools
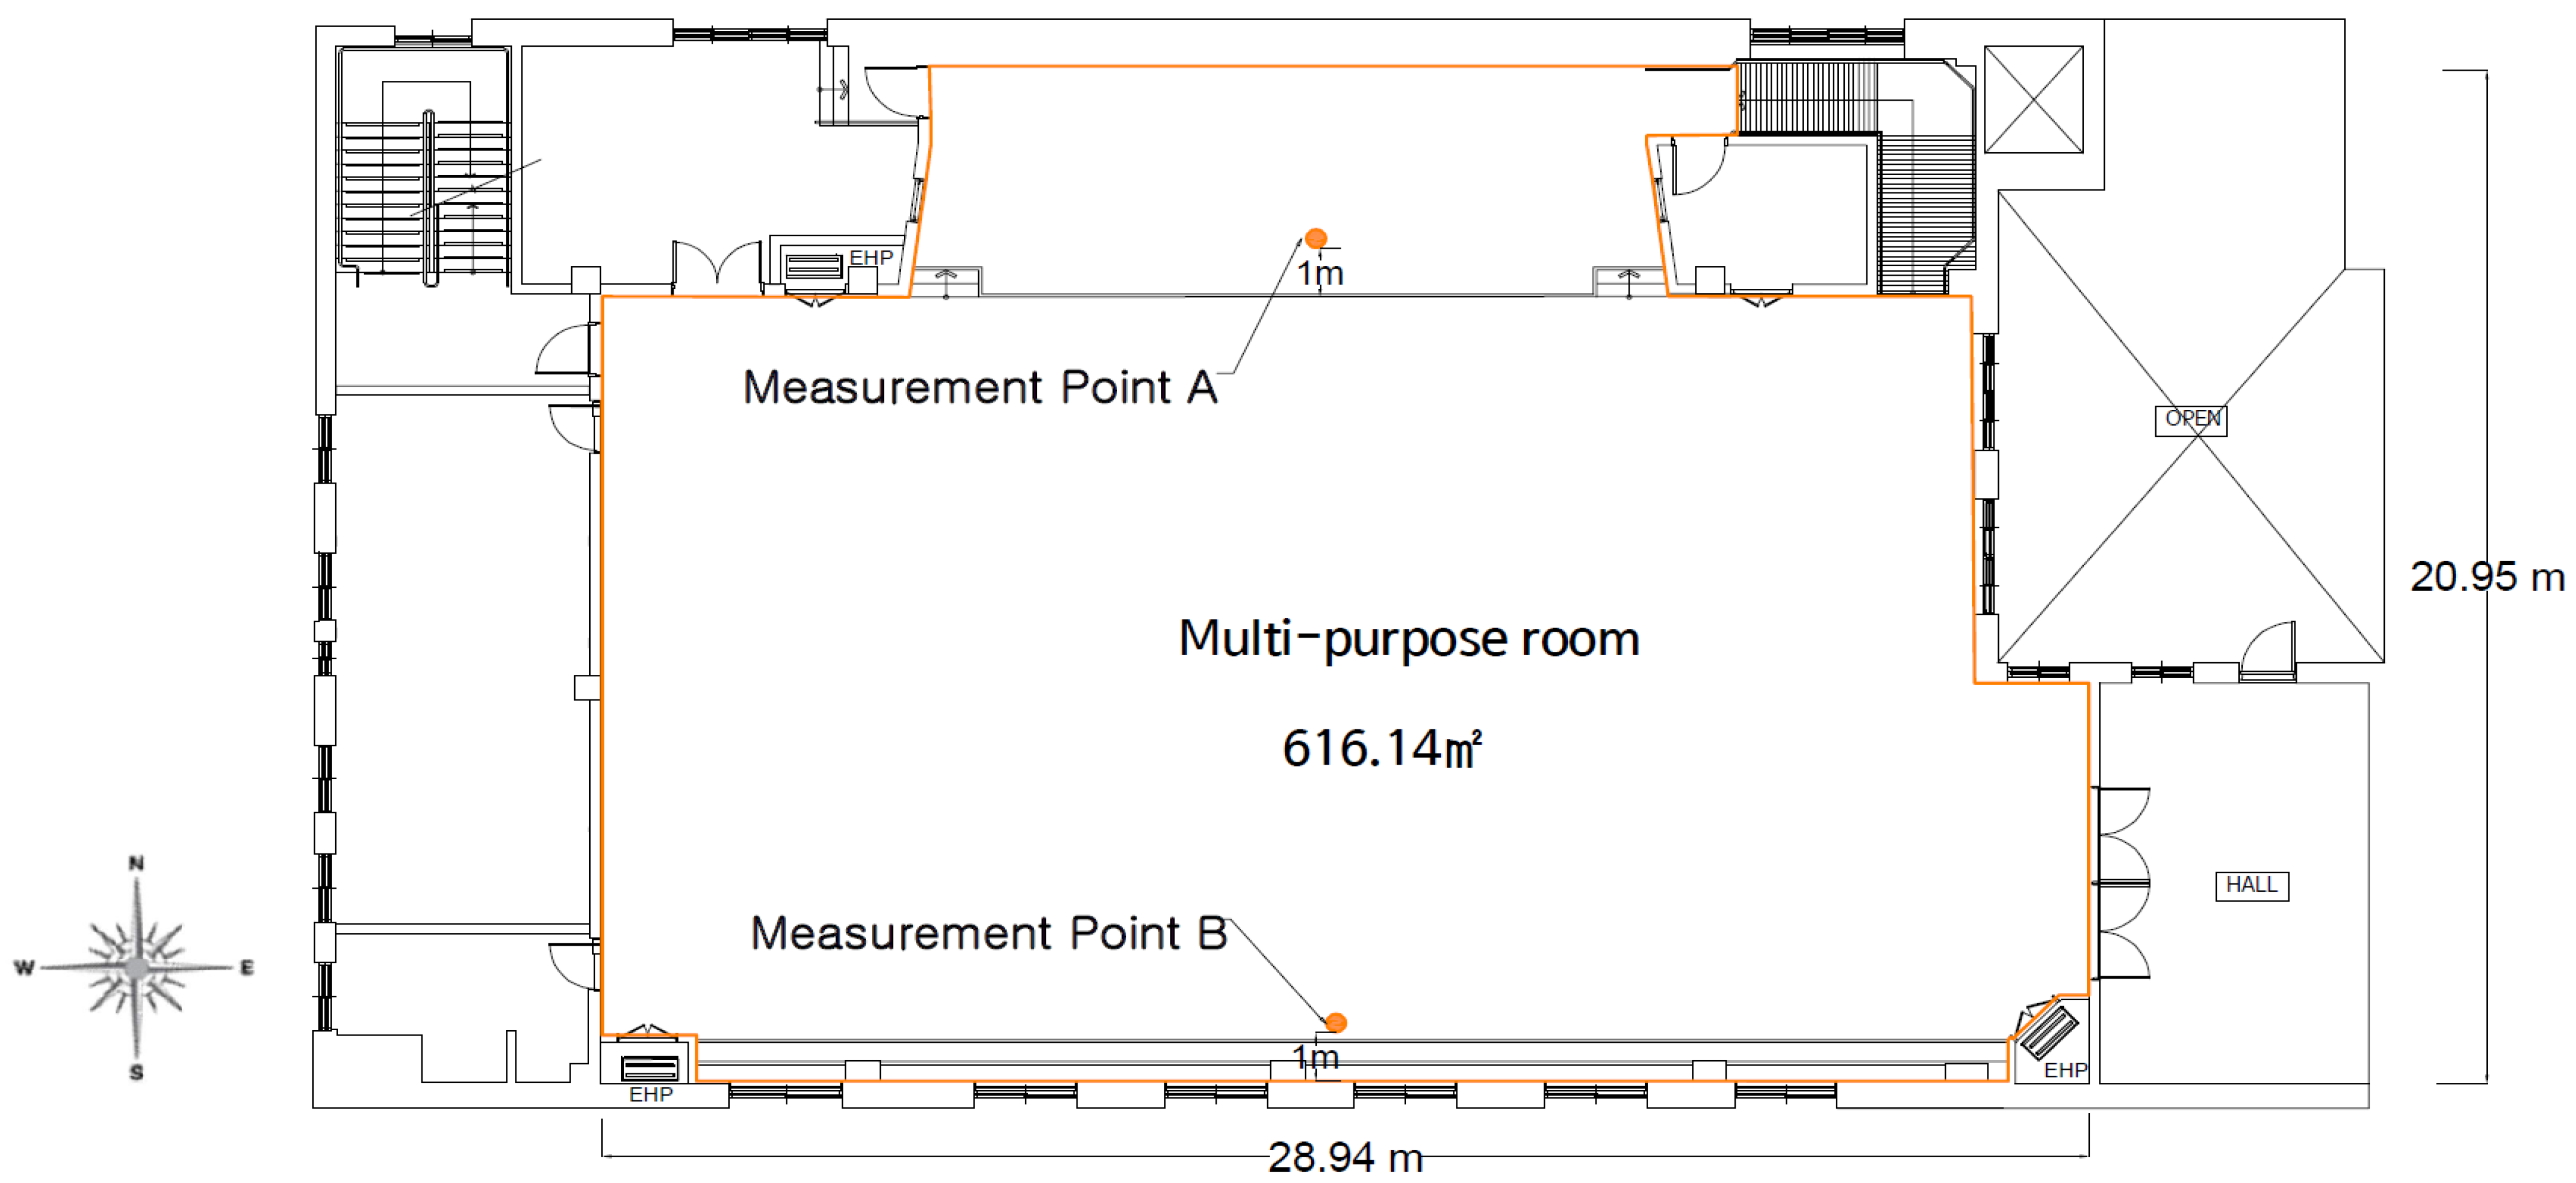
3.1. Architectural Factors of the Indoor MPA-Space in the Elementary Schools
3.2. Equipment Factors of the Indoor MPA-Space in the Elementary Schools
4. Analysis of the Indoor Air Quality Characteristics Based on the Volume of the MPA-Space
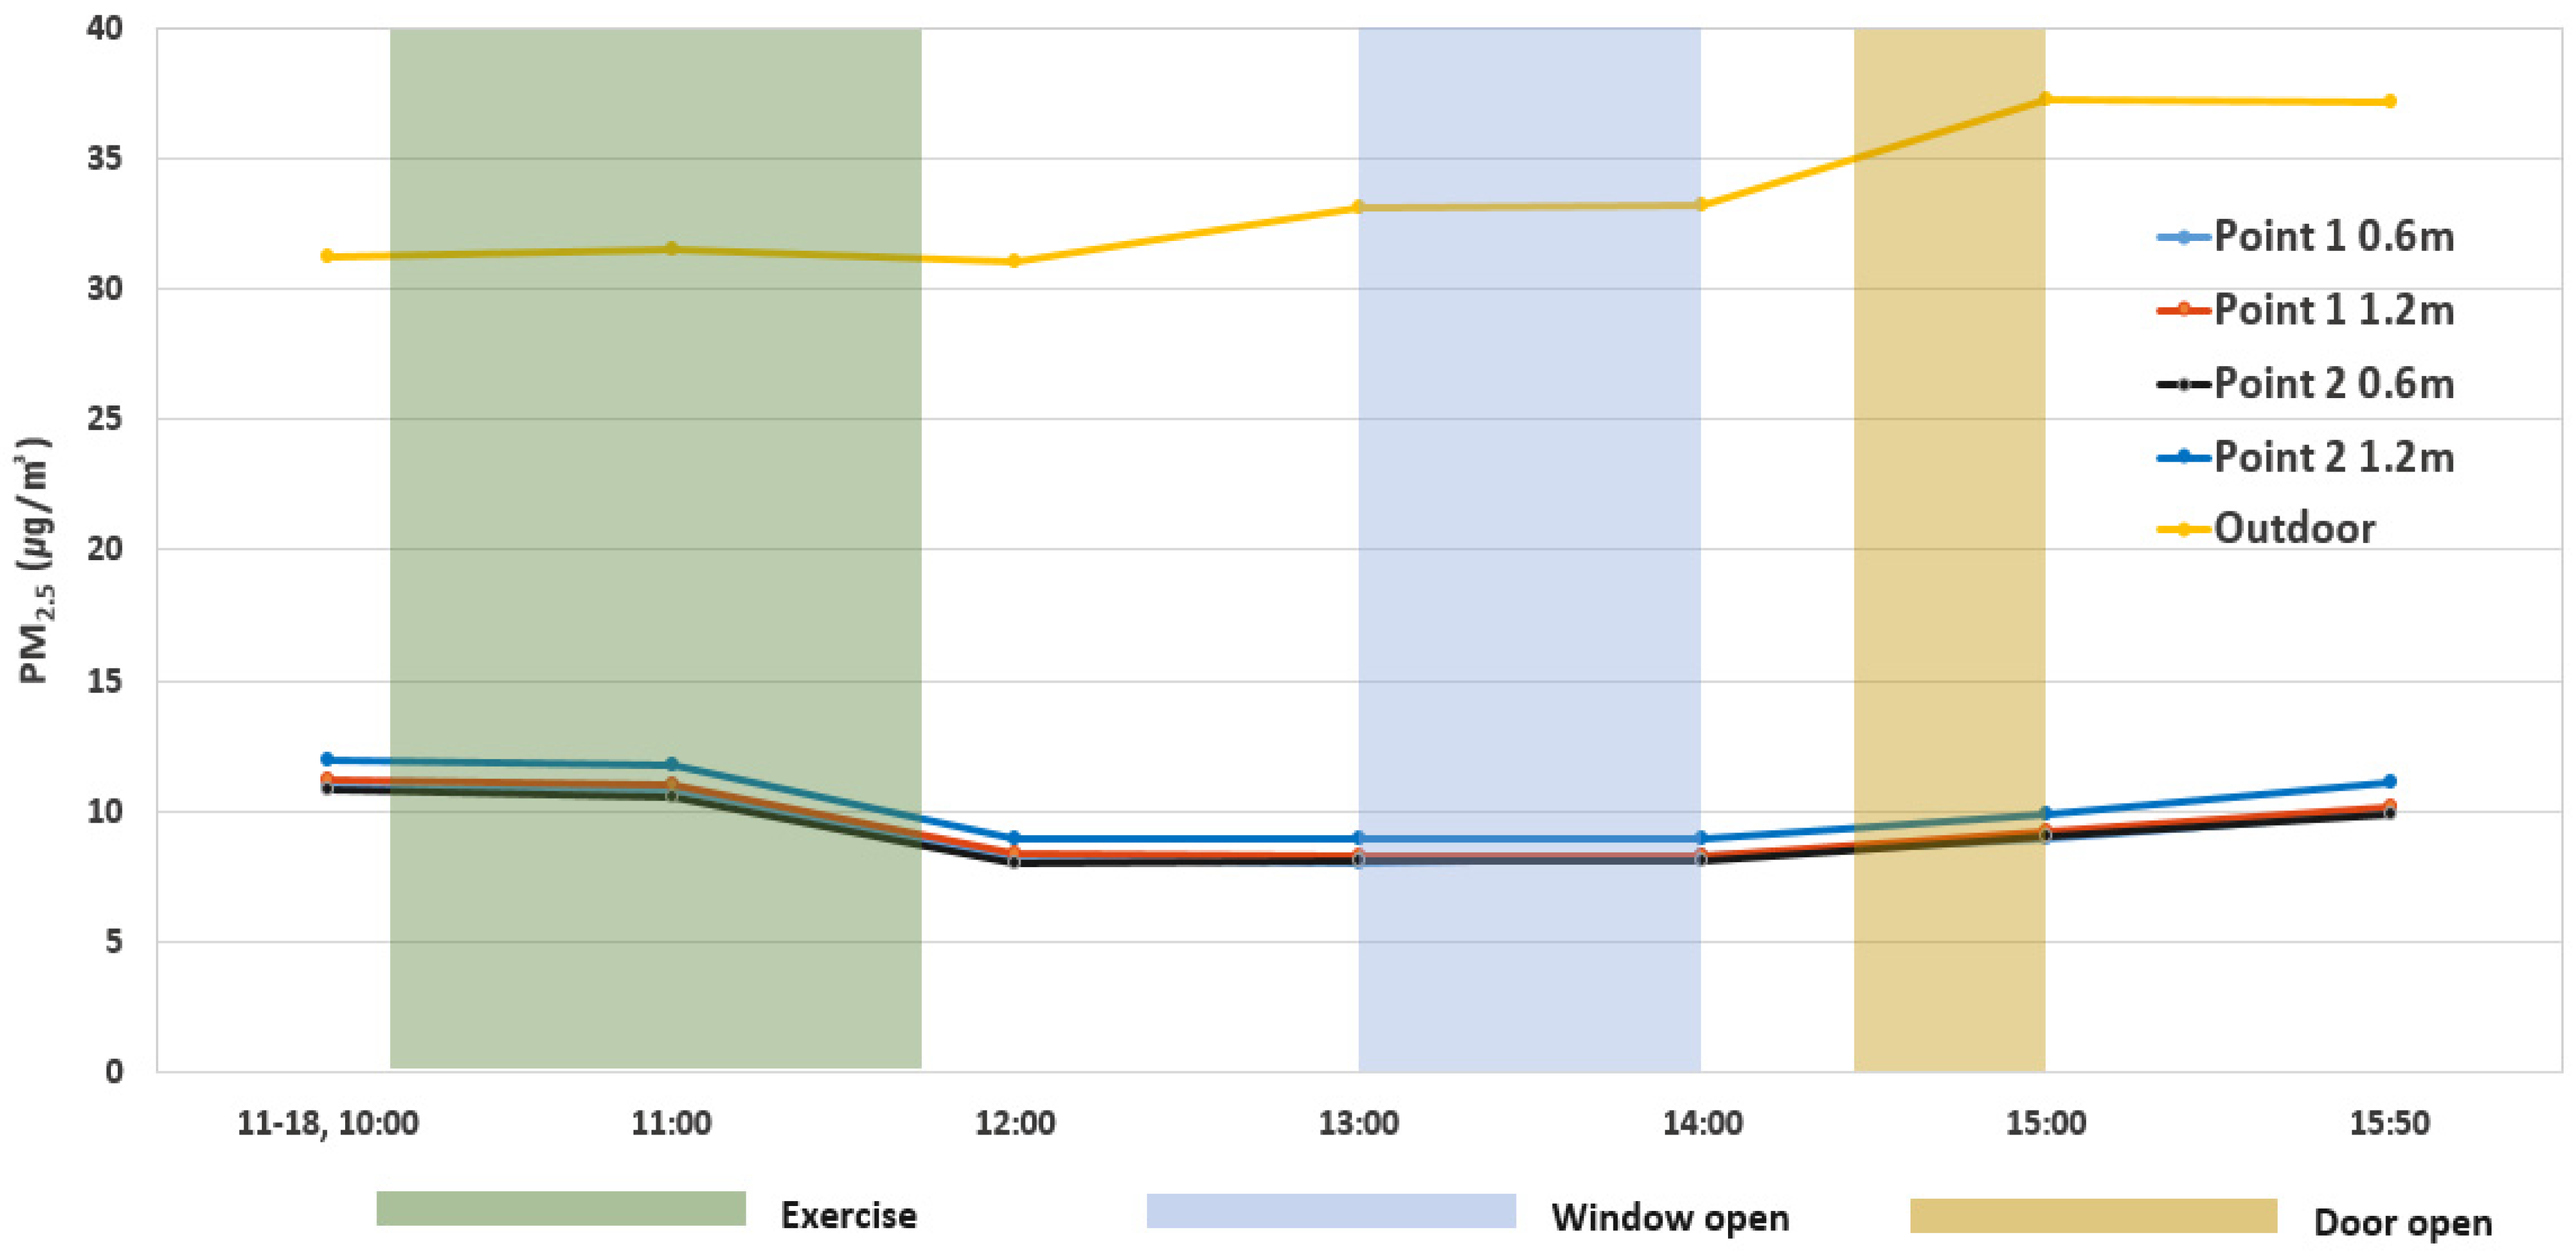
4.1. Indoor Air Quality Experiment of the MPA-Space
4.2. Simulation Analysis of the MPA-Space
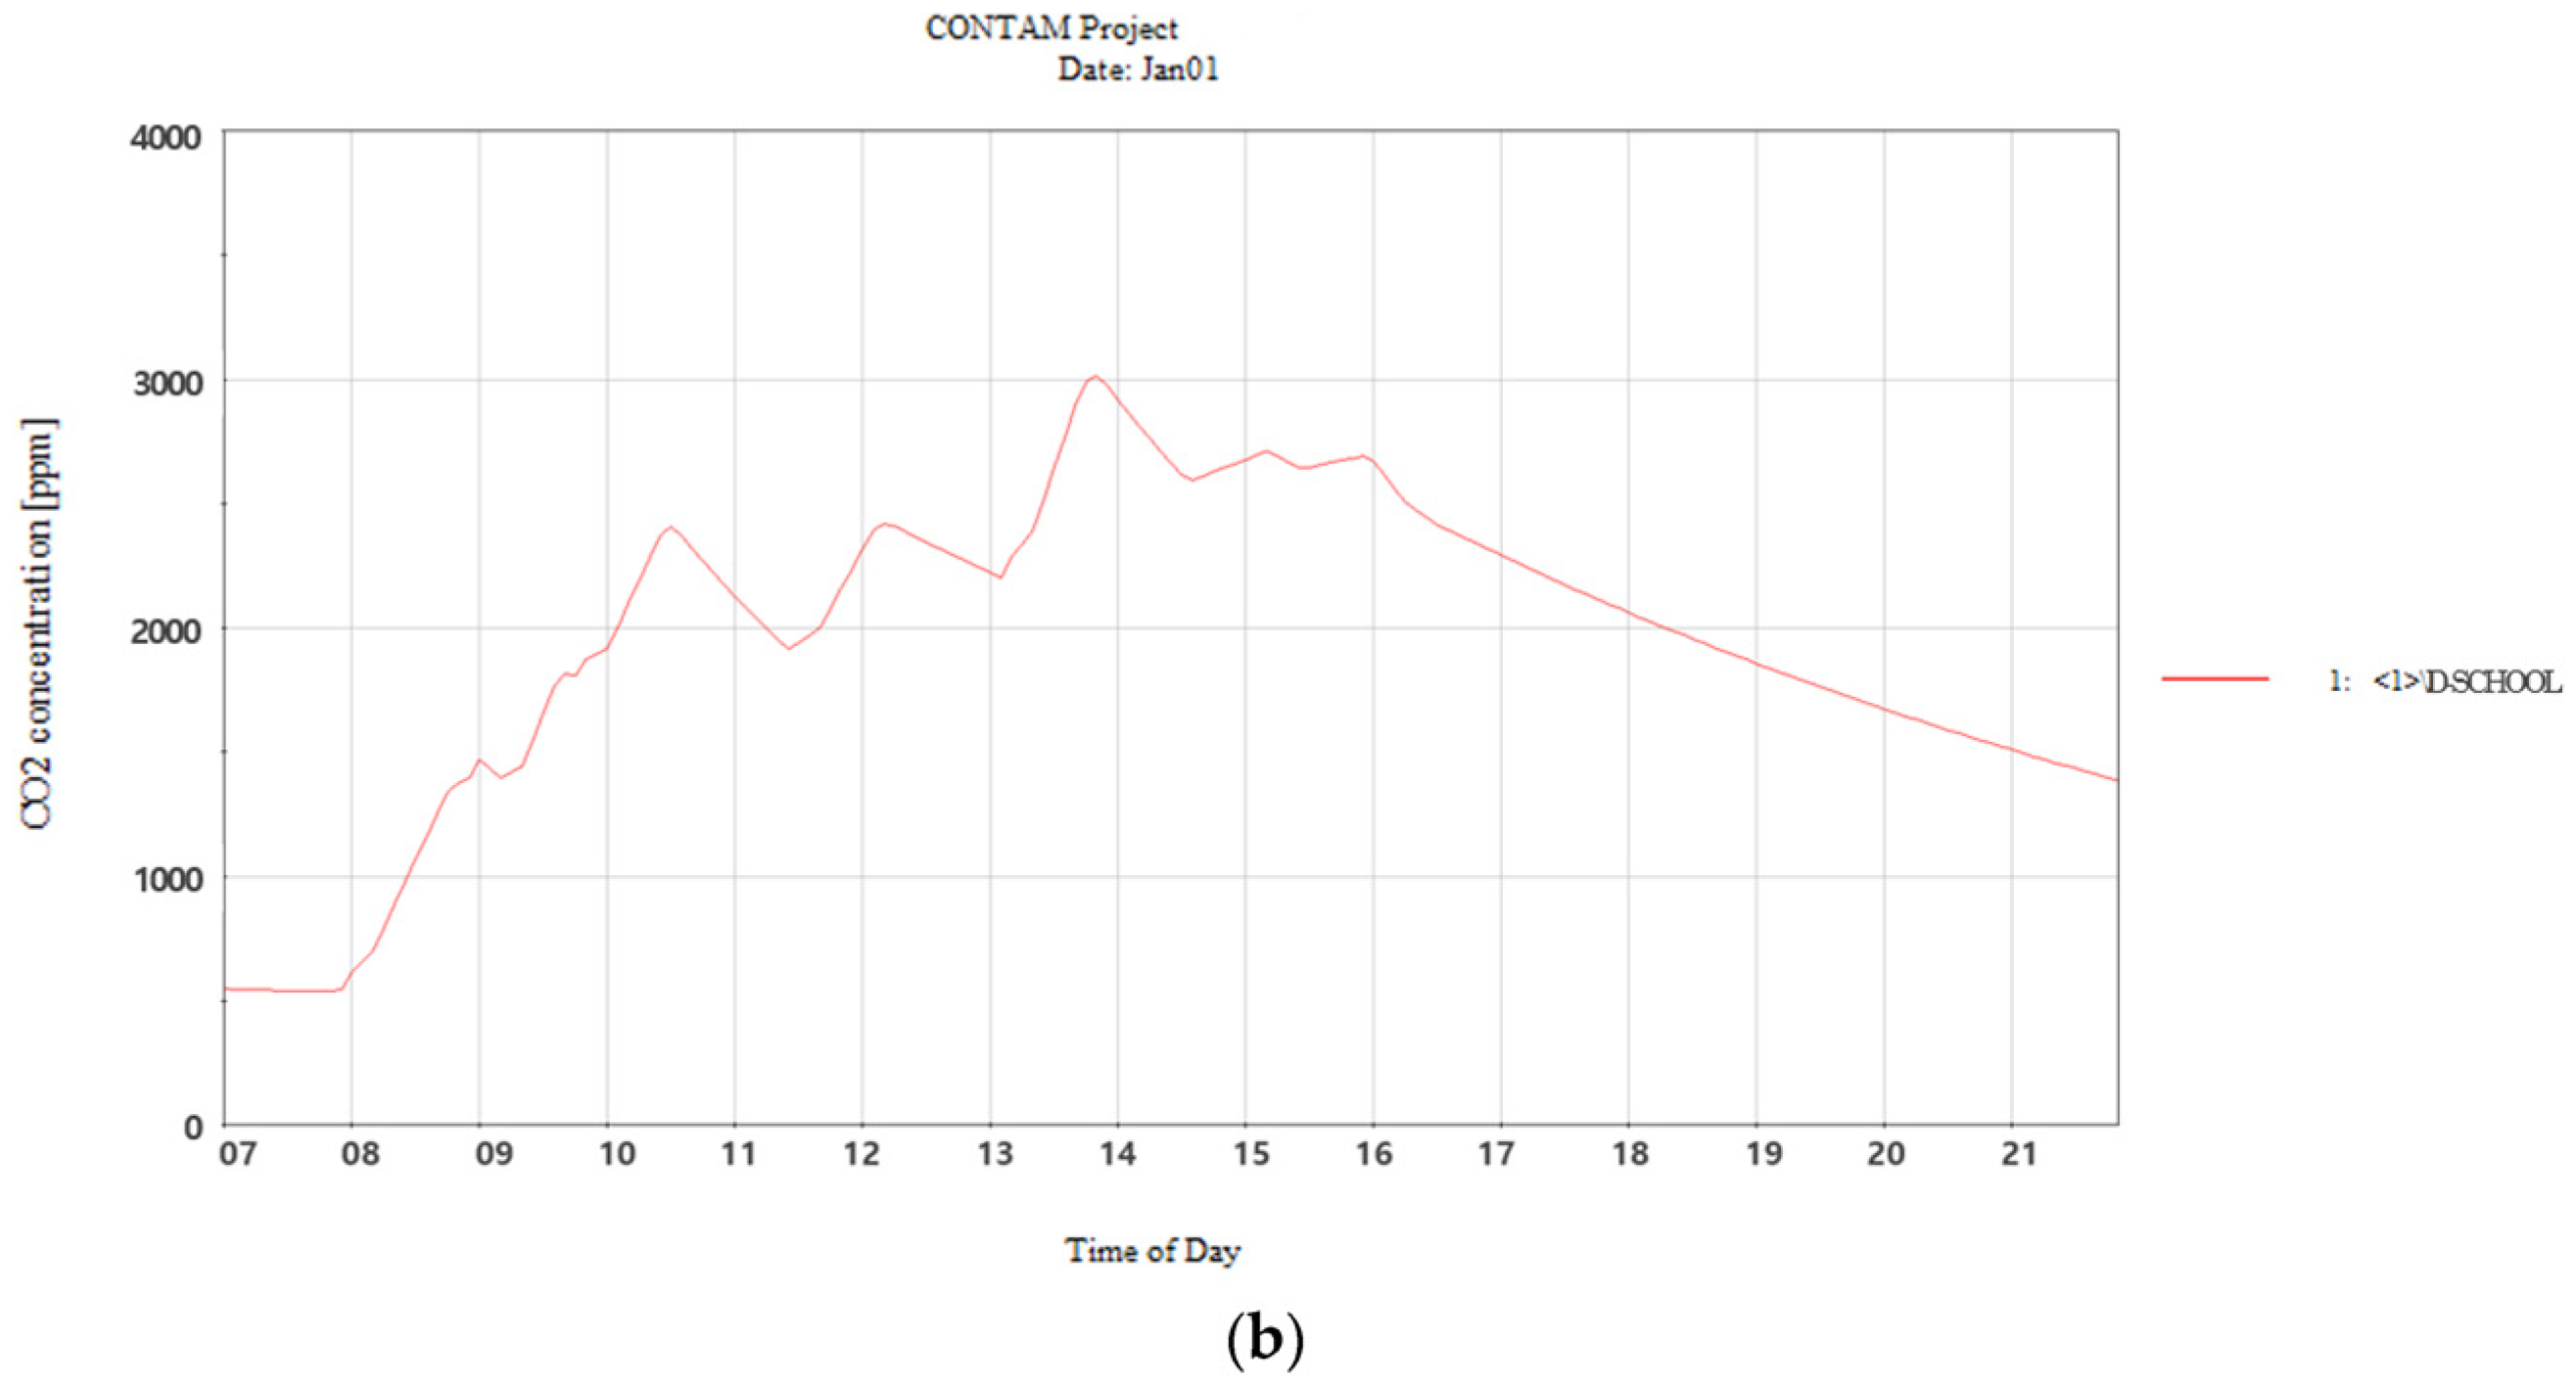
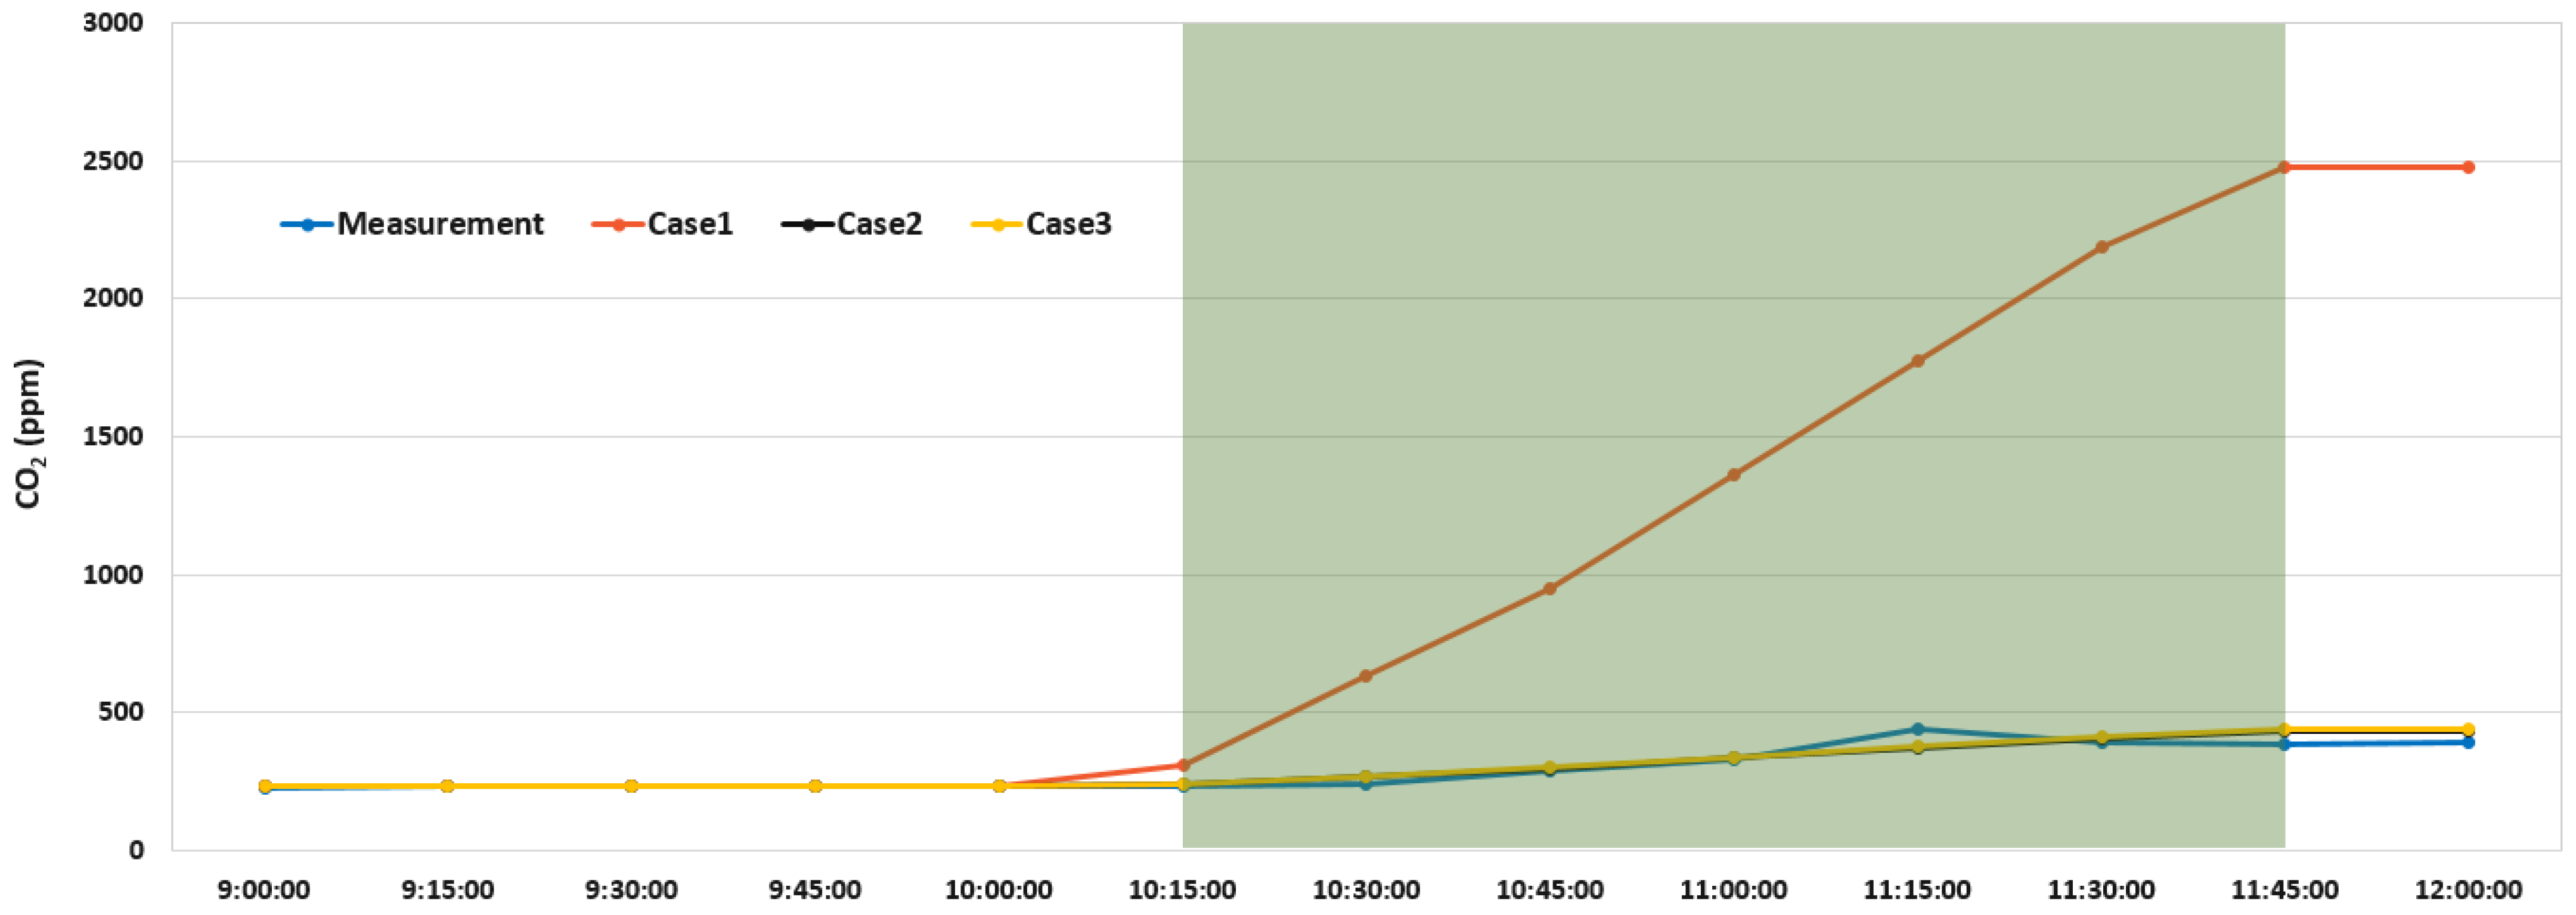
4.3. Verification of the Indoor Air Quality of the MPA-Space
4.4. Simulation Verification Analysis of the MPA-Space
5. Measures against Increase in Indoor CO2 Concentration Due to Physical Education Activities
5.1. Optimum Volume per Occupant for Each Physical Eduction Activity
5.2. Determination of the Optimum Number of Occupants for an MPA-Space
6. Discussion
7. Conclusions
- (1)
- The characteristics of the indoor air pollutants in the indoor MPA-space were identified, and the increase in the quantity of these pollutants as a function of the physical education activity was characterized.
- (2)
- The amount of CO2 generated per elementary school student per hour ranged from 0.0120 to 0.0323 g/s. In addition, the average space volume required per person at an initial indoor CO2 concentration of 520 ppm was approximately 88 m3/h∙person for a one-hour physical activity. Furthermore, the optimum volume required by 35 elementary school students engaging in physical activities for an hour to maintain the indoor CO2 concentration below 1000 ppm was 3080 m3.
- (3)
- A correlation equation for the required volume per person for each activity was derived using the analysis of the amount of CO2 per person per hour for each activity, and a guideline was presented based on this result.
- (4)
- The required volume of the MPA-space was determined based on the predetermined optimum number of occupants, and a guideline for design purposes was presented.
- (5)
- A correlation formula was provided to help physical education teachers identify the characteristics of indoor air pollutants during physical education activities and conduct physical education classes.
Author Contributions
Funding
Institutional Review Board Statement
Conflicts of Interest
References
- Kang, D.M.; Kim, J.E. Fine, Ultrafine, and Yellow Dust: Emerging Health Problems in Korea. J. Korean Med. Sci. 2014, 29, 621–622. [Google Scholar] [CrossRef] [Green Version]
- Korea Ministry of Environment. Enforcement Rules of the Domestic Indoor Air Quality Management Act; Ministry of Environment Ordinance No. 918; Annex 2 Maintenance Standards; Korea Ministry of Environment: Seoul, Korea, 2021.
- Fine Dust Data by Year in China. Available online: https://aqicn.org/city/hongkong/kr (accessed on 1 August 2021).
- National Institute of Environmental Research. 2019 Air Environment Annual Report; Korea Environment Corporation: Sejong, Korea, 2020.
- IQAir AirVisual. 2019 World Air Quality Report; IQAir: Goldach, Switzerland, 2020. [Google Scholar]
- Myung, H.-N. 2017 Fine Dust and Health in Our Region; Open Chungnam: Chungnam, Korea, 2017; Volume 79, pp. 13–17. [Google Scholar]
- Fine Dust Alert Status Report; Chungnam Institute of Health and Environment: Chungnam, Korea, 2017.
- Jung, S.-K.; Jun, K.-W. A Study on the Health Vulnerability Assessment of Particle Matter in Incheon. J. Korean Soc. Hazard Mitig. 2020, 20, 31–40. [Google Scholar] [CrossRef] [Green Version]
- Kim, S.-A.; Park, J.-H.; Han, D.-Y.; Chung, I.-J. The Effects of Fine Dust on Children’s Health: The Moderating Effects of Poverty and Green Area Ratio. J. Korean Soc. Hazard Mitig. 2020, 20, 163–171. [Google Scholar] [CrossRef] [Green Version]
- Ministry of Environment. High-Concentration Fine Dust Response Manual for the Protection of Vulnerable Groups such as Children, Students, and Senior Citizens; Ministry of Environment: Sejong, Korea, 2016; p. 2.
- Bennett, W.D.; Zeman, K.L.; Jarabek, A.M. Nasal Contribution to Breathing and Fine Particle Deposition in Children versus Adults. J. Toxicol. Environ. Health 2008, 71, 227–237. [Google Scholar] [CrossRef]
- Bateson, T.F.; Schwartz, J. Children’s Response to Air Pollutants. J. Toxicol. Environ. Health 2008, 71, 238–343. [Google Scholar] [CrossRef] [PubMed]
- Jang, N.-R.; Lee, S.-W. A Study on Elementary School Students Knowledge·Awareness and Attitude toward Fine Dust. J. Korean Pract. Arts Educ. 2020, 33, 1–20. [Google Scholar] [CrossRef]
- Lee, B.-S.; Park, J.-K. Comparison about Time Serial Change of Carbon Dioxide’s Concentration and Ventilation at Apartment Room. J. Korea Soc. Environ. Adm. 2006, 12, 27–36. [Google Scholar]
- Park, Y.-J.; Kim, Y.-J. Study on the Perception of Indoor Air Quality in a Dance Education Space. Korean J. Danc. 2019, 19, 71–82. [Google Scholar] [CrossRef]
- Yu, S.; HE, L.; Feng, G. The Transient Simulation of Carbon Dioxide Emission from Human Body Based on Contam. Procedia Eng. 2015, 121, 1613–1619. [Google Scholar] [CrossRef] [Green Version]
- Lim, S.-G.; Kim, J.-H.; Kim, T.-H.; Lee, K.-Y.; Yang, W.-H.; Jung, S.-G.; Yu, S.-D. Personal exposures to PM 2.5 and their relationships with microenvironmental concentrations. Atmos. Environ. 2012, 47, 407–412. [Google Scholar] [CrossRef]
- Seoul Metropolitan Office of Education. 2019 Seoul Metropolitan Office of Education Working Manual for High Concentration Fine Dust Response; Seoul Metropolitan Office of Education: Seoul, Korea, 2019. [Google Scholar]
- Park, H.-S.; Kim, M.-S.; Kim, S.-H.; Ma, R.-W.; Kim, M.-S. The Influence of Awareness regarding Particulate Matter, Perceived Respiratory Symptoms, and Physical Activities on Health Promotion Behavior of Elementary School Children. J. Korean Acad. Fundam. Nurs. 2020, 27, 95–105. [Google Scholar] [CrossRef]
- Lee, S.-M. A qualitative case study on physical education classes for efforts to overcome fine dust. J. Korean Soc. Study Phys. Educ. 2019, 8, 73–88. [Google Scholar]
- National School Information, Number of Students. Available online: https://www.schoolinfo.go.kr/ (accessed on 1 August 2021).
- Korean Institute of Educational Environment. Academic Research on School Facility Plan Design Guidelines and Facility Standards Development; Metropolitan Office of Education: Seoul, Korea, 2013. [Google Scholar]
- Building Plan Data, Elementary/Secondary School Planning and Design Materials. Available online: https://www.archidata.co.kr/ (accessed on 1 August 2021).
- Lee, C.-W.; Suh, K.-W.; Kang, Y.-J.; Kim, D.-W.; Jo, M.-T. Investigation of Jet Air Turnover System Using a Numerical Method. In Proceedings of the 2014 SAREK Summer Annual Conference, Pyeongchang, Korea, 25–27 June 2014; pp. 557–562. [Google Scholar]
- Information on Waiting around Our School, Measurement Data Inquiry. Available online: https://www.airkorea.or.kr/web/realschoolSearch (accessed on 1 August 2021).
- Department of the Environment. Enforcement Rules of the Indoor Air Quality Control Act; Ministry of Environment Decree: Seoul, Korea, 2020; p. 858.
- Yun, J.-U. Experiment and Analysis of Ventilation Rate for Maintaining CO2 Concentration in School Buildings. Master’s Thesis, Seoul National University of Science and Technology, Seoul, Korea, 2019. [Google Scholar]
- Turanjanin, V.; Vučićević, B.; Jovanović, M.; Mirkov, N.; Lazović, I. Indoor CO2 Measurements in Serbian Schools and Ventilation Rate Calculation. Energy 2014, 77, 290–296. [Google Scholar] [CrossRef]
- Undram, M.-C.; Song, D.-S.; Kim, J.-W. A Review of the Test Methods for Air-tightness Performance of Building Components Using the Blower Door System. Korea J. Air-Cond. Refrig. Eng. 2019, 31, 216–226. [Google Scholar]
- ASHRAE. 2017 ASHRAE Handbook Fundamentals; ASHRAE: Atlanta, GA, USA, 2017. [Google Scholar]
- Hering, S.V.; Lunden, M.M.; Thatcher, T.L.; Kirchstetter, T.W.; Brown, N.J. Using Regional Data and Building Leakage to Assess Indoor Concentrations of Particles of Outdoor Origin. Aerosol. Sci. Technol. 2007, 41, 639–654. [Google Scholar] [CrossRef]
- Lee, Y.G.; Shin, C.W. The Air Leakage Characteristics and Airtightness Performance of a Newly Built Apartment. Korean J. Air-Cond. Refrig. Eng. 2013, 25, 606–611. [Google Scholar]
- Kim, M.S.; Auh, J.S.; Hong, G.P.; Kim, B.S. Analysis on Ventilation Performance of Natural Ventilation Systems in Multi-Family Housing Using Blower Door Test. Korea Inst. Ecol. Archit. Environ. 2016, 16, 129–134. [Google Scholar]
- Cho, Y.-M.; Lee, J.-Y.; Kwon, S.-P.; Park, D.-S.; Park, J.-H.; Cho, K.-C. The Distribution Characteristics of Carbon Dioxide in Indoor School Spaces. J. Korean Soc. Atmos. Environ. 2011, 27, 117–125. [Google Scholar] [CrossRef] [Green Version]
- Kapalo, P.; Vilcekova, S.; Voznyak, O. Using Experimental Measurements of the Concentrations of Carbon Dioxide for Determining the Intensity of Ventilation in the Rooms. Chem. Eng. Trans. 2014, 39, 1789–1794. [Google Scholar]
- So, J.S.; Yoo, S.Y. A Prediction of CO2 Concentration and Measurement of Indoor Air Quality in the EMU. J. Korean Soc. Railw. 2008, 11, 378–383. [Google Scholar]
- Shafie, N.E.A.; Kamar, H.M.; Kamsah, N. Effects of Air Supply Diffusers and Air Return Grilles Layout on Contaminants Concentration in Bus Passenger Compartment. Int. J. Automot. Technol. 2016, 17, 751–762. [Google Scholar] [CrossRef]
- Jeong, J.H.; Roh, J.Y.; Lee, H.S.; Jeon, E.C. Development of Non-CO2 Emission Factor of Wood Chip Fired Fluidized Bed Combustion. J. Clim. Chang. Res. 2019, 10, 221–226. [Google Scholar] [CrossRef]
- Kim, J.-E.; Han, J.-S.; Kim, Y.-G.; Han, J.-W.; Yang, J.-Y.; Park, Y.-S.; Yi, S.-H. Trends Analysis of Carbon Dioxide Concentration Changes in Classroom. In Proceedings of the 2012 KIGAS Autumn Conference, Gangneug, Korea, 23 November 2012; p. 125. [Google Scholar]
- Stuart Dols, W.; Polidoro, B.J. Contam User Guide and Program Documentation, Version 3.2.; NIST: Gaithersburg, MD, USA, 2015. [Google Scholar]
- So, M.-S.; Shin, J.-H. Performance Degradation Prediction of Industrial Equipment using Machine Learning. Korean J. Comput. Des. Eng. 2019, 24, 268–279. [Google Scholar] [CrossRef]
- Shin, K.-J.; Kim, H.-J.; Cho, Y.-H. A study of the Prediction Model of Indoor Carbon Dioxide Concentrations. J. Korean Inst. Archit. Sustain. Environ. Build. Syst. 2016, 10, 83–89. [Google Scholar]
- Hong, T.-H.; Kim, H.-P.; Kim, J.-M.; An, J.-B.; Kang, H.-A.; Hong, J.-W.; Yeom, S.-K. Development of the Indoor fine dust density forecast model using Long Short Term Memory. In Proceedings of the 2018 Korea Society of Energy & Climate Change Conference, Jeju, Korea, 28 November 2018; Volume 11, p. 185. [Google Scholar]
- Kim, S.-H.; Han, G.-T. A Study of Indoor Air Pollution Prediction based on LSTM Model using Fine Dust Sensor Data in Kitchen Environment. In Proceedings of the Symposium of the Korean Institute of communications and Information Sciences, Seoul, Korea, 5 February 2020; pp. 1127–1128. [Google Scholar]
- Buonanno, G.; Fuoco, F.C.; Morawska, L.; Stabile, L. Airborne particle concentrations at schools measured at different spatial scales. Atmos. Environ. 2013, 67, 38–45. [Google Scholar] [CrossRef]
- Alves, C.A.; Calvo, A.I.; Castro, A.; Fraile, R.; Evtyugina, M.; Bate-Epey, E.F. Indoor Air Quality in Two University Sports Facilities. Aerosol Air Qual. Res. 2013, 13, 1723–1730. [Google Scholar] [CrossRef] [Green Version]
- Dutton, S.; Shao, L.; Riffat, S. Validation and Parametric Analysis of EnergyPlus: Air Flow Network Model Using CONTAM. In Proceedings of the Third National Conference of IBPSA, Berkeley, CA, USA, 30 July–1 August 2008; pp. 124–131. [Google Scholar]
- Wang, Z.; Hu, Y.; Jiang, J. Numerical investigation of leaking and dispersion of carbon dioxide indoor under ventilation condition. Energy Build. 2013, 66, 461–466. [Google Scholar] [CrossRef]
- Khatami, N.; Cook, M.J.; Firth, S.K.; Hudleston, N. Control of carbon dioxide concentration in educational spaces using natural ventilation. Int. J. Vent. 2013, 11, 339–352. [Google Scholar] [CrossRef] [Green Version]
- Song, K.-D. The Research Issues and Recent Activities in HVAC Design for Large Enclosures; The Society of Air-Conditioning and Refrigerating Engineers of Korea: Seoul, Korea, November 1997; Volume 11, pp. 3–20. [Google Scholar]
- Seo, M.-S.; Jung, S.-H.; Park, C.-S.; Kim, Y.-T.; Cho, J.-S. HVAC Design and construction procedures in the large enclosures. In Proceedings of the 2013 SAREK Summer Conference, Yongpyong, Korea, 20–22 December 2013; pp. 667–672. [Google Scholar]
- Teleszewski, T.; Gładyszewska-Fiedoruk, K. Changes of Carbon Dioxide Concentrations in Classrooms: Simplified Model and Experimental Verification. Pol. J. Environ. Stud. 2018, 27, 2397–2409. [Google Scholar] [CrossRef]
- Darus, F.M.; Nasir, R.A.; Sumari, S.M.; Ismail, Z.S.; Omar, N.A. Heavy Metals Composition of Indoor Dust in Nursery Schools Building. Soc. Behav. Sci. 2012, 38, 169–175. [Google Scholar] [CrossRef] [Green Version]
- McGrath, J.A.; Byrne, M.A.; Ashmore, M.R.; Terry, A.C.; Dimitroulopoulou, C. A simulation study of the changes in PM2.5 concentrations due to interzonal airflow variations caused by internal door opening patterns. Atmos. Environ. 2014, 87, 183–188. [Google Scholar] [CrossRef]
- Kapalo, P.; Mečiarová, Ľ.; Vilčeková, S.; Burdová, E.K.; Domnita, F.; Bacotiu, C.; Péterfi, K.E. Investigation of CO2 production depending on physical activity of students. Int. J. Environ. Health Res. 2019, 29, 31–44. [Google Scholar] [CrossRef] [PubMed]
- Tsega, E.G.; Katiyar, V.K.; Gupta, P. Breathing Patterns of Healthy Human Response to Different Levels of Physical Activity. J. Biomed. Eng. Technol. 2019, 7, 1–4. [Google Scholar] [CrossRef]
- Kapalo, P.; Domniţa, F.; Bacoţiu, C.; Spodyniuk, N. The Impact of Carbon Dioxide Concentration on the Human Health—Case Study. J. Appl. Eng. Sci. 2018, 8, 61–66. [Google Scholar] [CrossRef] [Green Version]
- Al-Rashidi, K.; Loveday, D.; Al-Mutawa, N. Impact of ventilation modes on carbon dioxide concentration levels in Kuwait classrooms. Energy Build. 2012, 47, 540–549. [Google Scholar] [CrossRef]
- Teleszewski, T.; Gładyszewska-Fiedoruk, K. The concentration of carbon dioxide in conference rooms: A simplified model and experimental verification. Int. J. Environ. Sci. Technol. 2019, 16, 8031–8040. [Google Scholar] [CrossRef] [Green Version]
- Persily, A.; Jonge, L. Carbon dioxide generation rates for building occupants. Indoor Air 2017, 27, 868–879. [Google Scholar] [CrossRef] [PubMed]


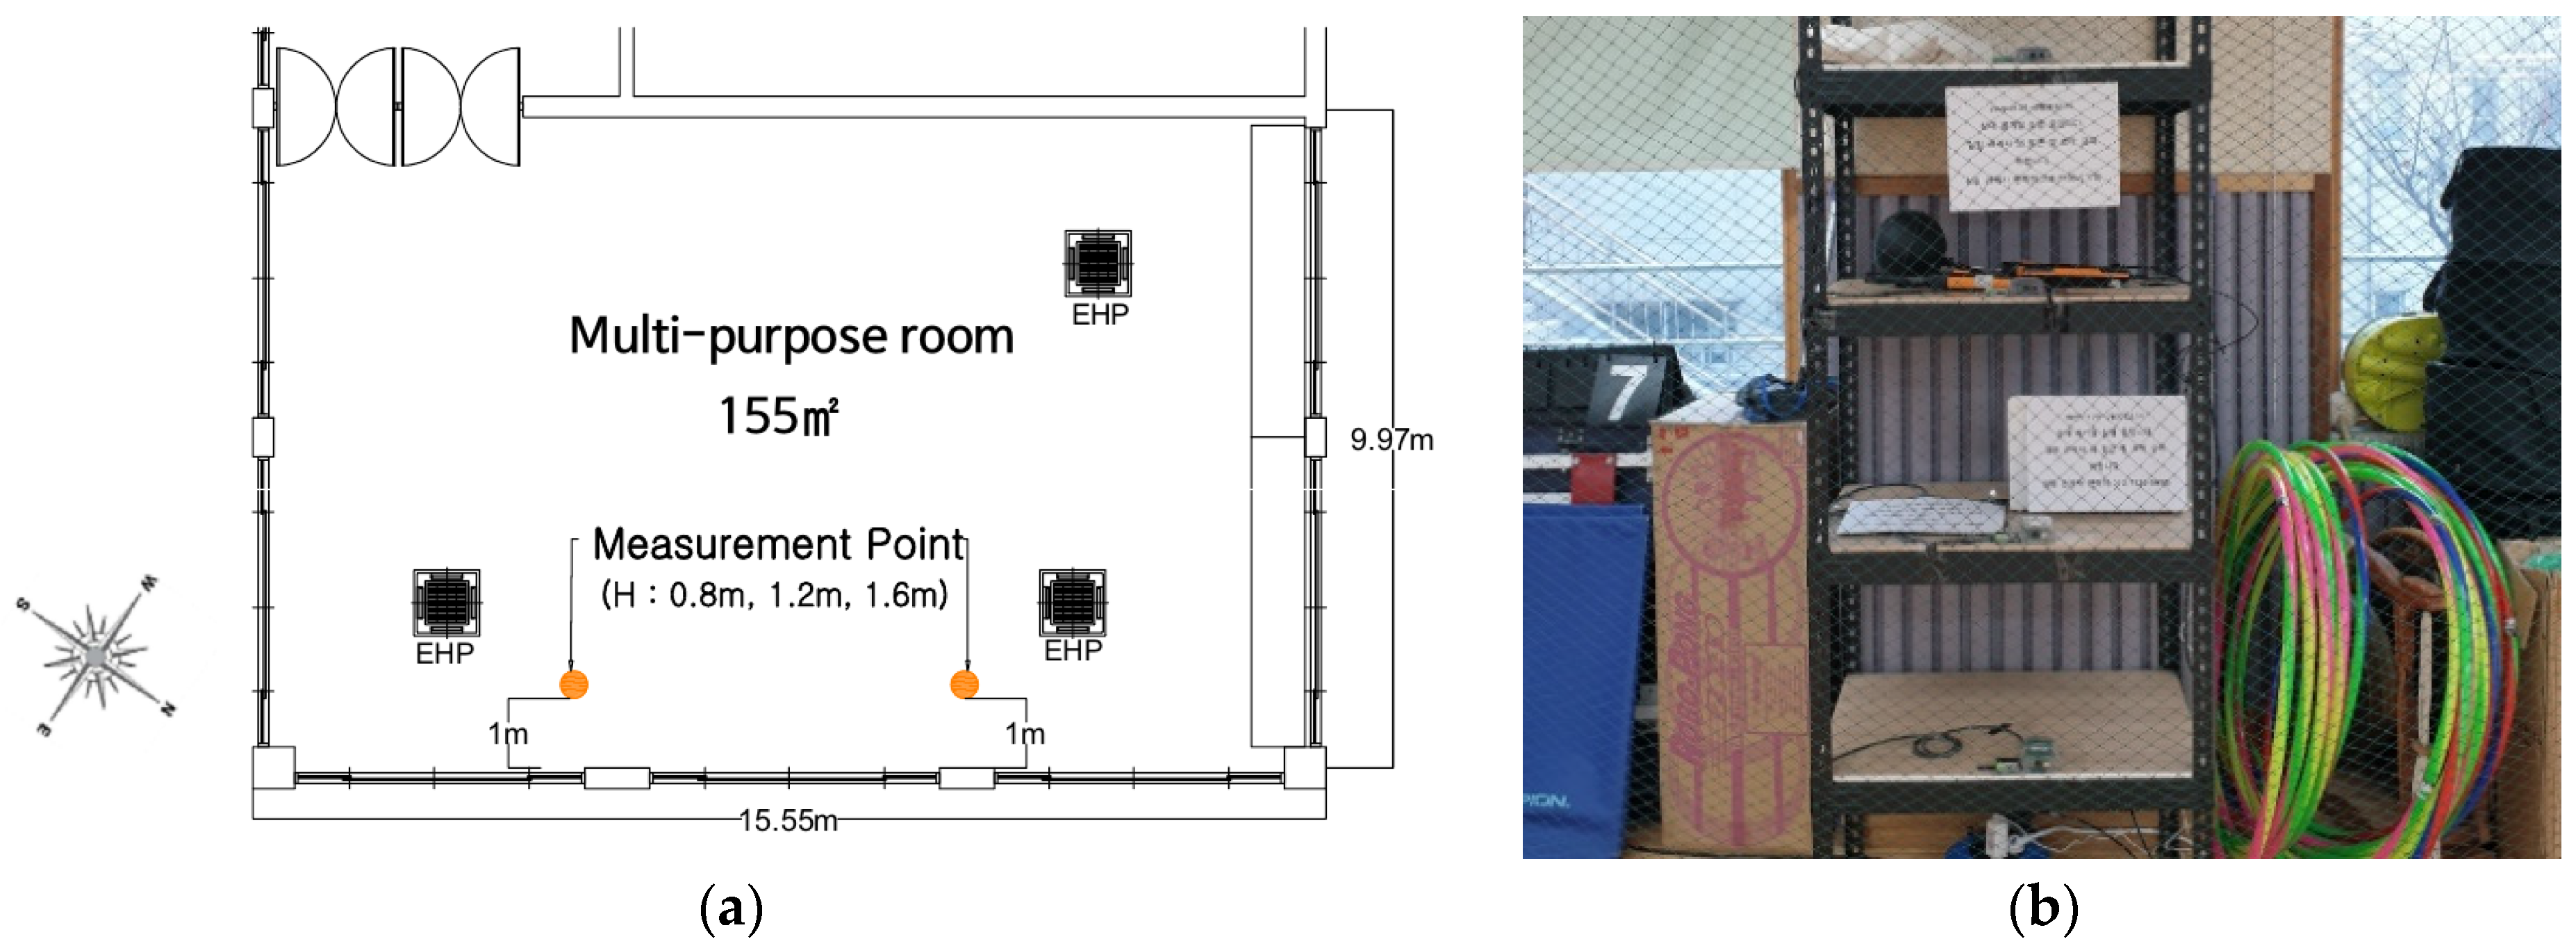
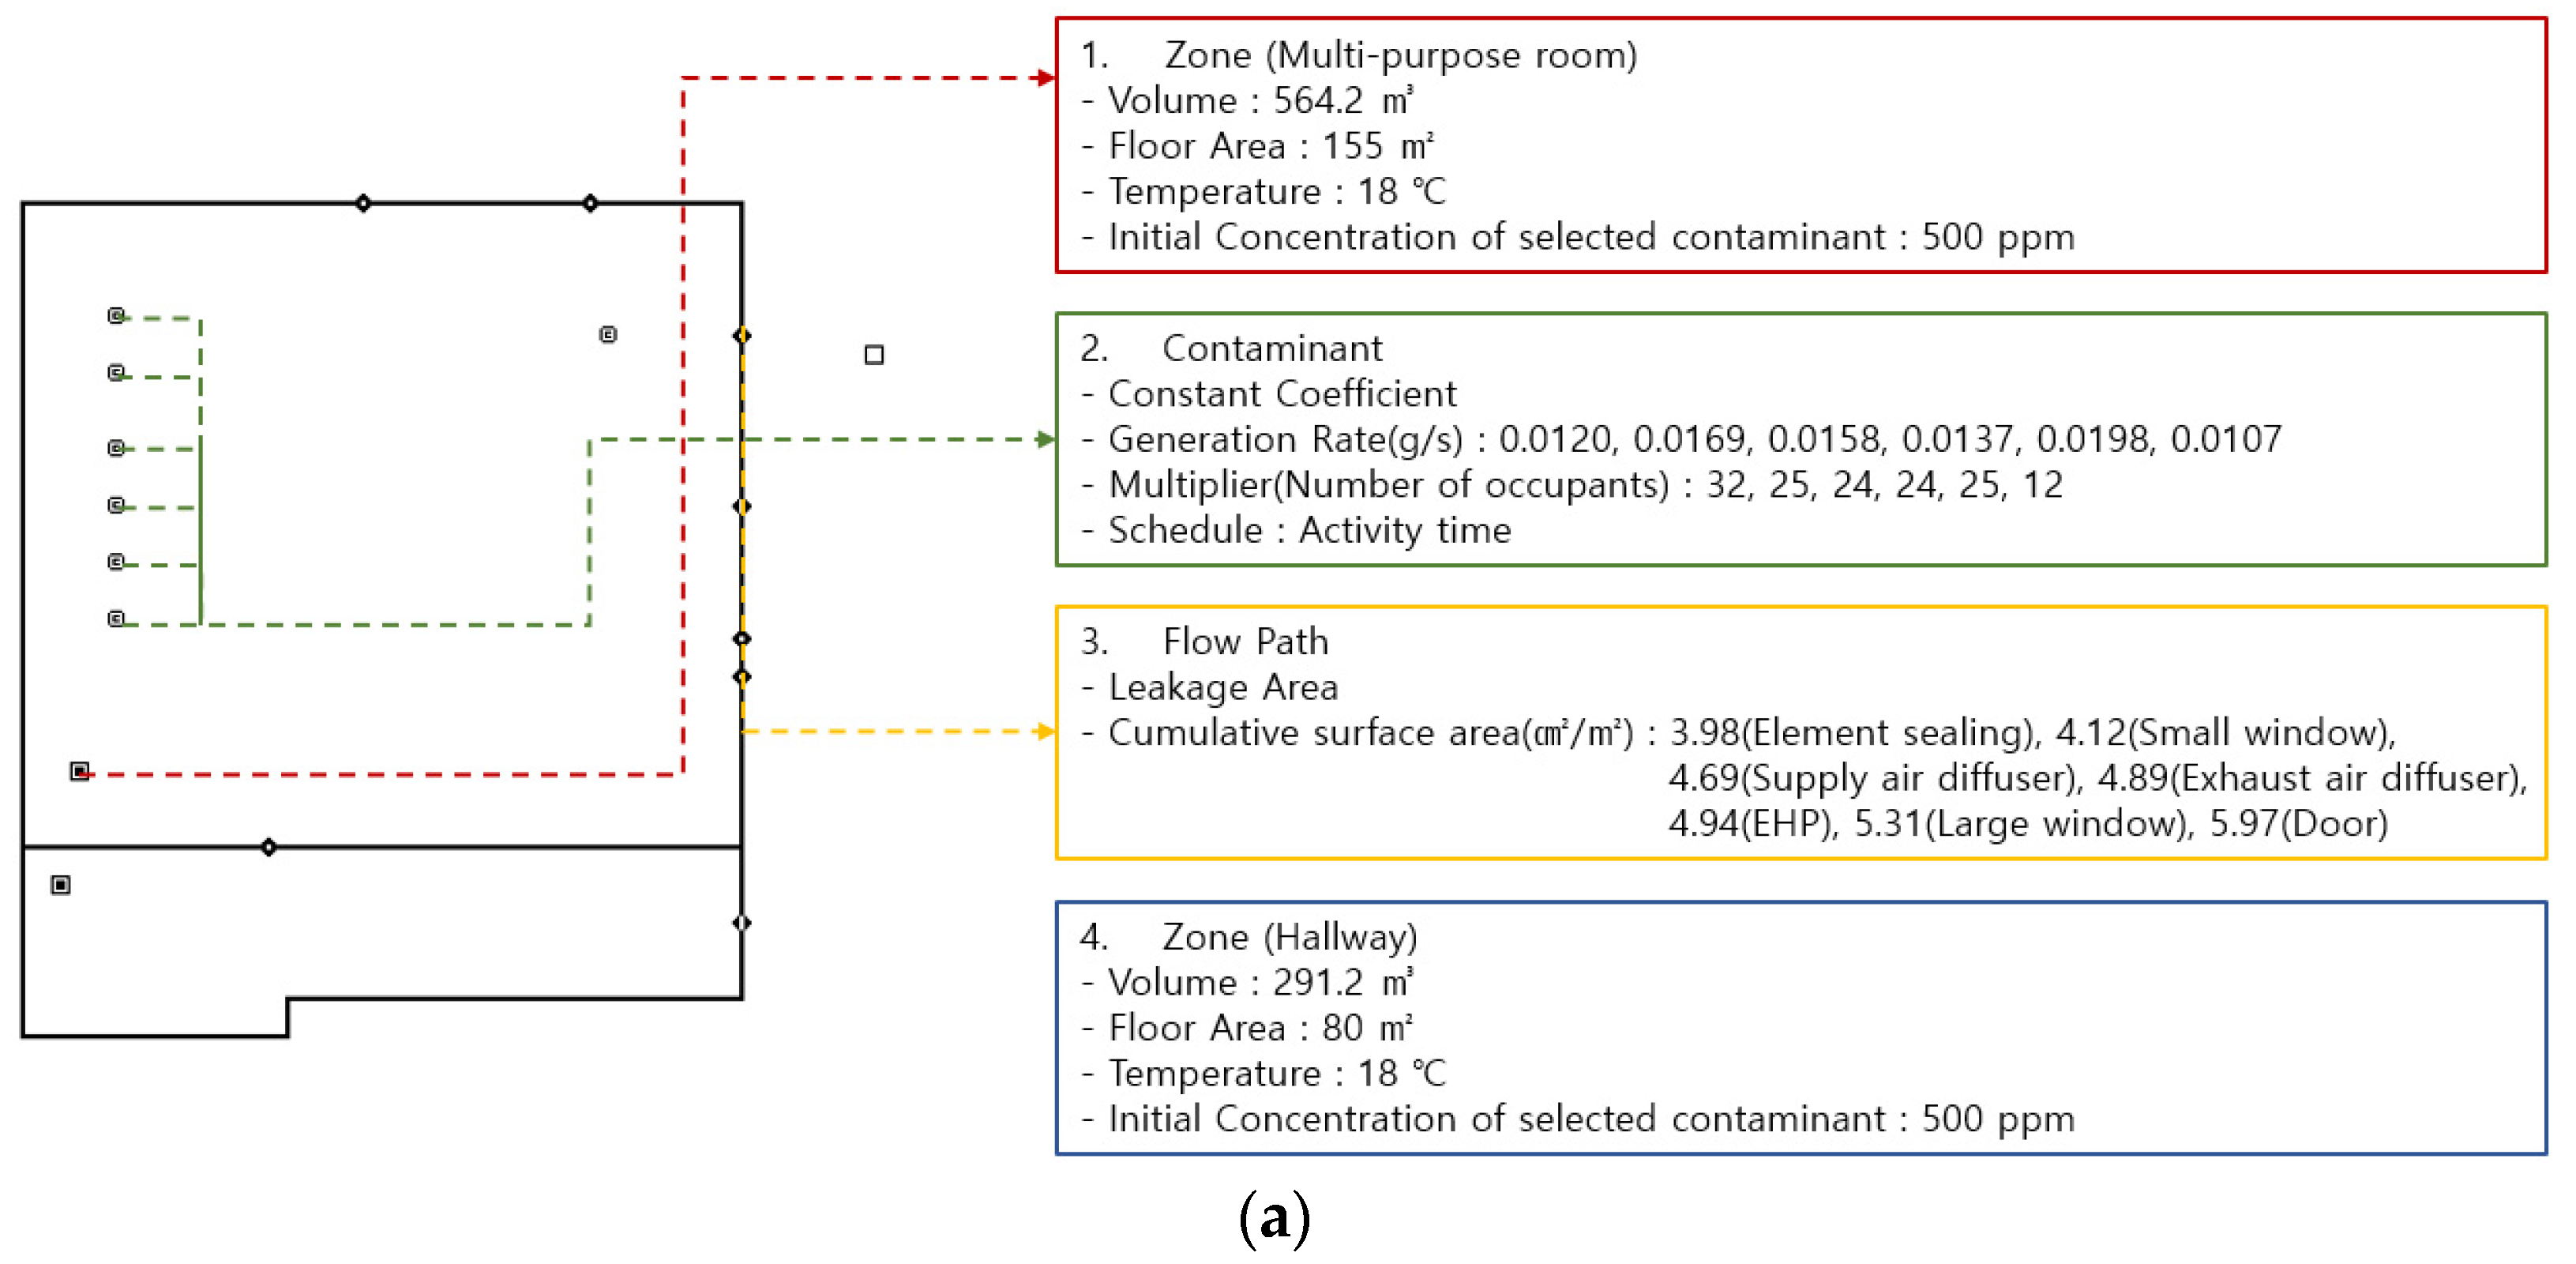
| Name of School | Ceiling Height (m) | Floor Area (m2) | Space Volume (m3) |
|---|---|---|---|
| A | 10.4 | 616.14 | 6407.9 |
| B | 10.8 | 677.16 | 7313.3 |
| C | 10.6 | 751.20 | 7962.7 |
| D | 3.64 | 155 | 564.2 |
| E | 10.6 | 562.8 | 5965.7 |
| F | 11.5 | 570.72 | 6563.3 |
| G | 12.1 | 725.4 | 8777.3 |
| H | 9.46 | 652.4 | 6171.7 |
| I | 10.5 | 777.6 | 8164.8 |
| Average | 9.96 | 609.82 | 6073.8 |
| Name of School | Number of Classes | Number of Students | Required Area (Number of Students × 0.4 m2) |
|---|---|---|---|
| A | 28 | 729 | 291.56 |
| B | 28 | 889 | 355.6 |
| C | 24 | 579 | 231.6 |
| D | 25 | 445 | 178 |
| E | 28 | 1224 | 489.6 |
| F | 32 | 1062 | 424.8 |
| G | 28 | 850 | 340 |
| H | 29 | 1263 | 505.2 |
| I | 22 | 823 | 329.2 |
| Average | 26.64 | 854.73 | 341.9 |
| Name of School | Air Conditioning and Heating Device | Air Purifier |
|---|---|---|
| A | GHP | Jet air turnover system |
| B | EHP | Jet air turnover system |
| C | GHP | X |
| D | GHP | ERV |
| E | GHP | Jet air turnover system |
| F | EHP | Jet air turnover system |
| G | EHP | X |
| H | EHP | Fan |
| I | GHP | Fan |
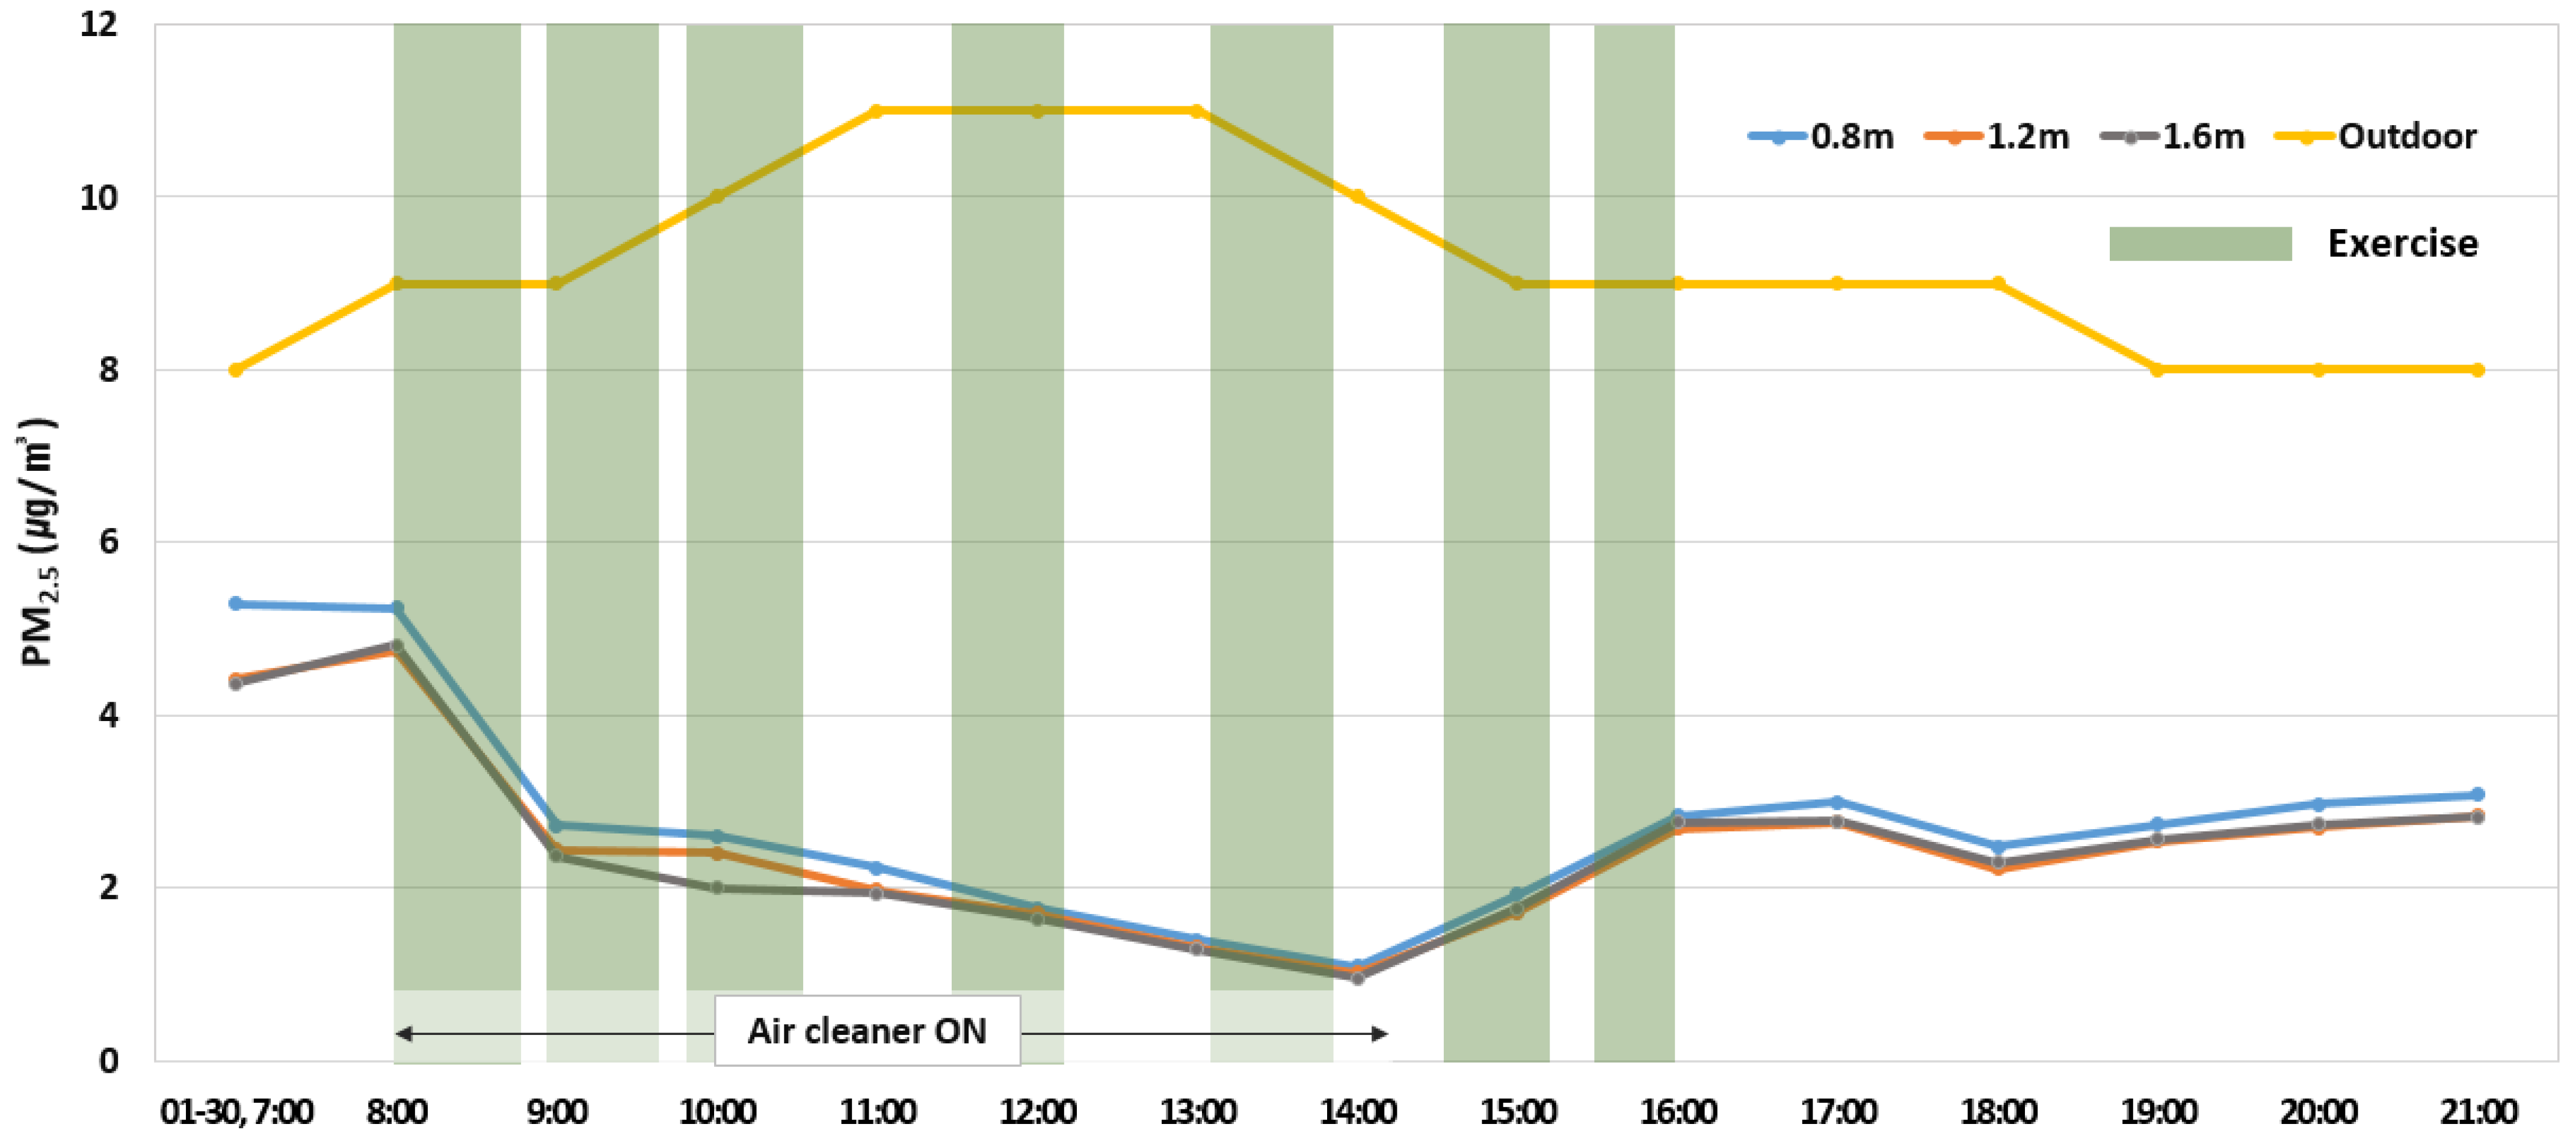
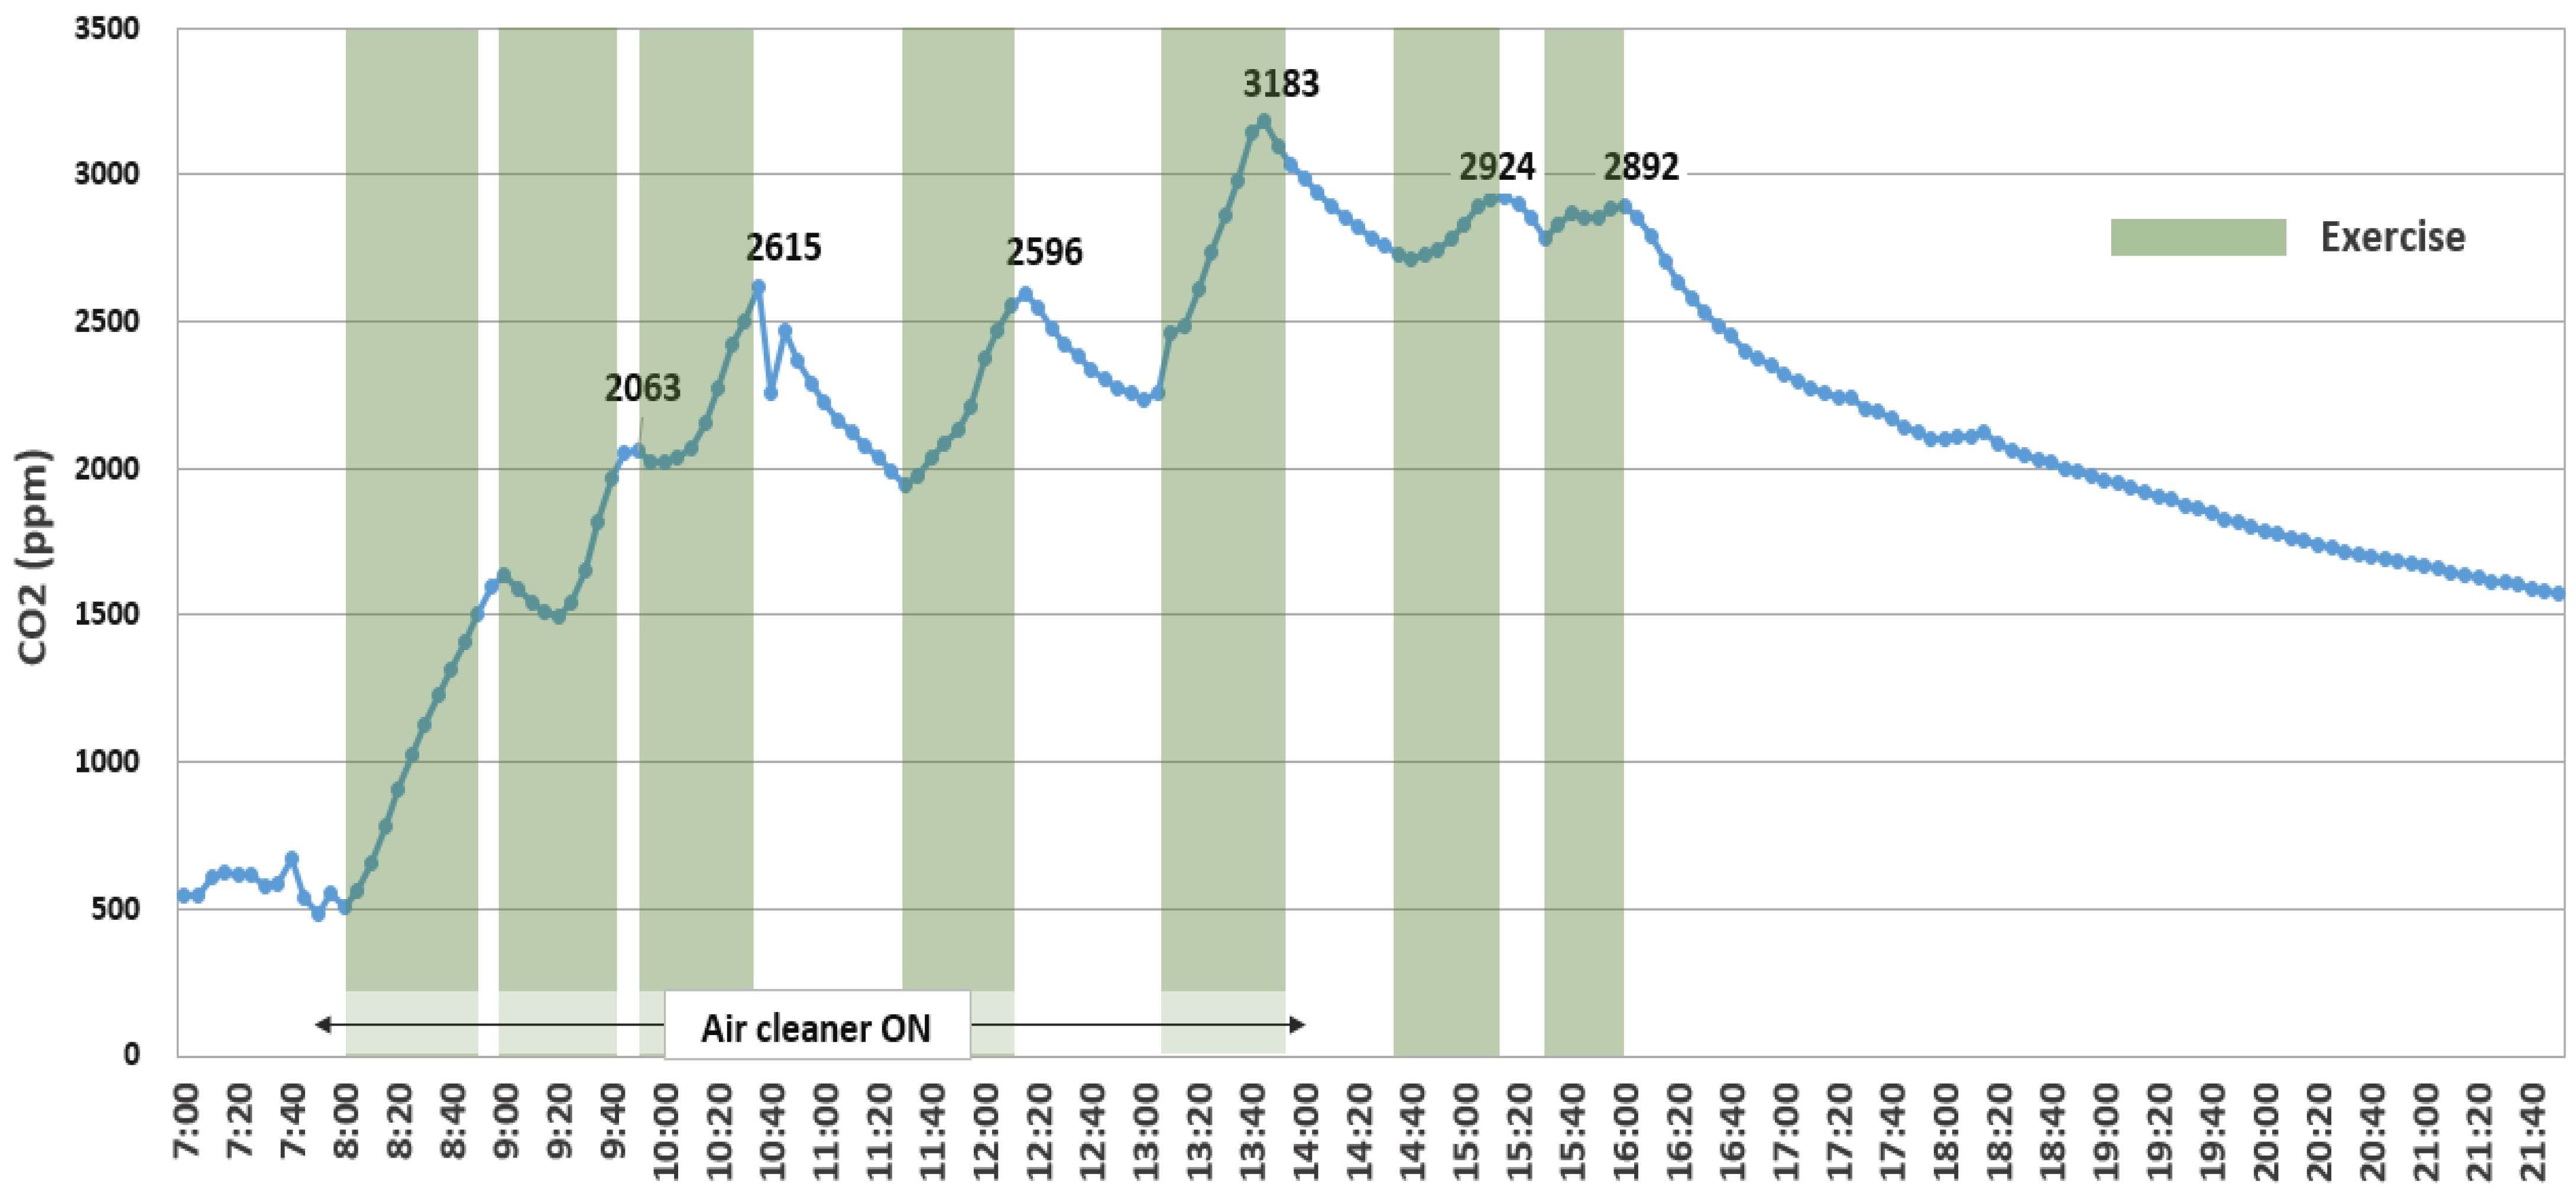
| Time | Activity Type | Number of Occupants | Air Purifier | Ventilation before Activity |
|---|---|---|---|---|
| 08:00–08:50 | Extracurricular activity | 32 | On | O |
| 09:00–09:40 | Catch play | 25 | On | O |
| 09:50–10:30 | Catch play | 24 | On | O |
| 11:30–12:10 | Catch play | 24 | On | O |
| 13:10–13:50 | Catch play | 25 | On | O |
| 14:35–15:10 | After-school activity | 12 | Off | O |
| 15:30–15:55 | After-school activity | 12 | Off | X |
| Element | Cumulative EqLA (cm2) | Cumulative Surface Area (cm2/m2) | EqLA (cm2) | Surface Area (cm2/m2) | |
|---|---|---|---|---|---|
| 1 | Element sealing | 1941.9 | 3.98 | 1941.90 | 3.98 |
| 2 | Small window | 2011.5 | 4.12 | 69.60 | 0.14 |
| 3 | Supply air diffuser | 2286.5 | 4.69 | 129.80 | 0.27 |
| 4 | Exhaust air diffuser | 2387.3 | 4.89 | 100.80 | 0.20 |
| 5 | EHP | 2410.9 | 4.94 | 23.60 | 0.05 |
| 6 | Large window | 2589.7 | 5.31 | 178.1 | 0.37 |
| 7 | Door | 2913.5 | 5.97 | 323.80 | 0.66 |
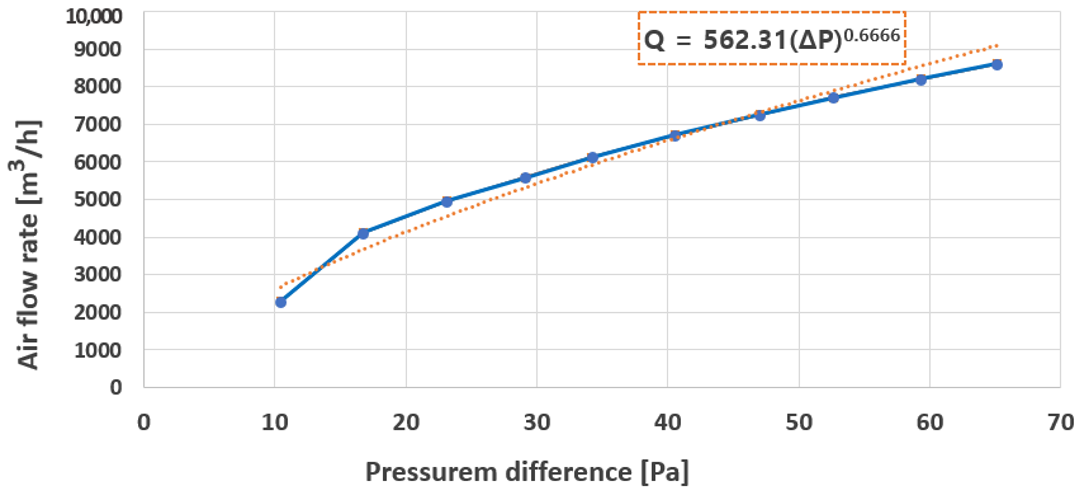 | Pressure Difference (Pa) | Air Flow Rate (m3/h) | Exponent (n) | Air Change per Hour (1/h) |
| 50 | 7629.73 | 0.67 | 13.52 | |
| 4 | 1416.80 | 2.51 | ||
| 2 | 892.57 | 1.58 |
| Activity Type | Volume of CO2 Generated per Person (ppm∙m3/min∙Person) | Mass of CO2 Generated per Person per Hour (g/s Person) |
|---|---|---|
| Extracurricular Activities | 367.64 | 0.0120 |
| Catch play (09:00~09:40) | 515.22 | 0.0169 |
| Catch play (09:50~10:30) | 483.84 | 0.0158 |
| Catch play (11:30~12:10) | 417.63 | 0.0137 |
| Catch play (13:10~13:50) | 603.38 | 0.0198 |
| After-school activity | 328.26 | 0.0107 |
| RMSE (ppm) | RMSE-Percent (%) | MAPE (%) |
|---|---|---|
| 123.37 | 6.02 | 5.50 |
| Time | Activity Type | Number of Occupants | Ventilation before Activity |
|---|---|---|---|
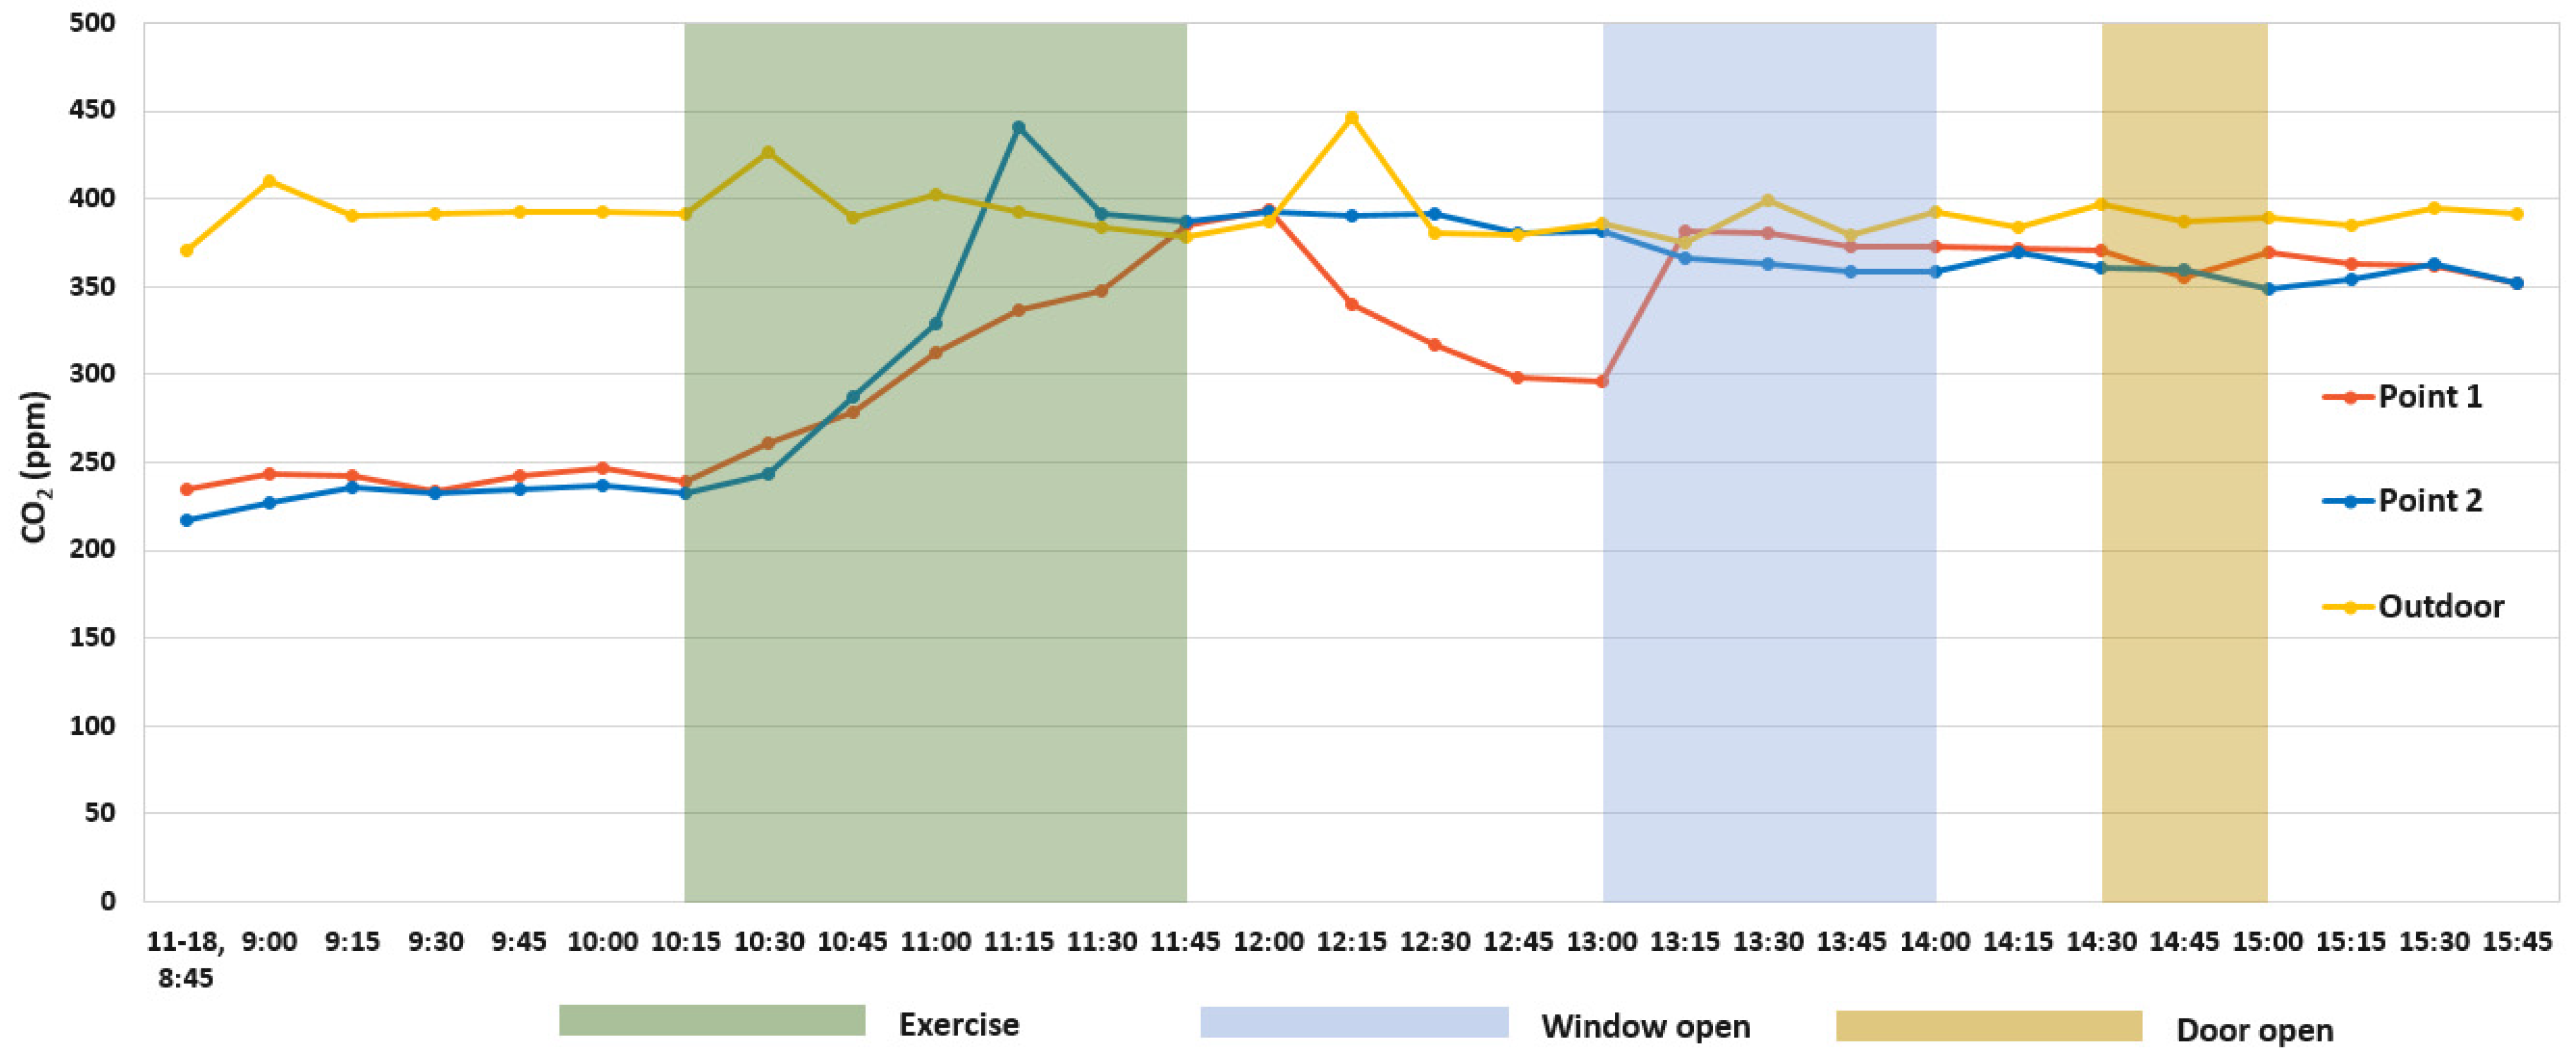
| 10:15–10:41 | Stretching, rope jump | 15 | X |
| 10:42–11:45 | Badminton | 15 | X |
| 13:00–14:00 | Window open | 2 | - |
| 14:30–15:00 | Hallway door open | 2 | - |
| Activity Type | Rate of Increase in CO2 Concentration per Person (ppm∙m3/min) | CO2 Generation per Person (g/s Person) |
|---|---|---|
| Stretching, rope jump | 768.94 | 0.0252 |
| Badminton | 987.29 | 0.0323 |
| RMSE | RMSE-Percent (%) | MAPE (%) |
|---|---|---|
| 7.04 | 4.27 | 2.37 |
| Classification of Activities | CO2 Generation Rate per Person (g/s·Person) | Initial Temperature (°C) | Initial CO2 Concentration (ppm) | Required Volume (m3/Hour·Person) |
|---|---|---|---|---|
| Extracurricular activities (a) | 0.0120 | 18 | 520 | 48.5 |
| Stretching and catch play (b) | 0.0166 | 67.5 | ||
| Stretching and rope jump (c) | 0.0252 | 102.5 | ||
| Badminton (d) | 0.0323 | 132.5 | ||
| Average | 0.0215 | 87.8 |
| Elementary School | Activity | Optimum Number of Students |
|---|---|---|
| D | Extracurricular activities | 12 |
| Stretching and catch | 8 | |
| Stretching and rope jump | 5 | |
| Badminton | 4 | |
| A | Extracurricular activities | 130 |
| Stretching and catch | 94 | |
| Stretching and rope jump | 62 | |
| Badminton | 48 |
| Name of School | Initial CO2 Concentration (ppm) | Rate of Increase in CO2 Concentration per Person (ppm∙m3/min) | Time (min) | Number of Classes | Space Volume (m3) | Result (ppm) |
|---|---|---|---|---|---|---|
| A | 520 | 987.29 | 60 | 28 | 6407.9 | 778.84 |
| D | 25 | 564.2 | 3144.84 |
| Name of School | Initial CO2 Concentration (ppm) | Rate of Increase in CO2 Concentration per Person (ppm∙m3/min) | Time (min) | Number of Classes | Space Volume (m3) | Result (ppm) |
|---|---|---|---|---|---|---|
| A | 520 | 987.29 | 60 | 48 | 6407.9 | 963.73 |
| D | 4 | 564.2 | 939.97 |
Publisher’s Note: MDPI stays neutral with regard to jurisdictional claims in published maps and institutional affiliations. |
© 2021 by the authors. Licensee MDPI, Basel, Switzerland. This article is an open access article distributed under the terms and conditions of the Creative Commons Attribution (CC BY) license (https://creativecommons.org/licenses/by/4.0/).
Share and Cite
Lee, Y.-K.; Kim, Y.I. Analysis of Indoor Air Pollutants and Guidelines for Space and Physical Activities in Multi-Purpose Activity Space of Elementary Schools. Energies 2022, 15, 220. https://doi.org/10.3390/en15010220
Lee Y-K, Kim YI. Analysis of Indoor Air Pollutants and Guidelines for Space and Physical Activities in Multi-Purpose Activity Space of Elementary Schools. Energies. 2022; 15(1):220. https://doi.org/10.3390/en15010220
Chicago/Turabian StyleLee, Yeo-Kyung, and Young Il Kim. 2022. "Analysis of Indoor Air Pollutants and Guidelines for Space and Physical Activities in Multi-Purpose Activity Space of Elementary Schools" Energies 15, no. 1: 220. https://doi.org/10.3390/en15010220
APA StyleLee, Y.-K., & Kim, Y. I. (2022). Analysis of Indoor Air Pollutants and Guidelines for Space and Physical Activities in Multi-Purpose Activity Space of Elementary Schools. Energies, 15(1), 220. https://doi.org/10.3390/en15010220