Article

Velocity Structure Revealing a Likely Mud Volcano off the Dongsha Island, the Northern South China Sea

1
Hunan Provincial Key Laboratory of Shale Gas Resource Utilization, Hunan University of Science and Technology, Xiangtan 411201, China
2
SINOPEC Key Laboratory of Geophysics, Sinopec Geophysical Research Institute, Nanjing 211103, China
3
Southern Marine Science and Engineering Guangdong Laboratory (Guangzhou), Guangzhou 511458, China
4
Key Laboratory of Ocean and Marginal Sea Geology, South China Sea Institute of Oceanology, Innovation Academy of South China Sea Ecology and Environmental Engineering, Chinese Academy of Sciences, Guangzhou 510301, China
5
Guangzhou Marine Geological Survey, Guangzhou 510760, China
*
Author to whom correspondence should be addressed.
Energies 2022, 15(1), 195; https://doi.org/10.3390/en15010195
Submission received: 27 October 2021 / Revised: 1 December 2021 / Accepted: 21 December 2021 / Published: 28 December 2021
(This article belongs to the Collection State of the Art Geo-Energy Technology in China)

Abstract

:
The Dongsha Island (DS) is located in the mid-northern South China Sea continental margin. The waters around it are underlain by the Chaoshan Depression, a relict Mesozoic sedimentary basin, blanketed by thin Cenozoic sediments but populated with numerous submarine hills with yet less-known nature. A large hill, H110, 300 m high, 10 km wide, appearing in the southeast to the Dongsha Island, is crossed by an ocean bottom seismic and multiple channel seismic surveying lines. The first arrival tomography, using ocean bottom seismic data, showed two obvious phenomena below it: (1) a low-velocity (3.3 to 4 km/s) zone, with size of 20 × 3 km2, centering at ~4.5 km depth and (2) an underlying high-velocity (5.5 to 6.3 km/s) zone of comparable size at ~7 km depth. MCS profiles show much-fragmented Cenozoic sequences, covering a wide chaotic reflection zone within the Mesozoic strata below hill H110. The low-velocity zone corresponds to the chaotic reflection zone and can be interpreted as of highly-fractured and fluid-rich Mesozoic layers. Samples dredged from H110 comprised of illite-bearing authigenic carbonate nodules and rich, deep-water organisms are indicative of hydrocarbon seepage from deep source. Therefore, H110 can be inferred as a mud volcano. The high-velocity zone is interpreted as of magma intrusion, considering that young magmatism was found enhanced over the southern CSD. Furthermore, the origin of H110 can be speculated as thermodynamically driven, i.e., magma from the depths intrudes into the thick Mesozoic strata and promotes petroleum generation, thus, driving mud volcanism. Mud volcanism at H110 and the occurrence of a low-velocity zone below it likely indicates the existence of Mesozoic hydrocarbon reservoir, which is in favor of the petroleum exploration.

1. Introduction

Generally, a mud volcano is formed by eruption of mud, gas, and fluid, often containing hydrocarbon, water, and so on; thus, it is an indicator of petroleum leakage from deep [1]. Because of rich fluid filling within porous sediments, seismic wave velocity in a mud volcano is low [2], and reflection from it becomes chaotic or blank [3]. The erupted mud may contain petroleum-associated mineral assemblage from the source layer in the depths [4]. The leaked methane can feed methanotrophic and deep-water organisms, producing authigenic carbonates on the seabed. Mud volcanism can be triggered by plate compression [5], gravitational instability [6], and thermodynamic drive [7]. Submarine mud volcanoes have been widely found over the world, e.g., in the Gulf of Mexico, the Caspian Sea [8], and the onshore and offshore Southwest Taiwan Island [5], where petroleum or gas hydrate are rich.
The Dongsha Island (DS) is located in the mid northern South China Sea (SCS) continental margin (Figure 1), where the Chaoshan Depression, a Mesozoic basin, relicts [9]. It is considered an exploration target area for Mesozoic hydrocarbon [10,11]. The waters are rich with young submarine hills. Some hills, e.g., MV3, MV8, southwest of the DS (Figure 2), were found in recent studies as mud volcanoes featuring chaotic or blank reflection zones on multichannel seismic (MCS) profiles, gas plume on CHIRP (Compressed High-Intensity Radiated Pulse) sub-bottom profiles, and abundant authigenic carbonate and deep-water organisms in dredged samples from the seabed [12]. However, their dynamic origins remain unknown, due to lack of deeper imaging.
In the waters southeast of the DS, there are also several submarine hills (Figure 2). Whether they are volcano or mud volcano is unknown, due to less investigation, but important for exploration of Mesozoic petroleum. A topographically large one, H110, ~300 m high and ~10 km wide, is crossed by an OBS/MCS (Ocean Bottom Seismic/Multiple-Channel Seismic) coincident survey line L2016-2, which can be helpful for revealing the deep geologic structures and, therefore, understanding its nature and origin.

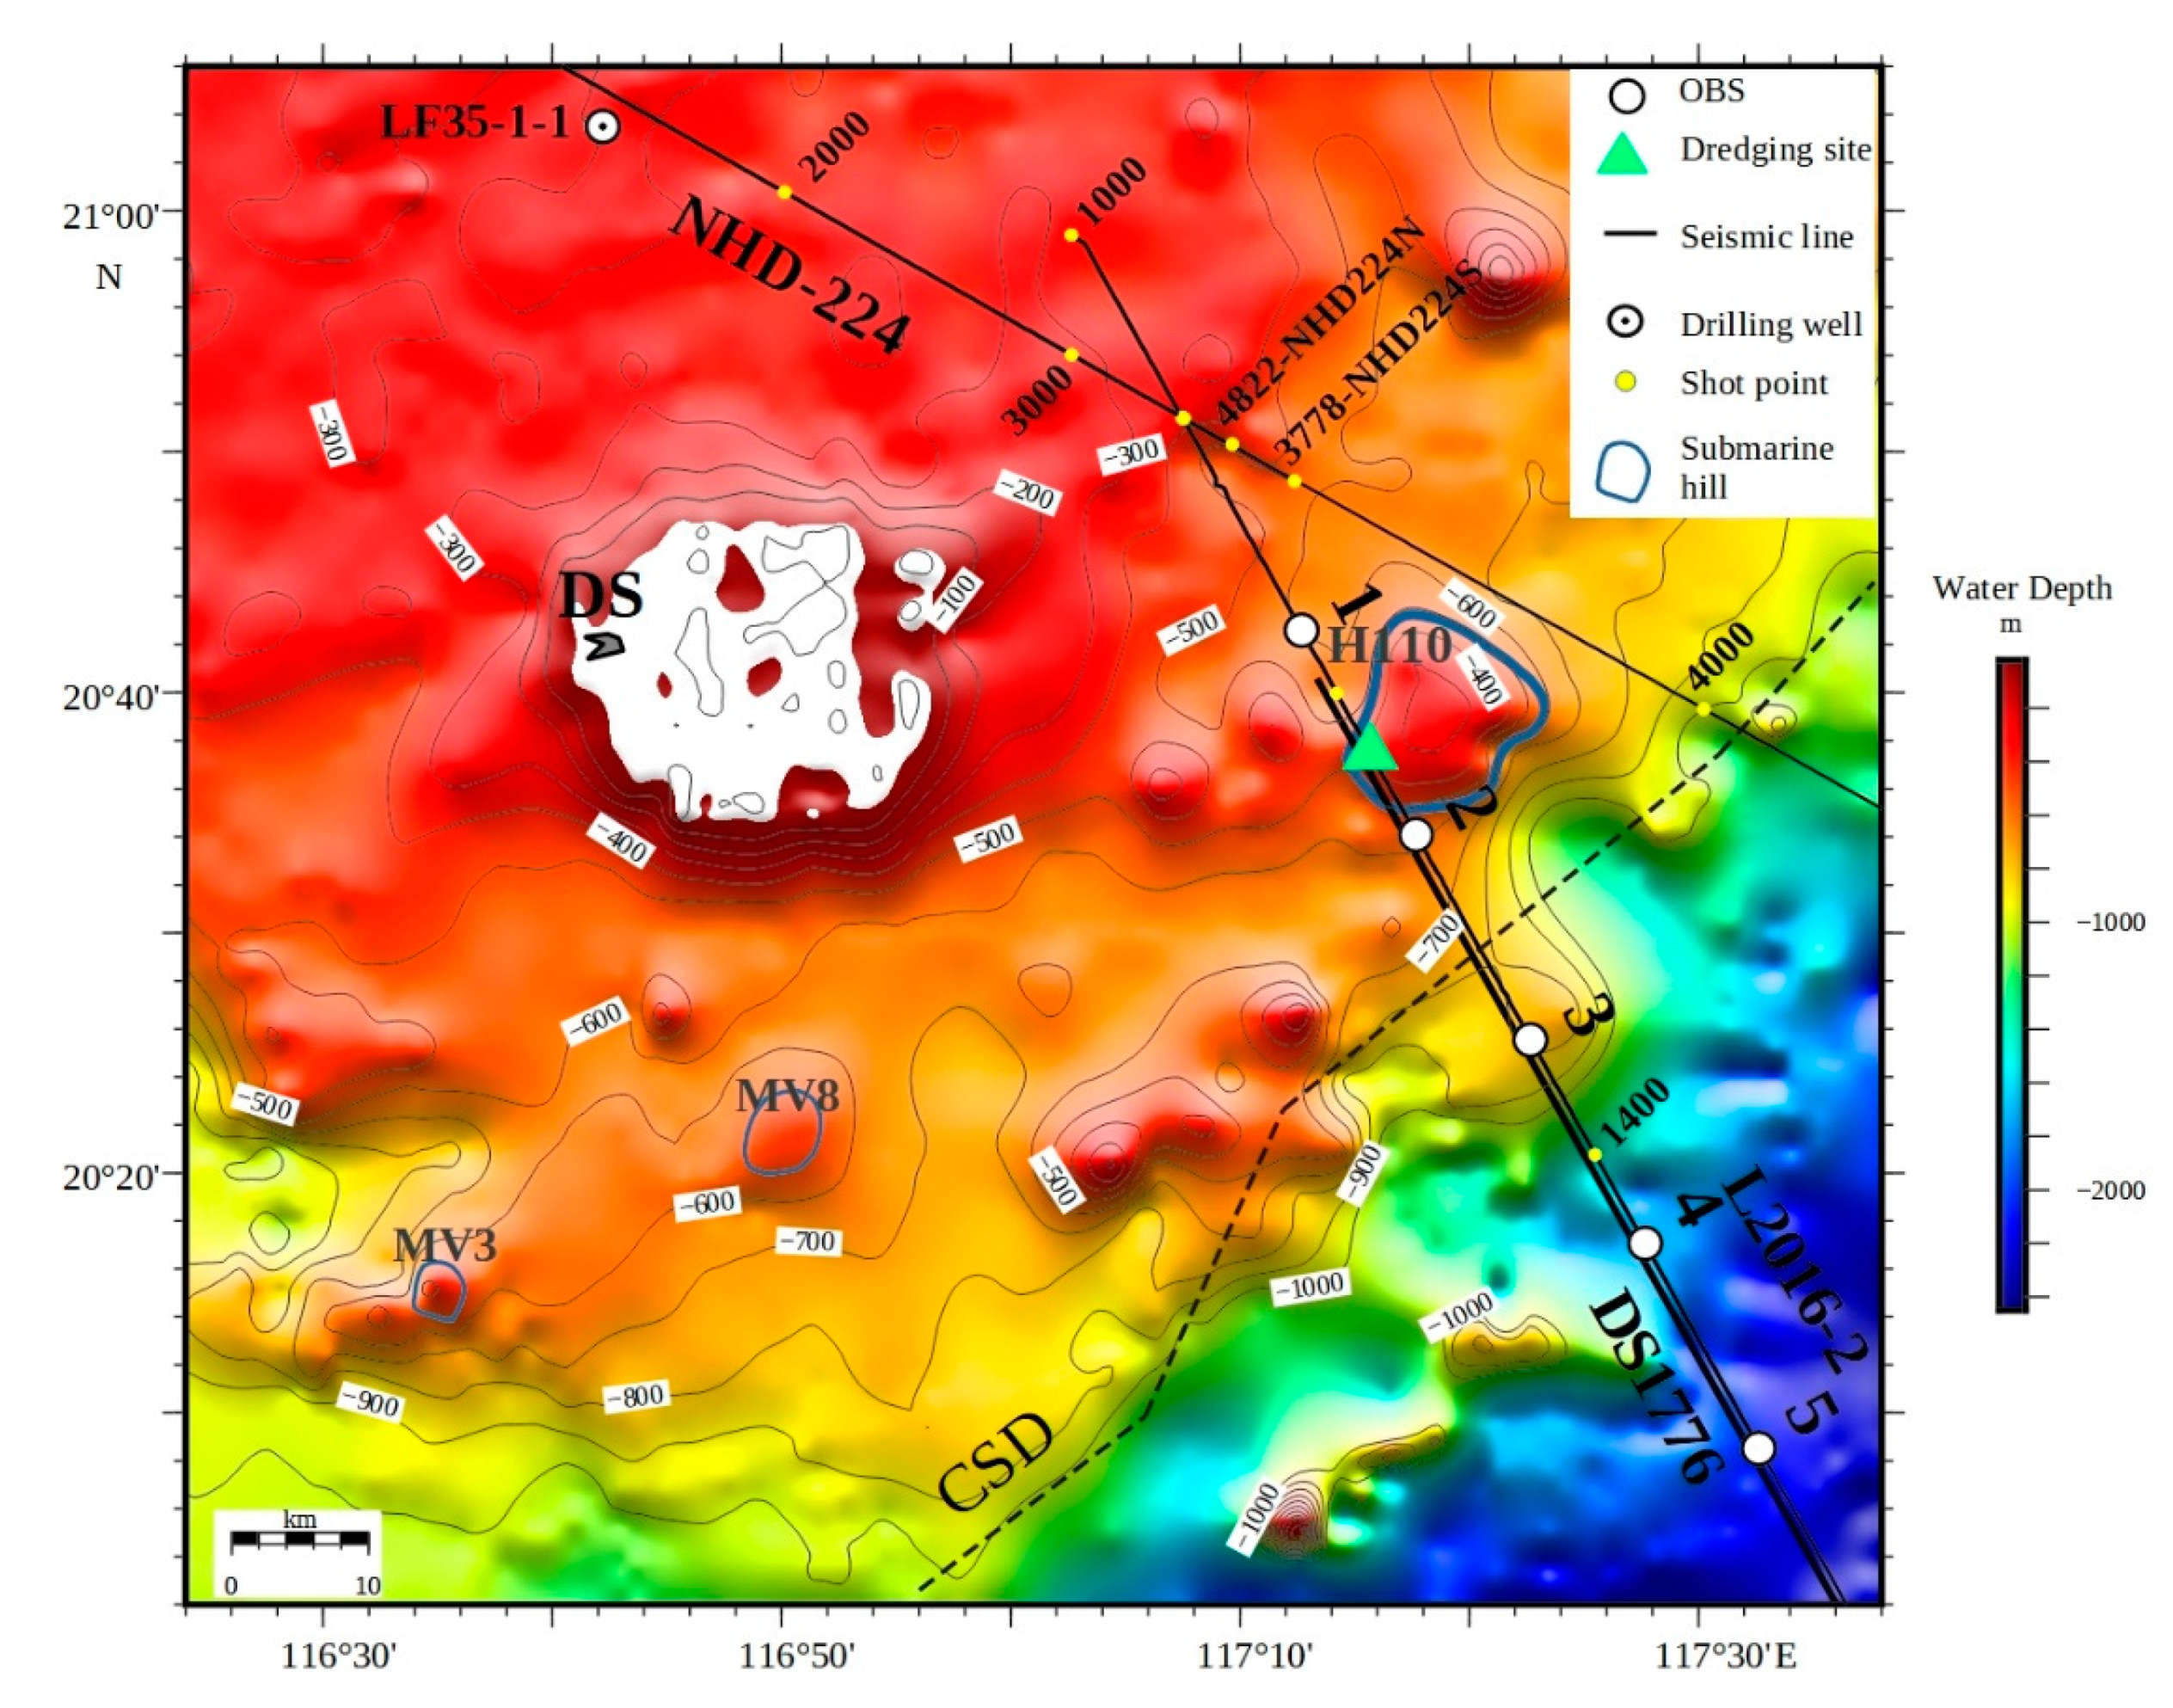
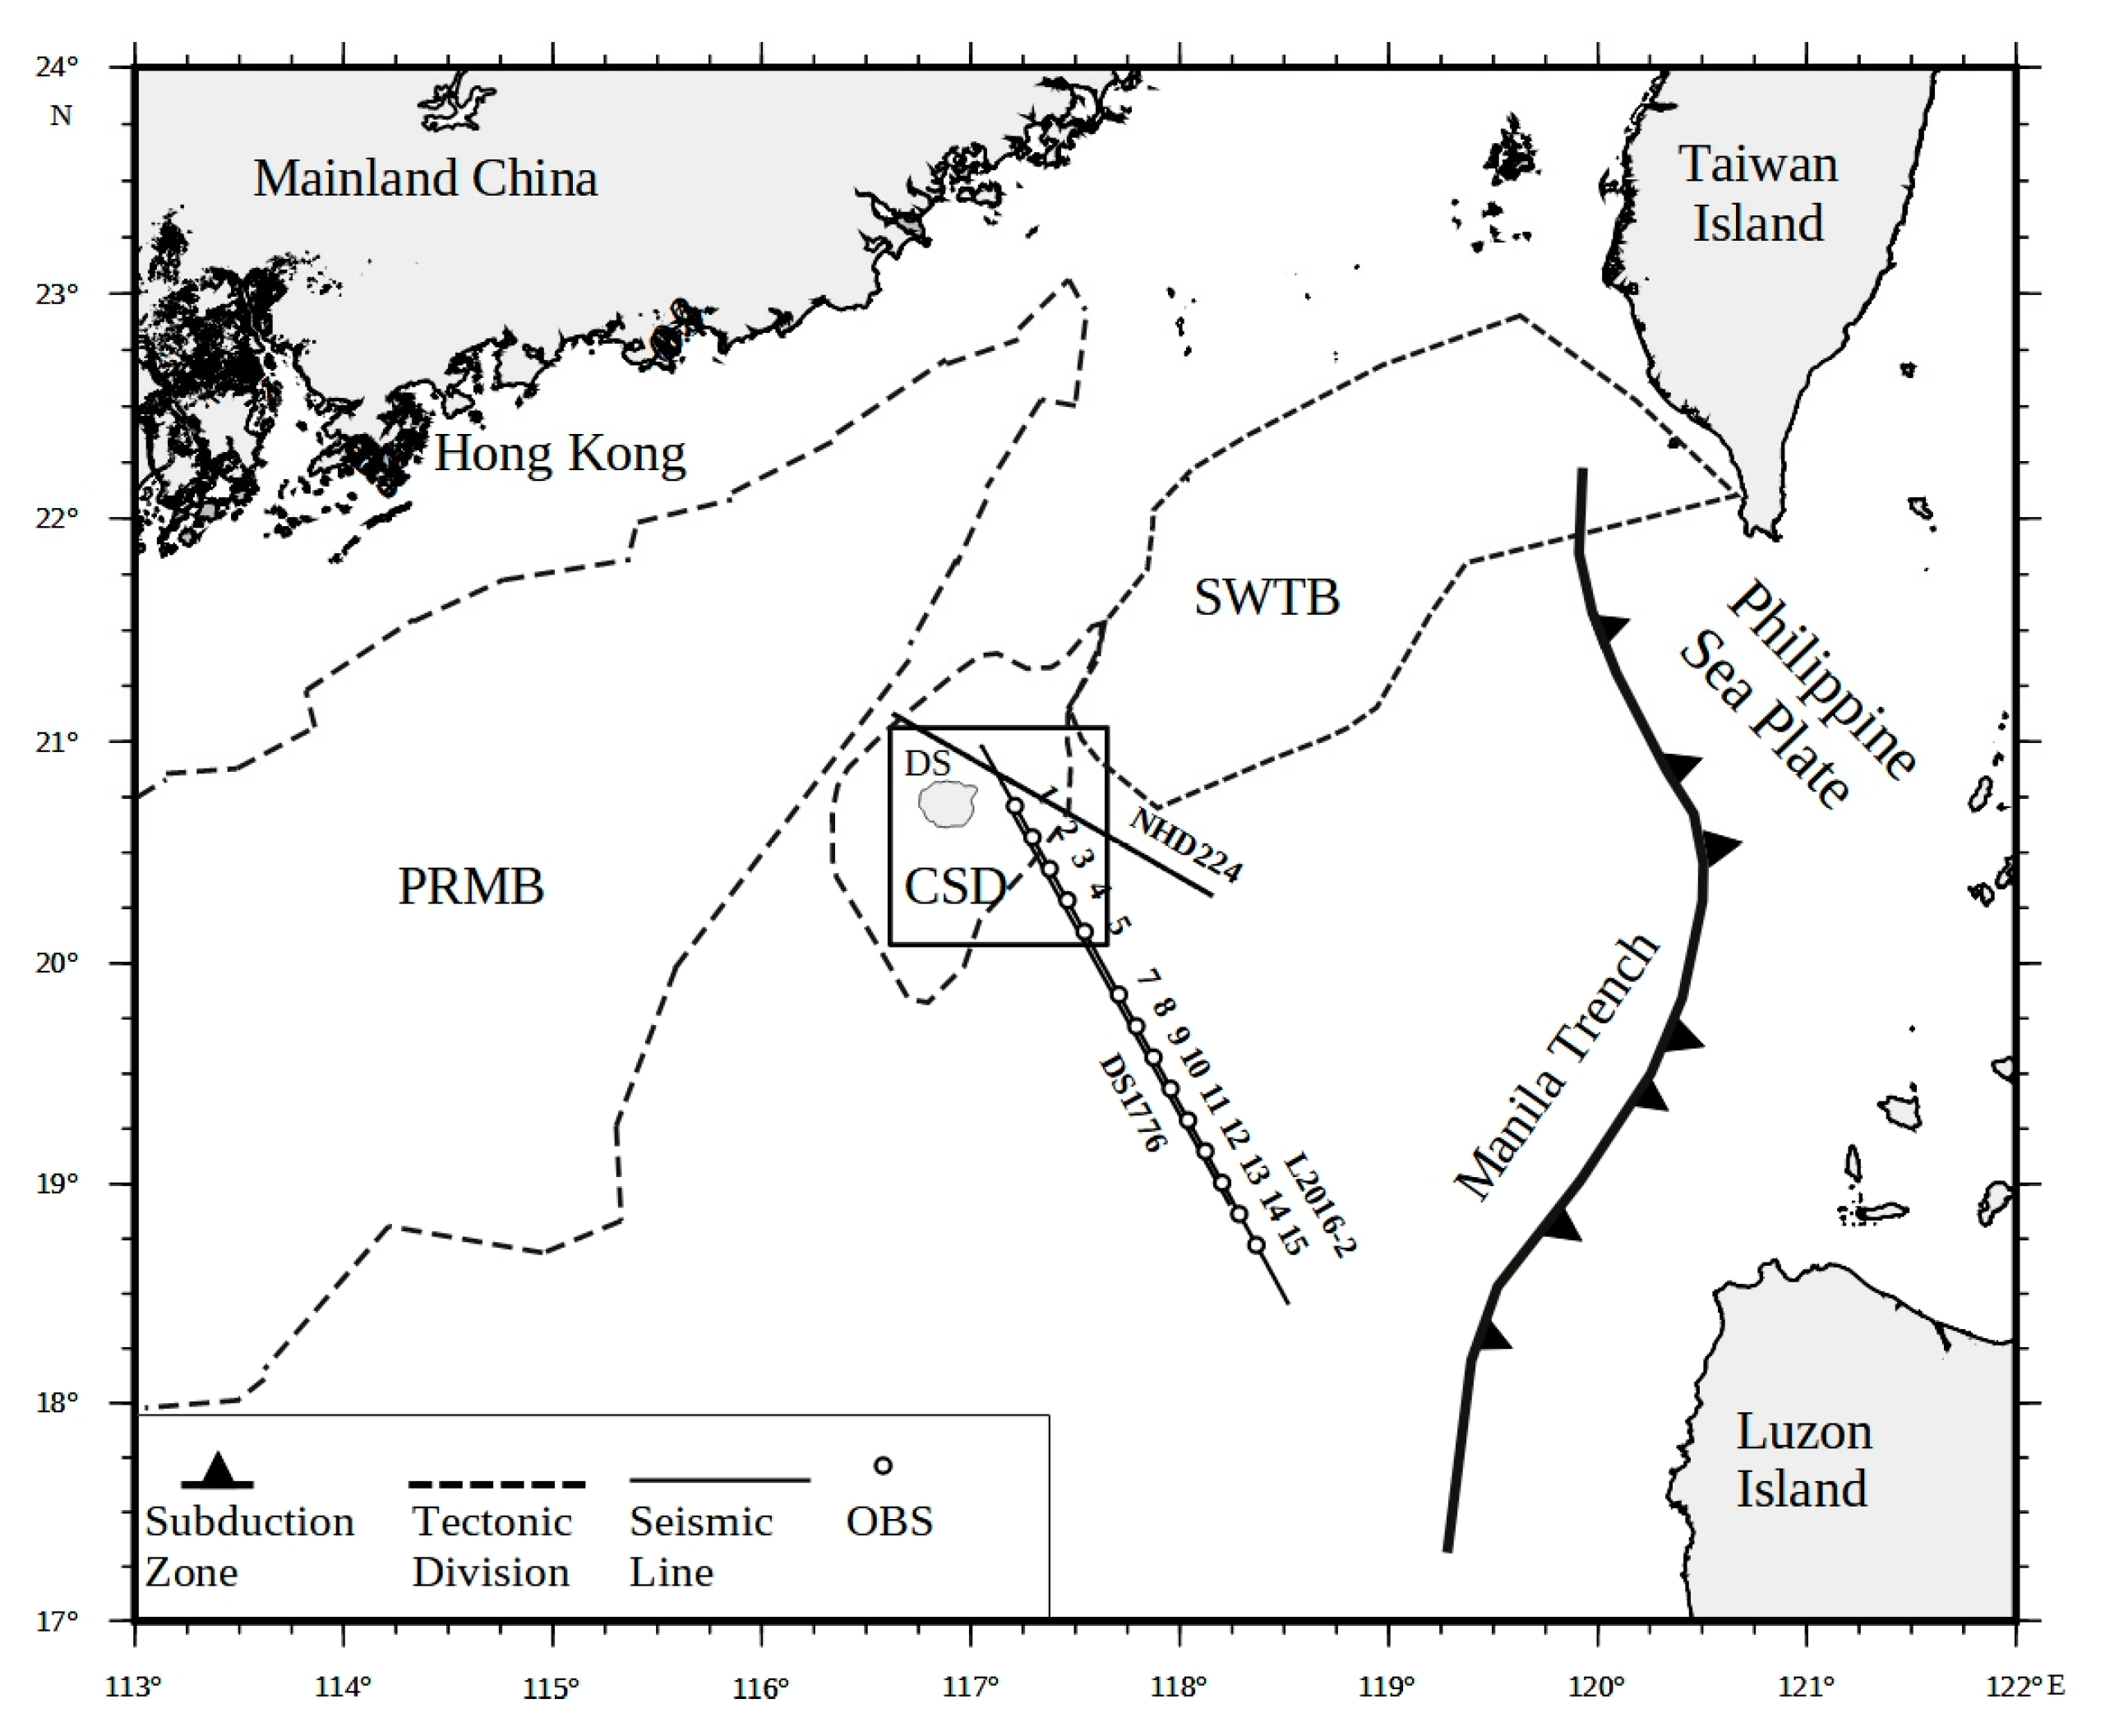
2. Geological Setting

The northern continental margin of the South China Sea has developed via magma-poor rifting [13] of the Mesozoic margin of South China, since the latest Mesozoic Era with a couple of major sedimentary basins formed [14] (Figure 1). The Chaoshan Depression (CSD) is neighbored by two major Cenozoic rift basins, the Pearl River Mouth Basin (PRMB) to the west and Southwest Taiwan Basin (SWTB) to the east, respectively. The PRMB is filled with thick Cenozoic sediments [15,16] and has become a major petroleum and gas production region. In the SWTB, many gas-seeping mud volcanoes are found along the northernmost accretion-subduction zone of the Manila Trench, due to convergence of the Philippine Sea Plate and the South China Sea [5].
Different from the PRMB and SWTB, where the crust has been highly faulted, detached, and depressed [15,16], the CSD remains, for the most part, less rifted and subsided [10]. It has developed with thin (~1 km) Cenozoic and thick (~5 km or more) Mesozoic Erathem [9,10,11]. In the northwestern CSD, a drilling well, LF35-1-1, penetrated the Early Cretaceous terrestrial and into Jurassic marine sequences, under thin Cenozoic cover [10]. Although the Early Cretaceous terrestrial contains a dense red bed, which features a seismic wave velocity of 4.0–5.5 km/s [9], a couple of interlayers in the underlying Jurassic marine strata were found with rich organic carbon [10]. In the southeast CSD, bottom simulating reflectors (BSR) were found and interpreted as originated from petroleum leakage from thick Mesozoic in the deep [11]. The Mesozoic basin seems to be an ample source and awaits the discovery of petroleum [12].
On the whole, the northern margin of South China Sea is magma-poor, but there are enhanced young magmatism locally, particularly around the southern CSD, in expressions of volcanoes, shallow intrusive, and lower crust underplating, featuring high-velocity (7.0–7.5 km/s) [13,17,18]. However, the impact of magmatism on the petroleum system in the CSD is less known.
The seismic survey line L2016-2 was initially designed to explore the magmatism over the DS water. Wan, et al. [18] has used the OBS data to construct forward and inversion velocity models and found two lower crust high-velocity (7.0–7.5 km/s) zones beneath the middle and lower slope, in the southeast, close to the CSD. Both zones were interpreted as formed by magma underplating. Their study focused on the crust but ignored the submarine hills, as well the effect of magmatic intrusion on the sedimentary sequences in the CSD.

3. Seismic Data

A seismic survey was conducted, onboard the RV Shiyan II of the South China Sea Institute of Oceanology (SCSIO), Chinese Academy of Sciences, along the Line L2016-2, in 2016. It crosses the northeast waters of the Dongsha Island and the lower continental slope to its southeast, totaling 320 km long. The source of three BOLT airguns, with a total volume of 4500 in3, were shot 1572 times, spacing 200 m, in 10 m water depth. Data were simultaneously recorded using 14 ocean-bottom-seismometers (OBS) and a MCS streamer.

3.1. OBS Data

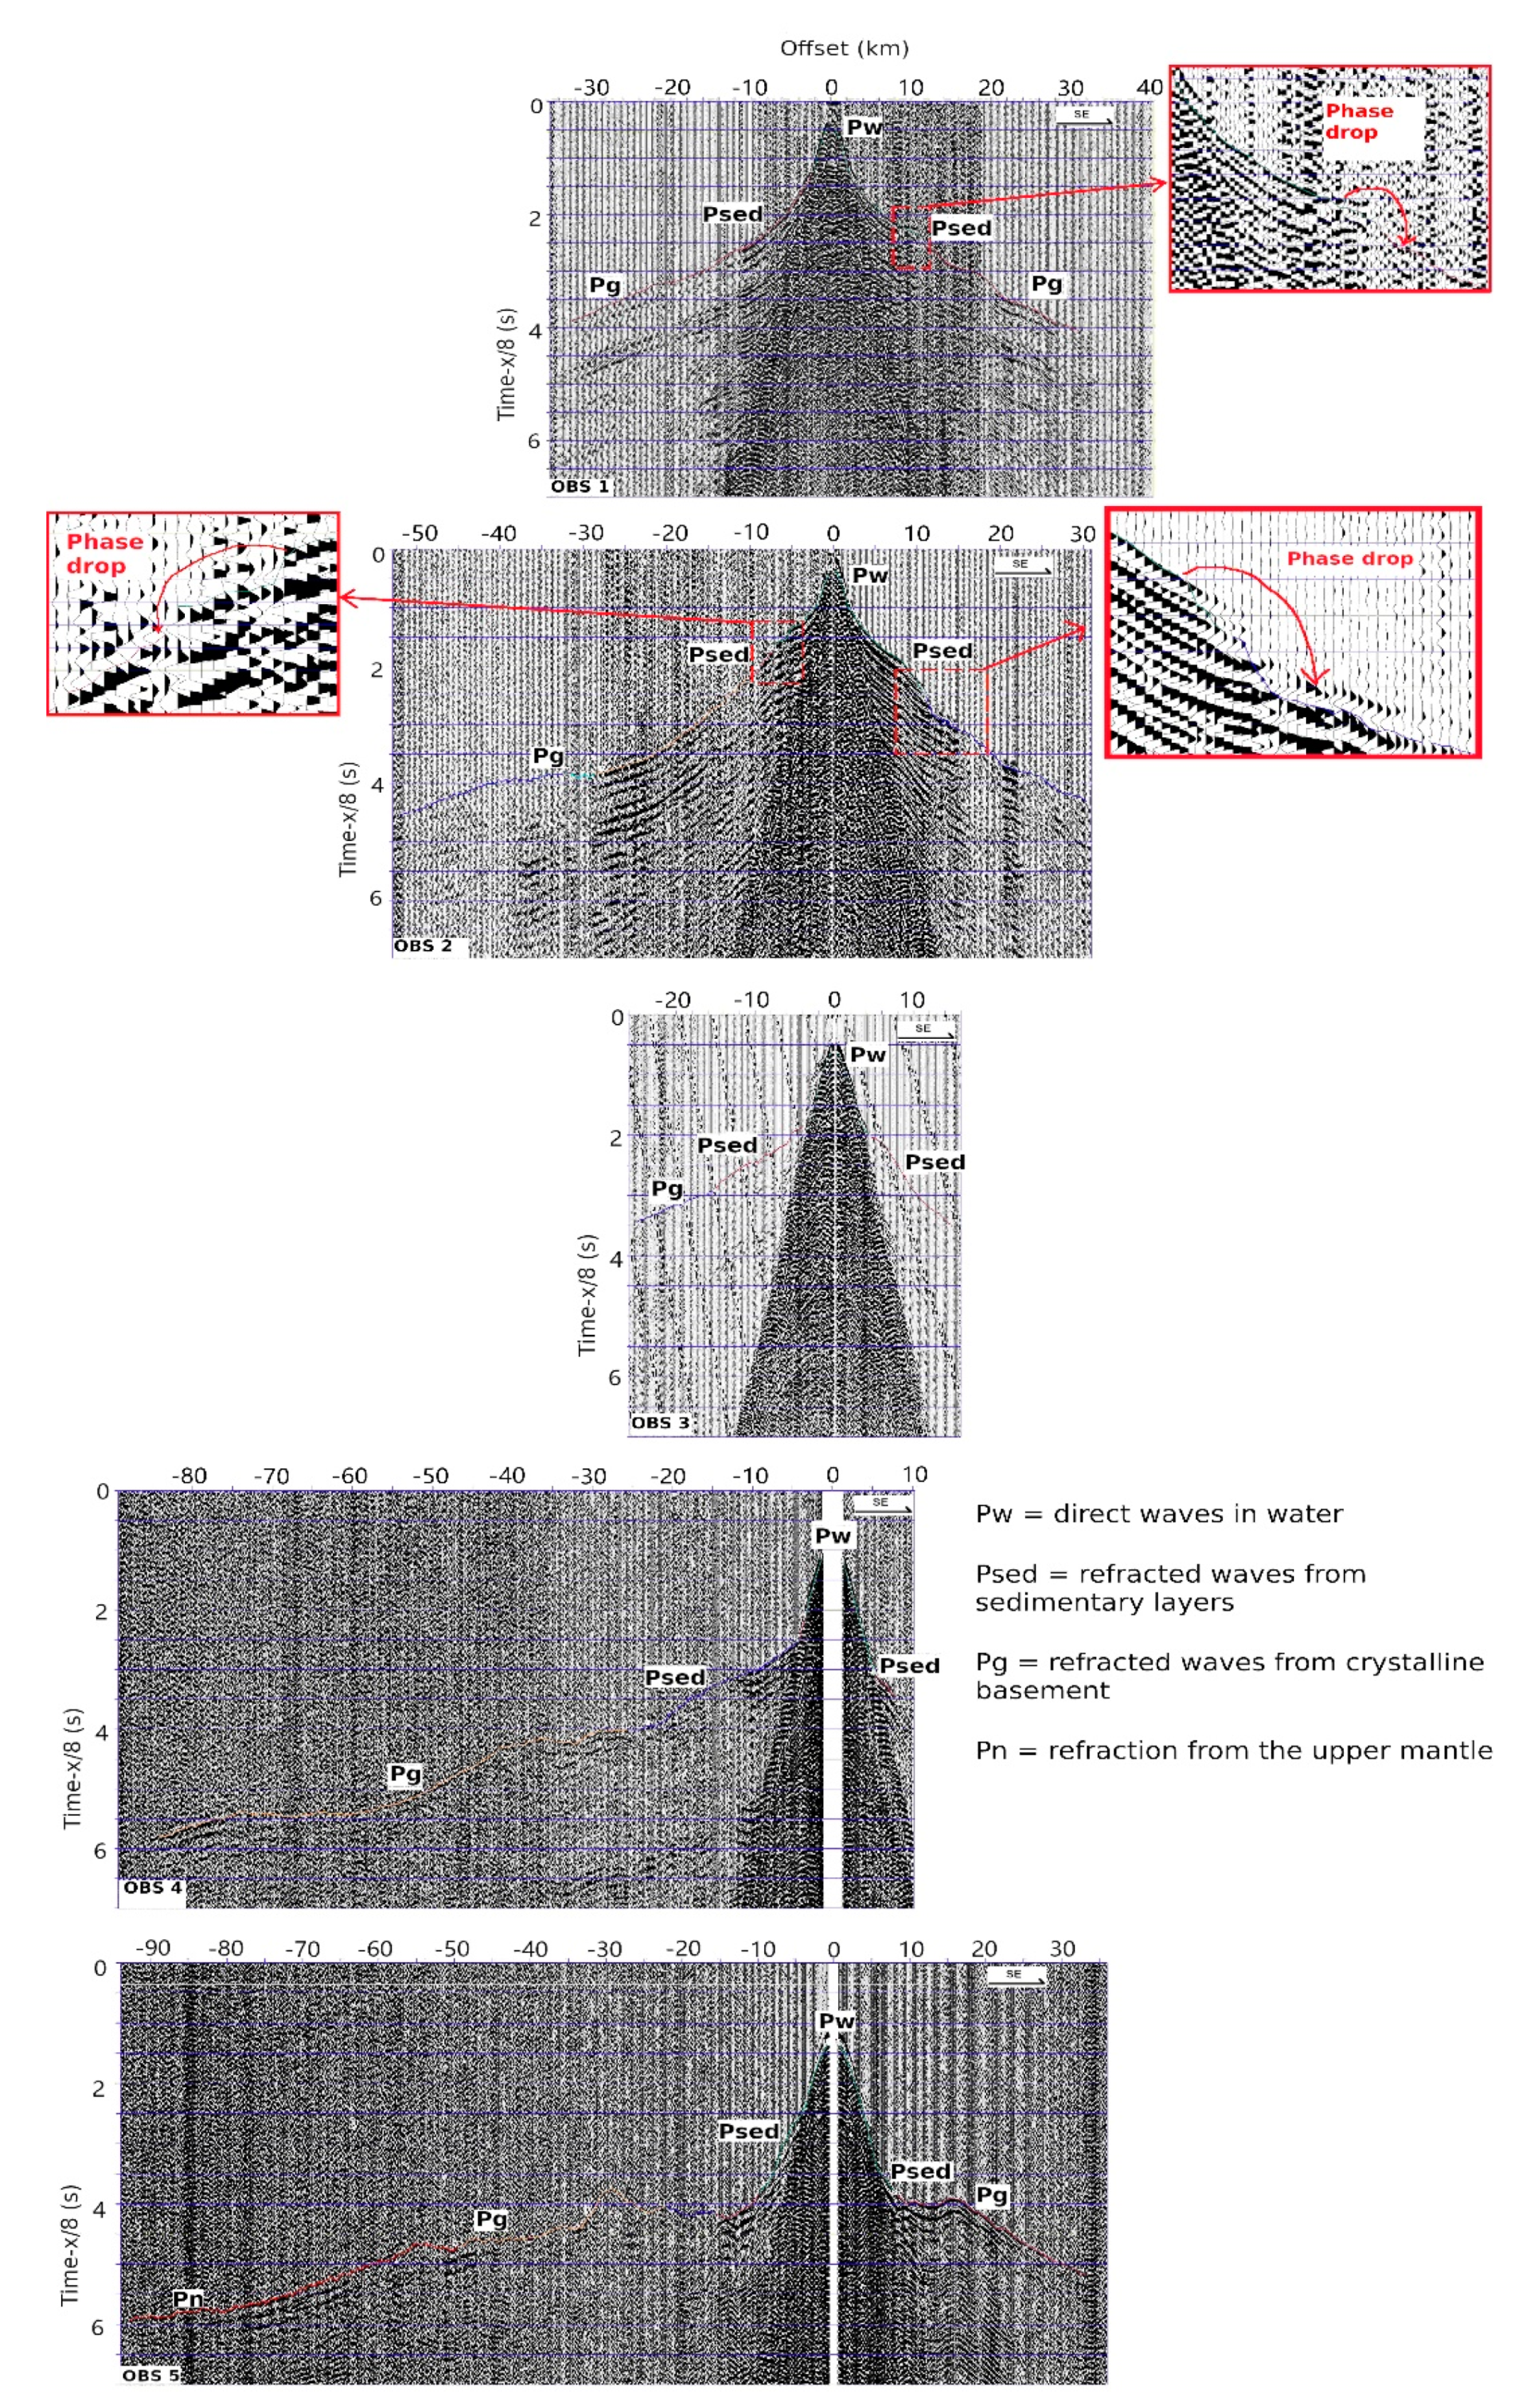
3.1.1. Collection, Pre-Processing, Phase Picks, and Analysis

The OBSs were developed by the Institute of Geology and Geophysics, China Academy of Sciences. Each OBS contains one hydrophone, as well as one vertical and two horizontal geophones. Fifteen OBSs were deployed, while fourteen of them were recovered, with OBS six lost. Location and clock time, during the deployment and recovery of the OBSs, were recorded in the log files.
In pre-processing, the raw OBS data were converted to SEGY format with UTIG’s software OBSTOOL [19]. Bathymetry is constrained by the coincident MCS profile. Clock drift is calculated by the readouts from the log files and used to correct the time of the OBS data. The direct waves, in a 4 km window, centering on OBS deployment position, were used to relocate the OBS falls on the sea bottom. As results, the space drifts were calculated as 84 m (OBS 1), 194 m (OBS 2), 235 m (OBS 3), 1377 m (OBS 4), 757 m (OBS 5), 262 m (OBS 7), 307 m (OBS 8), 228 m (OBS 9), 210 m (OBS 10), 127 m (OBS 11), 173 m (OBS 12), 176 m (OBS 13), 248 m (OBS 14), and 102 m (OBS 15), respectively. Offsets were recalculated with the relocated OBS positions. A 5–15 Hz band-pass filter was tested and well applied to suppress high frequency noise.
Each OBS record was displayed with a reduction velocity of 8 km/s. Depending on the signal-to-noise ratio, either hydrophone or vertical components were selected to pick the first arrivals. The first arrivals were picked for all OBS records. Records of OBS 1–OBS 5, which are close to H110, were selected to be illustrated in Figure 3. According to phase velocity, the picks include direct waves, labelled as Pw (1.5 km/s), and refracted waves, in primitive recognition, from sedimentary layers (1.6–5.5 km/s), crystalline basement (6–7 km/s), and Mantle (>7 km/s), i.e., Psed, Pg, and Pn, respectively (Figure 3). OBS 1 and 2 sat on the two sides of H110 (Figure 3), their records show that the first arrival waves were clear in near offset (<30 km), with high signal-to-noise ratio (S/N), and visible in middle and far range (offset >30 km), with low S/N. Three sedimentary layer-refracted phase drops are found, with time jump from 2.25 s to 2.5 s at 12 km offset of OBS 1, 1.5 s to 1.75 s at −5 km, and 2.25 s to 2.75 s at 10 km of OBS 2. These drops complicate the first arrival phase curves, implicating complex velocity structure. OBS 3–5 also recorded rich phases through H110. OBS 3 records show regular linear noises, likely due to a machine problem, but the first arrivals are still legible. For the OBS 7–15 records, the first arrivals are generally well recognizable to large offset.

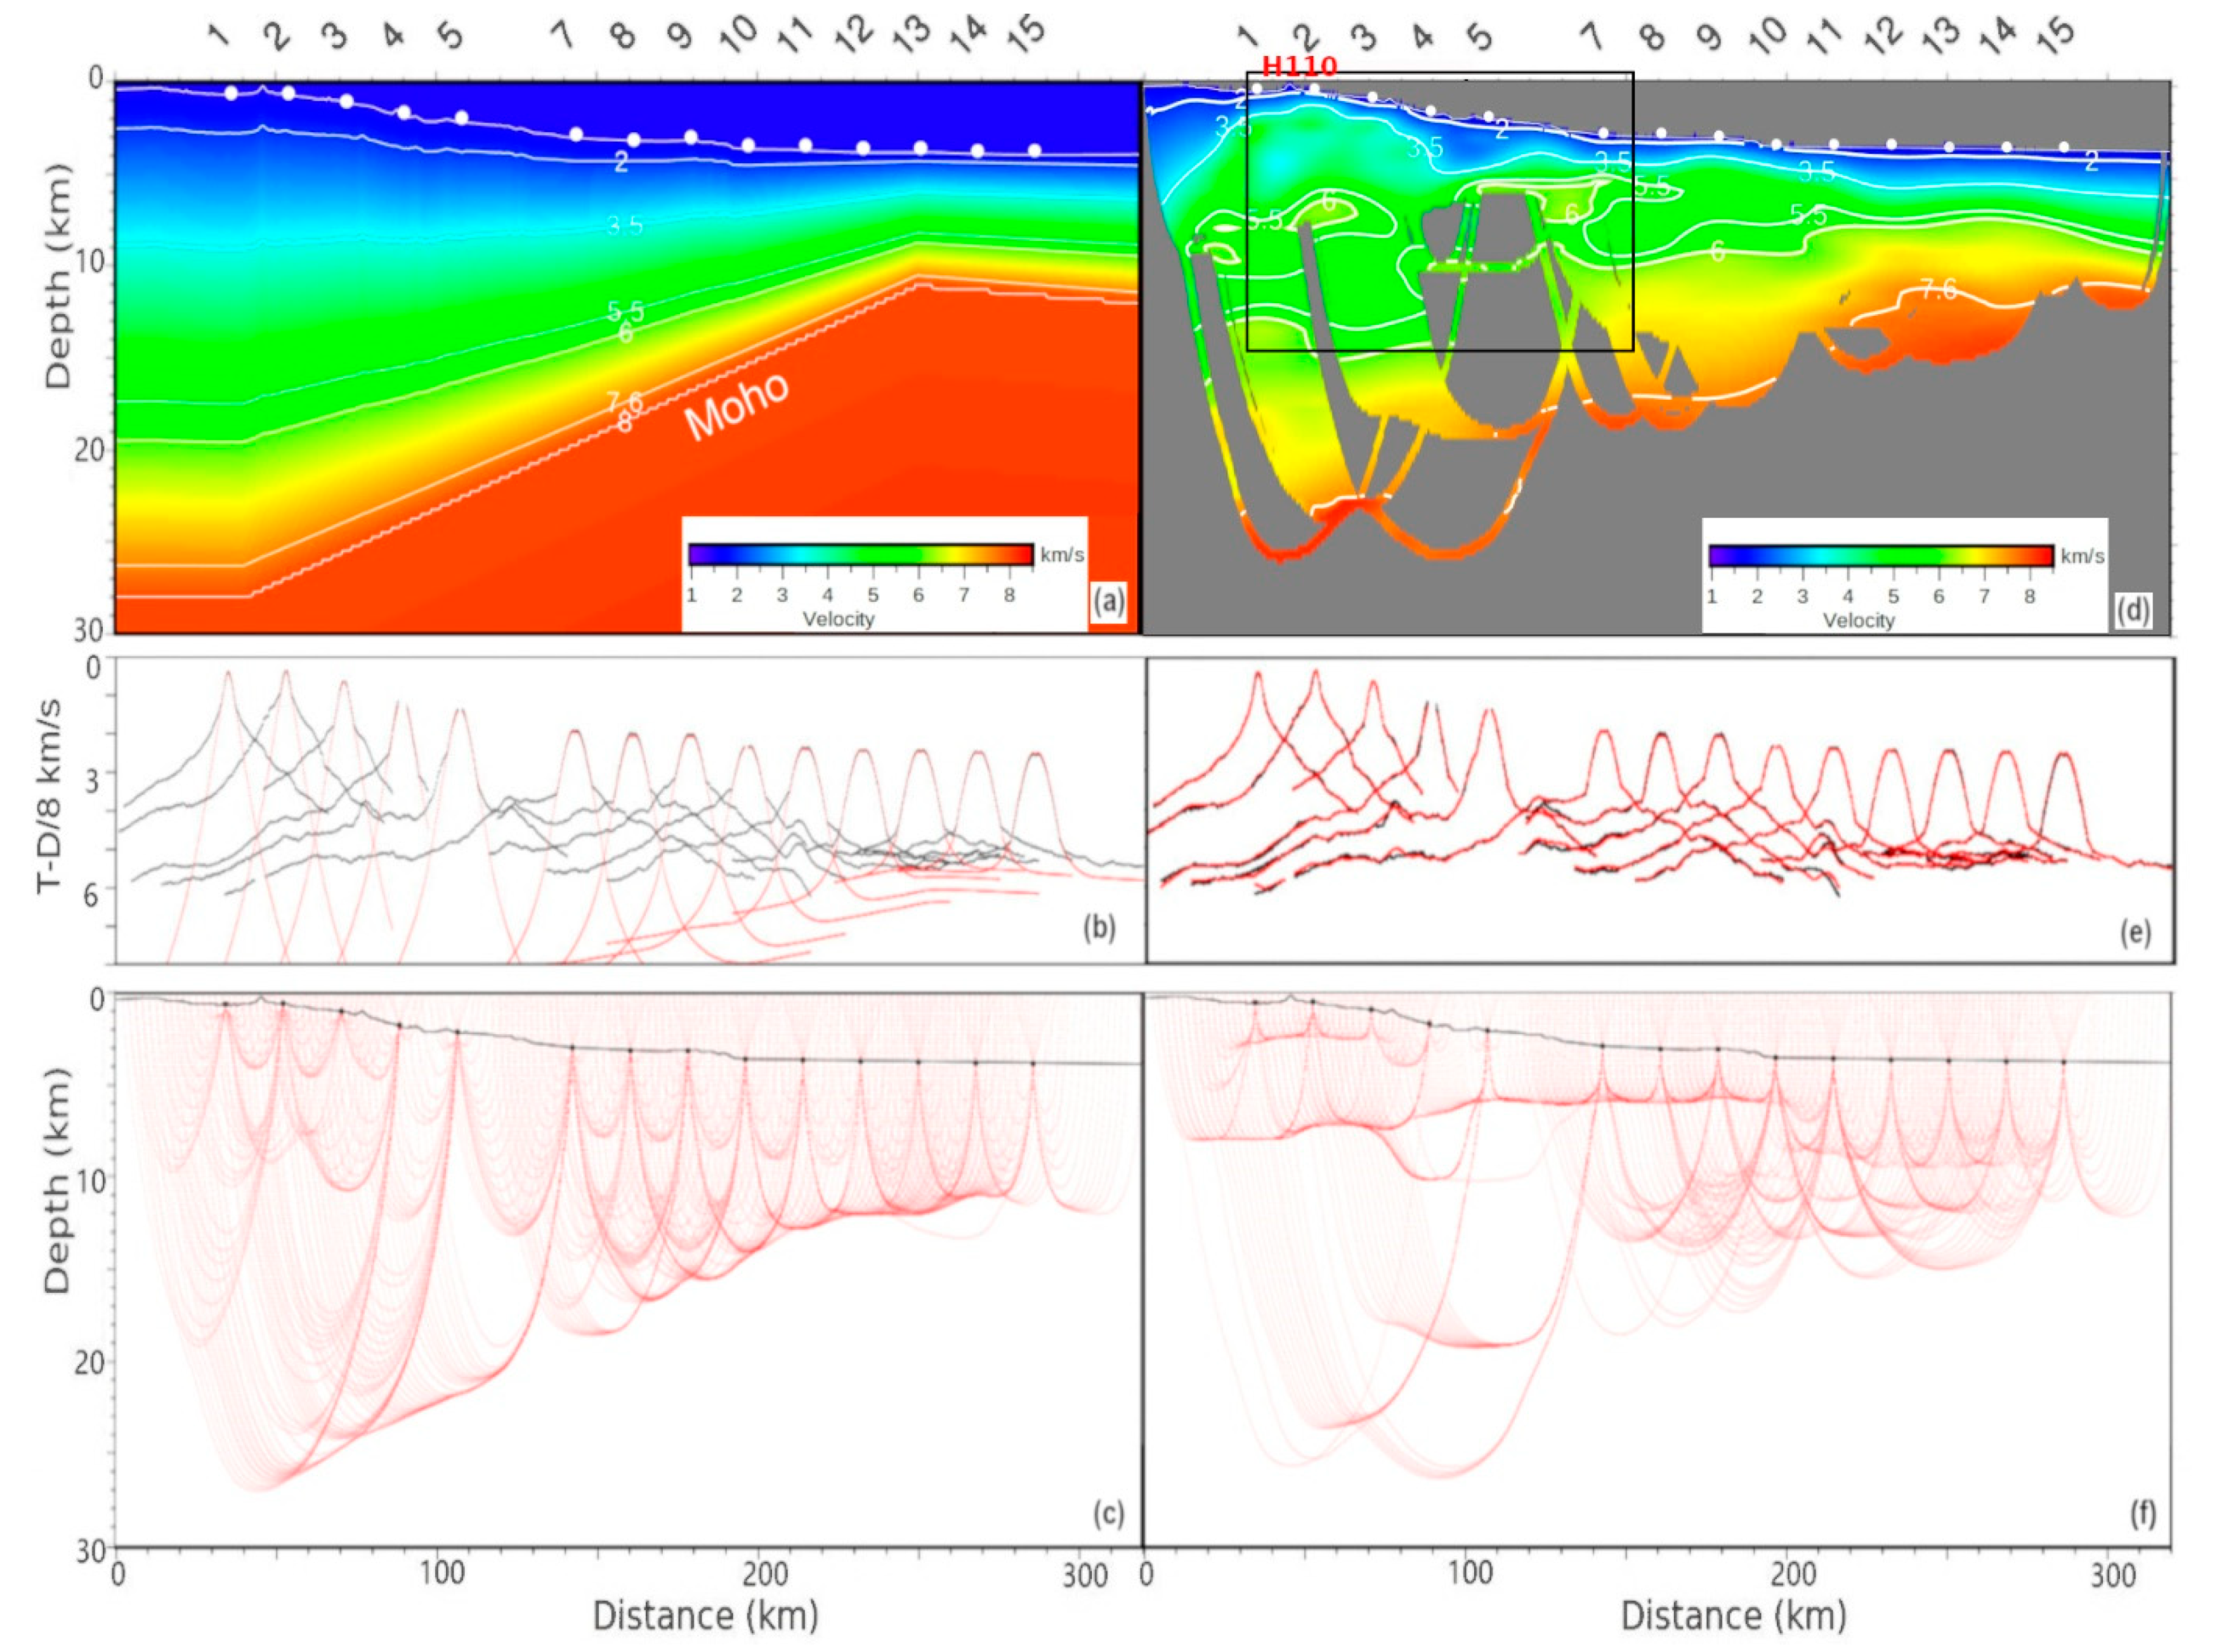
3.1.2. Velocity Inversion

Velocity inversion requires an initial model. It is established in the following steps. Firstly, a 320 km × 30 km blank model is constructed using cell space 0.25 × 0.25 km. Secondary, it is endowed with bathymetry, converted from MCS time data, with a sea water velocity of 1.5 km/s. Thirdly, the geometry of Moho discontinuity is assumed, with a curve of three line sections. Fourthly, velocity is assigned by linear increase from 1.5 km/s to 8 km/s, with depth from seabed to Moho, and kept at 1.5 km/s in water and 8 km/s beneath Moho (Figure 4a). OBS locations are projected onto the profile of L2016-2.
According to the S/N ratio, uncertainty of the first arrival time picks is assigned as 0.02 s for offset <30 km and 0.1 s for offset >30 km, respectively. To run velocity inversion, the initial velocity model (Figure 4a), time picks of the first arrivals, location of OBS, and bathymetry were input together into FAST program [20]. The number of iterations and trade-off parameters (regularization factor) were tested to 20 and 5, respectively. To the 20th run, the root-mean-square misfit between the calculated and observed arrivals was 46.79 ms and normalized chi-square value (misfit of traveltimes to uncertainty of picks) was 1.546 ms, both of which are usually regarded as satisfactory [21]. The observed (black dot) and calculated (red dot) first arrivals for the initial (Figure 4b) and finial (Figure 4e) velocity model were plotted to show the inversion process. The initial and final ray paths are shown in Figure 4c,f.
The final velocity model (Figure 4d and Figure 5) displays 2 remarkable features relating to H110. One is that the velocity generally increases from 1.5 km/s to 5.5 km/s to 7 km deep with an enclosed low-velocity zone 3 km thick, 20 km wide in depth of 3–5.5 km. Velocity in the zone decreased from 4 km/s (periphery) to 3.3 km/s at core. Another is two high-velocity (>5.5 km/s) zones. The west high-velocity zone (HVZ1) appears at 7–9 km and underlies slightly to east of the low-velocity zone below H110. The east one (HVZ2) centers at a model distance of 130 km, 3 km below the seabed.

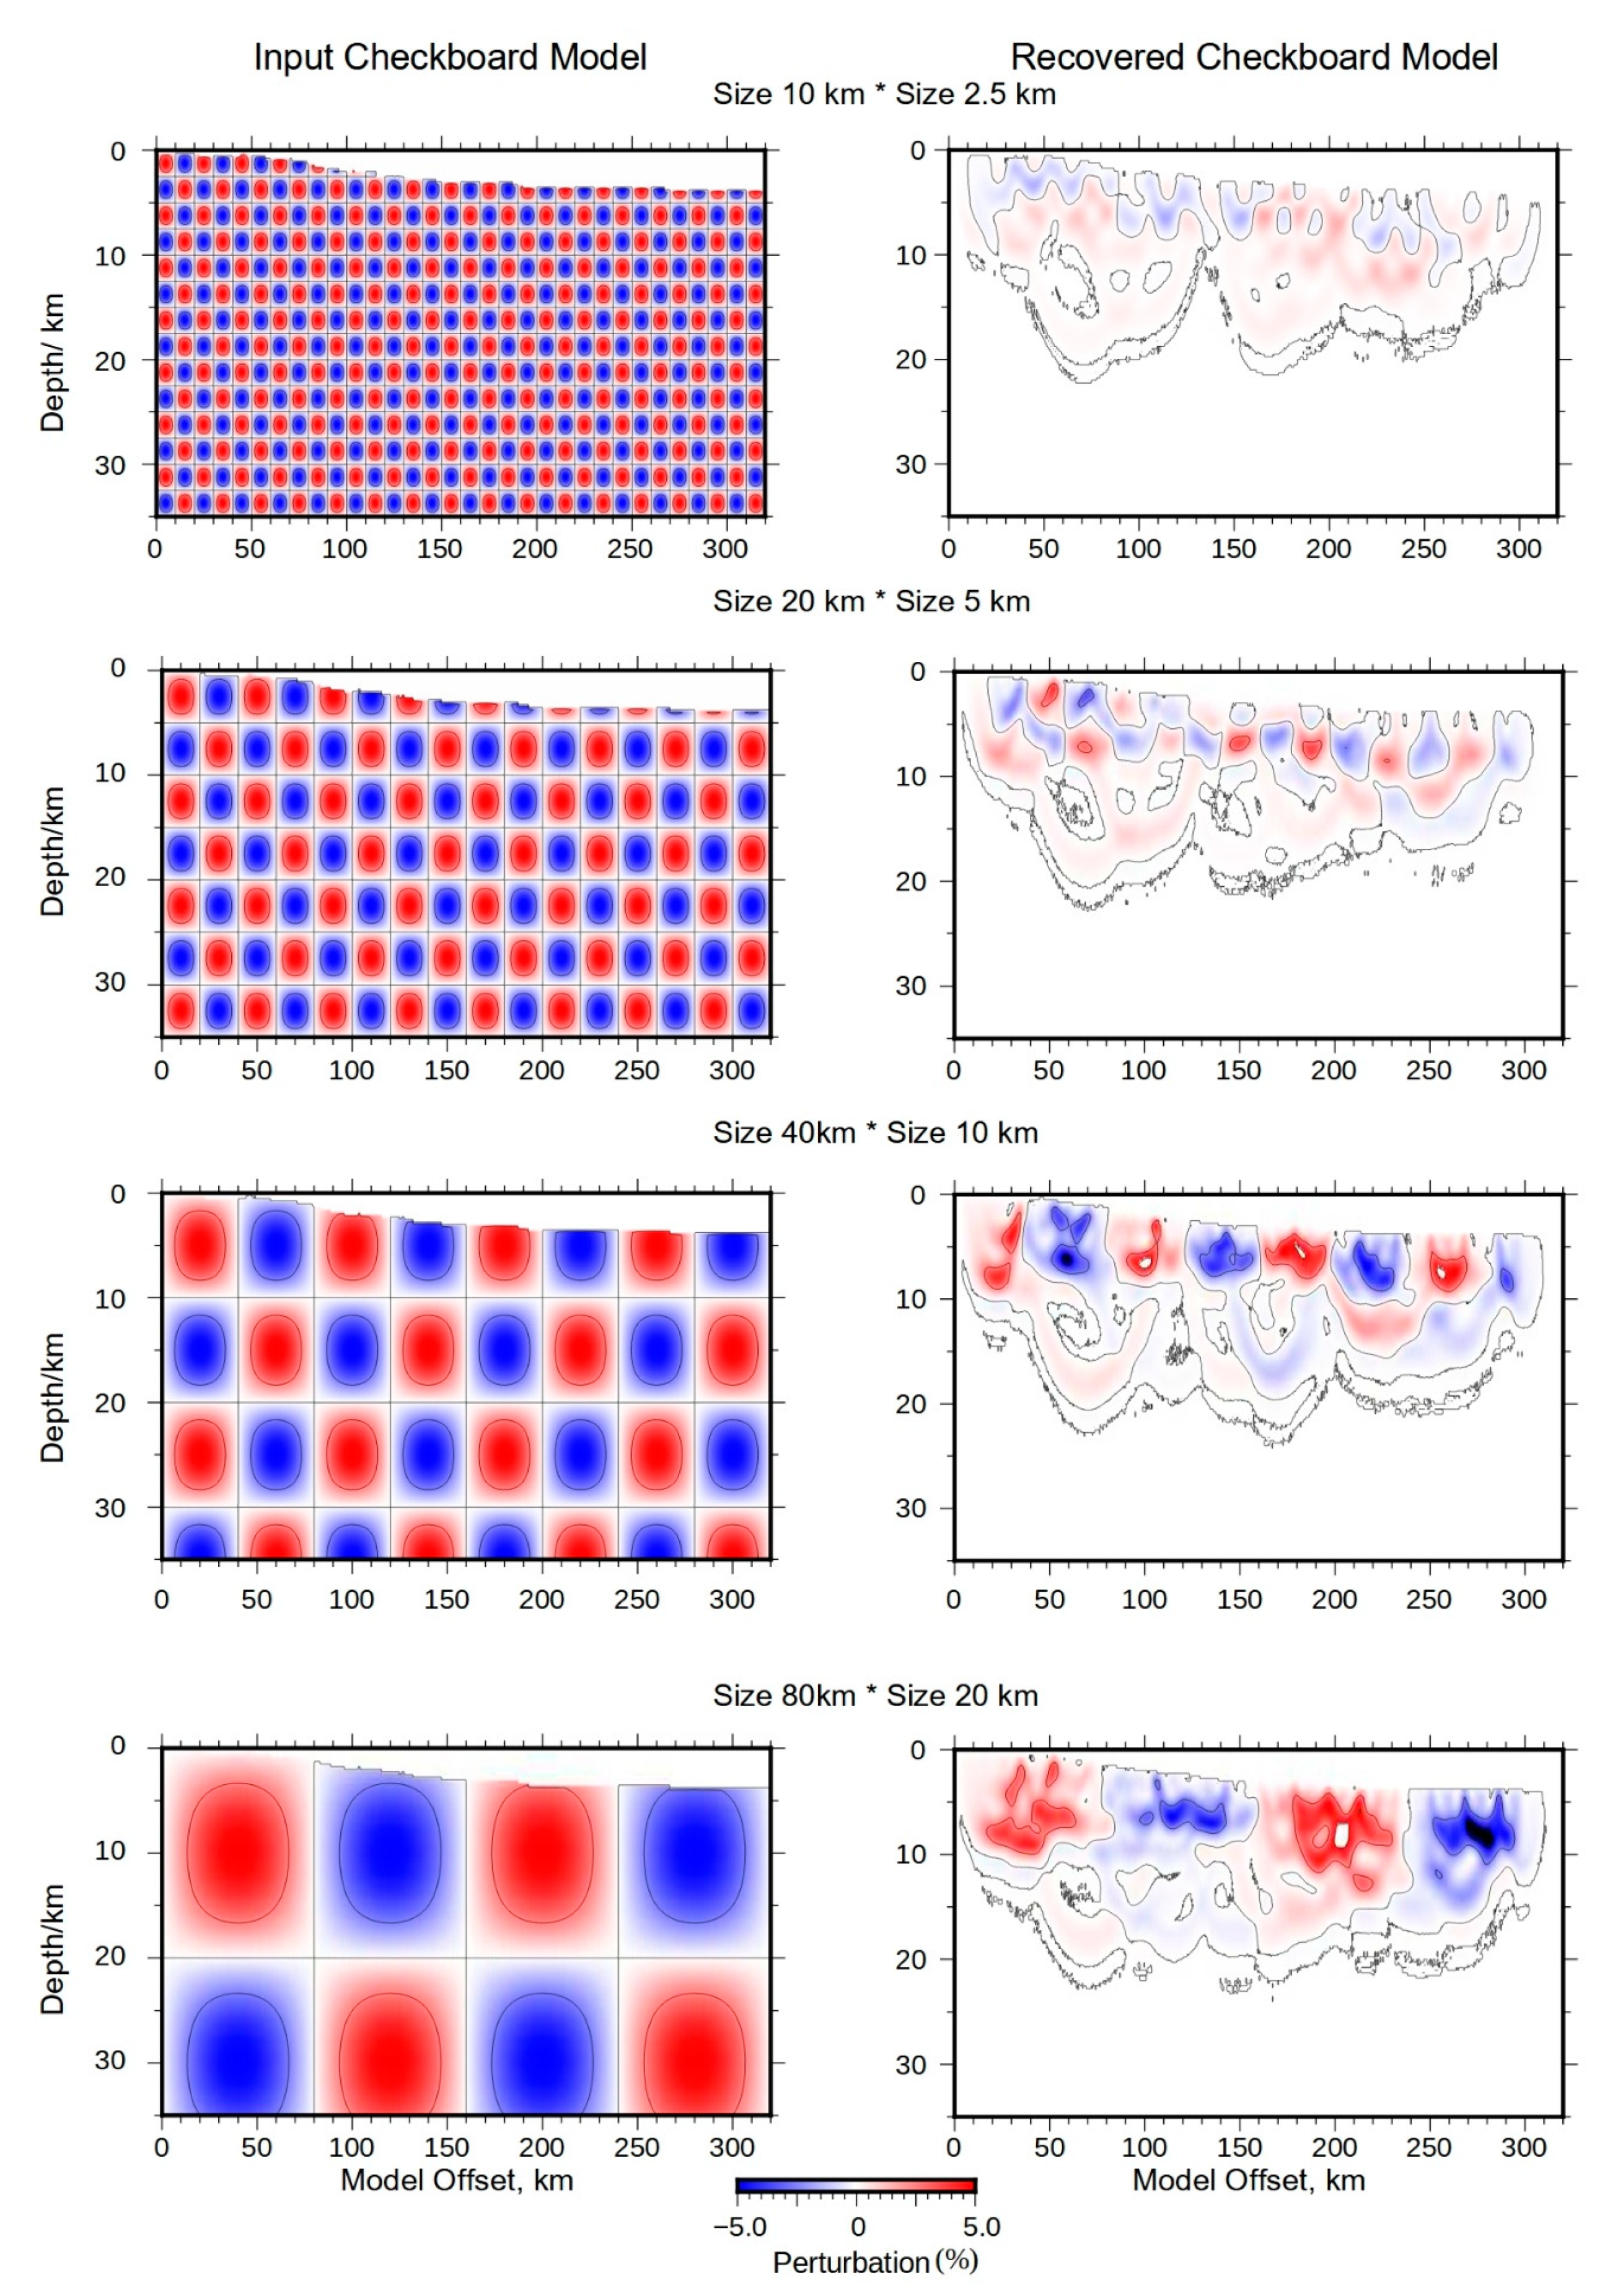
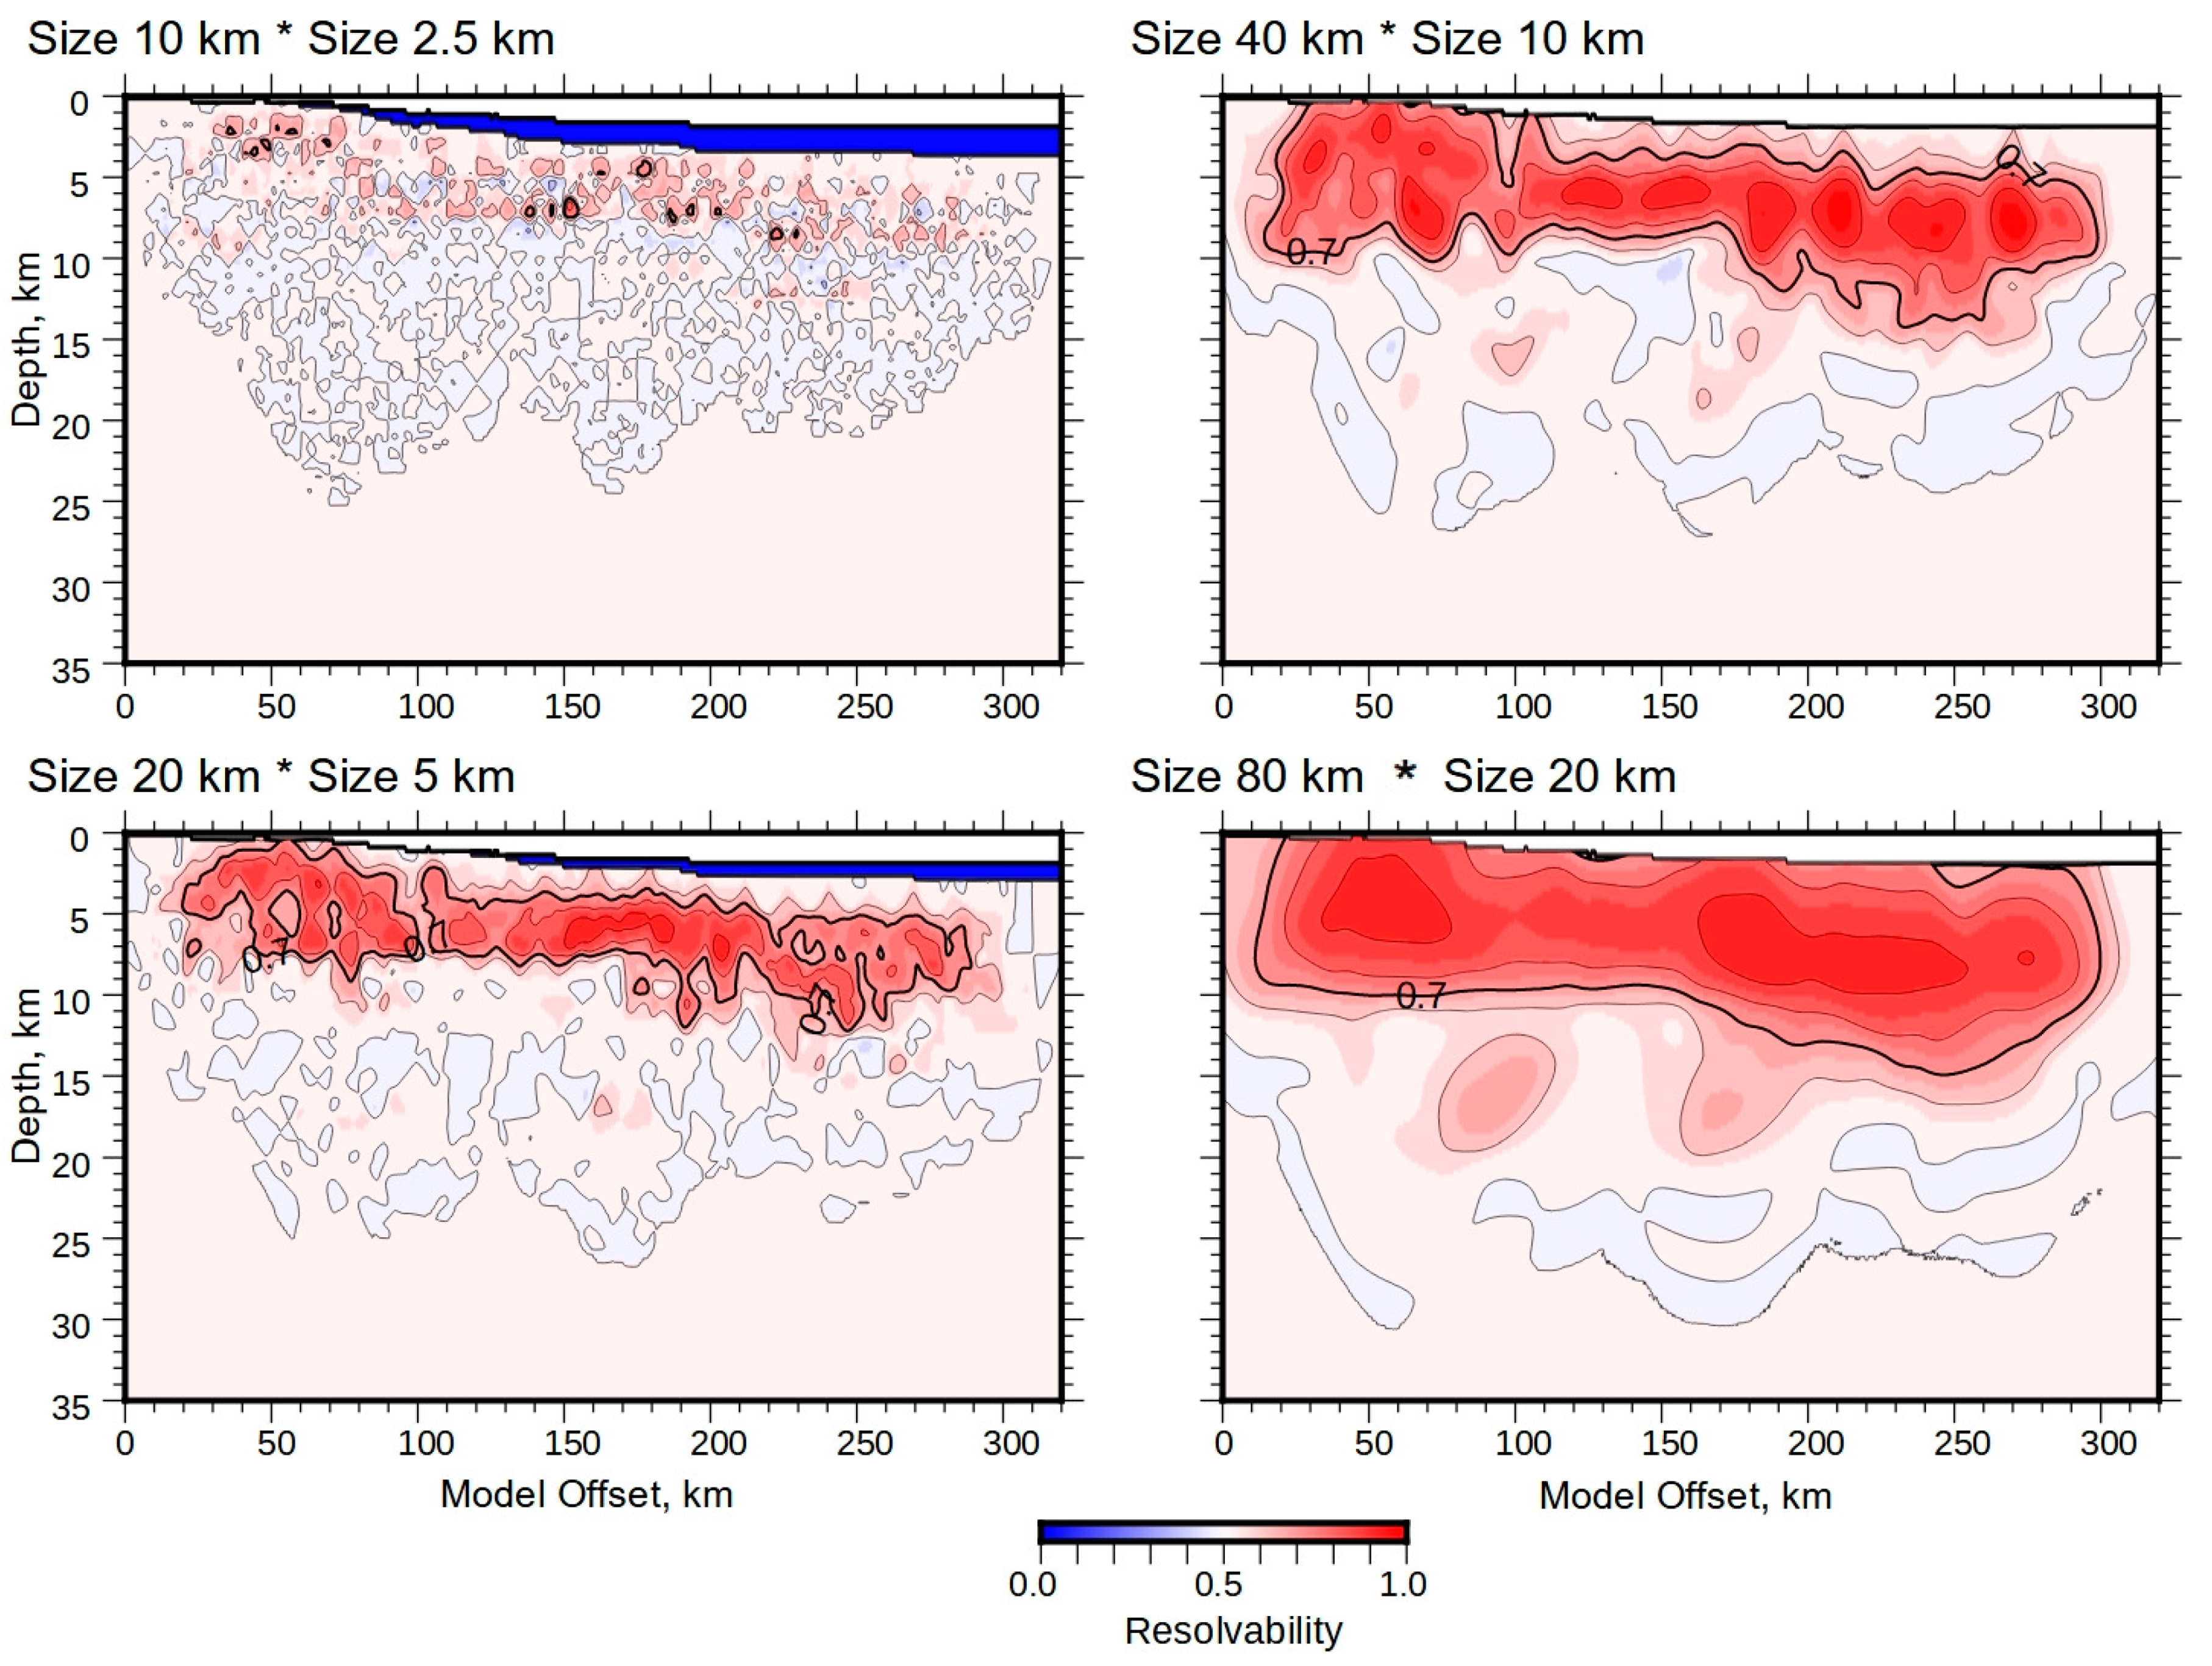
3.1.3. Checkerboard and Resolvability

To assess the resolution of the velocity inversion, the checkerboard method [21] was used. Synthetic perturbations of the inversed velocity were set in the range of −5% to 5%. Four checkerboard models, using sizes of 10 × 2.5 km, 20 × 5 km, 40 × 10 km, and 80 × 20 km, were tested (Figure 6). The resolvability was calculated with the Zelt (1998) [21] formulae of starting and recovered velocities. For the low-velocity zone (depth of 1–7 km) and the underlying high-velocity zone (depth of 7–9 km) beneath H110, the velocity resolvabilities were partly greater than 0.7 for 10 km cell size and universally higher for 20, 40, and 80 km cell sizes (Figure 7). The deeper part is less resolvable, due to fewer arrival picks and sparser ray paths.
It is noteworthy that below H110, the 20 × 3 km low-velocity (3.3–4 km/s) zone, appearing at 4.5 km depth and 30 × 3 km high-velocity (5.5–6.3 km/s) zone at 7 km depth (Figure 5), are basically well-recovered, with a confident resolvability of 0.7 in disturbance cell sizes of 10 × 2.5 km and 20 × 5 km, respectively (Figure 6 and Figure 7).

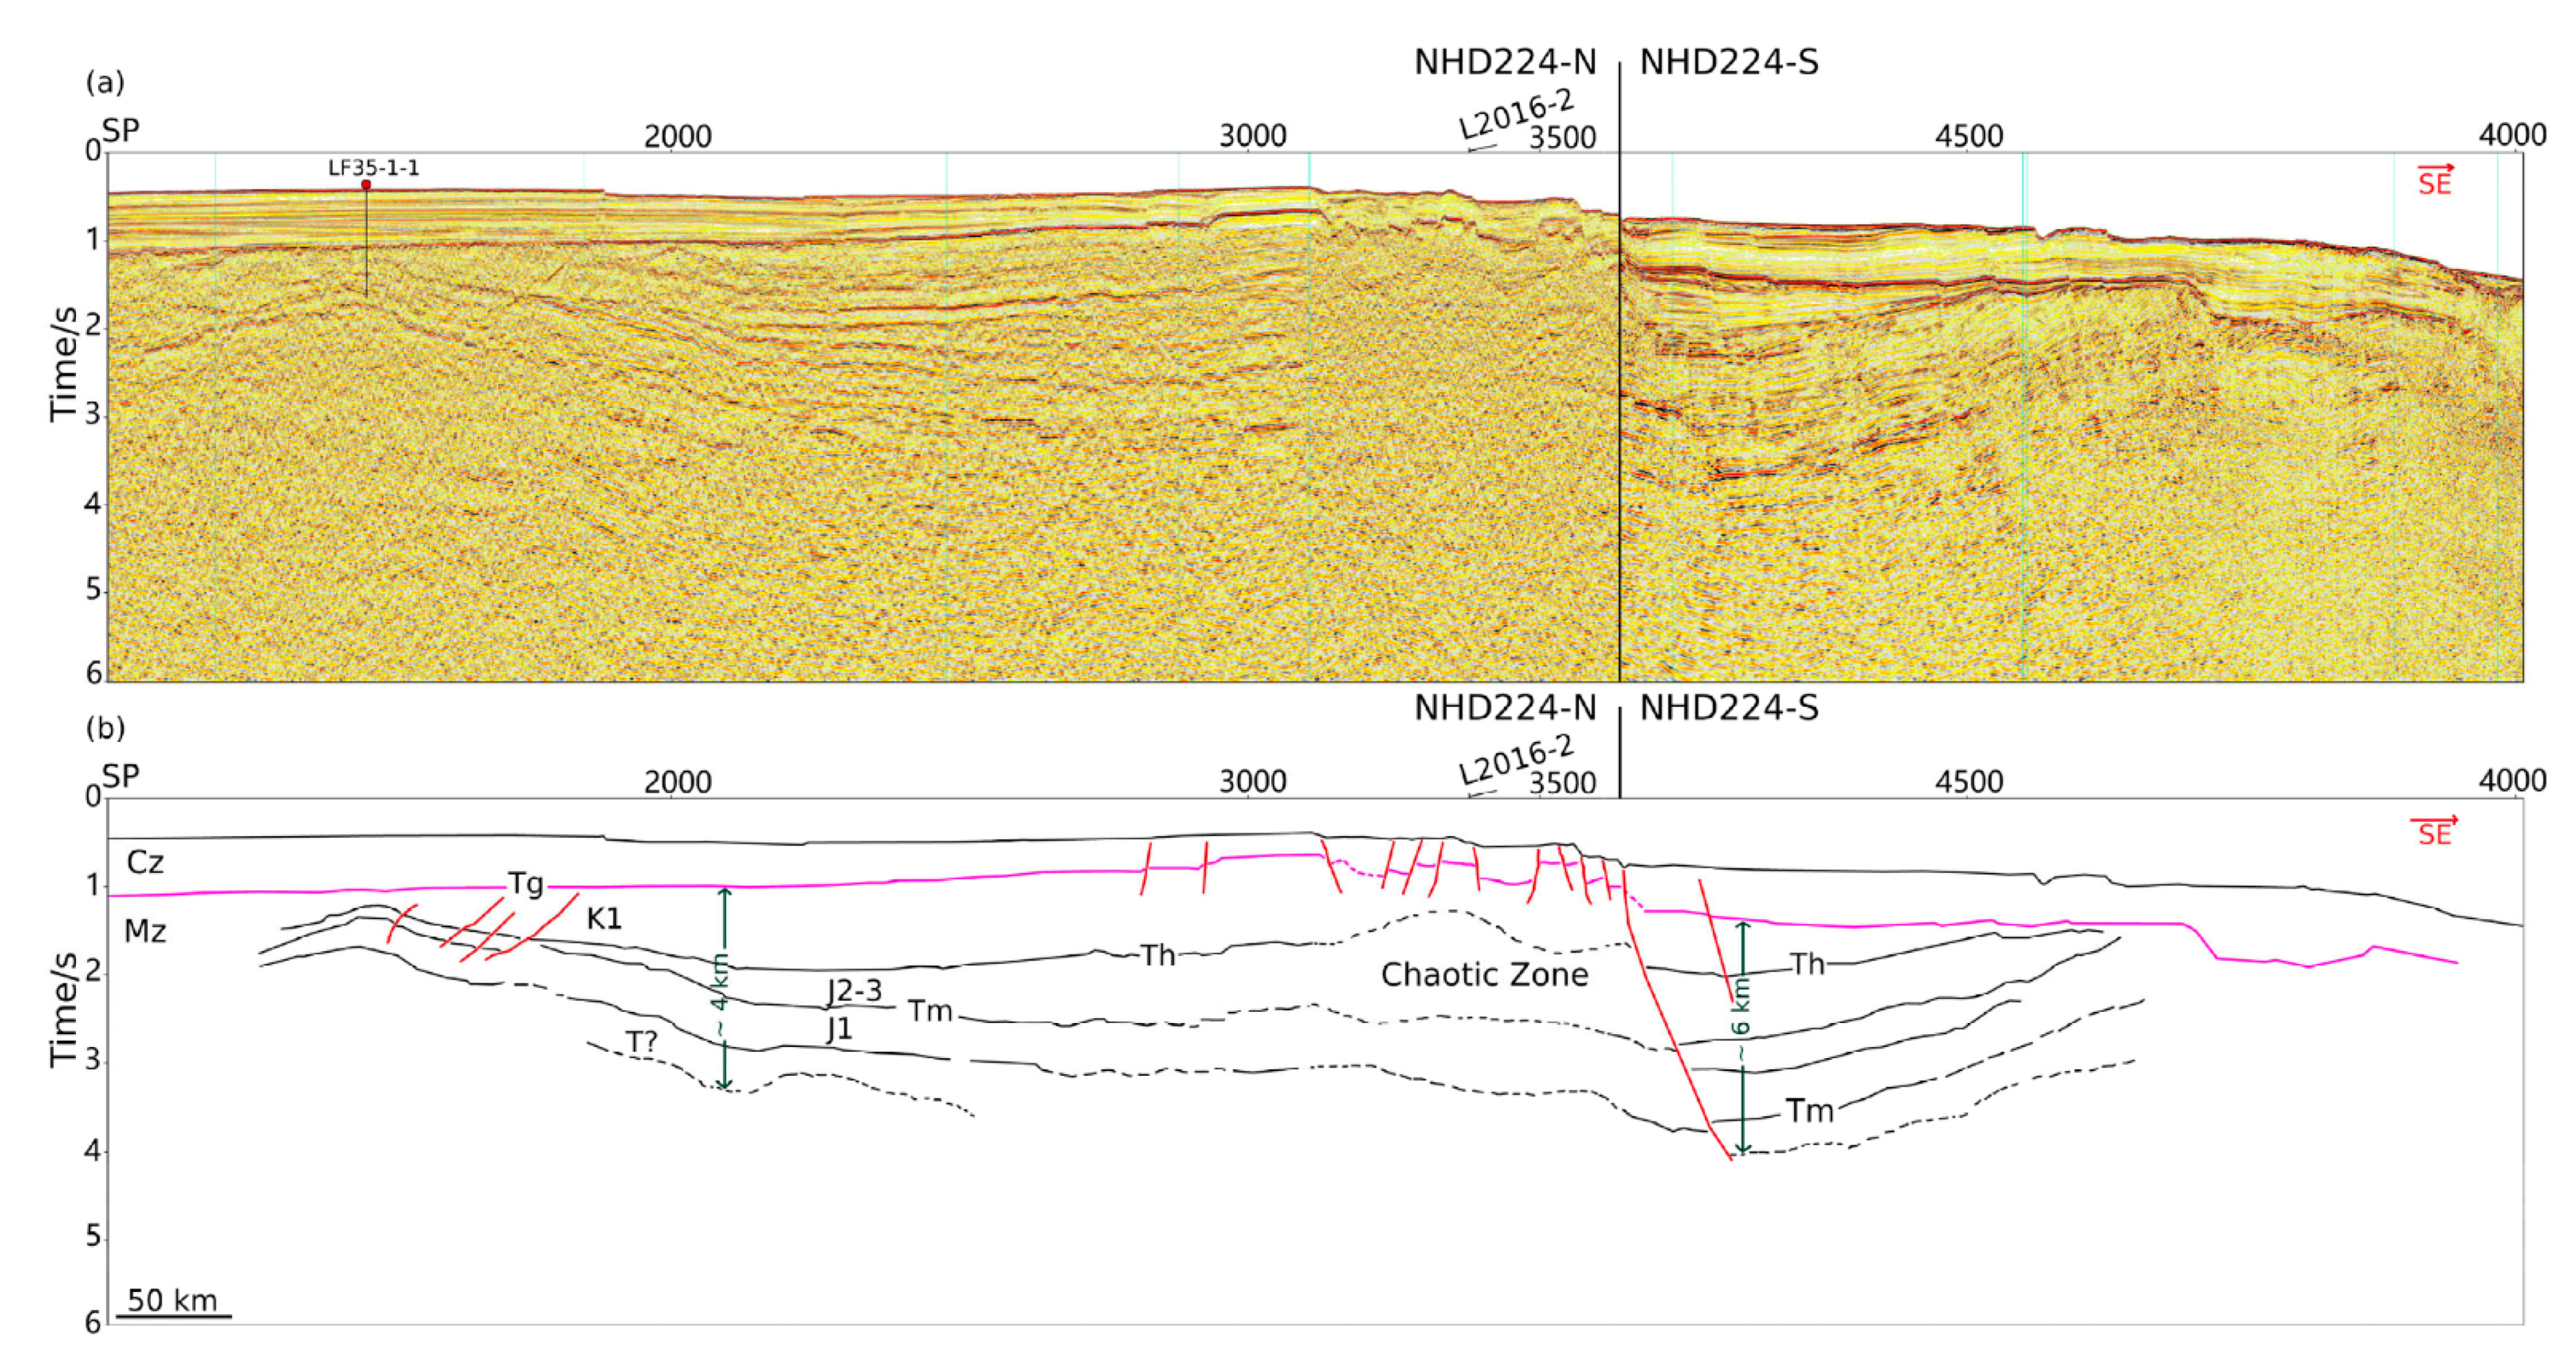
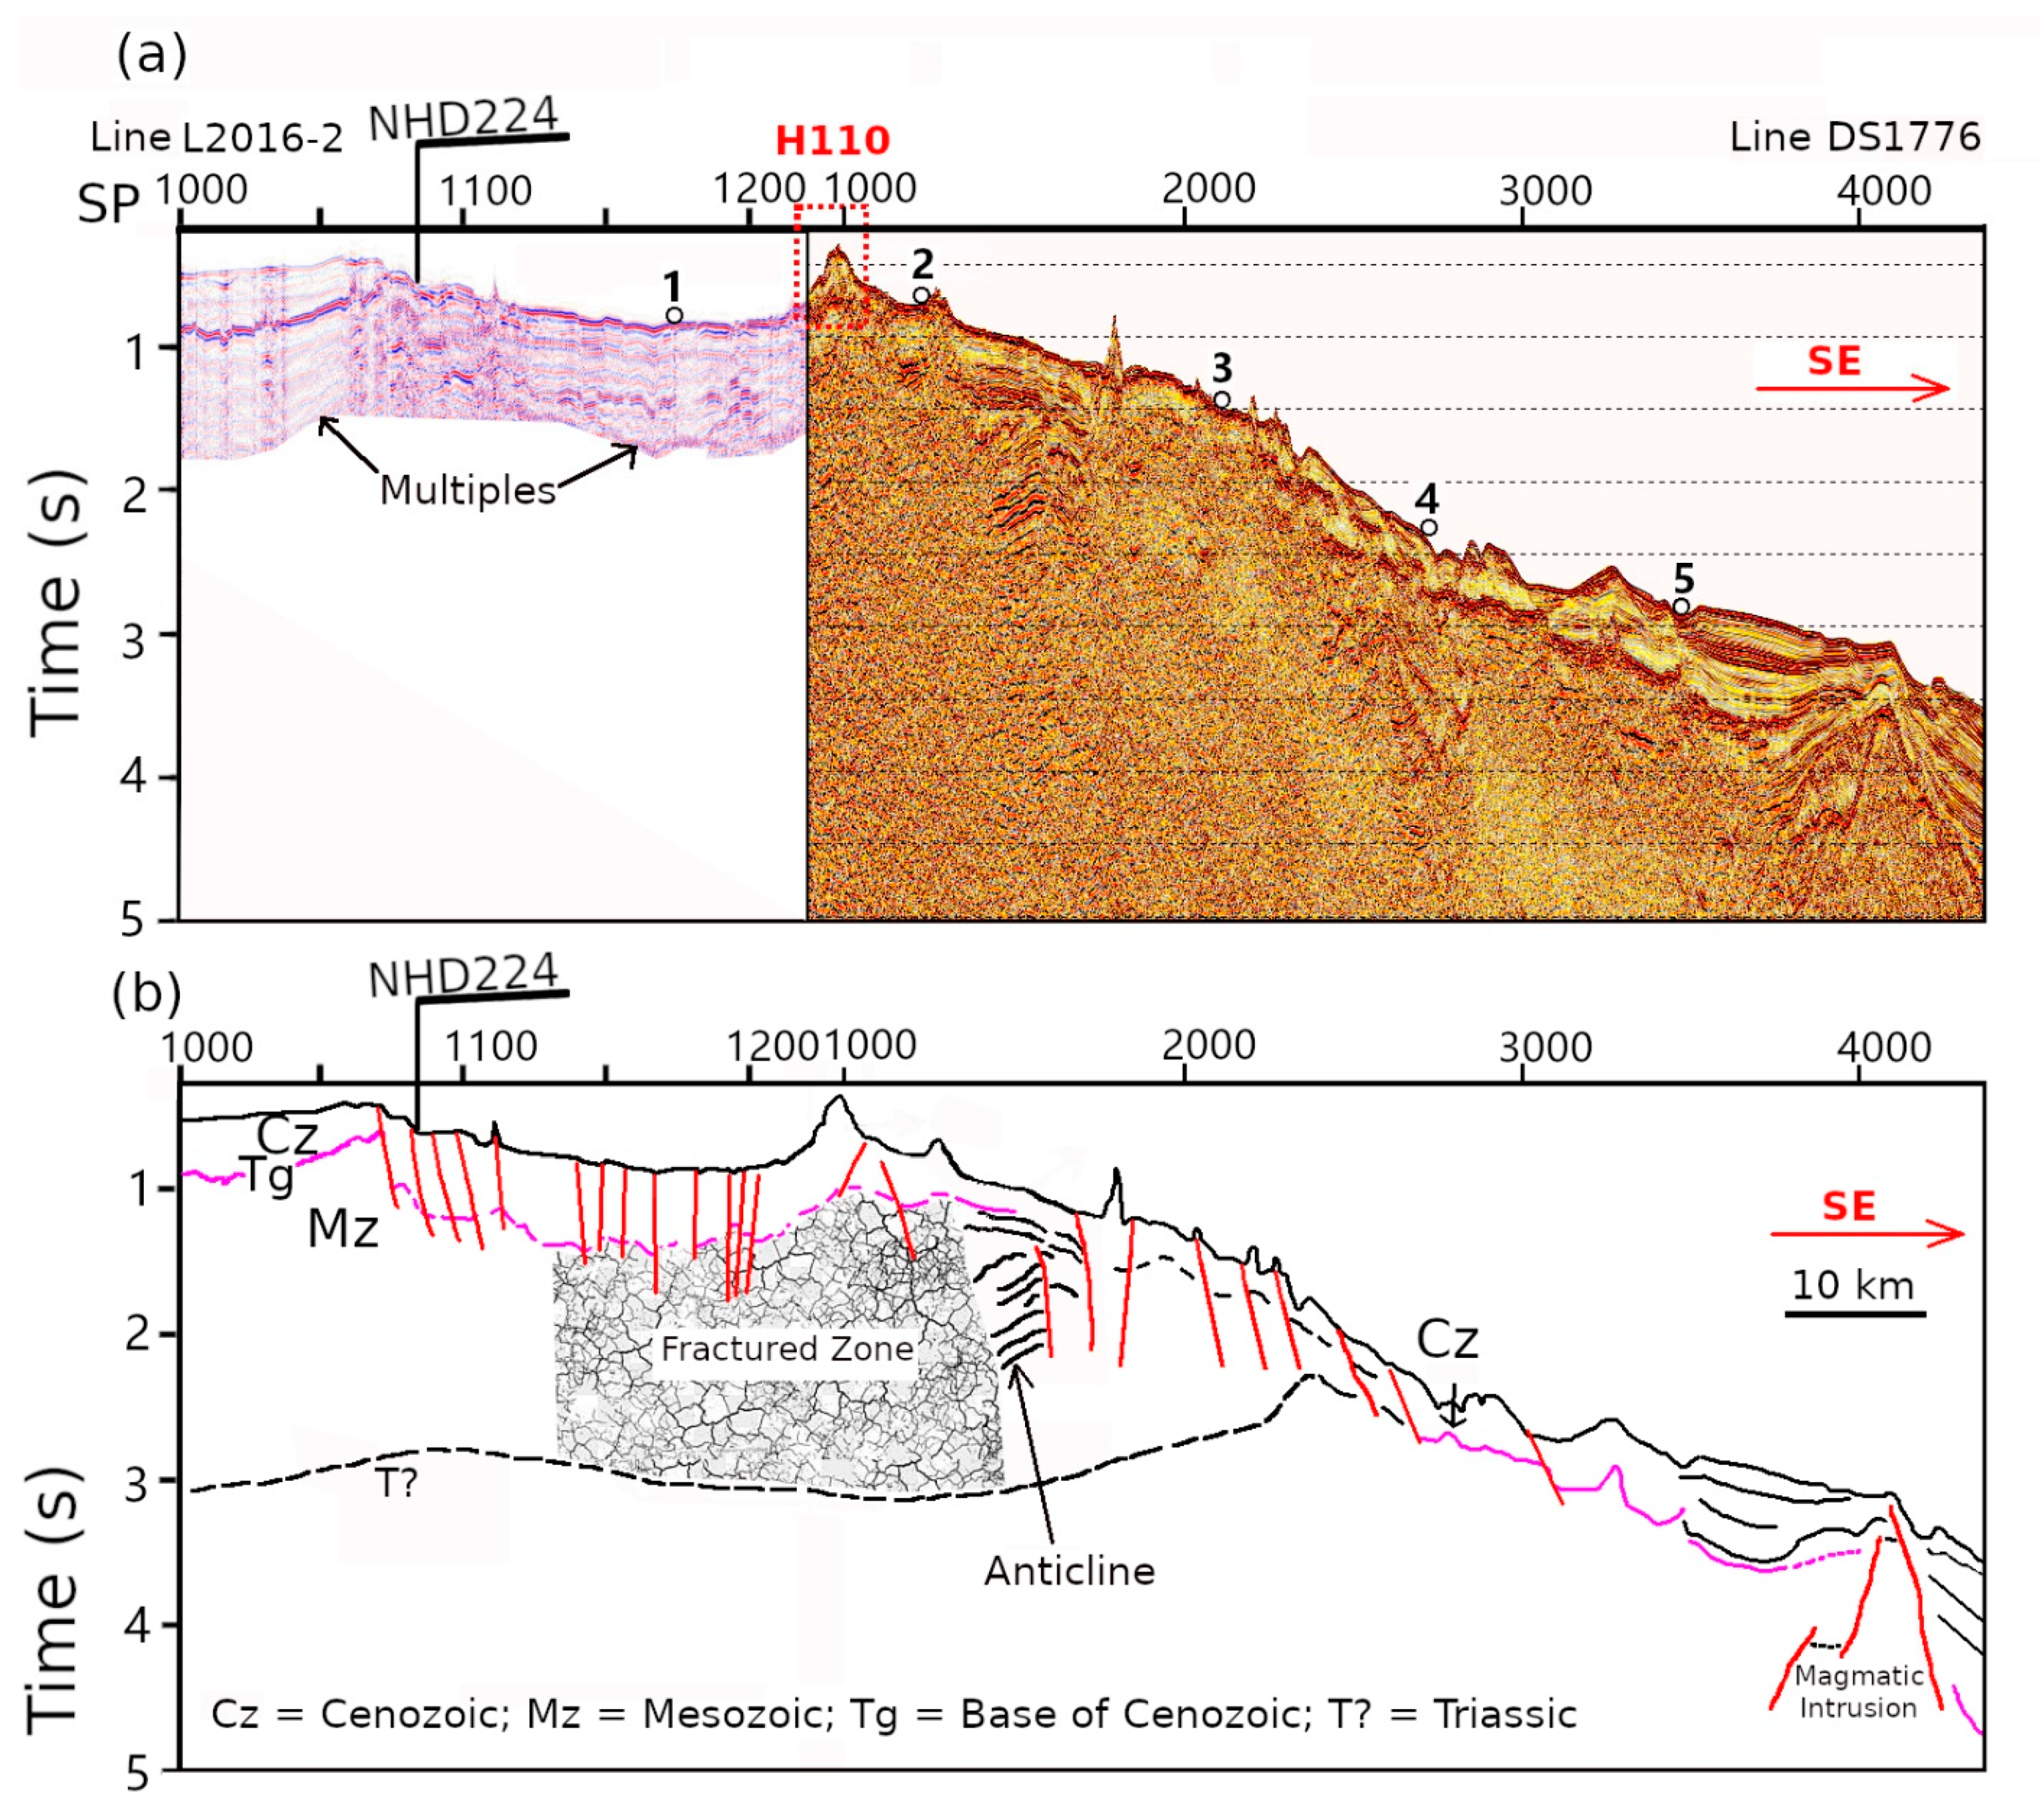
3.2. Multichannel Seismic Data Processing and Reflection Characteristics

A multichannel seismic streamer, model Seal 428 (Sercel Corp, Nantes, France), 1.5 km long, with 120 channels, spacing at 12.5 m, was deployed 12 m deep in the water, with a minimum offset of 200 m, concurring with the OBS survey. The record time length was 14 s, and the sample interval is 2 ms.
To reveal the reflection structure of H110, MCS data of the northern section of L2016-2 were processed using the CGG-GeoVation (CGG, West Perthm, Australia). The routine procedures include amplitude compensation, bandpass filtering, CDP sorting, velocity analysis, NMO correction, stacking, and migrating. The migrated profile fairly clearly shows imaged structures before multiple waves, which smear the later portion, due to poor suppression with low coverage (only 4 folds).
Two vintage MCS lines (NHD224, DS1776) crossing our research area were resorted to, in order supplement the study of H110 (Figure 1 and Figure 2). The MCS acquisition parameters are listed in Table 1. Line NHD224 (Figure 8) runs north close to H110 and intersects with Line L2016-2, and Line DS1776 (Figure 9) coincides with it for the most part. Both them feature a clearer image with higher coverage.
Line NHD224 starts from the vicinity of well LF35-1-1, where 1.6 km thick Mesozoic strata were drilled. The profile clearly shows several major reflectors, Tg, Th, and Tm, to depth (Figure 8). According to [11] Tg, featuring the strongest amplitude and highest continuity, is recognized as the base of the Cenozoic Erathem. Th and Tm, featuring high amplitude reflections, are the base of the Cretaceous and top of the early Jurassic (J1), respectively. The Mesozoic strata become thicker toward the southeast. In the range of shot point 3200–3778, the Cenozoic layers are cut by frequent faults, while the underlying Mesozoic Erathem appears too chaotic to specify any interface or major fault. In terms of the dips of the deep reflectors, this range sits a paleo-depocenter. On both sides of the chaotic zone, reflectors are visible deep to ~3 s and ~4 s, respectively, implying 4 and 6 km thick Mesozoic strata, using a velocity of 4 km/s. Hence, the thickness of the pristine Mesozoic sediment within the chaotic zone is maybe at least 5 km.
Figure 9a is a composite MCS profile, comprising of the northwestern section of Line L2016-2 (4 folds) and DS1776 (120 folds). It intersects with NHD224, in the mid-east of the CSD (Figure 2), where the Mesozoic strata are ~5 km or thicker, while the reflections are chaotic and weak. It reveals that there are several submarine hills, the highest one is H110, which is a well conic edifice in 2D view, featuring eruptive structure. Over H110, the overlying Cenozoic reflections are segmented by steep faults, while the deep reflections become chaotic, excepting only few localities, where highly folded layers are visible southeast of it. Given the thick Mesozoic layer around, the chaotic reflection zone below H110 is interpreted as comprising of highly fractured Mesozoic strata (Figure 9b).

4. Discussion

4.1. Phase Drop and Low-Velocity Zone

Three sediment-related phase drops are visible in the records of the OBSs near H110 (Figure 3). Generally, phase drops can be caused by a major fault, steep interface, or low-velocity zone. The MCS profile (Figure 9a) shows neither major faults nor steep interface underlying H110 that would result in the phase drops, so they should have arisen from certain low-velocity variations, being consistent with the inversed low-velocity structure (Figure 5).

4.2. Velocity Structure and Sedimentary Layer Division

In CSD, the Mesozoic and Cenozoic strata feature much different velocity [9]. The Cenozoic strata comprise of the Neogene and Quaternary which are thin (totally <1 km) and shortly lithified, thus giving very low-velocity, while the Mesozoic layers remain great thickness (>5 km), despite high uplift and erosion. The Mesozoic strata includes Cretaceous red beds, which are of high-velocity (up to 5.5 km/s). A case profile shows velocity jumps to 4.5–5.0 km/s, for the Mesozoic from 1.8–2.4 km/s, for the mid-Miocene [9]. Over the CSD, the sedimentary column can be simplistically subdivided by seismic velocity as Cenozoic (1.5 km/s to 3.5 km/s) and Mesozoic (3.5 km/s to 5.5 km/s). Applying such a rule of thumb to the velocity profile L2016-2 (Figure 6), the Cenozoic and Mesozoic strata beneath H110 can be roughly estimated as ~1.5 and 5.5 km thick, respectively, which is roughly comparable to the MCS interpretation (Figure 9).

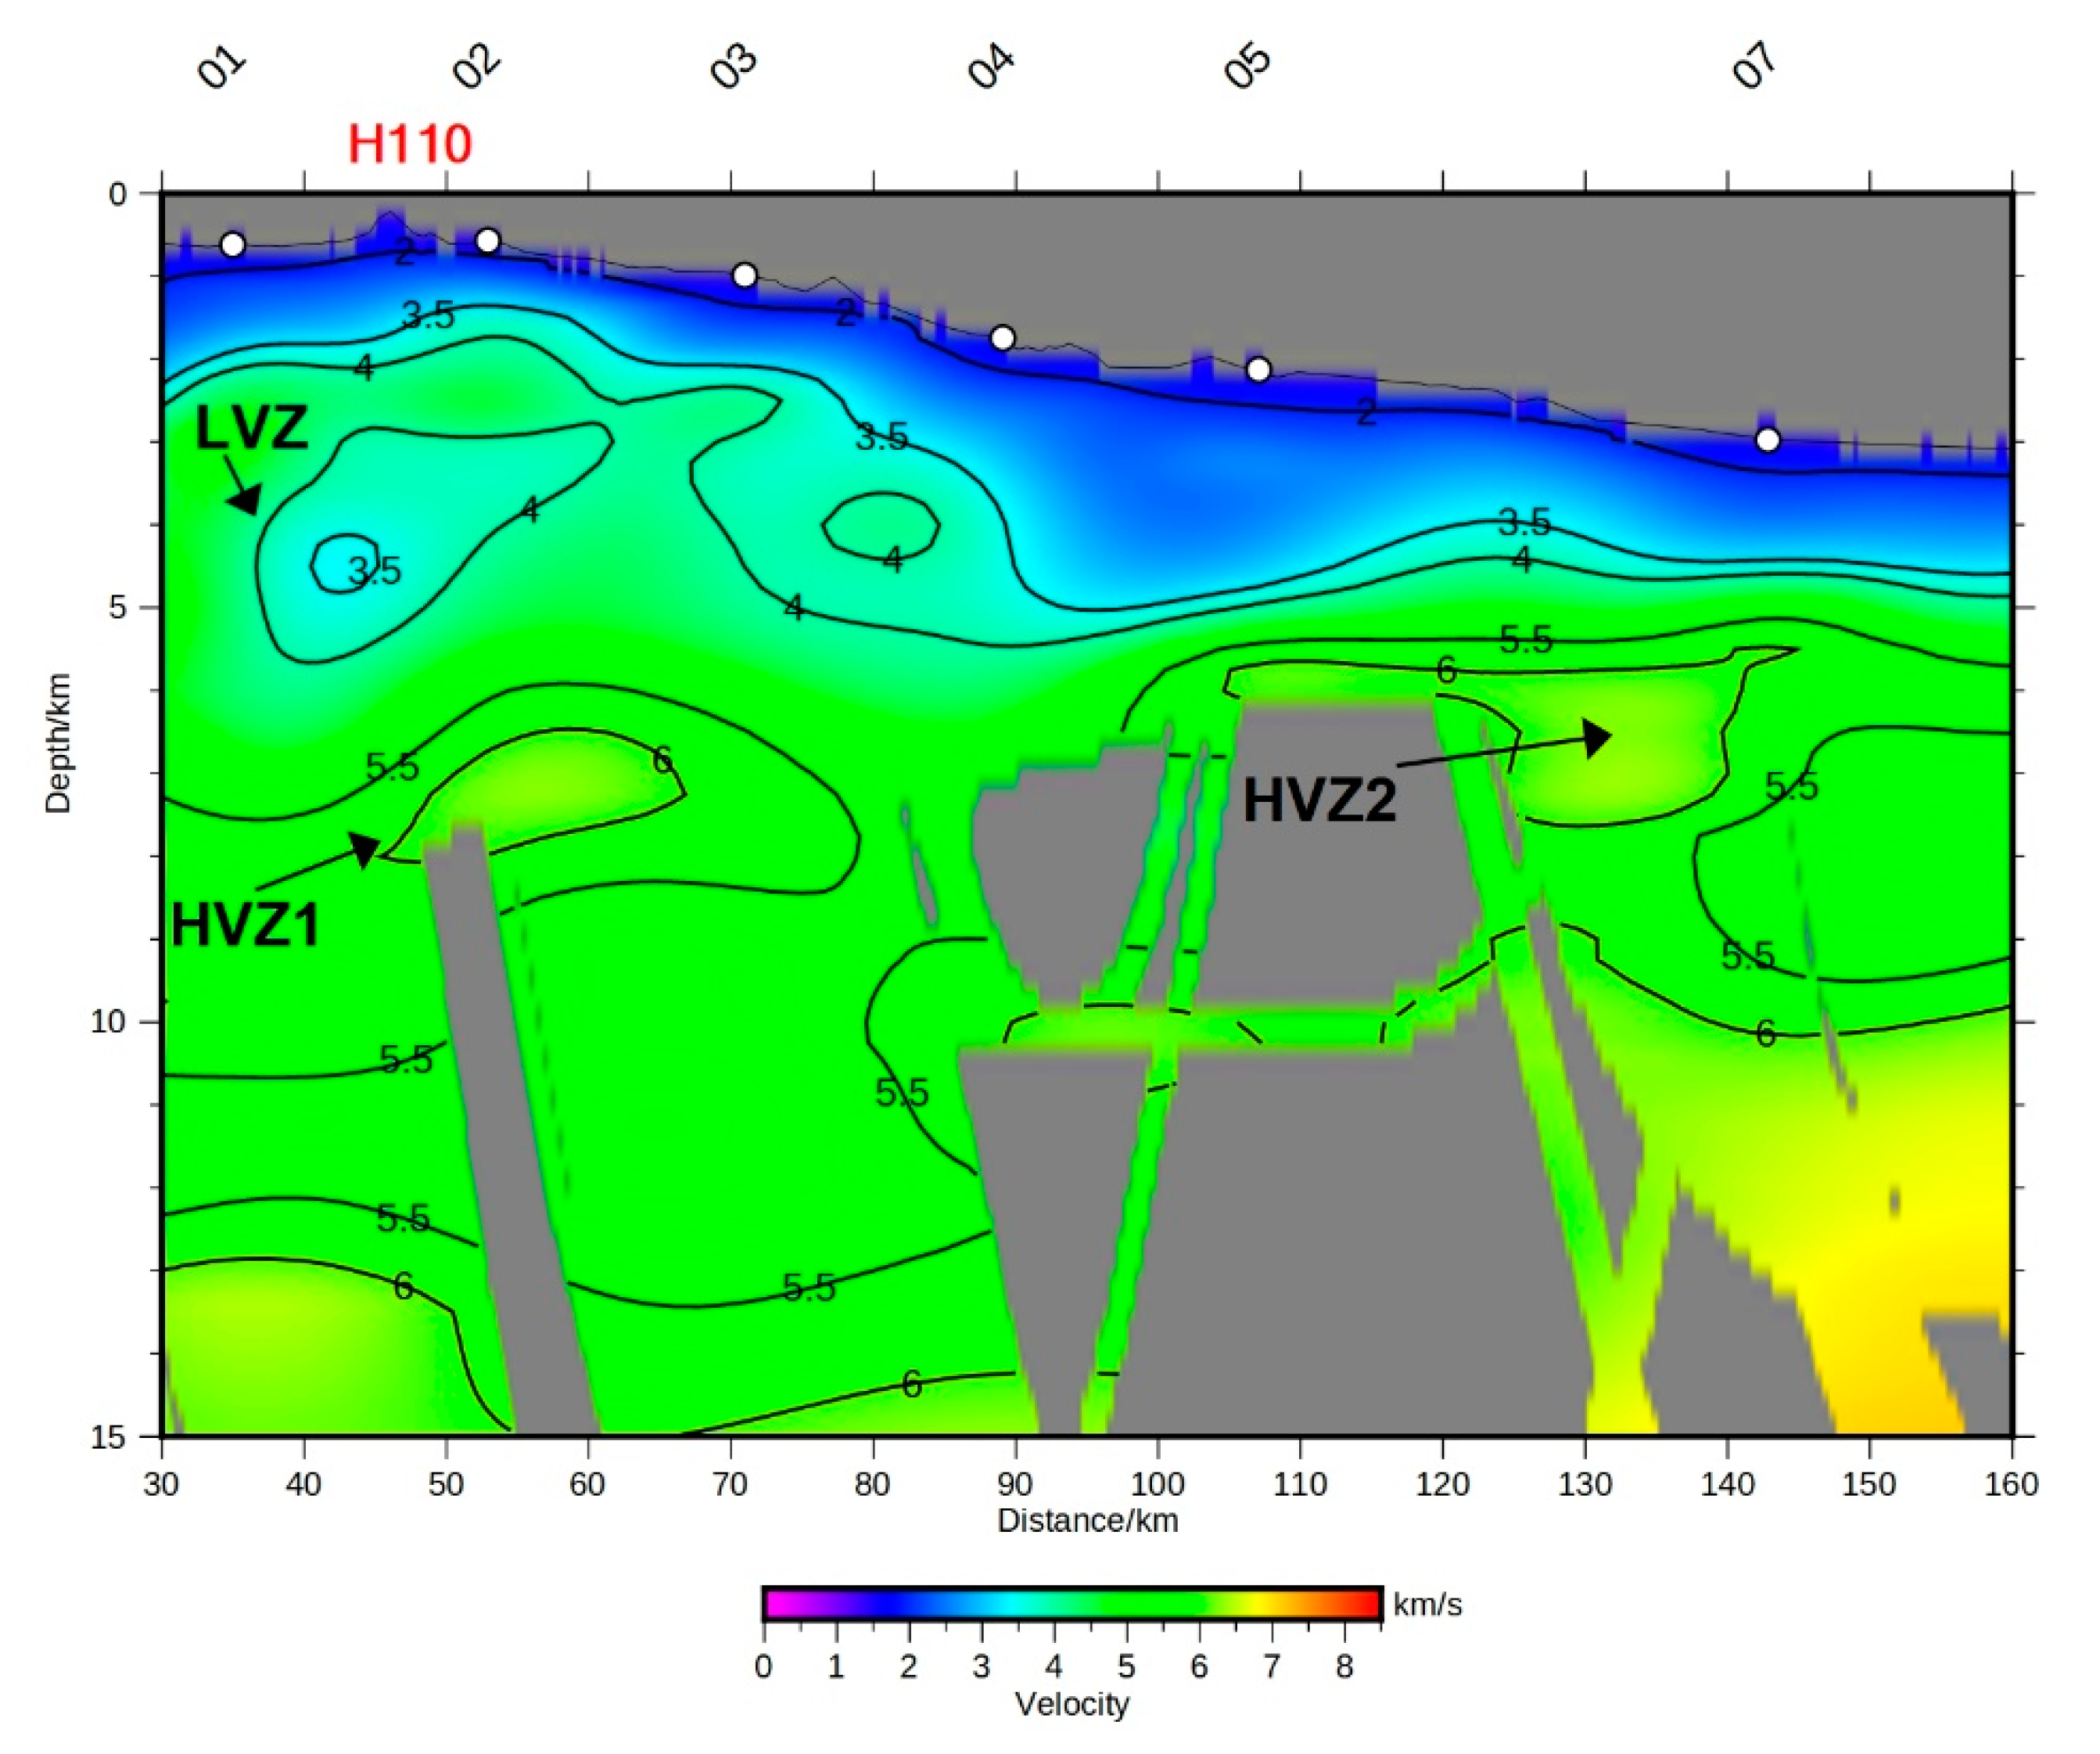
4.3. Analysis of the Hill H110 and the Low-Velocity Zone

The submarine hill H110 features typical eruptive structure. An eruptive hill can be formed by magma volcanism, in most cases, or by mud volcanism, in other cases. Whether the hill is a magmatic volcano or mud volcano is discussed here.
The low-velocity zone below H110 centers at 4.5 km deep, a depth of the Mesozoic layers. It can be caused by geofluid or melt. Suppose the low-velocity (3.3–4 km/s) zone to be a melt-rich magma chamber, its appearance in shallow level (3–6 km, Figure 5) per magma should have given rise to intense magmatism upward with a great energy, most likely eruption as hill H110. If so, it would have cooled rapidly, making it hard to retain low-velocity in the long term. Yet, the cooled magma would have generated a high-velocity zone which, however, has not been resolved in our case nor in other reports [18]. Though not improbably, it is less likely an active magma chamber.
Additionally, the samples [22] dredged from top of H110 contain no igneous rocks from young volcanism. In fact, the samples (Figure 10) are rich of deep-water organisms and authigenic carbonate nodules, which are always generated by biological methane oxidation [23]. In terms of the X-ray diffraction (XRD) composition analysis (Table 2), beside calcite and high-magnesian calcite, the carbonate nodules contain abundant illite, kaolinite, and chlorite, which are usually sourced from buried and warmed deep strata [24]. The coeval mineral assemblage [25] and rich organisms can be deemed proxies of oil and gas leakage.
The low-velocity zone in Figure 5 corresponds spatially to the fractured zone in Figure 9. The velocity value, 3.3–4 km/s, is slightly less than that of the surrounding Mesozoic strata (3.5–5.5 km/s) and can be correlated to high saturation porosity, 10–30% (Figure 11), according to the Mavko, et al. [26] review on reservoir rocks. Thus, it is most likely for rich geofluid to remain in the low-velocity zone below H110. According to the aforementioned interpretation of the MCS profile (Figure 9), the fractured zone lies within thick Mesozoic strata, mainly Cretaceous and Jurassic. As Jurassic interlayers were found with a high content of organic carbon (~1.5%) in Well LF35-1-1, and tend to be thicker southeastward [11]; it is reasonable that the low-velocity zone be rich of hydrocarbon (Figure 5). In terms of these features and the hydrocarbon leakage, hinted by the surface samples, H110 can be judged as a hydrocarbon-related mud volcano, rather than an igneous volcano.

4.4. Analysis of the High-Velocity Zone HVZ1

The west high-velocity (5.5–6.3 km/s) zone HVZ1 appears at 7–9 km deep, following the low-velocity zone below H110 (Figure 5). Its depth corresponds to the base of the Mesozoic strata, as well as the top upper crust. As the CSD is a relict Mesozoic Basin, suffering less crustal extension than those Cenozoic Basins, basement relief seems smooth within it, though usually ambiguous [9,17]. Thus, HVZ1 is less likely a protruding crustal block. Generally, the seismic velocity of igneous and metamorphic rocks is higher (>5.5 km/s) [29]. Ruled out as sedimentary rocks, HVZ1 can be interpreted as a thick batholith, caused by magma intrusion from deep crust (Figure 12), with considerations of enhanced, though limited, young magmatism around the southern CSD. For example, the east one (HVZ2, Figure 5) coincides spatially with the magmatic intrusive body at around SP 4000 of the MCS profile DS1776 (Figure 9). South of the CSD, magmatic underplating has been suggested in the lower crust by some workers [17,18], with discoveries of a high-velocity (>7 km/s) zone. Furthermore, a volcano-patched band, with high gravity anomalies, were found along the continental–ocean transition south of the CSD [13], within which IODP 368/369 penetrated basalts on a couple of sea mounts [30]. Additionally, a few post-spreading sills within the shallow sedimentary sequences were also recognized [31] in a few localities in the southern PRMB, which are close to the CSD. Its intrusion may follow the paleo-depocenter, where weak zone was inherited.
Considering that HVZ1 succeeds the low-velocity zone below H110, they must have a close three-party relationship, in terms of their origins, from which a scenario can be figured out as follows. As the post-spreading magma intruded the thick Mesozoic strata and solidified, the high-velocity zone HVZ1 formed at the base. When the thick host strata absorbed heat lastingly, the organic matter was promoted to transform into rich hydrocarbon. With accumulation of hydrothermal flow and petroleum, the geo-pressure was increased to produce a hydro-fracture in the host strata. As a result, the low-velocity zone was formed via a fractured zone filled with geofluid. As a comparison, the HVZ2 in the southeast is covered with considerably thinner sediments, where no heat-absorbing, low-velocity zone or mud volcanism appeared.

4.5. The Mechanism of Mud Volcano H110

With these arguments, a thermodynamic origin model (Figure 13) can be inferred from mud volcanism at H110, i.e., magma derived from deep crust promoted petroleum production before overpressure was achieved, and gas-bearing fluid were pressed upward along fractures and erupted to, finally, form a mud volcano (Figure 13). Similarly, a small magma intrusion in the depths has also been suggested to have stirred the catastrophic Lusi mud volcanism in Indonesia [2]. H110 represents a thermodynamic driving mud volcanism, different from those mud volcanoes in the Southwest Taiwan Basin, which were caused by plate collision [5]. It may apply to that of mud volcanos in the southwest of DS waters [12], in terms of their same geologic setting.

4.6. Mud Volcanism and Petroleum Exploration in the CSD

A mud volcano is always indicative of hydrocarbon leakage [8], often with methane hydrate forming, when in deep sea. In the southeastern CSD, the Cenozoic layers appear fragmented, often faulted to the seabed, reflecting recent activity. The existence of the large, low-velocity zone below H110 may imply that there is still abundant oil and gas remaining here, hopefully even as reservoirs in some anticlines (Figure 9). In a previous study, numerous mud volcanos were found, likely active, in the southwestern CSD [12,22]. These discoveries should be a favorable clue, in regard to Mesozoic hydrocarbon exploration there. Because the depth of H110 ranges from 300 to 600 m below sea level, it is also possible that gas hydrate accumulates in the deeper part.

5. Conclusions

Both OBS and MCS data, acquired along seismic survey line L2016-2, were processed, with a focus on the submarine hill H110. The velocity tomography using the first arrivals of OBS data images a few large velocity structures under it with fairly high resolvability. Collaborating coincident OBS/MCS results and geochemical analysis of samples dredged from the seabed, three conclusions can be drawn, as follows.
(1)
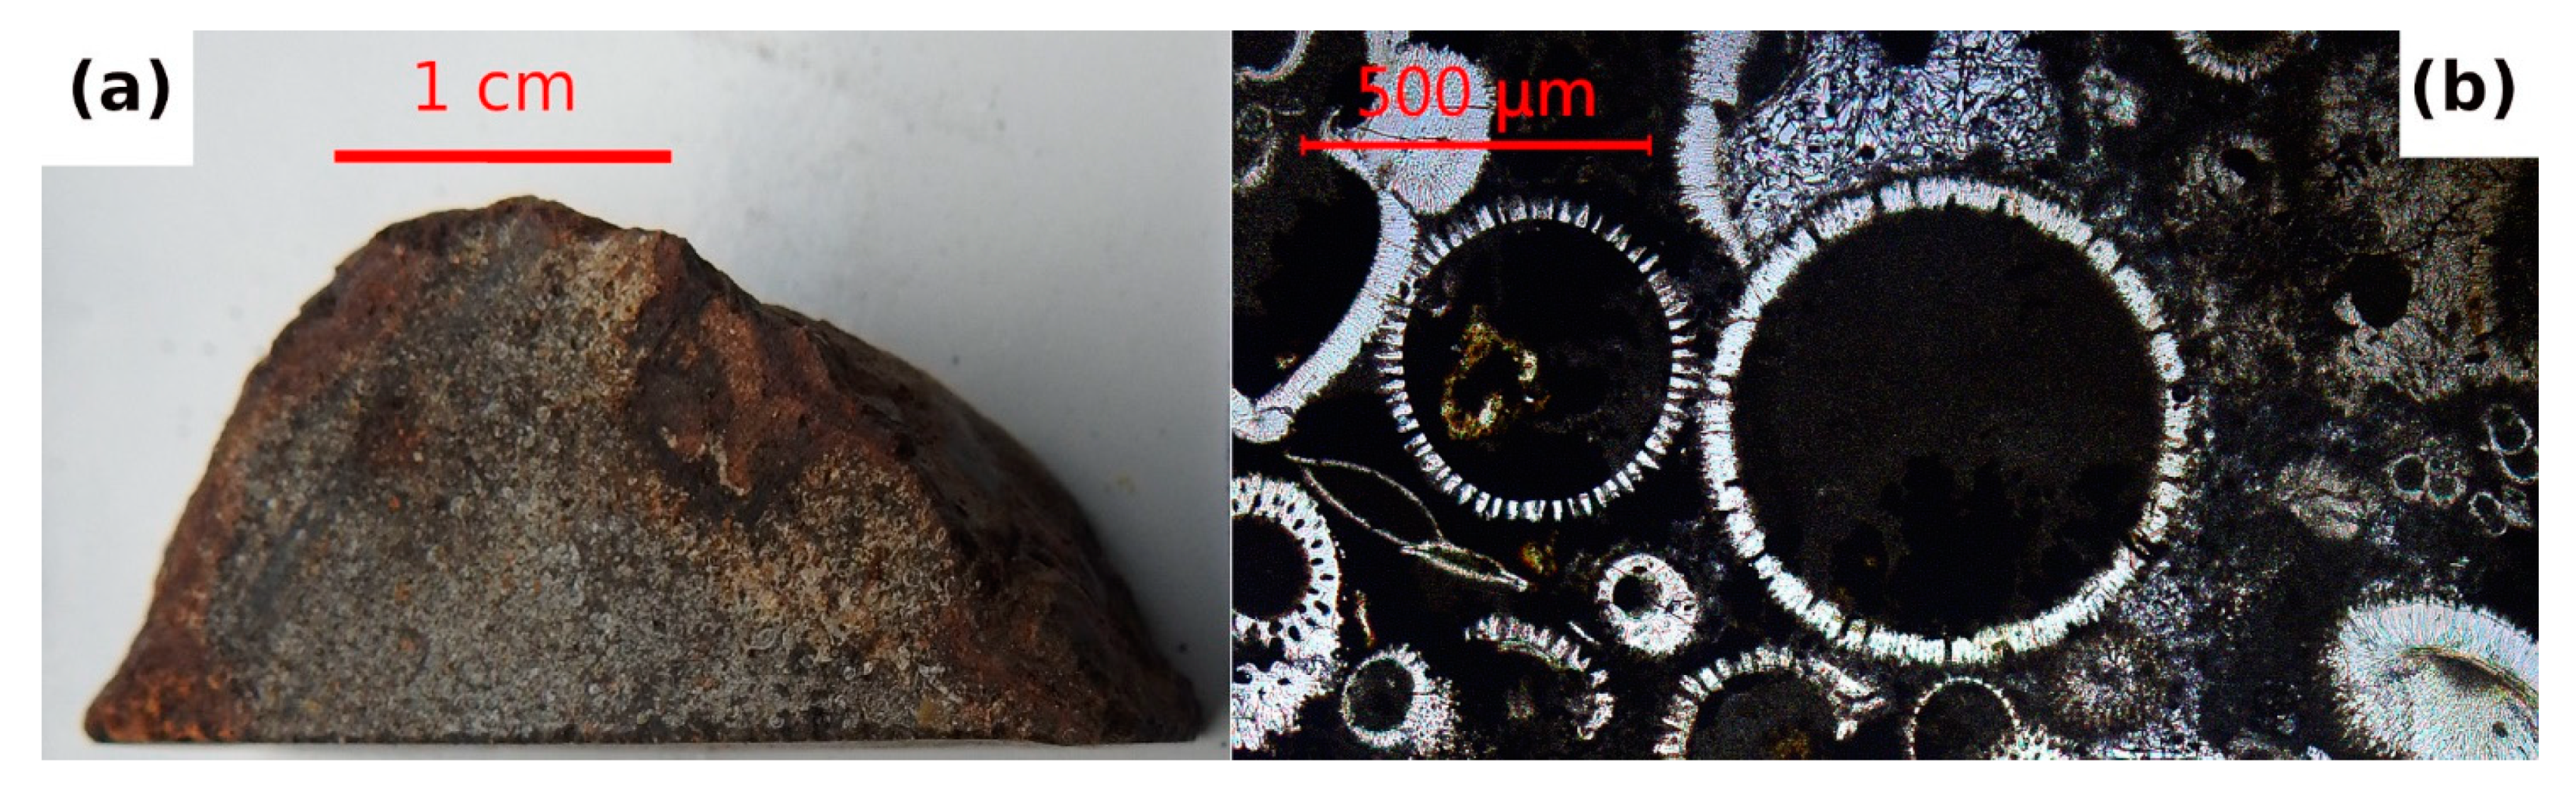
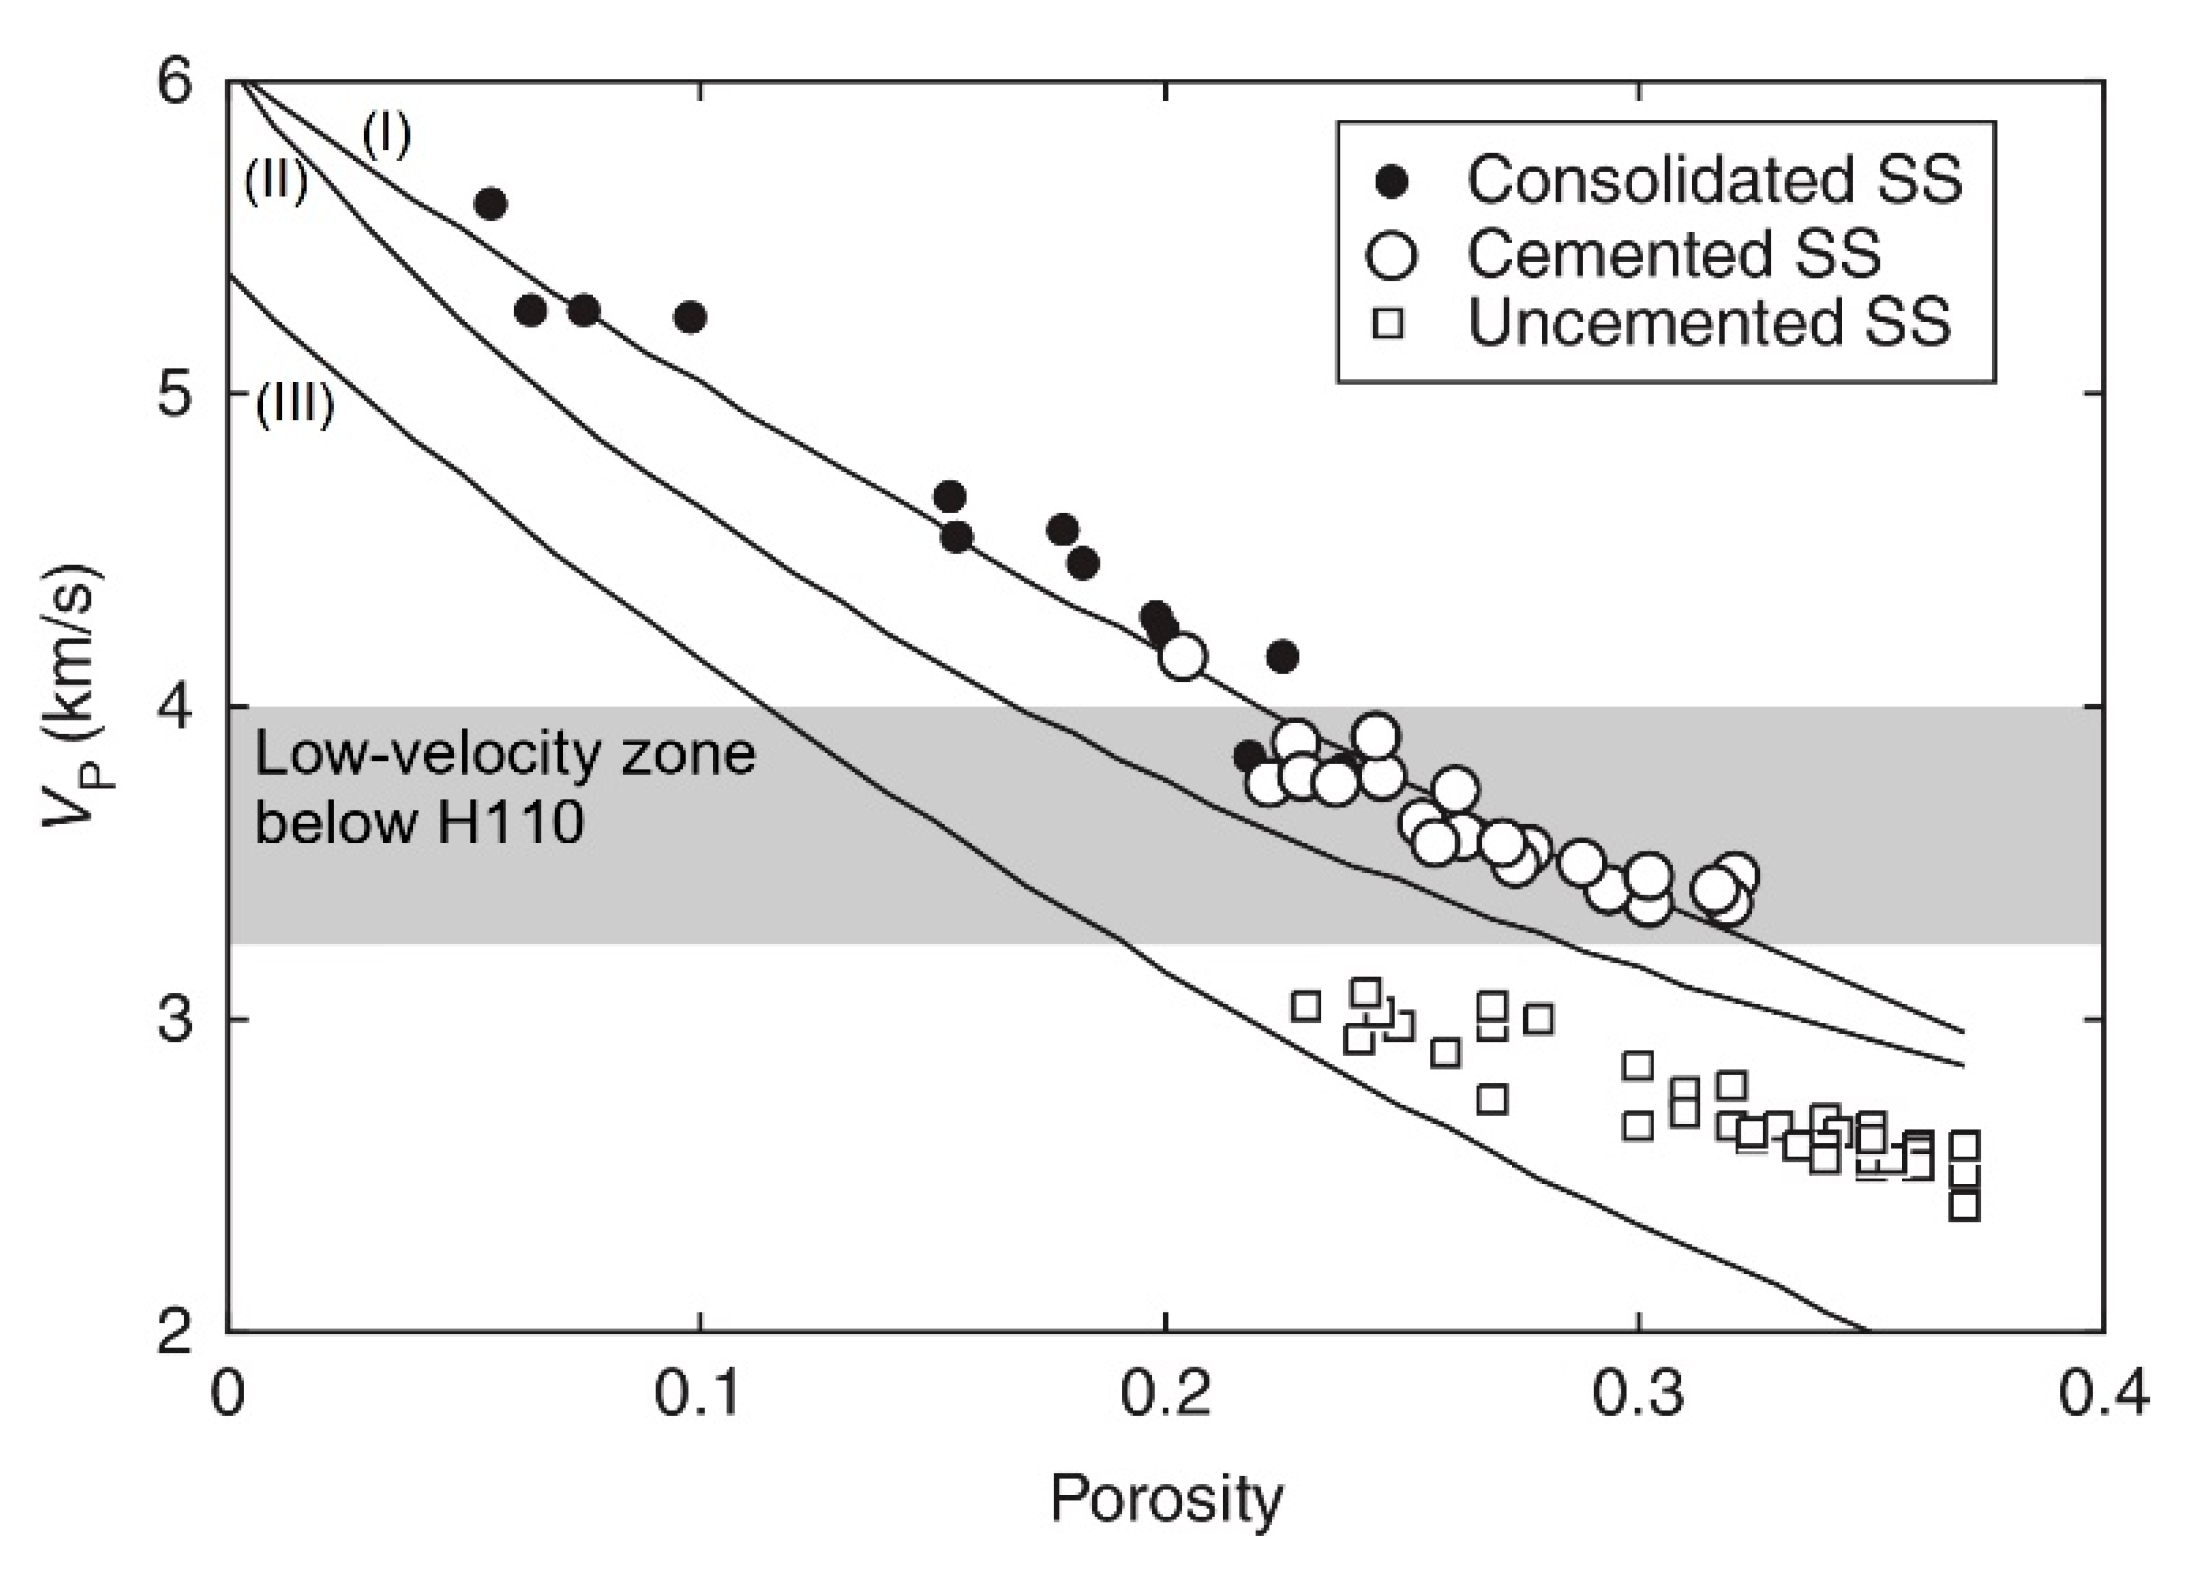
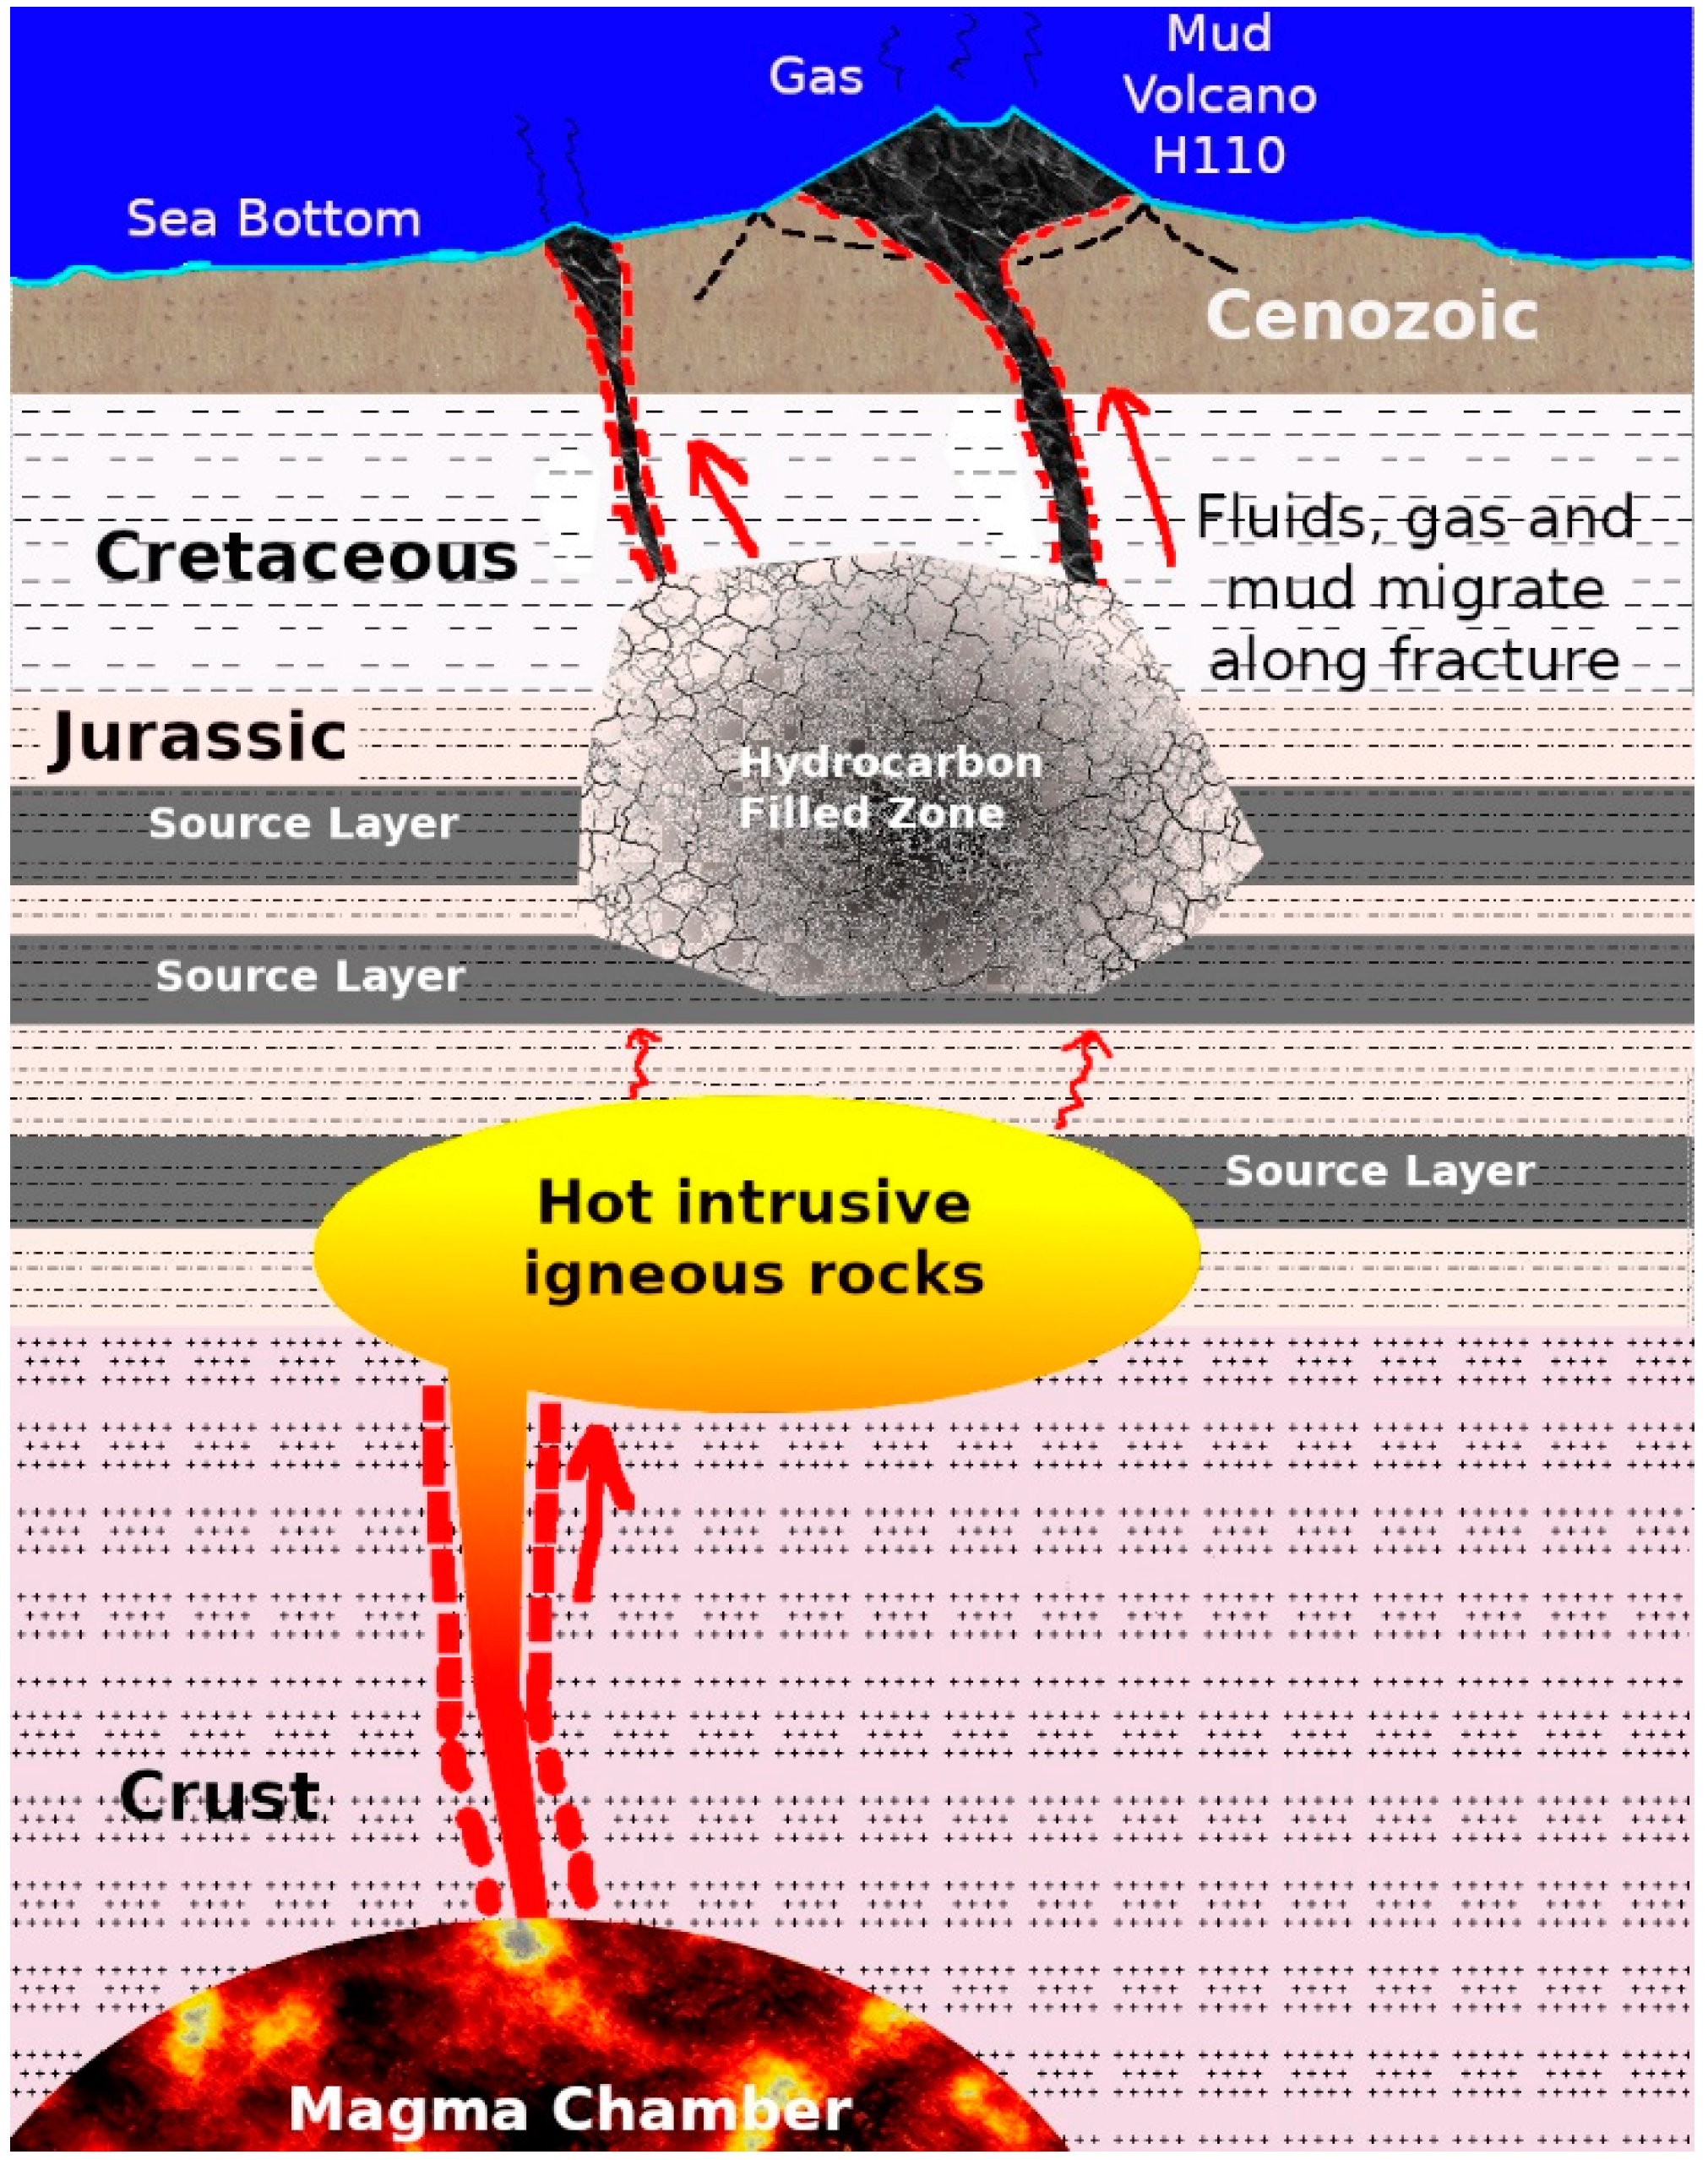
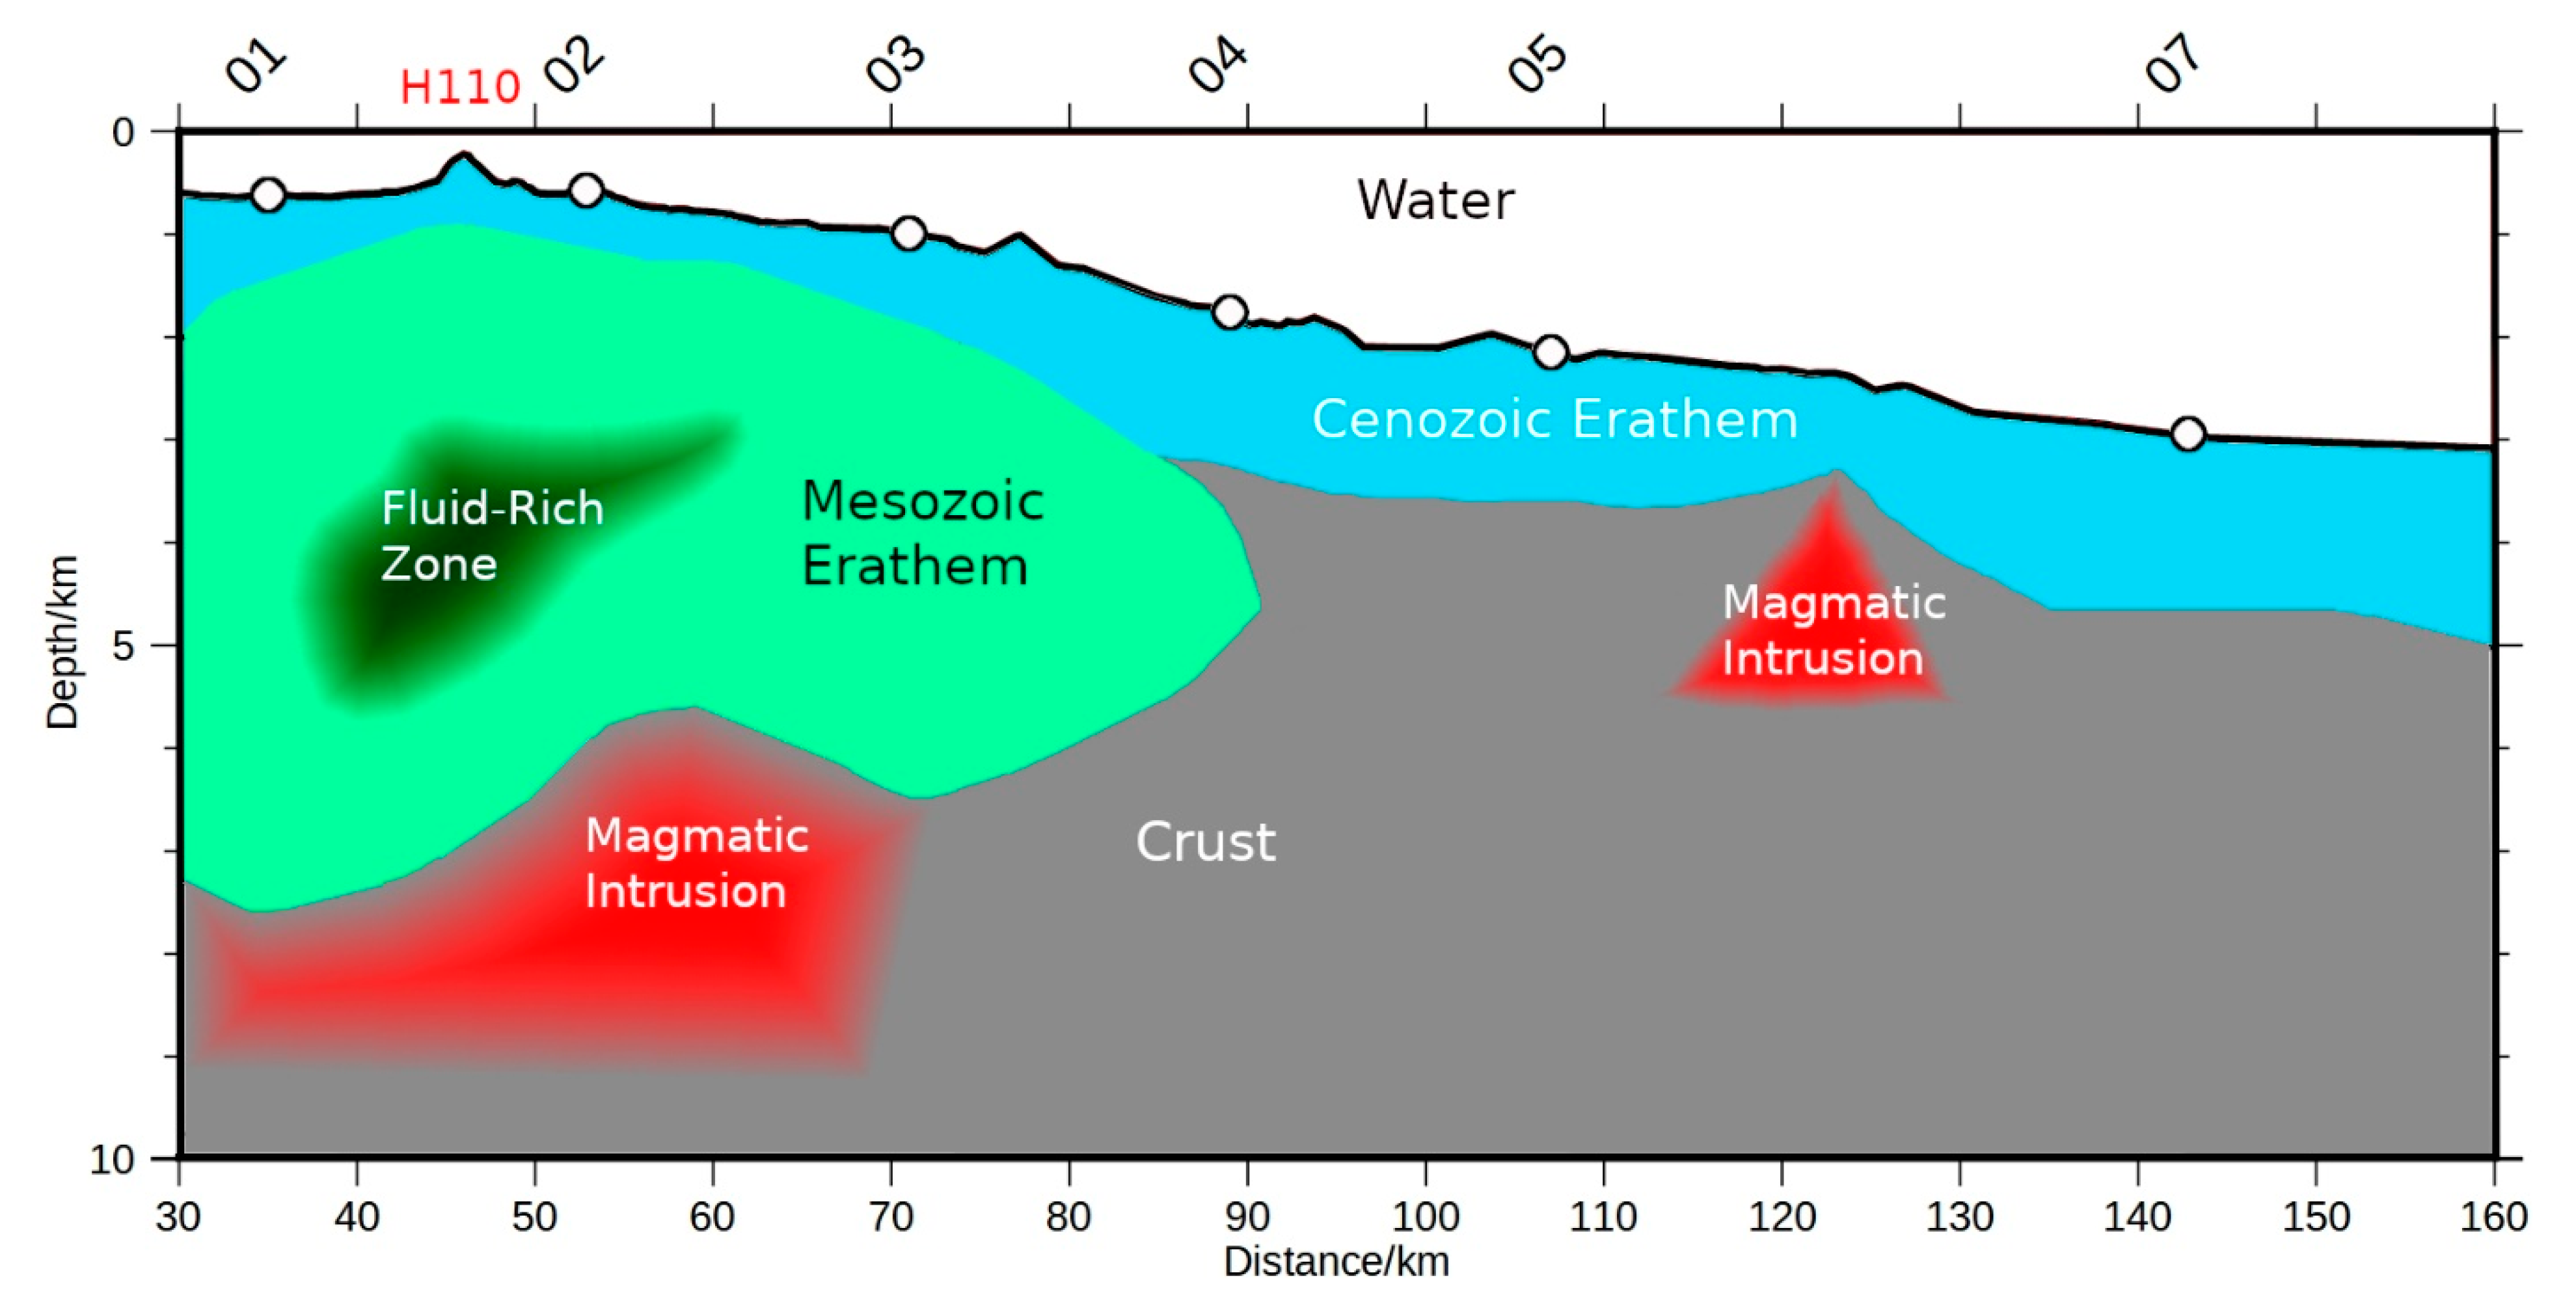
A large, low-velocity (3.3–4 km/s) zone, found below the conic hill H110, corresponds spatially to the fractured zone of Mesozoic strata in the MCS profile, likely a fluid-rich fractured zone. Dredged samples from the H110 surface, containing rich organisms, as well clay minerals, such as illite, kaolinite, and chlorite, are indicative hydrocarbon seepage. Therefore, the conic hill H110, featuring an eruptive structure, can be inferred as a mud volcano.
(2)
A high-velocity (5.5–6.3 km/s) zone, which appears 7 km deep, under the low-velocity zone, is ascribed to magma intrusion. Thus, the mud volcanism at H110 may be thermodynamically driven by magma intrusion into the Mesozoic sedimentary layers, rich in organic matter.
(3)
The mud volcanism and remains of the large low-velocity zone, associated with the Mesozoic basin, implies an abundant hydrocarbon source and potential reservoir, thus a likely favorable clue for Mesozoic petroleum exploration.

Author Contributions

Conceptualization, Y.Y.; data curation, Y.Y., J.Y. and C.C.; methodology, Y.Y. and J.Y.; software, Y.Y., J.Y. and C.C.; resources, J.Y., Y.W. and G.Z.; formal analysis, Y.Y., J.Y. and C.C.; Project administration, Y.W. and J.Y.; Supervision, L.W. and J.L.; Validation, J.Y.; visualization, Y.Y.; writing—original draft, Y.Y.; writing—reviewing & editing, J.L.; funding acquisition, J.L. and Y.W. All authors have read and agreed to the published version of the manuscript.

Funding

This work was financially supported by National Natural Science Foundation of China (41874156, 42074167, U1901217, 91855101); open fund of SINOPEC Key Laboratory of Geophysics (33550006-20-ZC0599-0012); Key Special Project for Introduced Talents Team of Southern Marine Science and Engineering Guangdong Laboratory (Guangzhou) (GML2019ZD0104); Special Support Program for Cultivating High-level Talents in Guangdong Province (2019BT02H594). The data and samples were collected with support from NSFC for sharing cruises (NORC2016-05, 06; NORC2017-05, 06, 07).

Data Availability Statement

The seismic data and samples are proprietary by SCISO and GMGS.

Acknowledgments

We appreciate 3 anonymous reviewers and associated editor for their crucial and constructive comments. Generic Mapping Tools (GMT) software is used to produce some of the figures in this study.

Conflicts of Interest

The authors declare no conflict of interest.

References

  1. Mazzini, A.; Etiope, G. Mud volcanism: An updated review. Earth-Sci. Rev. 2017, 128, 81–112. [Google Scholar] [CrossRef] [Green Version]
  2. Mohammad, J.F.; Anne, O.; Matteo, L.; Karyono, K.; Adriano, M. The Plumbing System Feeding the Lusi Eruption Revealed by Ambient Noise Tomography. J. Geophys. Res. Solid Earth 2017, 122, 8200–8213. [Google Scholar]
  3. Somoza, L.; Díaz-del-Río, V.; Leόn, R.; Ivanov, M.; Fernández-Puga, M.C.; Gardner, J.M.; Hernández-Molina, F.J.; Pinheiro, L.M.; Rodero, J.; Lobato, A.; et al. Seabed morphology and hydrocarbon seepage in the Gulf of Cádiz mud volcano area: Acoustic imagery, multibeam and ultra-high resolution seismic data. Mar. Geol. 2003, 195, 153–176. [Google Scholar] [CrossRef] [Green Version]
  4. Dill, H.G.; Kaufhold, S. The Totumo mud volcano and its near-shore marine sedimentological setting (North Colombia)—From sedimentary volcanism to epithermal mineralization. Sediment. Geol. 2018, 366, 14–31. [Google Scholar] [CrossRef]
  5. Chen, C.S.; Hsu, S.K.; Wang, Y.; Chung, S.H.; Chen, P.C.; Tsai, C.H.; Liu, C.S.; Lin, H.S.; Lee, Y.W. Distribution and characters of the mud diapirs and mud volcanoes off southwest Taiwan. J. Asian Earth Sci. 2014, 92, 201–214. [Google Scholar] [CrossRef]
  6. Vogt, P.R.; Cherkashev, G.; Ginsvurg, G.; Ivanov, G.; Milkov, A.; Crane, K.; Sundvor, A.; Pimenov, N.; Egorov, A. Haakon Mosby Mud Volcano provides unusual example of venting. EOS Trans. AGU 2011, 78, 549–557. [Google Scholar] [CrossRef] [Green Version]
  7. Mazzini, A.; Etiope, G.; Svensen, H. A new hydrothermal scenario for the 2006 Lusi eruption, Indonesia. Insights from gas geochemistry. Earth Planet. Sci. Lett. 2012, 317–318, 305–318. [Google Scholar] [CrossRef]
  8. Milkov, A.V. Worldwide distribution of submarine mud volcanoes and associated gas hydrates. Mar. Geol. 2000, 167, 29–42. [Google Scholar] [CrossRef]
  9. Yan, P.; Wang, L.L.; Wang, Y.L. Late Mesozoic compressional folds in Dongsha Waters, the northern margin of the South China Sea. Tectonophysics 2014, 615–616, 213–223. [Google Scholar] [CrossRef]
  10. Hao, H.; Zhang, X.; You, W.; Wang, R. Characteristics and hydrocarbon potential of Mesozoic strata in eastern Pearl River Mouth Basin, Northern South China Sea. J. Earth Sci. 2009, 20, 117–123. [Google Scholar] [CrossRef]
  11. Zhong, G.J.; Yan, P.; Sun, M.; Yu, J.H.; Feng, C.M.; Zhao, J.; Yi, H.; Zhao, Z.Q. Accumulation model of gas hydrate in the Chaoshan depression of South China Sea, China. IOP Conf. Ser. Earth Environ. Sci. 2020, 569, 1–13. [Google Scholar] [CrossRef]
  12. Yan, P.; Wang, Y.L.; Liu, J.; Zhong, G.Z.; Liu, X.J. Discovery of the southwest Dongsha Island mud volcanoes amid the northern margin of the South China Sea. Mar. Pet. Geol. 2017, 88, 858–870. [Google Scholar] [CrossRef]
  13. Yan, P.; Deng, H.; Zhang, Z.; Jiang, Y. The temporal and spatial distribution of volcanism in the South China Sea region. J. Asian Earth Sci. 2006, 27, 647–659. [Google Scholar] [CrossRef]
  14. Taylor, B.; Hayes, D.E. Origin and History of the South China Sea Basin. In The Tectonic and Geologic Evolution of Southeast Asian Seas and Islands: Part 2; Lamont-Doherty Geological Observatory of Columbia University: New York, NY, USA, 1983. [Google Scholar]
  15. Lei, C.; Ren, J.; Pang, X.; Chao, P.; Han, X. Continental rifting and sediment infill in the distal part of the northern South China Sea in the Western Pacific region: Challenge on the present-day models for the passive margins. Mar. Pet. Geol. 2018, 93, 166–181. [Google Scholar] [CrossRef]
  16. Li, Y.; Abbas, A.; Li, C.-F.; Sun, T.; Zlotnik, S.; Song, T.; Zhang, L.; Yao, Z.; Yao, Y. Numerical modeling of failed rifts in the northern South China Sea margin: Implications for continental rifting and breakup. J. Asian Earth Sci. 2020, 199, 104402. [Google Scholar] [CrossRef]
  17. Wei, X.D.; Ruan, A.G.; Zhao, M.H.; Qiu, X.L.; Li, J.B.; Zhu, J.J.; Wu, Z.; Ding, W. A wide-angle OBS profile across Dongsha Uplift and Chaoshan Depression in the mid-northern South China Sea. Chin. J. Geophys. 2011, 54, 1149–1160. [Google Scholar]
  18. Wan, X.L.; Li, C.F.; Zhao, M.H.; He, E.Y.; Liu, S.Q.; Qiu, X.L.; Lu, Y.; Chen, N. Seismic velocity structure of the magnetic quiet zone and continent-ocean boundary in the northeastern South China Sea. J. Geophys. Res. Solid Earth 2019, 124, 11866–11899. [Google Scholar] [CrossRef]
  19. Christeson, G. OBSTOOL: Software for Processing UTIG OBS Data; University of Texas Institute for Geophysics: Austin, TX, USA, 1995. [Google Scholar]
  20. Zelt, C.A. Lateral velocity resolution from three-dimensional seismic refraction data. Geophys. J. Int. 1998, 135, 1101–1112. [Google Scholar] [CrossRef] [Green Version]
  21. Zelt, C.A.; Barton, P.J. Three-dimensional seismic refraction tomography: A comparison of two methods applied to data from the Faeroe Basin. J. Geophys. Res. 1998, 103, 7187–7210. [Google Scholar] [CrossRef]
  22. Yan, P.; Wang, Y.L.; Yu, J.H.; Luo, W.; Liu, X.J.; Jin, Y.B.; Li, P.C.; Liu, J.; Zhong, G.J.; Yi, H. Surveying mud volcanoes over the Dongsha Waters in the South China Sea. J. Trop. Oceanogr. 2021, 40, 34–43. (In Chinese) [Google Scholar]
  23. Lein, A.Y. Authigenic Carbonate Formation in the Ocean. Lithol. Miner. Resour. 2004, 39, 1–30. [Google Scholar] [CrossRef]
  24. Pevear, D.R. Illite and hydrocarbon exploration. Proc. Natl. Acad. Sci. USA 1999, 96, 3440–3446. [Google Scholar] [CrossRef] [PubMed] [Green Version]
  25. Milkov, A.V.; Vogt, P.R.; Crane, K.; Lein, A.Y.; Sassen, R.; Cherkashev, G.A. Geological, geochemical, and microbial processes at the hydrate-bearing Håkon Mosby mud volcano: A review. Chem. Geol. 2004, 205, 347–366. [Google Scholar] [CrossRef]
  26. Mavko, G.; Mukerji, T.; Dvorkin, J. Empirical relations. In The Rock Physics Handbook: Tools for Seismic Analysis of Porous Media; Cambridge University Press: Cambridge, UK, 2009. [Google Scholar]
  27. Raymer, L.L.; Hunt, E.R.; Gardner, J. An Improved Sonic Transit Time-To-Porosity Transform; Silverchair: Lafayette, LA, USA, 1980. [Google Scholar]
  28. Wyllie, M.; Gregory, A.; Gardner, L. Elastic wave velocities in heterogeneous and porous media. Soc. Explor. Geophys. 1956, 21, 1–209. [Google Scholar] [CrossRef]
  29. Gardner, G.H.F.; Gardner, L.W.; Gregory, A.R. Formation velocity and density-the diagnostic basics for stratigraphic traps. Geophysics 1974, 39, 770–780. [Google Scholar] [CrossRef] [Green Version]
  30. Larsen, H.C.; Mohn, G.; Nirrengarten, M.; Sun, Z.; Stock, J.; Jian, Z.; Klaus, A.; Alvarez-Zarikian, C.A.; Boaga, J.; Bowden, S.A.; et al. Rapid transition from continental breakup to igneous oceanic crust in the South China Sea. Nat. Geosci. 2018, 11, 782–789. [Google Scholar] [CrossRef]
  31. Sun, Q.; Wu, S.; Cartwright, J.; Wang, S.; Lu, Y.; Chen, D.; Dong, D. Neogene igneous intrusions in the northern South China Sea: Evidence from high-resolution three dimensional seismic data. Mar. Pet. Geol. 2014, 54, 83–95. [Google Scholar] [CrossRef]
Figure 1. Locations of the Dongsha Island (DS), tectonic division [9], and seismic lines in the northeastern South China Sea. PRMB = Pearl River Mouth Basin; CSD = Chaoshan Depression; SWTB = Southwest Taiwan Basin; the box is the study area (also shown in Figure 2), and the black circle denotes the OBS station.
Energies 15 00195 g001
Figure 2. Bathymetry map of the DS waters (topographic data in 15″ × 15″ were downloaded from ftp://topex.ucsd.edu/pub/srtm15_plus/topo15.grd (accessed on 1 October 2014)). Hill MV3 and Hill MV8 were previously recognized mud volcanoes [12].
Energies 15 00195 g002
Figure 3. OBS 1–5 records. Dotted colour lines denote picks of the first arrivals.
Energies 15 00195 g003
Figure 4. Velocity by iterative inversion. (a) an initial velocity model; (b) the observed (black dot) and calculated (red line) first arrivals for (a); (c) ray paths for (a); (d) inversed model in the 20th iteration; (e) observed and calculated first arrivals for (d); (f) ray paths for (d). The box around H110 in (d) is shown in Figure 5.
Energies 15 00195 g004
Figure 5. Zoomed velocity profile around the hill H110, showing a large low-velocity (LVZ, 3.3–4 km/s) zone, followed by a high-velocity (HVZ1, 5.5–6.3 km/s) zone at different levels below H110. Another high-velocity one (HVZ2, 5.5–6.3 km/s) appears to its east.
Energies 15 00195 g005
Figure 6. Four checkerboard models for velocity perturbation, using 10 × 2.5, 20 × 5, 40 × 10, and 80 × 20 km cell sizes. The left suites display starting models and the right ones show recovered models.
Energies 15 00195 g006
Figure 7. Model resolvability at four different disturbance cell sizes. When resolvability is greater or equal to 0.7, the velocity model is deemed recoverable. H110 is basically resolvable for perturbation, using cell size 20 km, and completely resolvable to ~9 km deep for coarser cell size 20, 40, and 80 km.
Energies 15 00195 g007
Figure 8. A MCS profile of NHD224 (a) that ran by a drilling well, LF35-1-1, and interpretation (b). Tg is the unconformity separating the Cenozoic (Cz) from the Mesozoic (Mz) Erathem; Th separates the Cretaceous (K1) from the Jurassic system (J); Tm separates the Middle and Higher (J2-J3) from the Lower Jurassic (J1) series; T? is likely Triassic; red lines denote faults. Interpretation is referred to by [9,11].
Energies 15 00195 g008
Figure 9. A composite MCS profile of L2016-2 and DS1776 (a) and interpretation (b). There shows several outcrop hills in the upper slope and buried ones in the lower slope. Because of multiples, the section below 1.8 s in the L2016-2 profile is not shown.
Energies 15 00195 g009
Figure 10. (a) A slice of authigenic carbonate nodule, sampled from the surface of H110 (processed and analyzed in SCISO). Along with calcite, the constituent minerals of the nodule contain illite, kaolinite, and chlorite, reflecting sources from deep substrates; (b) a microscopic thin section view of (a), showing rich biological fossils, which are unidentified.
Energies 15 00195 g010
Figure 11. Projection of the low-velocity range below H110 onto the classical statistics [26] of velocity versus porosity in water-saturated sandstones. Curves I and II are based on equations for unconsolidated [27] and consolidated sandstones [28], while III is for quartz-calcite rocks [29].
Energies 15 00195 g011
Figure 12. The geological interpretation alone Line L2016-2.
Energies 15 00195 g012
Figure 13. A schematic mud volcanism, driven by magma intrusion at the hill H110.
Energies 15 00195 g013
Table 1. Acquisition parameter of MCS.
Line NameL2016-2NHD224-SNHD224-NDS1776
Channels120480480564
Channel spacing (m)12.512.512.512.5
Coverage460120141
Shot spacing (m)200502525
Minimum offset (m)200250250200
Sample interval (ms)2221
Record time length (s)141298
Source3 BOLT airguns32 BOLT airguns32 BOLT airguns40 BOLT airguns
Airguns Volume (in3)4500508050804100
Table 2. Minerals of representative samples (Figure 10a) from H110, analyzed using X-ray diffraction.
MineralRatio
illite14.50%
high-magnesian calcite36.00%
calcite31.80%
kaolinite3.10%
chlorite5.10%
quartz6.40%
iron-bearing dolomite3.00%
Publisher’s Note: MDPI stays neutral with regard to jurisdictional claims in published maps and institutional affiliations.

