Abstract
Energy policy affects the functioning of the economic and financial systems of countries worldwide. This paper provides a theoretical overview of the economy–energy nexus and discusses the particular cases of the energy policy dynamics amid the sustainability goals. This paper integrates multiple perspectives on the energy–economy nexus, with a particular focus on the energy trilemma, 4As of energy security and PESTEL approach. This allows the development of a comprehensive framework for the analysis of energy security and the sustainability interaction. A review of manifestations of the different dimensions of energy security and sustainability is carried out to identify the most topical facets of the issue. Then, the cases of the selected European Union countries (Ireland, Greece, Denmark and Lithuania) are presented to highlight the effects and features of the recent energy policy changes there. Indeed, these countries apply a PSO levy mechanism on electricity tariffs and are diverse in their geopolitical situation, economic development, geographical situation and energy dependency level. The analysis of the situations of such different countries applying the PSO levy mechanism makes it possible to perform a broader and more in-depth assessment and comparison of electricity tariff regulations. Thus, the developed theoretical model is applied to identify the major outcomes of the energy policy regimes (with a focus on tariff regulation) in the selected countries.
1. Introduction
Within each region, the economic and financial systems are affected by the energy system. In this context, energy security is perhaps the most important concept. Issues related to energy security issues began to be deliberated more and more actively on the eve of World War I, when the military leadership of England made the decision to switch naval fuel from coal to oil, thus creating conditions for England to become dependent on oil imports from abroad (Persia) [1]. Throughout the twentieth century and the beginning of the 21st century, energy security was impacted by many factors, such as global and local markets, developing infrastructures, new energy technologies and new ways to use them, financial markets, political agreements and the number of suppliers of primary energy sources. Eventually, the convolution of the aforementioned factors led to energy crises (such as oil crisis in the 1970s) [2]. Thus, energy policy has become an important factor for geopolitical and economic decisions, shaping the future of countries and society. The energy planning has become particularly important [3,4,5].
In this context, the European Union (EU) is no exception. Home to almost 450 million people, the EU is actively and purposefully pursuing its goals of energy security and energy transition. Electricity production and consumption have become integral parts of energy security. The liberalization of the EU electricity market aims at integration and international energy connections [6]. In addition, energy transition to tackle climate change by moving from fossil fuels towards 100% renewable energy by 2050 has been foreseen. These objectives call for a certain level of state intervention and the coordination of support mechanisms. Indeed, the aforementioned policy objectives require costly measures that are not commercially attractive in the short run and often provoke unreasonable public resistance. One of the mechanisms to finance the policy-oriented measures in the energy sector is the provision of the Public Service Obligation, which was defined in the EU Directive 2009/72/EC.
There have been studies focused on the general issues surrounding energy security. Bigerna, Bollino & Galkin [7] examined the impact of oil import portfolio optimization on energy security. Ashaye, Alharahsheh & Pius [8] examined the relationship between energy security and economic development. Lixia [9] examined energy security concepts, systems and indicators. Srivastav [10] examined the relationship between energy security and sustainability; Strielkowski, Veinbender, Tvaronavičienė & Lace [11] examined the economic efficiency and energy security of smart cities. Sutrisno, Nomaler & Alkemade [12] examined the impact of energy market developments on energy security. The case studies focused on Poland [13], Italy [14], India [15], Denmark [16], China [17], Indonesia [18], the EU [19], Latin America [20], Pakistan [21], Russia [22] and Andalusia [23].
The PSO has also been addressed in the earlier literature. Farrell & Lyons [24] examined the impact of the Irish PSO levy on electricity consumption. Skok, Mileta & Baricevic [25] examined the possibilities of forecasting the electricity load of the Croatian PSO electricity supplier in the short term. Karova [26] examined PSO in the context of electricity. Rusche [27] analyzed electricity generation from the RES as a PSO (however, this study took a legal rather than an economic point of view). Therefore, there is still a lack of more detailed and context-specific analyses of the impact of the PSO levy on electricity tariffs and energy security.
This article analyzes PSO solely in the context of the electricity market. The security of the supply and protection of the environment are taken into account throughout the analysis. The presence of the PSO implies that the final private and commercial electricity consumers pay an additional amount to their electricity bills (so-called PSO levy), which is then distributed to PSO-supplying companies (usually in the form of a subsidy). Since the treatment of PSO is different in every country and is often adjusted to the local needs, this requires a country-by-country analysis. This article examines the PSO mechanisms of four EU countries, as well as their impact on their energy security. These countries (Ireland, Greece, Denmark, Lithuania) have been selected to take into account different geographical locations, different energy systems and their challenges, different economic situations, different geopolitical situations of the regions and, finally, different PSO mechanisms.
The aim of this work is to assess the impact of the PSO levy on the electricity tariffs applied by the four EU countries (Ireland, Greece, Denmark and Lithuania) on their energy security. To ensure a better understanding of the context, the scientific concepts of public service obligation and energy security are first briefly discussed. Then, the literature examining the PSO mechanisms and energy security aspects in the four countries is analyzed (131 sources). The results of the case studies are compared with the Energy Trilemma Index to further examine the relationship between the PSO levy and the energy security level of the countries.
This paper is structured as follows. First, in Section 2, public service obligation and energy security definitions are examined. Section 3 describes the research approach taken in this work. Section 4 presents the results of the literature review. Section 5 is dedicated to the analysis of individual cases (countries). Finally, Section 6 presents the conclusions.
2. Preliminaries
2.1. PSO Definition
Different countries, including the EU Member States, often use various means of intervening in electricity price tariffs to subsidize a certain energy niche in the country. In most cases, electricity generation from RES is considered. The following terms referring to such interventions are found in the scientific literature:
- RES charge [28,29], RES levy [30];
- RES surcharge [30,31];
- RES payment [32,33];
- Payment for green electricity [34];
- EEG surcharge [35];
- PSO levy [36,37];
- PSO charge [38];
- PSO surcharge [39];
- PSO tariff [40];
- PSO element [41].
Although Harker, Kreutzmann and Waddams [42] note that PSO is most commonly applied in telecommunications, transport (rail, aviation), postal and energy services, this article examines PSO specifically in the context of electricity. Although the precise interpretation of PSO, based on the principle of subsidiarity at the EU level, is left to the discretion of each individual country [43], several PSO definitions prevailing in the electricity context can be singled out (Appendix A).
In general, the PSO ensures security of supply and protection of the environment [43]. In addition, the policies related to PSO have changed in recent decades. Initially, it used to be the exclusive prerogative of the country, whereas, currently, it is often provided by private or semi-private companies [26]. The common feature is that this levy is mandatory and compulsory in every country.
In principle, another mandatory and compulsory levy created by the state negatively affects the spirit of entrepreneurship and the freedom of entrepreneurs’ decision making. Kirzner [44] and Foss and Klein [45] examine this in their works, which state that state-regulated price mechanisms, regulations, antitrust and production volumes inhibit business discovery opportunities and the entrepreneurial spirit in general. As entrepreneurs are the driving force of any country’s economy, a negative investment climate or a poor entrepreneurial microclimate is something to be avoided in any case. However, the positive impact of the PSO levy on the country’s energy security and sustainability may in some ways offset the negative impact on the country’s entrepreneurs and their decision-making freedom.
This article examines, in particular, the PSO-based support schemes and their impact on energy security in the context of the electricity market. The PSO levy on electricity prices has been applied in the following countries: Portugal [46], Turkey [47], Belgium [48], Bulgaria [40], Luxembourg [49], Denmark [50], Lithuania [51], Greece [52] and Ireland [53]. This article examines four countries (Denmark, Lithuania, Greece, Ireland) and the impact of the PSO levy on their energy security. According to Finger and Finon [54], the regulator can choose from three different PSO funding methods: “public funding, funding by customers via an uplift” and “funding by competitors in relation to their market share or their turnover”. This article analyzes the cases where PSO is funded by all final electricity consumers by them paying the PSO levy together with their electricity bills. This is well-defined in the Irish Electricity Regulation Act [55]: “It shall be the duty of each final customer, which duty is owed to the electricity supplier which invoices such customer, to pay to that supplier the amount of the PSO Levy properly invoiced to such customer in accordance with this Order”.
Harker, Kreutzmann and Waddams [42] examined PSO mechanisms in the EU and compared the cases of Belgium, France, Germany and the UK. They concluded that the PSO is an important political tool in setting boundaries between EU and Member State law in the context of energetics, allowing for maintenance of the balance between healthy competition and active social policies. However, the final users of services often suffer from the increased prices (as in the cases covered in this article). Moreover, clear and transparent PSO compensation mechanisms are needed. Rusche [27] examined the possibilities of subsidizing the production of electricity from RES by collecting a PSO levy. The latter study concluded that this is not in conflict with the legislation, and payments to producers of electricity from RES are also allowed. Furthermore, it was noted that such payments are based on feed-in tariffs. Such regulatory mechanisms operate in many EU countries.
Karova [26] noted that regulatory intervention is sometimes necessary due to market failures and “to the need of satisfying a number of socially desirable objectives”. The inclusion of PSO in the EU Energy Liberalization Directives is an example of such an intervention when seeking to find a compromise among a well-functioning internal EU energy market, compliance with competition rules and the provision of an effective public service. Karova [26] also noted that the financial burden of providing PSO by the suppliers of these services requires some kind of financial mechanism to compensate/subsidize them. These can be direct or indirect state subsidies or a special fund. Moreover, compensation (if it is not proportional to the PSO) can act as state aid. Such an aid scheme often distorts competition in the market by conferring certain advantages on the legal entity providing the public service over other market participants. This situation often requires deeper and legal clarification and is often the subject of disputes between legal market participants. Member States must therefore obtain clarification from the European Commission that their PSO levy model complies with the legal framework.
In each country, the PSO scheme is regulated by the energy law, electricity laws, PSO administration law, PSO pricing methodology law and RES law [42]. At the EU level, the PSO is defined by Directive 2009/72/EC [56]. When analyzing the PSO levy mechanism, it is necessary to take into account the 2003 Altmark Trans Case decision, which was ruled by the Court of Justice of the European Communities, the main points of which read as follows [42,57,58]:
- the undertaking (in receipt of compensation) must actually have public service obligations, which are defined;
- the parameters for the calculation of compensation must be established in advance in an objective and transparent manner, to avoid conferring an economic advantage on it over its competitors;
- compensation cannot exceed what is necessary to cover all or part of the costs of the obligation;
- where a public procurement process is not used to appoint the undertaking, the level of compensation must be determined on the basis of the costs that an efficient undertaking would incur.
2.2. Energy Security Definition
Over time, the concept of energy security has shifted from a narrow definition, covering only the country’s self-sufficiency with energy resources, to a much broader concept that encompasses such dimensions as diversity, cost, technology, environment, efficiency and reliability [59]. Appendix B provides some definitions of energy security. In essence, they refer to a stable and reliable supply of energy at affordable prices.
Many definitions and descriptions of energy security are found in the literature. For example, Winzer [60] examined 36 definitions of energy security and concluded that the term should be separated from other policy goals (e.g., related to economic efficiency and sustainability) by defining it as “the continuity of energy supplies relative to demand”. Such an approach implies narrowing the definition to the security of supply [61]
The definition and components of energy security can be seen in Figure 1. Energy security is a constituent part of national security, environmental security and economic security, or “is where environmental, economic and national securities converge” [62]. The national security level represents a country’s ability to be independent from other countries in many areas [63,64]. Environmental security represents a country’s ability to control and reduce the impact of human activities on the environment [65,66,67]. Finally, economic security is a country’s ability to control its economic vulnerability [68]. Figure 1 shows that energy security can be examined in four important aspects, which are termed the 4As [69]: affordability (low price, decentralization, public subsidies), availability (security of supply, penetration of RES, diversification), acceptability (sustainability of energy systems and acceptable environmental impact) and accessibility (economic cost, connection to utility grid). The literature also mentions stability [70], which includes national policies and environmental impacts, and reliability [71], which includes physical security, cyber security and intermittency.
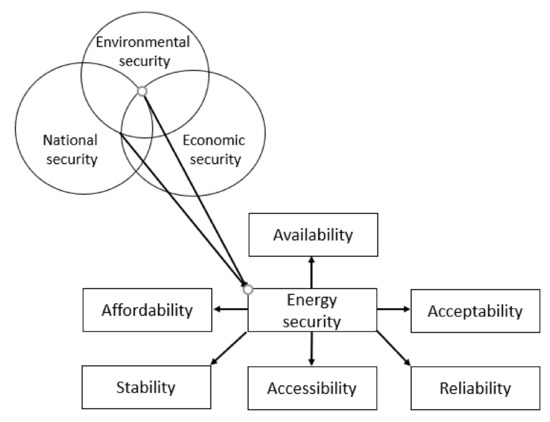
Figure 1.
The nexus of energy security and other dimensions (designed by the authors, based on [62,69,70,71,72,73]).
When examining the impact of PSO on energy security, it is necessary to choose specific methods to assess the level of energy security in a certain country. In the literature, such indicators of energy security as the overall energy import dependency (provided by Eurostat) and country-specific supplier concentration index (provided by Eurostat) are used [74]. Azzuni and Breyer [59] analyzed the definitions of energy security and distinguished 15 dimensions (availability, diversity, cost, technology and efficiency, location, timeframe, resilience, environment, health, culture, literacy, employment, policy, military and cyber security). These dimensions were used to measure the energy security index.
However, in this article, the impact of the PSO levy on energy security will be assessed on the basis of the Energy Trilemma Index that is calculated by the World Energy Council. The Energy Trilemma Index was developed by the World Energy Council to assess countries along three key dimensions (economic, social, environmental) [75]. This annual index evaluates 128 countries (as of 2021) according to their capacity to deliver an accessible, affordable, secure and environmentally sustainable energy supply. In addition, countries are compared by a composite score, which shows how well they can ensure a trade-off among economic, social and environmental dimensions [74]. Countries are compared to each other; so, for example, if a certain country has not seen any changes in the energy system, but other countries have significantly improved/worsened their performance, this will affect the results for all countries.
The Energy Trilemma Index is measured by three main aspects [76]:
- Energy security (import dependence, diversity of electricity generation, energy storage) measures a country’s capacity to meet current and future energy needs and also to withstand and recover quickly from a system shock with the least possible disruption to supply.
- Energy equity (access to electricity, electricity prices, gasoline and diesel prices) assesses a country’s ability to provide universal access to reliable and affordable energy for household and commercial use.
- Environmental sustainability (final energy intensity, low-carbon electricity generation, CO2 emissions per capita) reveals the country’s transition to an environmentally friendly energy system with the minimal contribution to climate change.
The index is based on global and national data and is intended for policymakers, the investment and financial sector and academia.
3. Methodological Approach
This work analyzes the literature in an effort to elucidate the impact of the public service obligation levy (in electricity tariffs) on the energy security of selected countries. It includes a general analysis of manifestations of the concepts of public service obligation and energy security in the literature. Then, the paper proceeds with the cases of selected countries where the PSO levy mechanism is applied. The legal basis, its evolution, the distribution of the PSO levy, its impact on energy security and factors influencing the PSO levy are discussed for each country in the context of the Energy Trilemma Index.
There are a number of methods for analyzing the scientific literature. For example, one can mention an integrative literature review [77], meta-analysis of the literature [78,79], narrative literature review [80], systematic literature review [81], scoping review [82] and critical review [83]. The theoretical model for the literature analysis used in this work is outlined in Figure 2 and follows the guidelines of Zacho and Mosgaard [84]. The particular procedure used for this paper is depicted in Figure 3.
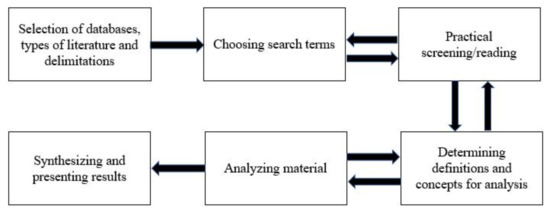
Figure 2.
Process of a literature review (designed by the authors, based on [84]).
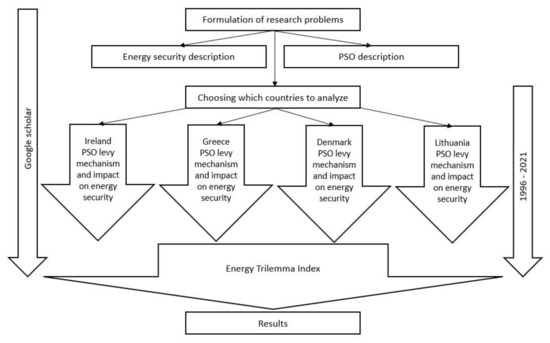
Figure 3.
The flow of literature analysis followed in this work (designed by the authors).
After formulating the problem and the task, the definitions of public service obligation and energy security used in the academic literature are examined. The EU countries that apply the PSO levy are then selected. Finally, the literature sources are analyzed. The literature review includes not only scientific papers, but also reports and policy documents related to the PSO levy. The literature review focuses on sources published from 1996 to 2021.
The Google Scholar database was used as the source of the relevant references due to its operationality, i.e., simple interface, comprehensive data sources and possibilities for customized queries. The conventional Google search engine was also used to search for reports and policy documents. The following keywords were used in the database: (Ireland OR Greece OR Denmark OR Lithuania OR Irish OR Greek OR Danish OR Lithuanian) AND (Public service obligation OR, PSO) AND (levy OR charge OR surcharge OR payment) AND (energy security OR security of supply OR renewable energy sources OR RES OR indigenous energy sources OR energy independence OR diversification of the energy sources OR diversification of the energy suppliers). Abbreviations and keyword roots were also used in the search (as recommended by [85]), thus broadening the research sample.
4. Results of the Literature Review
During the literature review, the goal was to find the most up-to-date information. The distribution of the sources across years is shown in Figure 4. The newest sources from 2019–2021 account for 39% of all sources considered (51 sources out of 131). The sources from 2009–2021 make up the absolute majority (126 sources from 131, or 96%) of the sample. This leads to the conclusion that this article is based on the latest and most relevant sources, as a result of which the article presents the real situations and mechanisms of the PSO levy and their impact in the long and short term.
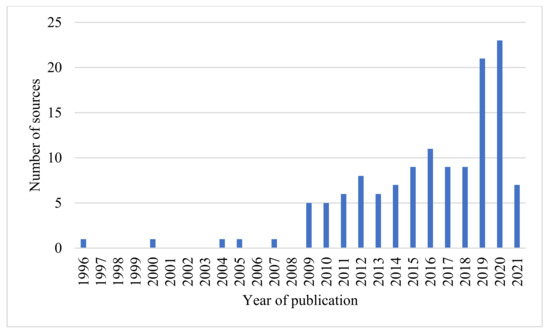
Figure 4.
Classification of sources by year of publication (created by the authors).
Most of the identified sources were scientific papers (92 out of 131 sources, or 70%). Since the topic of this work is rather specific, other types of literature were also considered. A total of 20 reports and 19 policy documents were also analyzed. The classification and categorization of a source were based on the name of the source itself or its description.
4.1. Literature on the Cases of the Selected Countries
First, EU countries that had applied or have been applying a PSO levy in electricity pricing were selected. The prices and costs of EU energy analysis by ECOFYS [40] was used as a source of information as it indicates which countries add a PSO levy to their electricity tariffs. Four countries were selected, namely Ireland, Greece, Denmark and Lithuania. The main reasons for choosing these countries are as follows: (1) they all apply a PSO levy mechanism; 2) they exhibit different geographical locations; (3) they rely on different energy systems; (4) they exhibit different levels of economic development; (5) they operate in different geopolitical situations.
Ireland occupies 5/6 of the Island of Ireland, which is located to the west of mainland Europe. It has a border only with Northern Ireland, which is a part of Great Britain. Ireland has been a member of the EU since 1973. The Irish GDP stood at EUR 365.05 billion in 2018, with the largest sector being industry, accounting for 36.5% of the GDP [86]. See Section 5.1 for more details.
Greece is a country in Southern Europe, located near the Mediterranean Sea and occupying the southern part of the Balkan Peninsula. Greece spreads over more than 100 islands (19% of the country’s total territory). It has continental borders with Albania, Northern Macedonia, Bulgaria and Turkey. Greece has been a member of the EU since 1981. Its GDP stood at EUR 187.46 billion in 2018, with wholesale and retail trade, transport, accommodation and food services contributing 25.1% [86]. More details are provided in Section 5.2.
Denmark is located in Northern Europe, the Jutland Peninsula and the surrounding islands. It has a continental border only with Germany. Denmark has been a member of the EU since 1973. Its GDP amounted to EUR 310 billion in 2018, with the highest share (21.6%) attributed to the public sector [86]. More details are provided in Section 5.2.
Lithuania is located in the central part of Europe and has continental borders with Latvia, Belarus, Poland and Russia. It is located near the Baltic Sea. It has been an EU member since 2004. The Lithuanian GDP stood at EUR 48.43 billion in 2018, with the largest contribution (33%) from wholesale and retail trade, transport, accommodation and food services [86]. More details are provided in Section 5.4.
The distribution of the analyzed sources across countries is shown in Figure 5. Around thirty sources related to each state allowed for a fairly detailed analysis. Greece showed the lowest number of relevant sources (27), indicating a lack of PSO-related research for this country. A total of 131 sources were examined and there was only one source [40] that discussed all of the four aforementioned countries.
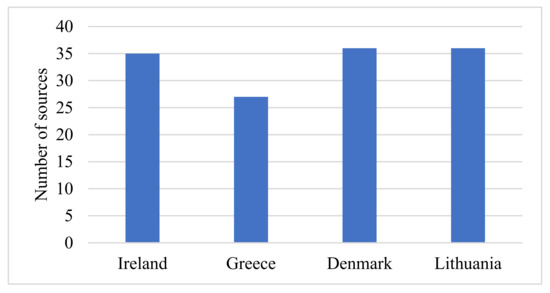
Figure 5.
Sources by countries examined (designed by the authors).
4.2. Literature on PSO and Energy Security
As the literature was analyzed in order to find intersections between PSO and energy security for either of the selected countries, 131 sources dealing with PSO and at least one aspect of energy security were found. The distribution of sources across PSO and energy security topics is shown in Figure 6.
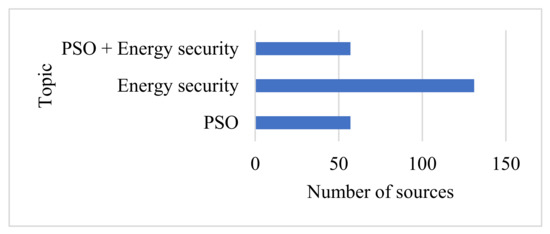
Figure 6.
Classification of the selected sources across the topics (designed by the authors).
Figure 6 suggests that at least one dimension of energy security was mentioned in all 131 sources. Meanwhile, 57 sources (out of 131) addressed PSO aspects. This means that the PSO levy is not a particularly popular area of analysis. Therefore, we sought to shed more light on the indirect links between the PSO levy and energy security. Specifically, after asserting how the PSO levy is distributed, we looked at its impacts on each country’s energy security.
It is possible distinguish the different dimensions of energy security manifested in the references under analysis (Figure 7). The main aspects of energy security discussed in the sources, as shown in Figure 7, include security of supply and renewable energy sources. Then, indigenous energy sources, diversification of suppliers, diversification of energy sources, system reliability, energy price, system integration, modern energy system, energy independence and self -sufficient energy production are noted at similar frequencies.
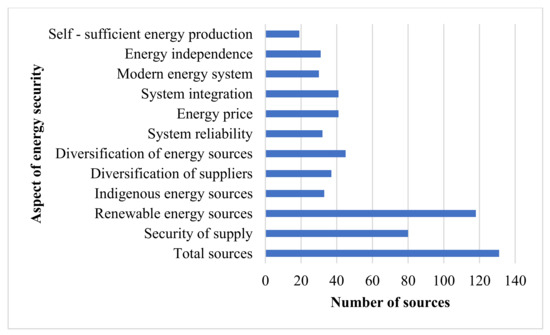
Figure 7.
Classification of sources by energy security topic examined (created by the author).
RES-related issues were addressed in most sources (118 out of 131 sources, or 90%). This is quite reasonable, as the support of the PSO levy fund is often allocated to the development of RES. Next comes security of supply (80 out of 131, 61%), which can be explained by fact that security of supply is one of the most important aspects of energy security and is also one of the areas most supported by the PSO levy fund. All other sources were assessed a fairly similar number of times, i.e., from 30 to 45 out of 131.
5. Case Studies
The previous section provided general information on the PSO and energy security research for the selected countries (Denmark, Greece, Ireland and Lithuania) based on the literature review. This chapter examines the case of each country individually, focusing on the specifics of PSO levy collection and distribution, the impact of these processes on countries’ energy security and sustainability and countries’ performance in terms of the Energy Trilemma Index. Moreover, at the beginning, there is a short section outlining the EU’s energy goals and initiatives, which provides an overview of the overall direction of the EU’s energy transition.
Table 1 shows the mechanisms for the application of the PSO levy in the four selected countries, i.e., to whom it is distributed. Three out of the four countries support (subsidize) electricity generation from RES through the PSO levy. Two countries subsidize security of supply under this scheme. Two countries (Greece and Lithuania) subsidize the implementation of strategic infrastructure projects (Lithuania focuses on electricity connections with other countries, whereas Greece supports the connection of islands to the mainland electricity system). There are also certain aspects that are relevant to a single country: Lithuania supports a nuclear decommissioning fund and electricity generation from thermal power plants, Denmark focuses on research and development and distributed power generation, Greece supports social tariffs and regional electricity price compensation, and Ireland supports electricity generation from local energy sources through the PSO levy.

Table 1.
Distribution of the collected PSO levy by country (designed by the authors).
There is another item to which the PSO levy is allocated by all the countries concerned and which is not shown in Table 1, namely the “equalization” (compensation) of the preceding period’s PSO levy fund. As the PSO levy fund is formed on an ex ante basis, overpayment or underpayment may occur in a certain period, which needs to be offset by the PSO budget for the next period. This item is of a financial nature and does not provide additional information in regard to the energy policy.
The Energy Trilemma Index was chosen to assess the impact of the PSO levy on energy security at the country level. The indicators comprising the Energy Trilemma Index for the four countries examined are shown in Table 2. Obviously, the countries differ in many regards. We further discuss each case (country) individually.
Table 2.
Energy Trilemma Index for selected EU countries in 2020 (designed by the authors, based on [87]).
5.1. European Union Energy Goals
The European Union has a fairly clear and specific energy policy and objectives, starting with the 2007 climate and energy package. By 2020, three headline targets had been set for: (1) a 20% reduction in greenhouse gas emissions (compared to 1990 level), (2) a 20% EU final energy consumption from RES, (3) a 20% improvement in energy efficiency. The energy goals of each Member State were linked to the level of wealth of the country. In 2020, even more ambitious plans were set for 2030: (1) a 40% reduction, (2) 32%, (3) 32.5%. However, in the wake of the COVID-19 pandemic (and the ongoing), the “European Green Deal“ (September 2020) and “Fit for 55” (20 July 2021) set a target of reducing greenhouse gas emissions by 55% by 2030 [88].
The European Union has faced the problem and complexity of approving energy initiatives in the past and, without a doubt, will face it in the future. The EU’s application of the principle of subsidiarity is not always successful, especially in an area as problematic and affecting the national security of each Member State as energy policy. However, historically, the EU has always found a consensus between Member States’ interests in adopting and approving energy and climate change strategies and policies.
5.2. Ireland
The Irish electricity sector has undergone significant transformations towards sustainability and security objectives, including the diversification of electricity sources, promotion of local power generation [89] and an increase in the RES share [90,91]. Development of the indigenous onshore wind energy sources is instrumental for achieving the aforementioned policy objectives in Ireland [92]. The major challenge associated with this approach is that onshore wind installations cause undesirable social, economic and environmental effects both within and outside the power system [93,94]. The promotion of RES is also maintained by installing hydro, offshore wind, bioenergy, solar and combined heat and power plants [95]. Moreover, the development of smart grids and encouragement of public involvement in the management of virtual power plants, energy distribution, trade and management are also important for Ireland’s energy security and transition [96]. However, according to Yue et al. [97], reliance on renewable energy sources alone is not the most cost-effective way to achieve complete decarbonization. There is also a need for the diversification of energy sources, diversification of energy suppliers and digitization and modernization of the energy system, which Ireland is gradually implementing. These measures stimulate the energy transition and contribute to energy security in Ireland. The aforementioned policy objectives and measures require additional investments along with dedicated financing mechanisms. Therefore, Ireland is one of the EU countries where the PSO is included in the electricity bill [38,98] paid by all electricity consumers [53,95]. The stylized facts about Ireland are presented in Figure 8.
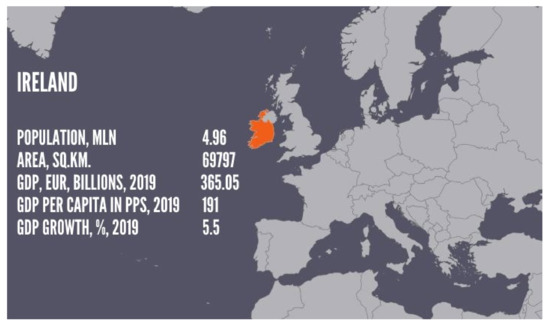
Figure 8.
Stylized facts about Ireland (designed by the authors, based on [86,99,100]).
The Irish PSO levy legal framework is managed by the Department of Communications, Climate Action and the Environment of Ireland with the approval of the European Commission on state aid. PSO levy calculations, forecasts and administrations are carried out by the Commission for Regulation of Utilities (CRU). The level of PSO is set from 1 October to 30 September each year [101].
For the period 2020/21, the Commission for the Regulation of Utilities (CRU) of Ireland has set EUR 6.52 excl. VAT per month for residential customers and the following scheme for business customers: PSO levy where Maximum Import Capacity < 30kVA = EUR 21.41 per month (excl. VAT) and PSO levy where Maximum Import Capacity => 30 kVA = EUR 2.78 per kVA per month (excl. VAT) [101]. This levy is intended to ensure security of the electricity supply and to support indigenous (peat; see [102]) and renewable energy sources (wind, hydro, solar, bio energy, combined heat and power) [38], as well as to promote environmental protection [55].
In Ireland, this levy was first adopted in the Electricity Regulation Act [55] and has been applied in practice since 2001 [103]. Renewable Energy Feed-in Tariff (REFIT) support is funded by this charge, compensating electricity suppliers for the additional costs incurred in purchasing electricity generated by PSO-supported electricity producers [104]. In other words, electricity consumers provide free insurance against low prices for RES (wind energy) through the PSO fee [105].
Di Cosmo and Linch [37] predicted that this levy could come under significant pressure due to the ongoing Irish capacity financing mechanism. Looking at the dynamics of the applied PSO levy in (see discussion below), this can be partly confirmed. The PSO fee is calculated on the basis of the estimated generation required, the planned wholesale electricity price next year (to cover the additional costs that they incur in purchasing PSO-supported electricity generation) and an adjustment to payments made two years previous once actual costs for the year are known [101,105]. It is the rising price of wholesale electricity that has led the PSO to decline in recent years. However, in 2020/21, we are already seeing a significant increase in PSO [101], one of the main reasons for which is the decrease in the wholesale electricity price, from 57.37 EUR/MWh in 2019/2020 to the indicative benchmark price 46.86 EUR/MWh in 2020/2021 until the final benchmark price of 53.66 EUR/MWh 2020/2021 [101]. This means that if the wholesale price of electricity falls, additional funds are needed to subsidize PSO-backed energy producers, which means that the PSO tax will increase. An examination of the changes in the Irish PSO tax, the following main upward and downward factors, is presented in Figure 9.
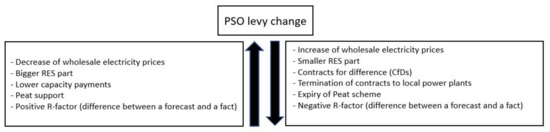
Figure 9.
Factors of Irish PSO levy changes (designed by the authors based on [101,106,107,108,109,110,111,112,113,114,115].
The distribution of the 2020/21 PSO levy applied in Ireland is shown in Appendix D. The measures supported by the PSO can be grouped into four categories. The Alternative Energy Requirement (AER) scheme was introduced in 1995. Since 2020/21, only offshore and onshore wind energy have been supported under this scheme. Small-scale hydropower, combined heat and power (CHP), biomass (landfill gas), biomass–CHP and biomass–anaerobic digestion had been supported in the earlier schemes The first Renewable Energy Feed-in-Tariff (REFIT) scheme, REFIT1, became operational in 2006. In 2012, REFIT2 and REFIT3 were launched. The main purpose of this scheme is to support renewable electricity generation. Unlike the RES scheme, REFIT is open to all suppliers (not merely Electric Ireland).
The level of the PSO is adjusted each year due to multiple factors, but the main one is the wholesale price of electricity [101]. The distribution of the PSO (Figure 10) shows that the share of the PSO allocated for the promotion of the RES is increasing and the country is aiming to achieve 70% by 2030 [116], although the total mandatory share set by the European Union is 40% [117] and by 2050 100% [118] electricity from RES. The increase in RES for electricity shows the country’s focus on achieving sustainable energy and increasing energy security. Most of the RES used in Ireland is produced or harnessed in Ireland itself, so there is no need to import it from other countries, which directly contributes to the greater energy security of Ireland [91]. Through comparison of the data from SEAI [91] on indigenous energy generation by source from 1990 to 2017, and the dynamics in the PSO tax introduced in 2001, one can note that the PSO directly contributes to the maintenance of energy from indigenous peat and the ever-increasing use of energy from indigenous RES.
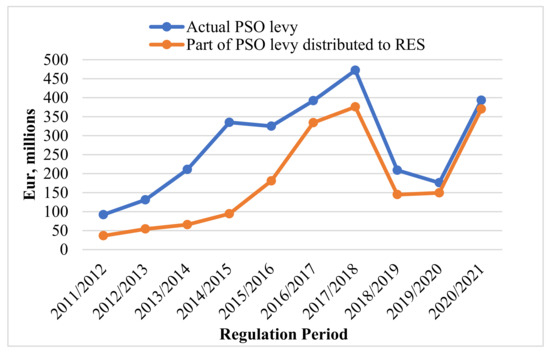
Figure 10.
Irish PSO levy and PSO levy distributed to RES 2011–2021 (designed by the authors, based on [101]).
After examining the change in the level of PSO (Figure 10) and its objectives, we can draw some conclusions related to energy security in Ireland. Until the end of 2016, the money collected by the PSO levy was allocated to support the Aughinish Alumina (160 MW) and Tynagh (400 MW) power plants since they were built for securing the power supply in 2005/06. These power plants no longer receive PSO support for electricity generated after March 2016. As a result, there has been no PSO support for “security of supply” since that year. At the end of 2019, support for the peat scheme ended, which, at least for the time being, ended support for indigenous energy sources. Local biofuel (peat) combustion plants (Lough Ree, West Offaly) were supported, compensating up to 30% of their capacity annually. As a result, PSO support for “indigenous energy sources” has disappeared. Corresponding with the policy targets, a gradual increase in PSO funding for RES (wind, bioenergy, solar, hydro energy, CHP) can be noticed over 2011–2021. With the reduction or elimination of support for indigenous energy sources and security of supply, PSO support in 2020/21 is basically limited to RES.
Comparing the change in the PSO levy applied since 2001 (Figure 10) and the Energy Trilemma Index (Figure 11), one can assess the impacts of this regulatory measure on the energy performance. Since 2008, a steady increase in the environmental sustainability indicator has been observed. The main reason for this is the increasing emphasis on low-carbon energy [119]. Since 2009, the share of the PSO fee has been allocated continuously to renewables, and since 2011, it has only been increasing [101,106,107,108,109,110,111,112,113,114,115,120] Since 2012, a surge in the energy security indicator can be seen. However, compared to other countries, this indicator is slightly lower, mainly due to the high dependence on imports and the low diversity of the primary energy supply [119]. The value of Ireland’s energy equity indicator is very high (98.1 out of 100); see Table 2. This can be explained by the presence of the universal access to electricity and stable energy prices [119].
Figure 11.
Trends of the components of the Energy Trilemma Index for Ireland, 2000–2020 (based on [121]).
Ireland ranks relatively high, at 17th (Although Ireland is ranked 17th in the 2020 Energy Trilemma ranking, the country essentially holds 20th position, with Austria and Finland sharing 4th place, France and the United Kingdom in 5th and Lithuania and Luxembourg in 16th. Therefore, with Ireland ranking 17th, it practically lands in 20th place.) place among 108 (Although there are 108 positions in the Energy Trilemma ranking, Austria and Finland are in 4th place, France and the United Kingdom are in 5th place, Lithuania and Luxembourg are in 16th place, Belgium and Slovakia are in 20th place, Iceland and Latvia are in 22nd place, Australia and Romania 25th, Argentina and Malta 30th, Costa Rica and Hong Kong 34th, Azerbaijan and Barbados 36th, Kazakhstan and Peru 42nd, Albania, Panama and Venezuela 43th, China and Saudi Arabia 55th Paraguay and Turkey 58th place, Montenegro and Oman 59th place, Mauritius and Serbia 60th place, Jamaica and Morocco 73rd place, Honduras and Sri Lanka 75th place, Jordan and Moldova 84th place, Kenya and Myanmar 89th place, so there are 128 countries in the overall ranking.) countries [87] in terms of the Energy Trilemma Index for year 2020. The indicators measured by this index and the influence of the PSO on them can be seen in Table 3.
Table 3.
PSO levy impact on Energy Trilemma Index for Ireland (created by the authors, based on [121]).
Looking at the change in the PSO levy on residential consumers between 2010 and 2021 (Figure 12), one can note that it decreased in 2011, 2015, 2018 and 2019. As for the period of 2020/21, the PSO fee is the highest since its implementation and amounts to an annual fee of EUR 88.80 with VAT for a domestic consumer. Comparing this levy with the annual median household gross income, which, in Ireland, is around EUR 47,000 [122], we can see that it represents a small proportion (0.19%) of the total annual household gross income. Farrell and Lyons [24], who examined the impact of PSO on electricity consumption in Ireland, conclude that an increase (or decrease) in PSO has an impact on household budget allocation by increasing (or decreasing) the overall price of electricity for the final consumer.
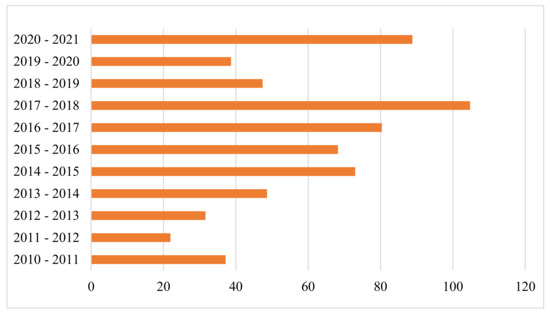
Figure 12.
PSO levy for residential users in Ireland during 2010–2021, EUR per year including VAT (designed by the authors based on [101]).
Among the EU countries (Figure 13), Ireland’s retail electricity price for household customers is the fourth highest, with only Germany, Denmark and Belgium exceeding its value. However, in terms of the net price of electricity (excluding any additional taxes and VAT), the price of electricity in Ireland is the highest in the EU. This negates the suggestion that only the PSO levy leads to this increase: even without all taxes, the price of Irish electricity is the most expensive in the EU.
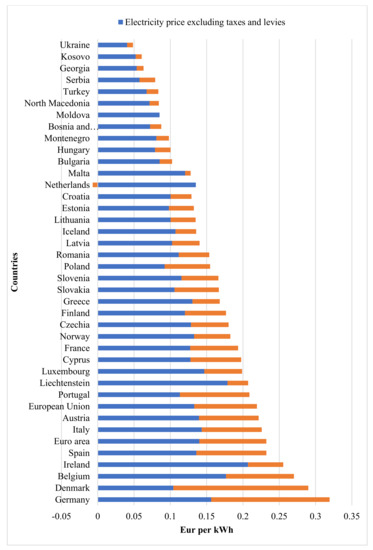
Figure 13.
Electricity prices for household consumers in the EU, first half 2021 (created by the authors, based on [123]).
As the PSO levy is mandatory for all electricity consumers (both residential and business ones), it undoubtedly raises the overall price of electricity and affects indicators such as energy poverty, electricity affordability, the competitiveness of exporting companies [124], the Irish economy, the investment ecosystem, employment and cost competitiveness. Note than an increase in the PSO was observed in 2020 amid one of the highest electricity prices in the world, the global COVID-19 pandemic and the effects of Brexit [101]. Therefore, on the one hand, the PSO levy has a positive impact on the development and energy security of the Irish energy system, and on the other hand, some negative socio-economic impacts may appear.
5.3. Greece
In 2001, Greece initiated an electricity reform, which was aimed at the liberalization of the electricity market. According to Danias, Swales and McGregor [125] and Iliadou [126], the main obstacles to the reform are incumbent company dominance, the electricity sector’s dependence on indigenous lignite firing generation, the non-standard geographical location of the country, Greece’s presence in the periphery of EU electricity and gas markets, the country’s financial crisis and weak political will. The PSO fee in Greece has been in place since 2007. It is administered and coordinated by the Greek Regulatory Authority (RAE) and is intended to supply electricity to customers in Non-Interconnected Islands (NIIs) at the same rates as in mainland Greece [127]. Figure 14 presents the major facts on Greece.
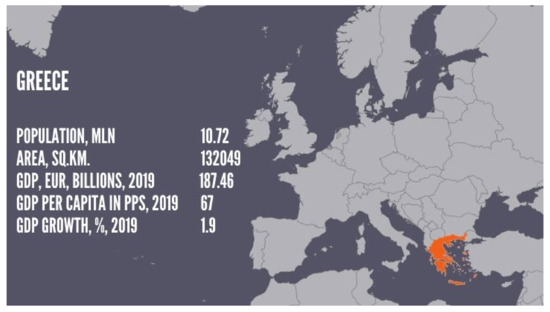
Figure 14.
Stylized facts about Greece (designed by the authors, based on [86,99,100]).
The Greek electricity system can be divided into interconnected (continental Greece) and autonomous (Greek Islands) [128] or NIIs, which consist of fifty Greek islands in the Aegean Sea (which account for approximately 9% of the total Greek electricity demand). It includes micro isolated systems, e.g., Rhodes and Crete [129]. Electricity suppliers in the islands are compensated for the difference in price between the (higher) generation costs and system marginal prices in mainland Greece from a fund based on the PSO levy revenue.
According to Hatziargyriou, Margaris, Stavropoulou, Papathanassiou and Dimeas [130], the case of Greek NIIs is unique due to the large number of islands of different sizes, huge RES potential due to the geographical and meteorological locations, the challenge of finding the “golden mean” between RES penetration, low production costs and high-quality provision of electricity services to consumers. Although, according to Vasilakos [52], NIIs, especially the Greek islands in the Aegean, have very high RES potential, it still remains unfulfilled, mainly due to weak local grids. Thus, electricity generation in these islands is based on old, highly polluting and inefficient fuel-based plants. Another problem challenging the islands’ electrification is the seasonality of electricity use due to tourism [131].
As connecting the remote islands to mainland Greece is a costly, technically complex and not always cost-effective process, the Hellenic Electricity Distribution Network Operator (HEDNO) has developed and adapted a smart grid system, the “smart island”, that allows the monitoring and control of the functioning of all NIIs, both in terms of generation and distribution [130]. This has not only increased the energy security of the NIIs and the whole country, but also allowed for the optimal management of the generation, maximum use of RES, improvement of regulatory and coordination mechanisms and a transition towards transparent market management.
The PSO fee is used to finance important energy projects. Specifically, electricity connections between the Dodecanese Islands and Crete and between mainland Greece and the North Aegean Islands are seen as crucial ones for maintaining Greece’s energy security and RES development [52]. In addition, completing the electricity connection with Crete could be seen as one of the steps required for integration with Israel’s power network [132]. This would contribute to the country’s energy security due to the increased energy supply. The subsea cable between Attica and Crete is expected to become operational by the end of 2023, and interconnections of the Aegean islands are planned for late 2020s [133]. EU funding is also used when implementing these projects, but Vasilakos [52] emphasized the need to develop additional effective EU funding instruments (EIB, CEF, Commission Initiative for Clean Energy for the EU Islands, Structural Funds, etc.).
Vourdoubas [134] argued that Crete can achieve carbon neutrality of power generation technically and economically if a connection is implemented between Crete (which has abundant solar and wind energy) by cables to the mainland Greece. This would allow the combination of the local generation of green solar and wind electricity with electricity transfer with the mainland. The generation of electricity from the RES and its circulation through connections with mainland Greece would have a positive impact, including the promotion of energy investments, lower use of imported and polluting fossil fuels, decarbonization of Crete’s energy sector and the creation of new local jobs [135]. This would have a direct impact on the country’s energy security, which is fully confirmed by Vlachou and Pantelias [136].
Although RES is not directly funded by the PSO, significant RES development in Greece has been driven by feed-in-tariffs (FITs) over the last 12 years. The FIT is supported by such financial mechanisms as the RES Levy or ETMEAR in Greece [30]. Therefore, both by itself and thanks to the directions set by the EU, the country aims to achieve 61% of RES in the gross electricity consumption by 2030 [132]. As the penetration of renewable energy sources gradually reached a high level, the Greek economic downturn in 2008 caused it to down. Nonetheless, regulatory efforts have been made to converge with other European electricity markets where a transition from a high FIT status to the market environment has been achieved [137]. The main directions of the Greek RES development are wind, photovoltaic (solar and photovoltaic panel), hydro (predominantly large-scale dams and growing wave energy), geothermal and localized biomass energy [128].
The transition from coal and oil to solar and wind technologies was examined by Mentis [138], Argenti and Knight [139], Loumakis, Giannini and Maroulis [30] and Vardopoulos [140]. However, both Katsaprakakis and Christakis [141] and Manolopoulos, Kitsopoulos, Kaldellis, and Bitzenis [142] highlighted a number of challenges facing RES development in Greece. Since 2009, when applications for funding for electricity generation projects from RES became available, licenses and applications have been approved without strategic planning, in contradiction to environmental and cultural requirements. Moreover, the projects were often technically too large for small islands (thus preventing projects dealing with other energy types in the local or regional area). In order to avoid such traps, local approval, detailed information, the participation of local investors and civil-society organizations and equal geographical distribution of projects should be facilitated. Higher RES penetration requires the installation of energy storage systems via batteries, pumped storage and hydrogen storage [131,143].
The PSO levy fund is also allocated to the so-called social residential tariff, which has been introduced and applied since 2011 and is aimed at the following vulnerable customer groups: low-income families, families with three or more children, the unemployed and people in need of medical care. In 2015, over 600,000 customers used this tariff [144]. The PSO fee is paid by all Greek electricity consumers, and it is divided into the categories shown in Appendix E. Note that similar categories prevail in all PSO-taxing countries.
The PSO levy amounts to between EUR 500 and 700 million annually in Greece. For example, in 2014–2016, the levy amounted to EUR 65 to 90 annually for each meter point in the Greek electricity system [144]. A comparison of the final electricity price for households in Greek and other EU countries (Figure 13) shows that the Greek price is close to the average level. This partially refutes the argument of the proponents of the abolition of the PSO that the PSO levy increases the price of electricity very significantly. The share of all additional taxes and VAT does not exceed 25% of the final electricity price in Greece.
Given the trends in the application of the PSO levy in recent decades, it is possible compare this information with the Energy Trilemma Index estimates for Greece in 2000–2020 (Figure 15). The environmental sustainability improved over 2005–2012 and 2013–2015 and then fluctuated above the initial level of 2000. This is mainly due to the increasing share of RES in the electricity market and the reduction in CO2 emissions. This was largely influenced by abandoning lignite-fired power plants in Greece. By the first half of 2020, lignite accounted for only 12% of the electricity demand in the Greek system, although the result was 52% back in 2010 [133]. Although the PSO levy does not directly support RES in Greece, the electrification of the Greek islands contributes significantly to the extension of electricity from the islands with the greatest RES potential to other islands and mainland Greece (and vice versa). The environmental sustainability score for Greece is 73.2 out of 100 (Table 2). The score is higher than average, yet there is still room for improvement.
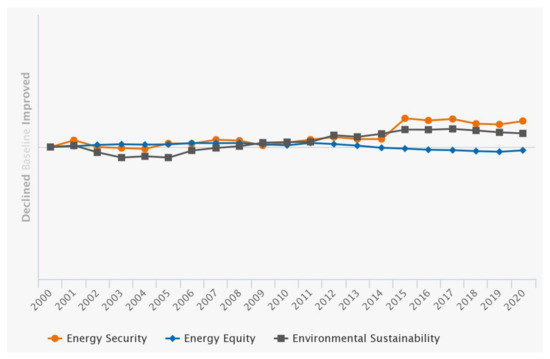
Figure 15.
Trends of the components of the Energy Trilemma Index for Greece, 2000–2020 (based on [133].
The energy equity indicator for Greece has changed very little over 2000–2020. During 2001–2013, it was slightly better than the initial level in 2000, and, in 2014–2020, it was slightly lower than the initial level. The PSO levy fund allows for the equalization of the price of electricity for the people living on the Greek islands and in mainland Greece. The social tariff also improves energy accessibility and affordability. However, energy access itself is quite complicated due to the fact that many islands are not connected to the common electricity system. Nonetheless, Greek is among the leaders in terms of energy equity score as it stood at 90.7 out of 100 (Table 2).
The energy security indicator maintained an upward trend, with minor downturns throughout 2000–2020 in Greece. Since 2005, the indicator level has been higher than the initial value for 2000. However, a comparison for Greece shows a value of the energy security indicator of 53.8 (Table 2), which is a rather poor result. This is mainly due to the country’s dependence on oil and gas imports, the low (but increasing) diversity of electricity generation and the poor (and even declining) ability of the country to meet the oil and gas demand considering the infrastructure capabilities, including storage and refining capacity.
Greece ranks 39th (Although Greece ranks 39th in the 2020 Energy Trilemma ranking, in reality, the country ranks 48th, as Austria and Finland share 4th place, France and the United Kingdom 5th, Lithuania and Luxembourg 16th, Belgium and Slovakia 20th, Iceland and Latvia 22th, Australia and Romania 25th, Argentina and Malta 30th, Costa Rica and Hong Kong 34th and Azerbaijan and Barbados 36th. Therefore, with Greece ranking 39th, it virtually holds 48th place.) among 108 (Although there are 108 positions in the Energy Trilemma ranking, Austria and Finland are in 4th place, France and the United Kingdom are in 5th place, Lithuania and Luxembourg are in 16th place, Belgium and Slovakia are in 20th place, Iceland and Latvia are in 22nd place, Australia and Romania 25th, Argentina and Malta 30th, Costa Rica and Hong Kong 34th, Azerbaijan and Barbados 36th, Kazakhstan and Peru 42nd, Albania, Panama and Venezuela 43th, China and Saudi Arabia 55th Paraguay and Turkey 58th place, Montenegro and Oman 59th place, Mauritius and Serbia 60th place, Jamaica and Morocco 73rd place, Honduras and Sri Lanka 75th place, Jordan and Moldova 84th place and Kenya and Myanmar 89th place, so there are 128 countries in the overall ranking.) [87] countries in the world according to the World Energy Council’s Energy Trilemma Index (as of 2020). The indicators measured by this index and the influence of the PSO levy on them are discussed in Table 4.
Table 4.
PSO levy impact on Energy Trilemma Index for Greece (designed by the authors, based on [133]).
The National Energy and Climate Plan of Greece [132] envisages several measures that are related to the PSO levy. Indeed, they are focused on the interconnections and upgrades of the existing energy systems. Particular attention is paid to emergency handling and the NIIs. The electricity interconnection projects between mainland Greece and the islands, supported by the PSO levy fund, make a significant contribution to Greece’s energy security. Thus, one can conclude that Greece’s National Energy and Climate Plan is in line with the country’s energy security needs (as indicated by the Energy Trilemma Index). In Greece, as is the case in other countries that apply the PSO levy, private electricity suppliers have some doubts over the country’s ability to implement EU Energy and Competition Law. According to Metaxas and Associates [145], after the official notification of the European Commission to Greece of possible restrictions on competition in the electricity market, several private electricity trading companies objected to the PSO levy sizing methodology, which is strictly based on the elements of the Public Power Corporation (PPC). Indeed, the methodology stipulates that the PPC is practically the only provider and recipient of the PSO levy. However, as stated in the European Commission’s explanation (2014) to the complaint of the Greek energy company Energa, the compensation granted to the PPC for the delivery of the public service obligation of supplying electricity on the NIIs at standard tariffs starting from 2007 constitutes state aid.
5.4. Denmark
Denmark shows rather high levels of energy security and sustainability [146,147,148,149]. Indeed, Denmark has achieved a transition from a country that was 100% dependent on imported oil and coal in the 1970s to a country that is currently completely independent of any foreign energy sources and a world leader in the share of wind energy in the country’s electricity system (more than 20%) [150]. As of 2019, the share of RES in electricity generation stood at 72% [151], which places Denmark among the leading countries in the world in this regard. The major facts about Denmark are provided in Figure 16.
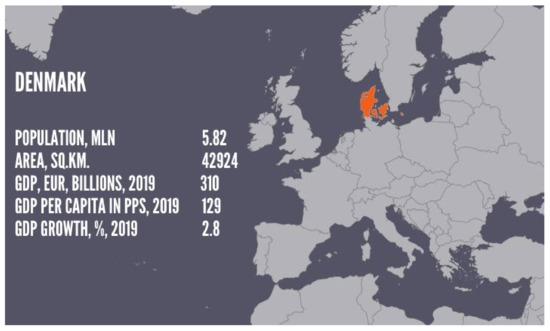
Figure 16.
Stylized facts about Denmark (designed by the authors, based on [86,99,100]).
Although Denmark has substantial natural energy source endowments, it had been heavily dependent on imported fossil fuel until the 1980s. After the oil crisis in the mid-1970s, the Danish government abandoned its nuclear energy plans in 1985 [152] and focused on wind energy and combined heat and power. In 1981, Denmark approved its first energy plan, which set an ambitious target to achieve 1,000 MW of wind energy generation capacity by 2000 [153]. Energy 21, the Danish Action Plan for Energy [154], aims to install 5500 MW wind turbines by 2030 and to achieve full independence from coal, oil and gas by 2050.
The use of wind energy in Denmark has been around longer if compared to other countries. In 1978, the Danish government established an experimental wind turbine station, Riso National Laboratory [153]. The development of wind turbines in 1984–2000 was supported through a feed-in tariff [155]. In 2000, the feed-in tariff was changed to green certificates, which were issued to renewable electricity producers, who could then trade them at a premium with anyone who wanted to buy renewable energy or who was obliged to do so [50].
Electricity generation from RES (namely wind energy) is supported through price premiums added to the market price, capped at a maximum amount, and tenders for offshore wind power. This process is coordinated by the Danish Energy Agency and all subsidy costs are passed on to electricity consumers through the PSO [156,157]. Thus, Denmark is another EU country applying a PSO levy [158]. Kitzing, Katz, Schröder, Morthorst and Andersen [41] refer to this levy as the PSO element. It is bound to fund such policy initiatives as support for renewable energies, decentralized plants and research and development regarding the electricity system.
Following the Energy Agreement of 2018, Denmark plans to generate 55% of its electricity power from RES by 2030. This is considered a guarantee for ensuring energy security in Denmark [159]. The PSO levy, which finances RES projects, contributes to the development of the sustainable and secure energy system. Currently, the price of electricity in Denmark consists of four elements: production, transmission, distribution and PSO. The latter is to be abolished in 2022 [160].
The Organization for Economic Co-Operation and Development [161] indicated that the Danish market rules for green energy and the PSO were not precisely defined. Thus, there have been improvements in green electricity support schemes and the PSO system. All electricity consumers are obliged to purchase renewable energy certificates and bear the cost of PSO [161]. Energinet.dk is responsible for distributing proceeds from the PSO levy to the entitled stakeholders [41].
Electricity customers (mostly business customers) consuming more than 100 GWh per year have paid a reduced PSO levy [41] from 2014 onwards [162] to maintain their international competitiveness. The PSO Agreement reduced Danish electricity bills by DKK 2.7 billion in 2016 (more than EUR 363 million at the exchange rate on 11 March 2021) and, with the complete abolition of the PSO levy in 2022, will allow Danish businesses to pay perhaps the lowest price for electricity in the European Union [163]. Figure 13 also indicates that the taxes and levies comprise the major part of the retail electricity price in Denmark.
The PSO tariff is set quarterly and is publicly available on the Energinet.dk website. In the third quarter of 2015, it accounted for approximately 10% of the final electricity price for residential customers [162]. The Ministry of Environment and Energy retains key regulatory powers in the electricity sector, including setting the PSO [161]. In 2011–2012, the major share of the proceeds from the PSO levy (60–80%) was dedicated to renewable energy and decentralized plant development [41]. These are expected to contribute to Danish energy security [159]. The third-largest part is for adjustment for profit or loss from previous periods that occurs when the market price of electricity departs from the forecasts made when setting the fixed (guaranteed) price for the renewable energy. In essence, the PSO decreases with increasing market price [41]. The fourth (and smallest) part is allocated to research and development activities initiated by the PSO Energinet.dk [162].
According to 2012 data, the average Danish household spent 5–6% of its income on electricity bills, and this was a relatively high figure among all the EU countries (the average was 3–4%). However, the high living standard in Denmark did not cause extreme difficulties [164]. In 2014, the PSO levy was slightly reduced by shifting a part of the funding to the federal budget, with considerable public questioning and pressure to reduce or eliminate it [162]. For the most part, the criticism came from industrial customers. In 2016, the Danish government decided that the PSO tariff would be completely abolished by the end of 2021 [165,166]. As a result, a decline from 17.45 EUR/MWh in 2018 to zero in 2022 is expected [167]. The main reason for this is its contradiction with the EU Treaty, as foreign companies cannot receive the same subsidies under the same conditions as Danish companies. With the abolition of the PSO, RES will be supported by the Danish national budget, and this will reduce the price of electricity for consumers by around 10% [162].
Thanks to the PSO levy, 350 MW nearshore (10 km from the Danish coast) and 600 MW offshore wind projects have been financed since 2012. This promotes the development of RES and integration with the German electricity market, which in turn is an important aspect of energy security [159,162]. Indeed, wind energy is an important component of the existing and future Danish energy system. Jacobsen, Hevia-Koch & Wolter [168] examine the advantages, disadvantages and cost drivers of nearshore and offshore wind energy; Ladenburg, Hevia-Koch, Petrović, & Knapp [169] examine the differences between onshore and offshore wind farms and public attitudes towards them; Berg, Apostolou & Enevoldsen [170] examine the wind energy market in Denmark and the economic feasibility of integrating various capacities of water electrolysis systems; Jørgensen, Anker, & Lassen [171] examine wind energy support and compensation schemes; Koivisto, Gea-Bermúdez, Kanellas, Das & Sørensen [172] examine wind energy opportunities and prospects across the North Sea region, comparing the connection of each offshore wind farm to the main system individually and the collective advantages and disadvantages; Lund and Mathiesen [173] predict different scenarios for Denmark to achieve 100% RES use and confirm that this is technically possible.
Sovacool & Tambo [174] found that Danish respondents value energy safety less than other countries. However, Denmark is one of the safest countries energy-wise in the world [175]. The maturity of Danish society and the energy direction set by the Danish government, government-sponsored and sponsored initiatives led to the mass establishment of so-called wind cooperatives in the 1970s: small, rural, farmed and privately owned wind turbines [152]. Of course, the oil crisis of the 1970s also contributed to this, which led to the search for new energy sources. Moreover, as early as the 1990s, there were an estimated 2000 such privately operated wind turbines in Denmark. However, with the liberalization of the electricity market, many of these small wind farms were bought by larger energy companies that had more financial and technical potential to replace small wind turbines with larger (and more expensive) ones [152]. Active support policy has led to the development of Danish wind energy with such manufacturers as Vestas and Siemens Wind Power, which account for more than 30% of the global wind turbine market [150].
Examining Denmark’s final electricity price for households in the EU context, it is visible (Figure 13) that the price is the second most expensive in the EU, surpassing only Germany. However, the net electricity price (excluding any additional taxes and VAT) appears to be one of the lowest in the EU (only in Poland, Estonia, Hungary and Bulgaria). Additional taxes and VAT account for two thirds of the final price of electricity for household consumers and this significantly increases the final price of electricity. However, the share of the PSO levy is around 10% of the final electricity price and it therefore cannot be considered as the main reason for such expensive electricity.
Denmark holds a very high third place (as of 2020; see Table 2) in terms of the Energy Trilemma Index [87] and is undoubtedly among the world leaders in energy security and sustainability. This is mainly influenced by the import independence, affordability of electricity, increased low-carbon power generation and diversity of power generation sources. In many ways, the PSO levy impacts many of these indicators. A more detailed deliberation on the impact of the PSO levy in the Danish case is provided in Table 5. Examining the changes in the Energy Trilemma Index for Denmark (Figure 17), one can draw conclusions on the influence of the PSO levy on the index.
Table 5.
PSO levy impact on Energy Trilemma Index for Denmark (designed by the authors, based on [176]).
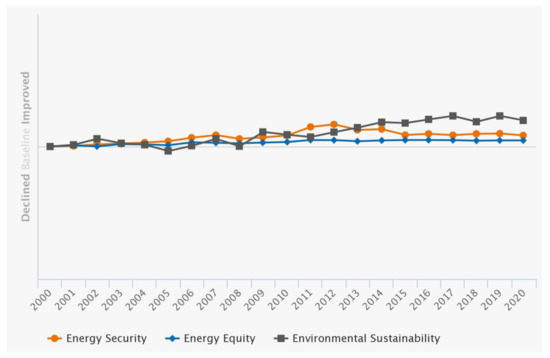
Figure 17.
Trends of the components of the Energy Trilemma Index for Denmark, 2000–2020 (based on [176]).
The environmental sustainability has increased since 2000, with certain fluctuations over 2000–2020. Note that the indicator fell below the initial value for 2000 in 2005. The country’s determination to become a net-zero-emissions country by 2050 and the active use of wind energy and other RES contribute to the high value of this indicator. According to this indicator, Denmark ranks 10th among all the indexed countries. The PSO levy contributes to this as a tool to support the development of RES in a clear, comprehensible and targeted manner.
The energy equity indicator exceeded the initial level over 2000–2020 and Denmark was ranked as the 15th country (Table 2) among all the indexed countries. Stable access to electricity and electricity prices allowed Denmark to maintain such a position. The indicator remained rather stable throughout the period covered. The PSO levy had an effect on this indicator only in regard to the increase in the electricity price for the final consumers.
According to the energy security indicator, Denmark holds a very high position of fourth place (Table 2). The increasing diversity of power generation sources and import independence are the main reasons for such a result. The indicator followed an inverse U-shaped trend throughout 2000–2020, with a peak in 2012. This indicator is highly influenced by the PSO levy through RES and decentralized production support measures.
5.5. Lithuania
Lithuania is endowed with limited energy sources and is quite dependent on energy imports [177]. For decades, Ignalina NPP was the main source of electricity in the country. When Lithuania joined the EU, it was agreed on the closure of Ignalina NPP and complete shutdown took place in 2009 [178,179]. Thus, almost overnight, Lithuania transitioned from a large exporter of electricity into a country that imported 70% of its electricity from Russia [180,181]. The increasing importance of the imports’ diversification and energy-mix diversification led to further initiatives to support the RES and interconnections with such countries as Sweden and Poland. The major facts on Lithuania are provided in Figure 18.
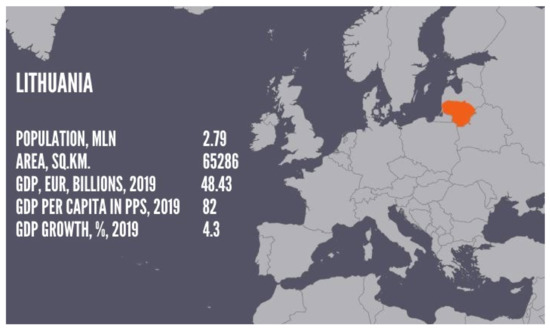
Figure 18.
Stylized facts about Lithuania (designed by the authors, based on [86,99,100]).
Streimikiene, Burneikis and Punys [182] discussed which RES would be most suitable to replace the shutdown nuclear power plant. Later on, Gaigalis and Katinas [183] reported that, in 2015–2020, energy consumption increased around 1.3 times, whilst wind energy production increased 2.5 times, biogas energy 2.8 times, and the total emissions of greenhouse gasses decreased by 3% and air pollutants by 23% in Lithuania. Galinis et al. [184] examined the implications of gradual and delayed carbon price increases in the four Baltic Sea region countries in the context of energy security. The latter study noted that the Lithuanian local generation is deeply diversified both in terms of power plants and primary energy resources, including gas, wind, biomass and municipal waste as the main ones. From 2030, the contribution of wind energy is projected to be significantly higher, and the growing share of domestic energy resources (wind, solar, biomass) in total primary energy consumption has a very positive impact on energy security.
Although the Lithuanian electricity system still belongs to the Integrated/Unified Power System (IPS/UPS), along with Russia and Belarus, electricity connections with Poland and Sweden contribute to the country’s energy security [149]. Švedas [185] examined the possibilities for Lithuania to no longer be an energy island and emphasized that the Swedish–Lithuanian NordBalt connection and LitPolLink connection between Lithuania and Poland create a major change on the geo energy map in the Baltic Sea region. This was confirmed by Pikšrytė, Mažylis and Povilaitis [186], who examined Lithuania’s energy strategy in the European context.
Electricity connections with other countries are an important aspect of Lithuania’s energy security and are partly financed by the PSO levy fund (Table 6). In addition, Pérez, Scholten and Stegen [187] argued that Lithuania’s determination and policies leading to disconnection from the IPS/UPS and synchronization with European networks will further increase the country’s energy security. Blažauskas, Włodarski and Paulauskas [188] studied offshore wind energy development in Lithuania among other South-East Baltic countries and also highlighted the importance of the electricity connections for wind energy development.
As of 2016, wind energy accounted for the largest share of RES (54%) in Lithuania, followed by hydropower (22%), even though there is a lack of marine technologies in Lithuania. Bioenergy (21%) came next [189]. Klevas, Bobinaite, Maciukaitis and Tarvydas [190] examined RES (wind energy) support measures and policies in Lithuania and noted that support from structural funds should be used in the short term. A feed-in tariff was also mentioned as an effective support tool allowing the maintenance of the competitiveness of the wind energy in the market. Improvements in the energy infrastructure were also discussed as a prerequisite for further development of the RES in Lithuania.
According to Štreimikienė, Strielkowski, Bilan & Mikalauskas [191], Lithuania shows the lowest energy and carbon intensity of all economies, as well as specific branches of the economy, the highest energy import dependency, and its share of RES in final energy is above the EU-28 level (and has increased by approximately 70% since 2004). In addition, the country needs more policies to increase the energy efficiency and use of RES, and to increase the diversification of the fuel mix. The support provided by the PSO levy fund to certain energy segments contributes directly or indirectly to many of the aforementioned issues (Table 6).
Lithuania is yet another EU country where the PSO levy is applied and paid for by all electricity consumers. In Lithuania, the PSO levy has been applied since 2004 [192]. In 2005, the PSO levy accounted for 10% of the retail price, 20% in 2013 and 10% again in 2021 [192]. The Energy Ministry of Lithuania requires electricity suppliers to purchase electricity from RES on a mandatory basis if the electricity consumer delivers a request [51]. Electricity producers providing PSO in the energy sector receive a fixed tariff for each unit of electricity produced and supplied [193].
The purpose of supplying PSO is to implement the strategic goals of the Lithuanian energy, economic and environmental policy, respecting the interests of all electricity consumers [194]. Lithuanian PSO can be used to finance the optimization, development and/or reconstruction of power networks implemented by the power network operators in order to ensure the development of production using renewable energy. This service is provided by operators of the transmission system and of distribution networks [194]. Table 6 shows a detailed overview of the stakeholders that the PSO levy is supplied for in Lithuania.
Table 6.
Distribution of Lithuanian PSO levy (created by the authors, based on [194]).
Table 6.
Distribution of Lithuanian PSO levy (created by the authors, based on [194]).
| Nr. | PSOs | Description |
|---|---|---|
| 1. | Production of renewable energy (RE) and balancing | The PSO includes production of electricity using renewable energy and its balancing |
| 2. | Effective production at thermal power plants | Includes production of electricity in the thermal mode at combined power and thermal production cycle plants, whereby these power plants supply heat to the heat supply systems and the quantity of primary energy saved is such as to ensure that the overall production of heat and electricity can be considered effective |
| 3. | Assurance of safety of power supply and of system reserves | Includes production of electricity in specified power plants, where production of electricity is necessary in order to ensure the security of electricity supply and the reserves of the electricity system in specified power plants whose operation is necessary to ensure the national energy security |
| 4. | Strategic electricity production projects | Includes development of electricity production capacities that are of strategic importance for the safety and reliability of the operation of the electricity system and/or for the assurance of the national energy security |
| 5. | Strategic infrastructure projects | Includes implementation of strategic power sector projects connected with improvement of energy security by providing connecting lines with power systems of other countries and/or connecting Lithuanian power systems with power systems of other Member States |
| 6. | Ignalina NPP Decommissioning Fund | Includes assurance of the safety of operation of energy sites and handling of radioactive waste |
| 7. | Connection of RE to power networks | Includes connection of renewable energy sources to power networks. This service is provided by operators of the transmission system and of distribution networks |
| 8. | Network development due to RE | Includes optimization, development and/or reconstruction of power networks implemented by the power network operators in order to ensure development of production using renewable energy, and this service is provided by operators of the transmission system and of distribution networks |
The PSO is set every year by the National Energy Regulatory Council (NERC) and is published on its website. The NERC also annually determines the projected electricity market price, which is used to determine the PSO budget [194], and the legal basis and scope of the PSO are determined by the national government. The PSO levy is administered and distributed by the state-owned company Baltpool [195] according to the guidelines. Appendix C shows how the funds collected from the PSO levy are distributed to the various RES. Energy production from RES is supported through the PSO and, in 2018, for example, this support amounted to EUR 84.4 million [196].
Wind energy is the most developed in Lithuania and its capacity has increased around 2.8 times during 2011–2018 (from 191 MW to 532 MW), which corresponds to the average annual growth of 17% (Table 7). In second place is hydro power, although it has maintained a slight upward trend (from 126 MW in 2011 to 128 MW in 2018). The hydro power capacities changed the least among other types of energy (by 0.22% per year). Solar and biomass showed similar installed capacity for 2018, although the growth rates for these technologies were 47% per year and 13% per year, respectively. However, the steepest increase in the installed capacity of the solar power plants was observed in 2011–2013, when the capacity increased from 1 MW to 69 MW and only a slight growth was noted in 2013–2018 (from 69 MW to 72 MW). Biogas plant capacity increased from 14 MW in 2011 to 38 MW in 2018 at the annual growth rate of 16%. These figures are more or less in line with the share of PSO levy allocated to RES—EUR 26.99 million in 2011 and EUR 114.217 million in 2018 (Appendix C).
Table 7.
Installed capacity of RES power plants in Lithuania during 2011–2018, MW (designed by the authors, based on [196]).
Looking at the change in the PSO levy from 2010 to 2020 (Appendix C), several trends can be seen: it increased during 2011–2014 and decreased during 2014–2020. This can be partly explained by the fact that the funds from the PSO levy fund are being virtually allocated only to RES, eliminating all other areas of support. It can also be noticed that the funds allocated for electricity generation at the Lithuanian power plant had been in effect until 2015, and the reserves at the Lithuanian power plant were financed until 2018. This part of the support relates to the security of supply. According to the National Energy Regulatory Council [197], the components of electricity prices in Lithuania in 2021 are: purchase price (37%), TSO (10%), transmission (65), system services (7%), public supply (3%), distribution of medium voltage (11%), distribution of low voltage (25%), additional component (1%). A PSO contribution of 10% to the final electricity price is rather usual in the European Union context.
In 2021, the average electricity price for household customers amounted to 11.393 eurocent/kWh, of which 1124 cent was the PSO levy [197]. At the EU level, the final electricity price for Lithuanian households (Figure 16) is lower than the EU, with only six countries showing lower prices. All surcharges and VAT account for no more than 25% of the final electricity price, and the PSO levy is around 10% of the final electricity price. Thus, the PSO levy does not cause a significant increase in the final price of electricity in Lithuania.
Lithuania holds 16th (Although Lithuania ranks 16th in the 2020 Energy Trilemma rating, in reality, the country ranks 19th, with Austria and Finland sharing 4th place, France and the United Kingdom in 5th place and Luxembourg also in 16th place. Therefore, Lithuania ranks 16th, but it actually holds 19th position.) place according to the Energy Trilemma index among the 108 (Although there are 108 places in the Energy Trilemma ranking, Austria and Finland are in 4th place, France and the United Kingdom are in 5th place, Lithuania and Luxembourg are in 16th place, Belgium and Slovakia are in 20th place, Iceland and Latvia are in 22nd place, Australia and Romania 25th, Argentina and Malta 30th, Costa Rica and Hong Kong 34th, Azerbaijan and Barbados 36th, Kazakhstan and Peru 42nd, Albania, Panama and Venezuela 43th, China and Saudi Arabia 55th Paraguay and Turkey 58th place, Montenegro and Oman 59th place, Mauritius and Serbia 60th place, Jamaica and Morocco 73rd place, Honduras and Sri Lanka 75th place, Jordan and Moldova 84th place and Kenya and Myanmar 89th place, so there are 128 countries in the overall ranking.) indexed countries. The country shows stable performance according to all three indicators (with certain exceptions for the energy security component) and has prospects for improving them. The country’s performance according to the three indicators is shown in Figure 19.
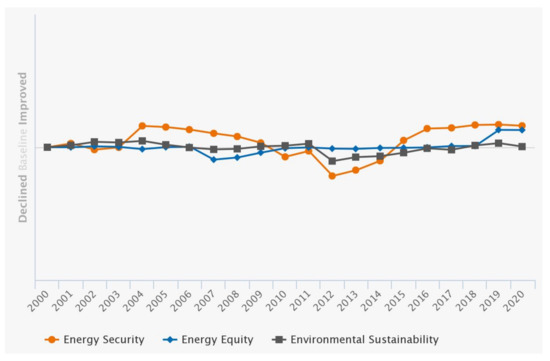
Figure 19.
Trends of the components of the Energy Trilemma Index for Lithuania, 2000–2020 (based on [198]).
The environmental sustainability indicator slightly increased before declining in 2012. Afterwards, it recovered and remained below the initial level in 2020. In terms of the environmental sustainability indicator, Lithuania was assigned the value of 79.2 points (out of 100) and ranked as the 16th country among all the indexed ones. The decline in the indicator in 2012 may be related to the closure of the nuclear power plant and the increasing use of fossil fuels in power generation. In 2019, Lithuania presented a new RES support strategy and, in 2020, the National Energy and Climate Plan was approved, where ambitious goals for reducing CO2 emissions and increasing the use of RES were set. In addition, the National Independence Strategy was approved in 2018. The latter strategy envisaged the goal of securing 80% of the energy demand from non-polluting sources and 100% of the electricity demand from domestic sources of energy by 2050. Therefore, this indicator is expected to improve in the future. Moreover, 700 MW of offshore wind farms are planned to be built by 2030. A permanent part of the PSO levy devoted to the development and maintenance of RES (Appendix C) undoubtedly contributes to the improvement of this indicator.
The energy equity indicator remained relatively stable between 2000 and 2020 and very close to the 2000 indicator level, except for the period 2006–2010, when the indicator fell due to higher electricity prices. Following the year 2018, the indicator improved quite robustly. Among all countries evaluated by the index, Lithuania ranks 18th by this indicator, with 95.7 points out of 100 (Table 2). The inclusion of the PSO levy in the price of electricity increases the final price of electricity for consumers, and thus affects the value of this indicator. The indicator of access to electricity remained stable as Lithuanian residents have long had proper access to electricity and it is only possible to improve the infrastructure of the electricity system.
According to the energy security indicator, Lithuania was assigned a score of 60.9 out of 100 and ranked as the 43rd country, which is a fairly average result. In 2000–2020, several trends can be seen: the increase in 2004, a downturn trend for 2004–2012 and a rebound for 2012–2020. Again, the impact of the closure of the nuclear power plant is evident. Such projects as the country’s energy systems’ synchronization with European systems, a new electricity connection with Poland (Harmony Park, 700 MW) and other infrastructure projects will significantly improve the energy security performance in the near future. Important strategic projects (Table 1) supported by the PSO levy contribute to the improvement of this indicator. PSO levy support for RES also contributes to energy security by increasing the diversity of electricity generation. The impact of the PSO levy on energy security and the Energy Trilemma Index as a whole is discussed in Table 8.
Table 8.
PSO levy impact on Energy Trilemma Index for Lithuania (designed by the authors, based on [198]).
6. Conclusions
This paper assessed the theoretical preliminaries and empirical cases of the PSO levy in selected EU countries. The cases of Denmark, Greece, Ireland and Lithuania were considered for a more detailed analysis. Such an approach allowed us to identify the major challenges and possibilities for improvement of the PSO levy.
The four countries considered in the analysis are diverse in terms of their energy infrastructure, development level, economic development level and geographical and geopolitical situations. The case of Denmark shows that a major breakthrough has been achieved in the sense of the energy transition via the support under the PSO levy, yet this measure is to be abandoned due to economic considerations, among other reasons. Ireland is still on a similar pathway of promoting renewables via the PSO levy. For such countries as Greece and Lithuania, the development of the energy infrastructure is important due to the geopolitical situation. The PSO levy is likely to persist in such cases for a longer time in order to ensure the modernization of the energy systems there. In terms of the 4As (affordability, availability, acceptability and accessibility), we showed that the PSO levy affects different sets of the four dimensions depending on the country-specific policy measures supported by the levy. Analysis of the literature and case studies also confirmed that PSO supports (directly or indirectly) energy security.
The PESTEL approach can be applied to provide a comprehensive description of the effects of the PSO levy. Taking the political dimension into account, the PSO levy is always a political instrument, both in terms of determining what the PSO is and its level. This always requires the identification of clear energy policy priorities, decisive actions, clear reasoning and support from public authorities and the European Commission. Obviously, the PSO levy is strongly expressed in the economical dimension. It acts as the tax increases the price of electricity for the final consumer, but, at the same time (following the example of Greece), may act as a cross-subsidy measure for vulnerable groups. Moreover, PSO levy support is allocated to producers of electricity from RES, which makes it easier for them to do business and encourages them to do so. In the long run, support for RES and the transition to sustainable and clean energy will contribute to a healthier society and nature, thus offering vast benefits for health and environmental protection. This is also related to the social dimension. The best example of PSO levy support in the social dimension can be seen in the Greek support mechanism, which finances electricity for vulnerable groups and residents of Non-Interconnected Islands. Turning to the technological dimension, PSO support has an impact on technological progress. Taking Denmark as an example, research and development are directly supported in order to improve energy efficiency. All countries directly or indirectly support RES energy, which always uses the latest technologies. In Lithuania and Greece, support is provided for large infrastructure projects, which also always require the latest technological solutions and insights. The environmental dimension is also relevant to the PSO-based policy. Taking the four countries analyzed as examples, all countries directly (Ireland, Denmark, Lithuania) and indirectly (Greece) support electricity generation from RES, which supports the development of the sustainable energy sector. The legal dimension is also of crucial importance in the PSO levy context. In the countries applying the PSO levy, legal discourses often arise regarding the legality of PSO levy support, and its directions, as this creates conditions for distorting competition in the (regulated) electricity market. Such disputes arose in all the countries examined, and Denmark even plans to stop applying the PSO levy from 2022 for this reason. Therefore, when applying a PSO levy, the country must communicate the entire support mechanism to the public in a clear, detailed and transparent manner, and obtain the approval of the European Commission in the case of EU countries.
PSO levy support is not the only policy instrument that can be applied for the development of energy systems. Many countries also intervene in the electricity tariff by imposing additional taxes. The tax revenue can be used for measures related to the security of supply, RES development or other important services or projects that meet the definition of public service. Therefore, if the countries did not apply a PSO levy, they would simply use another form of levy or a different support mechanism (i.e., funds directly from the state budget).
Author Contributions
Conceptualization, T.K. and T.B.; methodology, T.K.; formal analysis, T.K.; investigation, T.K.; writing—original draft preparation, T.K.; writing—review and editing, T.B.; visualization, T.K.; supervision, T.B. All authors have read and agreed to the published version of the manuscript.
Funding
This research received no external funding.
Institutional Review Board Statement
Not applicable.
Informed Consent Statement
Not applicable.
Data Availability Statement
The data can be obtained from the corresponding author upon reasonable request.
Conflicts of Interest
The authors declare no conflict of interest.
Appendix A
Table A1.
Definitions of the public service obligation.
Table A1.
Definitions of the public service obligation.
| Reference | Definition |
|---|---|
| [199] | “Member States may impose on undertakings operating in the electricity sector, in the general economic interest, public service obligations which may relate to security, including security of supply, regularity, quality and price of supplies and environmental protection, including energy efficiency and climate protection. In relation to security of supply, energy efficiency/demand-side management and for the fulfilment of environmental goals, as referred 2 to in this paragraph, Member States may introduce the implementation of long-term planning, taking into account the possibility of third parties seeking access to the system”. |
| [95] | “Public Service Obligation-In this context, is a levy imposed by the Government on some or all final electricity customers to recover the additional costs associated with electricity from specified sources of generation- including sustainable, renewable and indigenous sources”. |
| [200] | “In the context of European Union law, a public service obligation or PSO means an obligation imposed on an organization by legislation or contract to provide a service of general interest within the European Union territories. PSOs may operate in any field of public service, but postal services, social services, energy, transport and banking are identified as specific sectors where the concept is relevant”. |
| [201] | “public service means the guaranteeing, through regulatory standards, measures or requirements, of levels of consumer or environmental protection that might otherwise not be maintained through the simple operation of the market mechanism”. |
Appendix B
Table A2.
Definitions of energy security.
Table A2.
Definitions of energy security.
| Reference | Definition |
|---|---|
| [202] | “defines energy security as the uninterrupted availability of energy sources at an affordable price. Energy security has many aspects: long-term energy security mainly deals with timely investments to supply energy in line with economic developments and environmental needs. On the other hand, short-term energy security focuses on the ability of the energy system to react promptly to sudden changes in the supply-demand balance”. |
| [203] | “defines energy security as the ability of an economy to guarantee the availability of energy resource supply in a sustainable and timely manner with the energy price being at a level that will not adversely affect the economic performance of the economy”. |
| [204] | “is the reliable, stable and sustainable supply of energy at affordable prices and social costs”. |
| [205] | “For importers energy security means security of supply (that is sustainability of access to energy resources), pursuit of diversified sources of supply, suppliers and routes of supply to minimize risks and vulnerabilities stemming from any kind of dependence, at competitive prices and without harming the environment”. |
Appendix C
Table A3.
PSO budget in Lithuania (mln. EUR) 2010–2019 [206]).
Table A3.
PSO budget in Lithuania (mln. EUR) 2010–2019 [206]).
| No | Name | 2010 | 2011 | 2012 | 2013 | 2014 | 2015 | 2016 | 2017 | 2018 | 2019 | 2020 |
|---|---|---|---|---|---|---|---|---|---|---|---|---|
| 1. | Renewable energy sources (RES) PSO, RES balancing and central trade RES | 12.69 | 26.99 | 36.98 | 53.351 | 62.498 | 63.278 | 93.243 | 111.372 | 114.217 | 108.359 | 91.016 |
| 2. | Combined Heat and Power Plant (CHPP) PSO | 10.34 | 24.82 | 33.93 | 48.71 | 27.24 | 17.79 | 0 | 0 | 0 | 0 | 0 |
| 3. | Lithuanian Power Plant PSO (production) | 99.99 | 89.94 | 96.479 | 136.462 | 77.670 | 50.59 | 0 | 0 | 0 | 0 | 0 |
| 4. | Fixed costs of Lithuanian Power Plant | 7.29 | 10.85 | 18.867 | 0 | 0 | 0 | 0 | 0 | 0 | 0 | 0 |
| 5. | Lithuanian Power Plant PSO reserves | - | - | - | 4.159 | 0 | 0 | 25.146 | 34.308 | 26.939 | 0 | 0 |
| 6. | Strategic Projects (Visaginas Power Plant) | - | - | - | 0 | 0 | 0 | 0 | 0 | 0 | 0 | 0 |
| 7. | Strategic Projects (NordBalt) | - | 26.65 | 24.62 | 24.62 | 23.17 | 20.273 | 19.588 | 0 | 0 | 0 | 0 |
| 8. | Ignalina Nuclear Power Plant PSO | 0 | 0 | 0 | 0 | 0 | 0 | 0 | 0 | 0 | 0 | 0 |
| 9. | RES Connection to the transmission and distribution grids | 0 | 0.23 | 0.049 | 0.131 | −0.049 | 5.14 | 0.545 | 0.045 | 3.885 | 0.381 | 0.078 |
| 10. | Network expansion for RES | - | 0 | 0 | 0 | 0 | −0.003 | −0.003 | −0.139 | −0.123 | 0 | 0 |
| 11. | Cost of Market Operator | 0.52 | - | - | - | 0 | 0 | 0 | 0 | 0 | 0 | 0 |
| 12. | Administrative costs | - | 0.14 | 0.14 | 0.14 | 0.14 | 0.14 | 0.162 | 0.162 | 0.162 | 0.195 | 0.183 |
| 13. | Interest income | - | 0 | 0 | −0.17 | −0.23 | 0 | 0 | 0 | 0 | 0 | 0 |
| 14. | Interest | - | - | - | - | - | - | 0.241 | 0.05 | 0.034 | 0.033 | 0.046 |
| 15. | Connection revenues (part paid by RES) | 0 | 0 | −0.31 | - | - | −1.47 | 0 | −0.049 | 0 | 0 | 0 |
| 16. | Compensation for the solar producers | - | - | - | - | 1.001 | 2.436 | 0.022 | 0.035 | 0 | 0 | 0 |
| 17. | The Law on Electricity article 741 (2) provides return of PSO funds | - | - | - | - | - | - | - | - | - | - | 15.545 |
| 18. | PSO budget | 130.82 | 179.62 | 210.75 | 267.407 | 191.452 | 158.171 | 138.944 | 145.784 | 145.114 | 108.968 | 106.869 |
| 19. | Imbalance of last year | −5.79 | −1.85 | −1.18 | −17.26 | 6.793 | 1.91 | 14.072 | 0.459 | 0.157 | −9.392 | −30.28 |
| 20. | PSO budget (actual) | 125.03 | 177.77 | 209.58 | 250.15 | 198.24 | 160.081 | 153.016 | 146.243 | 145.271 | 99.576 | 76.589 |
Appendix D

Figure A1.
Irish PSO levy support mechanism and supported technologies (created by the authors, based on [101]).
Appendix E

Figure A2.
Payers of the PSO levy in Greece (designed by the authors, based on [129]).
References
- Yergin, D. Ensuring energy security. Foreign Aff. 2006, 85, 69–82. [Google Scholar] [CrossRef]
- Yergin, D. Energy Security in the 1990s. Foreign Aff. 1988, 67, 110. [Google Scholar] [CrossRef]
- Yan, Q.Y.; Wang, Y.H.; Qin, G.Y.; Zhu, J.Y.; Zidonis, Z. Short-term load forecasting based on improved particle swarm optimisation and long short-term memory network. Transform. Bus. Econ. 2021, 20, 154–177. [Google Scholar]
- Chen, S.X.; Huang, J.B. Forecasting China’s primary energy demand based on an improved AI model. Chin. J. Popul. Resour. Environ. 2018, 16, 36–48. [Google Scholar]
- Karakara, A.A.; Osabuohien, E.S.; Asongu, S. Domestic energy consumption in Ghana: Deprivation versus likelihood of access. Manag. Environ. Qual. 2021, 32, 804–821. [Google Scholar] [CrossRef]
- Jamasb, T.; Pollitt, M. Electricity market reform in the European Union: Review of progress toward liberalization & integration. Energy J. 2005, 26, 11–41. [Google Scholar]
- Bigerna, S.; Bollino, C.A.; Galkin, P. Balancing energy security priorities: Portfolio optimization approach to oil imports. Appl. Econ. 2021, 53, 555–574. [Google Scholar] [CrossRef]
- Ashaye, O.R.; Alharahsheh, H.H.; Pius, A. Energy security and economic development. In ICT Solutions for Improving Smart Communities in Asia; IGI Global: London, UK, 2021; pp. 151–161. [Google Scholar]
- Lixia, Y. Energy Security: Concepts, Frameworks and Indicators. In Energy Security in Times of Economic Transition: Lessons from China; Emerald Publishing Limited: Bingley, UK, 2021. [Google Scholar]
- Srivastav, A. Energy Security and Sustainability: An Overview. Energy Dyn. Clim. Mitig. 2021, 1, 1–31. [Google Scholar]
- Strielkowski, W.; Veinbender, T.; Tvaronavičienė, M.; Lace, N. Economic efficiency and energy security of smart cities. Econ. Res. Ekon. Istraživanja 2020, 33, 788–803. [Google Scholar] [CrossRef]
- Sutrisno, A.; Nomaler, Ṏ.; Alkemade, F. Has the global expansion of energy markets truly improved energy security? Energy Policy 2021, 148, 111931. [Google Scholar] [CrossRef]
- Kamyk, J.; Kot-Niewiadomska, A.; Galos, K. The criticality of crude oil for energy security: A case of Poland. Energy 2021, 220, 119707. [Google Scholar] [CrossRef]
- Desogus, E. Modelling the Role of Oil in the Italian Energy Security. Ph.D. Thesis, Politecnico di Torino, Torino, Italy, 2020. [Google Scholar]
- Nepal, R.; Paija, N.; Tyagi, B.; Harvie, C. Energy security, economic growth and environmental sustainability in India: Does FDI and trade openness play a role? J. Environ. Manag. 2021, 281, 111886. [Google Scholar] [CrossRef] [PubMed]
- Ostergaard, J.; Ziras, C.; Bindner, H.W.; Kazempour, J.; Marinelli, M.; Markussen, P.; Christensen, J.S. Energy Security through Demand-Side Flexibility: The Case of Denmark. IEEE Power Energy Mag. 2021, 19, 46–55. [Google Scholar] [CrossRef]
- Xiao, H.; Zhang, Z.; Wang, A.; Ren, J. Evaluating Energy Security in China: A Subnational Analysis. In China’s Energy Security: Analysis, Assessment and Improvement; World Scientific Publishing Europe Ltd.: Singapore, 2021; pp. 119–137. [Google Scholar]
- Erahman, Q.F.; Purwanto, W.W. Energy security: A case study of Indonesia. In Energy and Environmental Security in Developing Countries; Springer: Cham, Switzerland, 2021; pp. 49–74. [Google Scholar]
- Cîrdei, I.A. EU Energy security at a glance: The evolution of the situation between 2014–2018. Land Forces Acad. Rev. 2021, 26, 1–8. [Google Scholar] [CrossRef]
- Fuentes, S.; Villafafila-Robles, R.; Rull-Duran, J.; Galceran-Arellano, S. Composed Index for the Evaluation of Energy Security in Power Systems within the frame of Energy Transitions–The case of Latin America and the Caribbean. Energies 2021, 14, 2467. [Google Scholar] [CrossRef]
- Malik, S.; Qasim, M.; Saeed, H.; Chang, Y.; Taghizadeh-Hesary, F. Energy security in Pakistan: Perspectives and policy implications from a quantitative analysis. Energy Policy 2020, 144, 111552. [Google Scholar] [CrossRef]
- Karatayev, M.; Hall, S. Establishing and comparing energy security trends in resource-rich exporting nations (Russia and the Caspian Sea region). Resour. Policy 2020, 68, 101746. [Google Scholar] [CrossRef] [PubMed]
- Bekhrad, K.; Aslani, A.; Mazzuca-Sobczuk, T. Energy security in Andalusia: The role of renewable energy sources. Case Stud. Chem. Environ. Eng. 2020, 1, 100001. [Google Scholar] [CrossRef]
- Farrell, N.; Lyons, S. The distributional impact of the Irish public service obligation levy on electricity consumption. MPRA 2014, 1, 1–31. [Google Scholar]
- Skok, M.; Mileta, D.; Baricevic, T. Short term forecasting the electricity load for the Croatian supplier under public service obligation. In Proceedings of the 23rd International Conference on Electricity Distribution (CIRED 2015), Lyon, France, 15–18 June 2015; p. 1. [Google Scholar]
- Karova, R. Understanding the Public Service Obligation in the Electricity Sector. Lessons for the Contracting Parties of the Energy Community Treaty. Eur. Energy J. 2012, 2, 53–63. [Google Scholar]
- Rusche, T.M. The production of electricity from renewable energy sources as a public service obligation. J. Eur. Environ. Plan. Law 2006, 3, 486–499. [Google Scholar] [CrossRef]
- Simoglou, C.K.; Biskas, P.N.; Bakirtzis, A.G. Impact of increased RES penetration on the operation of the Greek electricity market. IET 2010, 1, 1–7. [Google Scholar]
- Simoglou, C.K.; Biskas, P.N.; Vagropoulos, S.I.; Bakirtzis, A.G. Electricity market models and RES integration: The Greek case. Energy Policy 2014, 67, 531–542. [Google Scholar] [CrossRef]
- Loumakis, S.; Giannini, E.; Maroulis, Z. Renewable energy sources penetration in Greece: Characteristics and seasonal variation of the electricity demand share covering. Energie 2019, 12, 2441. [Google Scholar] [CrossRef]
- Brunekreeft, G.; Buchmann, M.; Meyer, R. New Developments in Electricity Markets Following Large-Scale Integration of Renewable Energy. In The Routledge Companion to Network Industries; Routledge: Abingdon, UK, 2015; Volume 37. [Google Scholar]
- Gerres, T.; Ávila, J.P.C.; Martínez, F.M.; Abbad, M.R.; Arín, R.C.; Miralles, Á.S. Rethinking the electricity market design: Remuneration mechanisms to reach high RES shares. Results from a Spanish case study. Energy Policy 2019, 129, 1320–1330. [Google Scholar] [CrossRef]
- Kowalska-Pyzalska, A. Do consumers want to pay for green electricity? A case study from Poland. Sustainability 2019, 11, 1310. [Google Scholar] [CrossRef]
- Akcura, E. Mandatory versus voluntary payment for green electricity. Ecol. Econ. 2015, 116, 84–94. [Google Scholar] [CrossRef]
- Loreck, C.; Matthes, F.C.; Hermann, H.; Jung, F.; Emele, L.; Cook, V. Short Analysis of the Increase of the German EEG Surcharge for 2013; Öko-Institut eV: Berlin, Germany, 2012. [Google Scholar]
- Clifford, E.; Clancy, M. Impact of Wind Generation on Wholesale Electricity Costs in 2011; SEAI/EirGrid: Dublin, Ireland, 2011. [Google Scholar]
- Di Cosmo, V.; Lynch, M.Á. Competition and the single electricity market: Which lessons for Ireland? Util. Policy 2016, 41, 40–47. [Google Scholar] [CrossRef]
- Gaffney, F.; Deane, J.P.; Gallachóir, B.Ó. Reconciling high renewable electricity ambitions with market economics and system operation: Lessons from Ireland’s power system. Energy Strategy Rev. 2019, 26, 100381. [Google Scholar] [CrossRef]
- Albertsen, L.H.; Andersen, M.; Boscán, L.R.; Santos, A.Q. Implementing dynamic electricity taxation in Denmark. Energy Policy 2020, 143, 111543. [Google Scholar] [CrossRef]
- Ecofys. Prices and Costs of EU Energy. Annex 1: Country Descriptions. 2016. Available online: https://ec.europa.eu/energy/sites/default/files/documents/annex1_ecofys2016.pdf (accessed on 20 March 2021).
- Kitzing, L.; Katz, J.; Schröder, S.T.; Morthorst, P.E.; Andersen, F.M. The Residential Electricity Sector in Denmark: A Description of Current Conditions; Technical University of Denmark: Lyngby, Denmark, 2016. [Google Scholar]
- Harker, M.; Kreutzmann, A.; Waddams, C. Public Service Obligations and Competition; Cerre Final Report; Centre on Regulation in Europe: Brussels, Belgium, 2013. [Google Scholar]
- Nowak, B. The electricity and gas sector in the EU: The dilemmas of public service obligations in the context of state aid. Yearb. Pol. Eur. Stud. 2006, 10, 151–167. [Google Scholar]
- Kirzner, I.M. Method, Process, and Austrian Economics; Lexington Books: Lexington, MA, USA, 1982. [Google Scholar]
- Foss, N.J.; Klein, P.G. Organizing Entrepreneurial Judgment: A New Approach to the Firm; Cambridge University Press: Cambridge, UK, 2012. [Google Scholar]
- Leitao, T.M.; Cadete, E.M. Public service obligations in the electricity and gas sectors: Portugal. Int. Energy Law Tax. Rev. 2004, 1, 22–26. [Google Scholar]
- Atiyas, I.; Dutz, M. Competition and regulatory reform in the Turkish electricity industry. In Proceedings of the A Paper Prepared for Presentation at the Conference on EU Accession, Ankara, Turkey, 10–11 May 2003. [Google Scholar]
- PwC Enterprise Advisory. European Comparison of Electricity and Gas Prices for Large Industrial Consumers; PwC Enterprise Advisory: Brussels, Belgium,, 2019. [Google Scholar]
- Eurostat. Electricity Prices—Price Systems 2006. 2007. Available online: https://ec.europa.eu/eurostat/documents/3217494/5620104/KS-ER-07-001-EN.PDF.pdf/09aa5280-7432-47d5-b4df-17daec6226e0?t=1414769804000 (accessed on 20 March 2021).
- Odgaard, O. The green electrcity market in Denmark: Quotas, certificates and international trade. In Proceedings of the Workshop on Best Practices in Policies and Measures International Institute for Sustainable Development, Copenhagen, Denmark, 11–13 April 2000; p. 13. [Google Scholar]
- Bobinaitė, V.; Konstantinavčiūtė, I. Does electricity from renewable energy sources reduce electricity market price in Lithuania? Electr. Control. Technol. 2014, 7, 104. [Google Scholar]
- Vasilakos, N. Energy transition challenges and development priorities for the Greek energy sector in the coming decade. Renew. Energy Law Policy Rev. 2019, 9, 32–38. [Google Scholar] [CrossRef]
- Farrell, N.; Lyons, S. Who should pay for renewable energy? Comparing the household impacts of different policy mechanisms in Ireland. Energy Res. Soc. Sci. 2015, 7, 31–42. [Google Scholar] [CrossRef]
- Finger, M.; Finon, D. From the “public service” model to the “universal service” obligation. In Handbook of Liberalised Infrastructure Sectors; Edward Elgar Publisher: London, UK, 2011. [Google Scholar]
- Electricity Regulation Act. S.I. No. 217/2002 - Electricity Regulation Act 1999 (Public Service Obligations) Order 2002. 1999. Available online: http://www.irishstatutebook.ie/eli/2002/si/217/made/en/print#article16 (accessed on 19 March 2021).
- European Commission. Directive 2009/72/EC of The European Parliament and of The Council; European Commission: Brussels, Belgium, 2009. [Google Scholar]
- The Court of Justice of the European Communities. Case C-280/00 Altmark; Court of Justice: Hague, The Netherlands, 2003. [Google Scholar]
- Travers, N. Public service obligations and state aid: Is all really clear after Altmark. Eur. St. Aid LQ 2003, 387–392. [Google Scholar] [CrossRef]
- Azzuni, A.; Breyer, C. Definitions and dimensions of energy security: A literature review. Wiley Interdiscip. Rev. Energy Environ. 2018, 7, e268. [Google Scholar] [CrossRef]
- Winzer, C. Conceptualizing energy security. Energy Policy 2012, 46, 36–48. [Google Scholar] [CrossRef]
- Månsson, A.; Johansson, B.; Nilsson, L.J. Assessing energy security: An overview of commonly used methodologies. Energy 2014, 73, 1–14. [Google Scholar] [CrossRef]
- State of New Jersey Department of Environmental Protection. 2021. Available online: https://www.state.nj.us/dep/aqes/energysecurity.html (accessed on 23 March 2021).
- Leffler, M.P. National security. J. Am. Hist. 1990, 77, 143–152. [Google Scholar] [CrossRef]
- Paleri, P. National Security: Imperatives and Challenges; Tata McGraw-Hill: New Delhi, India, 2008. [Google Scholar]
- Allenby, B.R. Environmental security: Concept and implementation. Int. Political Sci. Rev. 2000, 21, 5–21. [Google Scholar] [CrossRef]
- De Wilde, J.H. Environmental security deconstructed. In Globalization and Environmental Challenges; Springer: Berlin/Heidelberg, Germany, 2008; pp. 595–602. [Google Scholar]
- Barnett, J. Environmental security. In The Routledge Handbook of New Security Studies; Routledge: London, UK, 2010; pp. 123–131. [Google Scholar]
- Tamošiūnienė, R.; Munteanu, C. Current research approaches to economic security. In Proceedings of the 1st International Conference on Business Management, Valencia, Spain, 4 June 2015. [Google Scholar]
- Cherp, A.; Jewell, J. The concept of energy security: Beyond the four as. Energy Policy 2014, 75, 415–421. [Google Scholar] [CrossRef]
- Hossain, Y.; Loring, P.A.; Marsik, T. Defining energy security in the rural North—Historical and contemporary perspectives from Alaska. Energy Res. Soc. Sci. 2016, 16, 89–97. [Google Scholar] [CrossRef]
- De Paoli, L.; Sacco, M. Evaluating security of energy supply in the EU: Implications for project appraisal. In Proceedings of the 34 th IAEE, International Conference, Stockholm, Sweden, 19–23 June 2011; pp. 19–23. [Google Scholar]
- Sovacool, B.K.; Mukherjee, I. Conceptualizing and measuring energy security: A synthesized approach. Energy 2011, 36, 5343–5355. [Google Scholar] [CrossRef]
- Ang, B.W.; Choong, W.L.; Ng, T.S. Energy security: Definitions, dimensions and indexes. Renew. Sustain. Energy Rev. 2015, 42, 1077–1093. [Google Scholar] [CrossRef]
- Štreimikiene, D. Ranking of Baltic States on progress towards the main energy security goals of European energy union strategy. J. Int. Stud. 2020, 13, 24–37. [Google Scholar] [CrossRef]
- Al Asbahi, A.A.M.H.; Gang, F.Z.; Iqbal, W.; Abass, Q.; Mohsin, M.; Iram, R. Novel approach of principal component analysis method to assess the national energy performance via Energy Trilemma Index. Energy Rep. 2019, 5, 704–713. [Google Scholar] [CrossRef]
- World Energy Council. 2021. Available online: https://www.worldenergy.org/transition-toolkit/world-energy-trilemma-index (accessed on 25 March 2021).
- Torraco, R.J. Writing integrative literature reviews: Guidelines and examples. Hum. Resour. Dev. Rev. 2005, 4, 356–367. [Google Scholar] [CrossRef]
- Stanley, T.D. Wheat from chaff: Meta-analysis as quantitative literature review. J. Econ. Perspect. 2001, 15, 131–150. [Google Scholar] [CrossRef]
- Davis, J.; Mengersen, K.; Bennett, S.; Mazerolle, L. Viewing systematic reviews and meta-analysis in social research through different lenses. SpringerPlus 2014, 3, 1–9. [Google Scholar] [CrossRef]
- Jahan, N.; Naveed, S.; Zeshan, M.; Tahir, M.A. How to conduct a systematic review: A narrative literature review. Cureus 2016, 8, 1–8. [Google Scholar] [CrossRef]
- Okoli, C.; Schabram, K. A Guide to Conducting a Systematic Literature Review of Information Systems Research; Information Systems Department Weatherhead School of Management Case Western Reserve University: Cleveland, OH, USA, 2010. [Google Scholar]
- Peterson, J.; Pearce, P.F.; Ferguson, L.A.; Langford, C.A. Understanding scoping reviews: Definition, purpose, and process. J. Am. Assoc. Nurse Pract. 2017, 29, 12–16. [Google Scholar] [CrossRef] [PubMed]
- Armitage, A.; Keeble-Allen, D. Undertaking a structured literature review or structuring a literature review: Tales from the field. In Proceedings of the 7th European Conference on Research Methodology for Business and Management Studies: ECRM2008, Regent’s College, London, UK, 19–20 June 2008; p. 35. [Google Scholar]
- Zacho, K.O.; Mosgaard, M.A. Understanding the role of waste prevention in local waste management: A literature review. Waste Manag. Res. 2016, 34, 980–994. [Google Scholar] [CrossRef] [PubMed]
- Harter, S.P. Search term combinations and retrieval overlap: A proposed methodology and case study. J. Am. Soc. Inf. Sci. 1990, 41, 132–146. [Google Scholar] [CrossRef]
- European Union. Living in the EU. 2021. Available online: https://europa.eu/european-union/about-eu/figures/living_en#quality-of-life (accessed on 25 March 2021).
- World Energy Council. Energy Trilemma Index, 2020 Country Rankings. 2020. Available online: https://trilemma.worldenergy.org/ (accessed on 2 February 2021).
- Noussan, M.; Hafner, M.; Campbell, L.; Lu, X.; Raimondi, P.P.; Zhu, E. Towards the Decarbonization of the Power Sector–A Comparison of China, the EU and the US Based on Historical Data (No. 2021.24); Fondazione Eni Enrico Mattei: Milan, Italy, 2021. [Google Scholar]
- Gaffney, F.; Deane, J.P.; Gallachóir, B.Ó. A 100 year review of electricity policy in Ireland (1916–2015). Energy Policy 2017, 105, 67–79. [Google Scholar] [CrossRef]
- Huber, C.; Ryan, L.; Gallachóir, B.Ó.; Resch, G.; Polaski, K.; Bazilian, M. Economic modelling of price support mechanisms for renewable energy: Case study on Ireland. Energy Policy 2007, 35, 1172–1185. [Google Scholar] [CrossRef]
- Sustainable Energy Authority of Ireland. Renewable Energy in Ireland, 2019 Report. 2019. Available online: https://www.seai.ie/publications/Renewable-Energy-in-Ireland-2019.pdf (accessed on 20 December 2021).
- Cleary, B.; Duffy, A.; Bach, B.; Vitina, A.; O’Connor, A.; Conlon, M. Estimating the electricity prices, generation costs and CO2 emissions of large scale wind energy exports from Ireland to Great Britain. Energy Policy 2016, 91, 38–48. [Google Scholar] [CrossRef]
- Brennan, N.; van Rensburg, T.M. Public preferences for wind farms involving electricity trade and citizen engagement in Ireland. Energy Policy 2020, 147, 111872. [Google Scholar] [CrossRef]
- González, A.; McKeogh, E.; Gallachoir, B.O. The role of hydrogen in high wind energy penetration electricity systems: The Irish case. Renew. Energy 2004, 29, 471–489. [Google Scholar] [CrossRef]
- Council of European Energy Regulators. Status Review of Renewable Support, Schemes in Europe for 2016 and 2017, Public Report. 2018. Available online: https://www.ceer.eu/documents/104400/-/-/80ff3127-8328-52c3-4d01-0acbdb2d3bed (accessed on 16 March 2020).
- Van Summeren, L.F.; Wieczorek, A.J.; Bombaerts, G.J.; Verbong, G.P. Community energy meets smart grids: Reviewing goals, structure, and roles in Virtual Power Plants in Ireland, Belgium and The Netherlands. Energy Res. Soc. Sci. 2020, 63, 101415. [Google Scholar] [CrossRef]
- Yue, X.; Patankar, N.; Decarolis, J.; Chiodi, A.; Rogan, F.; Deane, J.P.; O’Gallachoir, B. Least cost energy system pathways towards 100% renewable energy in Ireland by 2050. Energy 2020, 207, 118264. [Google Scholar] [CrossRef]
- European Network of Transmission System Operators for Electricity (ENTSO-E). ENTSO-E Overview of Transmission Tariffs in Europe: Synthesis 2019. Available online: https://eepublicdownloads.entsoe.eu/clean-documents/mcdocuments/190626_MC_TOP_7.2_TTO_Synthesis2019.pdf (accessed on 3 January 2021).
- World Bank. GDP Growth (Annual %). 2021. Available online: https://data.worldbank.org/indicator/NY.GDP.MKTP.KD.ZG (accessed on 25 March 2021).
- Statista. Gross Domestic Product (GDP) at Current Market Prices of Selected European Countries in 2019. 2020. Available online: https://www.statista.com/statistics/685925/gdp-of-european-countries/ (accessed on 25 March 2021).
- Commision for Regulation of Utilities of Ireland. CRU20086 PSO Decision Paper 2020/21. 2020. Available online: https://www.cru.ie/document_group/public-service-obligation-levy-2020-21/ (accessed on 19 December 2020).
- Newbery, D. Implications of the National Energy and Climate Plans for the Single Electricity Market of the Island of Ireland; Faculty of Economics, University of Cambridge: Cambridge, UK, 2020. [Google Scholar]
- Department of the Environment, Climate and Communications of Ireland Government. Policy of Renewable Electricity. 2020. Available online: https://www.gov.ie/en/policy-information/7498e-renewable-electricity/ (accessed on 10 January 2020).
- Department of the Environment, Climate and Communications of Ireland. Climate Action Plan. 2019. Available online: https://www.gov.ie/en/publication/ccb2e0-the-climate-action-plan-2019/ (accessed on 10 February 2021).
- Gorecki, P. The Internal EU Electricity Market: Implications for Ireland; Economic and Social Research Institute: New York, NY, USA, 2011. [Google Scholar]
- Commision for Regulation of Utilities of Ireland. CER/10/086, Public Service Obligation Levy 2010/11. 2010. Available online: https://www.cru.ie/wp-content/uploads/2010/07/cer10086.pdf (accessed on 20 December 2020).
- Commision for Regulation of Utilities of Ireland. CER/11/130, Public Service Obligation Levy 2011/12. 2011. Available online: https://www.cru.ie/wp-content/uploads/2011/07/cer11130.pdf (accessed on 20 December 2020).
- Commision for Regulation of Utilities of Ireland. Public Service Obligation Levy 2012/13. 2012. Available online: https://www.cru.ie/document_group/public-service-obligation-levy-2012-13/ (accessed on 20 December 2020).
- Commision for Regulation of Utilities of Ireland. Public Service Obligation Levy 2013/14. 2013. Available online: https://www.cru.ie/document_group/public-service-obligation-levy-2013-14/ (accessed on 19 December 2020).
- Commision for Regulation of Utilities of Ireland. CER/14/361, Public Service Obligation Levy 2014/2015. 2014. Available online: https://www.cru.ie/wp-content/uploads/2014/07/CER14361-PSO-Levy-Decision-Paper-2014-15-New.pdf (accessed on 20 December 2020).
- Commision for Regulation of Utilities of Ireland. CER/15/142, Public Service Obligation Levy 2015/2016. 2015. Available online: https://www.cru.ie/wp-content/uploads/2015/07/CER15142-PSO-Levy-2015-16-Decision-Paper.pdf (accessed on 19 December 2020).
- Commision for Regulation of Utilities of Ireland. CER/16/152, Public Service Obligation Levy 2016/17. 2016. Available online: https://www.cru.ie/wp-content/uploads/2016/07/CER16152-PSO-Levy-2016-17-Proposed-Decision-Paper.pdf (accessed on 19 December 2020).
- Commision for Regulation of Utilities of Ireland. CER/17/241 Public Service Obligation Levy 2017/18. 2017. Available online: https://www.cru.ie/wp-content/uploads/2017/06/CER17241-PSO-Levy-2017-18-Decision-Paper.pdf (accessed on 19 December 2020).
- Commision for Regulation of Utilities of Ireland. CRU18148 2018-19 PSO Decision Paper. 2018. Available online: https://www.cru.ie/document_group/pso-levy-2018-19/ (accessed on 19 December 2020).
- Commision for Regulation of Utilities of Ireland. CRU19094 PSO Decision Paper 2019-20. 2019. Available online: https://www.cru.ie/document_group/pso-levy-2019-2020/ (accessed on 19 December 2020).
- Irish Wind Energy Association. A 70% Renewable Electricity Vision for Ireland in 2030. 2018. Available online: https://www.iwea.com/images/files/70by30-report-final.pdf (accessed on 16 January 2021).
- Koecklina, M.T.; Fitwia, D.Z.; DeCarolisc, J.F.; Curtisa, J. Renewable Electricity Generation and Transmission Network Developments in Light of Public Opposition: Insights from Ireland; Working Paper No. 653; ESRI: Dublin, Ireland, 2020. [Google Scholar]
- Sustainable Energy Authority of Ireland. Ireland’s Energy Targets. Progress, Ambition & Impacts. Summary for Policy-Makers. 2016. Available online: https://www.seai.ie/publications/Ireland___s-Energy-Targets-Progress-Ambition-and-Impacts.pdf (accessed on 15 January 2021).
- World Energy Council. World Energy Trilemma Index 2019. Available online: https://www.worldenergy.org/assets/downloads/WETrilemma_2019_Full_Report_v4_pages.pdf (accessed on 16 January 2021).
- Commision for Regulation of Utilities of Ireland. Public Service Obligation (PSO) Levy 2009/2010—Proposed Decision Paper. 2009. Available online: https://www.cru.ie/document_group/public-service-obligation-pso-levy-2009-2010/ (accessed on 20 December 2020).
- World Energy Council. 2020. Available online: https://trilemma.worldenergy.org/#!/country-profile?country=Ireland&year=2020 (accessed on 12 March 2021).
- Central Statistics Office of Ireland. Labour Force Survey 2018. Available online: https://www.cso.ie/en/statistics/labourmarket/archive/releasearchive2018/ (accessed on 16 December 2020).
- Eurostat. Electricity Prices for Household Consumers, First Half 2021. Available online: http://appsso.eurostat.ec.europa.eu/ (accessed on 24 October 2021).
- Devitt, C.; Valeri, L. The effect of refit on irish wholesale electricity prices. Econ. Soc. Rev. 2011, 42, 343–369. [Google Scholar]
- Danias, N.; Swales, J.K.; McGregor, P. The Greek electricity market reforms: Political and regulatory considerations. Energy Policy 2013, 62, 1040–1047. [Google Scholar] [CrossRef]
- Iliadou, E.N. Electricity sector reform in Greece. Util. Policy 2009, 17, 76–87. [Google Scholar] [CrossRef]
- European Commission. C(2014) 6436 Final. State aid SA.32060 (2014/NN)—Greece; European Commission: Brussels, Belgium, 2014. [Google Scholar]
- Lavidas, G. Energy and socio-economic benefits from the development of wave energy in Greece. Renew. Energy 2019, 132, 1290–1300. [Google Scholar] [CrossRef]
- Regulatory Authority for Energy (RAE). Regulation and Performance of the Electricity Market and the Natural Gas Market in GREECE, in 2019. National Report. 2020. Available online: http://www.rae.gr/site/file/system/docs/ActionReports/2020;jsessionid=0ac113f330d920811f5e655d485d9505b7b6158b5e2d.e34Lah0LbNqMe38KahiNbxiRahf0n6jAmljGr5XDqQLvpAe (accessed on 14 February 2021).
- Hatziargyriou, N.; Margaris, I.; Stavropoulou, I.; Papathanassiou, S.; Dimeas, A. Noninterconnected island systems: The Greek case. IEEE Electrif. Mag. 2017, 5, 17–27. [Google Scholar] [CrossRef]
- Panagiotidou, M.; Xydis, G.; Koroneos, C. Environmental siting framework for wind farms: A case study in the Dodecanese Islands. Resources 2016, 5, 24. [Google Scholar] [CrossRef]
- Ministry of the Environment and Energy of Greece. National Energy and Climate Plan. 2019. Available online: https://ec.europa.eu/energy/sites/ener/files/el_final_necp_main_en.pdf (accessed on 21 February 2021).
- World Energy Council. 2020. Available online: https://trilemma.worldenergy.org/#!/country-profile?country=Greece&year=2020 (accessed on 11 March 2021).
- Vourdoubas, J. Use of renewable energy sources for energy generation in rural areas in the island of Crete, Greece. Eur. J. Environ. Earth Sci. 2020, 1, 1–7. [Google Scholar] [CrossRef]
- Vourdoubas, J. Islands with zero net carbon footprint due to electricity use. The case of Crete, Greece. Eur. J. Environ. Earth Sci. 2021, 2, 37–43. [Google Scholar] [CrossRef]
- Vlachou, A.; Pantelias, G. Energy Transitions and the Role of the EU ETS: The Case of Greece; Athens University of Economics and Business: Athens, Greece, 2020. [Google Scholar]
- Stavrakas, V.; Kleanthis, N.; & Flamos, A. An Ex-Post Assessment of RES-E Support in Greece by investigating the monetary flows and the causal relationships in the electricity market. Energies 2020, 13, 4575. [Google Scholar] [CrossRef]
- Mentis, D. Electrifying Greece with solar and wind energy. Therm. Sci. 2014, 18, 709–720. [Google Scholar] [CrossRef]
- Argenti, N.; Knight, D.M. Sun, wind, and the rebirth of extractive economies: Renewable energy investment and metanarratives of crisis in Greece. J. R. Anthropol. Inst. 2015, 21, 781–802. [Google Scholar] [CrossRef]
- Vardopoulos, I. Multi-criteria analysis for energy independence from renewable energy sources case study Zakynthos Island, Greece. Int. J. Environ. Sci. Dev. 2017, 8, 460–465. [Google Scholar] [CrossRef]
- Katsaprakakis, D.A.; Christakis, D.G. The exploitation of electricity production projects from Renewable Energy Sources for the social and economic development of remote communities. The case of Greece: An example to avoid. Renew. Sustain. Energy Rev. 2016, 54, 341–349. [Google Scholar] [CrossRef]
- Manolopoulos, D.; Kitsopoulos, K.; Kaldellis, J.K.; Bitzenis, A. The evolution of renewable energy sources in the electricity sector of Greece. Int. J. Hydrog. Energ. 2016, 41, 12659–12671. [Google Scholar] [CrossRef]
- Gioutsos, D.M.; Blok, K.; van Velzen, L.; Moorman, S. Cost-optimal electricity systems with increasing renewable energy penetration for islands across the globe. Appl. Energy 2018, 226, 437–449. [Google Scholar] [CrossRef]
- International Energy Agency (IEA). Energy Policies of IEA Countries. Greece. 2017 Review. Available online: https://euagenda.eu/upload/publications/untitled-110952-ea.pdf (accessed on 17 February 2021).
- Metaxas & Associates. Newsletter—Latest Legal Updates, Issue 23 November 2010. Available online: https://www.metaxaslaw.gr/wp-content/uploads/2018/04/NEWSLETTER_MA_Issue6_2010.pdf (accessed on 23 February 2021).
- Sovacool, B.K. Energy policymaking in Denmark: Implications for global energy security and sustainability. Energy Policy 2013, 61, 829–839. [Google Scholar] [CrossRef]
- Mendonça, M.; Lacey, S.; Hvelplund, F. Stability, participation and transparency in renewable energy policy: Lessons from Denmark and the United States. Policy Soc. 2009, 27, 379–398. [Google Scholar] [CrossRef]
- Czarny, R.M. The Kingdom of Denmark: Leader in energy efficiency. In The Nordic Dimension of Energy Security; Springer: Cham, Switzerland, 2020; pp. 123–145. [Google Scholar]
- Czarny, R.M. Norden states in the context of energy security: Fundamental issues. In The Nordic Dimension of Energy Security; Springer: Cham, Switzerland, 2020; pp. 101–121. [Google Scholar]
- Sovacool, B.K. A grounded comparison of energy security in Denmark, Brazil, Bangladesh, and China. In New Security Frontiers: Critical Energy and the Resource Challenge; Ashgate: Farnham, UK, 2012; pp. 67–92. [Google Scholar]
- Johnstone, P.; Rogge, K.S.; Kivimaa, P.; Fratini, C.F.; Primmer, E. Exploring the re-emergence of industrial policy: Perceptions regarding low-carbon energy transitions in Germany, the United Kingdom and Denmark. Energy Res. Soc. Sci. 2021, 74, 101889. [Google Scholar] [CrossRef]
- Oteman, M.; Wiering, M.; Helderman, J.K. The institutional space of community initiatives for renewable energy: A comparative case study of the Netherlands, Germany and Denmark. Energy Sustain. Soc. 2014, 4, 1–17. [Google Scholar] [CrossRef]
- United Nations Economic and Social Commission for Asia and the Pacific (UNESCAP). 2012. Available online: https://www.unescap.org/sites/default/files/16.%20CS-Denmark-renewable-energy-policies.pdf (accessed on 6 March 2021).
- Danish Ministry of Environment and Energy. Energy 21—The Danish Government’s Action Plan for Energy; 56.55.; Danish Ministry of Environment and Energy: Copenhagen, Denmark, 1996.
- Pinson, P.; Mitridati, L.; Ordoudis, C.; Østergaard, J. Towards fully renewable energy systems: Experience and trends in Denmark. CSEE J. Power energy Syst. 2017, 3, 26–35. [Google Scholar] [CrossRef]
- Shukla, S.; Sawyer, S. 30 Years of Policies for Wind Energy: Lessons from 12 wind Energy Markets; Technical Report, Renewable Generation, Support Policies and the Merit Order Effect 261; International Renewable Energy Agency (IRENA): Abu Dhabi, United Arab Emirates, 2012. [Google Scholar]
- Danish Energy Agency. Energy Policy Toolkit on System Integration of Wind Power. Experiences from Denmark. 2015. Available online: https://ens.dk/sites/ens.dk/files/Globalcooperation/system_integration_of_wp.pdf (accessed on 6 March 2021).
- Bundgaard, S.S.; Togeby, M.; Dyhr-Mikkelsen, K.; Sommer, T.; Kjærbye, V.H.; Larsen, A.E. Spending to save: Evaluation of the energy efficiency obligation in Denmark. ECEEE Summer Study 2013 Proc. 2013, 1, 1997–2006. [Google Scholar]
- Danish Ministry of Climate, Energy and Utilities. Denmark’s Integrated National Energy and Climate Plan. 2019. Available online: https://ec.europa.eu/energy/sites/ener/files/documents/dk_final_necp_main_en.pdf (accessed on 11 March 2021).
- Organisation for Economic Co-Operation and Development (OECD). Fossil Fuel Support Country Note. Denmark. 2020. Available online: https://www.oecd.org/fossil-fuels/data/ (accessed on 6 March 2021).
- Organisation for Economic Co-Operation and Development (OECD). Regulatory Reform in Denmark. Regulatory Reform in the Electricity Sector. 2000. Available online: https://www.oecd.org/denmark/2510666.pdf (accessed on 6 March 2021).
- Ropenus, S.; Jacobsen, H.K. A Snapshot of The Danish Energy Transition: Objectives, Markets, Grid, Support Schemes and Acceptance; Agora Energiewende: Berlin, Germany, 2015; Volume 1, pp. 1–74. [Google Scholar]
- Danish Ministry of Energy, Utilities and Climate. Denmark: Energy and Climate Pioneer. Status of the Green Transition. 2018. Available online: https://en.kefm.dk/media/7127/denmark_energy_and_climate_pioneer_pdfa.pdf (accessed on 11 March 2021).
- Dromacque, C. European Residential Energy Price Report; VaasaETT: Helsinki, Finland, 2013. [Google Scholar]
- Danish Energy Agency. Denmark’s Energy and Climate Outlook. 2019. Available online: https://ens.dk/sites/ens.dk/files/Analyser/deco19.pdf (accessed on 11 March 2021).
- Basse, E.M. Environmental Law in Denmark; Kluwer Law International BV: Alphen aan den Rijn, The Netherlands, 2020. [Google Scholar]
- Energinet. PTX in Denmark before 2030. Short Term Potential of PtX in Denmark from a System Perspective. 2019. Available online: https://energinet.dk/-/media/8BF0CD597E1A457C8E9711B50EC2782A.PDF (accessed on 11 March 2021).
- Jacobsen, H.K.; Hevia-Koch, P.; Wolter, C. Nearshore and offshore wind development: Costs and competitive advantage exemplified by nearshore wind in Denmark. Energy Sustain. Dev. 2019, 50, 91–100. [Google Scholar] [CrossRef]
- Ladenburg, J.; Hevia-Koch, P.; Petrović, S.; Knapp, L. The offshore-onshore conundrum: Preferences for wind energy considering spatial data in Denmark. Renew. Sustain. Energy Rev. 2020, 121, 109711. [Google Scholar] [CrossRef]
- Berg, T.L.; Apostolou, D.; Enevoldsen, P. Analysis of the wind energy market in Denmark and future interactions with an emerging hydrogen market. Int. J. Hydrog. Energy 2021, 46, 146–156. [Google Scholar] [CrossRef]
- Jørgensen, M.L.; Anker, H.T.; Lassen, J. Distributive fairness and local acceptance of wind turbines: The role of compensation schemes. Energy Policy 2020, 138, 111294. [Google Scholar] [CrossRef]
- Koivisto, M.; Gea-Bermúdez, J.; Kanellas, P.; Das, K.; Sørensen, P. North Sea region energy system towards 2050: Integrated offshore grid and sector coupling drive offshore wind power installations. Wind. Energy Sci. 2020, 5, 1705–1712. [Google Scholar] [CrossRef]
- Lund, H.; Mathiesen, B.V. Energy system analysis of 100% renewable energy systems—The case of Denmark in years 2030 and 2050. Energy 2009, 34, 524–531. [Google Scholar] [CrossRef]
- Sovacool, B.K.; Tambo, T. Comparing consumer perceptions of energy security, policy, and low-carbon technology: Insights from Denmark. Energy Res. Soc. Sci. 2016, 11, 79–91. [Google Scholar] [CrossRef]
- Sovacool, B.K.; Brown, M.A. Competing dimensions of energy security: An international perspective. Annu. Rev. Environ. Resour. 2010, 35, 77–108. [Google Scholar] [CrossRef]
- World Energy Council. 2020. Available online: https://trilemma.worldenergy.org/#!/country-profile?country=Denmark&year=2020 (accessed on 11 March 2021).
- Ignatov, A. Analysis of the energy security of the European union and the related policy framework. Glob. Econ. J. 2020, 20, 2050005. [Google Scholar] [CrossRef]
- Maigre, M. Energy Security Concerns of the Baltic States. International Center for Defense Studies. Tallinn. 2010. Available online: http://www.icds.ee/fileadmin/failid/Merle_Maigre-Energy_Security_Concers_of_the_Baltic_States.pdf (accessed on 9 March 2021).
- Pipilaite, A. Lithuania. EEJ 2012, 2, 57. [Google Scholar]
- Dudzevičiūtė, G. Lithuanian security of energy supply and consumption in the context of the European Union countries. Whither Our Econ. 2012, 32, 32–38. [Google Scholar]
- Fairley, P. The great Baltic disconnect. IEEE Spectr. 2015, 52, 11–13. [Google Scholar]
- Streimikiene, D.; Burneikis, J.; Punys, P. Review of renewable energy use in Lithuania. Renew. Sustain. Energy Rev. 2005, 9, 29–49. [Google Scholar] [CrossRef]
- Gaigalis, V.; Katinas, V. Analysis of the renewable energy implementation and prediction prospects in compliance with the EU policy: A case of Lithuania. Renew. Energy 2020, 151, 1016–1027. [Google Scholar] [CrossRef]
- Galinis, A.; Martišauskas, L.; Jääskeläinen, J.; Olkkonen, V.; Syri, S.; Avgerinopoulos, G.; Lekavičius, V. Implications of carbon price paths on energy security in four Baltic region countries. Energy Strategy Rev. 2020, 30, 100509. [Google Scholar] [CrossRef]
- Švedas, R. EU energy Island–Characteristics, threats, and how to break out of it: A case study of Lithuania. Lith. Annu. Strateg. Rev. 2017, 15, 179–209. [Google Scholar] [CrossRef]
- Pikšrytė, A.; Mažylis, L.; Povilaitis, R. Lithuanian Energy Strategy: European Context; Maj, W.J., Kwiatkiewicz, P., Eds.; WSB University: Poznan, Poland, 2015. [Google Scholar]
- Pérez, M.D.L.E.M.; Scholten, D.; Stegen, K.S. The multi-speed energy transition in Europe: Opportunities and challenges for EU energy security. Energy Strategy Rev. 2019, 26, 100415. [Google Scholar] [CrossRef]
- Blažauskas, N.; Włodarski, M.; Paulauskas, S. Perspectives for Offshore Wind Energy Development in the South-East Baltics; Klaipėda University: Klaipėda, Lithuania, 2013; pp. 1–54. [Google Scholar]
- Šneiderienė, A.; Ruginė, H. Green Technologies Development in the European Union and Lithuania. Manag. Theory Stud. Rural. Bus. Infrastruct. Dev. 2019, 41, 249–263. [Google Scholar] [CrossRef]
- Klevas, V.; Bobinaite, V.; Maciukaitis, M.; Tarvydas, D. Microeconomic analysis for the formation of renewable energy support policy: The case of wind power sector in lithuania. Eng. Econ. 2018, 29, 188–196. [Google Scholar] [CrossRef]
- Štreimikienė, D.; Strielkowski, W.; Bilan, Y.; Mikalauskas, I. Energy dependency and sustainable regional development in the Baltic states: A review. Geogr. Pannonica 2016, 20, 79–87. [Google Scholar] [CrossRef]
- Vileiniškytė, E. Energy Security in Terms of Renewable Energy (2004–2014): Case Studies of Lithuania and the Czech Republic. Ph.D. Thesis, Vytautas Magnus University, Kaunas, Lithuania, 2017. [Google Scholar]
- Bobinaite, V.; Juozapaviciene, A. Retail electricity price formation factors: Lithuanian case. Econ. Manag. 2012, 17, 110–129. [Google Scholar] [CrossRef][Green Version]
- Baltpool. 2021. Available online: https://www.baltpool.eu/en/what-is-pso/ (accessed on 13 March 2021).
- Baltpool. 2021. Available online: https://www.baltpool.eu/en/activity/ (accessed on 13 March 2021).
- National Energy Regulatory Council. The Sector of Renewable Energy Resources. 2019. Available online: https://www.regula.lt/en/Pages/the-sector-of-renewable-energy-resources.aspx (accessed on 13 March 2021).
- National Energy Regulatory Council. Public Service Obligation. 2019. Available online: http://www.regula.lt/elektra/Puslapiai/tarifai/elektros-energijos-kainos.aspx (accessed on 13 March 2021).
- World Energy Council. 2020. Available online: https://trilemma.worldenergy.org/#!/country-profile?country=Lithuania&year=2020 (accessed on 13 March 2021).
- European Commission. Note of Dg Energy & Transport on Directives 2003/54/Ec and 2003/55/Ec on the Internal Market In Electricity And Natural Gas. 2004. Available online: http://195.251.119.23/old/europe/sub4/public_service_obligations_DGTREN.pdf (accessed on 19 March 2021).
- European Commission. A Quality Framework for Services of General Interest in Europe, Brussels 20.12.2011 COM(2011)900 Final; European Comission: Brussels, Belgium, 2011. [Google Scholar]
- Jones, C. EU Energy Law, Volume 1: The Internal Energy Market; Claeys & Casteels Law Publishing: Deventer, The Netherlands, 2016. [Google Scholar]
- International Energy Agency. 2021. Available online: https://www.iea.org/topics/energy-security (accessed on 21 March 2021).
- Asia Pacific Energy Research Centre. A Quest for Energy Security in the 21st Century. 2007. Available online: https://aperc.or.jp/file/2010/9/26/APERC_2007_A_Quest_for_Energy_Security.pdf (accessed on 21 March 2021).
- World Economic Forum. Global Agenda Council on Energy Security 2012–2014. 2010. Available online: https://www.weforum.org/reports/global-agenda-council-energy-security-2012-2014 (accessed on 21 March 2021).
- Proedrou, F. EU Energy Security in the Gas Sector: Evolving Dynamics, Policy Dilemmas and Prospects; Ashgate Publishing, Ltd.: London, UK, 2013. [Google Scholar]
- National Energy Regulatory Council. Public Service Obligation. 2019. Available online: https://www.regula.lt/en/Pages/public-service-obligation.aspx (accessed on 13 March 2021).
Publisher’s Note: MDPI stays neutral with regard to jurisdictional claims in published maps and institutional affiliations. |
© 2021 by the authors. Licensee MDPI, Basel, Switzerland. This article is an open access article distributed under the terms and conditions of the Creative Commons Attribution (CC BY) license (https://creativecommons.org/licenses/by/4.0/).