1. Introduction
The issue of fuel interchangeability is more and more topical in various fields of human activity. Interest in this issue is mainly associated with fields such as transport, ecology, economy, or energy [
1].
The interchangeability of fuels means the possibility of fuel changing, by conservation of required energy and environmental criteria. The interchangeability of fuels can be assessed from a general point of view based on different parameters, such as burning rate, flame stability, combustion perfection, the temperature of combustion, amount, and composition of flue gas, most of which cannot be met at the same time [
2]. The interchangeability of fuels can be also realized based on criteria that are specific only for the specific type of fuel. This approach was applied by Ferguson et al. [
3].
Wobbe and Weaver applied different historical parameters and specific indexes for the determination of fuel interchangeability. Park et al. [
4] used another approach. They used the model of the combustion plant for an evaluation of interchangeability of different types of fossil fuels, including synthesis gas from the coal gasification, steel gases, and blast furnace gas (BFG). The realized evaluation was based on the criteria such as the emission trend (NOx), exhaust gas temperature distribution according to the combustor pressure, syngas composition, and dilution ratio at the fuel side.
Research on the interchangeability of fuels is now more and more actual for the field of heat production. One of the reasons is the trend of changeover from fossil energy to renewable energy; this fact causes the question of fuel interchangeability to be a necessity [
5].
The heat production process in heating plants is based on technologies that mostly use different categories of solid fuels as the primary energy source. Coal, wood, or biomass are most often used as fuels.
Fossil fuels are currently one of the most widely used energy sources in heating plants. During their combustion, a large amount of gaseous emissions and solid waste are generated. Current trends in fossil fuel combustion are aimed at making the combustion process as efficient as possible so that thermal energy is obtained most efficiently. At the same time, the main intention is to minimize the negative impact of the combustion process on the environment. In particular, the waste generated by fossil fuel combustion contains various types of substances, which can be toxic in certain cases.
The process of fossil fuel combustion is often influenced by different factors, so the combustion of the same type of fuel in different thermal power plants with different technologies is not the same. This issue, in terms of trace element behaviour, was researched by Lopez-Anton et al. [
6] as well as Klein et al. [
7]. Trace elements are an important factor in the fossil fuel combustion process and it is very important to recognize research about this problem, as presented by Bool and Helble [
8] or Querol et al. [
9]. Trace elements created during the combustion of fossil fuels can also be effectively searched in laboratory conditions. Helble [
10] searched trace elements using an isothermal laminar flow of tube furnace and sorted the resulting ash samples according to their size. The study of trace elements is also presented in [
11].
Different methods and approaches can be used for the evaluation of fuel interchangeability. Keramiotis et al. [
12] used an infrared thermography and gas chromatograph for the research of biogas interchangeability. Xiang et al. [
13] used a simulation approach with the use of software simulation tools. Pujihatma et al. [
14] used a similar approach for the evaluation of the interchangeability of the optimized model. Martinez et al. [
15] researched the interchangeability of natural gas based on statistical methods. Thus, it is possible to assume the suitability of statistical methods applied for the evaluation of interchangeability of other types of fuels, also fossil fuels. Based on this fact, the utilization of this method for the field of fuel interchangeability evaluation was searched in the field of heat production. The paper will present in more detail the presented approach, with the evaluation of 12 types of fuels; each fuel was evaluated based on 36 categories of parameters obtained from the ash after their combustion.
2. Materials and Methods
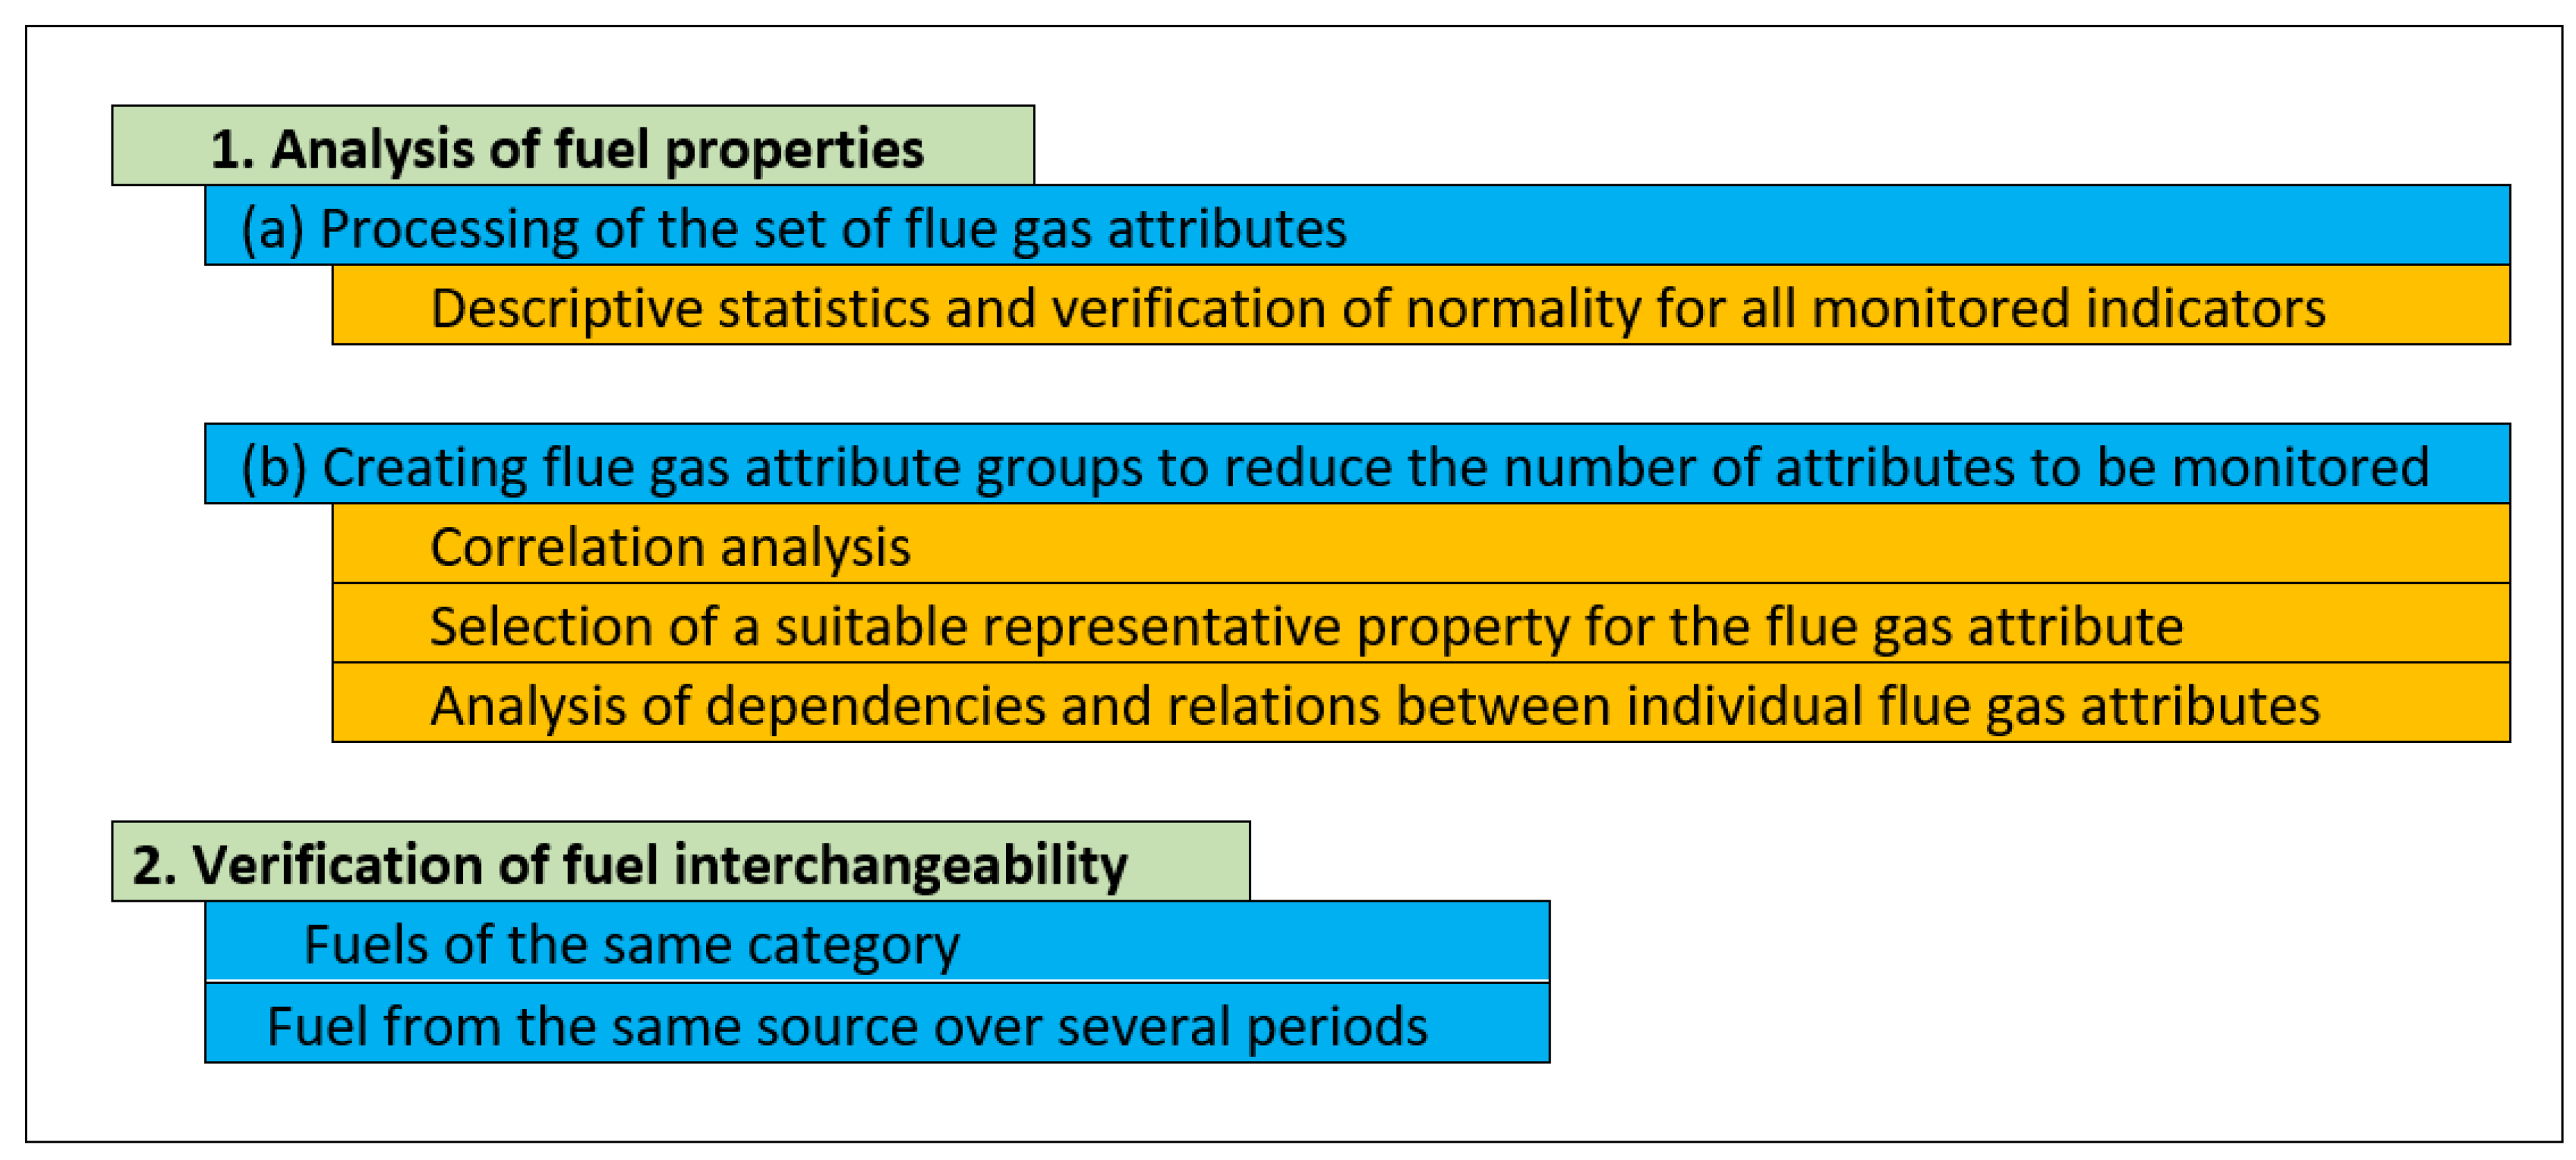
The investigation of fuel properties, according to
Figure 1, consisted of two steps. In the first step, the research focused on the analysis of the properties of individual fuels. Based on the processing of the set of flue gas attributes, descriptive statistics were first calculated with verification of normality for all monitored flue gas attributes.
According to the values of the flue gas attributes of individual fuels, in the future, it will be possible to evaluate its position and the percentile within each flue gas attribute for fuel after adding new fuel.
Percentile is a statistical parameter that determines the percentage within the population, where the measured value is from minimum to maximum [
16]. Subsequently, the research in the first step continued with the creation of flue gas attribute groups, with the aim to reduce the number of attributes to be monitored (lines in bold in
Table 1). An analysis of the dependencies and relations between these attributes has been carried out for the bold attributes of flue gases, from
Table 1.
In the second step, the interchangeability of the fuels in the same category was verified based on the flue gas attributes.
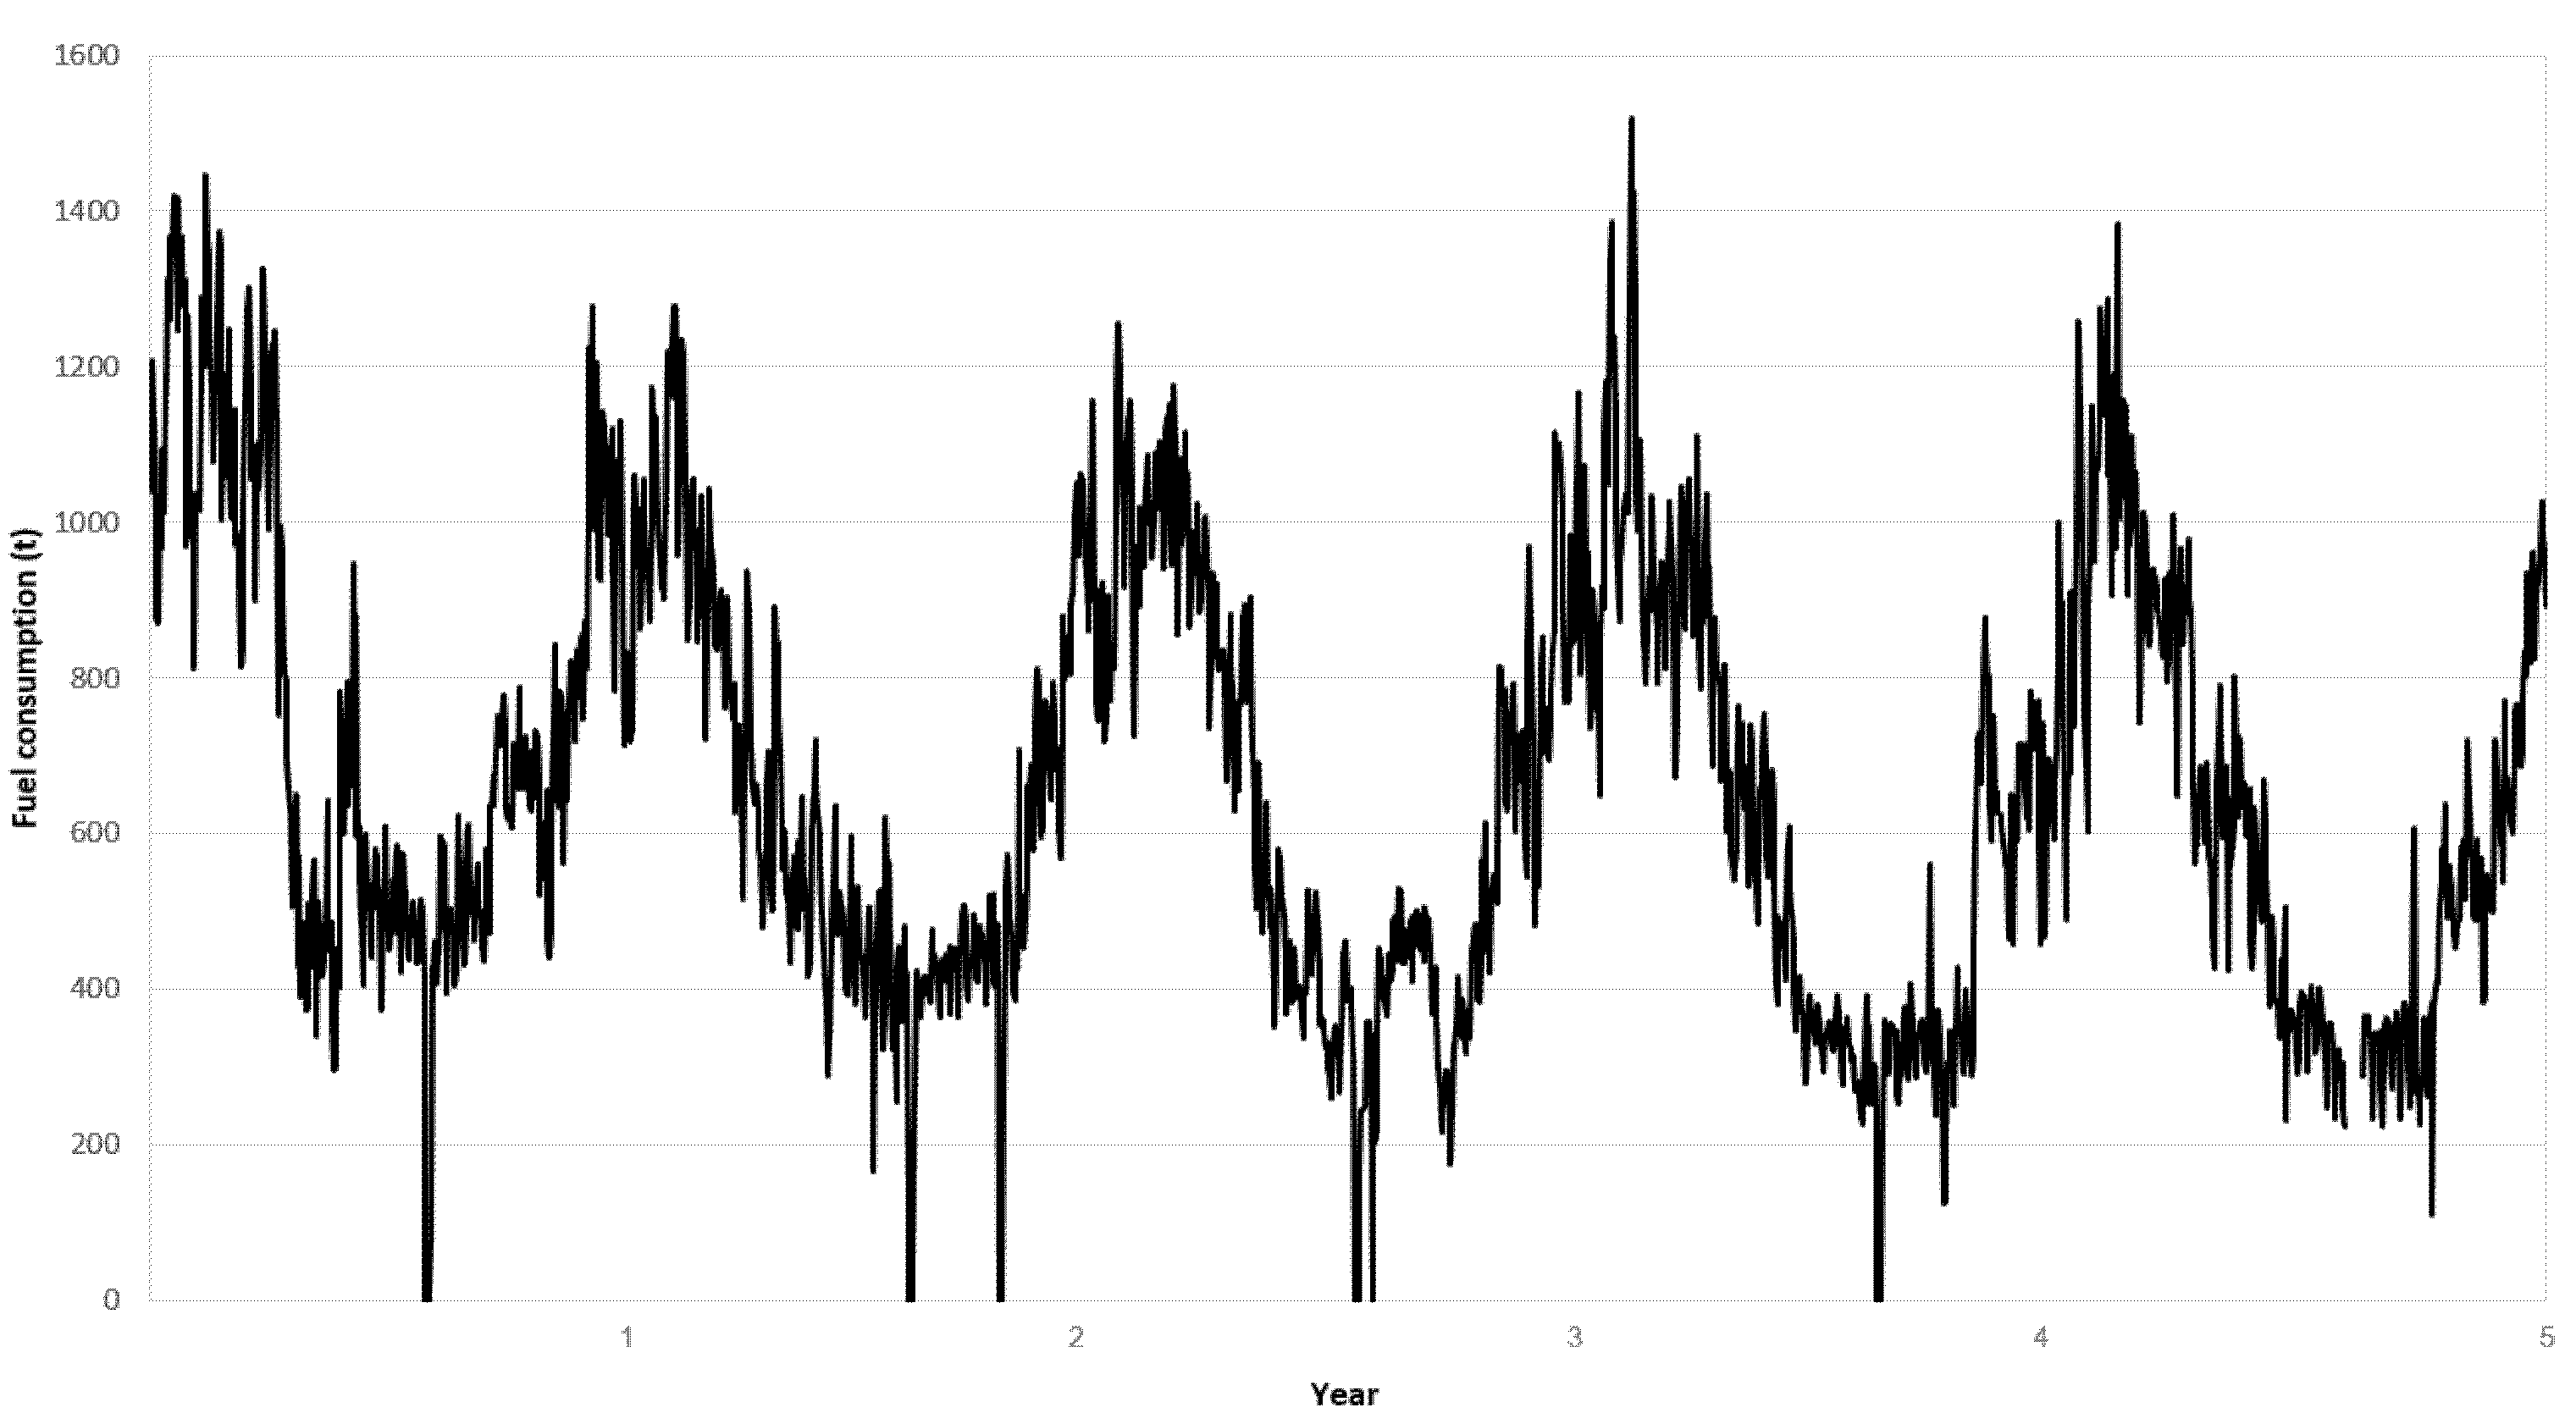
This methodology was verified within the research and was performed in a real heating plant, which was a suitable object for such verification. The given heating plant was chosen because its fuel consumption was approximately uniform and it was repeated cyclically. This fact is also confirmed by a record of the four-year cycle of the heating plant fuel consumption, which is shown in
Figure 2.
This consumption monitoring was carried out before the research of interchangeability of different fuel types.
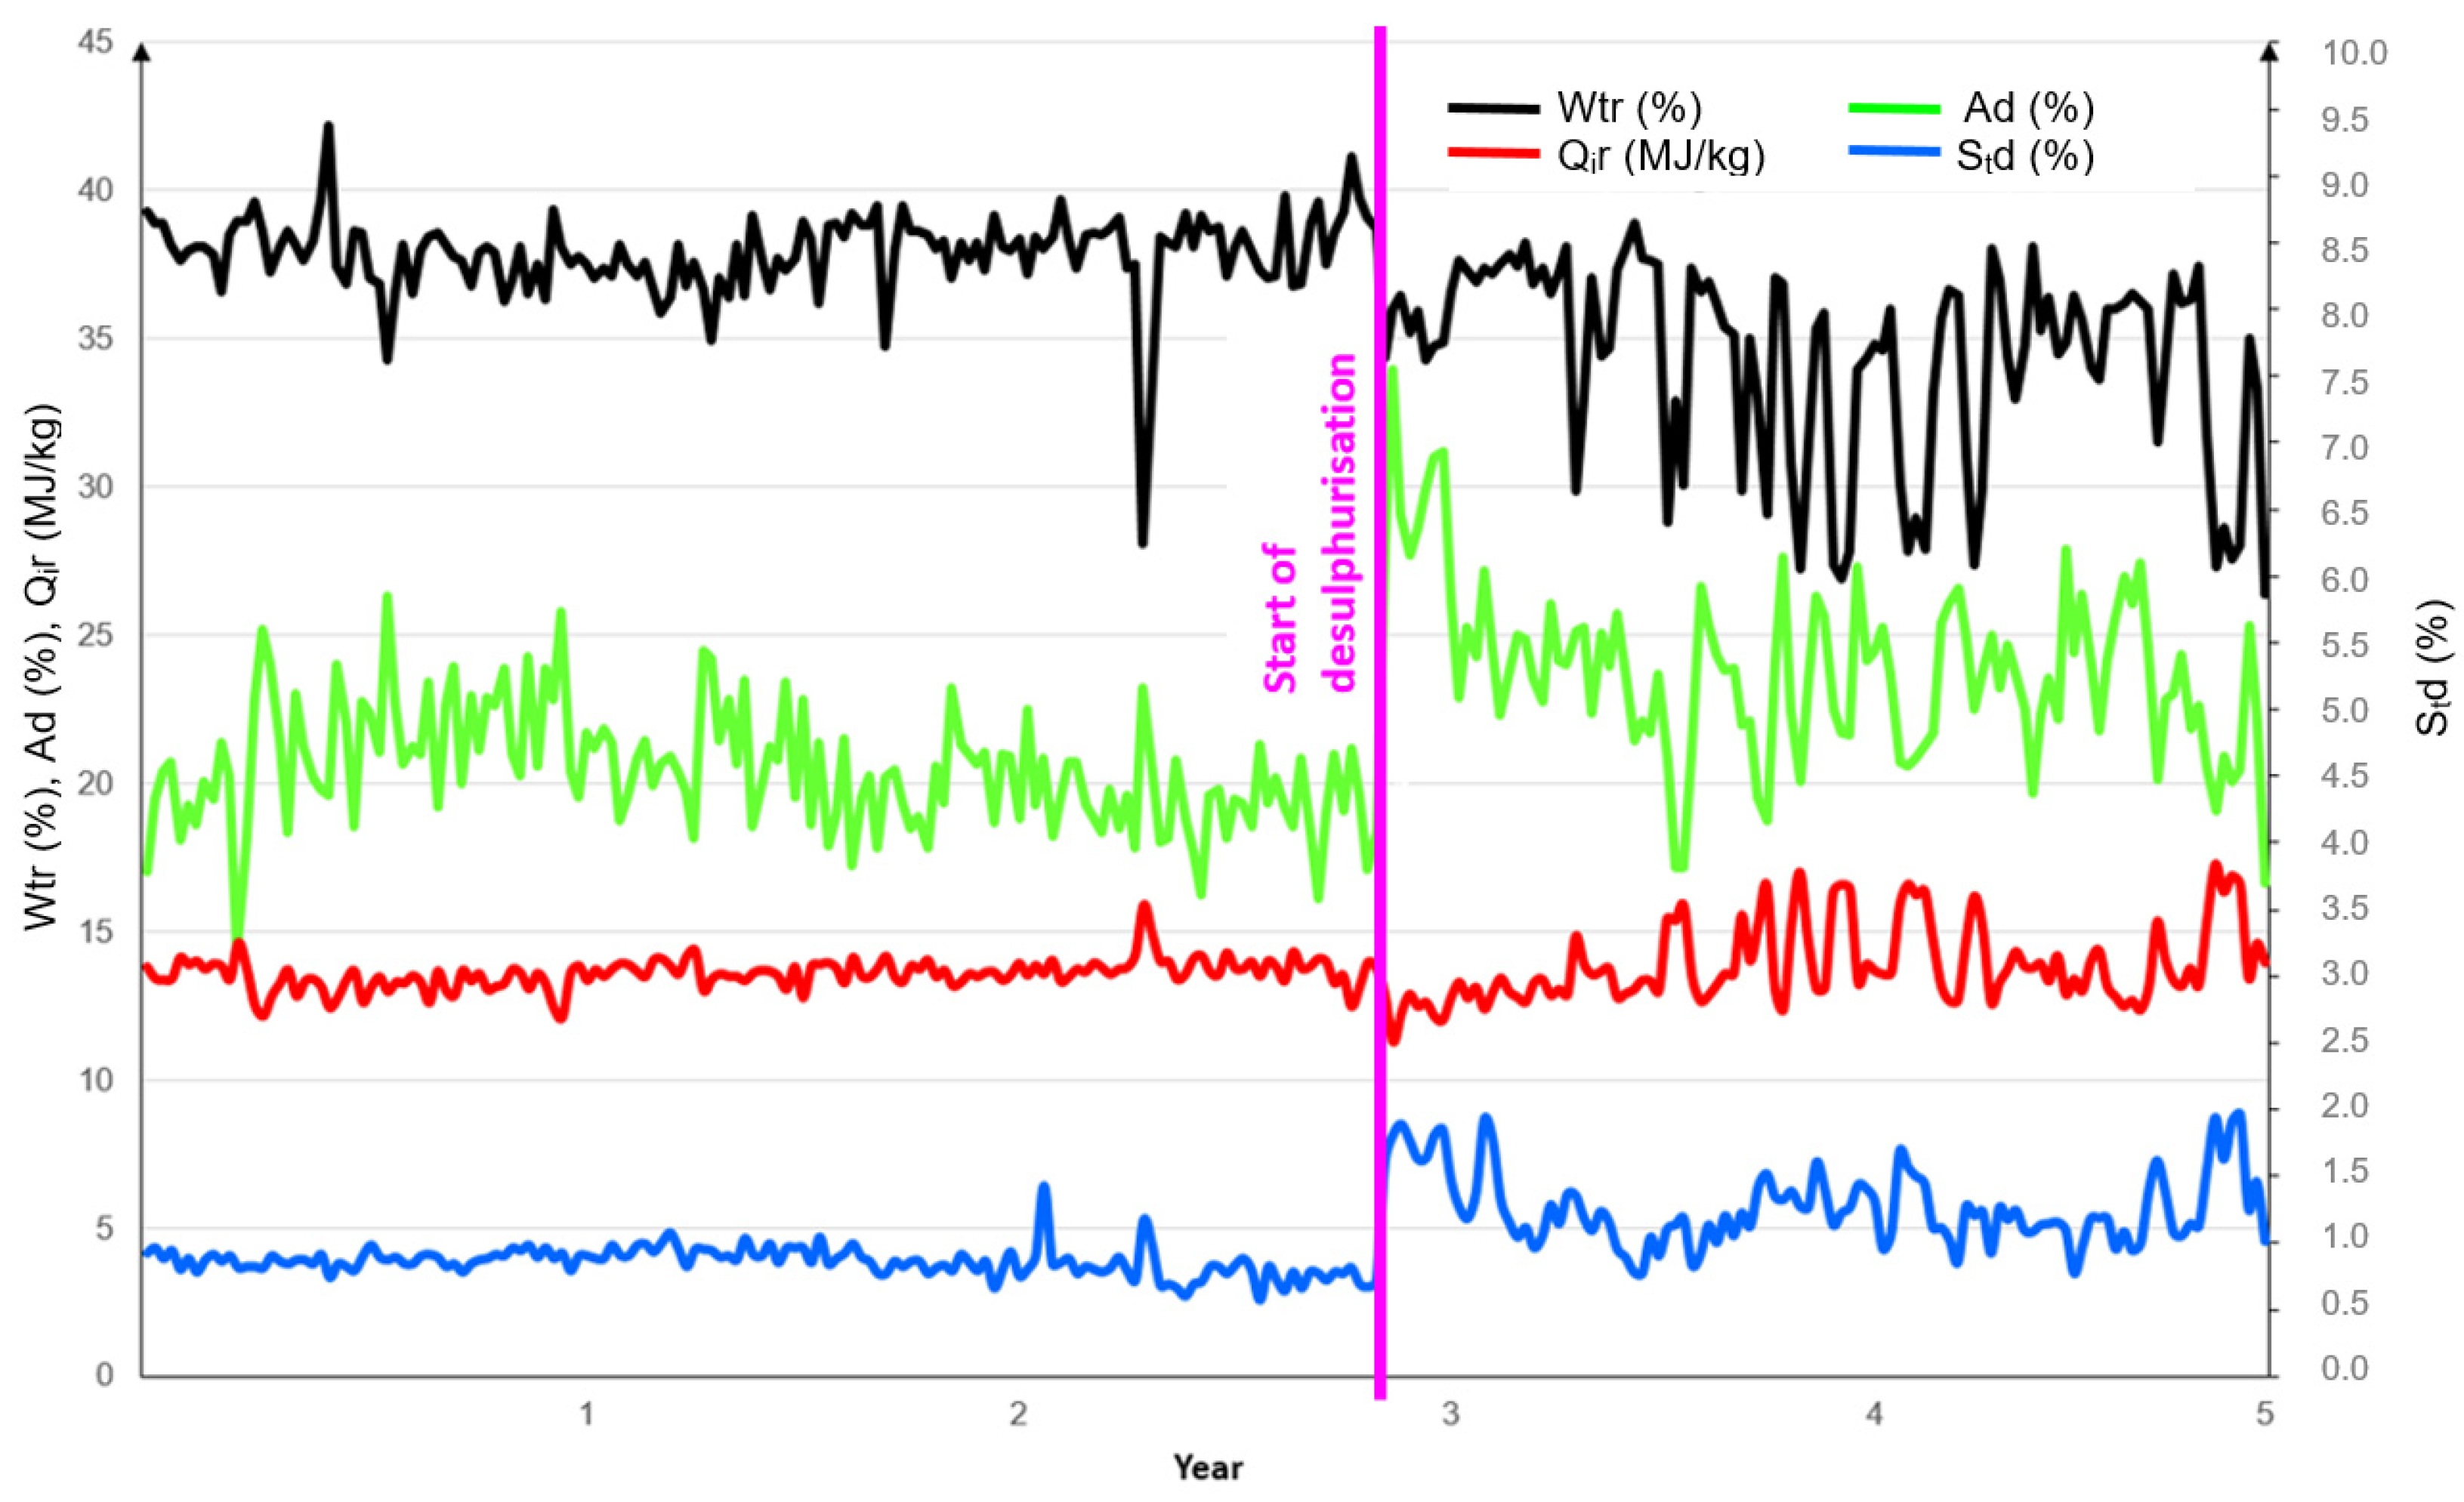
The following research, concerning properties of the selected fuels, was realized on the basis of measured ash attributes in the heating plant during the 5 years. Before starting the research of the fuel interchangeability in the given heating plant, the fuel used so far was analyzed based on the residues that remained after the combustion process. The main characteristics of the fuel are presented in
Figure 3. During the 3rd year it was installed, the desulphurization technology in the heating plant influenced the obtained parameters.
The methodology developed for verifying the fuel interchangeability was tested on the research sample of 12 fuels, which were applied in the given heating plant for 5 years.
The group of 12 samples of examined fuels consisted of: brown coal from several suppliers, wood chips, wood pellets, non-wood pellets, and two solid alternative fuels.
For each of the 12 fuel samples, 35 flue gas attributes were measured and assigned to separate flue gas attribute groups: ash content, the heat of combustion, calorific value, sulphur content, combustible matter content, water content, emission factor, carbon content, hydrogen content, nitrogen content, and oxygen content (
Table 1).
The following were analyzed:
Solid alternative fuels, designated as TAP1 and TAP2;
Biomass: wood chips, wood pellets, and non-wood pellets.
Furthermore, the interchangeability of the fuel-brown coal was verified. Coal from the same source was evaluated over several periods from the same supplier over several years, based on the attributes of their flue gases.
3. Results
A total of 35 flue attributes from 12 fuel samples were evaluated. The flue gas attributes were evaluated and grouped according to fuel properties—ash content, the heat of combustion and calorific value, sulphur content, water content, emission factor, carbon content, hydrogen content, nitrogen content, oxygen content, and combustible content.
3.1. Descriptive Fuel Statistics
Descriptive statistics and results of the Shapiro–Wilk test of flue gas attributes of compliance with the normal distribution are given in
Table 1. The tested null Hypothesis H0 was: the population is normally distributed. The highlighted
p-value means a rejection of the null hypothesis and the use of non-parametric tests for the corresponding data.
The following section lists the attributes for which the null hypothesis H0 on the normal distribution was rejected. This means that statistical parametric tests cannot be used for these attributes.
The population’s attributes of the flue gases that were not normally distributed are: Qsdaf-Combustion heat of pure combustible (MJ/kg), Stdaf-Sulphur in combustible (%), Smr-Specific sulphur content (g/MJ), Wh-Residual water (%), Ctdaf-Carbon in combustible (%), Nta-Nitrogen in the analytical sample (%), Ntd-Nitrogen in the anhydrous sample (%), Ntdaf-Nitrogen in combustible (%), Nr-Nitrogen in the original sample (%), Oda-Oxygen in the analytical sample (%), Odd-Oxygen in the anhydrous sample (%), Oddaf-Oxygen in the combustible (%), and Oder-Oxygen in the original sample (%).
The flue gas attributes, for which a normal distribution can be considered, are suitable for estimating the relationships between the individual flue gas attributes. The results from
Table 1 are discussed in detail in the discussion chapter.
3.2. Creating Groups of Flue Gas Attributes with the Aim to Reduce the Number of Monitored Attributes
For all of the flue gas attributes of the same property, their correlation was examined and one attribute was selected to be used in further analyses.
For flue gas attributes where the hypothesis the population is normally distributed was not rejected, the Pearson’s correlation coefficient (with the critical value of 0.532) was used to verify the correlation of the flue gas attribute pairs.
For the flue gas attribute pairs, at least one of which cannot be considered hypothesis, the population is normally distributed, the Spearman correlation coefficient (with the critical value of 0.587) was calculated.
Based on the mutual correlation of the flue gas attributes of the same property and the availability of the flue gas property attribute values, one attribute was chosen, which is used as a representative of the property in subsequent calculations.
3.3. Research of Relations between Flue Gas Attributes
The existence of mutual relations was investigated for the selected flue gas attributes (given in the previous step).
(a) Model: regression models for flue gas attribute pairs (linear or polynomial model of the maximum third degree) were used to analyze the relationships between the flue gas attribute values. The mathematical expression of the models is:
The linear model has the shape ;
Degree of a polynomial 2 is expressed by the equation ;
Degree of a polynomial 3, the member is added to the degree of a polynomial 2.
(b) Model evaluation: two model evaluation statistics—the F test of the model regression function and the Adjusted R-squared
R2 were used to evaluate model suitability. The F model regression function test [
17].
The null hypothesis of the statistical test is This means that all estimated parameters of the regression model, except the parameter , are statistically insignificant. is a constant, is the number of flue gas model attributes, except
The alternative hypothesis is : at least one parameter is not statistically insignificant where .
The test criterion is calculated according to the Equation (1):
where:
are the measured values (empirical),
are the modelled values (theoretical),
is the average of the measured values,
is the number of values from which the estimate of the flue gas attributes
to of the model was calculated.
The hypothesis H0 is rejected if the test criterion F is greater than the critical value for the test. The critical value of the Fisher distribution for significance level and the number of degrees of freedom and . .
If the hypothesis H0 is not rejected, the mathematical equation function is not suitable. In this case, we should change the function type. The significance level was chosen, it is the probability that the null hypothesis is valid and will be rejected.
The test result can also be evaluated using the test, determined as the probability of rejecting the null hypothesis if it is correct.
The value is compared with the value . The condition of acceptance of the model according to the F test result is that the value of is less than the significance level .
The other evaluation statistics is
calculated according to Equation (2):
The calculated value is the ratio of the variability of empirical values.
The components of the calculation are explained in Equation (1). To accept the model, the value R2 was required to be greater than 0.6.
Residues were calculated for each model and the proportions of residues and model values .
For the acceptance of the model, a condition has been established for the residues that the proportion of the model and actual value difference must be less than 0.25 for all values, which means that the model deviation percentage is less than 25%. In
Section 4.1.2, only models that meet the specified requirements are listed. For linear models, the correlation coefficient was calculated instead of Adjusted R-squared
R2.
3.4. Verification of Fuel Interchangeability
The Wilcoxon signed-rank sum test [
17] was used when data on brown coal from the same source were available for two periods, respectively, two alternatives of the same fuel category. The verified statistical hypothesis was:
H0: the difference between the pairs follows a symmetric distribution around zero,
H1: the difference between the pairs does not follow a symmetric distribution around zero.
The Friedman rank-sum test was used when data on brown coal from the same source were available for three or more periods, respectively three or more alternatives of the same fuel category.
Zero and alternative hypothesis:
Hypothesis 0 (H0). Differences in flue gas attribute values are random.
Hypothesis 1 (H1). Differences in flue gas attribute values are not random.
The evaluation of the test results was at the significance level using the value .
4. Discussion
The results obtained by the performed mathematical-statistical analysis will be presented and commented on in the next chapter. Besides individual descriptive statistics, the possibility of the interchangeability of individual fuels was also verified.
4.1. Processing of a Set of Flue Gas Attributes
This section of paper reviews the descriptive statistics for the sets of attributes of the same quality and the correlation examined among these. In case of significant correlation, it is enough to examine only one attribute, as the others can be obtained by derivation.
The results of processing the set of flue gas attributes, which contains descriptive statistics and verification of normality for all monitored indicators (
Table 1), are described in detail in the following subchapters.
4.1.1. Descriptive Statistics of the Flue Gas Ash Content Attributes
Aa Ash in the analytical sample (%)
Ad Ash in the anhydrous sample (%)
Ar Ash in the original sample (%)
The maximum values of all the flue gas attributes of the ash content were measured for brown coal from Severočeské doly a.s. of 2017. The maximum ash content in the analytical sample Aa was 38.91%, and was Ad 41.44% in the anhydrous sample. The lowest values of ash content were for wood pellets in the original sample Aa 1.91% and in the anhydrous sample Ad 2.05%. According to the statistics for skew (−0.42 to −0.51) and kurtosis (0 to −0.51), it can be stated that the flue gas attributes of the ash are symmetrical and have adequate kurtosis. This is also indicated by the position of the median and diameter, which are close to each other (for Ad, the average is 22.12, median 24.60). The Shapiro–Wilk test confirmed that the sets of values came from a population with a normal distribution. The Pearson’s correlation coefficient (
Table 2) was calculated to verify linear dependence. All of the flue gas attributes of the ash were strongly correlated with each other, as shown by the high correlation coefficient value.
Such correlation values allow, if necessary, to observe only one of the flue gas attributes of the ash content and to calculate the others according to a linear regression model. The Ad attribute will be used for the analysis of dependencies and relations between individual flue gas attributes.
4.1.2. Descriptive Statistics of the Flue Gas Attributes for Gross Heat and Calorific Value
Qas Combustion heat in the analytical sample (MJ/kg)
Qds Combustion heat in the anhydrous sample (MJ/kg)
Qir Net calorific value (MJ/kg)
Qsdaf Combustion heat of pure combustible (MJ/kg)
Qsr Combustion heat of the original sample (MJ/kg)
The combustion heat of pure Q
sdaf cannot be regarded as normally distributed (
Table 1). The values of the Pearson’s correlation coefficient for the other combustion gas attributes and calorific values with normal distribution are given in
Table 3.
It is obvious that the attribute Qas is correlated with the attributes of the flue gas of the combustion heat and the calorific value Qds, Qir, and Qsr. The correlation was not confirmed between the Qir and Qds flue gas attributes. For each pair of flue gas attributes, except for Qir and Qds, it is sufficient to observe only one of the flue gas attributes.
The Spearman correlation coefficient in
Table 4 was determined to track the relationship between the Q
sdaf attribute and other ones.
The results show that the Qsdaf attribute is not correlated with the Qir and Qsr attributes. The Qir attribute will thus be used to analyze dependencies and relations between individual flue gas attributes. For the Qir attribute, the minimum value of 10.28 MJ/kg was measured for brown coal PS2 Severočeské doly for 2017. The maximum value of 16.98 MJ/kg was measured for biomass. For the other two types of lignite, calorific values above 16 MJ/kg were found. The average value is 14.22 MJ/kg and the median is 13.98 MJ/kg, which are close values. The distribution is symmetrical, skew is −0.32 and adequately sharp, and the kurtosis coefficient is −0.39. The range is 6.7 MJ/kg.
4.1.3. Descriptive Statistics of the Flue Gas Attributes of the Sulphur Content
Sta Sulphur in the analytical sample (%)
Std Sulphur in the anhydrous sample (%)
Stdaf Sulphur in combustible (%)
Sr All sulphur in original sample (%)
Smr Specific sulphur content (g/MJ)
The attributes of the flue gas sulphur content S
tdaf and Smr do not come from a population with a normal distribution. The values of the Pearson’s coefficient (
Table 5) show a very strong correlation between the flue gas attributes of sulphur content S
ta, S
td, and Sr. All values are greater than 0.98.
For the flue gas attributes of the sulphur content, which cannot be considered as normally distributed—S
tdaf and Smr (
Table 1), the Spearman correlation coefficient (
Table 6) was calculated, of which all values are above 0.95. This indicates a strong correlation between the flue gas attributes of the sulphur content.
The Std attribute will thus be used to analyze dependencies and relations between individual flue gas attributes. The descriptive statistics for the Std attribute are:
A minimum value of 0.03% for wood chips and a maximum value of 2.83% for brown coal PS2 Severočeské doly for 2017.
The average value is 1.06% and the median is 1.08%.
A symmetrical distribution is assumed, but the value of the skew coefficient (skew) is 0.81, which is a slight asymmetry.
The kurtosis coefficient is 1.15, which is a sharper distribution.
4.1.4. Descriptive Statistics of the Flue Gas Attributes for Water Content
The Pearson’s correlation coefficient values for attributes of flue gases (
Table 7) water content show a linear dependence between attributes.
The flue gas water content attribute Wh does not come from a population with a normal distribution, so the Spearman correlation coefficient (
Table 8) was used to verify the correlation with the other flue gas water content attributes.
Except for the pair of flue gas attributes Wh and Wex, there is a linear dependence between the flue gas attributes of the water content. For the analysis of dependencies and relations between individual flue gas attributes, the attribute Wtr will be used, which can be used to describe all other flue gas content attributes using linear regression.
For the Wtr attribute, descriptive statistics are as follows:
A minimum value of 6.96% for wood pellets and a maximum value of 38.33% for brown coal from Sokolovská uhelná.
The range of values is 31.37.
The average value is 24.82 and the median is 28.25. This indicates a negative skew of −0.48. The kurtosis coefficient is −0.81, so the probability distribution is a flatter normal distribution.
4.1.5. Descriptive Statistics of the Flue Gas Attributes for Carbon Content
Cta Carbon in the analytical sample (%)
Ctd Carbon in the anhydrous sample (%)
Ctdaf Carbon in the combustible (%)
Cr Carbon in original sample (%)
The values of the Pearson’s correlation coefficient (
Table 9) confirm the linear relation between the flue gas attributes C
ta, C
td, and Cr.
The C
tdaf indicator does not come from a population with a normal distribution (
Table 1), so the Spearman correlation coefficient (
Table 10) was used to investigate the relationship between it and the other flue gas carbon content attributes. The results indicate that C
tdaf does not correlate with Cr.
For the analysis of dependencies and relations between individual flue gas attributes, the attribute Cr will be used. For the attribute Cr, the minimum value is 27.51% for PS2 Severočeské doly, and the maximum value is 45.40% for wood pellets. The average value is 38.1 and the median is 37.64. This indicates that the distribution is symmetrical. The kurtosis coefficient is −0.15 and the distribution is adequately sharp.
4.1.6. Descriptive Statistics of the Flue Gas Attributes for Hydrogen Content
Hta Hydrogen in the analytical sample (%);
Htd Hydrogen in anhydrous sample (%);
Htdaf Hydrogen in combustible (%);
Hr Hydrogen in the original sample (%).
All of the flue gas attributes of the hydrogen content originate from a population with a normal distribution. The values of Pearson’s correlation coefficient are displayed in
Table 11.
All of the flue gas attributes of the hydrogen content are correlated with each other and it is sufficient to observe only one indicator. Other indicators can be derived using a linear regression model. The attribute Hr will thus be used for the analysis of dependencies and relations between individual flue gas attributes. The values of the attribute Hr range from 2.80% for PS2 Severočeské doly brown coal to 5.92% for wood pellets. The average value is 4.21% and the median is 3.98%. The coefficient of asymmetry is 0.57 and the distribution is suitably symmetrical. The kurtosis coefficient is 0.04, so the distribution is as sharp as the normal distribution.
4.1.7. Descriptive Statistics of the Flue Gas Attributes for Nitrogen Content
Nta Nitrogen in the analytical sample (%);
Ntd Nitrogen in the anhydrous sample (%);
Ntdaf Nitrogen in combustible (%);
Nr Nitrogen in the original sample (%).
The null hypothesis of a normal population distribution was rejected for all nitrogen-containing flue gas attributes. Mutual relations between attributes were observed using the Spearman correlation coefficient. The results show that all flue gas attributes are correlated with each other (
Table 12).
For the analysis of dependencies and relations between individual flue gas attributes, the attribute Nr will be used. The attribute values range from 0.18% in wood chips to 2.89% in wood pellets. The average value is 0.82% and the median is 0.57%. These values are relatively close to each other, but are closer to the minimum than to the maximum. This determines the value of the asymmetry coefficient of 2.16, thus, more values are smaller than the average. The kurtosis coefficient 3.87 testifies to the flat distribution.
4.1.8. Descriptive Statistics of the Flue Gas Attributes for Oxygen Content
Oda Oxygen in the analytical sample (%);
Odd Oxygen in the anhydrous sample (%);
Oddaf Oxygen in combustible (%);
Odr Oxygen in the original sample (%).
For all of the flue gas attributes of the oxygen content, the null hypothesis of a normal population distribution was rejected (
Table 1), so the relative relations between them were monitored using the Spearman correlation coefficient, which results in all flue gas attributes correlating with each other (
Table 13).
The attribute Odr will be used for the analysis of dependencies and relations between individual flue gas attributes. Th values of the indicator range from 7.31% in brown coal from Sokolovská uhelná to 36.85% in wood pellets. The average value is 14.95% and the median is 9.53%. The variation between the median and the diameter is due to the composition of the fuel selection analyzed, as 8 out of 12 fuels are brown coal and the rest are biomass and alternative fuels. The proportion of oxygen in brown coal is about 7% to 12%. In other types of analyzed fuels, it is 19% to 29%. The asymmetry coefficient 1.19 corresponds to the described fact that more values are smaller than the average. The kurtosis coefficient 0.07 indicates a slightly flat distribution.
4.1.9. Descriptive Statistics of Other Flue Gas Attributes
The values of the attribute Vr range from 40.84% in wood chips to 91.13% in wood pellets. The average value is 57.12% and the median is 55.04%. These values are close to each other, but are closer to the minimum than to the maximum. This determines the value of the asymmetry coefficient of 1.07, thus, more values are smaller than the average. The kurtosis coefficient of 0.63 shows an adequate sharp distribution.
The values of the fem attribute range from 94.31% in one of the solid alternative fuels, to 104.33% in the wood chip. The average value is 97.92% and the median is 97.75%. These values are close to each other but are closer to the minimum than to the maximum. This determines the value of the asymmetric coefficient of 1.04, thus, more values are smaller than the average. The kurtosis coefficient 0.98 gives an adequate sharp distribution.
These flue gas attributes come from a population with a normal distribution. Both Vr and fem will be used to analyze dependencies and relations between individual flue gas attributes.
4.1.10. The Analysis of Dependencies and Relations between Individual Flue Gas Attributes
Ad Ash in the anhydrous sample (%);
Qir Net calorific value (MJ/kg);
Std Sulphur in the anhydrous sample (%);
Wtr All water (%);
Cr Carbon in the original sample (%);
Hr Hydrogen in the original sample (%);
Nr Nitrogen in the original sample (%);
Odr Oxygen in the original sample (%);
Vr Combustible matter (%);
fem Emission factor (tCO2/TJ).
Following the established model acceptance guidelines, the following model relations, as shown in
Table 14, have been accepted.
Among the flue gas attributes, , the accepted relation was described by the degree of a polynomial 3.
Among the flue gas attributes, and , the accepted relation was described by a linear dependence. The correlation coefficient r = 0.982 confirms a strong linear dependence of the calorific value and the amount of carbon.
Among the flue gas attributes, , the accepted relation was described by a linear dependence. The correlation coefficient r = –0.849 confirms a strong negative correlation, i.e., fuels with a lower amount of ash contain a higher amount of combustible material.
Among the flue gas attributes, , the accepted relation was described by a linear dependence. The correlation coefficient r = –0.843 confirms a strong negative correlation, i.e., fuels with a lower amount of sulphur in the sample without water contain a higher amount of hydrogen in the original sample.
Among the flue gas attributes, the accepted relation was described by the degree of a polynomial 3.
4.2. Verification of Fuel Interchangeability
This verification was carried out for the preliminary evaluation of fuel interchangeability for:
4.2.1. Comparison of the Results of Flue Gas Attributes of the Same Category Fuels
The Wilcoxon signed-rank test was used to test the flue gas attribute compliance for Solid Alternative Fuels: TAP1 and TAP2. The test criterion value is V = 307 and the 0.9035.
The null hypothesis cannot be rejected. The flue gas attributes of TAP1 and TAP2 are not statistically significantly different.
The comparison of TAP1 and TAP2 results implies their mutual interchangeability.
The Friedman rank-sum test was used to verify the hypothesis of the conformity of the flue gas attributes of the biomass, wood chips, wood pellets, and non-wood pellets. The test criterion value is 6.6232 and the value 0.03646.
The null hypothesis is rejected in favor of the alternative one. Flue gas attributes of at least one fuel pair of wood chips, wood pellets, and non-wood pellets differ statistically significantly.
The Wilcoxon signed-rank test was subsequently used to verify the hypothesis of the conformity of the flue gas attributes for wood chips and wood pellets. The test criterion value is V = 328 and 0.8378. Thus, the null hypothesis cannot be rejected. The attributes of flue gases of wood chips and wood pellets do not differ significantly.
The result of the comparison suggests that non-wood pellets differ significantly from the wood chips and wood pellets in the flue gas attributes.
Comparison of biomass results: wood chips, wood pellets and non-wood pellets implies that non-wood pellets are of different attributes; however, wood pellets and wood chips are mutually interchangeable.
4.2.2. Comparison of the Results of Flue Gas Attributes of the Fuel—Brown Coal from the Same Source for Several Periods
To verify the hypothesis of conformity of brown coal flue gas attributes from Sokolovská uhelná, the Wilcoxon signed-rank test was used for 2017 and 2018. The test criterion value is V = 414 and the value 0.04733.
The null hypothesis is rejected in favor of the alternative one. In the values of brown coal flue gas values in 2017 and 2018 from Sokolovská uhelná non-conformity, i.e., brown coal supplied between 2017 and 2018, is not interchangeable.
To verify the hypothesis of conformity of brown coal flue gas attributes from Severočeské doly a.s., the Wilcoxon signed-rank test was used for 2017 and 2018. The test criterion value is V = 226 and the value 0.147.
The null hypothesis cannot be rejected. In the values of brown coal flue gas attributes in the years 2017 and 2018 from Severočeské doly a.s. is a match, i.e., brown coal supplied between 2017 and 2018 is interchangeable.
To verify the hypothesis of conformity of brown coal flue gas attributes from Severní energetická a.s. for the years 2016, 2017, and 2018, the Friedman rank sum test was used. The test criterion value is 1.338 and the value 0.512.
The null hypothesis cannot be rejected. In the values of brown coal flue gas attributes in the years 2016, 2017, and 2018 from Severní energetická a.s. is a match, i.e., brown coal supplied between 2016, 2017, and 2018 is interchangeable.
The results of the comparison show that two suppliers, Severní energetická a.s. and Severočeské doly a.s., respected the values of the flue gas attributes of the supplied brown coal for 2016 to 2018. Sokolovská uhelná differed in 2016–2018 in terms of attributes.
5. Conclusions
The analysis of fuel interchangeability in the conditions of heat production is realized with the intention of efficiency of the complex technological process. In practice, there are several approaches for the evaluation of fuel interchangeability. In the presented case study, the researched approach was based on the application of mathematical-statistical methods. Specifically, 12 types of solid fuels were evaluated, and also 35 different attributes.
Due to the extent of the monitored attributes, the attributes were classified to simplify the way of their monitoring. Specifically, for all attributes of flue gas with the same property, was searched a cross-correlation and one attribute was selected, which was used in further analyses. The analysis of cross-correlation among attributes was used as regression models for the pairs of attributes.
Evaluation of fuel interchangeability its comparison in terms of the same category and also the same source during several periods was realized by Wilcoxon signed-rank sum test and Friedman rank-sum test, according to the condition two or more fuels in the group.
The result of the realized analysis and preparatory calculations are descriptive statistics of flue gas attributes and confirmation/negation of linear relations between the pairs of attributes.
The obtained results of the research confirm that this approach is effective and fully applicable. At the same time, the results point to the possibility of mathematical-statistical methods used in the field of verification of fuel interchangeability in heat production.
Author Contributions
Conceptualization, M.H.; methodology, V.M. and G.F.; investigation, B.S. and G.B.; data analysis, B.S. and G.B.; writing—original draft preparation, V.M. and G.F.; writing—review and editing, M.H., G.F. and V.M. All authors have read and agreed to the published version of the manuscript.
Funding
This work was supported by the projects of the Scientific Grant Agency of the Ministry of Education, Science, Research and Sport of the Slovak Republic and the Slovak Academy of Sciences project No. VEGA 1/0403/18, No. VEGA 1/0600/20, No. VEGA 1/0264/21 and was supported by the projects of the Cultural and Educational Grant Agency of the Ministry of Education, Science, Research and Sport of the Slovak Republic and the Slovak Academy of Sciences project No. KEGA 012TUKE-4/2019, KEGA 013TUKE-4/2019 and APVV SK-SRB-18-0053.
Conflicts of Interest
The authors declare no conflict of interest.
References
- Gadiraju, S.; Park, S.; Singh, P.; Pandit, J.; Ekkad, S.V.; Liberatore, F.; Srinivasan, R.; Ho, Y. Fuel Interchangeability Effects on the Lean Blowout for a Lean Premixed Swirl Stabilized Fuel Nozzle. In Proceedings of the ASME Turbo Expo: Turbomachinery Technical Conference and Exposition, Oslo, Norway, 11–15 June 2018; The American Society of Mechanical Engineers: New York, NY, USA, 2018; Volume 4b. [Google Scholar]
- Vlček, J.; Velička, M.; Pyszko, R. Interchangeability of Mixed Gas Components for Heating Industrial Furnaces. In Proceedings of the 38th Meeting of Departments of Fluid Mechanics and Thermodynamics, Liptovsky Mikulas, Slovakia, 19–21 June 2019; pp. 1–5. [Google Scholar]
- Ferguson, D.; Richard, G.A.; Straub, D. Fuel Interchangeability for Lean Premixed Combustion in Gas Turbine Engines. In Combustion, Fuels and Emissions, Parts A and B, Proceeding of the ASME 2018 Turbo Expo, Oslo, Norway, 11–15 June 2018; ASME: New York, NY, USA, 2018; Volume 3, pp. 973–981. [Google Scholar]
- Park, S.; Choi, G.; Tanahashi, M. Combustion Characteristics of Syngas on Scaled Gas Turbine Combustor in Pressurized Condition: Pressure, H-2/CO Ratio, and N-2 Dilution of Fuel. Fuel Process. Technol. 2018, 175, 104–112. [Google Scholar] [CrossRef]
- Maznoy, A.; Pichugin, N.; Yakovlev, I.; Fursenko, R.; Petrov, D.; Shy, S. (Steven). Fuel Interchangeability for Lean Premixed Combustion in Cylindrical Radiant Burner Operated in the Internal Combustion Mode. Appl. Therm. Eng. 2021, 186. [Google Scholar] [CrossRef]
- Lopez-Anton, M.A.; Diaz-Somoano, M.; Ochoa-Gonzalez, R.; Martinez-Tarazona, M.R. Distribution of Trace Elements from a Coal Burned in Two Different Spanish Power Stations. Ind. Eng. Chem. Res. 2011, 50, 12208–12216. [Google Scholar] [CrossRef][Green Version]
- Klein, D.H.; Andren, A.W.; Bolton, N.E. Trace-Element Discharges from Coal Combustion for Power Production. Water Air Soil Pollut. 1975, 5, 71–77. [Google Scholar] [CrossRef]
- Bool, L.E.; Helble, J.J. A Laboratory Study of The Partitioning of Trace-elements during Pulverized Coal Combustion. Energy Fuels 1995, 9, 880–887. [Google Scholar] [CrossRef]
- Querol, X.; Juan, R.; Lopez-Soler, A.; Fernandez-Turiel, J.L.; Ruiz, C.R. Mobility of Trace Elements from Coal and Combustion Wastes. Fuel 1996, 75, 821–838. [Google Scholar] [CrossRef]
- Helble, J.J. Trace-Element Behavior during Coal Combustion-Results of a Laboratory Study. Fuel Process. Technol. 1994, 39, 159–172. [Google Scholar] [CrossRef]
- Davison, R.L.; Natusch, D.F.S.; Wallace, J.R.; Evans, C.A. Trace Elements in Fly Ash. Dependence of Concentration on Particle Size. Environ. Sci. Technol. 1974, 8, 1107–1113. [Google Scholar] [CrossRef]
- Keramiotis, C.; Founti, M.A. An Experimental Investigation of Stability and Operation of a Biogas Fueled Porous Burner. Fuel 2013, 103, 278–284. [Google Scholar] [CrossRef]
- Xiang, L.; Theotokatos, G.; Ding, Y. Investigation on Gaseous Fuels Interchangeability with an Extended Zero-dimensional Engine Model. Energy Convers. Manag. 2019, 183, 500–514. [Google Scholar] [CrossRef]
- Pujihatma, P.; Hadi, S.P.; Rohmat, T.A. Combined Heat and Power-Multi-objective Optimization with an Associated Petroleum and Wet Gas Utilization Constraint. J. Nat. Gas Sci. Eng. 2018, 54, 25–36. [Google Scholar] [CrossRef]
- Martinez, A.S.; Jani, A.; Dabdub, D. Emission Factor Estimation in Regional Air Quality Studies of Residential Natural Gas Fuel Interchangeability. Fuel 2014, 119, 129–140. [Google Scholar] [CrossRef]
- Montgomery, D.C. Design and Analysis of Experiments, 8th ed.; Wiley: New York, NY, USA, 2012; ISBN 978-1-118-14692-7. [Google Scholar]
- Hanke, J.E.; Reitsch, A.G. Understanding Business Statistics; Irwin: Homewood, IL, USA, 1991; ISBN 0-256-06627-2. [Google Scholar]
| Publisher’s Note: MDPI stays neutral with regard to jurisdictional claims in published maps and institutional affiliations. |
© 2021 by the authors. Licensee MDPI, Basel, Switzerland. This article is an open access article distributed under the terms and conditions of the Creative Commons Attribution (CC BY) license (https://creativecommons.org/licenses/by/4.0/).


 ,
, 


