
History, Geology, In Situ Stress Pattern, Gas Content and Permeability of Coal Seam Gas Basins in Australia: A Review

 , ,
, ,
Abstract
1. Introduction
2. History of Coal Seam Gas in Australia
- Phase 1: Pre-1975
- Phase 2: 1975–1996 (Early Exploration)
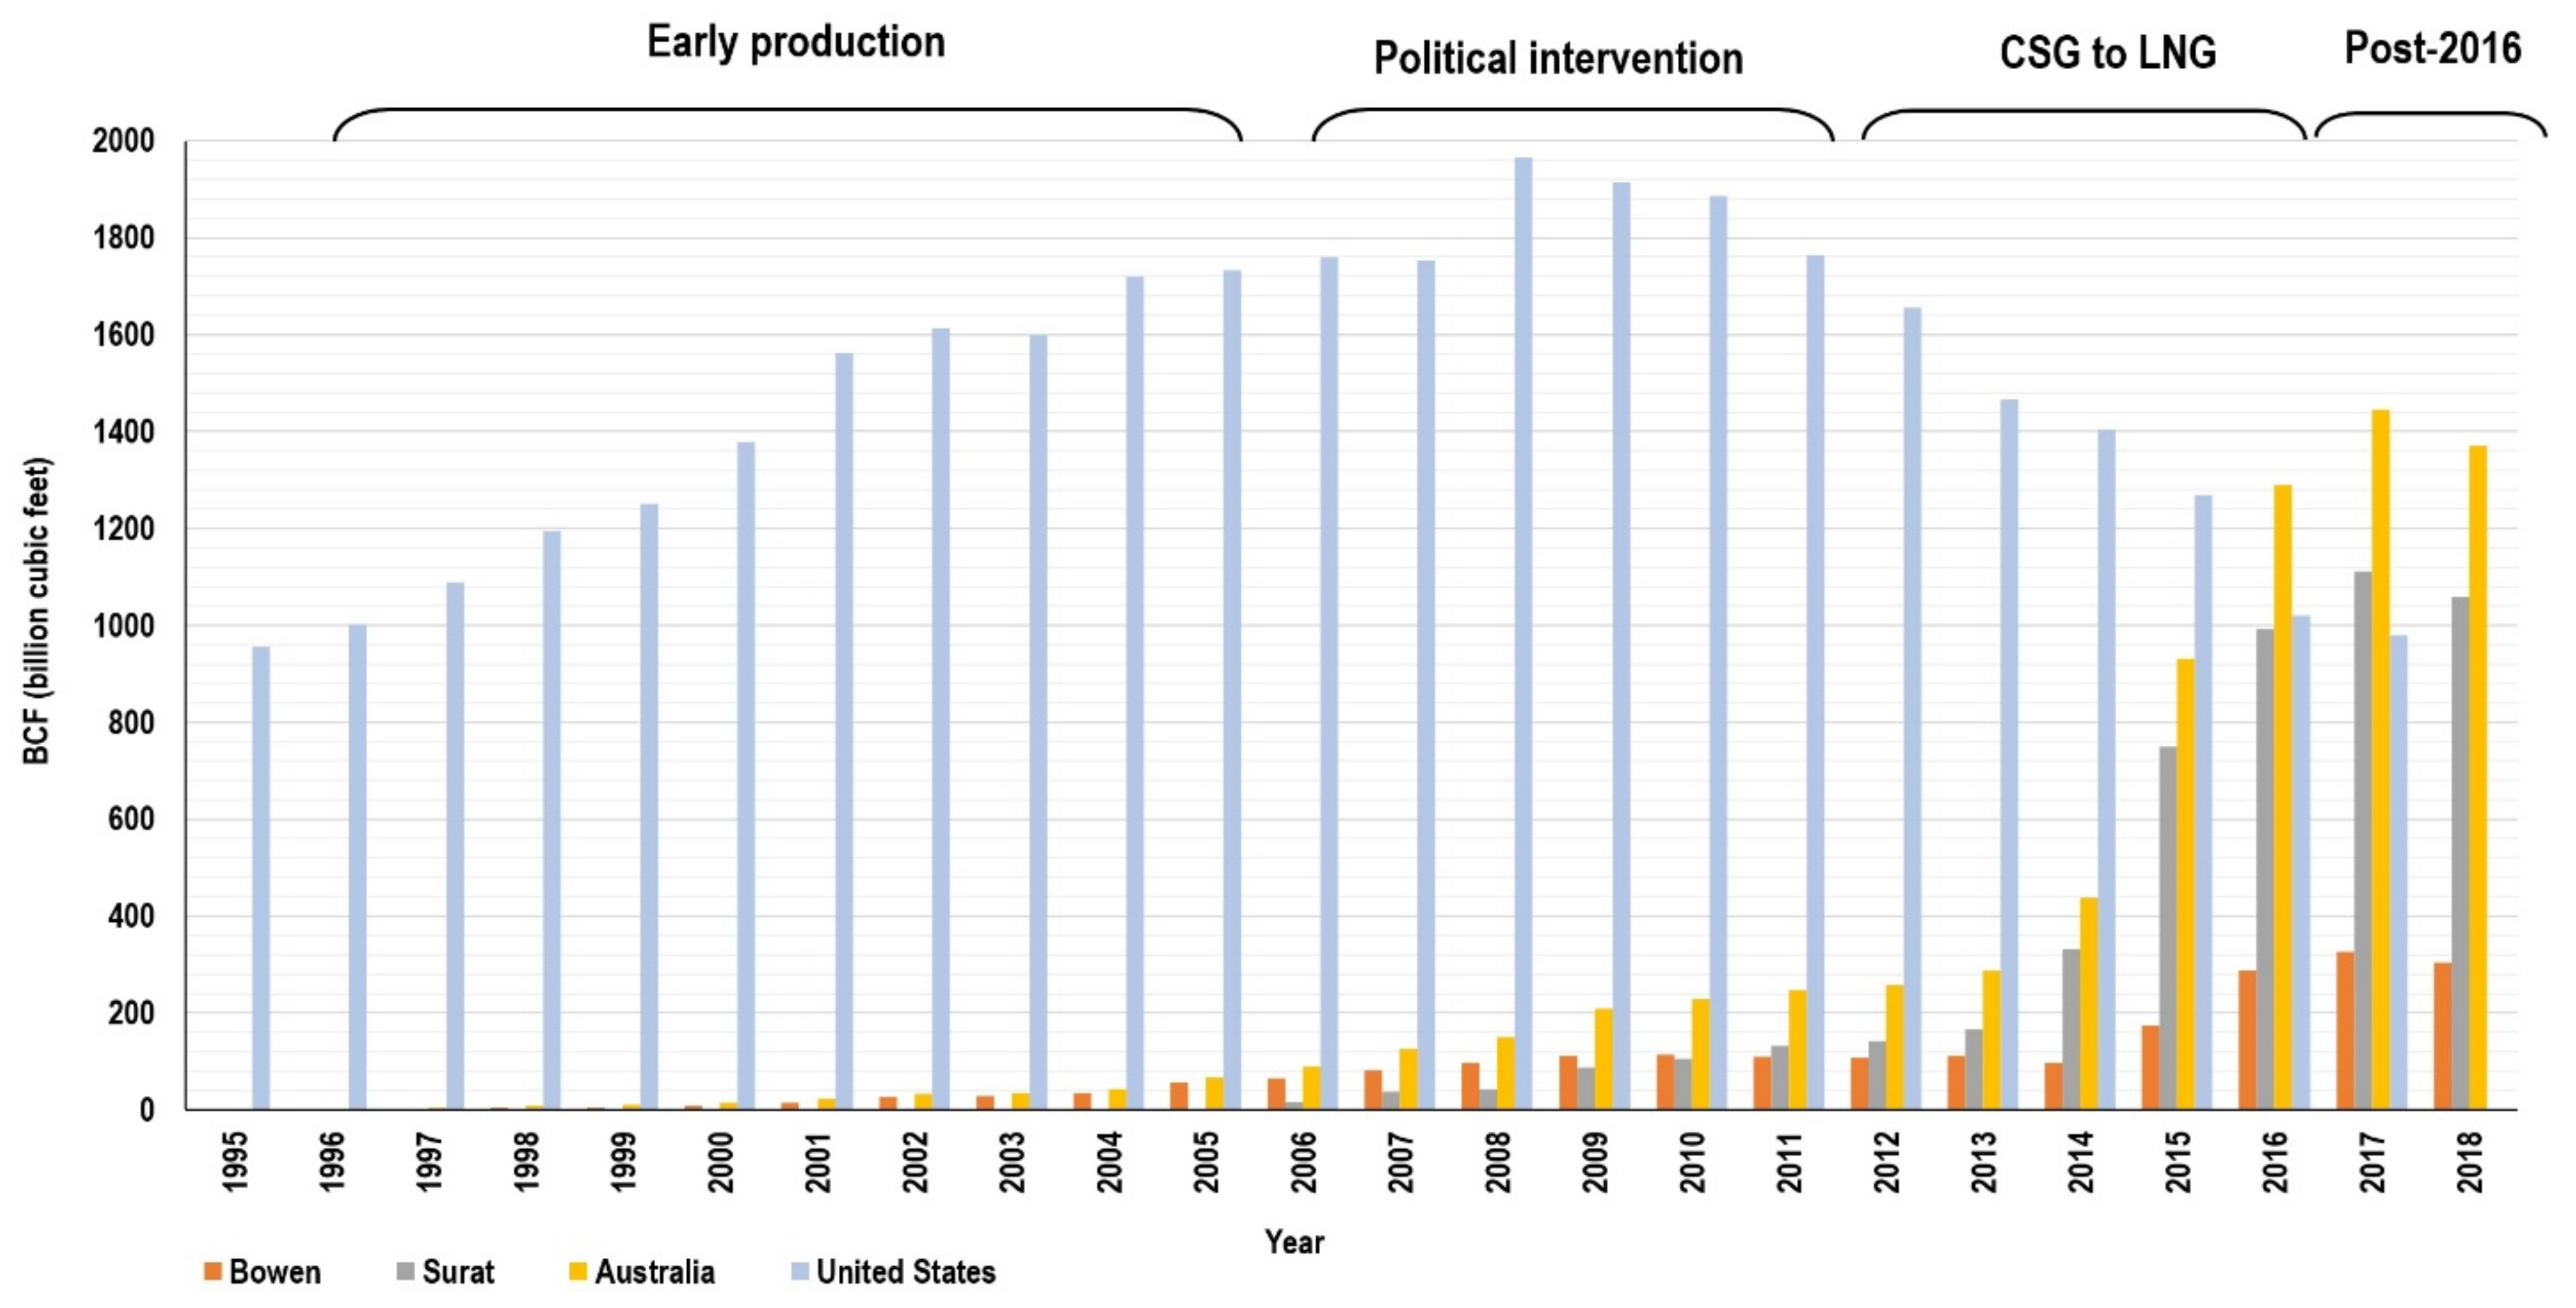
- Phase 3: 1996–2005 (Early Production)
- Phase 4: 2005–2011 (Political Intervention)
- Phase 5: 2011–2016 (CSG to LNG)
- Phase 6: Post-2016
2.1. Phase 1: Pre-1975
2.2. Phase 2: 1975–1996 (Early Exploration)
2.3. Phase 3: 1996–2005 (Early Production)
2.4. Phase 4–2005 to 2011 (Political Intervention)
2.5. Phase 5: 2011–2016 (CSG to LNG)
2.6. Phase 6: Post-2016
2.7. Development of Deep Coal Seam Gas in the Cooper Basin, South Australia
3. Geological Framework of Coal Deposits and Coal Seam Gas Resources in Australia
3.1. Bowen Basin
3.2. Sydney-Gunnedah Basins
3.3. Surat Basin
3.4. Cooper Basin
3.5. Gloucester Basin
4. In Situ Stress Pattern in the Australian Coal Seam Gas Basins


| Province | Number of A–C Quality Data | Mean SHmax Orientation (Degree from North) | Standard Deviation |
|---|---|---|---|
| Bowen-Surat 1 | 64 | 032° | 30° |
| Bowen-Surat 2 | 52 | 065° | 33° |
| Clarence-Moreton | 21 | 069° | 23° |
| Cooper-Eromanga | 78 | 099° | 14° |
| Galilee-Eromanga | 5 | 087° | 8° |
| Gloucester | 5 | 034° | 52° |
| Gunnedah | 30 | 057° | 33° |
| North Sydney | 32 | 065° | 40° |
| South Sydney | 11 | 041° | 35° |
Applications of In Situ Stresses in Coal Seam Gas Exploration and Production
5. Gas Content and Permeability in Major Australian CSG Basins
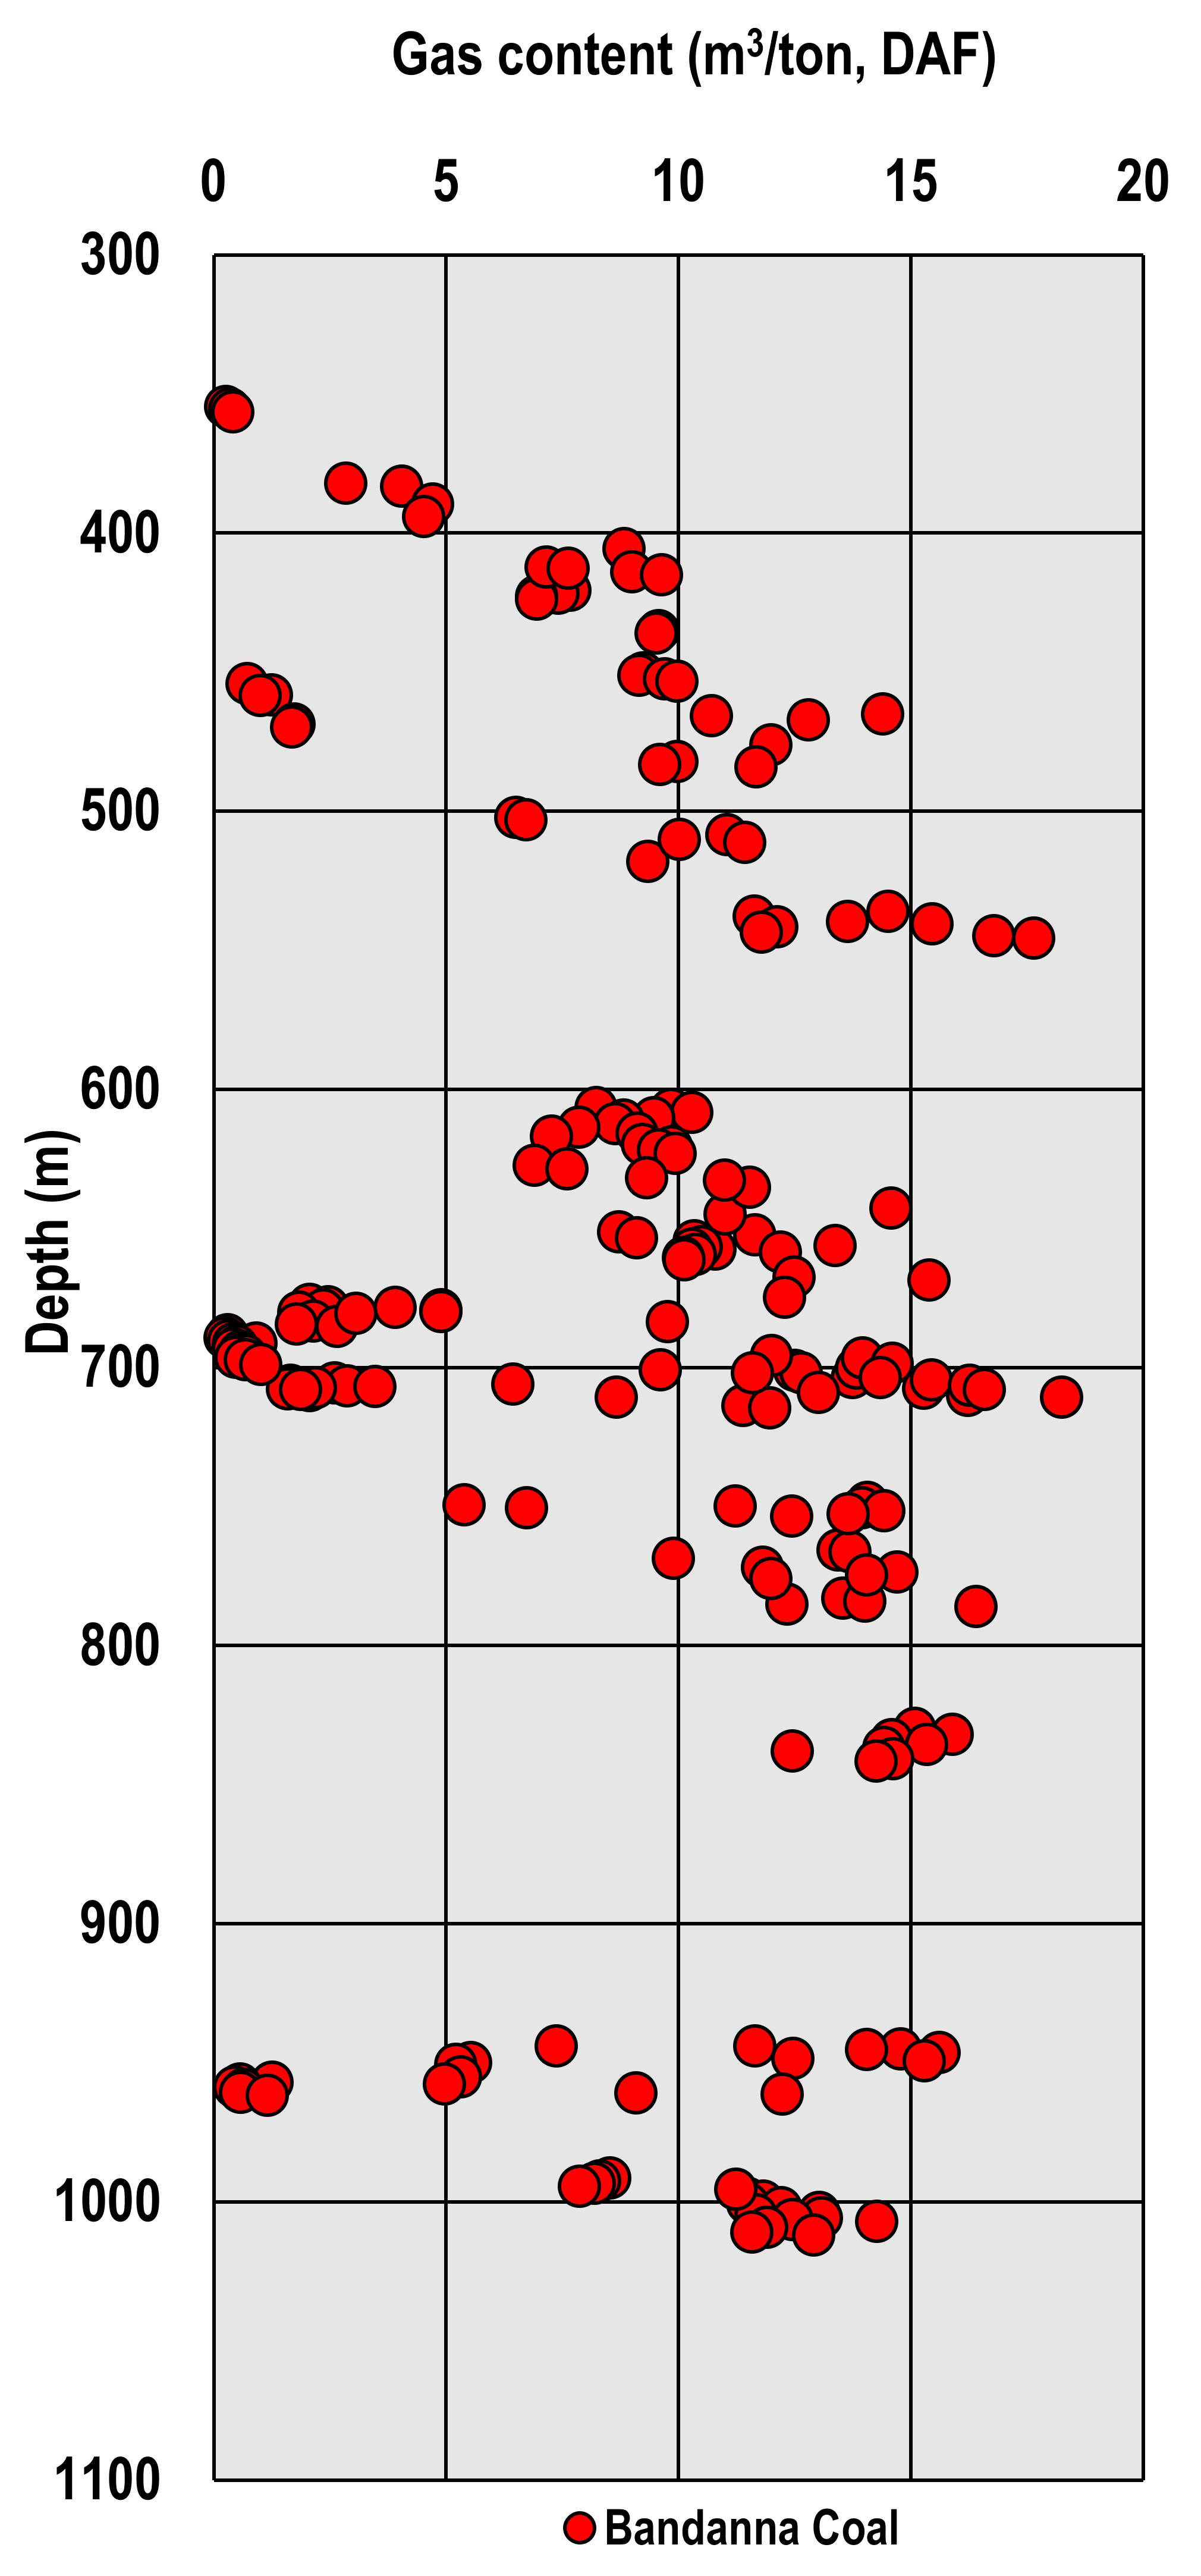
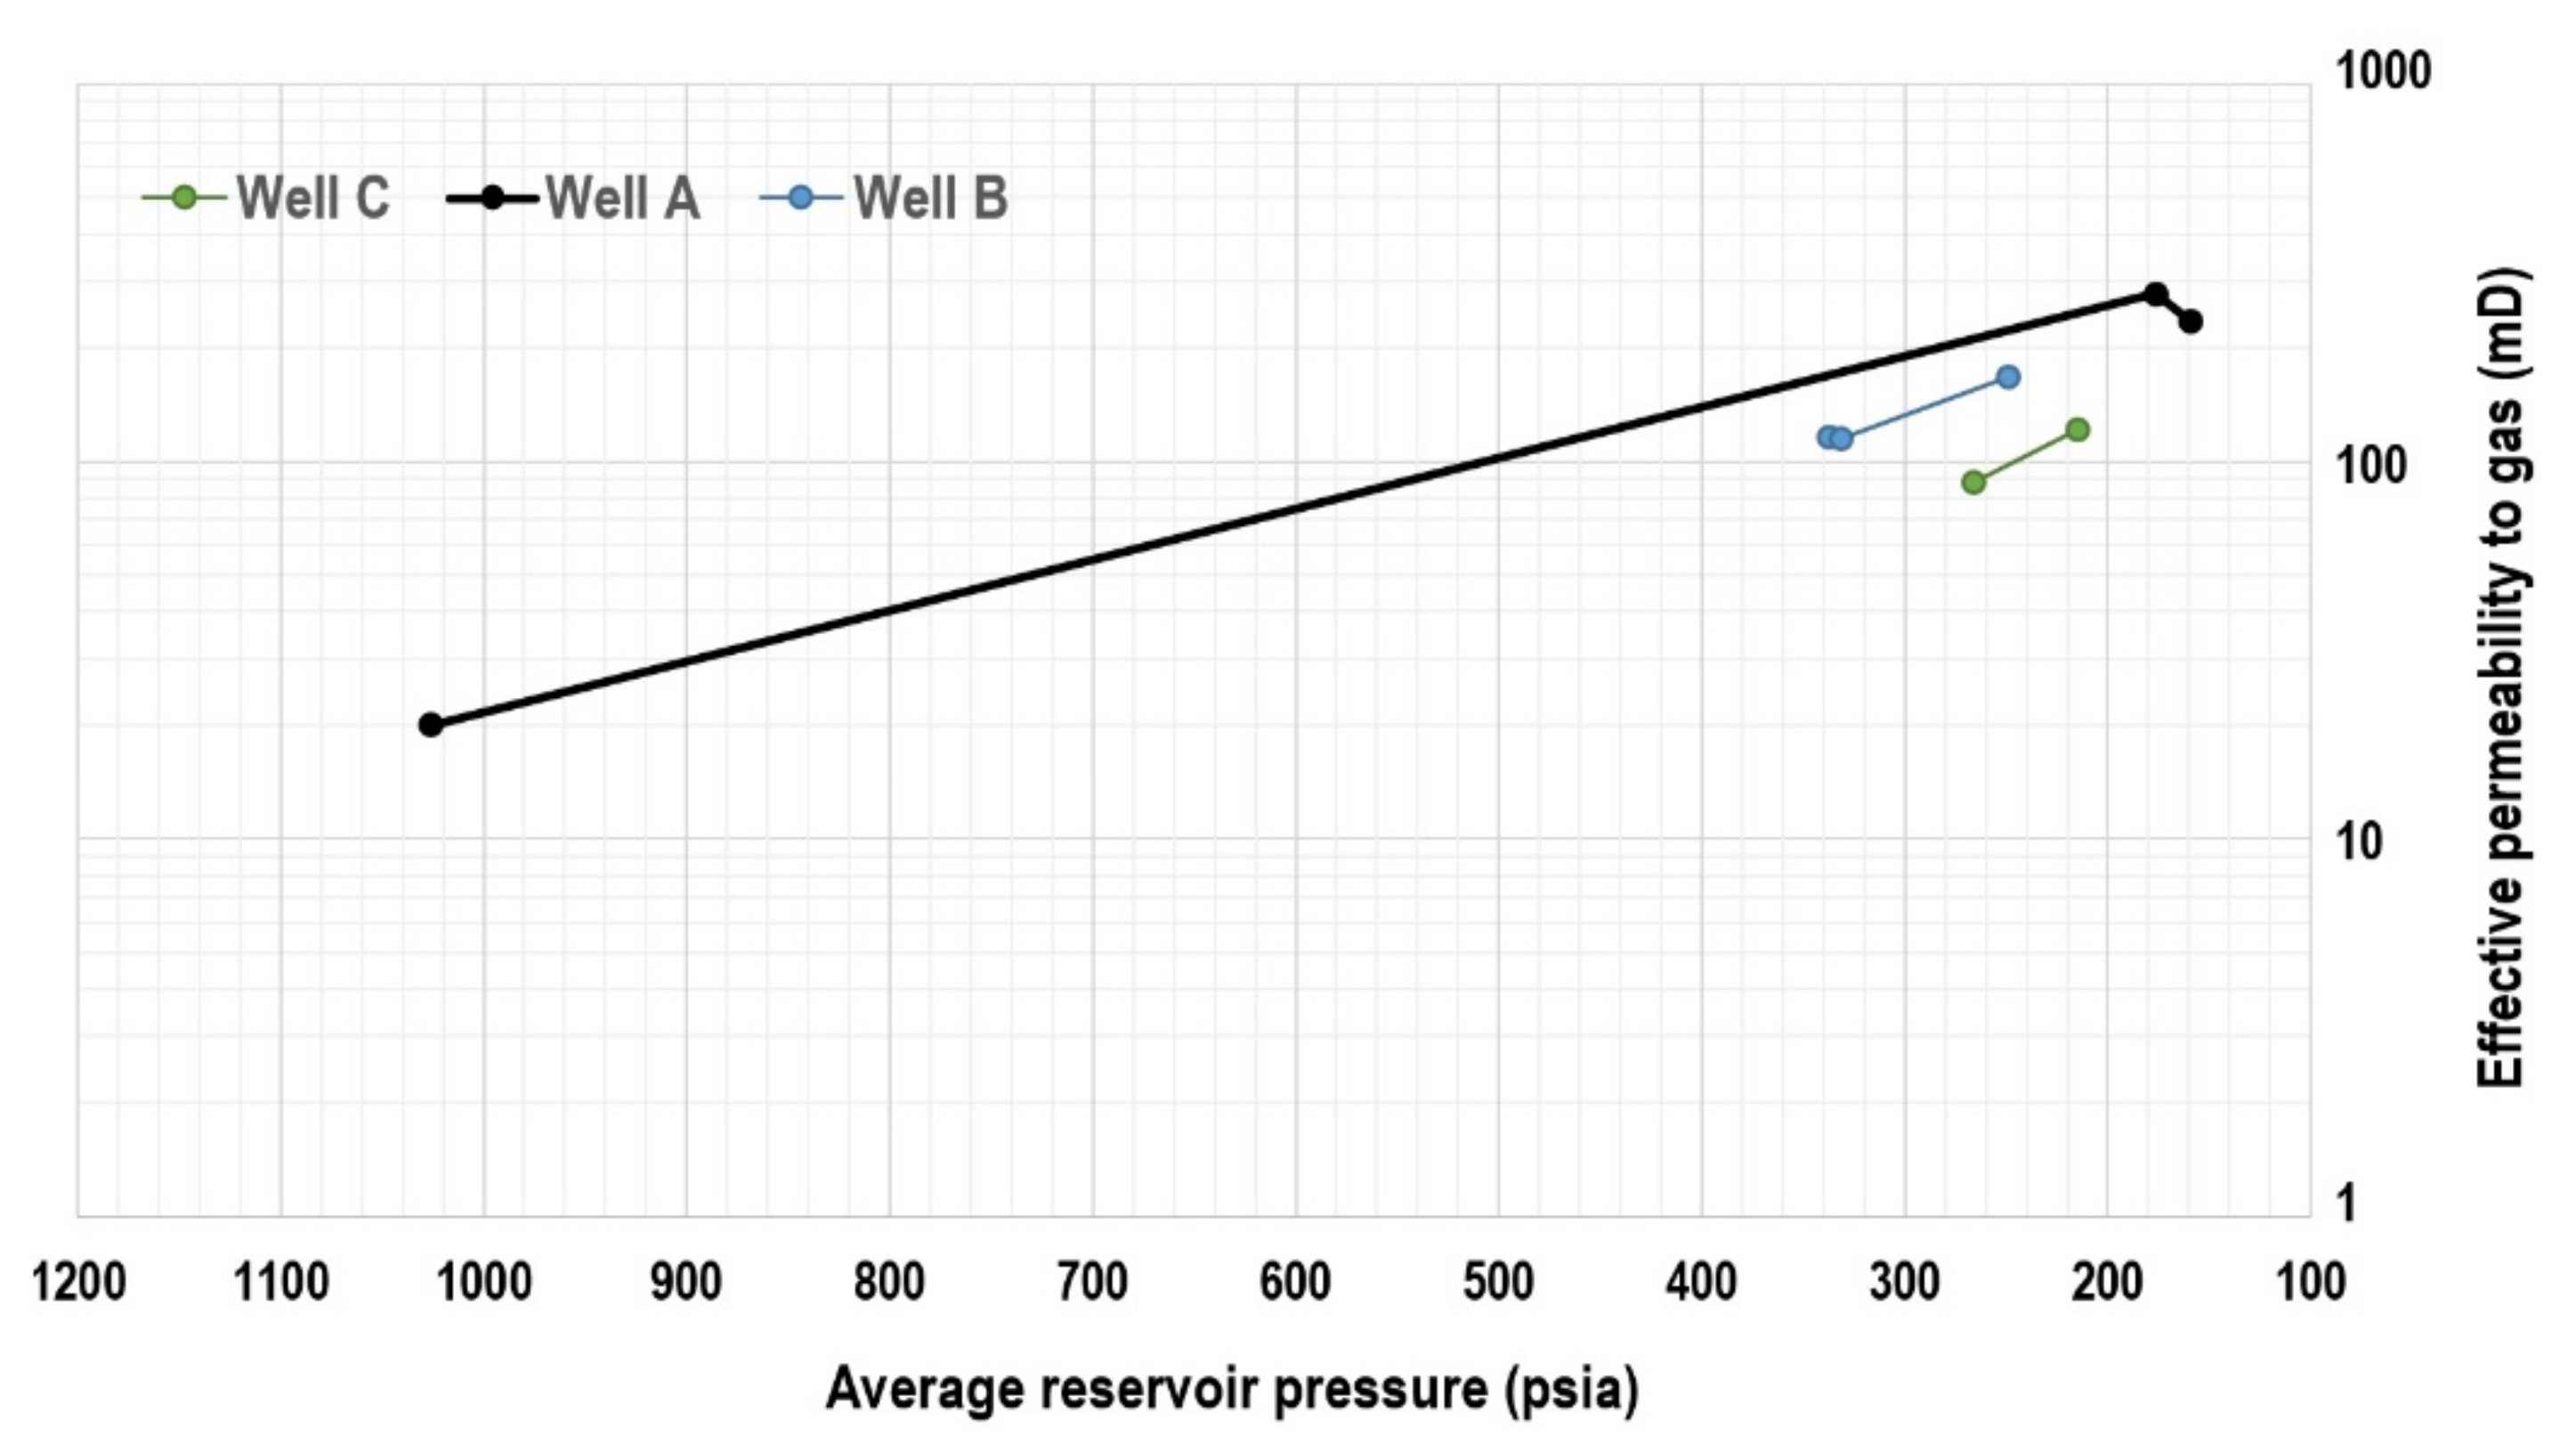
5.1. Bowen Basin
5.2. Sydney-Gunnedah Basins
5.3. Surat Basin
5.4. Cooper Basin

6. Summary
Author Contributions
Funding
Institutional Review Board Statement
Informed Consent Statement
Data Availability Statement
Acknowledgments
Conflicts of Interest
Table of Conversions
| 1 | 35.3 |
| 1 | 3.28 |
| 1 | 1000 |
| 1 | 6.89 |
| 1 | 0.00689 |
Nomenclature
| Billion cubic feet | |
| Dry ash free | |
| Permeability | |
| Effective permeability to gas | |
| Initial permeability | |
| Relative permeability | |
| Million standard cubic feet per day | |
| Thousand standard cubic feet per day | |
| Average reservoir pressure | |
| Flowing bottom-hole pressure | |
| Maximum horizontal Stress | |
| Tcf | Trillion cubic feet |
References
- Australian Government. Resources and Energy Quarterly. June 2018. Available online: https://publications.industry.gov.au/publications/resourcesandenergyquarterlyjune2018/documents/Resources-and-Energy-Quarterly-June-2018-Gas.pdf (accessed on 1 March 2020).
- Branajaya, R.; Archer, P.; Farley, A. Pushing the boundaries-deployment of innovative drilling, completion and production technology to advance a deep coal seam play. APPEA J. 2019, 59, 770–775. [Google Scholar] [CrossRef]
- Camac, B.; Benson, J.; Chan, V.; Goedecke, A. Cooper Basin Deep Coal-the New Unconventional Paradigm: Deepest Producing Coals in Australia. ASEG Extended Abstr. 2018, 2018, 1–7. [Google Scholar] [CrossRef]
- Cooper, G.; Lockhart, D.; Walsh, A. The Permian Deep Coal Play, Cooper Basin, Australia. Unlocking the Next Gas Giant. In Proceedings of the SPE Asia Pacific Oil and Gas Conference and Exhibition, Brisbane, Australia, 23–25 October 2018; Society of Petroleum Engineers: Brisbane, Australia, 2018; p. 19. [Google Scholar]
- Dunlop, C.E.; Salmachi, A.; McCabe, P.J. Investigation of increasing hydraulic fracture conductivity within producing ultra-deep coal seams using time-lapse rate transient analysis: A long-term pilot experiment in the Cooper Basin, Australia. Int. J. Coal Geol. 2020, 220, 103363. [Google Scholar] [CrossRef]
- Fraser, S.A.; Johnson, R.L., Jr. Impact of Laboratory Testing Variability in Fracture Conductivity for Stimulation Effectiveness in Permian Deep Coal Source Rocks, Cooper Basin, South Australia. In Proceedings of the SPE Asia Pacific Oil and Gas Conference and Exhibition, Brisbane, Australia, 23–25 October 2018; Society of Petroleum Engineers: Brisbane, Australia, 2018; p. 19. [Google Scholar]
- Salmachi, A.; Dunlop, E.; Rajabi, M.; Yarmohammadtooski, Z.; Begg, S. Investigation of permeability change in ultradeep coal seams using time-lapse pressure transient analysis: A pilot project in the Cooper Basin, Australia. AAPG Bull. 2019, 103, 91–107. [Google Scholar] [CrossRef]
- Moore, T. Coalbed methane: A review. Int. J. Coal Geol. 2012, 101, 36–81. [Google Scholar] [CrossRef]
- Zhang, J.; Feng, Q.; Zhang, X.; Wen, S.; Zhai, Y. Relative permeability of coal: A review. Transp. Porous Media 2015, 106, 563–594. [Google Scholar] [CrossRef]
- Pan, Z.; Connell, L.D. Modelling permeability for coal reservoirs: A review of analytical models and testing data. Int. J. Coal Geol. 2012, 92, 1–44. [Google Scholar] [CrossRef]
- Clarkson, C. Production data analysis of unconventional gas wells: Review of theory and best practices. Int. J. Coal Geol. 2013, 109, 101–146. [Google Scholar]
- Miyazaki, S. Coal seam gas exploration, development and resources in Australia: A national perspective. APPEA J. 2005, 45, 131–142. [Google Scholar] [CrossRef]
- Towler, B.; Firouzi, M.; Underschultz, J.; Rifkin, W.; Garnett, A.; Schultz, H.; Esterle, J.; Tyson, S.; Witt, K. An overview of the coal seam gas developments in Queensland. J. Nat. Gas Sci. Eng. 2016, 31, 249–271. [Google Scholar] [CrossRef]
- Rajabi, M.; Tingay, M.; Heidbach, O.; Hillis, R.; Reynolds, S. The present-day stress field of Australia. Earth Sci. Rev. 2017, 168, 165–189. [Google Scholar]
- Queensland Government. Petroleum and Gas Production Statistics. 2019. Available online: https://www.data.qld.gov.au/dataset/petroleum-gas-production-and-reserve-statistics/resource/9746212a-e0c6-484d-95ad-b2be1c46027d (accessed on 15 October 2020).
- Energy Information Administration. US Coalbed Methane Production 2020 cited 2020. Available online: https://www.eia.gov/dnav/ng/ng_prod_coalbed_s1_a.htm (accessed on 15 October 2020).
- International Energy Agency. Key world Energy Statistics, Coal Production. p. 17. 2017. Available online: https://www.iea.org/publications/freepublications/publication/KeyWorld2017.pdf (accessed on 16 February 2020).
- Geoscience Australia. Australia Energy Resource Assessment. 2019. Available online: https://aera.ga.gov.au/ (accessed on 12 March 2020).
- Flores, R.M. Coalbed methane: From hazard to resource. Int. J. Coal Geol. 1998, 35, 3–26. [Google Scholar] [CrossRef]
- McLennan, J.D. A Guide to Determining Coalbed Gas Content; Schafer, P.S., Ed.; Gas Research Institute: Chicago, IL, USA, 1995. [Google Scholar]
- Diamond, W.P. Evaluation of the methane gas content of coalbeds: Part of a complete coal exploration program for health and safety and resource evaluation. In Proceedings of the 2nd International Coal Exploration Symposium, Denver, CO, USA, October 1978. [Google Scholar]
- Riley, J. The rise and rise of Coal Seam Gas in the Bowen Basin. APPEA J. 2004, 44, 647–652. [Google Scholar] [CrossRef]
- Cullicott, C.; Dunmire, C.; Brown, J.; Calwell, C. Coalbed Methane in the San Juan Basin of Colorado and New Mexico, in Coalbed Methane Development in the Intermountain West. University of Colorado Boulder, Natural Resources Law Center: Boulder, CO, USA, 2002. [Google Scholar]
- Queensland Government. Queensland’s Petroleum and Coal Seam Gas. 2017; p. 8. Available online: http://www.australiaminerals.gov.au/__data/assets/pdf_file/0003/47622/Queenslands-petroleum-and-coal-seam-gas-2017.pdf (accessed on 20 April 2020).
- Queensland Government. Queensland Gas Scheme, Business Queensland. 2014. Available online: https://web.archive.org/web/20110422191442/http://www.dme.qld.gov.au/Energy/gasscheme.cfm (accessed on 20 January 2020).
- Energy Quest, Queensland LNG Projects Facing Supply Crunch. 2019. Available online: https://www.lngworldnews.com/energyquest-queensland-lng-projects-facing-supply-crunc/ (accessed on 11 June 2020).
- Queensland Government. Petroleum and Gas Production and Reserve Statistics. 2019. Available online: https://www.data.qld.gov.au/dataset/petroleum-gas-production-and-reserve-statistics (accessed on 5 March 2020).
- Santos. Narrabri Gas Project. 2020. Available online: https://narrabrigasproject.com.au/2020/07/ceo-ipc-speech-narrabri-gas-project/ (accessed on 20 January 2021).
- Dunlop, E.C.; Warner, D.S.; Warner, P.E.; Coleshill, L.R. Ultra-deep Permian coal gas reservoirs of the Cooper Basin: Insights from new studies. APPEA J. 2017, 57, 218–262. [Google Scholar]
- Menpes, S.; Hill, T. Emerging continuous gas plays in the Cooper Basin, South Australia. APPEA J. 2012, 52, 671. [Google Scholar]
- Olson, T.M. White River Dome Field: Gas Production from Deep Coals and Sandstonesof the Cretaceous Williams Fork Formation, Piceance Basin Guidebook; AAPG: Tulsa, OK, USA, 2003. [Google Scholar]
- Camac, B.; Santos Ltd., 60 Flinders Street, Adelaide, SA 5000, Australia. Personal communication, 2019.
- Strike Energy. The Southern Cooper Basin Gas Project. 2017. Available online: https://strikeenergy.com.au/cooper-basin/ (accessed on 4 March 2020).
- Strike Energy. Cooper Basin Update. p. 1. 2020. Available online: https://strikeenergy.com.au/asx-announcements/ (accessed on 15 January 2021).
- Thomas, L. Coal Geology; Wiley Online Library: New York, NY, USA, 2013. [Google Scholar]
- Ward, C.; Harrington, H.; Mallett, C.; Beeston, J. Geology of Australian Coal Basins; Geological Society of Australia, Coal Geology Group: Hornsby, Australia, 1995. [Google Scholar]
- Burra, A.; Esterle, J.S.; Golding, S.D. Horizontal stress anisotropy and effective stress as regulator of coal seam gas zonation in the Sydney Basin, Australia. Int. J. Coal Geol. 2014, 132, 103–116. [Google Scholar] [CrossRef]
- Bustin, R.M. Importance of Fabric and Composition on the Stress Sensitivity of Permeability in Some Coals, Northern Sydney Basin, Australia: Relevance to Coalbed Methane Exploitation1. AAPG Bull. 1997, 81, 1894–1908. [Google Scholar]
- Bustin, M.R.; Clarkson, C.R. Geological controls on coalbed methane reservoir capacity and gas content. Int. J. Coal Geol. 1998, 38, 3–26. [Google Scholar]
- Draper, J.; Boreham, C. Geological controls on exploitable coal seam gas distribution in Queensland. Aust. Pet. Prod. Explor. Assoc. 2006, 46, 343–366. [Google Scholar] [CrossRef]
- Laxminarayana, C.; Crosdale, P.J. Role of coal type and rank on methane sorption characteristics of Bowen Basin, Australia coals. Int. J. Coal Geol. 1999, 40, 309–325. [Google Scholar]
- Pashin, J.C. Stratigraphy and structure of coalbed methane reservoirs in the United States: An overview. Int. J. Coal Geol. 1998, 35, 209–240. [Google Scholar] [CrossRef]
- Pashin, J.C. Coal as a petroleum source rock and reservoir rock. In Applied Coal Petrology; Elsevier: Amsterdam, The Netherlands, 2008; pp. 227–262. [Google Scholar]
- Scott, A.R. Hydrogeologic factors affecting gas content distribution in coal beds. Int. J. Coal Geol. 2002, 50, 363–387. [Google Scholar] [CrossRef]
- Seidle, J. Fundamentals of Coalbed Methane Reservoir Engineering; PennWell Books: Tulsa, OK, USA, 2011. [Google Scholar]
- Boreham, C.; Golding, S.; Glikson, M. Factors controlling the origin of gas in Australian Bowen Basin coals. Org. Geochem. 1998, 29, 347–362. [Google Scholar]
- Golding, S.D.; Baublys, K.A.; Glikson, M.; Uysal, I.T.; Boreham, C.J. Source and Timing of Coal Seam Gas Generation in Bowen Basin Coals. In Coalbed Methane: Scientific, Environmental and Economic Evaluation; Mastalerz, M., Glikson, M., Golding, S.D., Eds.; Springer Netherlands: Dordrecht, The Netherlands, 1999; pp. 257–269. [Google Scholar]
- Hamilton, S.K.; Golding, S.D.; Esterle, J.S.; Baublys, K.A.; Ruyobya, B.B. Controls on Gas Domains and Production Behaviour in A High-Rank CSG Reservoir: Insights from Molecular and Isotopic Chemistry of Co-Produced Waters and Gases from the Bowen Basin, Australia. Geosciences 2020, 10, 74. [Google Scholar]
- Green, P.; Hoffmann, K.; Brain, T.; Gray, A. The Surat and Bowen basins, south-east Queensland. In Queensland Minerals and Energy Review Series; Queensland Department of Mines and Energy: Brisbane, Australia, 1997. [Google Scholar]
- Babaahmadi, A.; Sliwa, R.; Esterle, J.; Rosenbaum, G. The development of a Triassic fold-thrust belt in a synclinal depositional system, Bowen Basin (eastern Australia). Tectonics 2017, 36, 51–77. [Google Scholar]
- Brakel, A.T.; Totterdell, J.M.; Wells, A.T.; Nicoll, M.G. Sequence stratigraphy and fill history of the Bowen Basin, Queensland. Aust. J. Earth Sci. 2009, 56, 401–432. [Google Scholar] [CrossRef]
- Sliwa, R.; Esterle, J. Rangal Supermodel 2015. APPEA J. 2016, 56, 598. [Google Scholar]
- Jell, P. Geology of Queensland; Queensland Geological Survey of Queensland: Brisbane, Australia, 2013. [Google Scholar]
- Mallett, C.; Pattison, C.; McLennan, T.; Balfe, P.; Sullivan, D. Bowen Basin. Special Publication of the Geological Society of Australia; Geological Society of Australia, Coal Geology Group: Hornsby, Australia, 1995; Volume 1, pp. 299–339. [Google Scholar]
- Korsch, R.J.; Totterdell, J.M.; Cathro, D.L.; Nicoll, M.G. Early Permian East Australian Rift System. Aust. J. Earth Sci. 2009, 56, 381–400. [Google Scholar] [CrossRef]
- Boreham, C.J.; Horsfield, B.; Schenk, H.J. Predicting the quantities of oil and gas generated fromAustralian Permian coals, Bowen Basin using pyrolyticmethods. Mar. Pet. Geol. 1999, 16, 165–188. [Google Scholar]
- Esterle, J.; Smith, G.L.B.; Yago, J. Geometry and connectivity of distributary channel sandstones in the Late Permian Moranbah Coal Measures, Bowen Basin, Australia. APPEA J. 2000, 40, 379–392. [Google Scholar]
- Maxwell, K.; Rajabi, M.; Esterle, J. Automated classification of metamorphosed coal from geophysical log data using supervised machine learning techniques. Int. J. Coal Geol. 2019, 214, 103284. [Google Scholar] [CrossRef]
- Baker, L.G.; Skerman, W.R. The significance of coal seam gas in eastern Queensland. APPEA J. 2006, 46, 329–342. [Google Scholar] [CrossRef]
- Mastalerz, M.; Glikson, M.; Golding, S. Coalbed Methane: Scientific, Environmental and Economic Evaluation; Springer Science & Business Media: Dordrecht, The Netherlands, 2013. [Google Scholar]
- Faiz, M.; Zoitsas, A.; Altmann, C.; Baruch, E.; Close, D. Compositional variations and carbon isotope reversal in coal and shale gas reservoirs of the Bowen and Beetaloo basins, Australia. Geol. Soc. Lond. Spec. Publ. 2020, 484, 51–70. [Google Scholar] [CrossRef]
- Esterle, J.; Williams, R. Coal Seam Gas Distribution in the Moranbah-German Creek Coal Measures, Bowen Basin, Queensland. In Petroleum Exploration Society of Australia, Queensland: Exploration and Development; Cowie, M., Ed.; PESA: Brisbane, Australia, 2002. [Google Scholar]
- Hoffman, G.L.; Jordan, G.R.; Wallis, G.R. Geophysical Borehole Logging Handbook for Coal Exploration; Coal Mining Research Centre: Edmonton, AB, Canada, 1982. [Google Scholar]
- Michaelsen, P.; Henderson, R.A.; Crosdale, P.J.; Mikkelsen, S.O. Facies architecture and depositional dynamics of the Upper Permian Rangal coal measures, Bowen Basin, Australia. J. Sediment. Res. 2000, 70, 879–895. [Google Scholar] [CrossRef]
- Yarmohammadtooski, Z.; Salmachi, A.; White, A.; Rajabi, M. Fluid flow characteristics of Bandanna Coal Formation: A case study from the Fairview Field, eastern Australia. Aust. J. Earth Sci. 2017, 64, 319–333. [Google Scholar] [CrossRef]
- Ayaz, S.A.; Rodrigues, S.; Golding, S.D.; Esterle, J.S. Compositional variation and palaeoenvironment of the volcanolithic Fort Cooper Coal Measures, Bowen Basin, Australia. Int. J. Coal Geol. 2016, 166, 36–46. [Google Scholar] [CrossRef]
- Beeston, J.W. Coal rank variation in the Bowen Basin, Queensland. Int. J. Coal Geol. 1986, 6, 163–179. [Google Scholar] [CrossRef]
- Hunt, W.J.; Smyth, M. Origin of inertinite-rich coals of Australian cratonic basins. Int. J. Coal Geol. 1989, 11, 23–46. [Google Scholar] [CrossRef]
- Elliott, L. Post-Carboniferous tectonic evolution of eastern Australia. APPEA J. 1993, 33, 215–236. [Google Scholar] [CrossRef]
- Stewart, R.; Adler, D. New South Wales Petroleum Potential; NSW Department of Mineral Resources: Sydney, Australia, 1995.
- Hammond, R.; Mallet, C. A tectonic framework for coal measure deformation in the southern Bowen Basin. In Advances in the Study of the Sydney Basin, Proceedings of the Twenty First Newcastle Symposium, Newcastle, Australia, 10–12 April 1987; Department of Geology, University of Newcastle: Callaghan, Australia, 1987. [Google Scholar]
- Korsch, J.; Boreham, C.; Totterdell, J.; Shaw, R.; Nicoll, M. Development and petroleum resource evaluation of the Bowen, Gunnedah and Surat Basins, eastern Australia. APPEA J. 1998, 38, 199–237. [Google Scholar] [CrossRef]
- Tadros, N.Z. The Gunnedah Basin, New South Wales. 1993, Geological Survey of New South Wales. Available online: https://search.geoscience.nsw.gov.au/product/923 (accessed on 11 May 2020).
- Sniffin, M.; Beckett, J. Sydney Basin—Hunter Coalfield. In Geology of Australian Coal Basins; Coal Group Special Publication 1; Geological Society of Australia Incorporated: Sydney, Australia, 1995; pp. 177–195. [Google Scholar]
- Baker, G.; Slater, S. The Increasing Significance of Coal Seam Gas in Eastern Australia. In Proceedings of the PESA Eastern Australasian Basins Symposium III, Sydney, Australia, 14–17 September 2008. [Google Scholar]
- Pinetown, K.L. Regional coal seam gas distribution and burial history of the Hunter Coalfield, Sydney Basin. Aust. J. Earth Sci. 2014, 61, 409–426. [Google Scholar] [CrossRef]
- Gurba, W.L.; Weber, C.R. Effects of igneous intrusions on coalbed methane potential, Gunnedah Basin, Australia. Int. J. Coal Geol. 2001, 46, 113–131. [Google Scholar] [CrossRef]
- Hamilton, D.S. Deltaic depositional systems, coal distribution and quality, and petroleum potential, Permian Gunnedah basin, N.S.W., Australia. Sediment. Geol. 1985, 45, 35–75. [Google Scholar] [CrossRef]
- Hutton, A.C. Geological Setting of Australasian Coal Deposits. The Australasian Institute of Mining and Metallurgy. 2009. Available online: https://ro.uow.edu.au/scipapers/733 (accessed on 2 February 2021).
- Moffitt, R.S. A Compilation of the Geology of the Southern Coalfield: Notes to Accompany the 1:100 000 Southern Coalfield Geological Map; Geological Survey Report (Geological Survey of New South Wales); no. GS1998/277.; W. Geological Survey of New South, Dept. of Mineral Resources: Sydney, Australia, 2000.
- Salmachi, A.; Rajabi, M.; Reynolds, P.; Yarmohammadtooski, Z.; Wainman, C. The effect of magmatic intrusions on coalbed methane reservoir characteristics: A case study from the Hoskissons coalbed, Gunnedah Basin, Australia. Int. J. Coal Geol. 2016, 165, 278–289. [Google Scholar] [CrossRef]
- Tadros, N.Z. Maceral Composition: Variations and Significance to the Formation of the Hoskissons Coal Member, Gunnedah Basin. 1988, Geological Survey of New South Wales. Available online: https://search.geoscience.nsw.gov.au/product/770 (accessed on 2 February 2021).
- Faiz, M.; Saghafi, A.; Sherwood, N.; Wang, I. The influence of petrological properties and burial history on coal seam methane reservoir characterisation, Sydney Basin, Australia. Int. J. Coal Geol. 2007, 70, 193–208. [Google Scholar] [CrossRef]
- Pratt, W. Gunnedah Coalfield Regional Geology Maps 1:100,000. Explanatory Notes; New South Wales Department of Mineral Resources: Sydney, Australia, 1998.
- Martin, M.; Wakefield, M.; MacPhail, M.; Pearce, T.; Edwards, H. Sedimentology and stratigraphy of an intra-cratonic basin coal seam gas play: Walloon Subgroup of the Surat Basin, eastern Australia. Pet. Geosci. 2013, 19, 21–38. [Google Scholar] [CrossRef]
- Korsch, R.; O’Brien, P.; Sexton, M.; Wake-Dyster, K.; Wells, A. Development of Mesozoic transtensional basins in easternmost Australia. J. Geol. Soc. Aust. 1989, 36, 13–28. [Google Scholar] [CrossRef]
- Gallagher, K.; Dumitru, T.A.; Gleadow, A.J.W. Constraints on the vertical motion of eastern Australia during the Mesozoic. Basin Res. 1994, 6, 77–94. [Google Scholar] [CrossRef]
- Fielding, C.R. Mesozoic sedimentary basins and resources in eastern Australia. In Geological Society of Australia Abstracts; Geological Society of Australia: Hornsby, Australia, 1996; Volume 43, pp. 180–185. [Google Scholar]
- Raza, A.; Hill, K.C.; Korsch, R.J. Mid-Cretaceous uplift and denudation of the Bowen and Surat Basins, eastern Australia: Relationship to Tasman Sea rifting from apatite fission-track and vitrinite-reflectance data. Aust. J. Earth Sci. 2009, 56, 501–531. [Google Scholar]
- Smith, T.; Bianchi, V.; Capitanio, F.A. Subduction geometry controls on dynamic topography: Implications for the Jurassic Surat Basin. Aust. J. Earth Sci. 2019, 66, 367–377. [Google Scholar] [CrossRef]
- Hamilton, S.K.; Esterle, J.S.; Sliwa, R. Stratigraphic and depositional framework of the Walloon Subgroup, eastern Surat Basin, Queensland. Aust. J. Earth Sci. 2014, 61, 1061–1080. [Google Scholar] [CrossRef]
- Hentschel, A.; Esterle, J.; Golding, S.; Pacey, D. Petrologic and stable isotopic study of the Walloon Coal Measures, Surat basin, Queensland: Peat accumulation under changing climate and base level. Int. J. Coal Geol. 2016, 160, 11–27. [Google Scholar] [CrossRef]
- Khorasani, G.K. Oil-prone coals of the Walloon Coal Measures, Surat Basin, Australia. Geol. Soc. Lond. Spec. Publ. 1987, 32, 303–310. [Google Scholar] [CrossRef]
- Scott, S.; Anderson, B.; Crosdale, P.; Dingwall, J.; Leblang, G. Revised geology and coal seam gas characteristics of the walloon subgroup-Surat basin, Queensland. In Proceedings of the PESA Eastern Australian Basins Symposium II, Adelaide, Australia, 19–22 September 2004; Petroleum Exploration Society of Australia (PESA): Adelaide, Australia, 2004. [Google Scholar]
- Goscombe, P.; Coxhead, B. Clarence-Moreton, Surat, Eromanga, Nambour, and Mulgildie Basins. Geol. Aust. Coal Basins 1995, 1, 489–511. [Google Scholar]
- Laubach, S.E.; Marrett, R.A.; Olson, J.E.; Scott, A.R. Characteristics and origins of coal cleat: A review. Int. J. Coal Geol. 1998, 35, 175–207. [Google Scholar] [CrossRef]
- Sliwa, R.; Esterle, J. Re-evaluation of structure and sedimentary packages in the eastern Surat Basin. In Proceedings of the Eastern Australasian Basins Symposium III, Sydney, Australia, 14–17 September 2008; PESA: Sydney, Australia, 2008. [Google Scholar]
- Wainman, C.C.; McCabe, P.J. Evolution of the depositional environments of the Jurassic Walloon Coal Measures, Surat Basin, Queensland, Australia. Sedimentology 2019, 66, 1673–1699. [Google Scholar] [CrossRef]
- Morris, R.J.; Martin, A.M. Coal architecture, high-resolution correlation and connectivity: New insights from the Walloon Subgroup in the Surat Basin of SE Queensland, Australia. Pet. Geosci. 2017, 23, 251–261. [Google Scholar] [CrossRef]
- Scott, S.; Anderson, B.; Crosdale, P.; Dingwall, J.; Leblang, G. Coal petrology and coal seam gas contents of the Walloon Subgroup, Surat Basin, Queensland, Australia. Int. J. Coal Geol. 2007, 70, 209–222. [Google Scholar] [CrossRef]
- Hamilton, S.K.; Esterle, J.S.; Golding, S.D. Geological interpretation of gas content trends, Walloon Subgroup, eastern Surat Basin, Queensland, Australia. Int. J. Coal Geol. 2012, 101, 21–35. [Google Scholar]
- Ovenden, B. Old rocks, new tricks: A reinvigorated Cooper Basin offers growth opportunity. APPEA J. 2019, 59, 928–930. [Google Scholar] [CrossRef]
- Gravestock, D.; Hibburt, J.; Drexel, J. Petroleum Geology of South Australia: Cooper Basin; Government of South Australia: Adelaide, Australia, 1998; Volume 4.
- Strong, P.C.; Wood, G.R.; Lang, S.C.; Jollands, A.; Karalaus, E.; Kassan, J. High resolution palaeogeographic mapping of the fluvial-lacustrine Patchawarra Formation in the Cooper Basin, South Australia. APPEA J. 2002, 42, 65–81. [Google Scholar] [CrossRef]
- Mavromatidis, A. Two layer model of lithospheric compression and uplift/exhumation in an intracratonic setting: An example from the Cooper-Eromanga Basins, Australia. Int. J. Earth Sci. 2008, 97, 623–634. [Google Scholar] [CrossRef]
- Beeston, J. Coal rank and vitrinite reflectivity. Spec. Publ. the Geol. Soc. Aust. Coal Geol. Group 1995, 1, 83–92. [Google Scholar]
- Smyth, M. Organic petrology and clastic depositional environments with special reference to Australian coal basins. Int. J. Coal Geol. 1989, 12, 635–656. [Google Scholar] [CrossRef]
- Smith, M.; Cassel, R.; Evans, T. Coal and Coal Seam Gas Resource Assessment for the Cooper Subregion. Product 1.2 for the Cooper Subregion from the Lake Eyre Basin Bioregional Assessment; Department of the Environment, Bureau of Meteorology, CSIRO and Geoscience Australia: Canberra, Australia, 2015; pp. 1–40.
- Menpes, S.; Hill, A.; Sansome, A. Unconventional Hydrocarbon Plays in the Permian Succession, South Australia. In Proceedings of the Eastern Australian Basins Symposium IV, Brisbane, Australia, 11–14 September 2012; PESA: Brisbane, Australia, 2012; pp. 1–10. [Google Scholar]
- Hughes, W. Gloucester Basin. Geology of Australian Coal Basins; Special Publication; Ward, C.R., Harrington, H.J., Mallett, C.W., Beeston, J.W., Eds.; Geological Society of Australia Incorporated, Coal Geology Group: Sydney, Australia, 1995; Volume 1, pp. 417–430. [Google Scholar]
- McVicar, T.; Langhi, L.; Barron, O.; Rachakonda, P.; Zhang, Y.; Dawes, W.; Macfarlane, C.; Holland, K.; Wilkes, P.G.; Raisbeck-Brown, N.; et al. Context Statement for the Gloucester Subregion, Product 1.1 from the Northern Sydney Basin Bioregional Assessment; Department of the Environment, Bureau of Meteorology, CSIRO and Geoscience Australia: Canberra, Australia, 2014.
- Ward, C.R.; Bocking, M.; Ruan, C.-D. Mineralogical analysis of coals as an aid to seam correlation in the Gloucester Basin, New South Wales, Australia. Int. J. Coal Geol. 2001, 47, 31–49. [Google Scholar] [CrossRef]
- New South Wales Government. Initial Report-Independent Review of Coal Seam Gas Activities in New South Wales. 2013. Available online: https://www.chiefscientist.nsw.gov.au/__data/assets/pdf_file/0016/31246/130730_1046_CSE-CSG-July-report.pdf (accessed on 10 November 2020).
- Gurba, L.; Weber, C. The relevance of coal petrology to coalbed methane evaluation, using the Gloucester Basin Australia as a model. In Proceedings of the International Coalbed Methane Symposium 2001, Tuscaloosa, AL, USA, 14–16 May 2001; University of Alabama: Tuscaloosa, AL, USA, 2001. [Google Scholar]
- Brooke-Barnett, S.; Flottmann, T.; Paul, P.K.; Busetti, S.; Hennings, P.; Reid, R.; Rosenbaum, G. Influence of basement structures on in situ stresses over the Surat Basin, southeast Queensland. J. Geophys. Res. Solid Earth 2015, 120, 4946–4965. [Google Scholar] [CrossRef]
- Flottmann, T.; Brooke-Barnett, S.; Trubshaw, R.; Naidu, S.-K.; Kirk-Burnnand, E.; Paul, P.; Busetti, S.; Hennings, P. Influence of in-situ stresses on fracture stimulations in the Surat Basin, southeast Queensland. In SPE Unconventional Resources Conference and Exhibition-Asia Pacific; SPE-167064-MS: Brisbane, Australia, 2013; 14p. [Google Scholar]
- Mukherjee, S.; Rajabi, M.; Esterle, J.; Copley, J. Subsurface fractures, in-situ stress and permeability variations in the Walloon Coal Measures, eastern Surat Basin, Queensland, Australia. Int. J. Coal Geol. 2020, 222, 103449. [Google Scholar] [CrossRef]
- Rahman, M.K.; Suarez, Y.A.; Chen, Z.; Rahman, S.S. Unsuccessful hydraulic fracturing cases in Australia: Investigation into causes of failures and their remedies. J. Pet. Sci. Eng. 2007, 57, 70–81. [Google Scholar] [CrossRef]
- Rajabi, M.; Tingay, M.; King, R.; Heidbach, O. Present-day stress orientation in the Clarence-Moreton Basin of New South Wales, Australia: A new high density dataset reveals local stress rotations. Basin Res. 2017, 29, 622–640. [Google Scholar] [CrossRef]
- Tavener, E.; Flottmann, T.; Brooke-Barnett, S. In situ stress distribution and mechanical stratigraphy in the Bowen and Surat basins, Queensland, Australia. Geol. Soc. Lond. Spec. Publ. 2017, 458, 31–47. [Google Scholar] [CrossRef]
- Rajabi, M.; Tingay, M.; Heidbach, O. The present-day stress field of New South Wales, Australia. Aust. J. Earth Sci. 2016, 63, 1–21. [Google Scholar] [CrossRef]
- Rajabi, M.; Heidbach, O.; Tingay, M.; Reiter, K. Prediction of the present-day stress field in the Australian continental crust using 3D geomechanical-numerical models. Aust. J. Earth Sci. 2017, 64, 435–454. [Google Scholar] [CrossRef]
- Enever, J.; Pattison, C.; McWatters, R.; Clark, I. The relationship between in-situ stress and reservoir permeability as a component in developing an exploration strategy for coalbed methane in Australia. In Proceedings of the EUROCK’94: Rock Mechanics in Petroleum Engineering, Delft, The Netherlands, 29–31 August 1994; CSIRO: Delft, The Netherlands, 1994. [Google Scholar]
- Heidbach, O.; Rajabi, M.; Cui, X.; Fuchs, K.; Müller, B.; Reinecker, J.; Reiter, K.; Tingay, M.; Wenzel, F.; Xie, F.; et al. The World Stress Map database release 2016: Crustal stress pattern across scales. Tectonophysics 2018, 744, 484–498. [Google Scholar] [CrossRef]
- Gui, F.; Rahman, K.; Lockhart, D.; Cunha, D.; Meadows, D. High Stress Contrast between Different Lithologies and its Implications for Drilling and Stimulation in the Northern Cooper Basin. In Proceedings of the SPE Asia Pacific Oil & Gas Conference and Exhibition, Perth, Australia, 25–27 October 2016; Society of Petroleum Engineers: Perth, Australia, 2016; p. 16. [Google Scholar]
- Hillis, R.; Enever, J.R.; Reynolds, S.D. In situ stress field of eastern Australia. Aust. J. Earth Sci. 1999, 46, 813–825. [Google Scholar] [CrossRef]
- Barton, C.A.; Zoback, M.D.; Moos, D. Fluid flow along potentially active faults in crystalline rock. Geology 1995, 23, 683–686. [Google Scholar] [CrossRef]
- Ayers, W.B. Coalbed Gas Systems, Resources, and Production and a Review of Contrasting Cases from the San Juan and Powder River Basins. AAPG Bull. 2002, 86, 1853–1890. [Google Scholar]
- Olsen, T.N.; Brenize, G.; Frenzel, T. Improvement Processes for Coalbed Natural Gas Completion and Stimulation. In Proceedings of the SPE Annual Technical Conference and Exhibition, Denver, CO, USA, 5–8 October 2003; Society of Petroleum Engineers: Denver, CO, USA, 2003. [Google Scholar]
- Hillis, R.R.; Williams, A.F. The Contemporary Stress Field of the Barrow-Dampier Sub-Basin and Its Implications for Horizontal Drilling. Explor. Geophys. 1993, 24, 567–575. [Google Scholar] [CrossRef]
- Fisher, K.M.; Warpinski, N.R. Hydraulic-Fracture-Height Growth: Real Data. SPE Prod. Oper. 2012, 27, 8–19. [Google Scholar] [CrossRef]
- Zhang, Y.; Underschultz, J.; Langhi, L.; Mallants, D.; Strand, J. Numerical modelling of coal seam depressurization during coal seam gas production and its effect on the geomechanical stability of faults and coal beds. Int. J. Coal Geol. 2018, 195, 1–13. [Google Scholar] [CrossRef]
- Diamond, P.W.; Schatzel, S.J. Measuring the gas content of coal: A review. Int. J. Coal Geol. 1998, 35, 311–331. [Google Scholar] [CrossRef]
- Pashin, J. Hydrodynamics of coalbed methane reservoirs in the Black Warrior Basin: Key to understanding reservoir performance and environmental issues. Appl. Geochem. 2007, 22, 2257–2272. [Google Scholar] [CrossRef]
- Pashin, J.C. Variable gas saturation in coalbed methane reservoirs of the Black Warrior Basin: Implications for exploration and production. Int. J. Coal Geol. 2010, 82, 135–146. [Google Scholar] [CrossRef]
- Gurba, W.L.; Ward, C.R. Vitrinite reflectance anomalies in the high-volatile bituminous coals of the Gunnedah Basin, New South Wales, Australia. Int. J. Coal Geol. 1998, 36, 111–140. [Google Scholar] [CrossRef]
- Moore, T.A.; Bowe, M.; Nas, C. High heat flow effects on a coalbed methane reservoir, East Kalimantan (Borneo), Indonesia. Int. J. Coal Geol. 2014, 131, 7–31. [Google Scholar] [CrossRef]
- Close, J.C. Natural Fractures in Coal: Chapter 5. In Hydrocarbons from Coal; American Association of Petroleum Geologists: Tulsa, OK, USA, 1993. [Google Scholar]
- Dawson, W.G.K.; Esterle, J.S. Controls on coal cleat spacing. Int. J. Coal Geol. 2010, 82, 213–218. [Google Scholar] [CrossRef]
- Pattison, C.I.; Fielding, C.R.; McWatters, R.H.; Hamilton, L.H. Nature and origin of fractures in Permian coals from the Bowen Basin, Queensland, Australia. Geol. Soc. Lond. Spec. Publ. 1996, 109, 133–150. [Google Scholar] [CrossRef]
- Titheridge, D. Drilling induced fractures in coal core from vertical exploration well: A method to determine cleat azimuth, and the angle between cleat and maximum horizontal stress, and its application. In Proceedings of the 14th Coal Operators’ Conference, University of Wollongong, The Australasian Institute of Mining and Metallurgy & Mine Managers Association of Australia, Wollongong, Australia, 12–14 February 2014. [Google Scholar]
- Tyson, S.; Hurter, S.; Zhou, F.; Jami, M. Improvements in understanding short-range permeability variability in coal seam gas reservoirs. APPEA J. 2016, 56, 555. [Google Scholar] [CrossRef]
- Faraj, B.S.M.; Fielding, C.R.; Mackinnon, I.D.R. Cleat mineralization of Upper Permian Baralaba/Rangal Coal Measures, Bowen Basin, Australia. Geol. Soc. Lond. Spec. Publ. 1996, 109, 151–164. [Google Scholar] [CrossRef]
- Keshavarz, A.; Sakurovs, R.; Grigore, M.; Sayyafzadeh, M. Effect of maceral composition and coal rank on gas diffusion in Australian coals. Int. J. Coal Geol. 2017, 173, 65–75. [Google Scholar] [CrossRef]
- Chen, D.; Shi, J.-Q.; Durucan, S.; Korre, A. Gas and water relative permeability in different coals: Model match and new insights. Int. J. Coal Geol. 2014, 122, 37–49. [Google Scholar] [CrossRef]
- Connell, L. A new interpretation of the response of coal permeability to changes in pore pressure, stress and matrix shrinkage. Int. J. Coal Geol. 2016, 162, 169–182. [Google Scholar] [CrossRef]
- Harpalani, S.; Chen, G. Influence of gas production induced volumetric strain on permeability of coal. Geotech. Geol. Eng. 1997, 15, 303–325. [Google Scholar] [CrossRef]
- Palmer, I. Permeability changes in coal: Analytical modeling. Int. J. Coal Geol. 2009, 77, 119–126. [Google Scholar] [CrossRef]
- Palmer, I.; Mansoori, J. How permeability depends on stress and pore pressure in coalbeds: A new model. SPE Reserv. Eval. Eng. 1998, 1, 539–544. [Google Scholar]
- Palmer, I.; Moore, B.; Loftin, D. Cleat Porosity of Coals: New Understanding. In Proceedings of the 3rd Asia-Pacific Coalbed Methane Symposium, Brisbane, Australia, 3–6 May 2011; University of Queensland: Brisbane, Australia, 2011. [Google Scholar]
- Gray, I. Reservoir Engineering in Coal Seams: Part 1-The Physical Process of Gas Storage and Movement in Coal Seams. SPE Reserv. Eng. 1987, 2, 28–34. [Google Scholar] [CrossRef]
- Levine, J.R. Model study of the influence of matrix shrinkage on absolute permeability of coal bed reservoirs. Geol. Soc. Lond. Spec. Publ. 1996, 109, 197–212. [Google Scholar] [CrossRef]
- Palmer, I. Coalbed methane completions: A world view. Int. J. Coal Geol. 2010, 82, 184–195. [Google Scholar] [CrossRef]
- Queensland Government. Queensland Petroleum Exploration Data QPED, M.a.E. Department of Natural Resources, Editor. 2016. Available online: http://qldspatial.information.qld.gov.au/catalogue/custom/search.page?q=%22Queensland%20petroleum%20exploration%20data%20-%20QPED%22 (accessed on 6 March 2020).
- Salmachi, A.; Barkla, J. Investigation of permeability change in the Bandanna Coal Formation of the Fairview Field using time-lapse pressure transient analysis. APPEA J. 2019, 59, 289–301. [Google Scholar] [CrossRef]
- Gierhart, R.R.; Clarkson, C.R.; Seidle, J.P. Spatial variation of San Juan Basin Fruitland coalbed methane pressure dependent permeability: Magnitude and functional form. In Proceedings of the International Petroleum Technology Conference, Dubai, United Arab Emirates, 4–6 December 2007. [Google Scholar]
- Mazumder, S.; Scott, M.; Jiang, J. Permeability increase in Bowen Basin coal as a result of matrix shrinkage during primary depletion. Int. J. Coal Geol. 2012, 96–97, 109–119. [Google Scholar]
- Burgoyne, M.; Shrivastava, R. A practical workflow for characterizing stress-dependent behaviour of coal from changes in well productivity. J. Nat. Gas Sci. Eng. 2016, 33, 1025–1045. [Google Scholar] [CrossRef]
- Belushko, I.; Herwin, H.; Gouth, F. Dynamic behavior of a multi-layered coal seams gas reservoir in the Bowen Basin. In Proceedings of the Asia Pacific Oil & Gas Conference and Exhibition, Adelaide, Australia, 14–16 October 2014; Society of Petroleum Engineers, SPE-171538-MS: Adelaide, Australia, 2014. [Google Scholar]
- Clarkson, R.C.; Salmachi, A. Rate-transient analysis of an undersaturated CBM reservoir in Australia: Accounting for effective permeability changes above and below desorption pressure. J. Nat. Gas Sci. Eng. 2017, 40, 51–60. [Google Scholar] [CrossRef]
- Clarkson, C.; Jordan, C.; Gierhart, R.; Seidle, J. Production data analysis of CBM wells. In Proceedings of the Rocky Mountain Oil & Gas Technology Symposium, Denver, CO, USA, 16–18 April 2007; Society of Petroleum Engineers: Denver, CO, USA, 2007. [Google Scholar]
- Clarkson, C.R.; Jordan, C.L.; Gierhart, R.R.; Seidle, J.P. Production Data Analysis of Coalbed-Methane Wells. SPE Reserv. Eval. Eng. 2008, 11, 311–325. [Google Scholar] [CrossRef]
- Shi, Q.J.; Durucan, S. A Model for Changes in Coalbed Permeability During Primary and Enhanced Methane Recovery. SPE Reserv. Eval. Eng. 2005, 8, 291–299. [Google Scholar] [CrossRef]
- Shi, Q.J.; Durucan, S. Exponential growth in San Juan Basin Fruitland coalbed permeability with reservoir drawdown: Model match and new insights. SPE Reserv. Eval. Eng. 2010, 13, 914–925. [Google Scholar] [CrossRef]
- Palmer, I.D.; Moschovidis, Z.A.; Cameron, J.R. Coal failure and consequences for coalbed methane wells. In Proceedings of the SPE Annual Technical Conference and Exhibition; Dallas, TX, USA, 9–12 October 2005, Society of Petroleum Engineers: Dallas, TX, USA, 2005. [Google Scholar]
- Espinoza, D.N.; Pereira, J.M.; Vandamme, M.; Dangla, P.; Vidal-Gilbert, S. Desorption-induced shear failure of coal bed seams during gas depletion. Int. J. Coal Geol. 2015, 137, 142–151. [Google Scholar] [CrossRef]
- Keshavarz, A.; Badalyan, A.; Carageorgos, T.; Bedrikovetsky, P.; Johnson, R. Stimulation of coal seam permeability by micro-sized graded proppant placement using selective fluid properties. Fuel 2015, 144, 228–236. [Google Scholar] [CrossRef]
- Wei, C.; Zou, M.; Sun, Y.; Cai, Z.; Qi, Y. Experimental and applied analyses of particle migration in fractures of coalbed methane reservoirs. J. Nat. Gas Sci. Eng. 2015, 23, 399–406. [Google Scholar] [CrossRef]
- Bai, T.; Chen, Z.; Aminossadati, S.M.; Rufford, T.E.; Li, L. Experimental investigation on the impact of coal fines generation and migration on coal permeability. J. Pet. Sci. Eng. 2017, 159, 257–266. [Google Scholar] [CrossRef]
- Lu, M.; Connell, L. Coal failure during primary and enhanced coalbed methane production-Theory and approximate analyses. Int. J. Coal Geol. 2016, 154, 275–285. [Google Scholar] [CrossRef]
- Reisabadi, M.Z.; Haghighi, M.; Sayyafzadeh, M.; Khaksar, A. Effect of matrix shrinkage on wellbore stresses in coal seam gas: An example from Bowen Basin, east Australia. J. Nat. Gas Sci. Eng. 2020, 77, 103280. [Google Scholar] [CrossRef]
- Zare Reisabadi, M.; Haghighi, M.; Salmachi, A.; Sayyafzadeh, M.; Khaksar, A. Analytical modelling of coal failure in coal seam gas reservoirs in different stress regimes. Int. J. Rock Mech. Min. Sci. 2020, 128, 104259. [Google Scholar] [CrossRef]
- Khanna, A.; Keshavarz, A.; Mobbs, K.; Davis, M.; Bedrikovetsky, P. Stimulation of the natural fracture system by graded proppant injection. J. Pet. Sci. Eng. 2013, 111, 71–77. [Google Scholar] [CrossRef]
- Thomson, S.; Thomson, D.; Flood, P. Observations on the distribution of coal seam gas in the Sydney Basin and the development of a predictive model. Aust. J. Earth Sci. 2014, 61, 395–407. [Google Scholar] [CrossRef]
- Faiz, M.; Stalker, L.; Sherwood, N.; Saghafi, A.; Wold, M.; Barclay, S.; Choudhury, J.; Barker, W.; Wang, I. Bio-enhancement of coalbed methane resources in the Southern Sydney Basin. APPEA J. 2003, 43, 595–610. [Google Scholar] [CrossRef]
- Australian Gas Light (AGL). Hydrogeological Summary of the Camden Gas Project; AGL: Sydney, Australia, 2013; p. 46. [Google Scholar]
- Ryan, D.; Hall, A.; Erriah, L.; Wilson, P. The Walloon coal seam gas play, Surat Basin, Queensland. APPEA J. 2012, 52, 273–290. [Google Scholar] [CrossRef]
- Mazumder, S.; Jiang, J.; Sharma, V.; Sugiarto, I. Production Data Analysis of CBM Wells in Surat Basin. In SPE Unconventional Resources Conference and Exhibition-Asia Pacific; Society of Petroleum Engineers: Brisbane, Australia, 2013. [Google Scholar]
- Law, B. The relationship between coal rank and cleat spacing: Implications for the prediction of permeability in coal. In Proceedings of the 1993 International Coalbed Methane Symposium, Tuscaloosa, AL, USA, 17–21 May 1993; University of Alabama: Tuscaloosa, AL, USA, 1993. [Google Scholar]
- Esterle, J.; Williams, R.; Sliwa, R.; Malone, M. Variability in Gas Reservoir Parameters that Impact on Emissions Estimations for Australian Black Coals. ACARP project C13071. 2006. Available online: https://www.acarp.com.au/abstracts.aspx?repId=C13071 (accessed on 5 June 2020).
- Holford, S.; Schofield, N.; Jackson, C.; Magee, C.; Green, P.; Duddy, I. mpacts of igneous intrusions on source and reservoir potential in prospective sedimentary basins along the western Australian continental margin. In Proceedings of the West Australian Basins Symposium, Perth, Australia, 18–21 August 2013. [Google Scholar]
- Karacan, C.; Okandan, E. Fracture/cleat analysis of coals from Zonguldak Basin (northwestern Turkey) relative to the potential of coalbed methane production. Int. J. Coal Geol. 2000, 44, 109–125. [Google Scholar] [CrossRef]
- Li, H.; Ogawa, Y. Pore structure of sheared coals and related coalbed methane. Environ. Geol. 2001, 40, 1455–1461. [Google Scholar] [CrossRef]
- Howell, S.; Furniss, J.; Quammie, K.; Norman, K.; Erriah, L. History matching CSG production in the Surat basin. In Proceedings of the SPE Asia Pacific Oil & Gas Conference and Exhibition, Adelaide, Australia, 14–16 October 2014; Society of Petroleum Engineers: Adelaide, Australia, 2014. [Google Scholar]
- Santos, Dorodillo-2, Well Completion Report (Desorbable Gas Report). 1998: South Australian Department of State Development. Available online: https://sarigbasis.pir.sa.gov.au/WebtopEw/ws/samref/sarig1/wci/ResultSet (accessed on 4 February 2020).
- Carr, L.K.; Korsch, R.J.; Palu, T.J. Onshore Basin Inventory: The McArthur, South Nicholson, Georgina, Wiso, Amadeus, Warburton, Cooper and Galilee Basins, Central Australia; Record 2016/004; Geoscience Australia: Canberra, Auatralia, 2016. [Google Scholar]
- Hall, L.; Hill, A.; Troup, A.; Lawson, C.; Wang, L.; Smith, M. Cooper Basin Architecture and Lithofacies: Regional Hydrocarbon Prospectivity of the Cooper Basin Data Pack 1; Geoscience Australia: Canberra, Australia, 2016. Available online: http://www.ga.gov.au/metadata-gateway/metadata/record/90054 (accessed on 1 February 2020).
- Geoscience Australia. Australian Geological Provinces v02, Geoscience Australia, Canberra, Australia. 2013. Available online: https://data.gov.au/data/dataset/9ff62603-2aba-44d0-bb4b-165ee66c4cac (accessed on 10 March 2020).
- Strike Energy, Well Completion Report for Le Chiffre 1. 2014. Available online: https://sarigbasis.pir.sa.gov.au/WebtopEw/ws/samref/sarig1/wci/ResultSet (accessed on 2 February 2021).
- Strike Energy, Jaws-1 Technical Update. 2018. Available online: https://strikeenergy.com.au/asx-announcements/ (accessed on 5 February 2021).


| LNG Facility | Final Investment Decision | Train 1 1st Shipment | Train 2 1st Shipment | Companies Involved |
|---|---|---|---|---|
| Queensland Curtis Liquefied Natural Gas (QCLNG) | 30 October 2010 | 28 December 2014 | 5 July 2015 | Queensland Gas (British Gas–now Shell); CNOOC; Tokyo Gas |
| Gladstone Liquefied Natural Gas (GLNG) | 13 January 2011 | 27 September 2015 | 25 May 2016 | Santos; Total; Petronas; Kogas |
| Australia Pacific Liquefied Natural Gas APLNG | 4 July 2012 | 2 January 2016 | 6 October 2016 | Origin; ConocoPhillips; Sinopec |
| Stratigraphic Unit and Environment of Deposition | Age | Thickness (m) | Coal Bed Thickness (m) | Lateral Continuity (km) | Rank %Ro | Composition | Total Moisture Content (wt%) | Ash Content (%) |
|---|---|---|---|---|---|---|---|---|
| Moranbah Coal Measures/German Creek Formation (Deltaic) | Permian (Lopingian) | 100–800 | 5–8, net coal thickness 15 | Split and coalesce over 250 | 0.6–3.5 | 55–90% vitrinite, <1% liptinite, 9–39% inertinite | 8.0–11 | 5–15 |
| Rangal Coal Measures (Fluvio-deltaic) | Permian (Lopingian) | 25–240 | 1–7.7, net coal thickness 8 | >25 | 0.6–2.6 | 46–65% vitrinite, <1–3% liptinite, 3–53% inertinite | 8.0–12 | 6.9–10 |
| Baralaba Coal Measures/ Bandanna Formation (Fluvio-deltaic) | Permian (Lopingian) | 9–556 | 6- >30 m, net coal thickness 30 | High degree of lateral continuity | 0.6–2.6 | 30–70% vitrinite, <1–2% liptinite, up to 35% inertinite | 8–11 | 7–16 |
| Stratigraphic Unit and Environment of Deposition | Age | Thickness (m) | Coal Bed Thickness (m) | Lateral Continuity (km) | Rank %Ro | Composition | Total Moisture Content (wt%) | Ash Content (%) |
|---|---|---|---|---|---|---|---|---|
| Illawarra Coal Measures (southern Sydney Basin) (Fluvio-deltaic)) | Permian (Lopingian) | 520 | 2–5, net coal thickness in excess of 20 | High degree of lateral continuity | 0.8–1.43 | 30–79% vitrinite, <1–7% liptinite, inertinite 1–43% | 0.9–2.0 | 8.2–16.8 |
| Hoskissons Coal Member, Black Jack Group (Gunnedah Basin) (Back barrier) | Permian (Lopingian) | 2.4–18 m | <1.17 | Laterally extensive | 0.6–5.3 | 8–44% vitrinite, 2–5% liptinite, 53–87% inertinite | 2.5–5.7 | 9–21 |
| Author/s | Study Area | Method |
|---|---|---|
| Mazumder, Scott [157] | Moranbah gas project, Bowen Basin | Time-lapse pressure transient analysis (PTA) |
| Burgoyne and Shrivastava [158] | Scotia Field, Bowen Basin | Characterization of stress-dependent behaviour of coal from changes in well productivity |
| Belushko, Herwin [159] | Fairview Field, Bowen Basin | Production data analysis |
| Yarmohammadtooski, Salmachi [65] Clarkson and Salmachi [160] | Fairview Field, Bowen Basin | Production data analysis |
| Salmachi and Barkla [155] | Fairview Field, Bowen Basin | Time-lapse pressure transient analysis |
| Palmer and Mansoori [149] | San Juan Basin, the United States | Production history matching |
| Gierhart, Clarkson [156] | Time-lapse PTA of 28 infill wells |
Publisher’s Note: MDPI stays neutral with regard to jurisdictional claims in published maps and institutional affiliations. |
© 2021 by the authors. Licensee MDPI, Basel, Switzerland. This article is an open access article distributed under the terms and conditions of the Creative Commons Attribution (CC BY) license (https://creativecommons.org/licenses/by/4.0/).
Share and Cite
Salmachi, A.; Rajabi, M.; Wainman, C.; Mackie, S.; McCabe, P.; Camac, B.; Clarkson, C. History, Geology, In Situ Stress Pattern, Gas Content and Permeability of Coal Seam Gas Basins in Australia: A Review. Energies 2021, 14, 2651. https://doi.org/10.3390/en14092651
Salmachi A, Rajabi M, Wainman C, Mackie S, McCabe P, Camac B, Clarkson C. History, Geology, In Situ Stress Pattern, Gas Content and Permeability of Coal Seam Gas Basins in Australia: A Review. Energies. 2021; 14(9):2651. https://doi.org/10.3390/en14092651
Chicago/Turabian StyleSalmachi, Alireza, Mojtaba Rajabi, Carmine Wainman, Steven Mackie, Peter McCabe, Bronwyn Camac, and Christopher Clarkson. 2021. "History, Geology, In Situ Stress Pattern, Gas Content and Permeability of Coal Seam Gas Basins in Australia: A Review" Energies 14, no. 9: 2651. https://doi.org/10.3390/en14092651
APA StyleSalmachi, A., Rajabi, M., Wainman, C., Mackie, S., McCabe, P., Camac, B., & Clarkson, C. (2021). History, Geology, In Situ Stress Pattern, Gas Content and Permeability of Coal Seam Gas Basins in Australia: A Review. Energies, 14(9), 2651. https://doi.org/10.3390/en14092651