Article

Numerical Simulation Research on Improvement Effect of Ultrasonic Waves on Seepage Characteristics of Coalbed Methane Reservoir

1
State Key Laboratory of Oil and Gas Reservoir Geology and Exploitation, Southwest Petroleum University, Chengdu 610500, China
2
Petroleum Engineering School, Southwest Petroleum University, Chengdu 610500, China
3
Exploration and Development Division, CNPC Southwest Oil & Gasfield Company, Chengdu 610066, China
4
Engineering Technology Research Institute, CNPC Southwest Oil & Gasfield Company, Guanghan 618300, China
5
Exploration and Development Division, CNPC Huabei Oil field Company, Renqiu 062550, China
*
Author to whom correspondence should be addressed.
Energies 2021, 14(15), 4605; https://doi.org/10.3390/en14154605
Submission received: 14 May 2021 / Revised: 20 July 2021 / Accepted: 23 July 2021 / Published: 29 July 2021
(This article belongs to the Special Issue Gas Production from Coal Seam Gas/Deep Coal Seam Gas Reservoirs)

Abstract

:
The matrix pores of a coalbed methane (CBM) reservoir are mostly nanoscale pores, with tiny pore throats and poor connectivity, which belong to the category of low–permeability gas reservoirs. The matrix particles and organic pore surfaces adsorb a large amount of CBM. These problems are the main reasons that limit the increase in CBM production. At present, the primary measure to increase CBM production is hydraulic fracturing. However, due to the technical characteristics and geological conditions of CBM reservoirs, applying this technology to CBM exploitation still has some key issues that need to be resolved. Therefore, it is essential to develop a new technology that can effectively increase the production of CBM. This paper proposed a method that uses ultrasonic waves to improve the seepage characteristics of CBM reservoir and theoretically verifies the feasibility of this idea using numerical simulation. In this paper, we firstly coupled the temperature, pressure, and seepage parameters of the CBM reservoir and built a CBM seepage model under the action of ultrasonic waves. Secondly, by comparing the numerical simulation results with the experiment, we verified the accuracy of the model. Finally, on the basis of the mathematical model, we simulated the change characteristics of pore pressure, reservoir temperature, permeability, and porosity under the action of ultrasonic waves. Research results show that under the action of ultrasonic waves, the pressure-drop funnel of CBM reservoir becomes more apparent. The boundary affected by the pressure drop also increases. With the increase of the action time of ultrasonic waves, the temperature of CBM reservoir also increases, and the action distance is about 4 m. With decreased pore pressure, the permeability and porosity of CBM reservoir significantly increase under the action of ultrasonic waves. With increased ultrasonic power, its effect on reservoir permeability and porosity becomes more significant.

1. Introduction

As clean energy, natural gas can be considered as transitional energy from nonrenewable resources (e.g., oil and coal) to renewable resources (e.g., tide, wind, and nuclear power). [1,2,3,4]. It can fully compensate for the lack of the stability of renewable resources. Although natural gas is an environmentally friendly energy resource with a high utilization rate, it is not inexhaustible. With the continuous increase in global energy demand, conventional natural-gas resources can no longer meet the increasing energy consumption [5,6,7,8]. Therefore, countries worldwide have begun to increase their efforts to explore and exploit unconventional natural gas resources represented by coalbed methane (CBM) and shale gas. Among them, the emergence of CBM is considered the game changer of the international energy market. The prospective resources of global CBM are enormous. The total CBM resources of 74 countries worldwide are 268 × 1012 m3 [9,10,11]. The CBM mainly distributes in Russia, Canada, China, the United States, Australia, Germany, Poland, Britain, Ukraine, Kazakhstan, India, and South Africa, and the resources are between 107.8 × 10¹²–124.8 × 10¹² m3. The CBM resources of the first five countries all exceed 10 × 1012 m3 [12,13]. Figure 1 shows the proportion of CBM resources globally and the quantity of CBM resources in major coal–producing countries. Taking China as an example, the total amount of CBM resources in China is 36.81 × 10¹² m3, closer to the land conventional natural gas resources of 38 × 1012 m3 [14,15]. If we can fully exploit and utilize CBM resources and increase the proportion of CBM in natural gas, we can effectively deal with insufficient energy supply.
The structural characteristics of the CBM reservoir are different from the conventional natural gas reservoir. The CBM reservoir is a three-phase coexistence of coal, gas, and water [16,17,18]. It is a dual pore system composed of micropores and natural fractures. The micropores are strongly developed and have strong adsorption capacity. At present, scholars generally believe that the storage state of CBM includes a free state, dissolved state, and adsorbed state, and the adsorbed state is the main one. Figure 2 shows the occurrence and migration state of CBM in the reservoir. The migration of CBM in an adsorbed state generally goes through three stages [19,20,21]. (1) Desorption: Under the action of pressure difference, the CBM adsorbed onto the surface of micropores/microfractures begin to desorb. (2) Diffusion: Under the action of concentration difference, the desorbed CBM begins to diffuse from micropores/microfractures into macropores/macrofractures. (3) Seepage: Under the action of flow potential, CBM seeps into the wellbore from macropores/macrofractures. The particular storage form and 11complicated seepage mechanism of CBM often necessitate the use of corresponding stimulation technology when exploiting CBM. The basic principle is to increase production by increasing the CBM desorption and seepage rates.
Using hydraulic fracturing technology to increase the production of CBM is currently the most widely used and most mature production increase measure. The actual application situation on-site shows that hydraulic fracturing can indeed bring a good increase in production. However, scholars worldwide have raised several questions worth pondering about its application to increase the production of CBM:
(1)
Pollution of water resources. The core principle of using hydraulic fracturing to increase production is to increase the number of fluid passages between the formation and the wellbore and to expand these passages. Suppose the on-site operators do not accurately control the fracturing displacement. In that case, it may cause the fractures produced by the hydraulic fracturing to extend excessively, leading to the fractures in the formation water layer, and the fracturing fluid gradually mixes into the formation water. The composition of water-based fracturing fluid primarily includes water, proppant, and chemical additives, and the proportion of chemical additives is generally between 0.01% and 0.05% [22,23]. The composition of chemical additives contains various toxic substances, such as carcinogens, benzene, xylene, toluene, and formaldehyde [24,25]. The proportion of chemical additives in the water-based fracturing fluid is not high, but the total amount of toxic substances is high due to the large amount of fracturing fluid. If the water-based fracturing fluid mixes with the formation water, human health may be significantly harmed.
(2)
Earthquake. Researchers from Tufts University have shown that most seismic activities caused by hydraulic fracturing are small-scale and do not affect daily human life. However, when the injection depth exceeds 1000 m, it may cause destructive earthquakes [26]. Data from the US Geological Survey show that the strongest earthquake caused by hydraulic fracturing to date is the 5.8 magnitude earthquake that occurred in Oklahoma, USA, in 2016. This state has also experienced four earthquakes of magnitude 5.0 or higher, and all are related to hydraulic fracturing. Several surrounding states have also experienced more earthquakes of magnitude 4.5–5.0 due to hydraulic fracturing [27,28].
(3)
Damage of well structure. In the hydraulic fracturing process, fracturing fluid may enter the natural fractures that intersect the wellbore along a particular channel, causing the fluid pressure in the fracture to increase [29,30]. When the pressure of fracture increases to a critical value, the combined force of the frictional force on the fracture surface and the shear stress generated by the wellbore resisting the fracture surface slippage will be less than the shear stress of the formation slippage. In this case, natural fractures will slip, causing deformation of the casing. This seriously affects the productivity and fracturing time of CBM wells and becomes an important factor restricting the development of CBM.
(4)
Restrictions on geological conditions. Hydraulic fracturing requires large-scale fracturing equipment and large volumes of water. If the CBM production area is located in a mountainous region, it will be difficult to deploy hydraulic fracturing equipment and the fracturing operation cannot obtain a sufficient water source [31,32]. In this case, it is challenging to increase CBM production through hydraulic fracturing technology. From the above points of view, developing a safe, environmentally friendly, and easy-to-operate CBM production-increase technology is in line with the current actual needs of CBM application.
Ultrasonic wave is a high-frequency and high-energy mechanical wave. There are two main functions of ultrasonic waves. (1) Changing certain materials’ states [33,34]: This type of ultrasonic wave is generally called a power ultrasonic wave. Ultrasonic cleaning, ultrasonic oil extraction, and ultrasonic processing are all the main applications of this type of ultrasonic wave in real life and production. (2) Collecting information [35,36,37]: This type of ultrasonic wave generally relies on its strong penetrability to collect information inside the material, such as ultrasonic flaw detection and ultrasonic diagnosis. Researchers from the USA and the former Soviet Union proposed the technical idea of using ultrasonic waves to increase the production of tight oil reservoirs based on their first function. When ultrasonic waves act on microscopic molecules, they can exert a mechanical vibration effect and thermal effect on the microscopic molecules. The specific principle of action is as follows. (1) Mechanical vibration effect: When ultrasonic waves propagate in the reservoir, they cause tiny particles to vibrate. Due to the vibration, the stress state of particles in a reservoir changes from uniform to uneven, resulting in acceleration and loosening. The pore sizes of micropores/microfractures increase accordingly. On the other hand, the mineral composition inside the bedrock is different, and the particles with relatively small hardness will break due to vibration, thereby forming new fractures. High-frequency, high-energy ultrasonic waves will cause oil and gas molecules to vibrate, causing the oil and gas molecules to adsorb on the surface, unevenly stressed, gradually getting rid of constraints and turning into a free state. (2) Thermal effect: When oil and gas molecules absorb high-energy ultrasonic waves, they can produce significant thermal effects, which increase the Brownian motion, kinetic energy, and vibration amplitude of oil and gas molecules. Oil and gas molecules gradually break away from the surface of micropores/microfractures and transform into a free state. From the principle mentioned above of the effect of ultrasonic waves on micromolecules, it is feasible to apply ultrasonic waves to increase the production of CBM.
At present, the application of ultrasonic waves to the exploration and exploitation of CBM is mainly used for logging analysis and testing the reservoir space. The research on the combination of ultrasonic waves and CBM exploitation mainly analyzes the desorption rate of CBM under the influence of ultrasonic waves through experiments. However, the disadvantage is that due to the limitation of equipment performance and environmental factors, the experiment can only analyze the desorption rate of CBM under certain conditions. Unlike experiments, mathematical models can simulate various situations and provide a more comprehensive research scope to obtain results more efficiently. In order to more comprehensively explore the effect of improving the seepage characteristics of CBM reservoirs under the action of ultrasonic waves, in this paper, we firstly integrated the temperature, pressure, and seepage parameters of the CBM reservoir to build a mathematical model for simulation of CBM seepage under ultrasonic waves action. Second, we conducted an experiment on the characteristics of CBM permeability under the action of ultrasonic waves and compared the experimental test results with those from mathematical model to verify the latter’s reliability. Finally, we simulated and analyzed the change characteristics of pore pressure, reservoir temperature, permeability, and porosity of CBM reservoir under the action of ultrasonic waves. The conclusions we have obtained can provide a corresponding theoretical basis for applying ultrasonic waves to increase the production of CBM.

2. Mathematical Model

2.1. Assumptions

To effectively build the mathematical model and be able to solve it more conveniently, we put forward the following assumptions without affecting the accuracy of the calculation results:
(1)
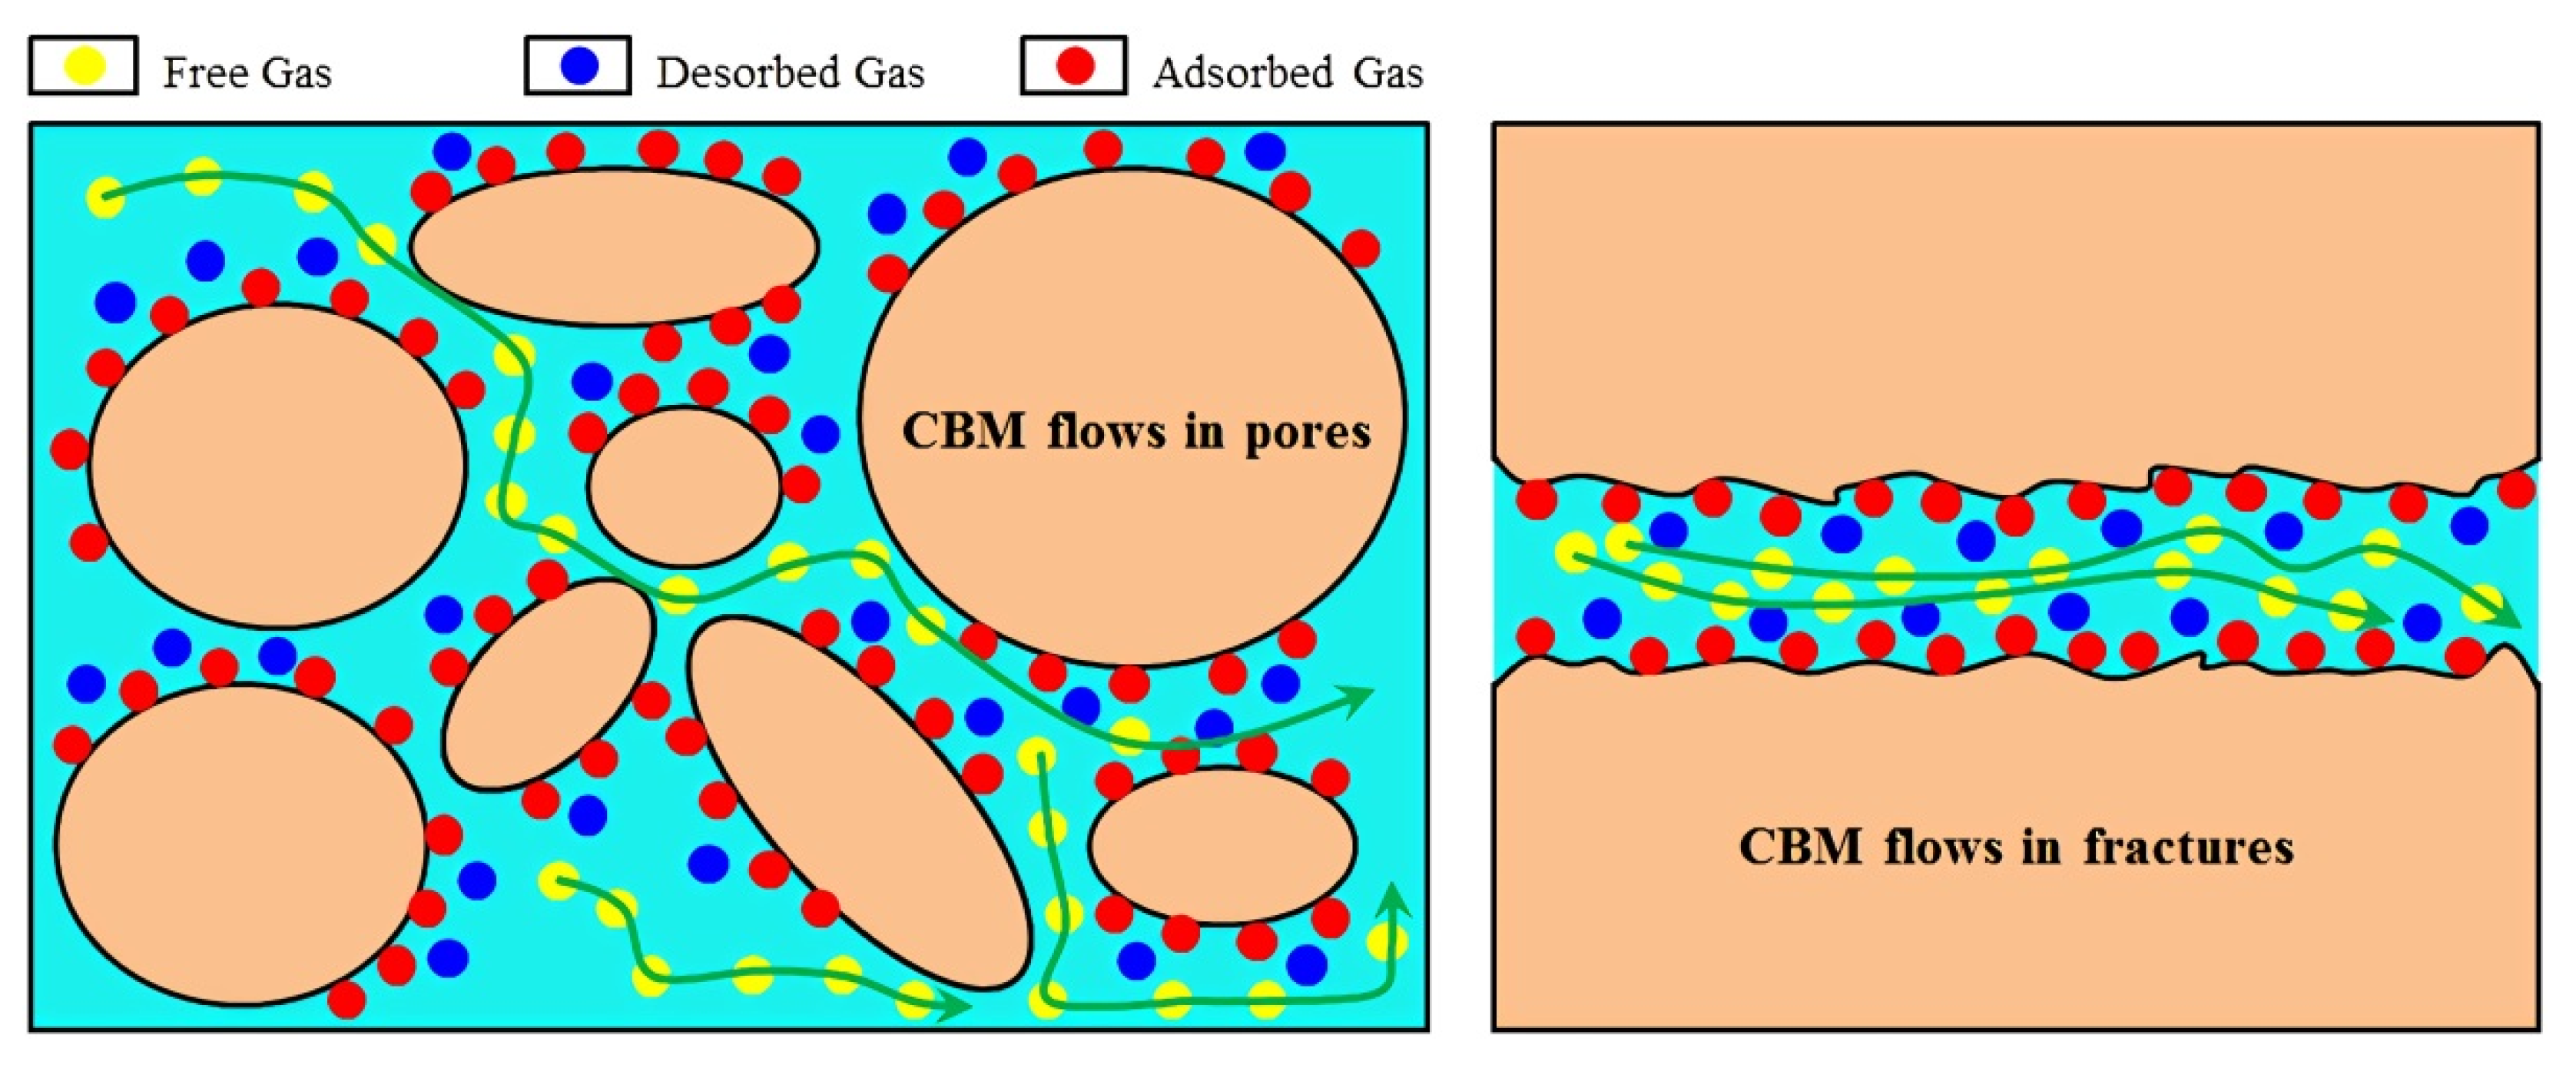
There are only micropores and microfractures in the reservoir.
(2)
CBM follows Darcy’s law when seepage in the reservoir.
(3)
Regard the time for the desorption of the adsorbed gas from the surface as 0.
(4)
All the energy of ultrasonic waves’ action is converted into heat energy.
(5)
Thermal physical parameters such as thermal conductivity, thermal expansion coefficient, and specific heat capacity do not change with reservoir temperature change.
(6)
Before exploitation, the reservoir is in a state of thermal equilibrium, and the CBM pressure is the original pore pressure.
(7)
When exploiting a well with a radius of rw, the bottom hole pressure remains constant.
(8)
There is no fluid seepage outside the gas reservoir boundary with a radius of re.

2.2. Governing Equations

2.2.1. Continuity Equation

The continuity equation for CBM seepage in the reservoir, as shown in Equation (1):
1 r r ( k μ g ρ g r p r ) = ( ϕ ρ g ) t + ρ des t
where r is the pore radius, m; k is the permeability of CBM reservoir, mD; μ g is the viscosity of CBM, mPa·s; ρ g is the density of CBM, kg·m–3; p is the pore pressure of CBM reservoir, MPa; ϕ is the porosity of CBM reservoir, dimensionless; ρ des is the density of desorbed gas, kg·m–3; t is the seepage time of CBM, s.
For the continuous flow of CBM, Equation (2) (Darcy formula) can be used to describe this process:
k = k μ g p = γ 1 · k μ g p r
where k is the permeability tensor, mD; γ 1 is the unit conversion factor, 10–6.
If we regard CBM as an ideal gas, the state equation of CBM is shown in Equation (3):
ρ g = γ 2 M g R T · p
where γ 2 is the unit conversion factor, 106; M g is the Molar weight of CBM, kg·mol1; T is the absolute temperature, K.
The Langmuir isotherm adsorption equations contain an accurate equation for calculating the density of the adsorbed gas, as shown in Equation (4):
ρ des = ρ m b p 1 + b p e n ( T 0 T )
where ρ m is the saturated gas density, kg·m–3; b is the pressure constant, MPa–1; n is the experimental coefficient, n = 0.02 0.993 + 0.0714 p ; T 0 is the temperature when the value of b is measured in the laboratory, K.
Substituting Equations (2)–(4) into Equation (1), the continuity equation can be transformed into the form shown in Equation (5):
1 r r ( r γ 2 M g R T p γ 1 k μ g p r ) = t ( ϕ γ 2 M g R T p ) + t ( ρ m b p 1 + b p e n ( T 0 T ) )
Expand the left term of Equation (5), and the obtained result is shown in Equation (6):
1 r r ( r γ 2 M g R T p γ 1 k μ g p r ) = γ 1 γ 2 M g R T k μ g 1 r r ( r · p p r ) + ( r · p p r ) 1 r r ( M g R T k μ g )
Expand the second term on the right side of Equation (6), and the obtained result is shown in Equation (7):
( r · p p r ) 1 r r ( M g R T k μ g ) = p p r [ ( M g R T k μ g ) T r + ( M g R T k μ g ) σ r + ( M g R T k μ g ) J r ]
In engineering, p r · T r , p r · σ r and p r · J r can be ignored, so Equation (6) can be rewritten as Equation (8):
1 r r ( r M g R T p k μ g p r ) = M g R T k μ g p 1 r r ( r · p r )
Expand the first term on the right side of Equation (5), and the obtained result is shown in Equation (9):
t ( ϕ γ 2 M g R T p ) = γ 2 M g R T ( ϕ p ) ( 1 ϕ ϕ p p t + 1 p p t ) ϕ p γ 2 M g R T 2 T t
Expand the second term on the right side of Equation (5), and the obtained result is shown in Equation (10):
t ( ρ m b p 1 + b p e n ( T 0 T ) ) = ρ m b 1 + b p e n ( T 0 T ) p t n ρ m b p 1 + b p e n ( T 0 T ) T t
Substituting Equations (8)–(10) into Equation (5), the continuity equation for CBM seepage in reservoir can be transformed into the form shown in Equation (11):
M g R T k μ g 1 r r ( r · p r ) = [ γ 2 M g R T ( ϕ p + ϕ p ) + ρ m b ( 1 + b p ) 2 e n ( T 0 T ) ] p t [ γ 2 ϕ M g R T 2 + n ρ m b ( 1 + b p ) e n ( T 0 T ) ] T t

2.2.2. Thermal Balance Equation

The thermal balance equation for CBM seepage in the reservoir is shown in Equation (12):
t [ ( ϕ ρ g c pg + ( 1 ϕ ) ρ s c ps ) T ] = 1 r r ( r ϕ ρ g c pg μ r T ) + Δ H ρ μ t + λ s 1 r r ( r T r ) + J
where ρ s is the density of coal matrix, kg·m–3; c pg is the specific heat capacity of free gas, J·kg1·K1; c ps is the specific heat capacity of coal matrix, J·kg1·K1; Δ H is the adsorption heat of coal matrix, J·kg1; λ s is the effective thermal conductivity of coal matrix, J·m1·K1; J is the intensity of the ultrasonic waves, W·m2.
Regarding the density, specific heat capacity of coal matrix and the specific heat capacity of free gas as constants, the Equations (13) and (14) can be obtained:
t [ ( ϕ ρ g c pg + ( 1 ϕ ) ρ s c ps ) T ] = c pg T t ( ϕ ρ g ) + [ ϕ ρ g c pg + ( 1 ϕ ) ρ s c ps ] T t
1 r r ( r · ϕ ρ g c pg μ r · T ) = c pg · T 1 r r ( r · ϕ ρ g μ r ) + ( ϕ ρ g c pg μ r ) T r
Substituting Equations (13) and (14) into Equation (12), the thermal balance equation can be transformed into the form shown in Equation (15):
[ γ 2 ϕ c pg M g R T p + ρ s c ps + n ρ m b ( 1 + b p ) e n ( T 0 T ) ] T t = ( c pg T + Δ H ) · ρ m b ( 1 + b p ) 2 e n ( T 0 T ) p t + λ s 1 r r ( r · T r ) + J
The intensity of ultrasonic waves can be calculated via Equation (16):
J = J 0 e 2 α l
where J 0 is the initial intensity of ultrasonic waves, W·m2; α is the attenuation coefficient of ultrasonic waves, m–1; l is the propagation distance of ultrasonic waves, m.

2.2.3. Seepage Parameter Equation

In 1990, Sawyer et al. proposed a momentum relationship between porosity, matrix pore compressibility, and shrinkage/expansion:
ϕ = ϕ 0 [ 1 + C p ( p p 0 ) ] C m ( 1 ϕ 0 ) ( Δ p 0 Δ c 0 ) ( c c 0 )
where ϕ 0 is the porosity of CBM reservoir under initial conditions, dimensionless; C p is the compression factor of pore volume, MPa–1; p 0 is the initial pore pressure, MPa; C m is the compression factor of coal-rock, MPa–1; Δ p 0 is the maximum pressure change at the beginning of desorption, MPa; Δ c 0 is the maximum concentration change at the beginning of desorption, dimensionless; c is the concentration of free gas, dimensionless; c 0 is the concentration of free gas at the beginning of desorption, dimensionless.
On the basis of Equation (17), Palmer and Mmansoori proposed an equation describing the relationship between reservoir stress, pore pressure, and porosity, which can be expressed via Equation (18):
ϕ = ϕ 0 + 1 M ( p p 0 ) + ( K M 1 ) ε 1 [ b p ( 1 + b p ) b p 0 ( 1 + b p 0 ) ]
where M is the axial modulus, MPa; K is the bulk modulus, MPa; ε 1 is the expansion/contraction coefficient, MPa–1.
In the process of gas desorption, the relationship between the stress and strain of linear elastic porous media can be used to describe the characteristics of stress changes in the reservoir. Moreover, the change of the contraction and expansion of the matrix can be represented by the Langmuir curve. The expression between pore pressure and skeleton stress is shown in Equation (19):
σ = σ 0 ν 1 ν ( p p 0 ) + E 3 ( 1 ν ) ε 1 ( b p 1 + b p b p 0 1 + b p 0 )
where ν is the Poisson’s ratio, dimensionless; E is the elastic modulus, MPa; σ is the skeleton stress, MPa; σ 0 is the initial skeleton stress, MPa.

2.3. Initial and Boundary Conditions

2.3.1. Initial Conditions

When solving the mathematical model, the pore pressure, reservoir temperature, and skeleton stress at the initial moment are set as the initial pore pressure, initial reservoir temperature, and initial skeleton stress, respectively. The specific form is shown in Equation (20):
{ p ( r , t = 0 ) = p 0 T ( r , t = 0 ) = T 0 σ ( r , t = 0 ) = σ 0

2.3.2. Boundary Conditions

Assuming that the CBM reservoir is a closed boundary, and the bottom hole pressure during CBM exploitation remains constant, the internal boundary condition is shown in Equation (21):
p ( r w , t ) = p wf
where p wf is the bottom hole pressure, MPa; r w is the well radius, m.
The outer boundary conditions are shown in Equation (22):
{ ( p r ) r = r e = 0 ( σ r ) r = r e = 0 ( λ s T r ) r = r e = h e ( T T 0 )
where r e is the reservoir boundary or single well supply radius, m; h e is the effective heat transfer coefficient, J·m2·K1.

2.4. Model Solution

Because Equations (11) and (15) have differential terms about time and space, we cannot obtain analytical solutions. Therefore, we use the finite difference method to solve them. In order to ensure the convergence and stability of the Equation, we use the forward difference method for solving the first-order time and space terms, as shown in Equation (23):
{ T t = T i n + 1 T i n Δ t p t = p i n + 1 p i n Δ p
where T i n is the temperature value of a position i in space at time n; p i n is the pressure value of a position i in space at time n.
For the second-order time and space terms, we use the central difference method for solving them, as shown in Equation (24):
{ r ( r p r ) = r i + 1 2 ( p i + 1 n p i n ) r i 1 2 ( p i n p i 1 n ) Δ r 2 r ( r T r ) = r i + 1 2 ( T i + 1 n T i n ) r i 1 2 ( T i n T i 1 n ) Δ r 2
Reorganize Equations (11) and (15) according to the above method, and the result is shown in Equation (25):
{ T i n + 1 = A 2 C 1 A 1 C 2 A 1 B 2 A 2 B 1 Δ t + T i n p i n + 1 = B 2 C 1 B 1 C 2 A 1 B 2 A 2 B 1 Δ t + p i n
A , B , and C in Equation (25) can be calculated via Equation (26):
{ A 1 = γ 2 M g R T ( ϕ p + ϕ p ) + ρ m b ( 1 + b p ) 2 e w ( T 0 T ) B 1 = γ 2 ϕ M g R T 2 + w ρ m b 1 + b p e w ( T 0 T ) C 1 = M g R T k μ g 1 r r i + 1 2 ( p i + 1 n p i n ) r i 1 2 ( p i n p i 1 n ) Δ r 2 A 2 = ( c pg T + Δ H ) ρ m b ( 1 + b p ) 2 e w ( T 0 T ) B 2 = γ 2 ϕ c pg M g R T p + ρ s c ps + w ρ m b 1 + b p e w ( T 0 T ) C 2 = λ s 1 r r i + 1 2 ( T i + 1 n T i n ) r i 1 2 ( T i n T i 1 n ) Δ r 2 J

3. Verification Experiment

3.1. Experimental Materials

The coal samples used in this experiment were taken from the Xuanwei Formation, Yibin City, Southern Sichuan, China. The core depth was 2032–2241 m, and the formation temperature distribution was 60.96–67.23 °C. When processing the experimental samples, the plunger samples were drilled perpendicular to the direction of the coal bed formation. The maximum nonparallelism between the two ends of the sample did not exceed 0.05 mm, the end face was perpendicular to the axis, and the maximum deviation did not exceed 0.25°. The sample was generally dark gray. The observation results from the polarizing microscope showed that the samples used in this experiment were relatively uniform, with mainly quartz, plagioclase, and clay minerals, and a small amount of pyrite and calcite. The overall weathering degree of coal-rock samples was low, and the lithology was relatively stable.

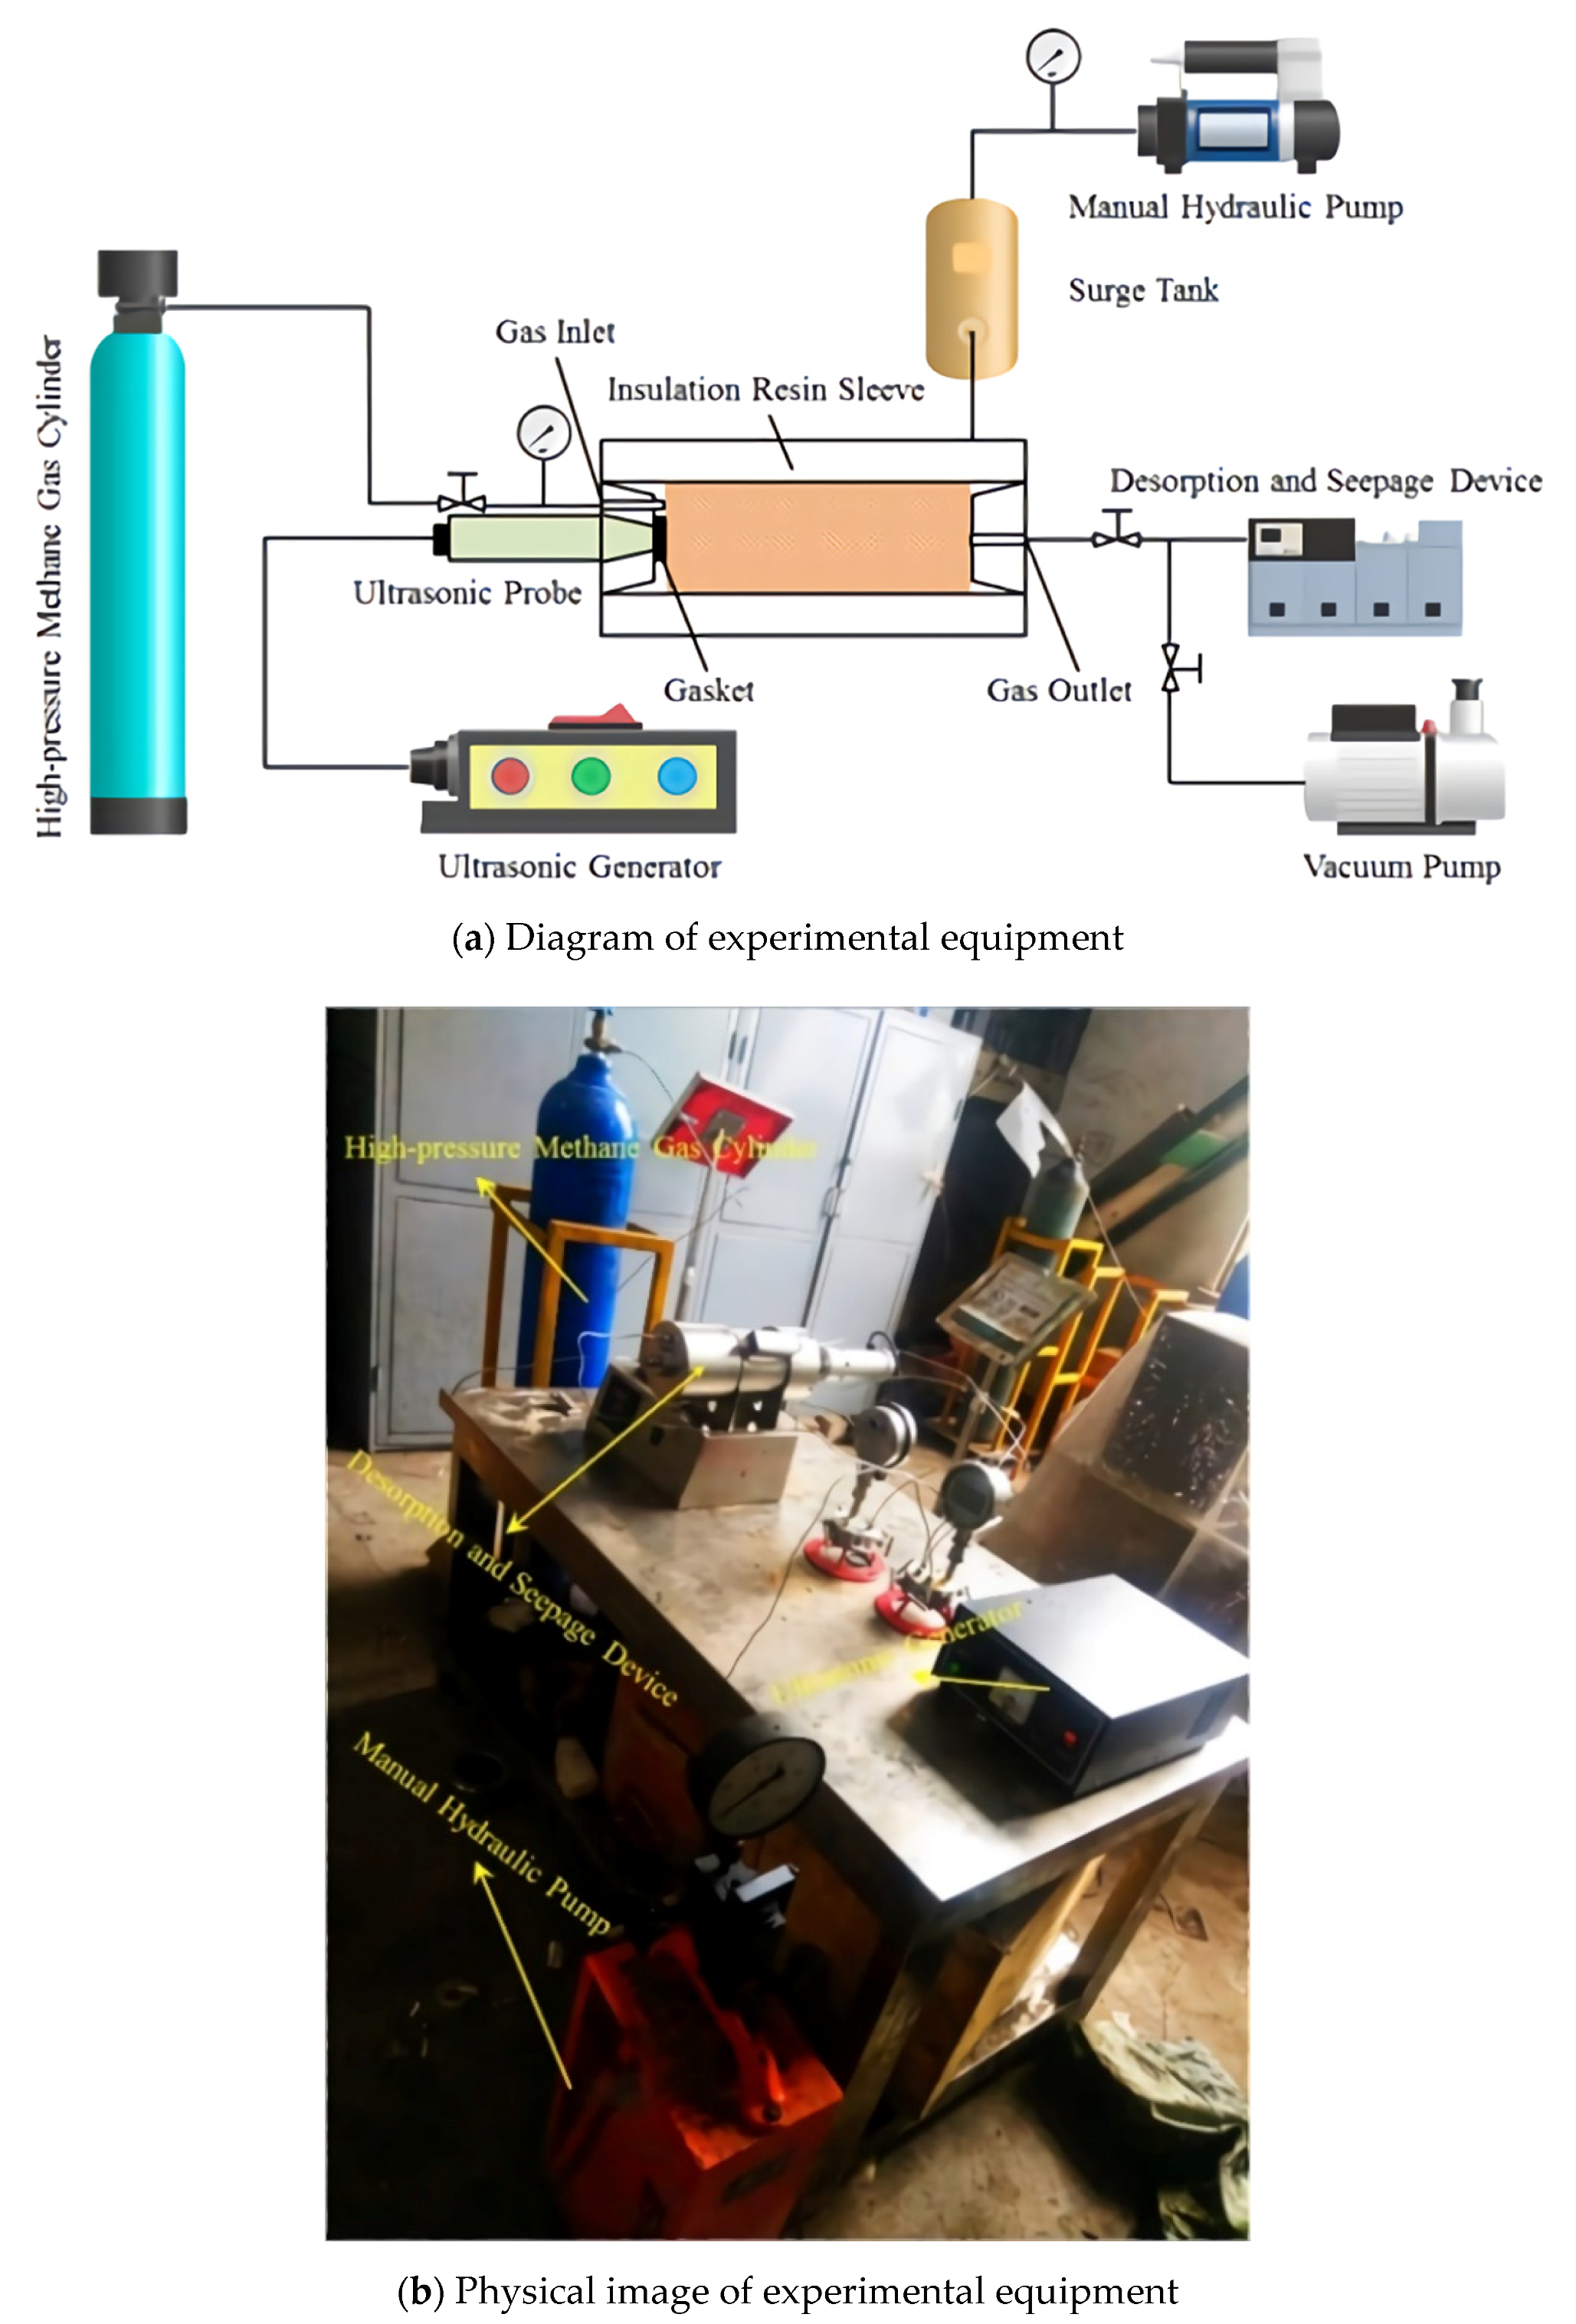
3.2. Experimental Equipment

To verify the accuracy of the calculation results of the mathematical model, we designed and assembled the equipment for testing the change of coal permeability under the action of ultrasonic waves. Figure 3 shows the experimental equipment. In this equipment, the high-pressure methane cylinder was used as the gas source to inject the gas required for the experiment into the coal sample; the ultrasonic generator was used as the sound source to provide the ultrasonic waves required for the experiment; the ultrasonic probe was used to transmit the ultrasonic waves generated by the ultrasonic generator to the coal sample container; the vacuum pump was used to extract the residual gas in the coal sample after the experiment, so as not to affect the next set of the experiment; the cooperation of the surge tank and the manual hydraulic pump can maintain the stability of the pressure of the coal sample container, thereby reducing unnecessary variables in the experiment.

3.3. Experimental Method

The experiment primarily followed the following steps to examine the seepage characteristics of CBM under ultrasonic waves:
(1)
The coal sample was sealed with the sample-sealing sleeve, and both its ends were pressed with pressure plates before placing them in the pressure vessel.
(2)
After installing the sample, we started to apply a confining pressure of 10 MPa.
(3)
The vacuum pump was turned on for 1 h of degassing.
(4)
After the degassing was completed, we closed the return valve, opened the intake valve, and passed in high-pressure methane gas for adsorption for 1 hour.
(5)
The return valve was opened, and the drainage method was used to measure the flow rate.
(6)
After the bubbles were continuously and stably discharged, the drainage volume was recorded time three times under each condition to obtain the average value.
(7)
After gas flow without the ultrasonic effect became stable, the ultrasonic generator was turned on and the drainage volume and time were measured under the ultrasonic effect.

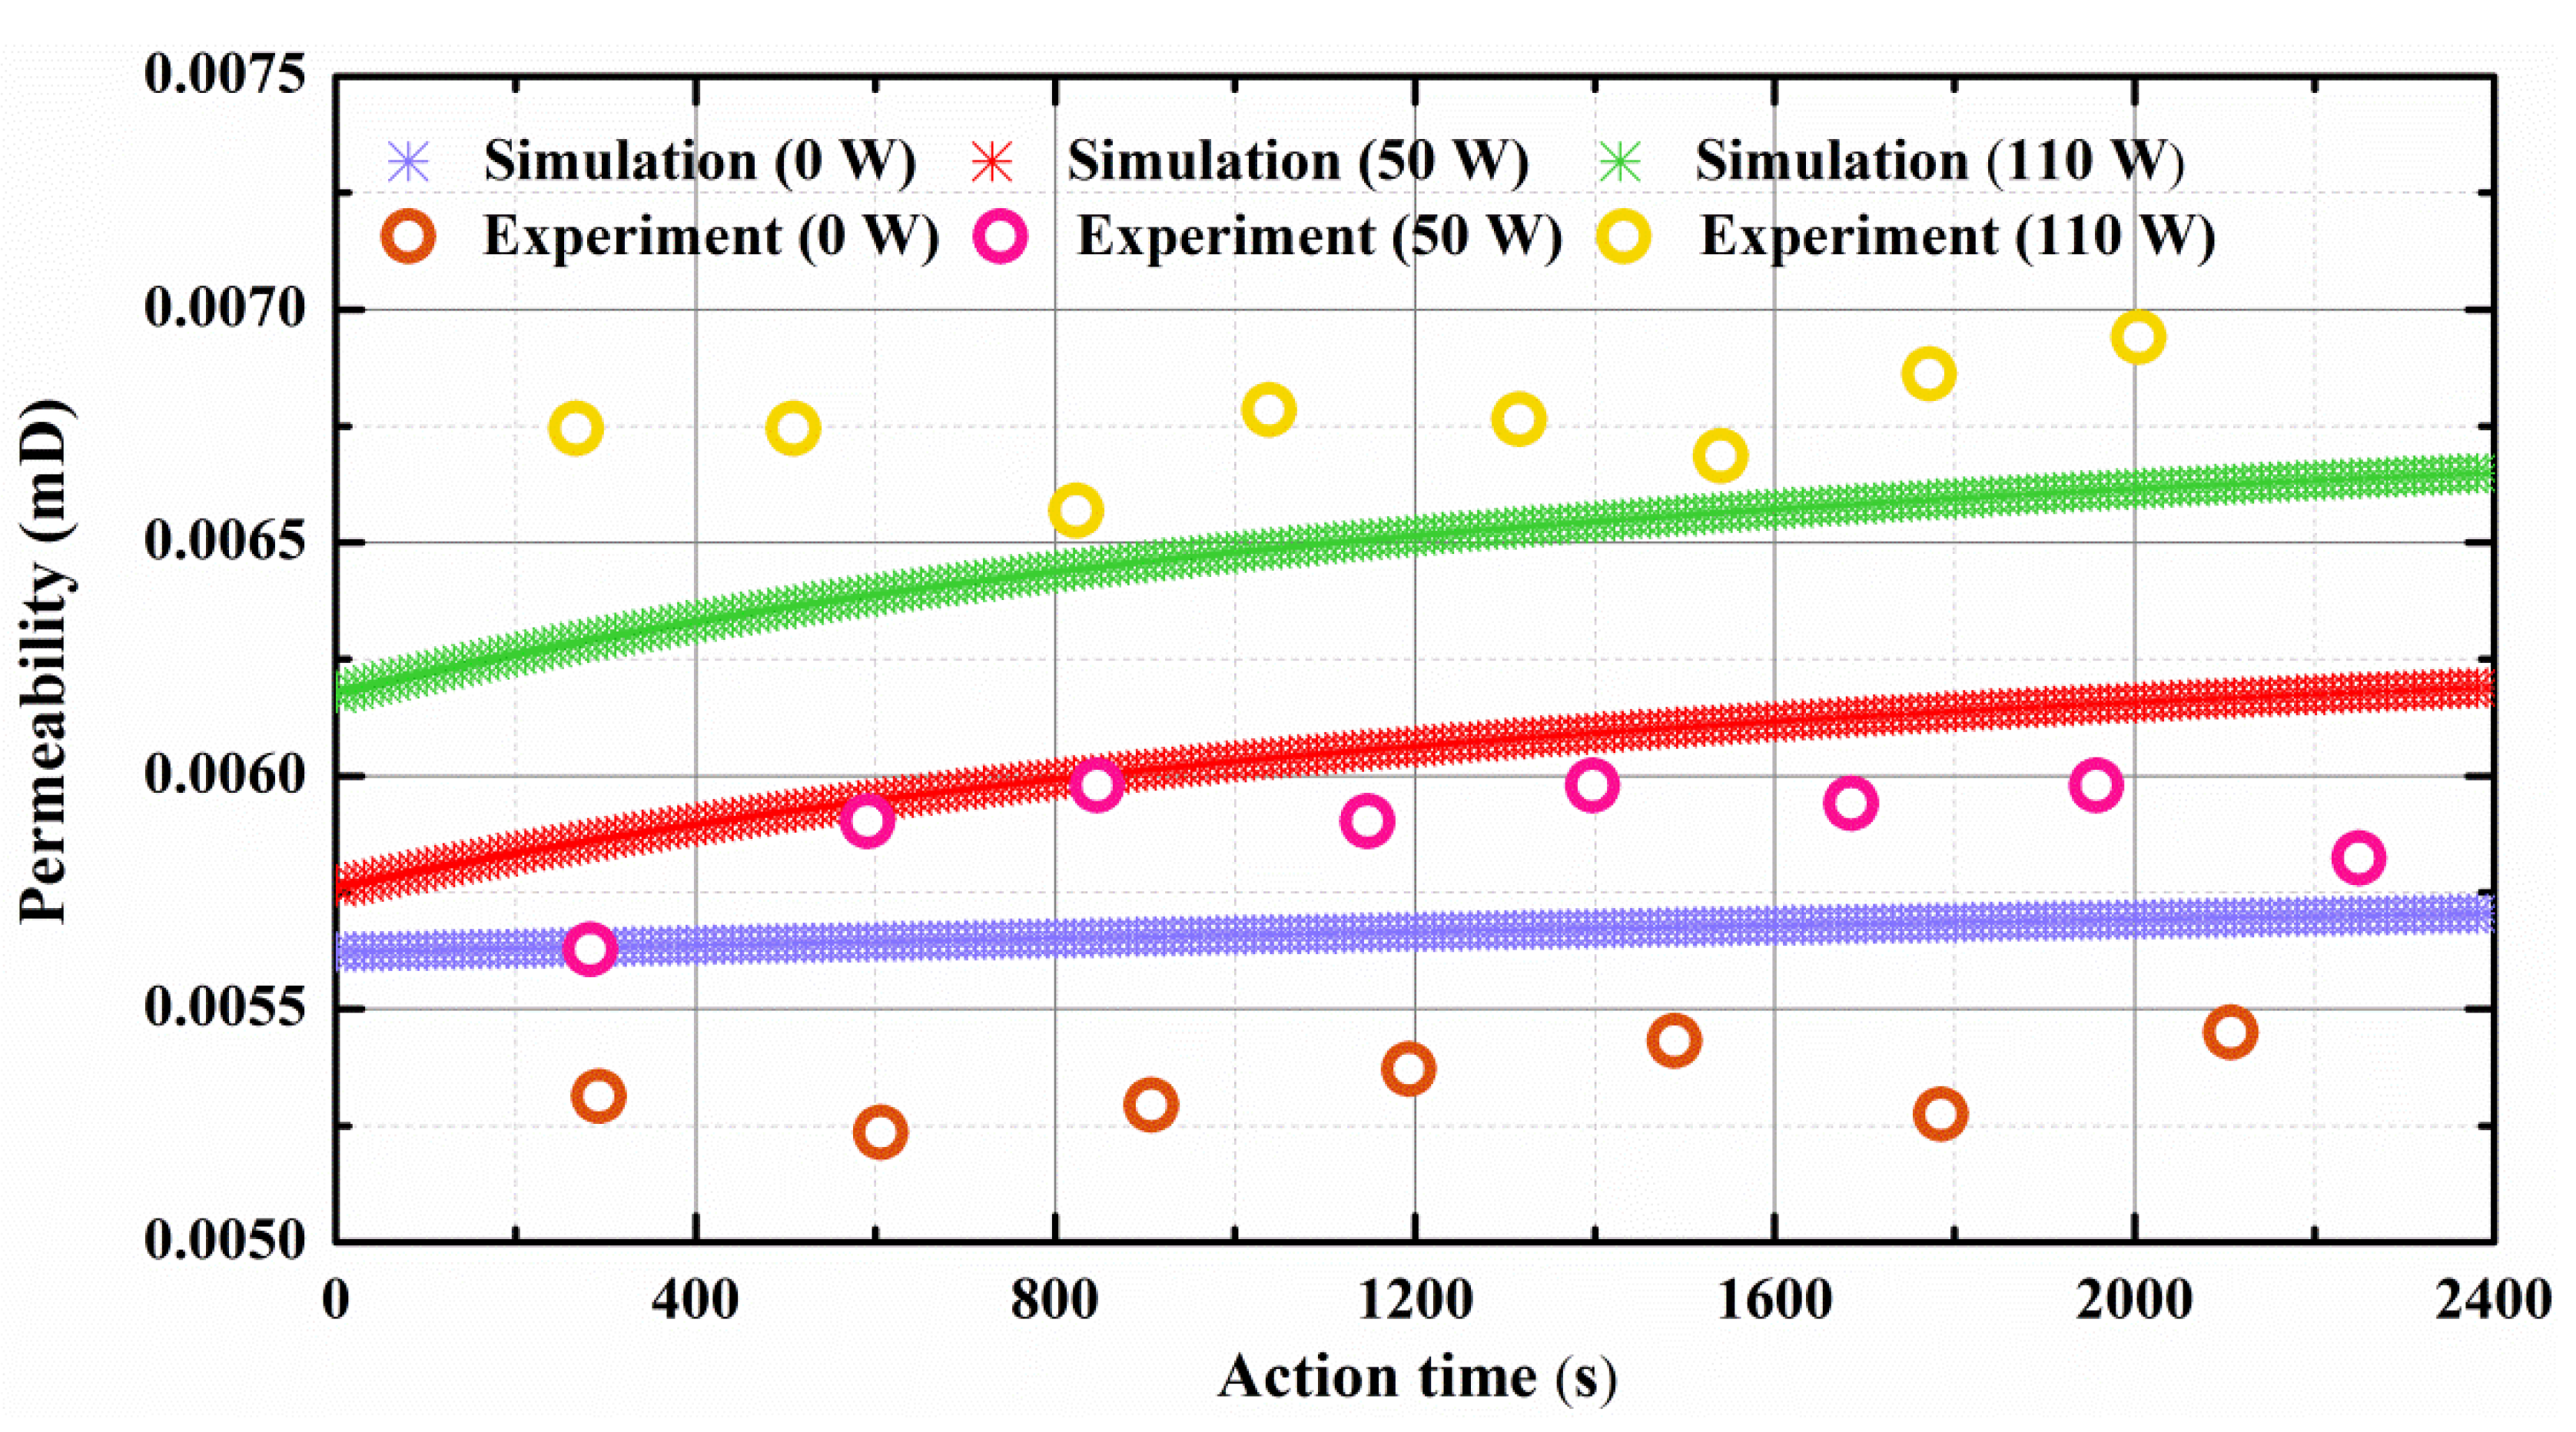
3.4. Verification Results

Figure 4 shows the simulation results and experimental results of coal permeability after 40 min of ultrasonic waves action at different powers. The frequency of the ultrasonic waves used in the experiment was 24 kHz.
Figure 4 shows that the simulation results of coal permeability under the action of ultrasonic waves were consistent with the experimental results. When the ultrasonic power was 0 W, the simulation result was larger than the experimental result as a whole, and the deviation was 4–5%. When the ultrasonic power was 50 W, the simulation results and the experimental results were more consistent in the 600–2000 s interval, and the deviation was 5–8%. When the ultrasonic power was 110 W, the simulation result was smaller than the experimental result as a whole, and the deviation was 2–8%. The comparison result of numerical simulation and the experimental test showed that the calculation result of the mathematical model could more accurately reflect the change of coal-rock permeability under the action of ultrasonic waves.

4. Effect of Ultrasonic Waves on CBM Reservoir

The specific values of the relevant parameters input during the mathematical modeling in Section 2 are shown in Table 1.

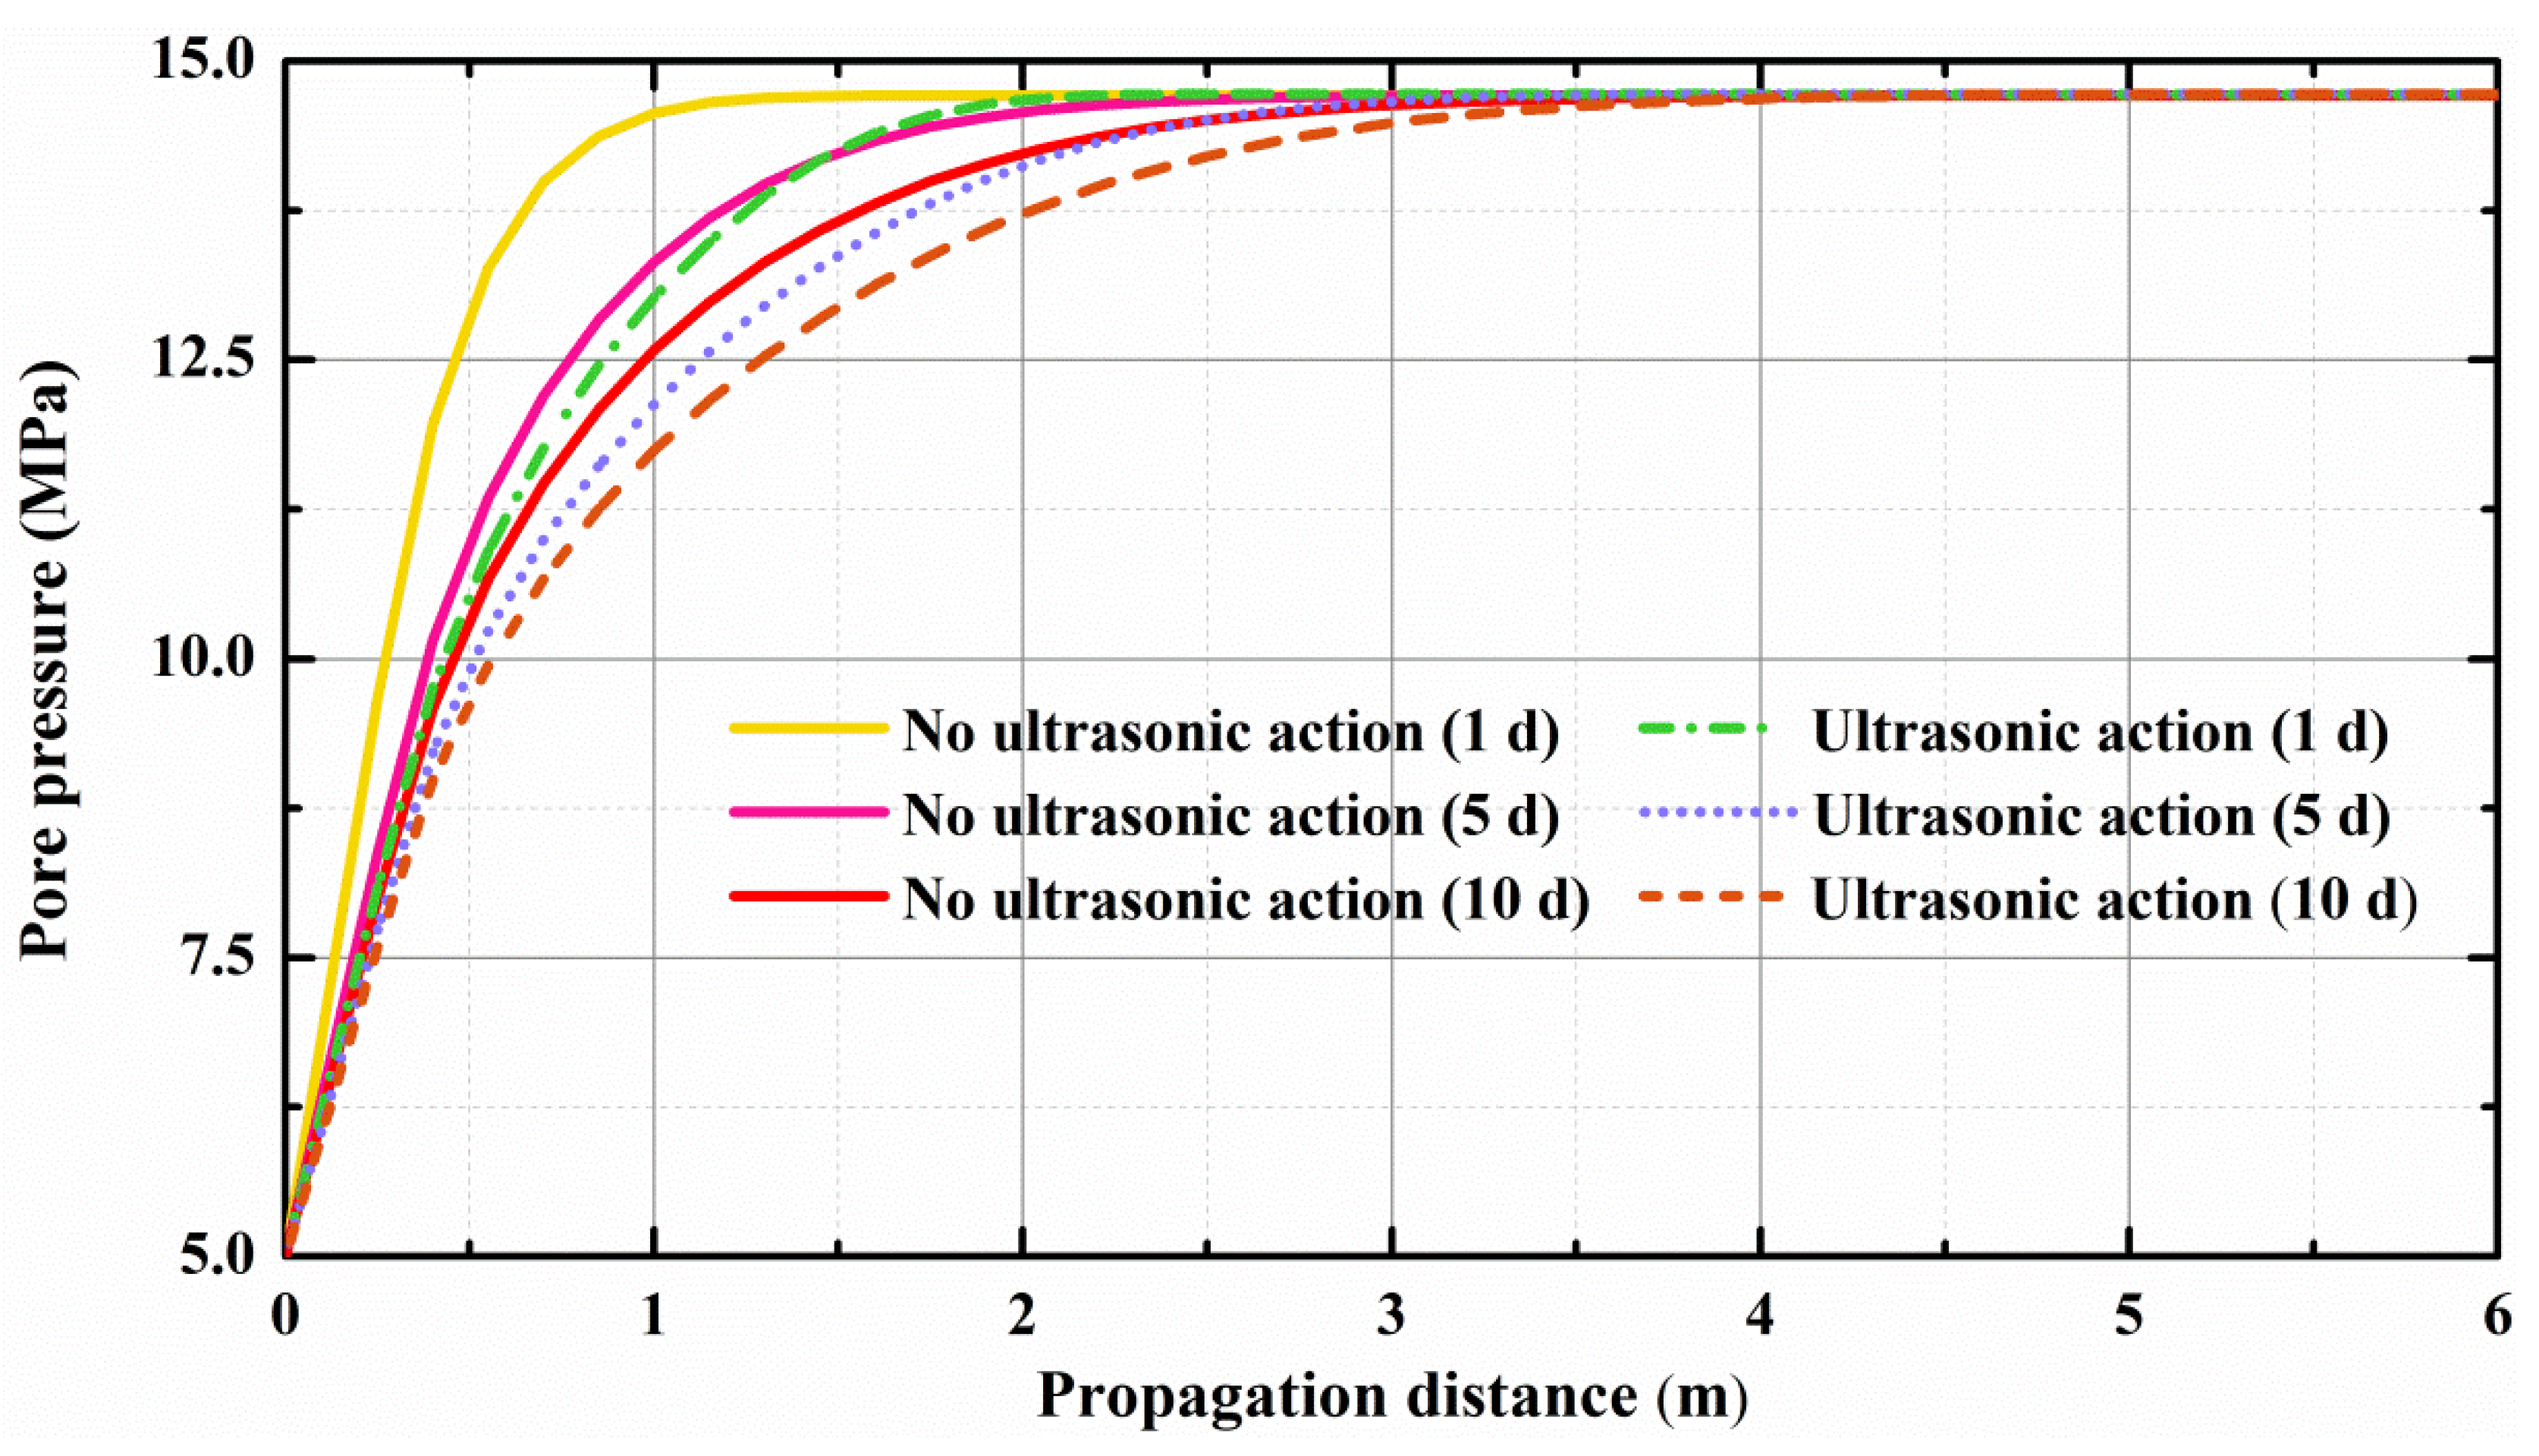
4.1. Effect of Ultrasonic Waves on Pore Pressure

Figure 5 shows the distribution characteristics of the pore pressure for the cases of no ultrasonic effect and ultrasonic effect.
Figure 5 shows that with the increase in production time, the influence on the pressure-drop gradually expanded from the bottom of the well to the inside of the reservoir. Observing the curve with a production time of 10 d, we found that the pressure- drop propagation was about 3 m when the effect of ultrasonic waves was not considered. If we consider the effect of ultrasonic waves, under the same production time of 10 d, the propagation of pressure-drop increased to about 4 m. Therefore, under the action of ultrasonic waves, the pressure-drop propagation was more apparent, and the boundary of the pressure-drop was also significantly increased.

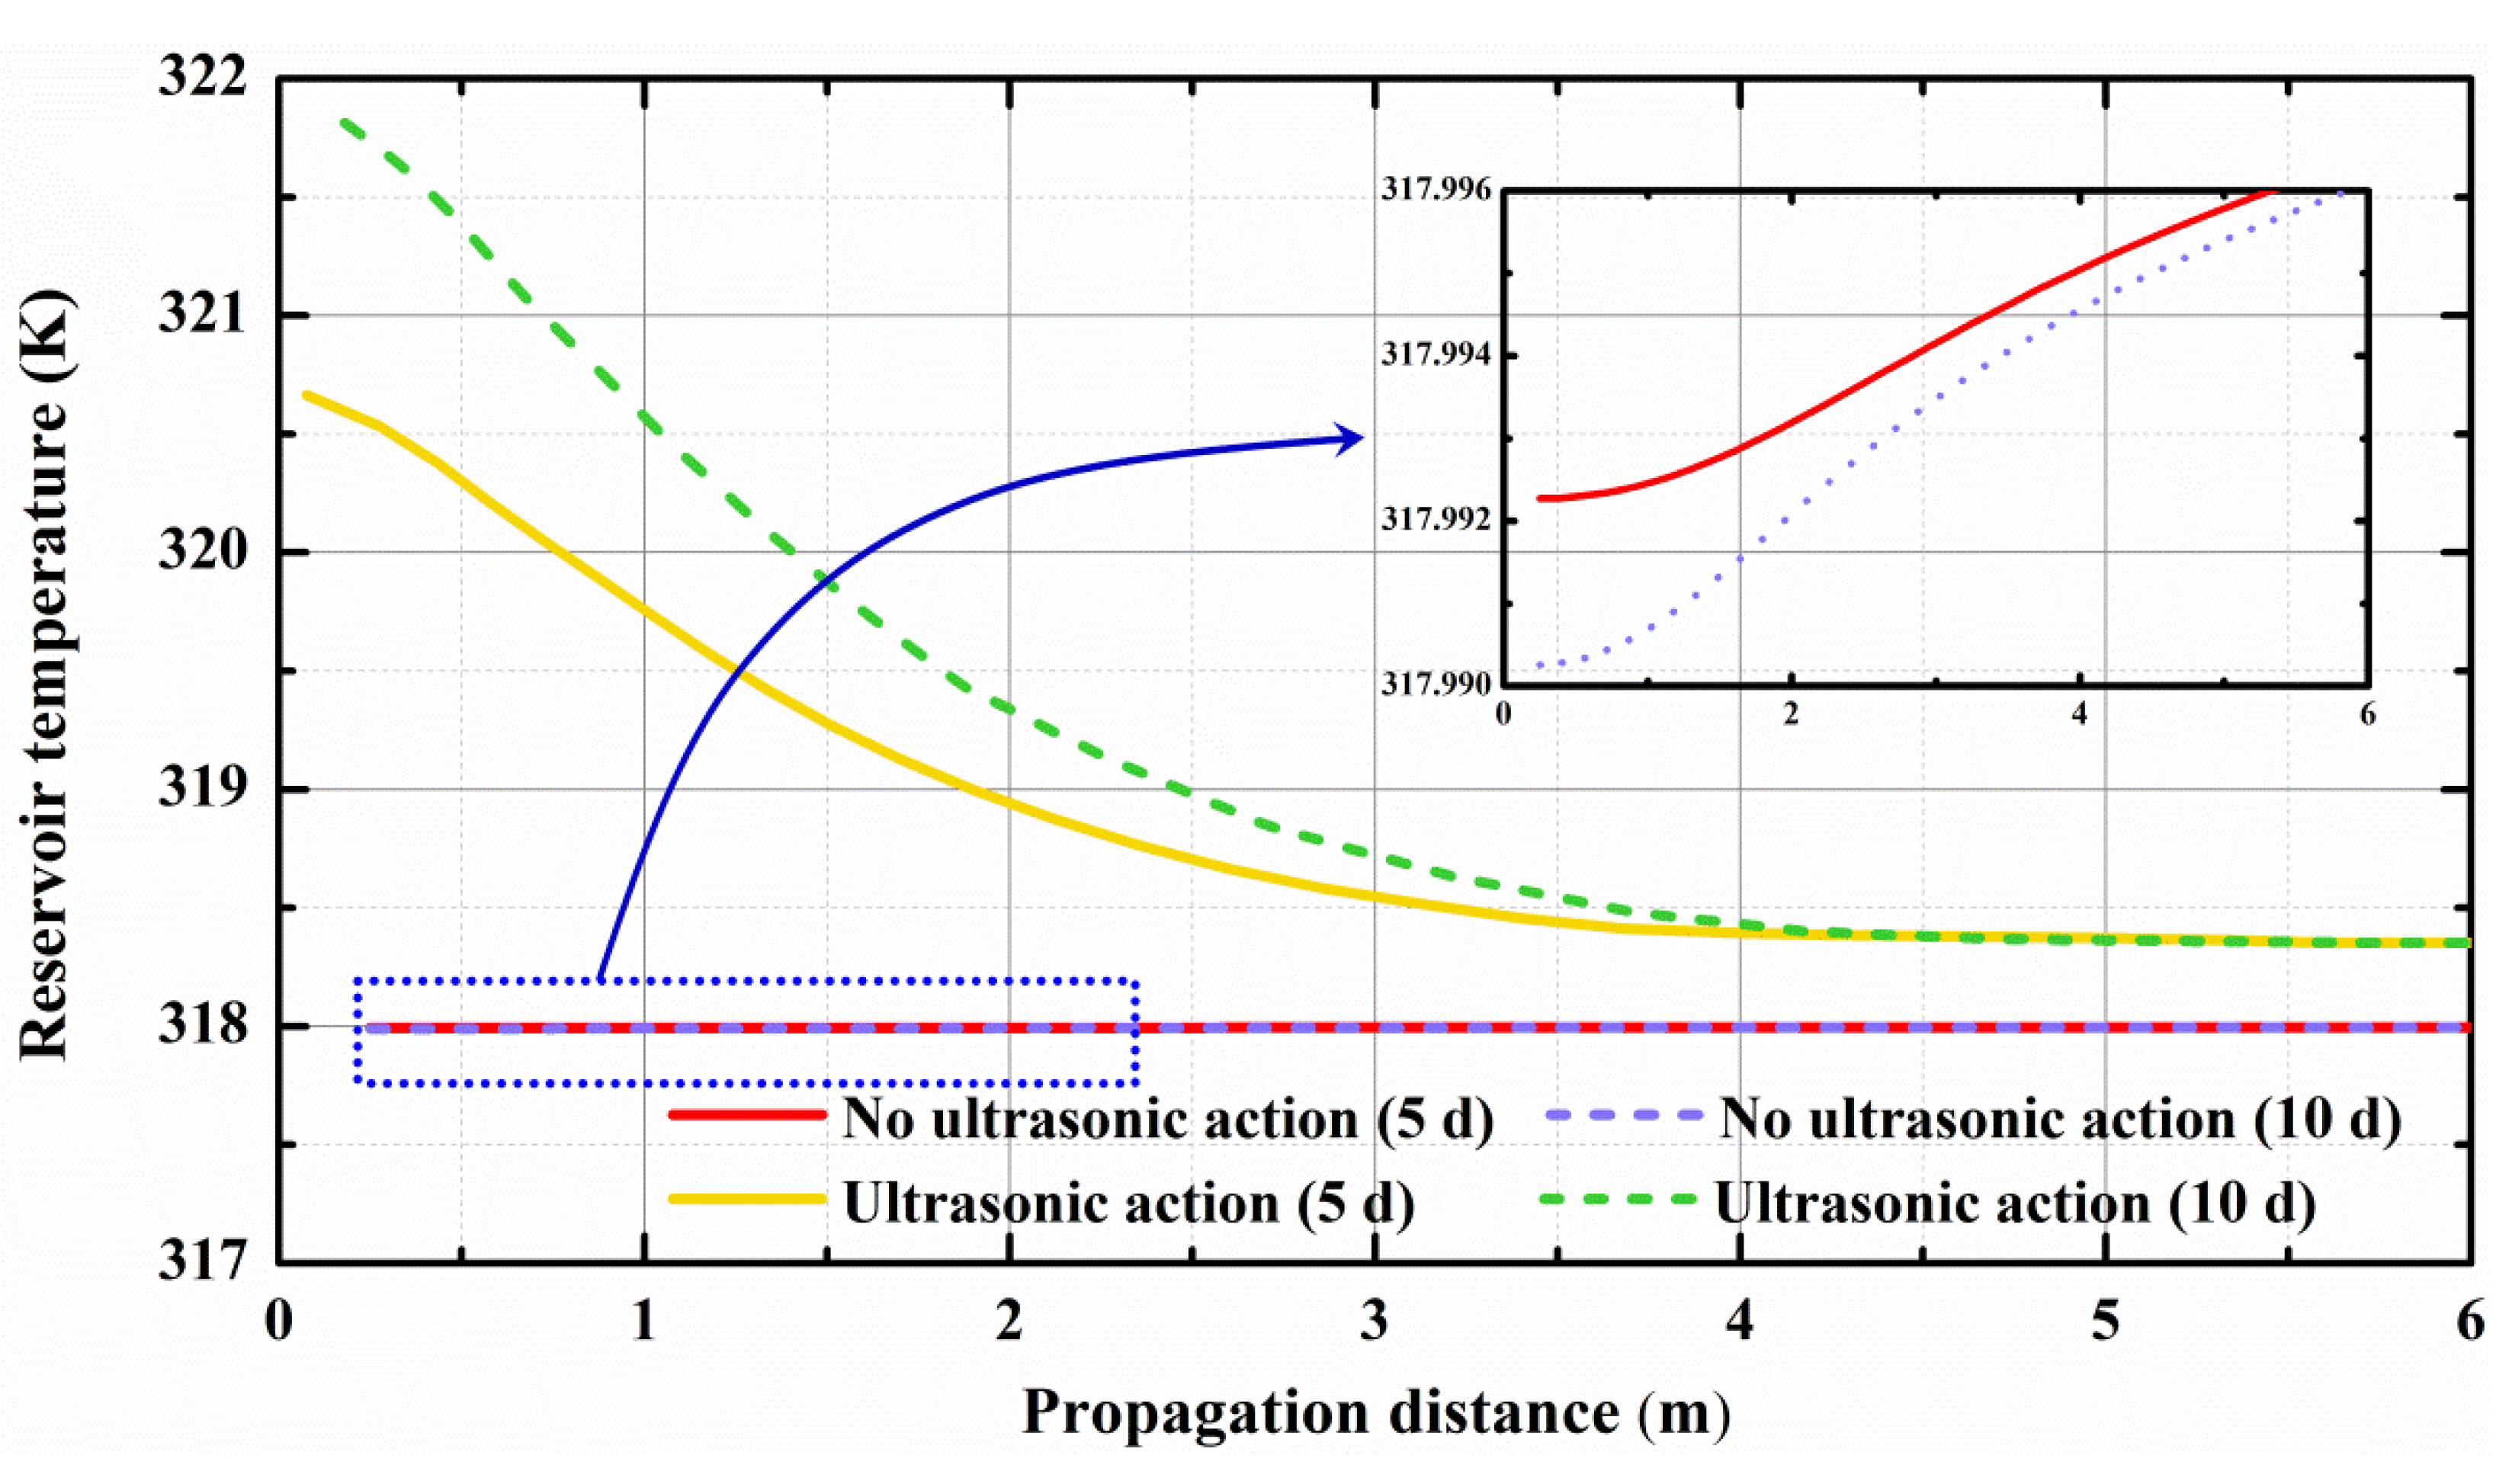
4.2. Effect of Ultrasonic Waves on Reservoir Temperature

Figure 6 shows the distribution characteristics of the reservoir temperature for the cases of no ultrasonic and ultrasonic effect.
Figure 6 indicates that when the production time was 10 d, the reservoir temperature near the bottom of the well would only decrease by about 0.002 °C without the ultrasonic waves action. When we considered the effect of ultrasonic waves in the simulation, the overall reservoir temperature will rise significantly. Moreover, with the increase of the action time of ultrasonic waves, the reservoir temperature increased gradually. With the increase of the propagation distance, the effect of ultrasonic waves weakened gradually, and the practical propagation distance was about 4 m.

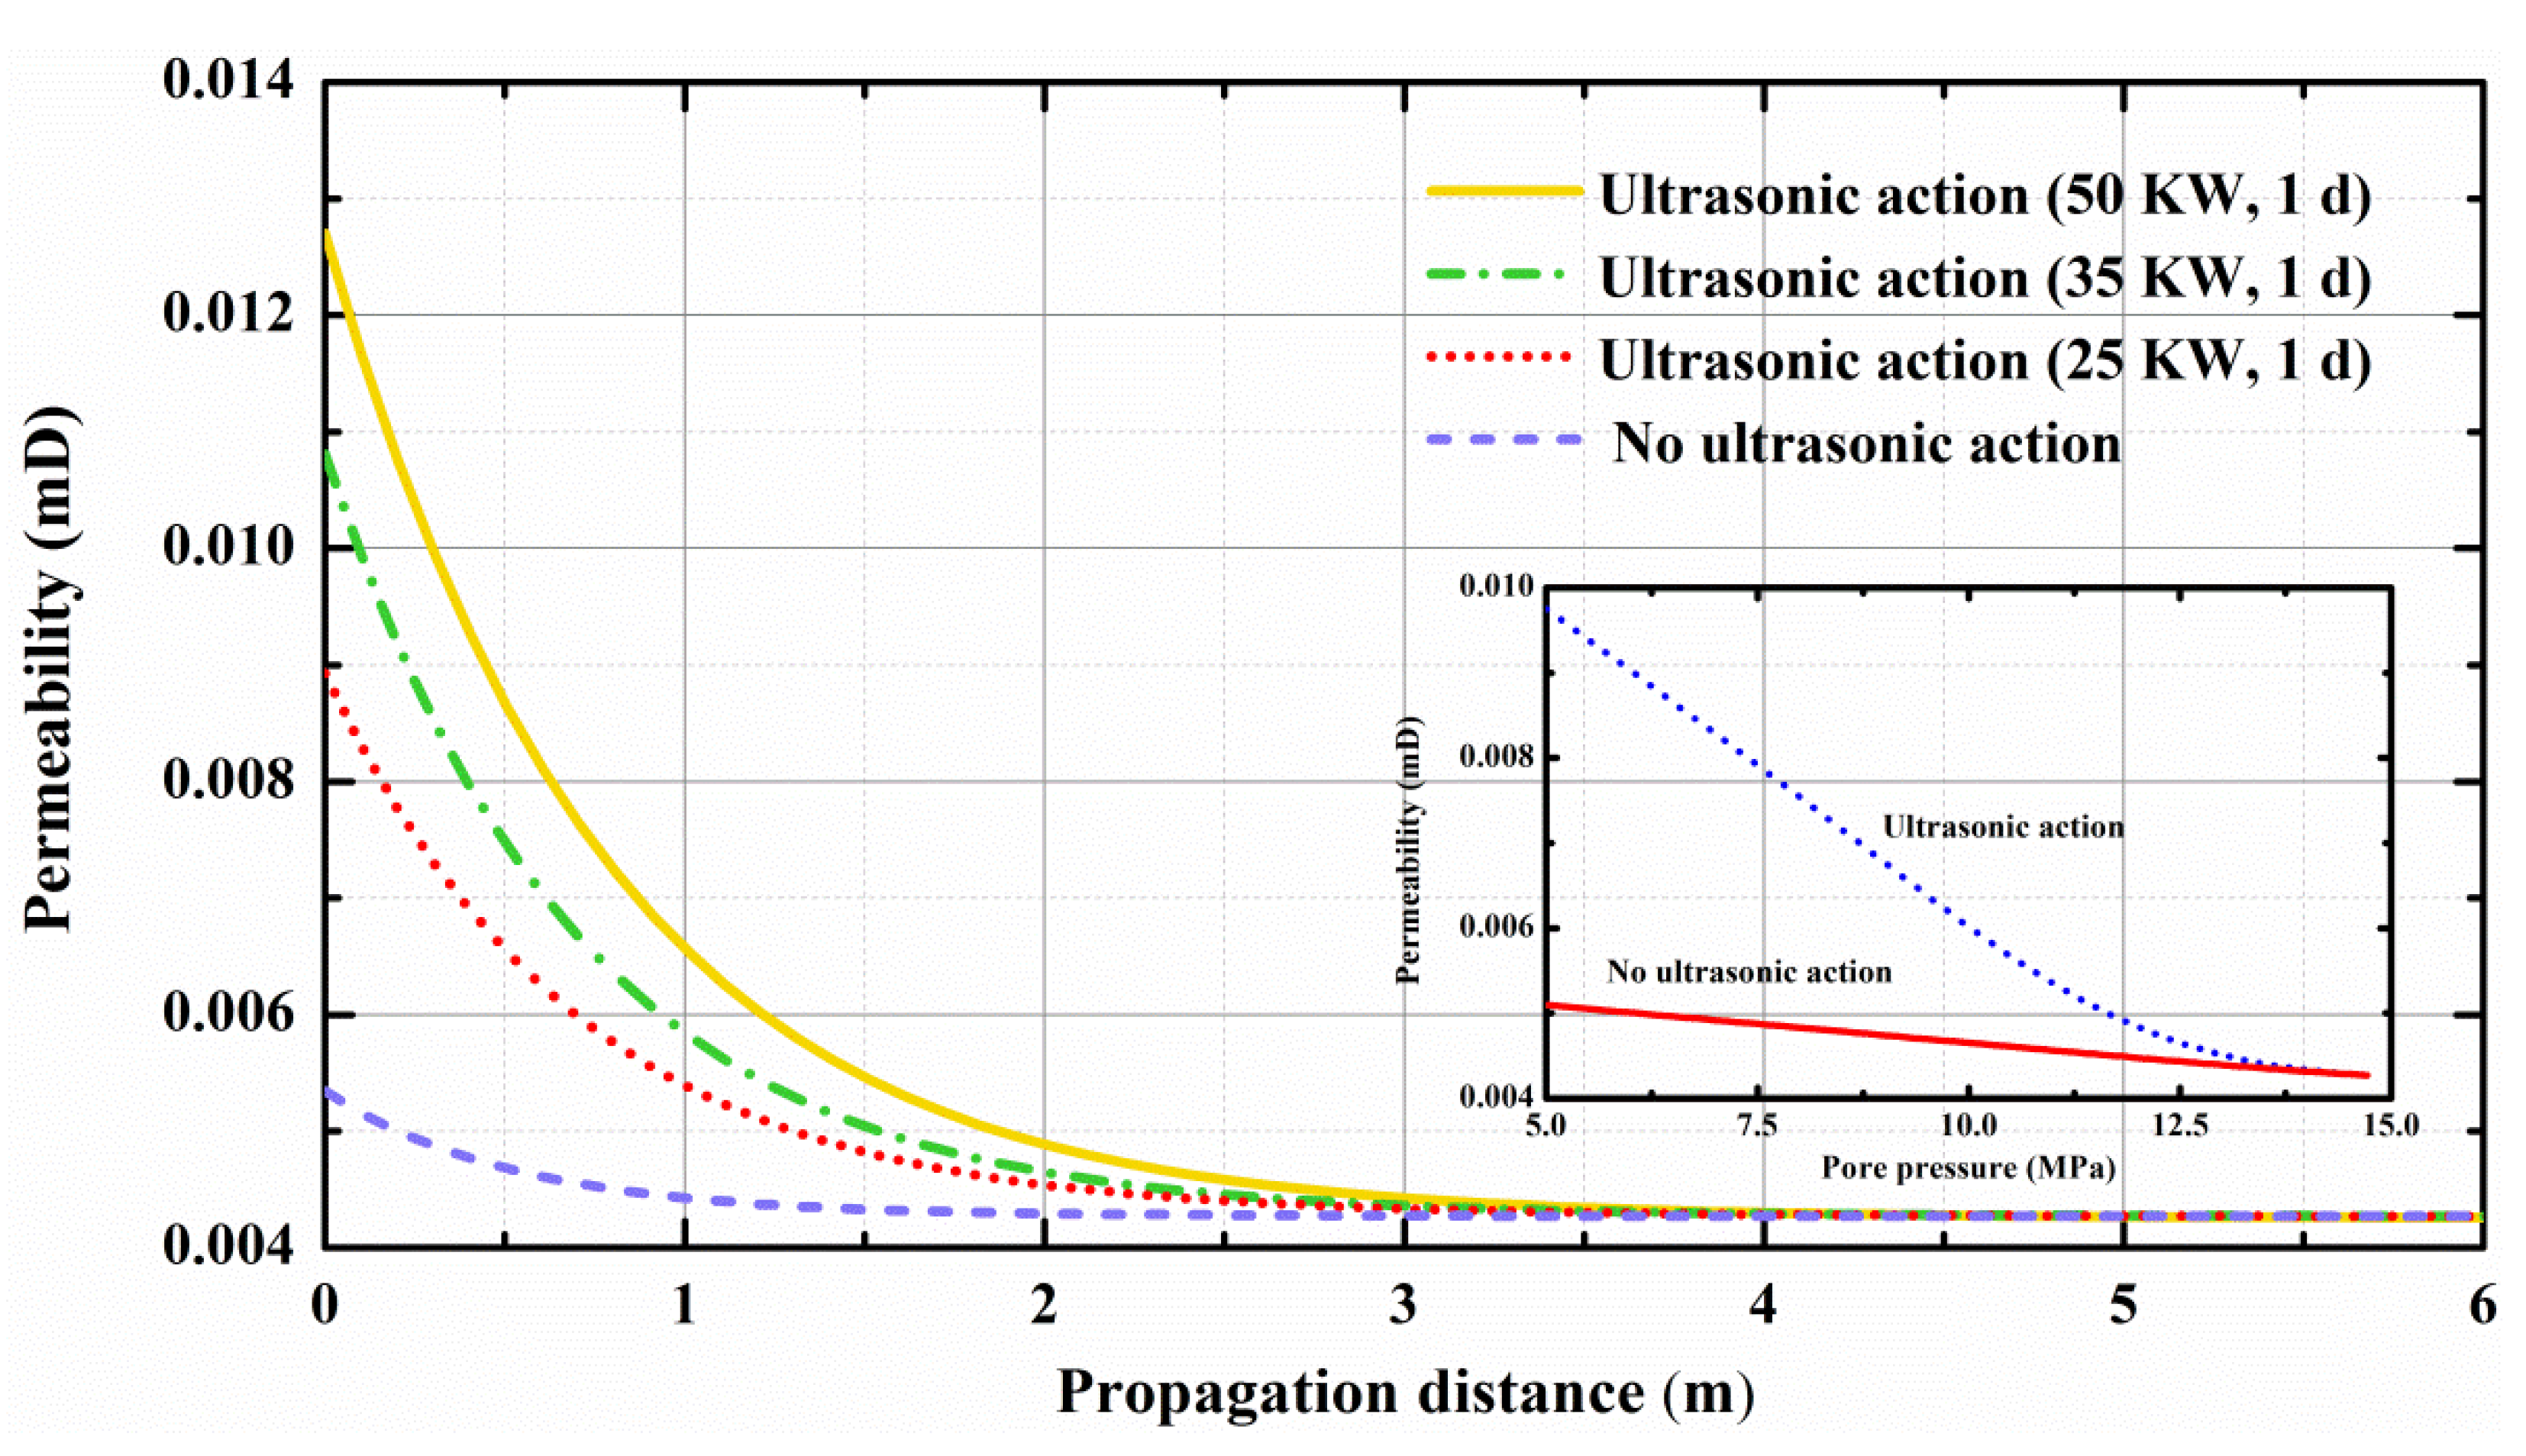
4.3. Effect of Ultrasonic Waves on Reservoir Permeability

Figure 7 shows the variation characteristics of the reservoir permeability for the cases of no ultrasonic effect and ultrasonic effect.
Figure 7 suggests that when the ultrasonic effect is not considered and as the pore pressure decreased, the adsorbed gas began to desorb, and the permeability of the reservoir increased, but the increase was not significant. After considering the effect of ultrasonic waves, as the pore pressure decreased, the increase in permeability became more significant. On the other hand, with the increase in ultrasonic power, the effect of ultrasonic waves would be more significant, and the effective distance was about 4 m.

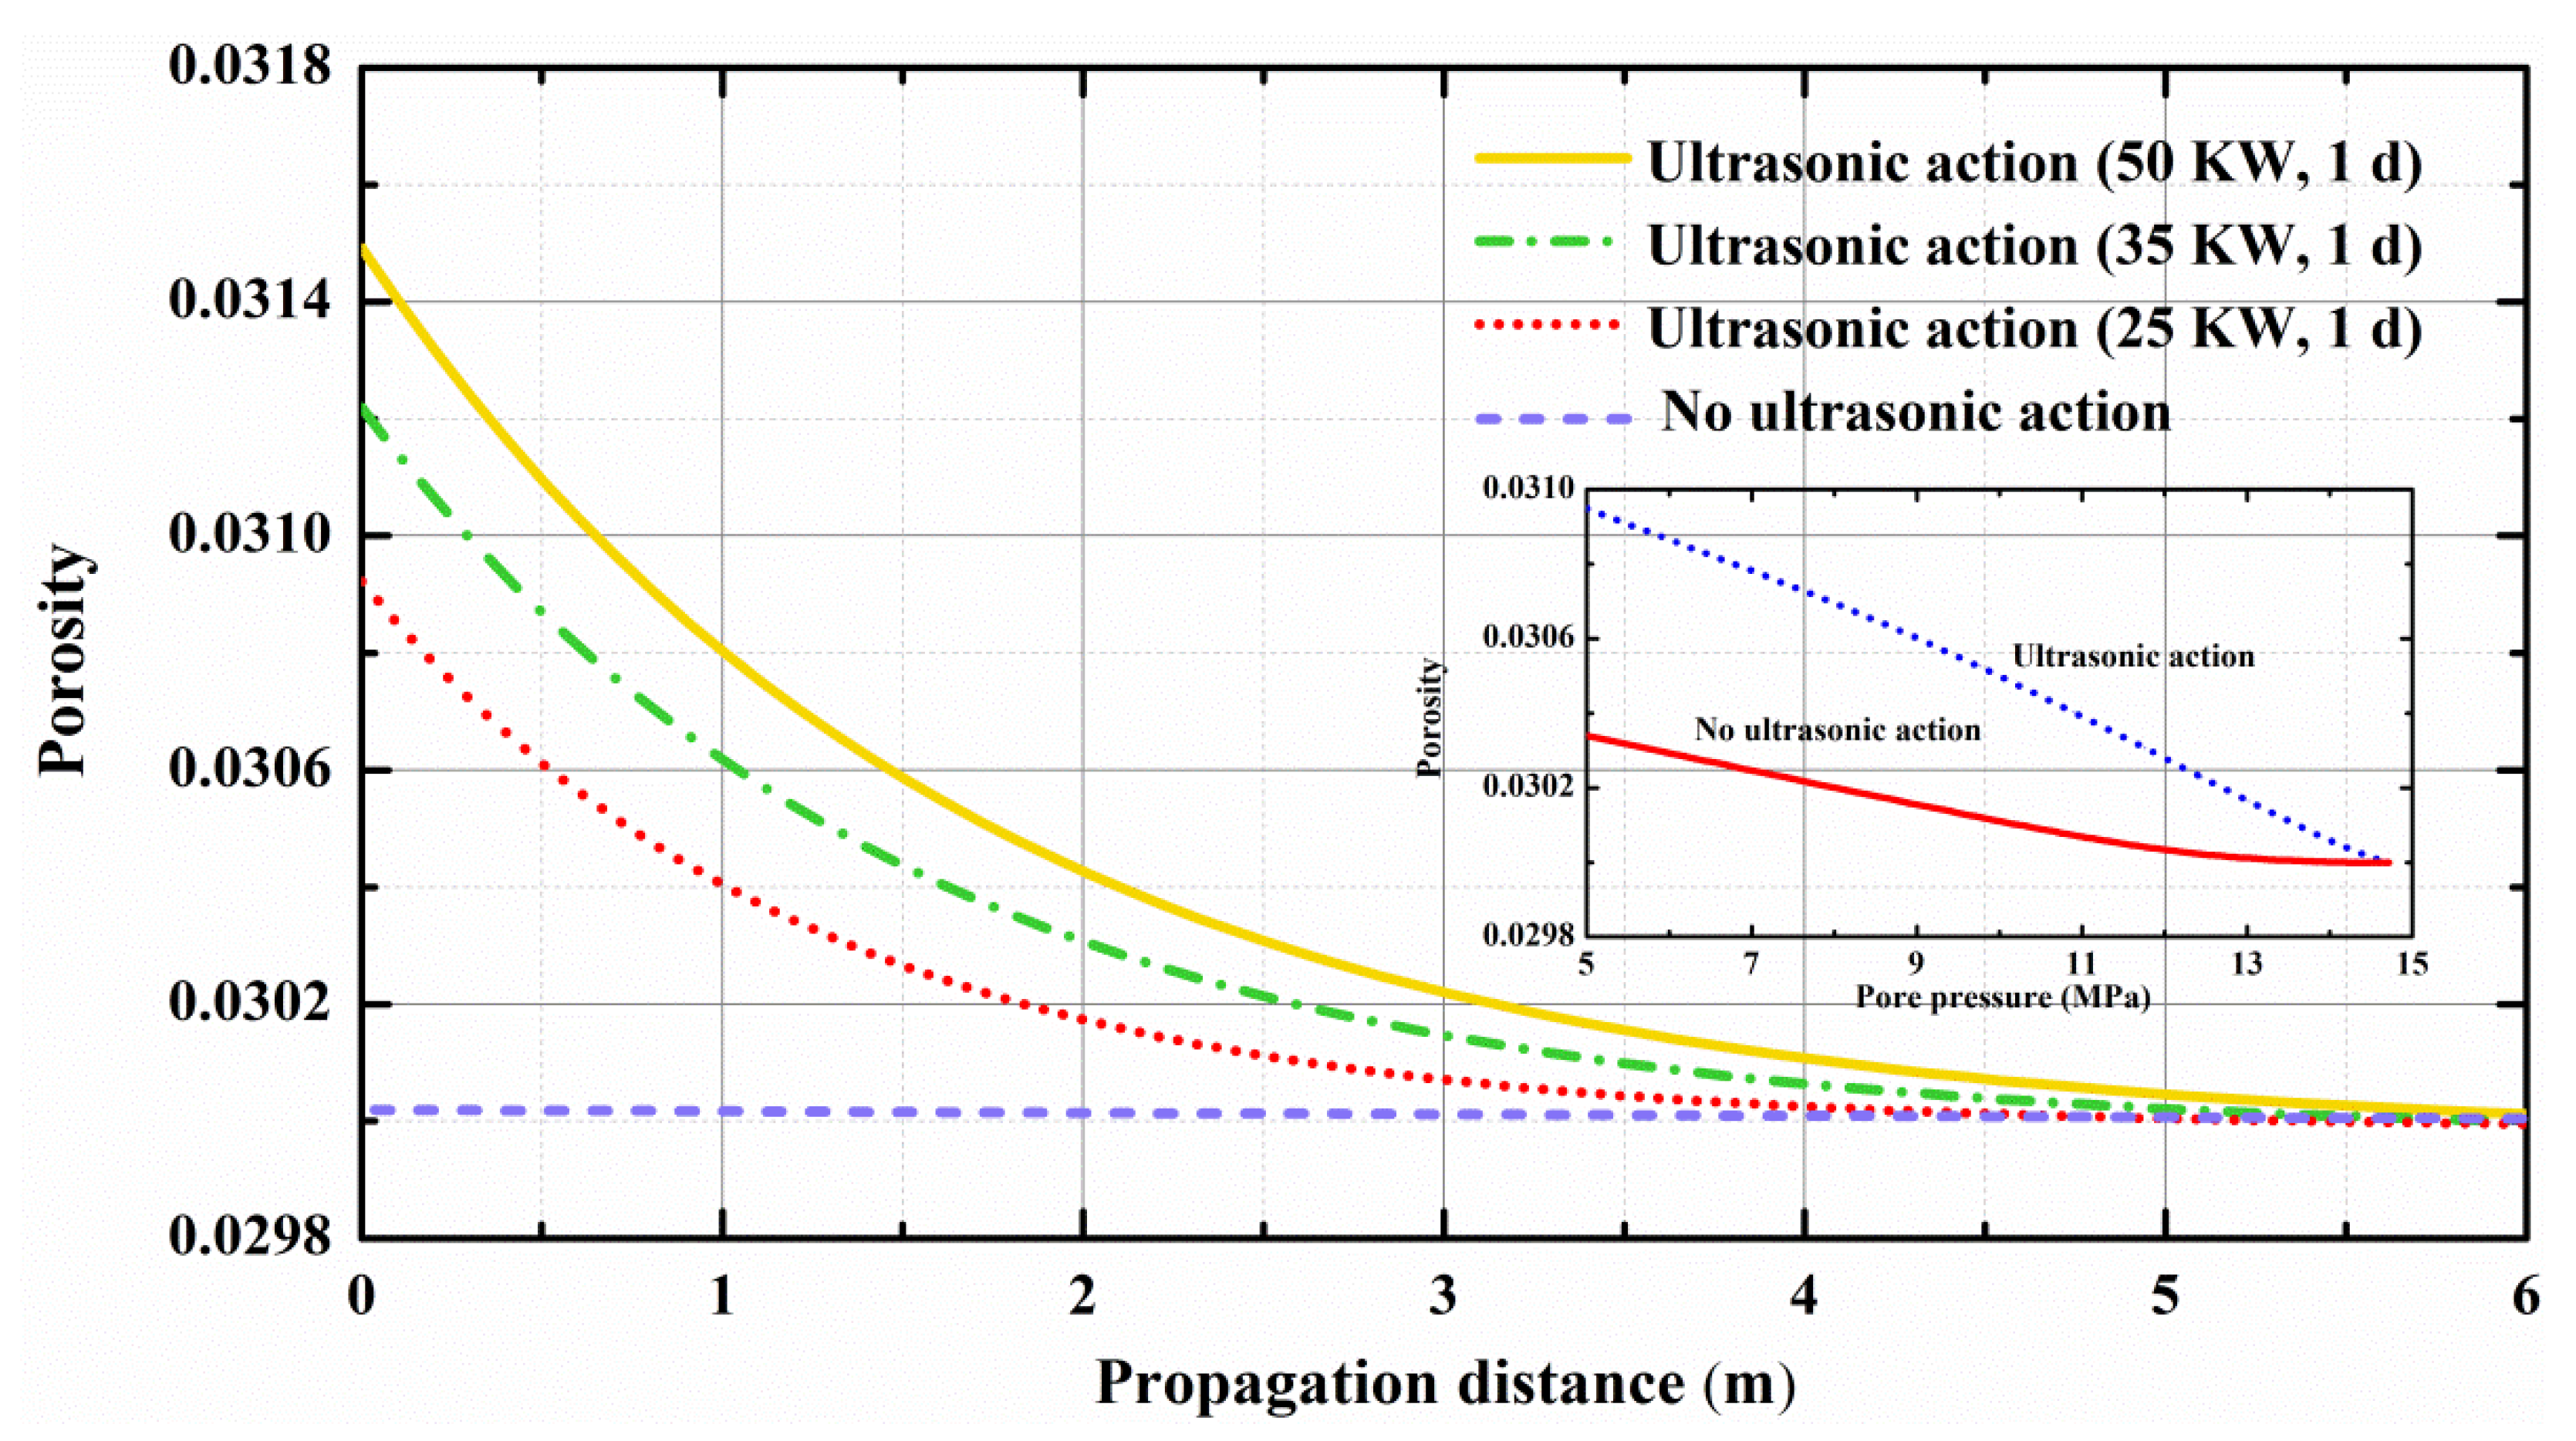
4.4. Effect of Ultrasonic Waves on Reservoir Porosity

Figure 8 shows the variation of the reservoir porosity for the cases of no ultrasonic effect and ultrasonic effect.
Figure 8 shows that the changing trend of reservoir porosity with pore pressure was the same as permeability. After we considered the effect of ultrasonic waves, the overall porosity of the reservoir was higher than that when the effect of ultrasonic waves was not considered. On the other hand, with the increase of ultrasonic power, the effect of ultrasonic waves on the reservoir porosity became more and more significant, and the effective distance was about 4 m.

5. Conclusions

In this paper, we have built a mathematical model for simulating the seepage characteristics of CBM reservoirs under the action of ultrasonic waves. On the basis of this model, we simulated the change of pore pressure, temperature, permeability, and porosity of a CBM reservoir under the action of ultrasonic waves. By comparing the change of the corresponding parameters for the cases of no ultrasonic and ultrasonic effect, we draw the following conclusions:
(1)
Numerical simulation results show that under the action of ultrasonic waves, the pressure-drop funnel of the CBM reservoir becomes more significant than that without action of the ultrasonic waves, and the boundary affected by the pressure drop also widens. This phenomenon shows that ultrasonic waves are indeed helpful in increasing the CBM production.
(2)
Ultrasonic waves can effectively raise the temperature of CBM reservoirs. As the time of ultrasonic action increases, the ultrasonic waves will generate more mechanical energy in the CBM reservoir, which can convert more heat energy, thus causing the temperature of the CBM reservoir to rise. Moreover, with the increase of the propagation distance, the effect of the ultrasonic wave shows a gradual attenuation trend. However, the reservoir temperature is still higher than that without the effect of the ultrasonic wave.
(3)
Ultrasonic waves can significantly improve the permeability of CBM reservoirs. Under the action of ultrasonic waves, coal particles will have a mechanical vibration effect and break themselves, which will increase the permeability of CBM reservoirs. Moreover, as the pore pressure decreases, the permeability of the CBM reservoir will increase more significantly, and the greater the power of the ultrasonic waves, the more significant the increase in permeability.
(4)
Under the action of ultrasound, the CBM reservoir is affected by the mechanical vibration effect, and its porosity and permeability have the same changing trend.
The above conclusions reflect that ultrasonic waves can improve the seepage characteristics of CBM reservoirs to a certain extent through thermal effects and mechanical vibration effects, and it is of great significance to increase the production of CBM.

Author Contributions

Methodology, validation, formal analysis, and writing—original draft preparation, X.L. (Xin Li); con-ceptualization, resources, and writing—review and editing, J.Z.; investigation, R.L. and Q.Q.; data curation, Y.Z.; visualization, C.L.; supervision, B.L.; project administration, C.W., T.H., and Y.W.; funding acquisition, X.D., Z.Z., and X.L. (Xu Liu). All authors have read and agreed to the published version of the manuscript.

Funding

The project is supported by the National Natural Science Foundation of China (No. 51274168), the National Key R&D Program of China (No. 2018YFC0310202), and the Southwest Petroleum University Graduate Research and Innovation Fund Key Program (No. 2020CXZD30).

Institutional Review Board Statement

Not applicable.

Informed Consent Statement

Not applicable.

Data Availability Statement

Not applicable.

Acknowledgments

The authors would like to acknowledge the other members of the research team for their assistance during the experimental testing process.

Conflicts of Interest

The authors declare that they have no known competing financial interests or personal relationships that could have influenced the work reported in this paper.

References

  1. Montuori, L.; Alcázar-Ortega, M. Demand response strategies for the balancing of natural gas systems: Application to a local network located in The Marches (Italy). Energy 2021, 225, 120293. [Google Scholar] [CrossRef]
  2. Lu, J.G.; Luo, Z.Y.; Zou, H.L.; Li, Y.P.; Hu, Z.Z.; Zhou, Z.Y.; Zhu, J.; Han, M.M.; Zhao, L.P.; Lin, Z.H. Geochemical characteristics, origin, and mechanism of differential accumulation of natural gas in the carboniferous kelameili gas field in Junggar basin, China. J. Pet. Sci. Eng. 2021, 203, 108658. [Google Scholar] [CrossRef]
  3. Chan, W.; Li, H.X.; Li, X.; Chang, F.C.; Wang, L.L.; Feng, Z.M. Exergoeconomic analysis and optimization of the Allam cycle with liquefied natural gas cold exergy utilization. Energy Conv. Manag. 2021, 235, 113972. [Google Scholar] [CrossRef]
  4. Nhuchhen, D.R.; Sit, S.P.; Layzell, D.B. Alternative fuels co-fired with natural gas in the pre-calciner of a cement plant: Energy and material flows. Fuel 2021, 295, 120544. [Google Scholar] [CrossRef]
  5. Avraam, C.; Bistline, J.; Brown, M.; Vaillancourt, K.; Siddiqui, S. North American natural gas market and infrastructure developments under different mechanisms of renewable policy coordination. Energy Policy 2021, 148, 111855. [Google Scholar] [CrossRef]
  6. Li, T.X.; Liu, P.; Li, Z. Optimal scale of natural gas reserves in China under increasing and fluctuating demand: A quantitative analysis. Energy Policy 2021, 152, 112221. [Google Scholar] [CrossRef]
  7. Rawat, A.; Garg, C.P. Assessment of the barriers of natural gas market development and implementation: A case of developing country. Energy Policy 2021, 152, 112195. [Google Scholar] [CrossRef]
  8. Leal, F.I.; Rego, E.E.; Ribeiro, C.D. Natural gas regulation and policy in Brazil: Prospects for the market expansion and energy integration in Mercosul. Energy Policy 2019, 128, 817–829. [Google Scholar] [CrossRef]
  9. Fan, L.R.; Xu, J.P. Authority–enterprise equilibrium based mixed subsidy mechanism for carbon reduction and energy utilization in the coalbed methane industry. Energy Policy 2020, 147, 111828. [Google Scholar] [CrossRef]
  10. Walsh, K.B.; Haggerty, J.H. Social license to operate during Wyoming’s coalbed methane boom: Implications of private participation. Energy Policy 2020, 138, 111217. [Google Scholar] [CrossRef]
  11. Acquah-Andoh, E.; Putra, H.A.; Ifelebuegu, A.O.; Owusu, A. Coalbed methane development in Indonesia: Design and economic analysis of upstream petroleum fiscal policy. Energy Policy 2019, 131, 155–167. [Google Scholar] [CrossRef]
  12. Luo, D.K.; Dai, Y.J. Economic evaluation of coalbed methane production in China. Energy Policy 2009, 37, 3883–3889. [Google Scholar] [CrossRef]
  13. Marcos-Martinez, R.; Measham, T.G.; Fleming-Muñoz, D.A. Economic impacts of early unconventional gas mining: Lessons from the coal seam gas industry in New South Wales, Australia. Energy Policy 2019, 125, 338–346. [Google Scholar] [CrossRef]
  14. Li, M.; Jiang, B.; Miao, Q.; Wang, G.O.; You, Z.J.; Lan, F.J. Multi-Phase Tectonic Movements and Their Controls on Coalbed Methane: A Case Study of No. 9 Coal Seam from Eastern Yunnan, SW China. Energies 2020, 13, 6003. [Google Scholar] [CrossRef]
  15. Olajossy, A.; Cieslik, J. Why Coal Bed Methane (CBM) Production in Some Basins is Difficult. Energies 2019, 12, 2918. [Google Scholar] [CrossRef] [Green Version]
  16. Kim, D.H.; Seo, Y.J.; Kim, J.Y.; Han, J.M.; Lee, Y.S. Experimental and Simulation Studies on Adsorption and Diffusion Characteristics of Coalbed Methane. Energies 2019, 12, 3445. [Google Scholar] [CrossRef] [Green Version]
  17. Cheng, H.M.; Zhang, N.; Yang, Y.G.; Peng, W.H.; Chen, H. A Study on the Mechanical Mechanism of Injection Heat to Increase Production of Gas in Low-Permeability Coal Seam. Energies 2019, 12, 2332. [Google Scholar] [CrossRef] [Green Version]
  18. Fan, C.J.; Luo, M.K.; Li, S.; Zhang, H.H.; Yang, Z.H.; Liu, Z. A Thermo-Hydro-Mechanical-Chemical Coupling Model and Its Application in Acid Fracturing Enhanced Coalbed Methane Recovery Simulation. Energies 2019, 12, 626. [Google Scholar] [CrossRef] [Green Version]
  19. Duan, L.J.; Qu, L.C.; Xia, Z.H.; Liu, L.L.; Wang, J.J. Stochastic Modeling for Estimating Coalbed Methane Resources. Energy Fuels 2020, 34, 5196–5204. [Google Scholar] [CrossRef]
  20. Senthamaraikkannan, G.; Budwil, K.; Gates, I.; Mitra, S.; Prasad, V. Kinetic Modeling of the Biogenic Production of Coalbed Methane. Energy Fuels 2016, 30, 871–883. [Google Scholar] [CrossRef]
  21. Tang, Z.Q.; Yang, S.Q.; Xu, G.; Sharifzadeh, M.; Zhai, C. Evolution Law of Adsorption and Desorption Characteristics of CH4 in Coal Masses during Coalbed Methane Extraction. Energy Fuels 2018, 32, 10540–10548. [Google Scholar] [CrossRef]
  22. Vengosh, A.; Jackson, R.B.; Warner, N.; Darrah, T.H.; Kondash, A. A Critical Review of the Risks to Water Resources from Unconventional Shale Gas Development and Hydraulic Fracturing in the United States. Environ. Sci. Technol. 2014, 48, 8334–8348. [Google Scholar] [CrossRef] [PubMed]
  23. Myers, T. Potential Contaminant Pathways from Hydraulically Fractured Shale to Aquifers. Ground Water. 2012, 50, 872–882. [Google Scholar] [CrossRef] [PubMed]
  24. Rahm, D. Regulating hydraulic fracturing in shale gas plays: The case of Texas. Energy Policy 2011, 39, 2974–2981. [Google Scholar] [CrossRef]
  25. Brandt, A.R.; Heath, G.A.; Kort, E.A.; O’Sullivan, F.; Pétron, G.; Jordaan, S.M.; Tanf, P.; Wilcox, J.; Gopstein, A.M.; Arent, D.; et al. Methane Leaks from North American. Nat. Gas Syst. Sci. 2014, 343, 733–735. [Google Scholar]
  26. Bhattacharya, P.; Viesca, R.C. Fluid-induced aseismic fault slip outpaces pore-fluid migration. Science 2019, 364, 464–468. [Google Scholar] [CrossRef]
  27. Alghannam, M.; Juanes, R. Understanding rate effects in injection-induced earthquakes. Nat. Commun. 2020, 11, 3053. [Google Scholar] [CrossRef]
  28. Atkinson, G.M.; Eaton, D.W.; Igonin, N. Developments in understanding seismicity triggered by hydraulic fracturing. Nat. Rev. Earth Environ. 2020, 1, 264–277. [Google Scholar] [CrossRef]
  29. Liu, K.; Gao, D.L.; Wang, Y.B.; Yang, Y.C. Effect of local loads on shale gas well integrity during hydraulic fracturing process. J. Nat. Gas Sci. Eng. 2017, 37, 291–302. [Google Scholar] [CrossRef]
  30. Sugden, C.; Johnson, J.; Chambers, M.; Ring, G.; Suryanarayana, P.V. Special Considerations in the Design Optimization of the Production Casing in High-Rate, Multistage-Fractured Shale Wells. SPE Drill. Complet. 2012, 27, 459–472. [Google Scholar] [CrossRef]
  31. Igonin, N.; Verdon, J.P.; Kendall, J.M.; Eaton, D.W. Large-Scale Fracture Systems Are Permeable Pathways for Fault Activation During Hydraulic Fracturing. J. Geophys. Res. Solid Earth. 2021, 126, e2020JB020311. [Google Scholar] [CrossRef]
  32. Gischig, V.S.; Doetsch, J.; Maurer, H.; Krietsch, H.; Amann, F.; Evans, K.F.; Nejati, M.; Jalali, M.; Valley, B.; Obermann, A.C.; et al. On the link between stress field and small-scale hydraulic fracture growth in anisotropic rock derived from microseismicity. Solid Earth 2018, 9, 39–61. [Google Scholar] [CrossRef] [Green Version]
  33. Wang, M.; Zheng, D.D.; Mei, J.Q.; Mao, Y.; Hu, J.Y. A new method for processing ultrasonic gas flowmeter signal in wet gas. IET Sci. Meas. Technol. 2020, 15, 2–13. [Google Scholar] [CrossRef]
  34. Estrela, C.; Estrela, C.R.A.; Decurcio, D.D.A.; Silva, J.A.; Bammann, L.L. Antimicrobial Potential of Ozone in an Ultrasonic Cleaning System Against Staphylococcus aureus. Braz. Dent. J. 2006, 17, 134–138. [Google Scholar] [CrossRef] [Green Version]
  35. Song, Y.F.; Kube, C.M.; Peng, Z.X.; Turner, J.A.; Li, X.B. Flaw detection with ultrasonic backscatter signal envelopes. J. Acoust. Soc. Am. 2019, 145, 142–148. [Google Scholar] [CrossRef] [PubMed] [Green Version]
  36. Xue, S.N.; Le, Q.C.; Jia, Y.H.; Jiang, L.P.; Zhang, Z.Q.; Bao, L. Ultrasonic flaw detection of discontinuous defects in magnesium alloy materials. China Foundry 2019, 16, 256–261. [Google Scholar] [CrossRef] [Green Version]
  37. Cantero-Chinchilla, S.; Aranguren, G.; Royo, J.M.; Chiachío, M.; Etxaniz, J.; Calvo-Echenique, A. Structural Health Monitoring Using Ultrasonic Guided-Waves and the Degree of Health Index. Sensors 2021, 21, 993. [Google Scholar] [CrossRef]
Figure 1. Distribution of global CBM resources.
Energies 14 04605 g001
Figure 2. Occurrence and migration state of CBM in the reservoir.
Energies 14 04605 g002
Figure 3. Experimental equipment used for testing CBM seepage under ultrasonic waves action.
Energies 14 04605 g003
Figure 4. Simulation and experimental results of coal permeability under ultrasonic waves action.
Energies 14 04605 g004
Figure 5. Simulation results of pore pressure changes without and with ultrasonic waves.
Energies 14 04605 g005
Figure 6. Simulation results of reservoir temperature changes without and with ultrasonic waves.
Energies 14 04605 g006
Figure 7. Simulation results of reservoir permeability changes without and with ultrasonic waves.
Energies 14 04605 g007
Figure 8. Simulation results of reservoir porosity changes without and with ultrasonic waves.
Energies 14 04605 g008
Table 1. Relevant parameters used during mathematical modeling.
SymbolValueUnitSymbolValueUnit
μ g 0.017mPa·s ε 1 0.035MPa–1
ρ s 2.27g·cm–3 Δ H 1500J·kg–1
b 0.4831MPa–1 λ s 1.6J·m–1·K–1
E 40,000MPa c pg 2400J·kg–1·K–1
M 42,000MPa c ps 500J·kg–1·K–1
K 15,000MPa ν 0.3
k 0.006mD ϕ 0 0.5
h e 25J·m–2·K–1 α 1.57m–1
Publisher’s Note: MDPI stays neutral with regard to jurisdictional claims in published maps and institutional affiliations.

