Article

Void Fraction Prediction Method in Gas–Liquid Flow through Channel Packed with Open-Cell Metal Foams

Department of Process and Environmental Engineering, Faculty of Mechanical Engineering, Opole University of Technology, 5 Mikolajczyka Str, 45-271 Opole, Poland
*
Authors to whom correspondence should be addressed.
Energies 2021, 14(9), 2645; https://doi.org/10.3390/en14092645
Submission received: 31 March 2021 / Revised: 27 April 2021 / Accepted: 2 May 2021 / Published: 5 May 2021
(This article belongs to the Special Issue Multiphase Flows)

Abstract

:
This paper reports the results of a study concerned with air–water and air–oil two-phase flow in channels packed with open-cell metal foams. The research was conducted in horizontal channel with an internal diameter of 0.02 m and length of 2.61 m. The analysis applied three metal foams with pore density 20, 30, and 40 PPI and porosity typical for industrial applications, changing in the range of 92–94%. The experimental data were used to develop a new method for predicting void fraction in two-phase gas–liquid flow in channels packed with metal foams. A new gas void fraction calculating method based on drift-flux model was developed. This model gives a correct representation of changes in the gas void fraction value and good prediction accuracy. The average relative error in calculating the air void fraction in two-phase flow is less than 13%, and 86% of experimental points is characterized by an error less than 20%.

1. Introduction

The rapid economic growth and human population development has the cost of very large and growing environmental pressures and impacts. The rise in natural resource use such as fossil fuels, ores, minerals, and water is coupled with insecurity for a number of resources that are strategically important in modern production and consumption systems. In the modern world, the general concept of effective resource management forces the search for new design and technological solutions for devices that increase the efficiency and effectiveness of industrial processes. These devices include a wide group of apparatuses for heat and mass transfer such as heat exchangers, chemical reactors, solar panels, accumulators, or refrigeration systems. A well-known method of intensifying the heat and mass transfer processes is to increase the contact area between the phases by using fins or, more often, by fulfill the pipes or apparatuses with the porous material [1,2,3,4]. However, in flow-through devices such as heat exchangers and column apparatuses, porous packings can cause high flow resistance and thus increase energy consumption for pumping the fluid. In this context, metal foams, due to their specific properties, show an advantage over other porous materials.
Solid open-cell foams are the wide group of multifunctional cellular materials that can be produced of various materials like minerals, polymers, and metals [5,6,7]. Due to well-mastered methods of producing metal foam, it is possible to expand various metal alloys and obtain materials with a wide variability of physical properties such as thermal conductivity, thermal and chemical resistance, density (relative), and rigidity [1,7]. The porosity of metal foam significantly exceeds the porosity of mesh structures or granular beds and can be as high as 98% with a large specific surface area of several thousand of m2/m3. The metal foams are used as structural part of compact high-efficiency heat exchangers and regenerators, catalytic reactors or accumulators [8,9,10,11,12]. These materials are recognized as valuable for many industrial branches due to high thermal conductivity and large specific surface area that considerably improve heat transfer (i.e., heat sinks production) [13,14]. As components of compact heat exchangers, they effectively dissipate heat from electronic systems but they can be also used as super light components in aircraft vehicles or shock-absorbing elements installed in cars’ crumple zones [4,15,16,17,18,19]. Metal foams are good electrical conductors while foams made of ceramic, glass, and polymers are known for their thermal insulation properties, so they are used in many industrial processes related to thermal control [18].
Metal foams are also perfect for filtration and separation of solid particles and liquid drops [1,2,19]. These include the purification processes of crude oil, fermentation fluids, hydrocarbons (in synthesis processes), molten sodium, or zinc sulphate solution in the metallurgical industry. Filters made of nickel alloys and stainless steel are used to remove uranium fluoride in nuclear power, as well as the textile and paper industry to remove dye particles and in paper pulp washing processes. Ghidossi et al. [20] used nickel-chromium foam as filter of solid particles to treat hot gases from fluidized drying of sewage sludge. In metal foam packed chemical reactors, highly developed interfacial contact area allows for the use of higher loads of catalysts that improve mass transfer processes in multi-phase systems [21,22,23,24,25]. Flooding of chemical reactors packed with foams undercounter-current flow conditions (according to Stemmet et al. [6]) makes one of some few factors which impose restraints in the use of that type of packing in actual industrial processes. Research in this area is conducted with the aim to reduce process costs, to optimize and to intensify chemical processes, and with the aim to replace more conventional packing such as spherical particles (telleretts) by foams with specific required properties [6,22,24,26,27]. The conducted research mainly covers flows of multi-phase mixtures in packed columns and catalytic reactors [9,28].
On the other hand, the light weight of foam, which is a consequence of material skeletal structure, contributes to a significant reduction in the mass of the apparatuses packed with this type of material. In highly porous metal structures, fluids such as gases or liquids can be transported relatively freely with low flow resistance. Low pressure losses, more advantageous hydrodynamic conditions (a higher level of liquid turbulence) combined with reduction of equipment operating costs (lower pumping costs, slight changes in fluid properties, density, and viscosity), simplify modeling and control of technological processes carried out in such equipment. In process and apparatuses design, many parameters such as phase void fraction, friction factor, pressure drop, heat transfer coefficient, and even bubble size distribution with respect to single and multiphase flow are necessary to make reliable engineering calculations. Correct calculation of many of the above-mentioned quantities requires the knowledge of the void fraction values in the flow.
Insights into the current literature offer a conclusion that relatively little information on multiphase flows (especially for a non-refrigerant liquid) through channels packed with metal foams is available with regard to such basic problems as void fraction. The review of void fraction measurement techniques, experimental databases, and correlations developed for two-phase gas–liquid flow unfortunately limited only to empty macro- and microchannels, is presented in works of Pietrzak et al. [29] and Gardenghi et al. [30]. There are only a few works in the literature that describe the void fraction calculation method in a two-phase gas–liquid flow through metal foams. These works include those by Hu et al. [31] and Ji and Xu [32], which, however, describe a specific type of two-phase flow that is vapor-liquid flow accompanying boiling process in the flow. The thermal and hydrodynamics processes under single-phase flow conditions through foams are quite well known and understood, as is the case of two-phase flow of various refrigerants in the boiling processes (heat transfer, pressure drop) which was undertaken by authors of [8,10,33,34]. Dyga et al. [35] and Busser et al. [36] were described the hydrodynamics of gas and liquid flow in channels filled with open-cell metal foams. In turn, Płaczek et al. [37] evaluated methods originally developed for porous media to predict gas void fraction in horizontal air–water flow through a channel packed with open-cell steel foam. The verified calculating methods in most cases turned out to be incapable of predicting the void fraction with acceptable accuracy.
Taking into account the literature review, it should be emphasized that most of the works in this field concern the hydrodynamics of single-phase or two-phase gas–liquid flow through packed columns, catalytic reactors, as well as cover issues related to the flow boiling of refrigerants in channels with different geometry.
The literature review shows that most of the research carried out in channels filled with metal foams concerned two-phase vapor–liquid flows. These studies focused mainly on heat transfer. However, there is a group of devices, such as catalytic reactors and fuel cells, in which the liquids do not evaporate. Few works in this area concern mainly the determination of velocity and pressure profiles and were carried out for low gas flow velocities of a few cm/s. Most of this research has been done in microchannels or gaps. On the other hand, no research results concerning the void fraction in the two-phase flow through conventional channels or apparatuses filled with metal foam were found in the literature for a wide range of gas and liquid flow parameter changes.
For this reason, the study of the void fraction in the two-phase air–water and air–oil flows were carried out in channels packed with metal foams with different porosity. The experimental tests included the determination of the influence of hydrodynamic flow parameters and foam structure on changes in the value of void fraction and were carried out for a wide range of gas and liquid velocity changes. Moreover, the well-known methods for calculating void fraction (originally developed for empty channels and filled with porous materials) were also verified in order to recognize the possibility to adopt them for flows through channels packed with open-cell metal foams.
However, the analysis of the data showed that they do not give a high accuracy in predicting the void fraction of the phases in such specific systems. Finally, a new method for calculating the void fraction in two-phase gas–liquid flows through metal foams was developed. This method is based on the assumptions of the Zuber-Findlay drift-flux model.

1.1. Scope of Experiment

The experimental tests involved the flow of gas–liquid (air–water and air–oil) two-phase mixtures through three channels packed with different types of open-cell aluminum foam, typical for industrial applications. The research was conducted in a horizontal channel with an internal diameter of 0.02 m and length of 2.61 m totally fulfilled by foam (Figure 1). A separate channel was made for each tested foam. The experimental stand in Figure 1 was used both in the research on the hydrodynamics of the flow and in the research of heat transfer (present analysis did not include this part of studies).
Air, water, and Velol-9Q machine oil were used to produce the two-phase mixture. The density, viscosity, and surface tension of oil were equal to: ρo = 859.4 kg/m3, μo = 0.0027 Pas, σo = 0.046 N/m, respectively. Velol-9Q machine oil was selected for the tests due to its relatively low viscosity, at the ambient temperature about nine times higher than that of water, which allowed to reduce the flow resistance and to conduct tests at relatively high oil flow velocities (νo = 0.006–0.066 m/s). The use of a high viscosity oil would limit the testing only to deep laminar flow. The properties and flow parameters of all fluids used in experiment are presented in Table 1.
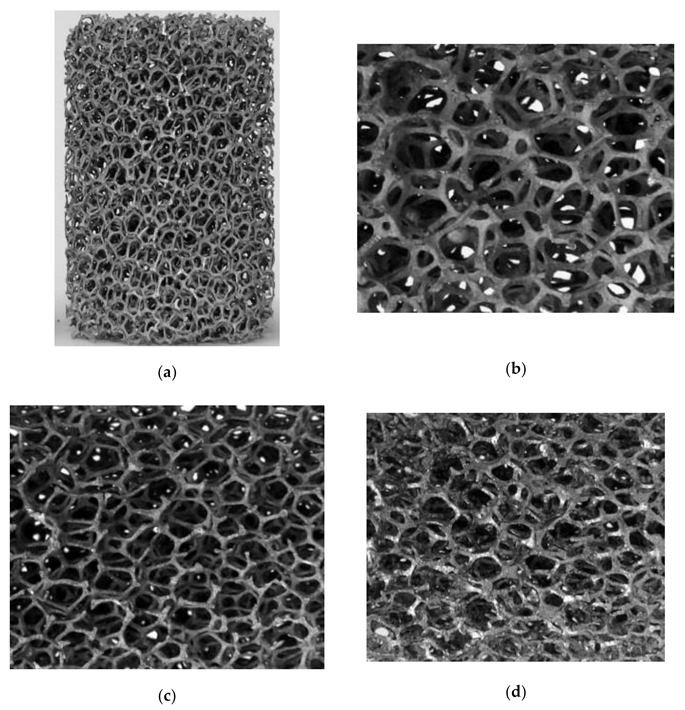
The foams used in tests had a pore density of 20, 30, and 40 PPI (pores per inch) according to manufacturer’s specification. The aluminum foam 40 PPI (Al 6101) was produced by ERG Aerospace Corporation and was available under the product trade name as DUOCEL® while foams with pore density of 20 PPI (AlSi7Mg) and 30 PPI (AlSi7Mg) were produced by m-pore GmbH (Figure 2).
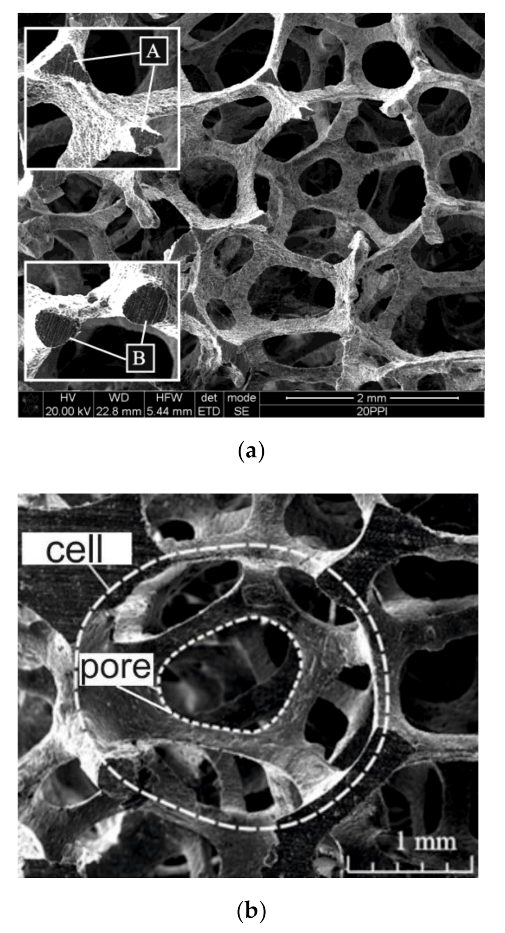
Morphological parameters such as porosity ε, diameter of cells dc, and diameter of pores dp are recognized as better for characterizing foam structure than pore density (PPI) which is the nominal size of foams declared by their producers. These parameters were determined based on the analysis of microscopic images of the foam skeleton. The images were made with a 15-fold magnification using the Inspekt F scanning microscope—according to the procedure of the Institute of Ferrous Metallurgy No. M4-MET. The diameter of a circle with the same circumference as the perimeter of the cell/pore (acc. to [38]) was adopted as the quantity characterizing the cell size/pore. The pore circumference was marked out along the skeleton edge (as shown in Figure 3), while the length of the line running along the axis of the skeleton fibers forming the cell was assumed as the cell circumference. The number of microscopic photos taken allowed to determine the size of more than 100 pores of each of the aluminum foams. On the other hand, the number of cells selected for measurement was 104 for the 20 PPI foam, 159 for the 30 PPI foam, and 185 for the 40 PPI foam. Characteristics of the most important morphological and material properties of foam can be found in Table 2. All examined foams had similar porosity and different cell and pore sizes, wherein Al 6101 foam (40 PPI) had a different skeleton structure with many clusters of solid material in the form of large nodes at the junction of skeleton fibers, which is visible in Figure 2d and Figure 3.
The porosity of the tested foams ε (one of the main geometric parameters listed in Table 2) was determined based on measured foam volume Vmf and the skeleton volume Vs.
ε = 1 V s V m f
The volume of fluid Vf (foam cells) can be replaced by the difference in the volume of the foam and the skeleton
V f = V m f V s
To determine the foam porosity, the material samples in the form of a cylinder with dimensions of ϕ 0.02 × 0.45 m were used, which were immersed in a calibrated measuring cylinder filled with water. The increase in water volume was taken as the skeleton volume Vs. For each of the foams, measurements were carried out using three samples, and the arithmetic mean of the results obtained for them was taken as the porosity value.

1.2. Measurements Procedure

The main element of the experimental stand (Figure 1) is horizontal channel packed with metal foam, which is divided into three parts: inlet part with the length of 1.1 m, measuring section with the length of 1.01 m made of aluminum pipe and outlet part (0.5 m long) made of transparent organic glass which was used for identification of flow patterns. At the connection of the measuring and the outlet section of the channel, there is a valve for void fraction measurement.
The first part of the channel was utilized to stabilize the hydrodynamic flow parameters. It was assumed to be the section of the channel up to the first pressure measurement point. This point was located at a distance of 1100 mm from the beginning of the channel. This distance was considered sufficient to get the flow fully stabilized. According to the authors of the [39,40] in single-phase flow through metal foams, the flow gets stabilized after a passage of 3–6 times the diameter of the foam cell. Information on the stabilization length for two-phase flow is missing from the literature. Authors of [31,32,41] conducted studies of gas–liquid flow through metal foams in channels with total length not exceeding fifty times the diameter. Air was supply directly from the compressed air system (gauge pressure in the channel did not exceed 62 kPa), while liquid (water/oil) from separate supply systems. Water was pump by the impeller pump (LP) from the water tank (LT). The water flow rate was measured with the use of electronic flow meters Kobold DPM1107G2L (WF) with the measuring accuracy of 1% (relative uncertainty 4.1%), oil flow rate was measured with the use of electronic flow meters Kobold KZA 1804R08 with the measuring accuracy of 2% (relative uncertainty 6%), while the air flow rate was measured with a mass flow meter at the accuracy of 0.2% (relative uncertainty 1.7%). The measurements of the temperatures (T) of individual fluids (in the range of 22 to 25 °C) was carried out using a K-type thermocouple system with an accuracy of Ti ± 0.1K (relative uncertainty 0.9%). The output signals from measuring instruments were connected to the computer-based data acquisition system (PC).
Besides measurement of void fraction, the experimental tests also included the measurement of pressure drops and the identification of flow patterns. The void fraction was measured by the volumetric method (quick-closing valves). In this method, valves are placed at each side of the test section in which the void fraction is measured. The valves are closed and opened simultaneously, which may result in an error in the timing of these valves (usually less than about 20 ms), as well as an error in the measurement of the void fraction of less than 1% [30]. In this way the air–oil or air–water mixture was retained in the measuring section with a known volume. Then, the liquid phase retained on the foam packing was pressed by using compressed air into a measuring cylinder and its volume was determined. The measurement of the volume of liquid retained in the pipe, and knowledge of the total volume of the measuring section containing the trapped fluids made it possible to determine the gas volume RG. Each measurement was made at least three times, and in the case of highly dynamic flows, such as slug or plug flow, it was repeated 5–7 times. The adopted procedure required about 400 measurements. The results obtained from these several measurements were then averaged.
The scope of the experimental tests is described in Table 1, while particular parameters were calculated from Equations (3) and (4). The superficial phase velocity νsf was determined taking into account the porosity of the foam ε using the equation,
v s f = Q f 4 ε π d 2
where: Qf—volumetric flow rate of phase f (gas or liquid), m3/s; d—channel diameter, m.
The volume fraction of the phases ζf was adopted to be represented by the volumetric flow rate of this phase in relation to the total liquids rates QT (sum of gas and liquid rates) the prior to their introduction into the channel
ζ f = Q f Q G + Q L = Q f Q T
where f = L (liquid phase) or f = G (gas phase).
In the transparent part of the measuring channel, observation and identification of flow patterns combined with measurements of the void fraction were performed. The identification of flow patterns was carried out based on visual observations and analysis of camera images and videos captured during the experiments as well as the measurement of the fluctuation of pressure drop (ΔP) in time (τ). Flow patterns were recorded with a Canon EOS 300D digital camera and video camera. The camera used to take images of the flow patterns has a shutter speed of 1/4000 s, whereas the video camera shoots films at a resolution of 1024 × 1024 pixels and a frequency of 1800 Hz.

2. Results and Discussion

2.1. Flow Patterns

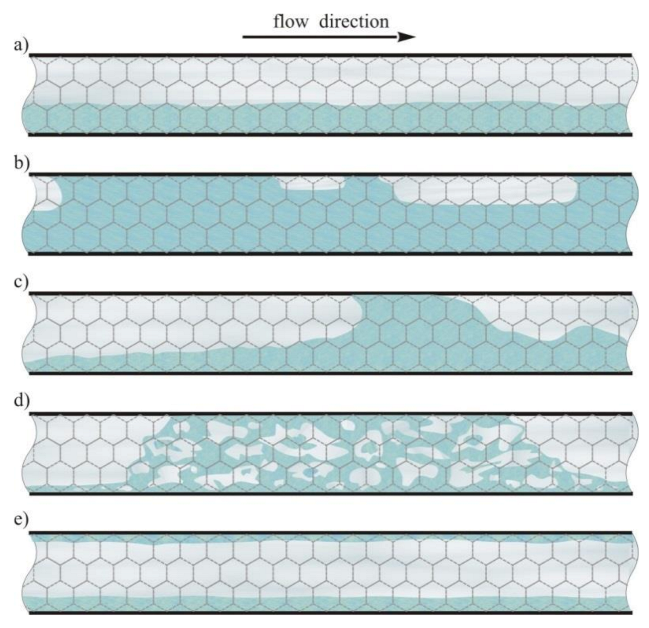
The analysis of the void fraction in gas–liquid flow through channel packed with metal foam cannot be carried out in isolation from the flow patterns that are develop under specified hydrodynamic conditions. During the tests, a typical gas–liquid flow patterns for horizontal empty channel were observed. The most frequent pattern observed was stratified flow but plug flow, semi-slug flow, slug flow, churn flow, and annular flow were also recorded. The annular flow did not occur in the air–oil flow, due to the lower air mass flux compared to the case of the air–water flow tests. Flow patterns observed during the experiments are presented in Figure 4.
The types of flow patterns were determined primarily by the relation of the gas mass flux gG to the liquid mass flux gL. In stratified flow (Figure 4a), gas flows in the upper part and liquid moves in the lower part of the channel. The stratified flow occurs for low liquid and air flow rates. The thickness of liquid layer depends on the flow rate of fluids introduced into the channel. Stratified flow is characterized by the structure of the interface which may be smooth or wavy according to the gas flow rate.
As the gas velocity is increased further, the interfacial waves become larger and can wash to the top of the pipe. The plug flow condition occurs where liquid plugs are separated by elongated gas bubbles (Figure 4b). The elongated gas bubbles are smaller than the pipe diameter such that the continuous liquid layer is flowing along the bottom of the pipe below these elongated bubbles. At even higher gas velocities, the diameter of the elongated gas bubbles become similar in size to the diameter of the pipe and slug flow occur (Figure 4c). The liquid slugs separating the elongated gas bubbles can also be described as high amplitude waves. Due to the high air velocity, considerable waves structures are formed along the interface between the gas and liquid phases. Local accumulations of liquid are also noticeable in the channel. In extreme cases, accumulated liquid portions may even occupy the entire cross-section of the channel.
Churn flow (Figure 4d) occurred when the superficial velocity of water exceeded 0.03 m/s and the air was flowing at a relatively high velocity greater than 1 m/s and has a similar character as slug flow. Accumulation of liquid accompanied this structure often closing the entire cross-section of the channel. Gas velocity increase causes a loss of liquid continuity. Liquid in the form of aerated portions with an irregular shape flows through channel at high speed, cyclically at intervals of several seconds.
When gas flows at many times greater velocity than that of liquid–annular flow is formed (Figure 3e). In annular flow, the liquid covers the channel wall with a thin film layer. Gas creates a core in the central part of the channel. Annular flow was observed at superficial gas velocity of about 4 m/s (mass flux exceeded 7 kg(m2s)).
The results demonstrate that in the flow through the channels with foam packing, the gas velocity that is required to generate annular flow is several times smaller than in the case of flow through the horizontal channels without packing. In empty channels, annular flow usually occurs for gas velocities of about a dozen m/s. Due to its low viscosity, air can relatively easily flow through the foam, which decelerates water flow to a considerable extent, and in turn this increases the interfacial slip that is typical for annular flow. Air–oil flow tests were carried out with a maximum air velocity of 2.5 m/s which was not sufficient to form annular flow.
The test results show that the presence of foam in the channel does not contribute to phase dissipation. Flows, typical for porous media, in which gas flowed in the form of fine bubbles were not observed. The type of foam had no effect on gas–liquid flow patterns. A greater variety of flow patterns was observed in the flow of air with oil than in the flow with water.
Detailed analysis of flow patterns and flow regime map which describe hydrodynamic conditions of particular flow patterns occurrence was presented in [35].

2.2. Void Fraction

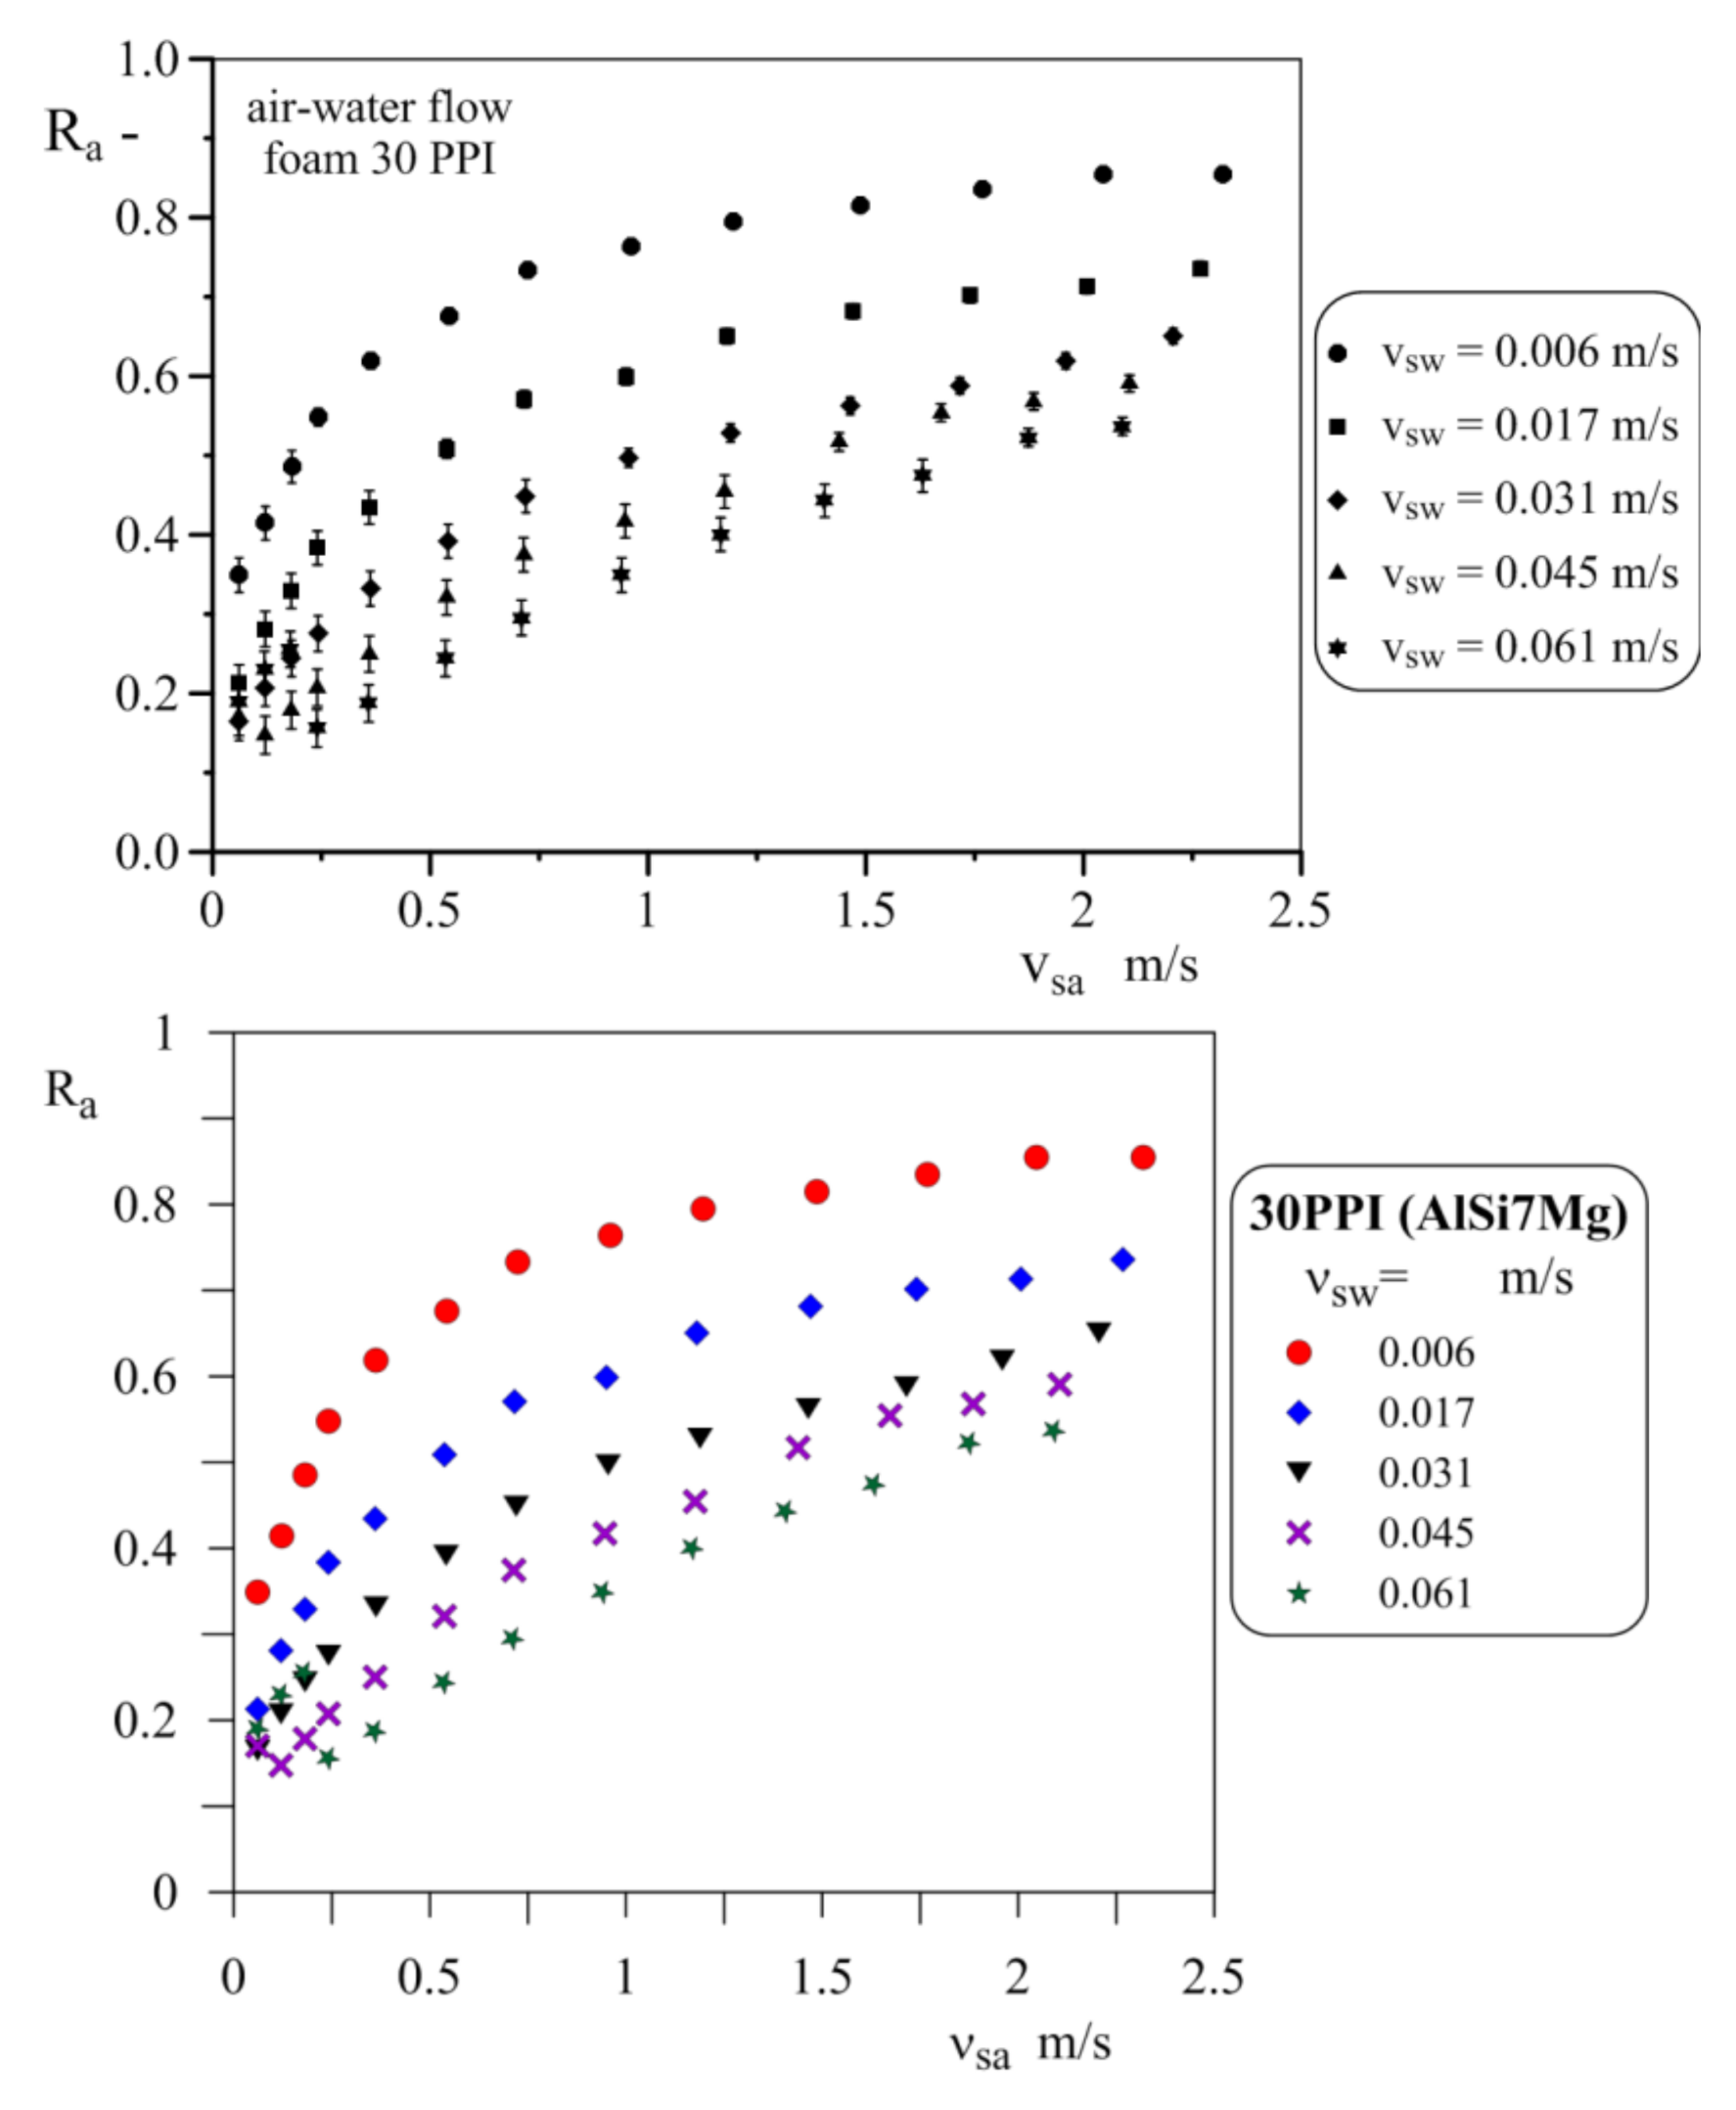
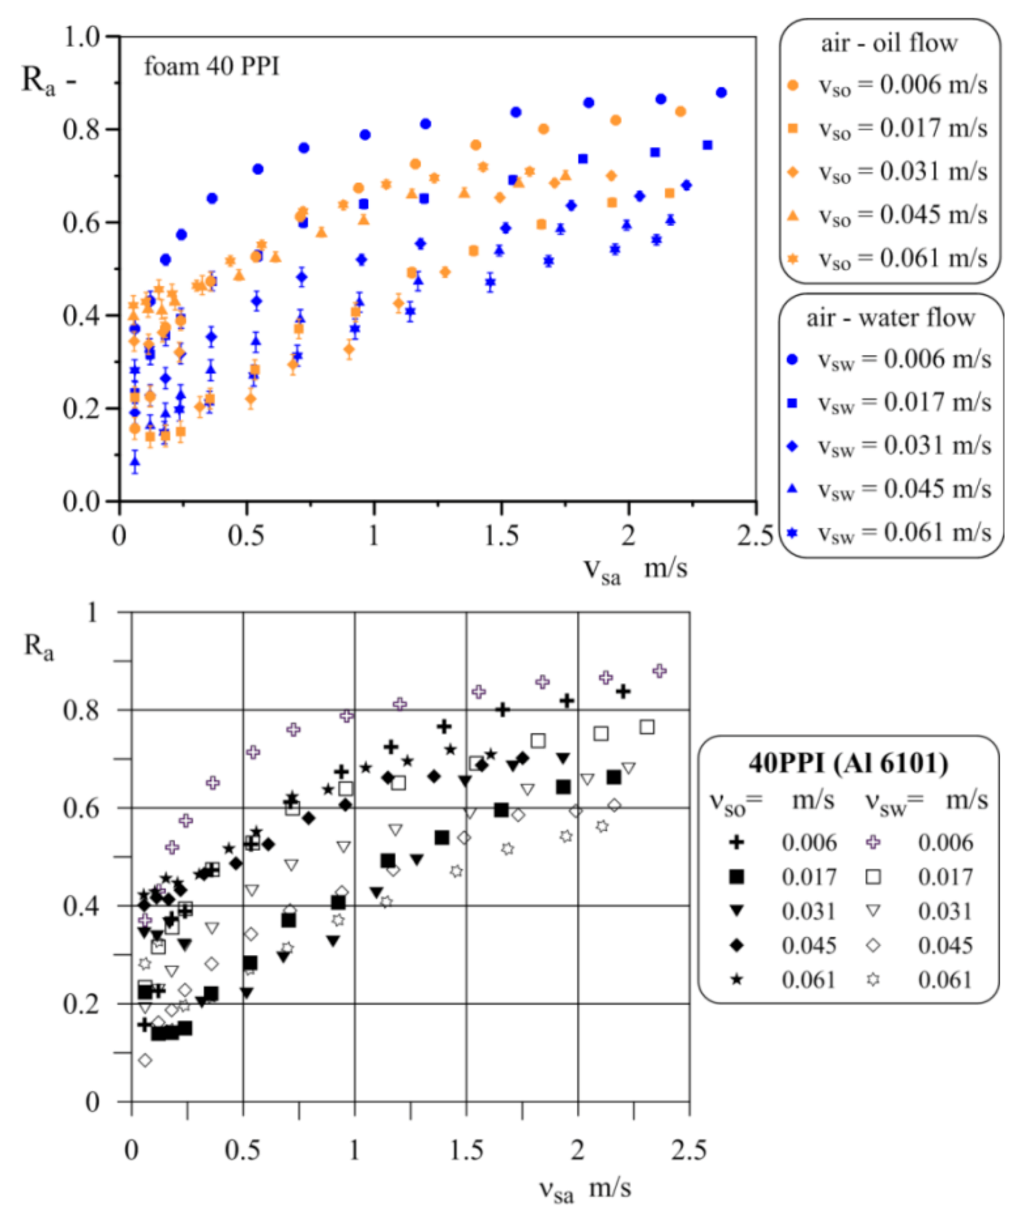
The analysis of changes in void fraction values in two-phase mixture flow allowed to state that the gas void fraction (Ra) increases with the increase of the superficial gas velocity (Figure 5 and Figure 6). At the same time, as illustrated in Figure 5, the increase in the superficial liquid phase velocity (νsw) contributes to the reduction of the gas volume fraction. The degree of this reduction can be as high as 50% in relation to the void fraction recorded at the lowest velocities of the liquid phase. The characteristic course of changes in the Ra values results from the reduction of free space in the channel available for the gas phase flow. As a result of increase in liquid stream and thus the volume of liquid, the larger surface area of the channel wall and the porous packing is wetted and filled by the liquid. Moreover, with higher liquid streams, the gas bubbles can flow much faster through the foam pores, which leads to reduction in their dimensions and thus a reduction in the gas void fraction. Additionally, the value of Ra in a two-phase flow depends on the type of the flow regime determined by the mutual relations of the inlet liquid and gas streams. Figure 6 compares the course of changes in void fraction for air–water and air–oil two-phase flow. The air void fraction in the air–water flow is higher than the corresponding void fraction in the air–oil flow, but only in the range of low superficial liquid velocities 0.006–0.031 m/s. On the other hand, for higher superficial liquid velocities in the range of 0.045–0.061 m/s, an opposite tendency can be observed. The gas void fraction is higher for air–oil flow.
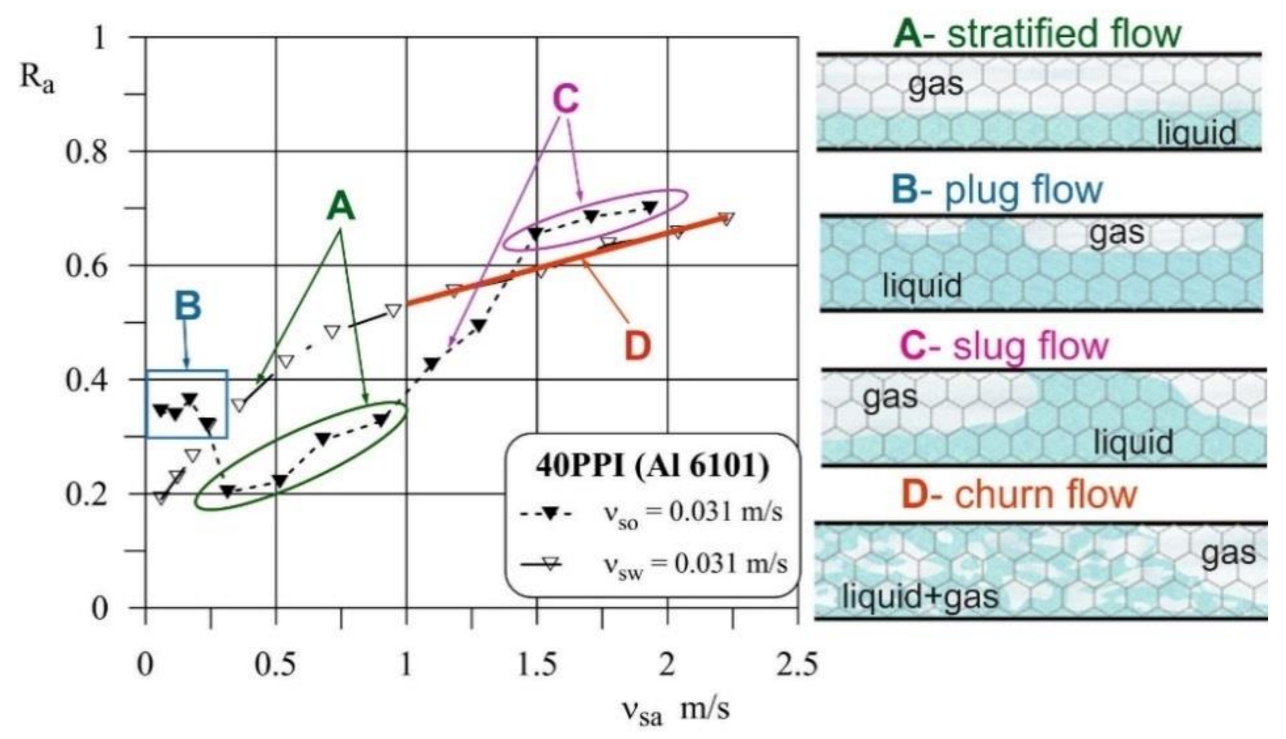
As was shown in Figure 5 and Figure 6, for air–water flow with the increase of the superficial gas velocity, the value of the void fraction increases but has no effect on change in the flow pattern (νsa < 1 m/s)—there is a stratified flow in the channel (see Figure 7). In the case of air–water flow, no local increases or decreases in the value of the air void fraction are observed. A different course of changes in the value of the air void fraction is observed for air–oil two-phase flow (Figure 6). Figure 6 shows that for the same flow conditions, i.e., the same superficial gas velocity, the course of changes in the void fraction for the air–water and air–oil mixture is different. In the case of air–oil flow, the increase in air superficial velocity contributes to the change in the flow pattern, i.e., from the plug to the stratified flow, and thus more differentiated values of the gas void fractions can be observed. The flow pattern transition as a result of an increase in superficial air velocity, which were observed for air–oil flow, is shown in Figure 8.
The influence of the flow patterns on void fraction is particularly noticeable for the flow with the superficial oil velocity νso = 0.031 m/s as illustrated in Figure 7 and Figure 8. Figure 7 shows the change in the air void fraction as a function of the superficial gas velocity for the air–oil (full triangles) and air–water (empty triangles) mixture flow. In Figure 7 and Figure 8, the individual values of void fractions were assigned to the flow patterns observed during the experiment at given flow conditions. In the air–water system (Figure 7), for air superficial velocities less than 1.0 m/s, a stratified flow was observed. When gas superficial velocity was above 1.0 m/s, the stratified flow turned into churn flow. In turn, analyzing the air–oil curve in Figure 7 for the range of low gas superficial velocities (νsa < 0.25 m/s), a plug flow is formed in the channel, which corresponds to large values of the gas volume fraction. When the flow is changed from plug to stratified (νsa > 0.25 m/s), the ratio of air in two-phase mixture flow decreases significantly and then increases quite rapidly again as the flow gradually changes from stratified to slug flow. The observed reduction in pressure drop values recorded during the tests, despite the increase in air superficial velocity, is the result of the reducing the wetted surface of the channel wall and the foam skeleton with oil. In a plug flow, oil covers a much larger area of the channel and foam than in a stratified flow. In the flows with the largest oil streams (which corresponds to νso = 0.045 and νso = 0.061 m/s)—Figure 8, the churn and slug flow occur. For this flow conditions, in the entire range of air velocity changes, the air volume fraction uniformly increasing, however, generally the air void fraction is greater for higher oil streams. A deviation from this trend was observed only for νso = 0.006 m/s and νsa < 0.60 m/s.
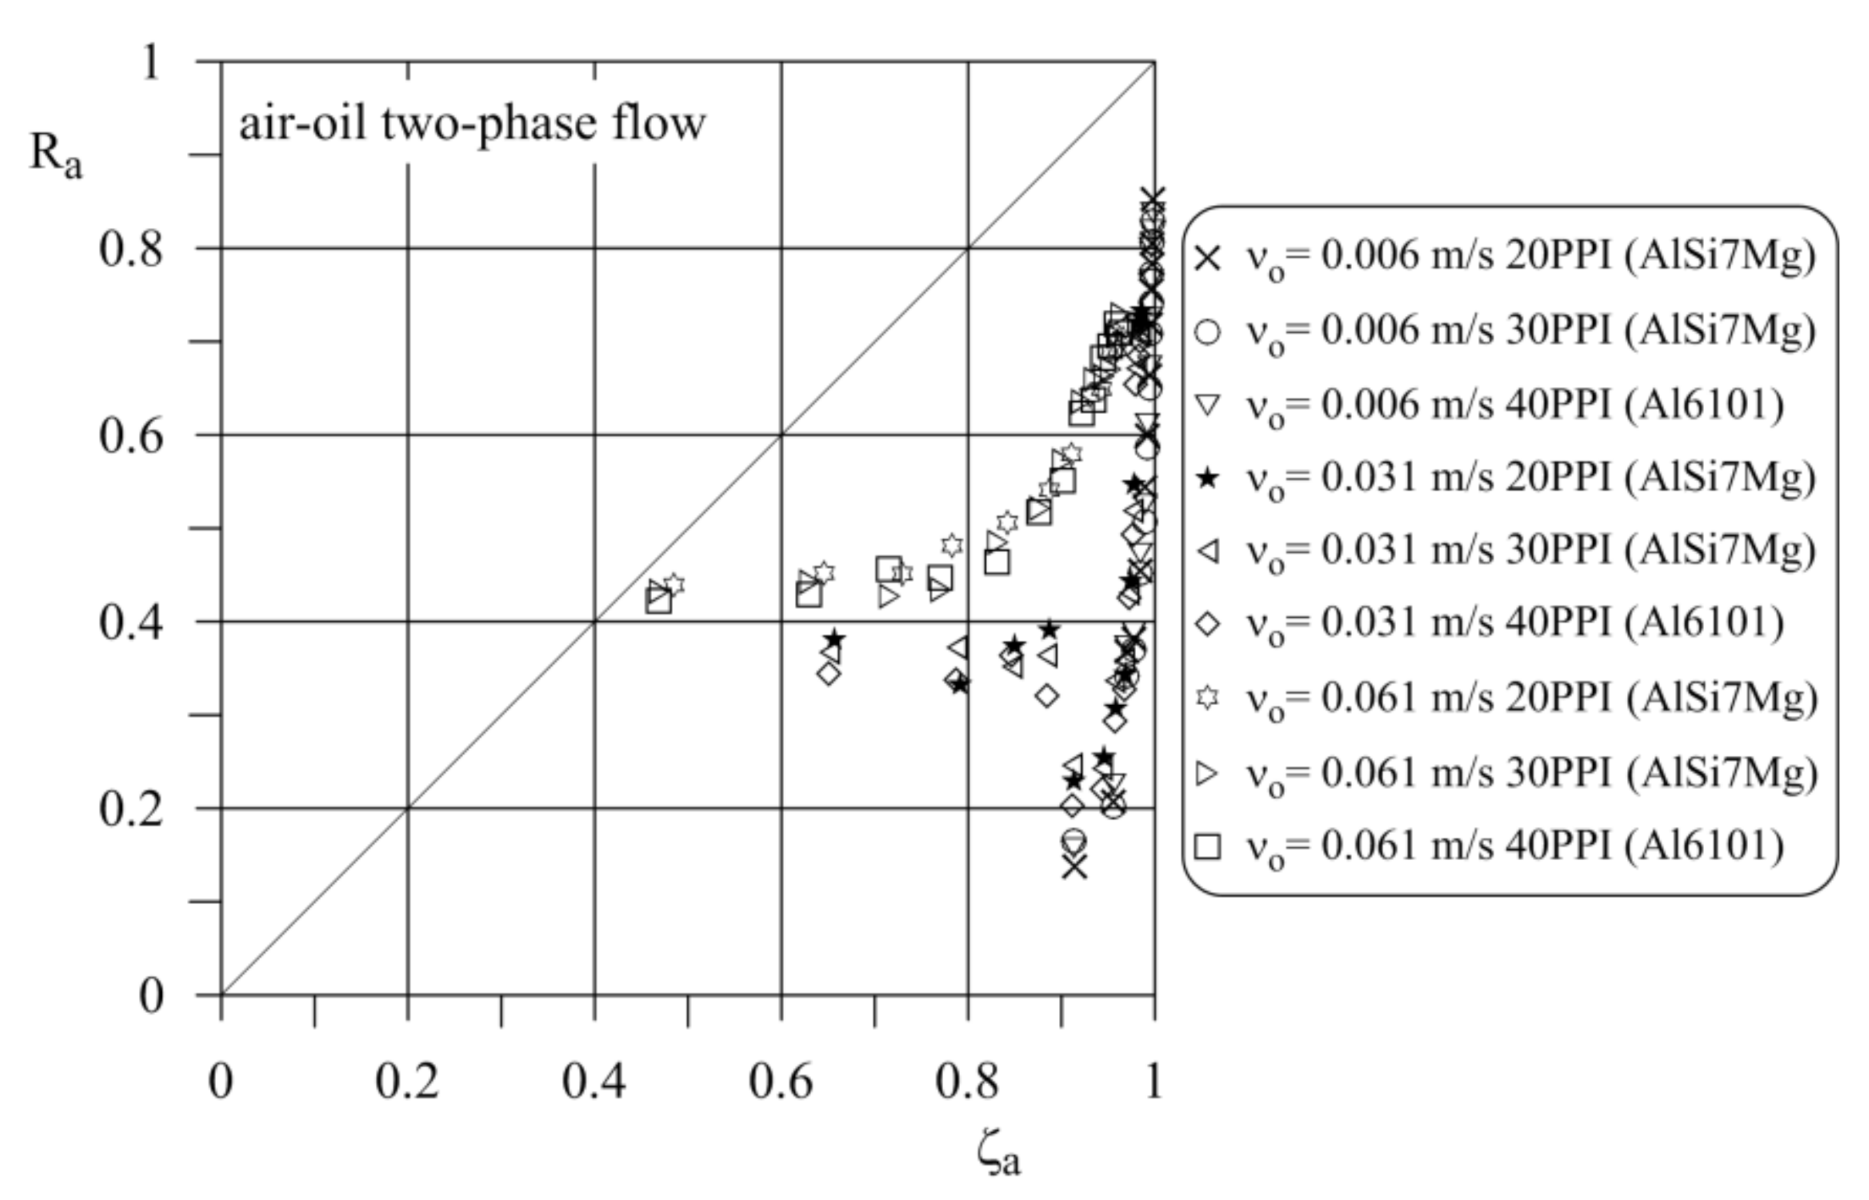
The air due to the low viscosity (at high velocity) flows relatively freely through foam packing while liquid of higher viscosity such as oil is stopped and accumulated on it. As a result, the air void fraction (Ra) in the mixture containing the liquid with higher dynamic viscosity may be over four times lower than the inlet gas volume fraction (ζa), i.e., resulting from the ratio of the volume flow phases at the inlet to the channel, as shown in Figure 9. The reason for the large differences between the values of the measured and inlet gas void fractions is interfacial slip.

2.3. Evaluation of Model for Calculation of Void Fraction

Due to the lack of methods for calculating the void fraction of the phases in the air–oil and air–water multiphase flows in horizontal channels filled with metal foams, an analysis of the possibility of using the models available in the literature, valid for two-phase gas–liquid systems flowing through channels or columns filled with porous material, was analyzed. Moreover, taking into account the results of previous analyzes carried out for the FeCrAlY foam (40 PPI) and the similarity of the flow patterns identified in present research (stratified flow, slug flow, churn flow) to the typical flow patterns observed in a gas–liquid two-phase flow in horizontal pipes without packing, the experimental data was also used to evaluate the validity of models originally developed for gas–liquid flows in empty channels [37]. In the paper, the models developed for porous media such as the Larkins and White model [42], Turpin and Huntington [43], Weber [44], Khan et al. [45] Hu et al. [31], Ji et al. [32], Saada et al. [46], and seven methods for calculating void fraction developed for gas–liquid systems flowing through empty channels (the Lockhart-Martinelli model [47], Zuber-Findlay [48], Dix [49], Chisholm [50], GE RAMP model [51], Stomma [52], and Rouhani [53]) were taken under evaluation. Table 3 describes the methods developed for calculating of void fraction in porous media, while Table 4 shows well-known methods for empty channels.
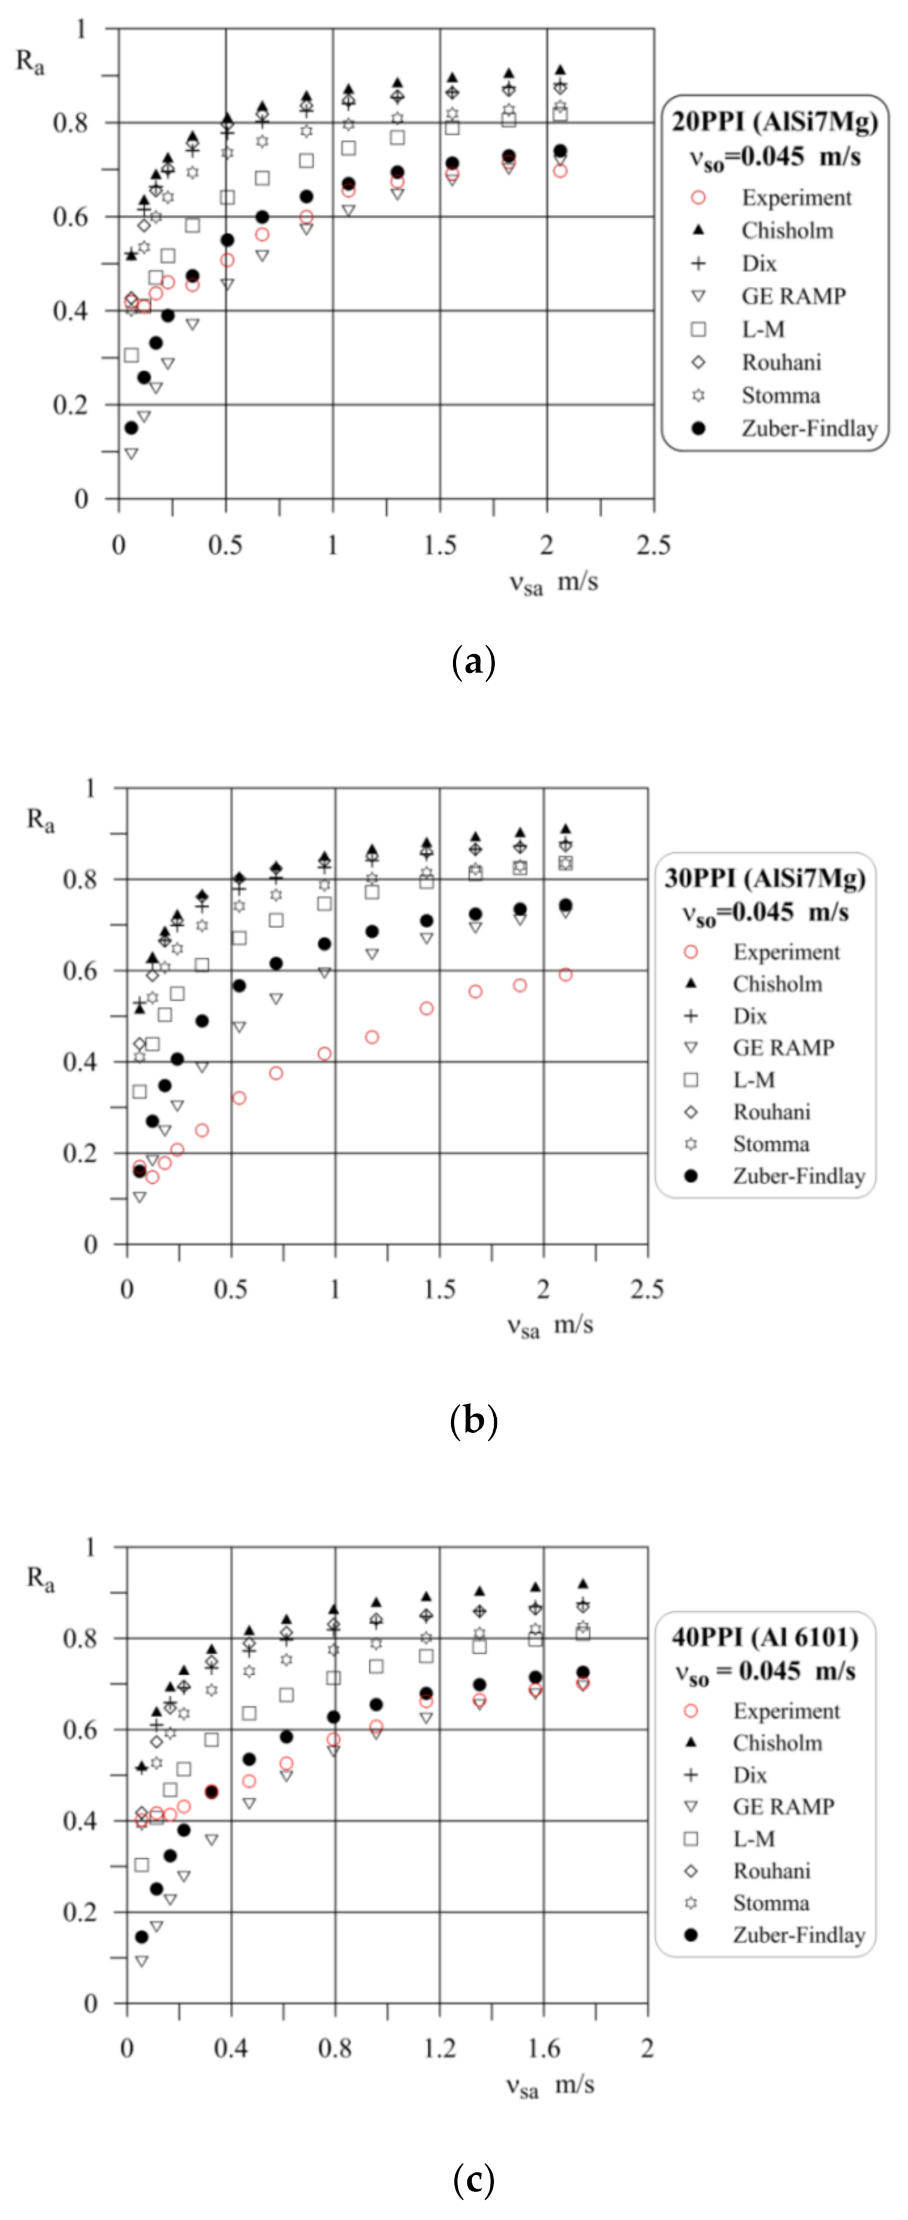
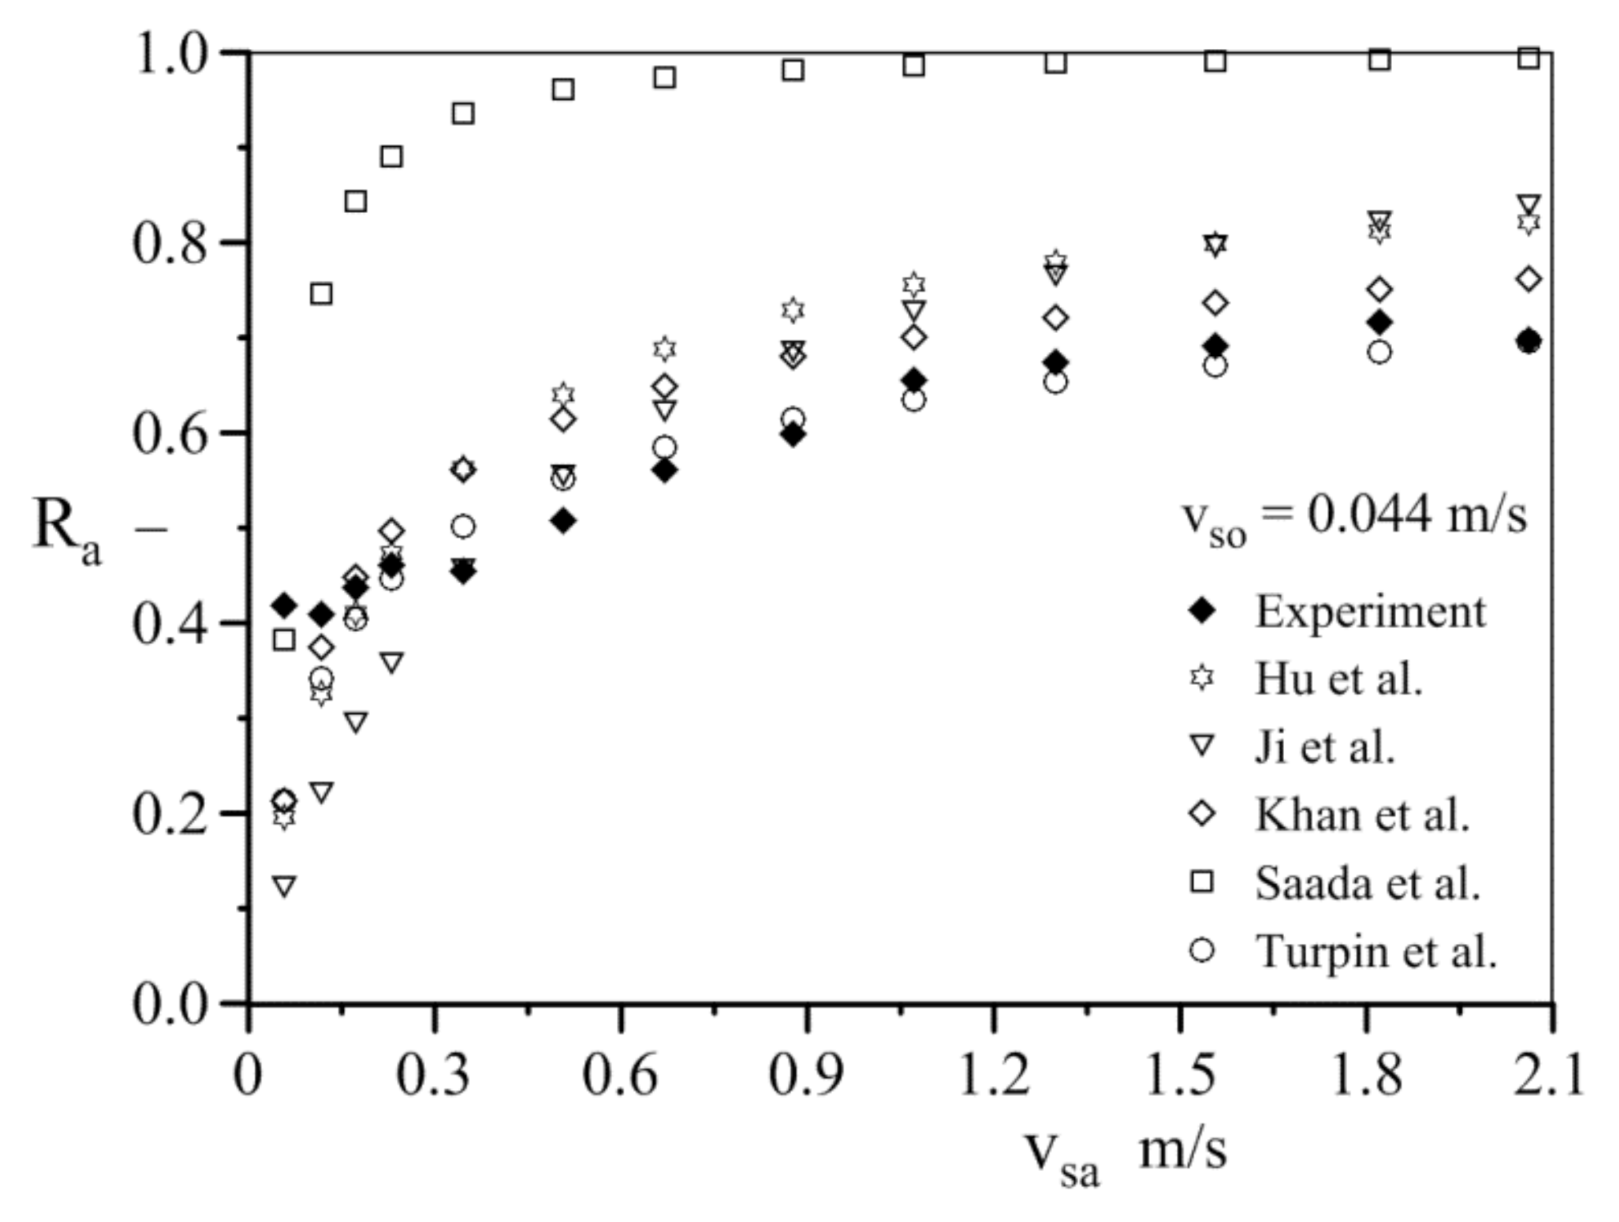
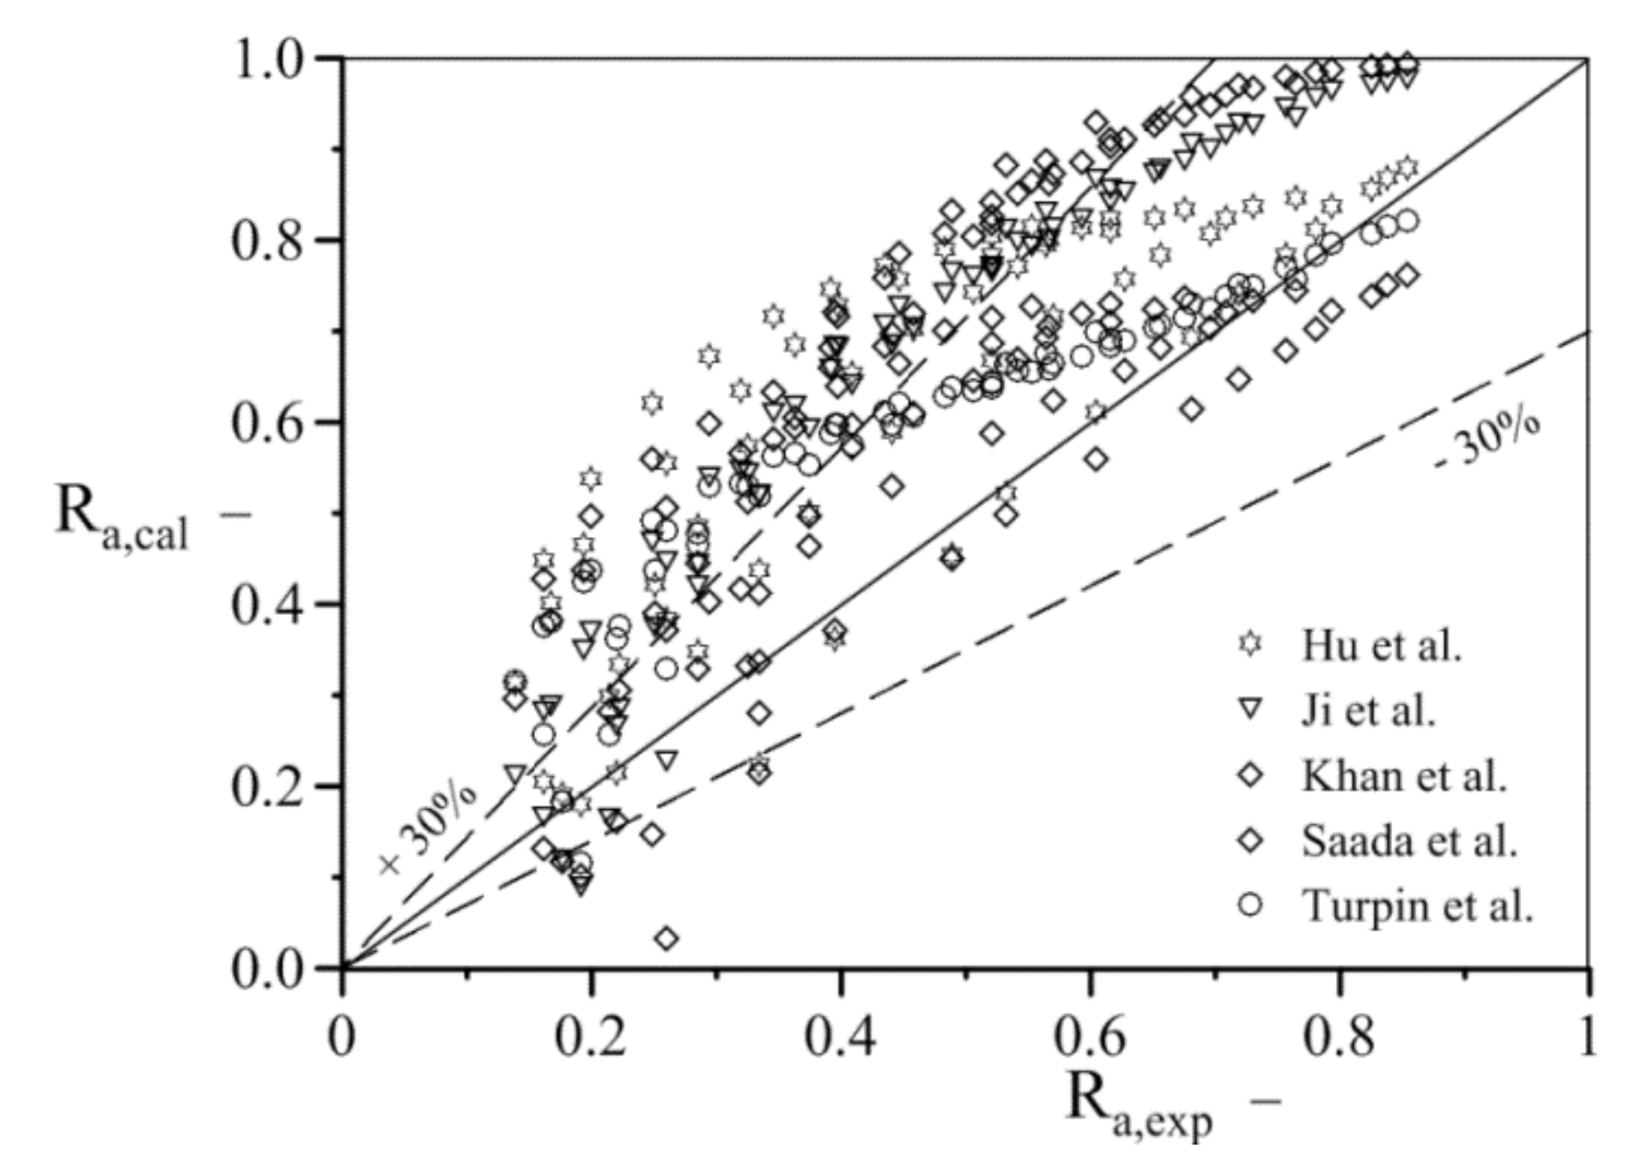
Figure 10 shows the change in the gas void fraction for all analyzed metal foam as a function of the superficial velocity of gas and liquid (νso = 0.045 m/s) for seven analyzed methods. Data analysis shows that none of the verified methods developed for empty channels well-describe the nature of the changes and measured gas void fraction values (Ra), mainly resulting in significantly overestimated these values. The overestimation of gas void fraction is due to the different values of the interfacial slip, which in empty channels has significantly lower values than in packed channels, where the liquid phase may accumulate on the packing elements. Similar observations were made in relation to the methods describing the void fraction in porous media for air–oil two-phase flow (Figure 11) and air–water two-phase flow (Figure 12). Figure 11 shows comparison between experimental and calculated gas void fraction values for constant superficial oil velocity νso = 0.044 m/s. Figure 12 shows that calculated gas void fraction values in relation to experimental ones are significantly overestimated. This is due to the fact that originally these methods describe gas–liquid flow in column apparatuses with a vertical orientation, and thus different from the one considered in our own research. Moreover, the diametrically different geometric structure of the packed bed and the foam causes great problems with determining the characteristic dimensions such as the hydraulic diameter. In porous media it is usually a size related to the particle diameter, which is physically non-existent in foams. The possibility of direct use of models valid for the flow in porous media to describe the void fraction of the phases in the gas–liquid flow through metal foams is limited due to the presence of different type of flow patterns in metal foams than in porous media. The greater variety of flow patterns in metal foams makes the phenomena accompanying the flows in the cell space of foams more complex than in porous media.
The results of the statistical analysis of the methods for calculating the void fraction in the air–oil flow through the channels filled with metal foam are presented in Table 5. The Root Mean Square (RMS) deviations and the relative error (δ(ε)) of the experimental data with the correlations reported in Table 3 and Table 4 were listed in Table 5. The RMS deviation is estimated from the following equation
R M S = 1 n i = 1 n x e x p x c a l c x e x p 2 0.5
The evaluation of the methods shows that most of them do not allow to calculate the volume fraction of the phases with the appropriate accuracy. Unsatisfactory prediction results were obtained for the methods of calculating the volume fraction of the phases developed for the flow through granular porous media for which the value of the mean standard deviation (RMS) significantly exceeds 70% and the relative error value δ(ε) is equal to 49%. The best approximation compared to the experimental data is provided by the GE RAMP [51] and Zuber-Findlay [48] methods developed for flows through empty channels. These methods, in the case of flow through the tested foams, allow the determination of Ra with an accuracy (RMS) of 36% and 46%, respectively, and with a relative error of 13% and 19%.

2.4. Method for Predicting the Void Fraction

The performed statistical evaluation of the methods for calculating the void fraction indicated that in the air–oil and air–water two-phase flows through metal foams these methods do not allow predicting these values with high accuracy. Based on the results of the statistical analysis and taking into account the similarity of the gas–liquid flow patterns identified during the tests to the flow patterns forming in empty channels, as well as their significant influence on the values of void fraction, it was decided to development of a new calculating method in packed channels based on assumptions right for separated flow. Evaluation of methods valid for two-phase flows through empty and filled channels allowed to select the drift-flux model proposed by Zuber and Findlay [48] as the basis for the development of the method calculating the void fraction in gas–liquid flow through channel filled with metal foam. According to the model, the gas void fraction (RG) is related to the parameters defining the flow conditions with the following relations:
ν s G R G = C o ν 2 P + ν d r
where: ν2P is the two-phase mixture mean velocity, Co is the distribution parameter, and νdr is the mean drift velocity, which represents the difference between the gas velocity and the mixture mean velocity and is usually considered to be a function of the terminal rise velocity of a bubble in a stagnant liquid phase. Two-phase mixture mean velocity is given by
ν 2 P = ν s G + ν s L
where: νsG is the superficial gas velocity, νsL is the superficial liquid velocity.
It was shown in [37,54] that Zuber-Findlay model, despite its simplicity, ensures relatively good agreement of the void fraction predicted values with the experimental ones, but mainly under flow conditions with small streams of liquid. As the liquid flux increases, the gas volume fraction calculated by the drift-flux model becomes more and more overestimated. Moreover, the experimental data show that in the case of flow through channels with metal foams, the curve of changes in the measured air void fraction as a function of air superficial velocity becomes “straightened” with the increase of the liquid flux (Figure 5 and Figure 6), which is not included in the Zuber and Findlay model. For this reason, while maintaining the original form of the drift-flux model, the distribution parameter Co and drift velocity (νdr) were subjected to independent modeling.
In the original form of the drift-flux model, and its numerous modifications, it is generally assumed that for small-diameter channels, the values of the distribution parameter Co and, above all, νdr depend, among others, on the physical properties of the phases, channel diameter and flow patterns, but in relation to a specific channel—two-phase mixture system, they are in fact constant values. The influence of the liquid flux on the course of changes in the measured void fraction of air observed during the experimental tests shows that in the case of two-phase flow through metal foams, the Co constant and the drift velocity also depend on the quantities describing the flow dynamics.
The distribution parameter Co is described by many researchers with similar relations, the basis of which is Equation (8), as a result it takes the value of approximately 1.2.
C o = 1.2 0.2 ρ G ρ L 0.5
This is the reason for some theoretical imperfection of the drift-flux model in estimating the real average gas velocity (left side of Equation (6)). In the case when the gas void fraction in the two-phase flow increases to 1, for each Co value differ than 1, this average gas velocity will not be consistent with the velocity resulting from the gas stream feeding the channel, (νsG/RG) ≠ ν2P = νsG. To avoid this inaccuracy, in the modified drift-flux model, the distribution parameter Co is given by
C o = 1.2 0.2 x G 0.5
Using the mass fraction of gas (xG) as a variable in Equation (9), the influence of the flow conditions on the changes of the void fraction of the phases was taken into account. In this equation, the value of the distribution parameter Co = 1 when xG = 1 (keeping the Co value close to 1.2 over a wide range of flow parameters changes). With the constant Co defined in this way, the influence of other quantities describing the flow conditions on the value of the volumetric fractions must be included in the description of the drift velocity νdr. In the modified form of the drift-flux model, this quantity is described by the following relationship
ν d r = C ν s L ν 2 P c 1 R e G c 2 σ L ğ ρ L ρ G 0.5 d h 1 η L η w ρ w ρ L 2 c 3
where: ğ —acceleration of gravity (m/s2), νsL—superficial liquid velocity m/s, ν2P—two-phase mixture velocity m/s, σL—liquid surface tension N/m, ρL—liquid density, ρG—gas density, ρw—water density, μL—liquid dynamic viscosity Pas, μG—gas dynamic viscosity Pas, μw—water dynamic viscosity Pas, dh—hydraulic diameter m, ReG—dimensionless gas Reynolds number.
The first part of this equation includes the influence of dynamic flow conditions on the value of νdr. The drift velocity is also determined by other factors influencing the formation of specific flow structures in the channel. These can include the surface tension of the liquid, differences in phase density, phase void fraction in the mixture, or geometric parameters of the channel. In the newly developed model, the reciprocal of the dimensionless hydraulic diameter (the second term of Equation (10)) proposed by Kataoka and Ishii [55] was used to describe the drift velocity. The presented correlation of the drift velocity (values determined on the basis of experimental data) with the quantities describing the flow conditions (Figure 13), indicated the necessity to take into account also the viscosity of the liquid. For this purpose, based on the experience in modeling of frictional pressure drop in gas–liquid systems, the dimensionless expression ((μL/μw)(ρw/ρL)2) was introduced into Equation (10). The Reynolds number for gas phase ReG describing the flow was defined by the equation
R e G = ν s G d h ρ G ε μ G
The hydraulic diameter (dh) in Equation (11) is an equivalent value calculated in relation to the structural parameters of the metal foam, i.e., porosity (ε) and pore diameter of the foam (dp). The value is calculated from the following equation
d h = ε d p 1 ε
The constant C and the exponents c1, c2, c3 in Equation (10) were determined on the basis of statistical calculations carried out independently for stratified and other type of flow (plug, slug, churn, annular). The analysis of void fraction data showed that the influence of flow patterns on the void fraction value can be limited to these two groups of flow patterns. For stratified flow, the determined values of the constant C and the exponents are as follows
C = 0.14; c1 = 0.75; c2 = 0.85; c3 = 0.33.
For the other types of flow patterns, the following constants can be taken C = 0.01; c1 = 1.1; c2 = 1.1; c3 = 0.33. The drift velocity equations for the various flow structures are summarized in the Table 6.
The liquid void fraction should be determined taking into account the gas void fraction as a complement to unity
R L = 1 R G
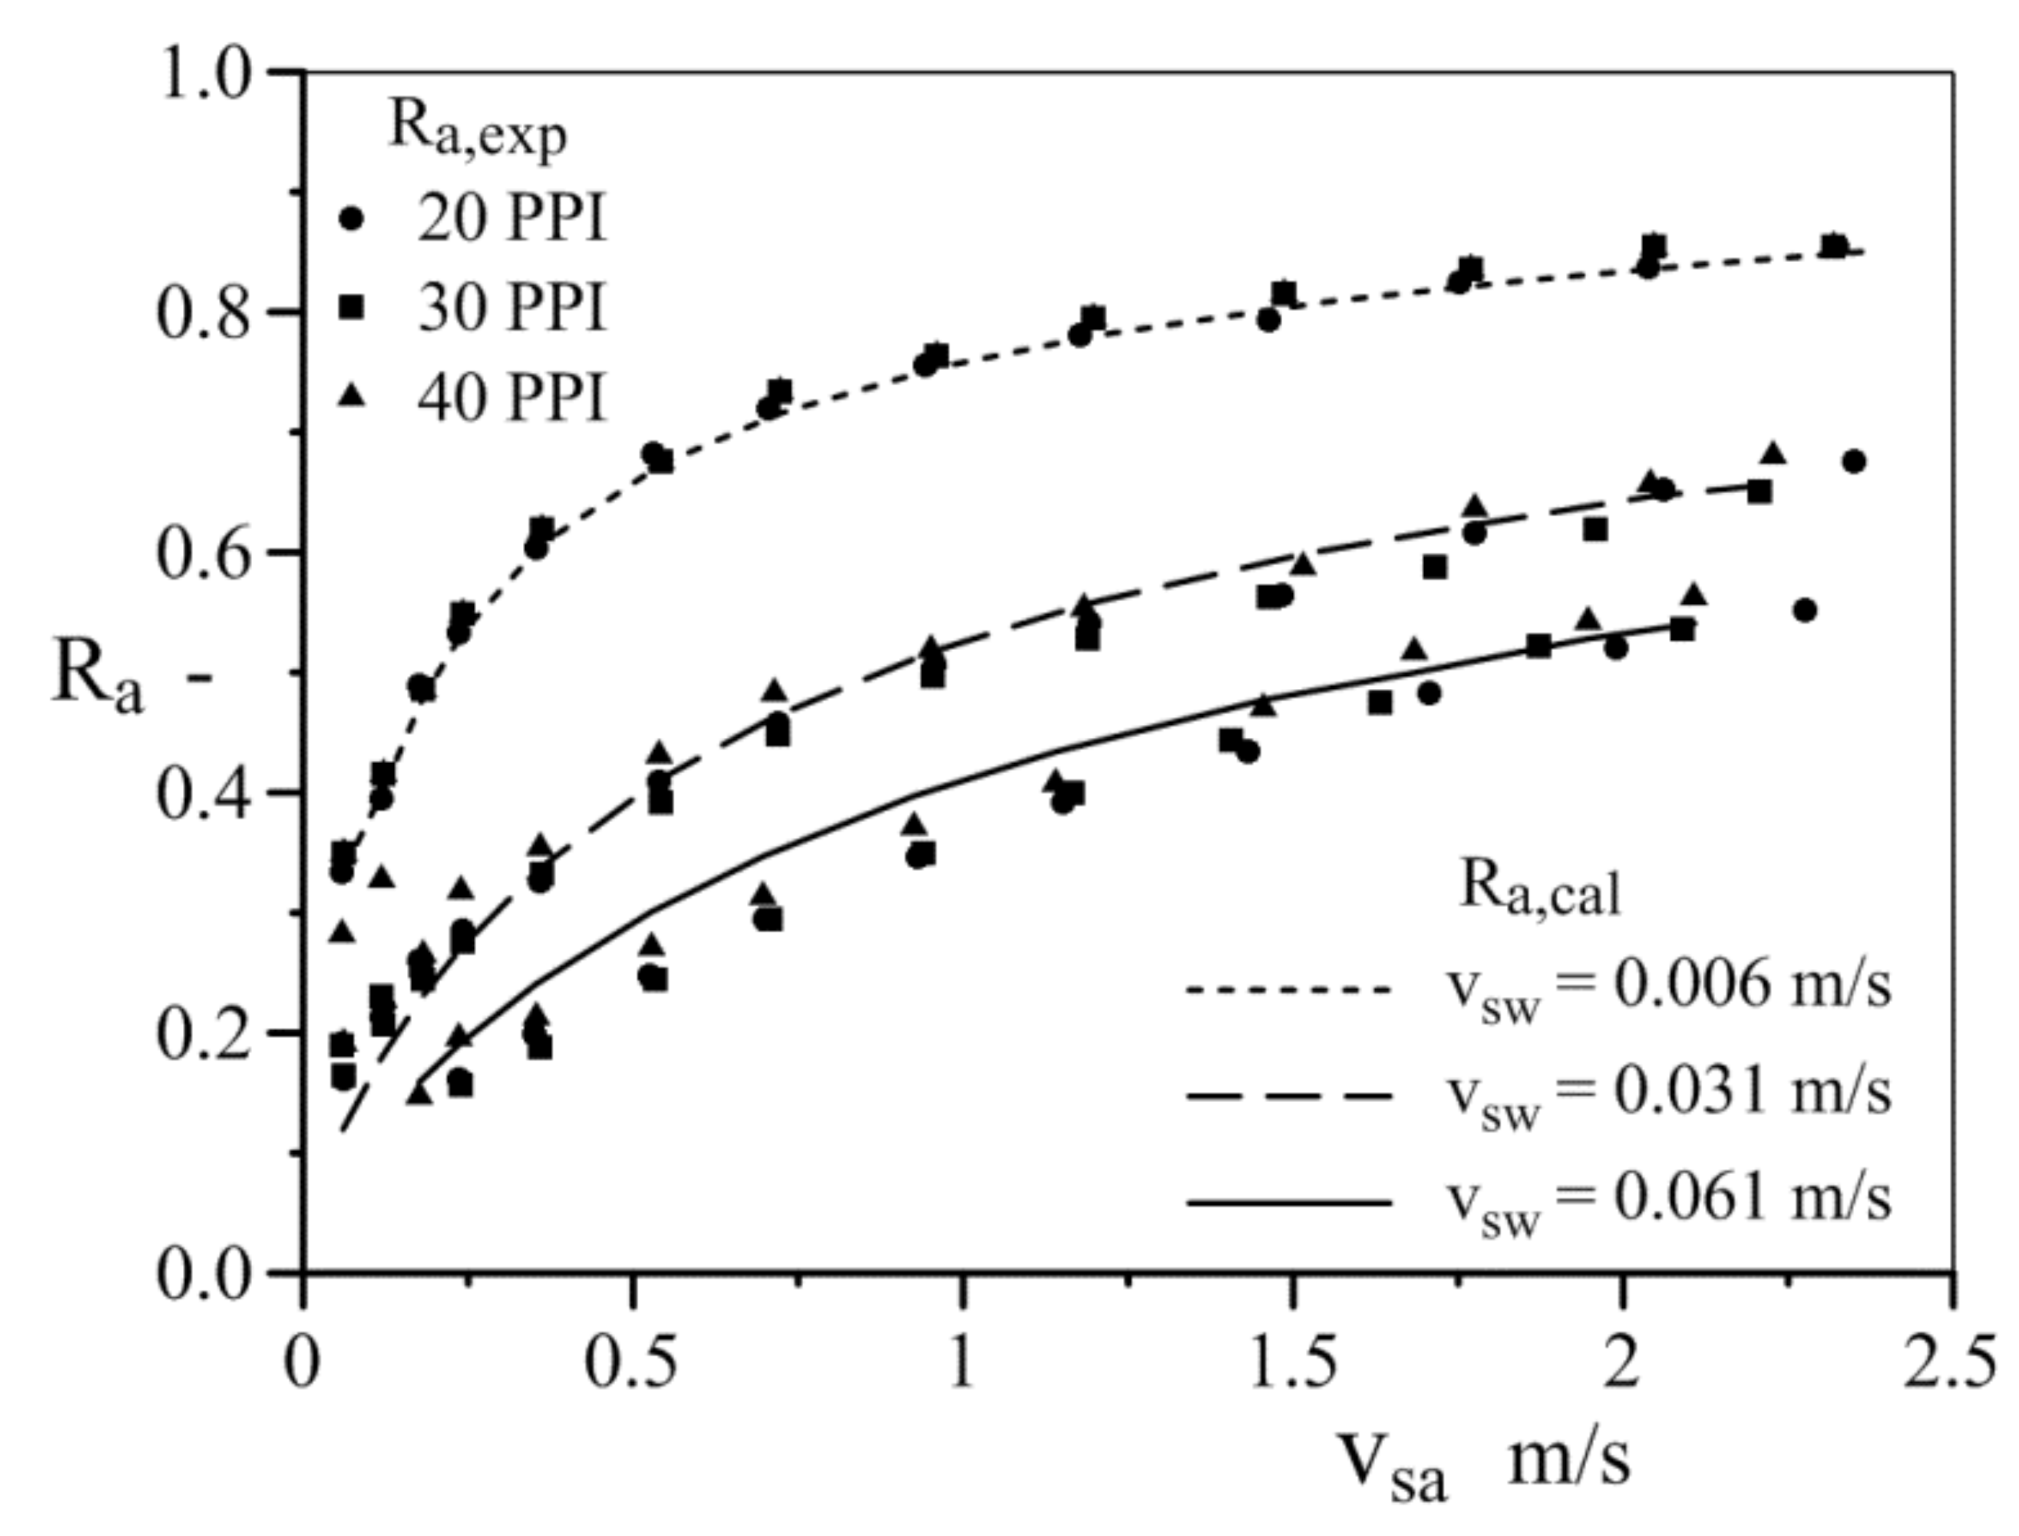
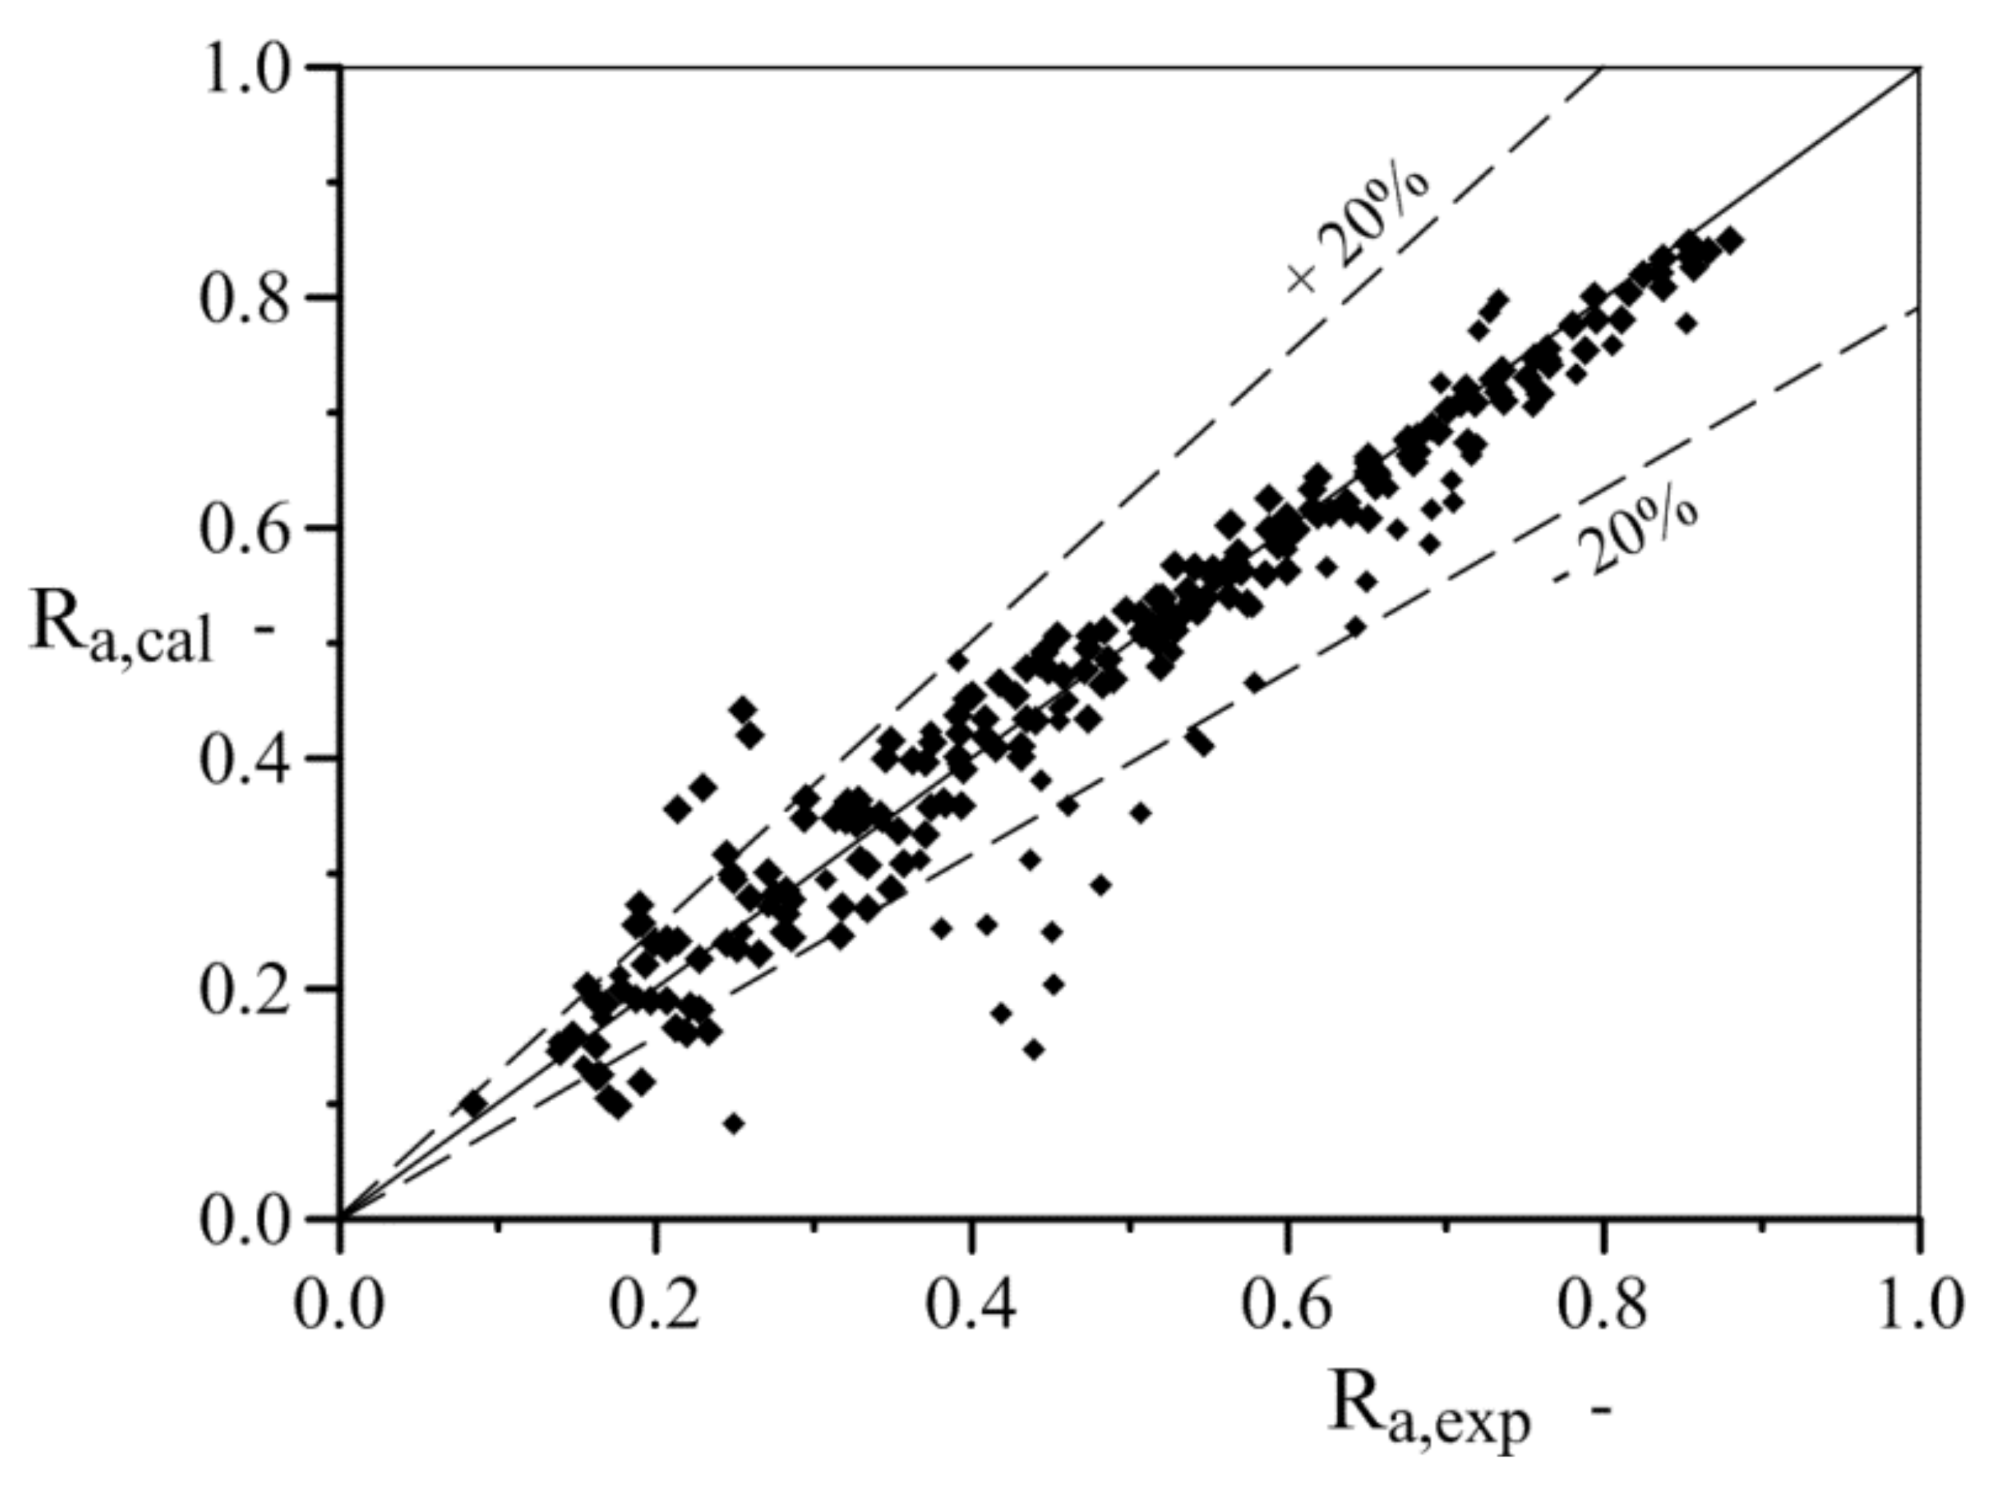
The greatest discrepancies between the air void fraction measured and calculated according to the developed method were found in the case of calculations carried out for mixtures with a small mass fraction of air (xG < 0.005), and for flow patterns different than stratified flow. The new developed method of calculating the volume fractions of phases can be used to describe the gas–liquid flow through metal foams, ensuring the correct representation of the course of changes in the volume fraction of air and high accuracy of determining this value. For example, Figure 14 shows the course of changes in the void fraction in the air–water flow through 20, 30, and 40 PPI metal foams (the points marked on the graph describe the experimental data, while the lines, the void fraction values predicted according to the model). Comparison of the measured air void fractions with calculated according to the new model is presented in Figure 15. The average relative error of prediction of the air void fraction is less than 13%, and 86% of the computational data is characterized by an error of less than 20%.

3. Conclusions

The results of the experimental tests show that in the gas–liquid flow, the presence of foam in the channel does not cause phase dispersion. In the channels packed with open-cell metal foam there are flow patterns typical for horizontal empty channels such as plug, slug, churn, and stratified flow. However, it has been found that the foam causes greater interfacial slip than during the flow of the two-phase gas–liquid mixture through the empty channels. The differences in the foam geometric structure do not affect the value of the phase void fraction and the type of flow patterns present in the flow. On the other hand, it was found that the flow patterns significantly influenced the value of void fraction.
The experimental data were used to develop a new method for predicting void fraction in two-phase gas–liquid flow in channels packed with metal foams. New model was based on the results covering a wide range of changes in flow parameters (velocity of fluids), using two liquids with different physical properties and foams with different pore densities (PPI). This method is based on the assumptions of the Zuber-Findlay drift-flux model. It should be emphasized that for the two-phase gas–liquid flow, the proposed model remains valid in the conditions of gas or liquid disappearance in the flow.
The average relative error for air void fraction prediction in two-phase flow through metal foam is less than 13%, and 86% of the computational data is characterized by an error of less than 20%. This model can be used for design of apparatuses packed with metal foam, in which there is a two-phase gas–liquid flow. Further research will be carried out using foams with a higher degree of pore packing which significantly increases the contact area between the phases. These types of foams are often used in catalytic reactors, fuel cells, and microreactors.
Experimental results presented in the paper complement and extend the current state of knowledge in relation to hydrodynamic of two-phase gas–liquid flow through horizontal channel packed with open-cell metal foams.

Author Contributions

Conceptualization, R.D.; methodology, M.P. and R.D.; validation, M.P. and R.D.; investigation, R.D.; supervision, R.D.; writing—original draft, M.P.; writing—review and editing, M.P.; visualization, M.P. and R.D. All authors have read and agreed to the published version of the manuscript.

Funding

This research received no external funding.

Conflicts of Interest

The authors declare no conflict of interest.

Abbreviations

Nomenclature
dinternal diameter of pipe (m)
ğacceleration of gravity (m/s2)
g ˙ L mass flux (kg/(m2 s))L length, m
νσsuperficial velocity (m/s)
Rvoid fraction (-)
ReReynolds number (-)
Ttemperature (°C)
Qvolumetric flow rate (m3/s)
xmass fraction (-)
Greek symbol
ζinput void fraction (-)
μviscosity (Pas)
ϑζequivalent linear dimension (m)
ρdensity (kg/m3)
σsurface tension (N/m)
Subscripts
aair2P two-phase flow
calcalculated value
ccolumn, channel
expmeasured value
Ggas
ii-phase
Lliquid
ooil
ppacking
wwater

References

  1. Banhart, J. Manufacture, characterization and application of cellular metals and metal foams. Prog. Mater. Sci. 2001, 46, 559–632. [Google Scholar] [CrossRef]
  2. Quadbeck, P.; Kümmel, K.; Hauser, R.; Standke, G.; Adler, J.; Stephani, G. Open Cell Metal Foams—Application-oriented Structure and Material Selection. In Proceedings of the International Conference on Cellular Materials, CellMat 2010, Dresden, Germany, 27–29 October 2010; Stephani, G., Hipke, T., Scheffler, M., Adler, J., Eds.; CELLMAT: Valladolid, Spain, 2010; pp. 279–288. [Google Scholar]
  3. Xu, S.; Wu, Z.; Lu, H.; Yang, L. Experimental Study of the Convective Heat Transfer and Local Thermal Equilibrium in Ceramic Foam. Processes 2020, 8, 1490. [Google Scholar] [CrossRef]
  4. Bhattacharya, A.; Mahajan, R.L. Finned metal foam heatsinks for electronics cooling in forced convection. ASME J. Electron. Packag. 2002, 124, 155–163. [Google Scholar] [CrossRef]
  5. Vafai, K. Handbook of Porous Media, 2nd ed.; Taylor Francis: New York, NY, USA, 2005. [Google Scholar]
  6. Stemmet, C.P.; Jongmans, J.N.; Schaaf, J.; Kuster, B.M.F.; Schouten, J.C. Hydrodynamics of gas-liquid counter-current flow in solid foam packings. Chem. Eng. Sci. 2005, 60, 6422–6429. [Google Scholar] [CrossRef]
  7. Quadbeck, P.; Stephani, G.; Kümmel, K.; Adler, J.; Standke, G. Synthesis and Properties of Open-Celled Metal Foams. MSF 2007, 534–536, 1005–1008. [Google Scholar] [CrossRef]
  8. Gao, W.; Xu, X.; Liang, X. Flow boiling of R134a in an open–cell metal foam mini−channel evaporator. Int. J. Heat Mass Transf. 2018, 126, 103–115. [Google Scholar] [CrossRef]
  9. Tourvieille, J.-N.; Philippe, R.; de Bellefon, C. Milli−channel with metal foams under an applied gas–liquid periodic flow: Flow patterns, residence time distribution and pulsing properties. Chem. Eng. Sci. 2015, 126, 406–426. [Google Scholar] [CrossRef]
  10. Li, H.-W.; Zhang, C.-Z.; Yang, D.; Sun, B.; Hong, W.-P. Experimental investigation on flow boiling heat transfer characteristics of R141b refrigerant in parallel small channels filled with metal foam. Int. J. Heat Mass Transf. 2019, 133, 21–35. [Google Scholar] [CrossRef]
  11. Wan, Z.; Sun, Y.; Yang, C.; Kong, X.; Yan, H.; Chen, X.; Huang, T.; Wang, X. Experimental performance investigation on the arrangement of metal foam as flow distributors in proton exchange membrane fuel cell. Energy Convers. Manag. 2021, 231, 13846. [Google Scholar] [CrossRef]
  12. Guo, J.; Liu, Z.; Du, Z.; Yu, J.; Yang, X.; Yan, J. Effect of fin-metal foam structure on thermal energy storage: An experimental study. Renew. Energy 2021, 172, 57–70. [Google Scholar] [CrossRef]
  13. Li, H.Y.; Leong, K.C. Experimental and numerical study on single and two-phase flow and heat transfer in aluminum foams. Int. J. Heat Mass Trans. 2011, 54, 4904–4912. [Google Scholar] [CrossRef]
  14. Kim, S.Y.; Lee, K.S. Heat removal by aluminum foam heat sinks in a multi-air jet impingement. IEEE Trans. Compon. Packag. Technol. 2005, 28, 141–148. [Google Scholar]
  15. Liang, L.S.; Wu, X.L.; Ma, N.N.; Du, J.J.; Liu, M.B. The Sound Absorption Properties Comparison of Metal Foams and Flexible Cellular Materials. MSF 2018, 933, 357–366. [Google Scholar] [CrossRef]
  16. Jin, W.; Liu, J.; Wang, Z.; Wang, Y.; Cao, Z.; Liu, Y.; Zhu, X. Sound Absorption Characteristics of Aluminum Foams Treated by Plasma Electrolytic Oxidation. Materials 2015, 8, 511–7518. [Google Scholar]
  17. Abadi, G.B.; Moon, C.; Kim, K.C. Flow boiling visualization and heat transfer in metal−foam−filled mini tubes–Part I: Flow pattern map and experimental data. Int. J. Heat Mass Transf. 2016, 98, 857–867. [Google Scholar] [CrossRef]
  18. García-Moreno, F. Commercial Applications of Metal Foams: Their Properties and Production. Materials 2016, 9, 85. [Google Scholar] [CrossRef]
  19. Salehi, M.; Mirbagheri, S.M.H.; Ramiani, A.J. Efficient energy absorption of functionally-graded metallic foam-filled tubes under impact loading. Trans. Nonferrous Metals Soc. China 2021, 31, 92–110. [Google Scholar] [CrossRef]
  20. Ghidossi, R.; Bonnet, J.-P.; Rebollar-Perez, G.; Carretier, E.; Ferrasse, J.-H.; Vicente, J.; Topin, F.; Moulin, P. Separation of particles from hot gases using metallic foams. J. Mater. Process. Technol. 2009, 209, 3859–3868. [Google Scholar] [CrossRef]
  21. Hutter, C.; Allemann, C.; Kuhn, S.; Von Rohr, P.R. Scalar transport in a milli-scale metal foam reaktor. Chem. Eng. Sci. 2010, 65, 3169–3178. [Google Scholar] [CrossRef]
  22. Wenmakers, P.W.A.M.; Van der Schaaf, J.; Kuster, B.F.M.; Schouten, J.C. Enhanced liquid-solid mass transfer by carbon nanofibers on solid foam as catalyst support. Chem. Eng. Sci. 2010, 65, 247–254. [Google Scholar] [CrossRef]
  23. Tschentscher, R.; Nijhuis, T.A.; van der Schaaf, J.; Kuster, B.F.M.; Schouten, J.C. Gas−liquid mass transfer in rotating solid foam reactors. Chem. Eng. Sci. 2010, 65, 472–479. [Google Scholar] [CrossRef]
  24. Stemmet, C.P.; Schaaf, J.; Kuster, B.M.F.; Schouten, J.C. Solid foam packings for multiphase reactors: Modeling of liquid holdup and mass transfer. Chem. Eng. Res. Des. 2006, 84, 1134–1141. [Google Scholar] [CrossRef]
  25. Twigg, M.V.; Richardson, J.T. Fundamentals and applications of structured ceramic foam catalysts. Ind. Eng. Chem. Res. 2007, 46, 4166–4177. [Google Scholar] [CrossRef]
  26. Stemmet, C.P.; Meeuwse, M.; Schaaf, J.; Kuster, B.M.F.; Schouten, J.C. Gas-liquid mass transfer and axial dispersion in solid foam packings. Chem. Eng. Sci. 2007, 62, 5444–5450. [Google Scholar] [CrossRef]
  27. Leon, M.A.; Nijhuis, T.A.; van der Schaaf, J.; Schouten, J.C. Mass transfer modeling of a consecutive reaction in rotating foam stirrer reactors: Selective hydrogenation of a functionalized alkyne. Chem. Eng. Sci. 2012, 73, 412–420. [Google Scholar] [CrossRef]
  28. Zalucky, J.; Wagner, M.; Schubert, M.; Lange, R.; Hampel, U. Hydrodynamics of descending gas−liquid flows in solid foams: Liquid holdup, multiphase pressure drop and radial dispersion. Chem. Eng. Sci. 2017, 168, 480–494. [Google Scholar] [CrossRef]
  29. Pietrzak, M.; Płaczek, M. Void fraction predictive methods in two-phase flow across a small diameter channel. Int. J. Multiph. Flow 2019, 121, 103115. [Google Scholar] [CrossRef]
  30. Gardenghi, A.R.; Filho, S.E.; Chagas, D.E.; Scagnolatto, G.; Oliveira, R.M.; Tibirica, C.B. Overview of Void Fraction Measurement Techniques, Database and Correlations for Two-Phase Flow in Small Diameter Channels. Fluids 2020, 5, 216. [Google Scholar] [CrossRef]
  31. Hu, H.; Zhu, Y.; Ding, G.; Sun, S. Effect of oil on two-phase pressure drop of refrigerant flow boiling inside circular tubes filled with metal foam. Int. J. Refrig. 2013, 36, 516–526. [Google Scholar] [CrossRef]
  32. Ji, X.; Xu, J. Experimental study on the two-phase pressure drop in copper foams. Heat Mass Transf. 2012, 48, 153–164. [Google Scholar] [CrossRef]
  33. Madani, B.; Tadrist, L.; Topin, F. Experimental analysis of upward flow boiling heat transfer in a channel provided with copper metallic foam. Appl. Therm. Eng. 2013, 52, 336–344. [Google Scholar] [CrossRef]
  34. Lu, W.; Zhao, C.Y. Numerical modeling of flow boiling heat transfer in horizontal metal foam tubes. Adv. Eng. Mater. 2009, 11, 832–836. [Google Scholar] [CrossRef]
  35. Dyga, R.; Płaczek, M. Influence of Hydrodynamic Conditions on the Type and Area of Occurrence of Gas–Liquid Flow Patterns in the Flow through Open–Cell Foams. Materials 2020, 13, 3254. [Google Scholar] [CrossRef] [PubMed]
  36. Busser, T.; Serres, M.; Philippe, R.; Vidal, V. Hydrodynamics of gas-liquid co-current flow through a thin sheet of highly porous open cell solid foam. Chem. Eng. Sci. 2020, 226, 115811. [Google Scholar] [CrossRef]
  37. Płaczek, M.; Dyga, R.; Witczak, S. Experimental Investigation of Void Fraction in Horizontal Air-water Flow Through FeCrAlY Foam. Procedia Eng. 2012, 42, 690–703. [Google Scholar] [CrossRef] [Green Version]
  38. Kamath, P.M.; Balaji, C.; Venkateshan, S.P. Experimental investigation of flow assisted mixed convection in high porosity foams in vertical channels. Int. J. Heat Mass Transf. 2011, 54, 5231–5241. [Google Scholar] [CrossRef]
  39. Dukhan, N.; Suleiman, A.S. Simulation of Entry-Region Flow in Open-Cell Metal Foam and Experimental Validation. Transp. Porous Media 2014, 101, 229–246. [Google Scholar] [CrossRef]
  40. Dyga, R.; Płaczek, M.; Witczak, S.; Czernek, K. Analysis of Flow Through the Entry Region of a Channel with Metal Foam Packing. In Practical Aspects of Chemical Engineering; Ochowiak, M., Woziwodzki, S., Doligalski, M., Mitkowski, P., Eds.; Lecture Notes on Multidisciplinary Industrial, Engineering; Springer: Cham, Switzerland, 2018; pp. 101–112. [Google Scholar]
  41. Diani, A.; Mancin, S.; Doretti, L.; Rossetto, L. Low-GWP refrigerants flow boiling heat transfer in a 5 PPI copper foam. Int. J. Multiph. Flow. 2015, 76, 111–121. [Google Scholar] [CrossRef]
  42. Larkins, R.P.; White, R.R. Two-phase co-current flow in packed beds. AIChE J. 1961, 7, 231–239. [Google Scholar] [CrossRef] [Green Version]
  43. Turpin, J.L.; Huntington, R.L. Prediction of pressure drop for two-phase two-component co-current flow in packed beds. AIChE J. 1967, 13, 1196–1202. [Google Scholar] [CrossRef] [Green Version]
  44. Weber, H.H. Untersuchungen über die Verweilzeitverteilung in Aufstromkolonnen. PhD Dissertation, TH Darmstadt, Darmstadt, Germany, 1961. [Google Scholar]
  45. Khan, A.; Khan, A.A.; Varma, Y.B.G. An analysis of phase holdup in concurrent gas liquid upflow through packed beds using (I) drift-flux model, and (II) slip ratio. Bioprocess Eng. 2000, 22, 165–170. [Google Scholar] [CrossRef]
  46. Saada, M. Fluid Mechanics of co-current two-phase flow in packed beds: Pressure drop and liquid hold-up studies. Chem. Ind. Genie Chem. 1972, 105, 1415–1421. [Google Scholar]
  47. Lockhart, R.C.; Martinelli, R.W. Proposed correlation of data for isothermal two-phase flow two-component flow in the pipes. Chem. Eng. Prog. 1949, 45, 39–48. [Google Scholar]
  48. Zuber, N.; Findlay, J.A. Average volumetric concentration in two-phase flow systems. J. Heat Trans. 1965, 87, 453–468. [Google Scholar] [CrossRef]
  49. Dix, G.E. Vapor Void Fraction for Forced Convection with Subcooled Boiling at Low Flow Rates. Ph.D. Thesis, University of California, Berkeley, Berkeley, CA, USA, 1971. [Google Scholar]
  50. Chisholm, D. A theoretical basis for the Lockhart-Martinelli correlation for two-phase flow. Int. J. Heat Mass Trans. 1967, 10, 1767–1778. [Google Scholar] [CrossRef]
  51. Punches, W.C. MAYU04: A Method To Evaluate Transient Thermal Hydraulic Conditions in Rod Bundles; General Electric Co.: Boston, MA, USA, 1977. [Google Scholar]
  52. Stomma, Z. Two-Phase Flows—Void Fraction Values Determination; Świerk, Report INR/18187/IXD/R/A; Institute of Nuclear Research: Warsaw, Poland, 1979. [Google Scholar]
  53. Rouhani, Z. AB Atomenergie, Studsvik: Nyköping, Sweden, 1986. In Steady State Void Fraction and Pressure Drop in Water Cooled Reactors.; AB Atomenergie, Studsvik: Nyköping, Sweden, 1986. [Google Scholar]
  54. Coddington, P.; Macian, R. A study of the performance of void fraction correlations used in the context of drift-flux two-phase flow models. Nucl. Eng. Des. 2002, 3, 199–216. [Google Scholar] [CrossRef]
  55. Kataoka, I.; Ishii, M. Drift flux model for large diameter pipe and new correlation for pool void fraction. Int. J. Heat Mass Transf. 1987, 30, 1927–1939. [Google Scholar]
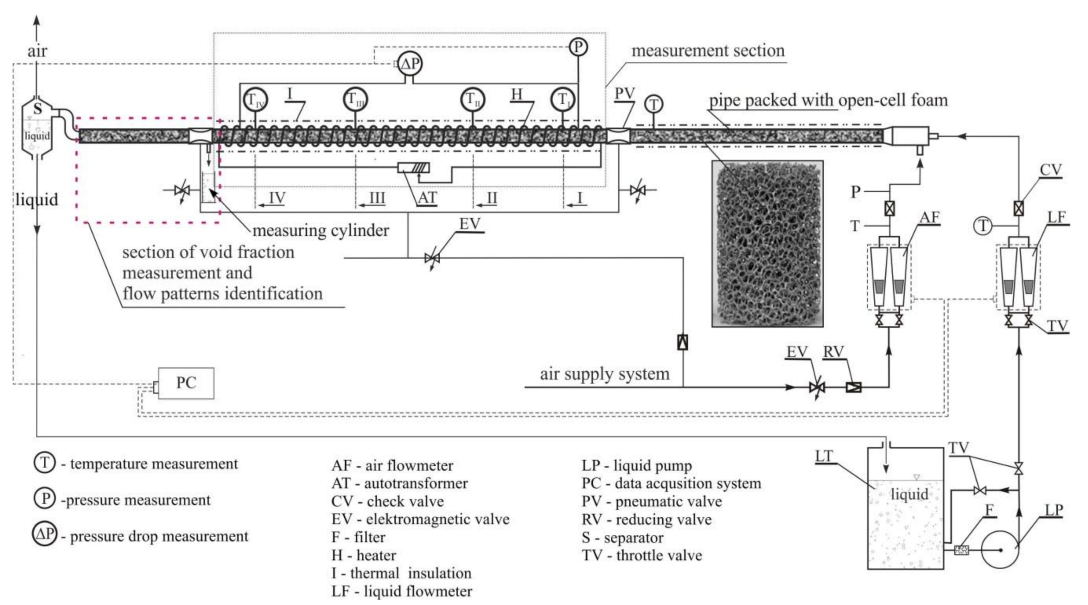
Figure 1. Experimental setup.
Energies 14 02645 g001
Figure 2. Microscopic detail of the cellular structure of aluminum alloy foams used in tests: (a,b) block and foam skeleton of AlSi7Mg—20 PPI, respectively, (c) AlSi7Mg—30 PPI, (d) Al 6101—40 PPI.
Energies 14 02645 g002
Figure 3. Microscopic view of the 30 PPI foam skeleton: (a) A—triangular fiber, B—oval fiber, (b) cell and pore of aluminum foam.
Energies 14 02645 g003
Figure 4. Gas–liquid flow patterns accompanying flow through metal foams: (a) stratified, (b) plug, (c) slug, (d) churn, (e) annular [35].
Energies 14 02645 g004
Figure 5. The measured gas void fraction as a function of superficial gas velocity in air–water flow through Al Si7Mg (30PPI) foam.
Energies 14 02645 g005
Figure 6. The measured gas void fraction as a function of superficial gas velocity for air–water and air–oil flow through Al 6101 (40PPI) foam.
Energies 14 02645 g006
Figure 7. Measured gas void fraction in air–oil and air–water mixture in the channel packed with 40PPI Al6101 foam.
Energies 14 02645 g007
Figure 8. Measured air void fraction in air–oil mixture versus superficial air velocity in channel packed with 20PPI AlSi7Mg foam.
Energies 14 02645 g008
Figure 9. Comparison of measured and inlet gas void fraction for air–oil mixture.
Energies 14 02645 g009
Figure 10. The gas void fraction in the air–oil flow calculated according to the methods developed for empty channels.
Energies 14 02645 g010
Figure 11. Comparison of experimental and calculated (acc. methods for porous media) gas void fraction values for air–oil two-phase flow (νso = 0.044 m/s)). Applied models: Hu et al. [31], Ji et al. [32], Khan et al. [45], Saada et al. [46], Turpin et al. [43].
Energies 14 02645 g011
Figure 12. Comparison of experimental and calculated (acc. to selected literature methods) gas void fraction values for air–water two-phase flow (metal foam packed channel). Applied models: Hu et al. [31], Ji et al. [32], Khan et al. [45], Saada et al. [46], Turpin et al. [43].
Energies 14 02645 g012
Figure 13. Correlation of drift velocity with gas–liquid flow conditions (stratified flow).
Energies 14 02645 g013
Figure 14. Comparison of measured and calculated according to new method values of air void fraction in air–water mixture flow through metal foam.
Energies 14 02645 g014
Figure 15. Comparison of the measured air void fractions with calculated in acc. to the Equation (6).
Energies 14 02645 g015
Table 1. Range of experimental data (multiphase mixture flow).
Mixture ComponentSuperficial VelocityMass Flux DensityReynolds NumberInlet Void Fraction
vsi, m/sgi, kg·(m2s)Rei, -ζi, -
air, a0.031–8.840
0.031–2.550 *
0.039–15.58
0.039–3.11 *
23–13,2440.207–0.999
0.319–0.998*
water, w0.006–0.1195.99–119.4930–45090.001–0.793
oil, o0.006–0.0665.40–56.713–2930.002–0.681
Physical properties of fluids at 20 °C
FluidDensity, ρi
kg/m3
Viscosity, μi
Pas
Surface tension, σi
N/m
air, a1.1641.82∙10−5-
water, w998.21.0∙10−30.070
oil (Velol-9Q), o859.42.7∙10−30.046
* applied to air–oil flow.
Table 2. Characteristics of open-cell aluminum foams.
Pore Density (PPI)/Type of FoamCell Diameter, dcPore Diameter, dpPorosity, εThermal Conductivity, kf
mm%W/(m·K)
20 PPI
(AlSi7Mg)
3.45∙10−31.09∙10−393.4150.4
30 PPI
(AlSi7Mg)
2.25∙10−30.71∙10−394.3150.4
40 PPI
(Al 6101)
2.38∙10−30.82∙10−392.9189.4
Table 3. Methods applied for the calculation of the void fraction in the gas–liquid flow through empty channels.
AuthorEquation
ν 2 P = ν a + ν w ; ν 2 P = ν a + ν o ; ζ G = ν G ν G + ν L , ; x = ρ G ν G ρ G ν G + ρ L ν L
Stomma [52] R G = 1 ζ G 2 x 2 2 l n 1 x 1 ζ G ζ G x ;   S = ν G ν L 1 ; R G x ζ G
Void fraction in upward flow in vertical pipe at low pressure
Lockhart—Martinelli [47] R G = 1 1 + 0.28 1 x x 0.64 ρ G ρ L 0.36 μ L μ G 0.07
Pipe diameter d = (1.49–25.8)⋅10−3m, Two-phase mixture: of Air–Water, air–Diesel Fuel Oil, Air–Kerosene, Air–Benzene, Air–S.A.E. 40 Oil, ReL = 1.1–39,000, ReG = 7–86,000
Chisholm [50] R G = 1 1 + S 1 x ρ G x ρ L    S = x ρ L ρ G + 1 x 0.5
Circular tube, annular flow, correlation based on an elementary separated flow
Zuber-Findlay [48] ν s G R G = 1.2 ν 2 P + ν d r ; C o = 1.2 ; ν d r = 1.53 ğ σ L ρ L ρ G ρ L 2 0.25
Relative movement of gas and liquid in pipe: slug, annular, churn-turbulent bubbly flow, RG > 0.8 annular flow Co = 1.
GE RAMP [51] R G = ν s G C o ν s G + ν s L + ν d r
C o = 1.13 for R G , e x p 0.65
or C o = 1 + 0.13 1 R G , e x p 1 0.65 for R G , e x p > 0.65
ν d r = 2.9 ğ σ L ρ L ρ G ρ L 2 0.25 for R G , e x p 0.65
ν d r = 2.9 ğ σ L ρ L ρ G ρ L 2 0.25 1 R G , e x p 1 0.65 for R G , e x p > 0.65
Numerical calculations were performed by the code MAYU04 that originally analyzes one-dimensional single channel hydraulic and heat transfer transients in rod bundles. Model was used to resolve the two-phase flow equations. The equations are valid for co-current and countercurrent flow. The model is suited for Boiling Water Reactor loss-of-coolant accident analysis where pressure transients are not very severe and subcooled voids are not very important.
Dix [49] C o = R G 1 + 1 R G 1 n n = ρ G ρ L 0.1    ν d r = 2.9 σ L ğ ρ L ρ G ρ L 2 0.25
Glass tube diameter d = 0.018 m
Rouhani [53] C o = 1 + 0.12 1 x ;   ν d r = C o 1 σ L ğ ρ L ρ G ρ L 2 0.25
Tube diameter: d = 21.9 mm, void fraction in flow boiling, measurement at 109 cm from the pipe, annular flow, heated perimeter O = 3.77 cm, q/A = 60–120 W/cm2 P = (19–50)·105 Pa, g ˙ L = 130–1450 kg/(m2s), steam quality x = 0–12%.
Table 4. Models for calculating the void fraction in the gas–liquid flow through porous media.
AuthorMethod
Khan et al. [45] R G = 1.708 ε 1 ε 0.125 R e L 0.055 R e G 0.323 μ L μ w 0.133    R e f = ν s f d s ρ f μ f ;
g ˙ L = 1 100 ;   g ˙ G = 0.02 6.5
Column diameter: dc = 0.091 m, column length Lc = 1.0 m, Co-current up-flow: Air–Water flow, Air–Monoethanol amine, Type of packing: Spheres, Raschig rings, Berl saddles, Cylinders dp = (3.0–12.5)⋅10−3 m, ε = (0.3–0.69)
Larkins and White [42]log10RL = −0.774 + 0.525(log10X) − 0.109(log10 X)2
X = Δ P L Δ P G 0.5  0.05 < X < 30
0.357 ε 0.52
Column diameter: dc = 50.8 mm and dc = 101.6 mm, Homogenous and heterogeneous flow regime, vertical downward flow: air–water, air–water (methyl-cellulose), air–water (0.033% soap), air–ethylene glycol, natural gas–kerosene, natural gas–lube oil, CO2-lube oil. Type of packing: Raschig rings 9.52⋅10−3 m and 3.17⋅10−3 m; Cylinders 3.17⋅10−3 m; Glass beads 3⋅10−3 m; νsG = 0–8.05 m/s, νsL = 0–0.265 m/s, ReG = 0–6200, ReL = 0–3405.
Turpin and Huntington [43] R L = 0.035 + 0.182 g ˙ L g ˙ G 0.24
g ˙ L g ˙ G 0.24 = 1 6
Column diameter: dc = 5⋅10−2 m, dc = 10⋅10−2 m, dc = 15⋅10−2 m, Air–Water flow (Bubble flow, Pulse and Spray flow). Type of packing: tubular alumina particles: 7.62⋅10−3 m and 8.23⋅10−3 m.
Saada [46] R L = K R e L R e G a , R e G * = 0.44 R e L 2 d p d c 0.38
K = 0.48; a = 1.25 for ReG < R e G *
K = 0.32; a = 0.07 for ReG > R e G *
Column diameter: dc = 4.52⋅10−2 m, Lc = 0.40 m, Co-current Air–Water upward flow, (Bubbly, Churn turbulent flow regimes). Type of packing: Glass ballotini spheres (dp = 5.14⋅10−4 m, dp = 9.74⋅10−4 m, dp = 20.64⋅10−4 m); ε = 34.6%
Table 5. Statistical evaluation of gas void fraction calculation methods.
Type of Foam20 PPI (AlSi7Mg)30 PPI (AlSi7Mg)40 PPI (Al 6101)
ModelRMSδ (ε)RMSδ (ε)RMSδ (ε)
Lockhart and Martinelli [47]1.011.010.960.921.111.24
Zuber and Findlay [48]0.460.200.450.190.550.30
Dix [49]1.291.671.241.531.422.04
Chisholm [50]1.361.861.301.711.502.27
GE RAMP [51]0.360.130.360.130.420.17
Stomma [52]1.201.441.141.301.321.74
Rouhani [53]1.211.471.161.351.351.84
Larkins and White [42]1.171.371.101.221.261.60
Turpin and Huntington [43]0.770.600.700.490.840.69
Weber (2 mm) [44]0.850.720.850.720.840.71
Weber (5 mm) [44]0.860.730.860.730.850.72
Table 6. Drift velocity νdr in flow through metal foam.
Type of FlowEquation
Stratified flow ν d r = 0.14 ν s L ν 2 P 0.75 R e G 0.85 σ L ğ ρ L ρ G 0.5 d h 1 η L η w ρ w ρ L 2 0.33
Other type of flows (plug, slug, churn, annular) ν d r = 0.01 ν s L ν 2 P 1.1 R e G 1.1 σ L ğ ρ L ρ G 0.5 d h 1 η L η w ρ w ρ L 2 0.33
Publisher’s Note: MDPI stays neutral with regard to jurisdictional claims in published maps and institutional affiliations.