Article

Rapid Model-Free State of Health Estimation for End-of-First-Life Electric Vehicle Batteries Using Impedance Spectroscopy

by
Alireza Rastegarpanah
1,2,*,†,
Jamie Hathaway
1,† and
Rustam Stolkin
1,2
1
Department of Metallurgy & Materials Science, University of Birmingham, Birmingham B15 2TT, UK
2
The Faraday Institution, Quad One, Harwell Science and Innovation Campus, Didcot OX11 0DG, UK
*
Author to whom correspondence should be addressed.
These authors contributed equally to this work.
Energies 2021, 14(9), 2597; https://doi.org/10.3390/en14092597
Submission received: 1 April 2021 / Revised: 27 April 2021 / Accepted: 28 April 2021 / Published: 1 May 2021

Abstract

:
The continually expanding number of electric vehicles in circulation presents challenges in terms of end-of-life disposal, driving interest in the reuse of batteries for second-life applications. A key aspect of battery reuse is the quantification of the relative battery condition or state of health (SoH), to inform the subsequent battery application and to match batteries of similar capacity. Impedance spectroscopy has demonstrated potential for estimation of state of health, however, there is difficulty in interpreting results to estimate state of health reliably. This study proposes a model-free, convolutional-neural-network-based estimation scheme for the state of health of high-power lithium-ion batteries based on a dataset of impedance spectroscopy measurements from 13 end-of-first-life Nissan Leaf 2011 battery modules. As a baseline, this is compared with our previous approach, where parameters from a Randles equivalent circuit model (ECM) with and without dataset-specific adaptations to the ECM were extracted from the dataset to train a deep neural network refined using Bayesian hyperparameter optimisation. It is demonstrated that for a small dataset of 128 samples, the proposed method achieves good discrimination of high and low state of health batteries and superior prediction accuracy to the model-based approach by RMS error (1.974 SoH%) and peak error (4.935 SoH%) metrics without dataset-specific model adaptations to improve fit quality. This is accomplished while maintaining the competitive performance of the previous model-based approach when compared with previously proposed SoH estimation schemes.

1. Introduction

With the electric vehicle (EV) market projected to grow to 140–245 million vehicles by 2030 [1], the demands presented by an expanding market for battery and plug-in hybrid electric vehicles also presents a considerable materials challenge, both for the acquisition of high-value materials necessary for current lithium-ion battery technology and the disposal of such batteries. In the context of increasing efforts to transition to low-carbon energy sources, this has garnered interest in both recycling [2,3,4] and employment of EV batteries in second-life applications as means of supplementing renewable energy sources in both grid and domestic energy storage applications [4,5]. The robust estimation of the state of health (SoH) for batteries at the end of their first useful life has proven critical for important facets of battery reuse in requirements to properly match and assess the condition of cells to correctly inform their second-life application. Proper matching of batteries in similar conditions, for example, has been documented as a matter of importance in preventing uneven wear on second-life battery systems to maximise their useful lifetime and is already a crucial aspect of quality control for fresh batteries [6]. The most common definition of battery state of health is based on the remaining capacity of a battery system relative to its start-of-life condition. Currently, this is determined by discharge testing, which takes several hours, making it a time consuming and, hence, costly process [7].
Electrochemical impedance spectroscopy (EIS) is a nondestructive characterisation technique that yields insight into the physical processes occurring within a battery system through exposing changes in the battery impedance over a range of probing voltage or current frequencies. For SoH estimation, it presents valuable advantages in the capability for much greater measurement speed over a full discharge test and the ability to characterise and, to a limited degree, quantify the extent of battery degradation with respect to the known battery degradation modes [8,9,10,11]. Traditionally, model-based approaches are employed to characterise the behaviour of the battery system, which represents a primary limitation of EIS. For most commercial batteries, detailed underlying knowledge of the system under investigation is often infeasible to obtain due to the sensitive nature of the battery internals and wide range of battery designs and chemistries, which makes detailed, electrochemical, model-based interpretations—such as those by [12,13]—inappropriate.

1.1. EIS and Model-Based State of Health Estimation

Due to the dependence of EIS on a number of measurement conditions, primarily the cell’s state of charge and temperature, in addition to the physical degradation processes occurring within the cell that affect the SoH, there is often difficulty interpreting the results reliably [14,15,16]. Comparison of works such as [17,18,19] demonstrates how parameters associated with the equivalent circuit model (ECM) interpretation of EIS evolve with cell degradation to be nonuniform between different cells and cell chemistries, while many of the mentioned studies have the limitation that the dependencies on key variables such as state of charge and temperature have been studied for only a few key parameters. Without the aid of models developed for specific batteries, it is, therefore, necessary to account for these dependencies for reliable SoH estimation. Traditionally, consideration of temperature is often eliminated by ensuring all measurements are conducted in a climate-controlled environment [18,20]. Eliminating the state of charge dependence, while possible, also presents difficulties [21]. Moreover, even after taking into account these dependencies, most works that focus on estimation of SoH using only a few select parameters—such as the battery internal resistance or charge transfer resistance—remain limited in accuracy [18,22].
Beyond impedance spectroscopy, examples of model-based approaches to SoH estimation include Kalman filtering [23,24] or, more recently, generalised approaches using a fuzzy c-regression model incorporating particle swarm optimisation [25], which has seen applied in SoH estimation for a NiMH battery [26]. Further, filtering-based methods include [27,28] for decoupled estimations of SoC and SoH, employing a recursive least-squares-based SoH estimator with online-identified ECM and with SoC estimation using a Kalman filter and H-infinity filter, respectively. Although these methods are demonstrated to be robust to different battery chemistries, there is the issue of convergence to accurate capacity estimates over short timescales, making it unsuitable for rapid end-of-life screening.
Recent related works have emphasised a combination of data-driven approaches such as neural networks in combination with a model-based approach for estimation of SoH as a means of addressing the limitations of the latter while complimenting the former. For example, in [29], an ECM parameter-based approach was proposed using an extreme learning machine (ELM) to monitor cell degradation over time through the evolution of the internal resistance and state of charge. A related example focusing on the end-of-life screening of batteries was proposed by [30] based on measurements of battery parameters by hybrid pulse power characterisation (HPPC), which was shown to be effective at estimating the state of health with low error with the use of a small dataset. In our previous work [31], a similar concept was explored using a small dataset based on EIS measurements with ECM-based parameter extraction; we demonstrated that this method presented large improvements in measurement times over conventional SoH measurement methods while retaining low estimation error. However, the previous work does not address the limitation of the lack of temperature dependence and relies on a well-chosen ECM for best results.
Incremental capacity analysis (ICA) and differential voltage analysis (DVA) have also been explored for data-driven SoH estimation. Similar to EIS, this family of methods represents a nondestructive characterisation technique, with the capability to expose measurable effects of battery ageing with respect to individual ageing mechanisms [9]. This capability has been explored with data-driven ICA methods such as [32], where a Lorentzian voltage–current model was formulated to extract parameters directly correlated with SoH, and [33], similarly with a polynomial-type model. Crucially, the SoH models constructed from one cell may be applied to other cells while retaining low (<1.5%) mean absolute error. However, the method of parameter extraction suffers from a similar issue to EIS in that the modelling parameters must be chosen with care for good results.

1.2. Model-Free State of Health Estimation

Considering the aforementioned works, relying on a priori knowledge of battery behaviour or an explicit battery model, several model-free, data-driven approaches have been proposed for estimation of battery state of charge and, more recently, state of health. An area of emphasis that can be identified in much SoH literature is battery prognostics and time series forecasting of the SoH based on neural network approaches as part of efforts to develop more robust battery management systems [34,35], which has been demonstrated to be a high-accuracy technique. Examples of the time series forecasting approach include works such as [36,37], focusing on online state of charge prediction, and [38,39,40] for predictive SoH models, with a focus on estimating the remaining useful life (RUL) of the battery system. However, in the context of offline battery screening, time series forecasting approaches are limited in the fact that predictions are made in the context of the history of the long-term battery degradation, which makes it inapplicable to end-of-life estimation of the current battery SoH.
Related to the time series forecasting approach are works using features extracted from fixed time intervals of battery terminal voltage, current, or partial capacity measurements, from which the battery state can be derived directly. In [41], this approach is employed based on a multilayer perceptron (ANN, or artificial neural network) using partial driving cycle data with high estimation accuracy, yet it suffers from high computational complexity and the requirement for long measurement time intervals. A similar approach based on an ANN classifier is proposed in [22], demonstrating considerably reduced measurement intervals of 60 s, albeit with limited precision due to batteries being sorted into discrete SoH bands.
Convolutional neural networks (CNNs) are mainly employed in the area of image recognition, classification, and time series forecasting due to the structured nature of such data and excel at these tasks due to the ability to extract a hierarchical set of features from which the class or state of the system being modelled may be inferred. Studies such as [42,43] demonstrate that it is feasible to train highly accurate CNN regression models for the SoH with a greatly reduced dataset size with the use of transfer learning and presents strong advantages in removing the requirement for an explicit model of the battery behaviour. In [44], a CNN-based approach to cell screening during the manufacturing process was applied, based on consideration of a combination of capacity and the dynamic cell behaviour, demonstrating a robust capability to match cells with similar properties.
Beyond neural-network-based methods, [45] studied the application of partial discharge current measurements for SoH estimation, presenting considerable improvements in speed over traditional discharge testing methods. This method has the demonstrated benefit of being designed to operate on parallel battery arrangements in contrast to the emphasis on single-cell SoH estimation in literature. Nevertheless, the requirement for at least a partial discharge of the battery limits this approach in speed, with results also being affected by the discharge rate.
With limitations of related approaches in mind, the demonstrated capabilities and limitations of model-based interpretations of EIS may motivate a model-free EIS-based approach to SoH estimation. Such methods have not been explored in great detail in a data-driven context, although previous studies have demonstrated that disparities between specific regions of measured and reference impedance spectra are useful for distinguishing healthy and defective cells in a quality control context [6]. Similarly, the use of a single-point impedance measurement employed in [46] for 4S arrangements of cells was investigated for rapid fault diagnosis under low-temperature cycling. More recently, ref. [47] presented a geometric interpretation of EIS based on a variable fractional-order model of the capacitive battery behaviour, circumventing the need for a traditional ECM-based interpretation of EIS; however, there are still difficulties in quantitatively relating this to the state of health.
In the context of these methods, this work presents a model-free neural-network-based approach for estimation of the state of health (SoH) from impedance measurements of high-power lithium-ion batteries. We propose a convolutional neural network (CNN)-based approach, focusing on model-free extraction of features directly from the impedance data, overcoming the requirement for physical interpretation of the battery impedance to extract learnable parameters. We compare this method with our previous work based on an artificial neural network (ANN), which focuses on maintaining lower computational complexity, and is based on the extraction of parameters from the impedance dataset using the equivalent circuit model (ECM) approach. Given the emphasis on the constraint of a small dataset in our previous work, a key expected contribution is to predict the SoH with high accuracy (RMS error <3%) with the constraint of a small battery dataset of 128 samples.

2. Materials and Methods

In this section, the principle of model-free SoH estimation using impedance spectroscopy is introduced based on a convolutional neural network architecture. The scheme of data preprocessing and network evaluation is subsequently described, before bringing the proposed scheme into context with a prior model-based SoH estimation scheme using equivalent-circuit-model-based parameter extraction. Finally, the collected dataset employed to generate results is introduced, employing measurements from electric vehicle batteries representative of the end-of-first-life condition.

2.1. Convolutional Neural Network

The main disadvantage of an explicit model-based approach is the dependency on a nonlinear fitting process to extract suitable parameters, which requires robust estimates of the initial fitting parameters and a well-chosen model for best performance. To address these limitations, a CNN-based regression model is proposed to learn a hierarchy of features directly from the impedance measurements for estimating the state of health. Although CNNs have traditionally been applied for the problem of image classification, CNNs are also famous for their applicability to complex time series problems. In principle, we can consider EIS measurements to be structured in a multifeatured 1-dimensional arrangement similar to a time series. A CNN-based approach hence forms a natural choice for model-free SoH estimation; although deep ANNs are capable of handling the same problem, they do so with lower parameter efficiency and thus, higher computational complexity and a greater tendency to overfit. The advantages of CNNs are furthermore established in related works such as [42].
Each set of impedance measurements is mapped to a corresponding battery state of health directly and forms the input to the CNN model as a 29 × 2 matrix, with the two channels being the real and imaginary components of the battery impedance. It is therefore assumed that the battery impedance is sampled at the same set of frequencies for all measurements. However, in principle, the response of a battery to impedance spectroscopy is influenced by a combination of factors, most notably, temperature and state of charge (SoC) as well as SoH. These factors are convoluted and difficult to quantify, which justifies previous investigations into the influence of SoC and temperature on measurements of specific battery properties, such as equivalent series resistance or charge transfer resistance. To incorporate the effects of SoC into the SoH estimation, the SoC is included as an additional model input, which is concatenated with the final feature vector from the convolutional layers.
To generate the CNN model, a manual hyperparameter search was conducted to define the appropriate number of filters, filter and pooling window sizes, convolution layers, and the number of neurons in the final dense hidden layer. The proposed CNN model consists of two convolutional layers with a kernel size of 3, each followed by a max-pooling operation of window size 2, and two fully connected layers, each preceded by a dropout layer. The described model structure is presented in Figure 1. For the kernel and pooling window size, 3 × 1 and 2 × 1 are typical choices; larger kernels offer a greater receptive field—that is, the maximum feature size represented in a given filter—at the expense of computational complexity. Max-pooling subsamples the feature maps and increases the effective receptive field, however, it represents a trade-off that is unnecessary considering the small size of the input matrix, hence, a max-pooling window size of 2 is appropriate.
Development and training of the neural network model was performed in Python using the TensorFlow 2 machine learning library [48] on an NVIDIA GTX 1060 6 GB GPU. Training was conducted for 300 epochs using the Adam [49] optimiser with an initial learning rate of 0.001 and batch size of 32. To prevent overfitting with the small dataset considered, the probability of dropout in all dropout layers was chosen to be 0.3.

2.2. Preprocessing and Evaluation

To test the accuracy of the neural network model, the dataset was partitioned according to a K-fold cross-validation scheme [50,51]. Samples from the full dataset are randomly chosen to fill K equal-size folds. A number of folds, typically K 1 , may then be reserved for training the network, while the remainder of the folds may be held-out as validation and testing data to evaluate the model. For this study, a value of K = 6 was chosen as a balance between validation accuracy and training performance as with our previous work [31]. For network evaluation and comparison, the metrics of RMS and mean absolute error, defined as
RMSE = 1 P p = 0 P Y p y p 2 ,
MAE = 1 P p = 0 P Y p y p ,
were employed along with peak error for each SoH value p with prediction y p and ground truth value Y p over all predictions P.
To improve the training performance owing to the disparate numeric scales of the input parameters and desired outputs, normalisation to zero mean and unity standard deviation was carried out for each input variable X in the dataset as
X n o r m = X X ¯ t r a i n σ X , t r a i n ,
with X ¯ t r a i n , σ X , t r a i n as the mean and standard deviation of X, respectively, calculated from the training folds only. Based on the measurements of discharge capacity q d , the learnable target SoH values were calculated for each battery arrangement as the ratio to the manufacturer-rated (nominal) capacity q n :
SoH = q d q n ,
using the manufacturer quoted value of q n = 65 Ah . The SoH target values were finally normalised as
SoH n o r m = SoH SoH t r a i n , m i n SoH t r a i n , m a x SoH t r a i n , m i n ,
where SoH t r a i n , m i n , SoH t r a i n , m a x are the minimum and maximum dataset SoH value, respectively. These normalisation statistics were computed from the training folds only, and the same normalisation was applied to the training and test folds independently.

2.3. Baseline Model

To establish a test case and a benchmark for comparison of the model-free approach with SoH estimation with a comparable model-based method on the same dataset, an ANN-based approach from our previous work is employed as a baseline, as shown in Figure 2. This approach consists of a multi-hidden-layer feed-forward neural network, where the network structure is obtained through a hyperparameter search using Bayesian optimisation of the RMS validation error in (1). The ELU activation function was used, with an initial learning rate of 0.01, an L2 regularisation penalty of 0.00089, and a dropout probability of 0.136. For training, the configuration used for the CNN was preserved, however, in addition to the limit of 300 epochs, early-stopping was employed to halt training if the RMS estimation error failed to reach a new minimum after 30 consecutive epochs.
In contrast to the CNN, the input to the baseline model is formed from parameters extracted from the raw impedance data using an equivalent circuit modelling (ECM) approach. This approach aims to extract a set of physically meaningful parameters that are related to the electrochemical phenomena occurring within the cell. In this case, the model employs a modification of the Randles circuit, where the double-layer capacitance C d l is represented as a constant phase element, and an inductor L is added to model the inductance of the connecting cables and current collectors observed at high frequencies. An idealised schematic of a spectrum conforming to the Randles ECM is shown in Figure 3. Using the Randles cell for ECM-based parameter extraction fits this problem well due to the well-documented relationship between the equivalent series resistance R e , charge transfer resistance R c t , Warburg resistance R W , and the SoH. Extraction of parameters from the raw spectra is achieved by nonlinear fitting using the Levenberg–Marquardt algorithm.

2.4. Dataset Description

For this work, a library of impedance spectroscopy measurements paired with their corresponding capacities measured by discharge testing is considered, as used in our previous study in [31]. The dataset, openly accessible in [52], contains measurements collected from a series of 13 battery modules from an end-of-life Nissan Leaf 2011 battery pack to obtain a realistic representation of the end-of-life battery condition. Each module encapsulates four cells in a 2P–2S arrangement, with each 2P arrangement of cells accessible through a three-terminal (labelled black, white, and red) configuration. The dataset contains a total of 128 spectra measured at state-of-charge intervals of 20% from 20–80% SoC, from batteries with a combined capacity range of 50–55 Ah (77–85% SoH). Spectra were obtained by EIS across the black and white terminals and red and white terminals separately and carried out with the batteries at room temperature (25 °C), with six measurements per decade over a logarithmically spaced sampling frequency range of 1 KHz–15 mHz.

3. Results and Discussion

3.1. Convolutional Neural Network

The results of 6-fold cross-validation trials of the convolutional network model are presented in Table 1. Results show that the model achieves an average RMS prediction error of 1.974 for the SoH (in SoH percentage) and a peak error of 4.935 SoH%. This suggests the model’s capability to estimate the battery state of health with good accuracy directly from battery impedance measurements without the requirement for manual parameter extraction, as these dependencies are learned directly from the data. However, as both SoH and SoC are expected to strongly influence measurements of the battery impedance, it is clear that the SoC is a significant factor in the estimation of the SoH; without knowledge of the SoC, the model must learn to deconvolute the contributions of SoC and SoH solely from the measured spectrum, which introduces additional uncertainty. For a similar test case where the model is not given access to measurements of the state of charge, this is demonstrated as the model’s RMS error increases to ∼2.1% over 6-fold cross-validation. On the hardware used, the average training time was evaluated to be 6.0 ± 0.2 s with an average inference time 0.38 ± 0.02 s. The high training times suggests high computational complexity of the CNN model, which represents a principal disadvantage of the CNN-based approach. Although this is the case, the training times are significantly reduced compared to a comparable CNN-based approach with ensemble learning (143.396 s) [43] used for SoH monitoring in the online application. Moreover, the use of more powerful hardware in the latter study suggests a more favourable comparison by this metric.

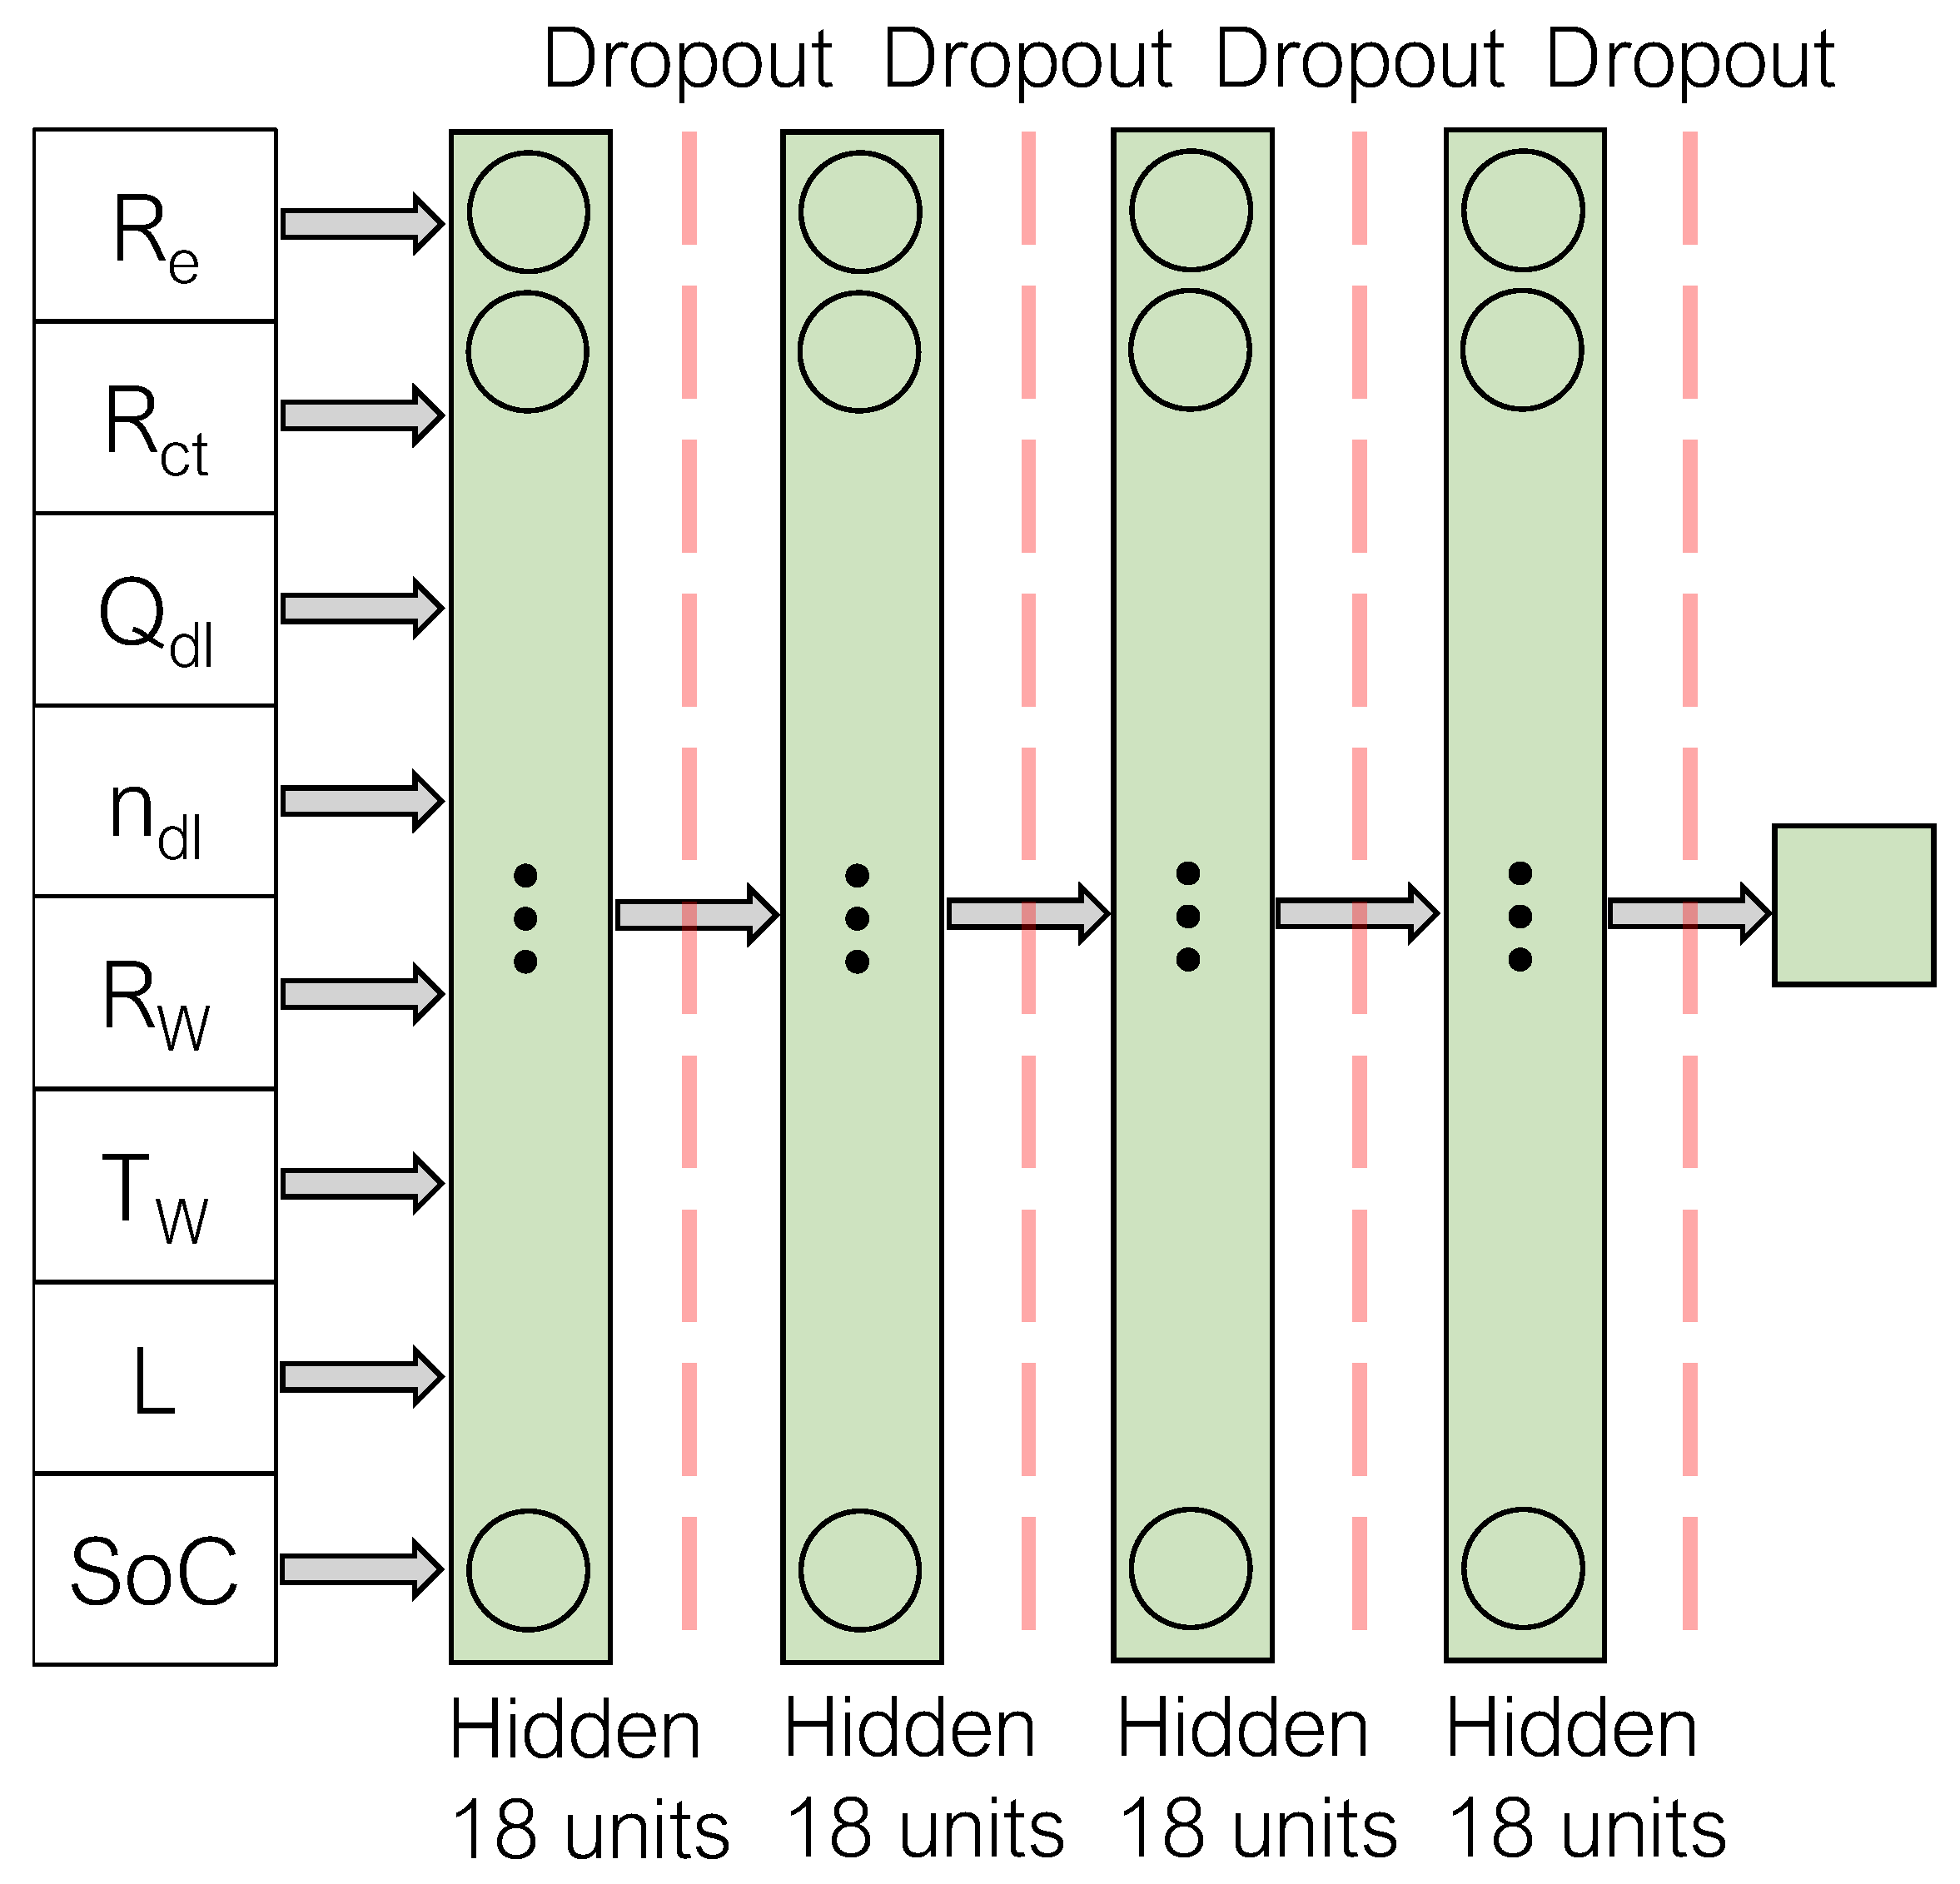
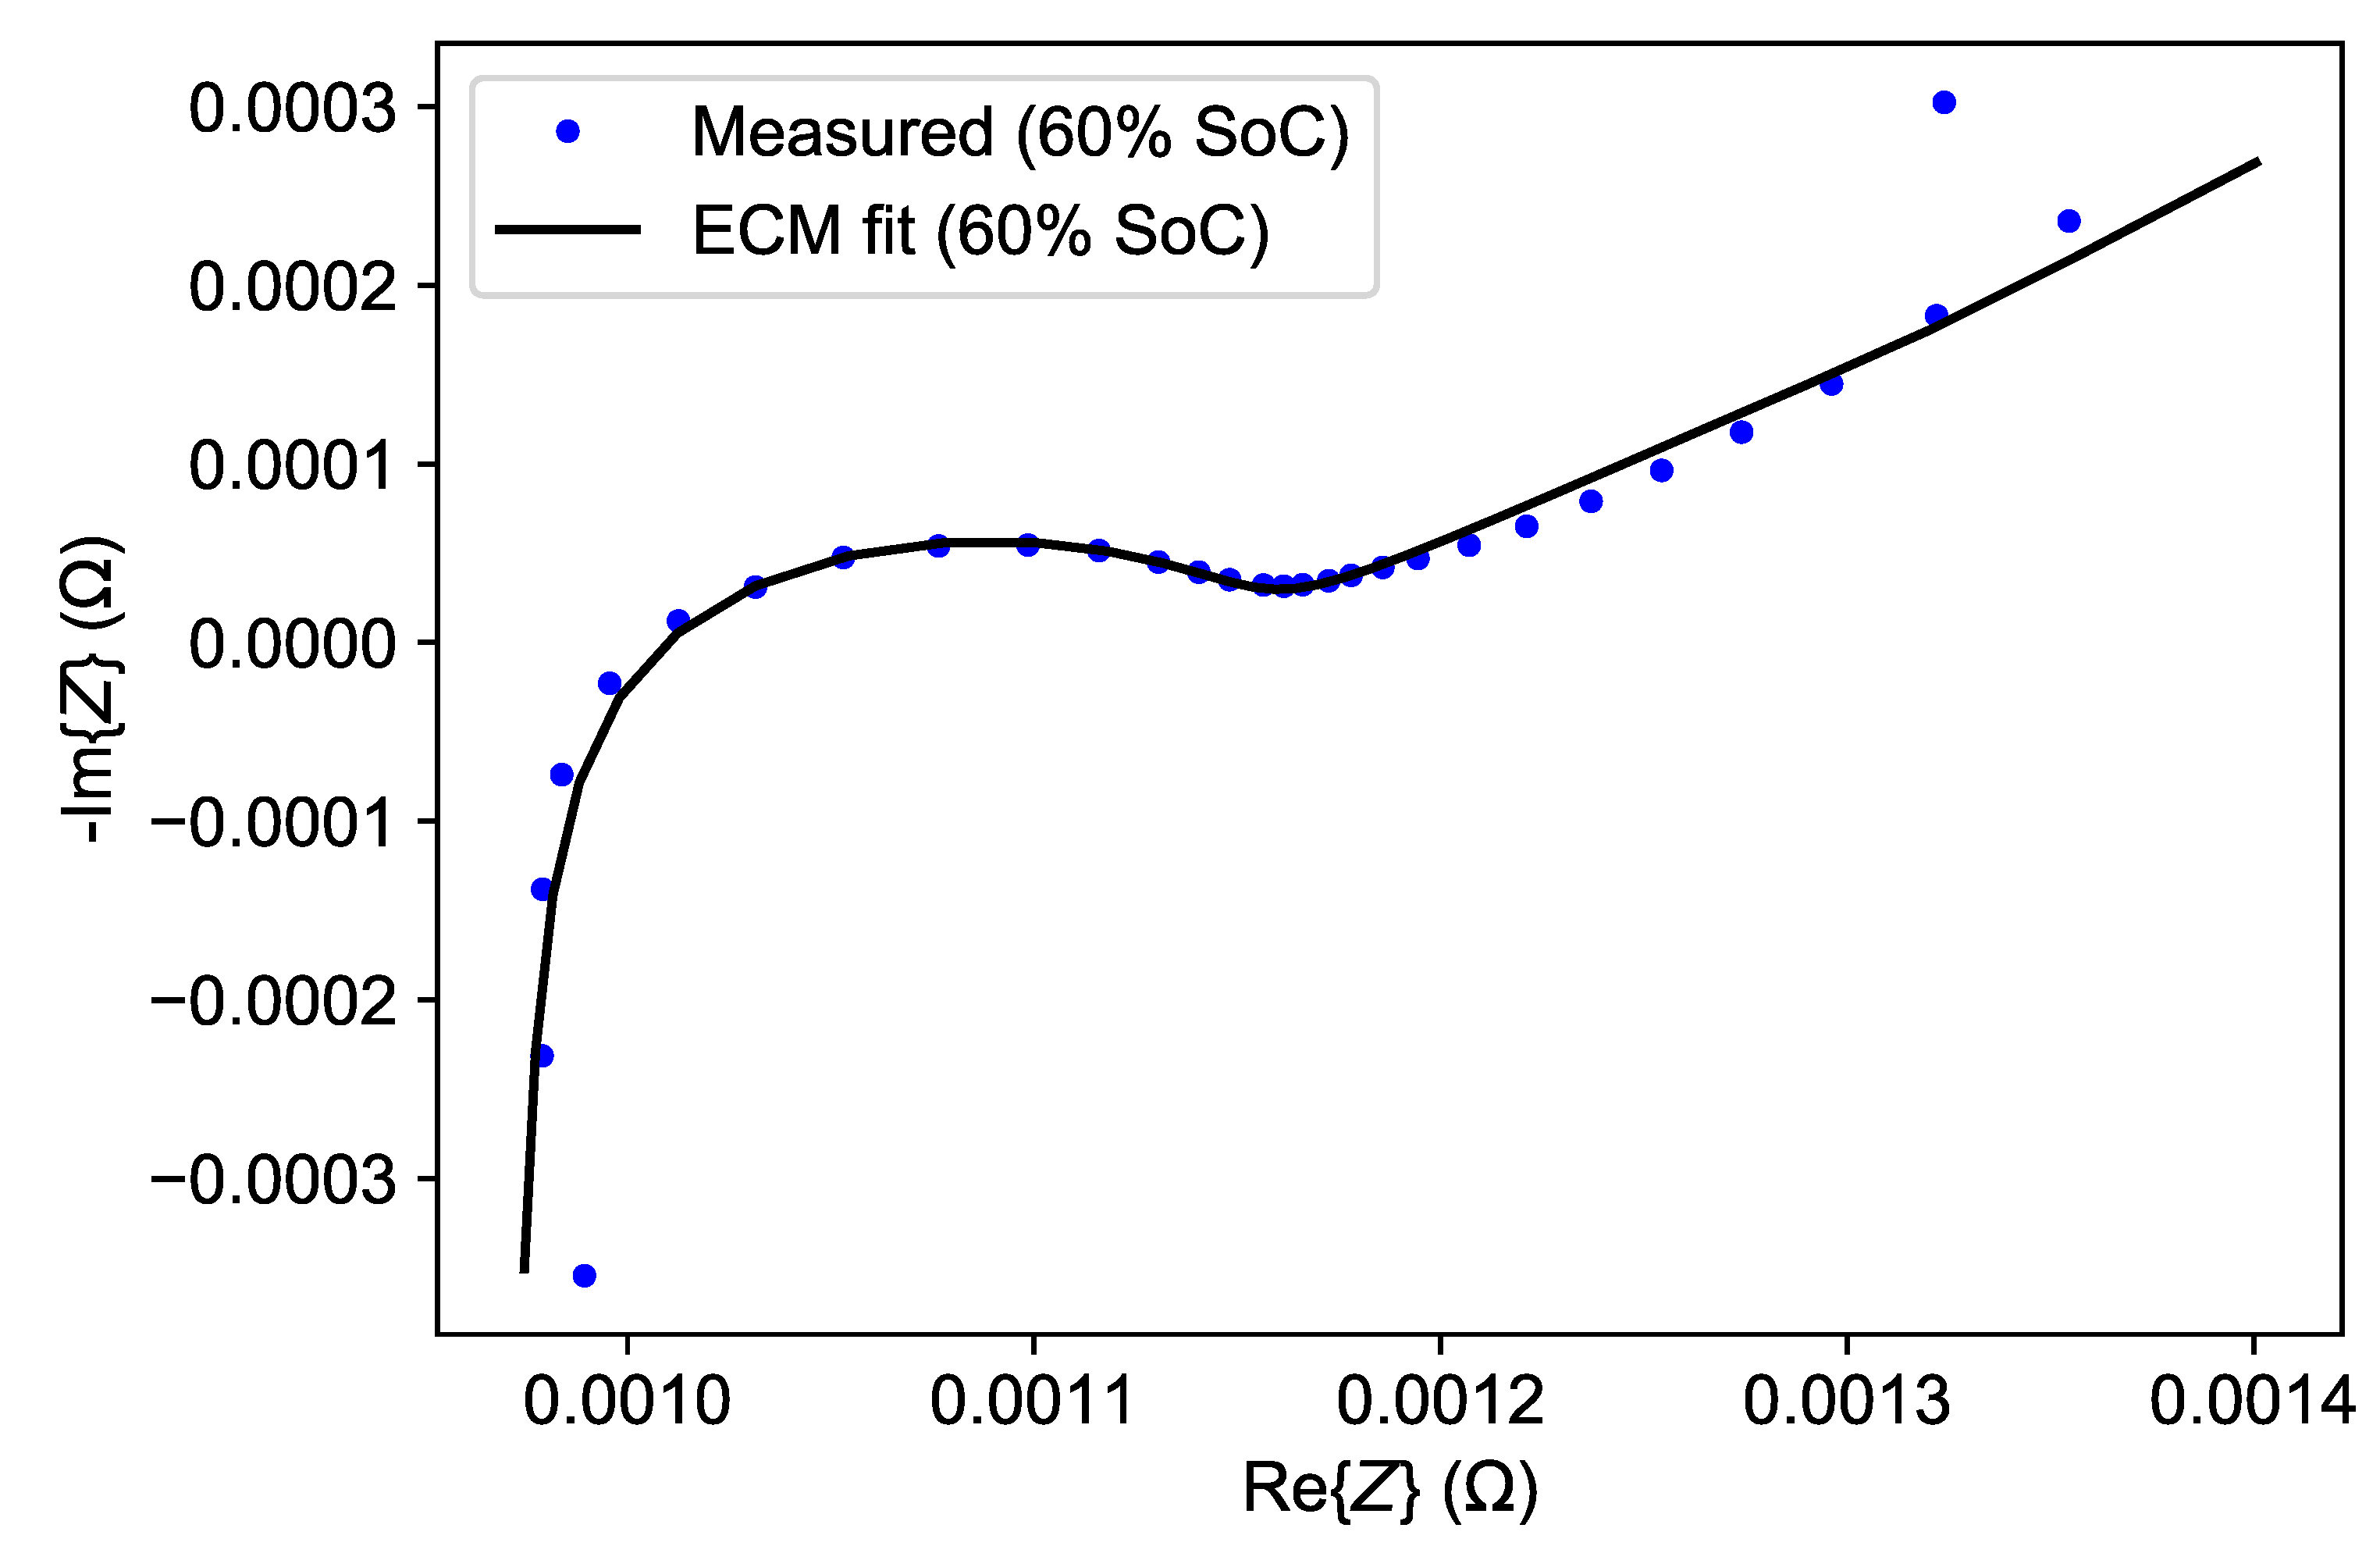
3.2. ECM-Based Artificial Neural Network

The results of parameter extraction using nonlinear fitting to the described modification of the circuit in Figure 3 is shown in Figure 4. This is presented for an impedance spectrum obtained at 60% SoC over the red and white terminals of module 1 of 13, producing the set of parameter values summarised in Table 2. Deviations from ideality are observed beyond the capacitive region of the spectrum, most notably at the high- and low-frequency extremes of the spectrum, associated with the inductive behaviour of the measurement cables and solid-state diffusion of ions in the electrodes (Warburg impedance), respectively. Improvement of fit quality could be achieved through refinement of the chosen ECM, however, this is balanced by physical intuition and prior knowledge. While a good fit may be obtained through the inclusion of an arbitrary number of ECM elements, this may have little to no correspondence with the underlying electrochemical processes occurring within the battery. Notwithstanding these considerations, a common phenomenon observed as the battery ages is the appearance of a second “film” capacitive loop at the mid- to high-frequency range attributed to the formation of the solid electrolyte interphase. Under certain conditions, particularly at a low state of charge [21], the film and double-layer capacitive regions are unresolved and difficult to distinguish, reducing the accuracy of the extracted parameter estimates. These factors represent a limitation of the ANN-based SoH estimation method with model-based input.
To evaluate the influence of fitting error on the accuracy of the model-based SoH estimation, cross-validation results from the model trained using ECM parameters extracted using an unmodified Randles circuit are presented. This ECM describes the impedance data less accurately, which demonstrates how the model predictions are influenced by a suboptimal choice of ECM with additional error on the extracted parameters. Using the 6-fold cross-validation scheme, the RMS, mean absolute, and peak prediction errors for the baseline model were generated as a benchmark to compare with the performance of the CNN-based model-free approach. The results of cross-validation are presented in Table 3, showing for the optimised ANN an average RMS SoH estimation error of 1.790 SoH%. However, removal of the modifications to the Randles circuit leads to an increase of RMS error by 0.335 SoH% and a significant reduction in model accuracy, with a corresponding increase of 0.48 SoH% to peak prediction error and reductions in model consistency over trials by all evaluation metrics.

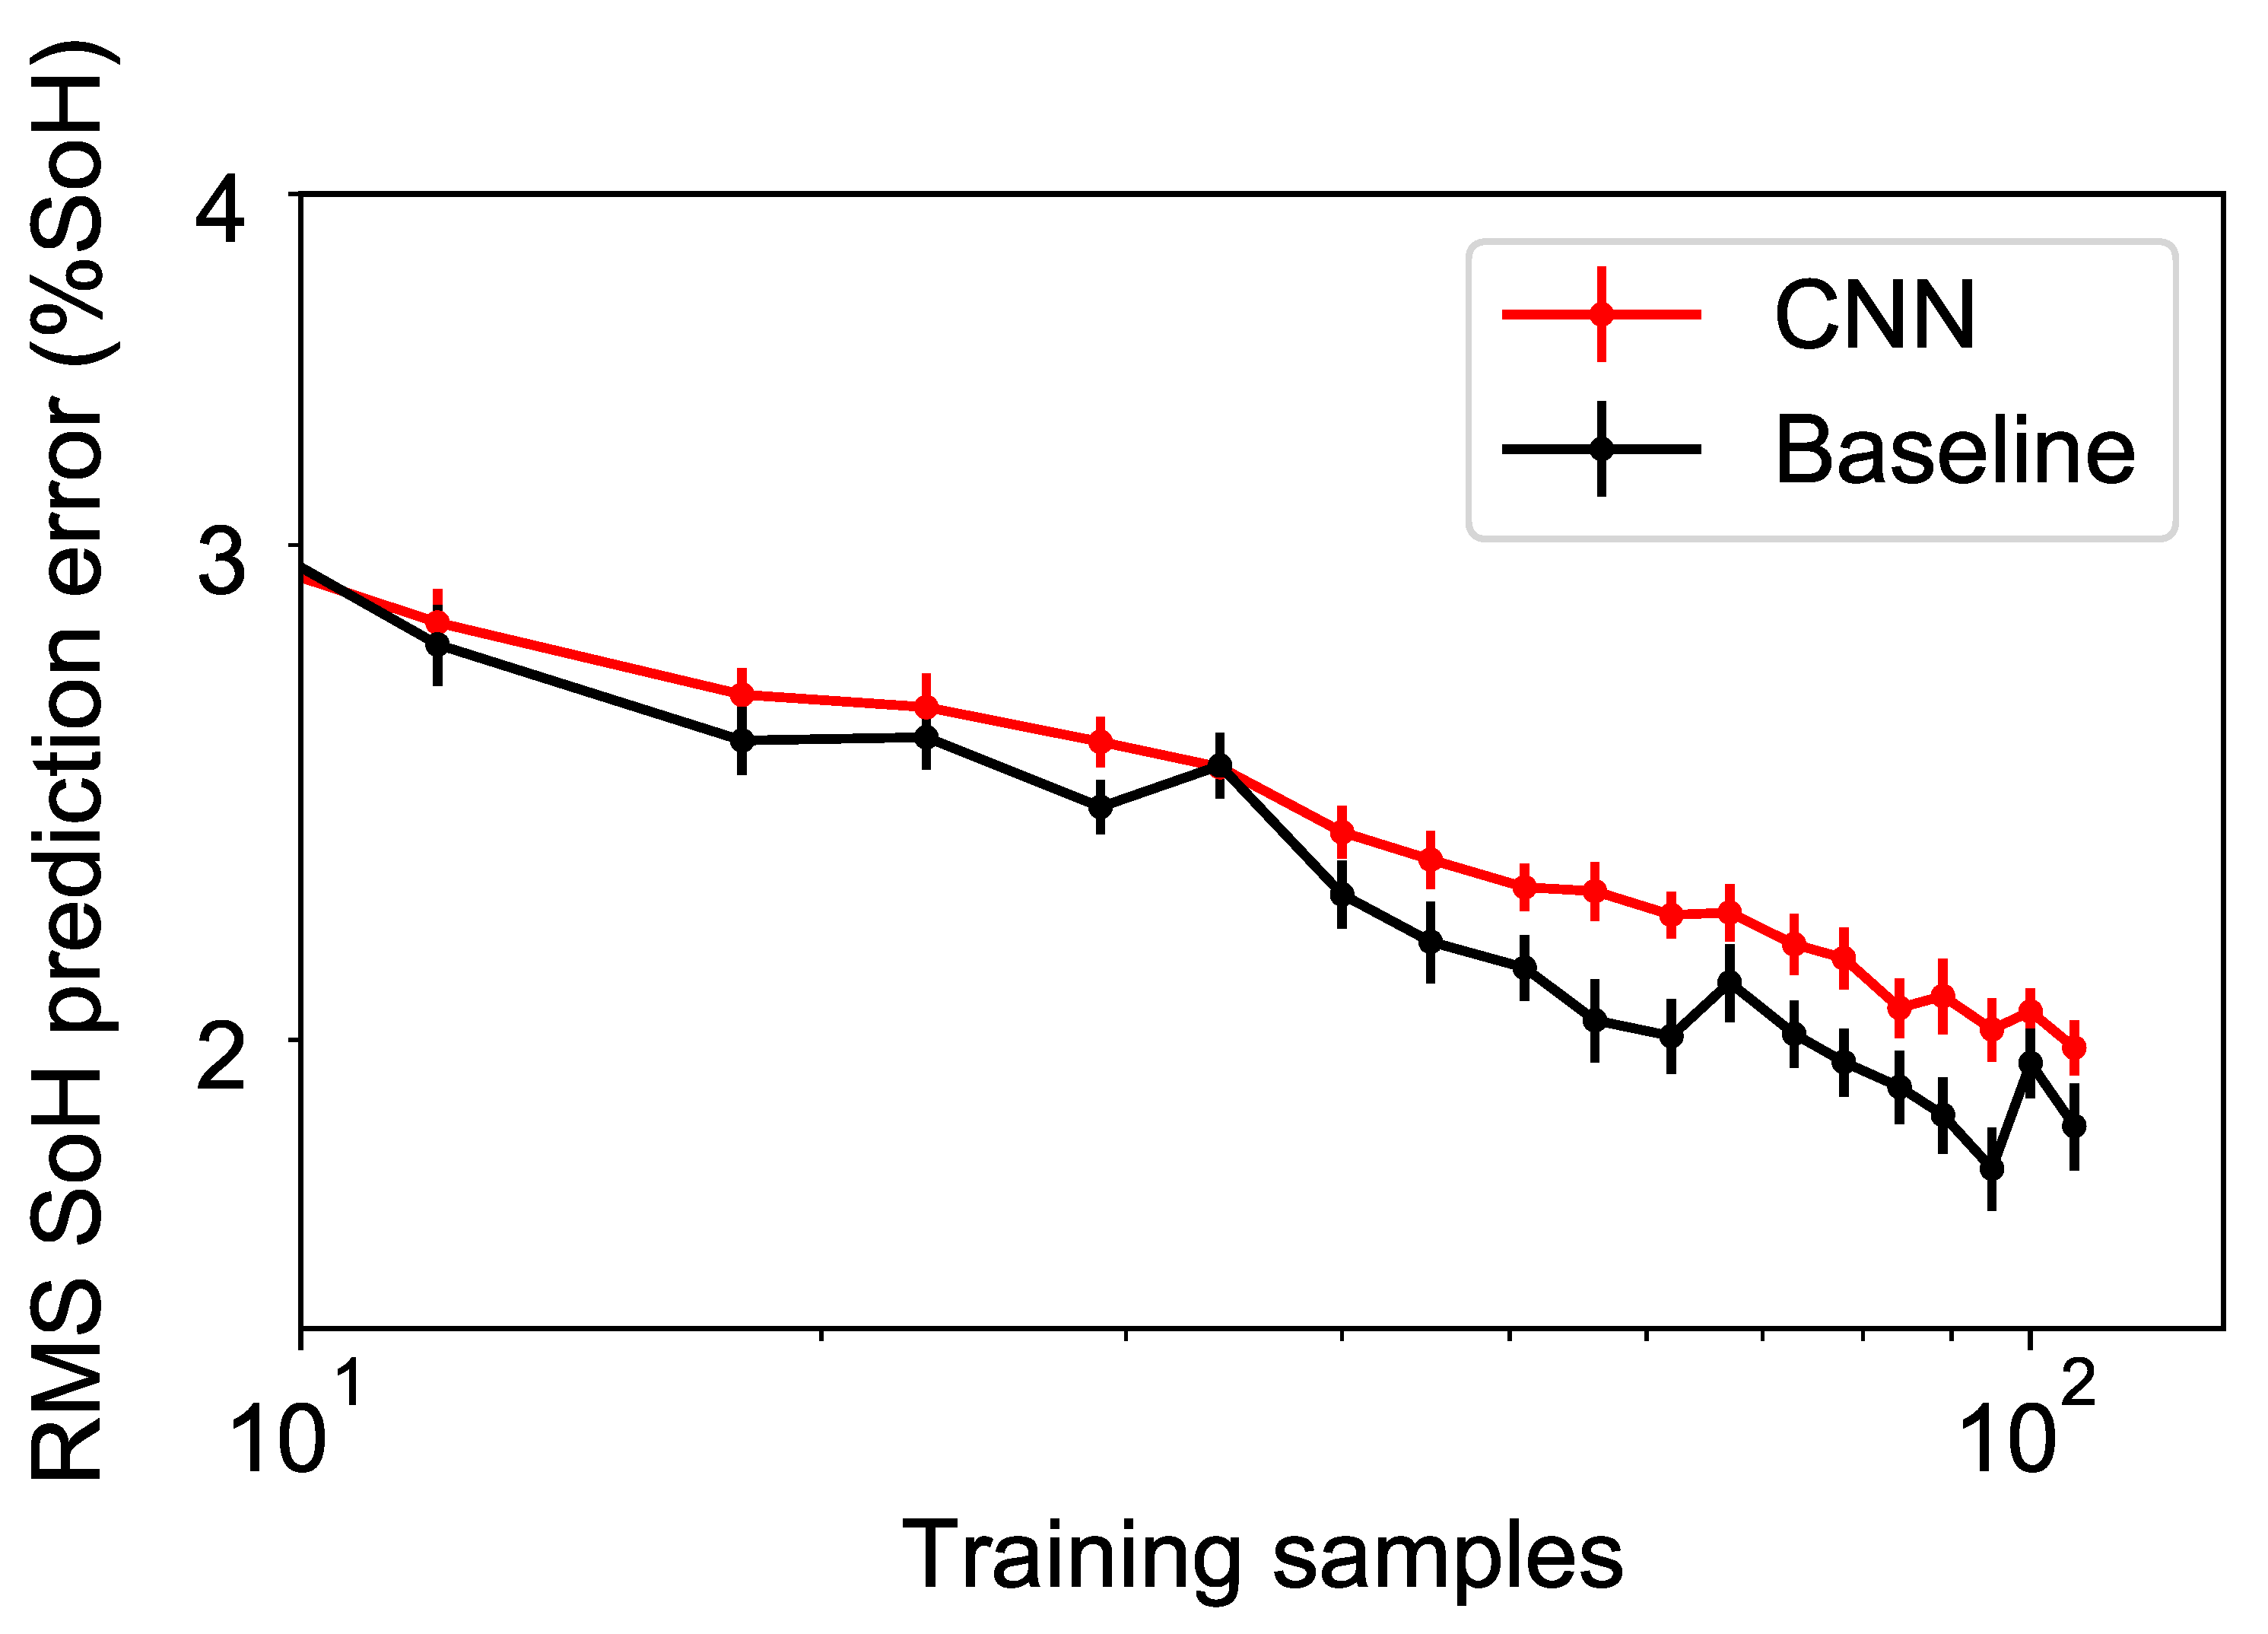
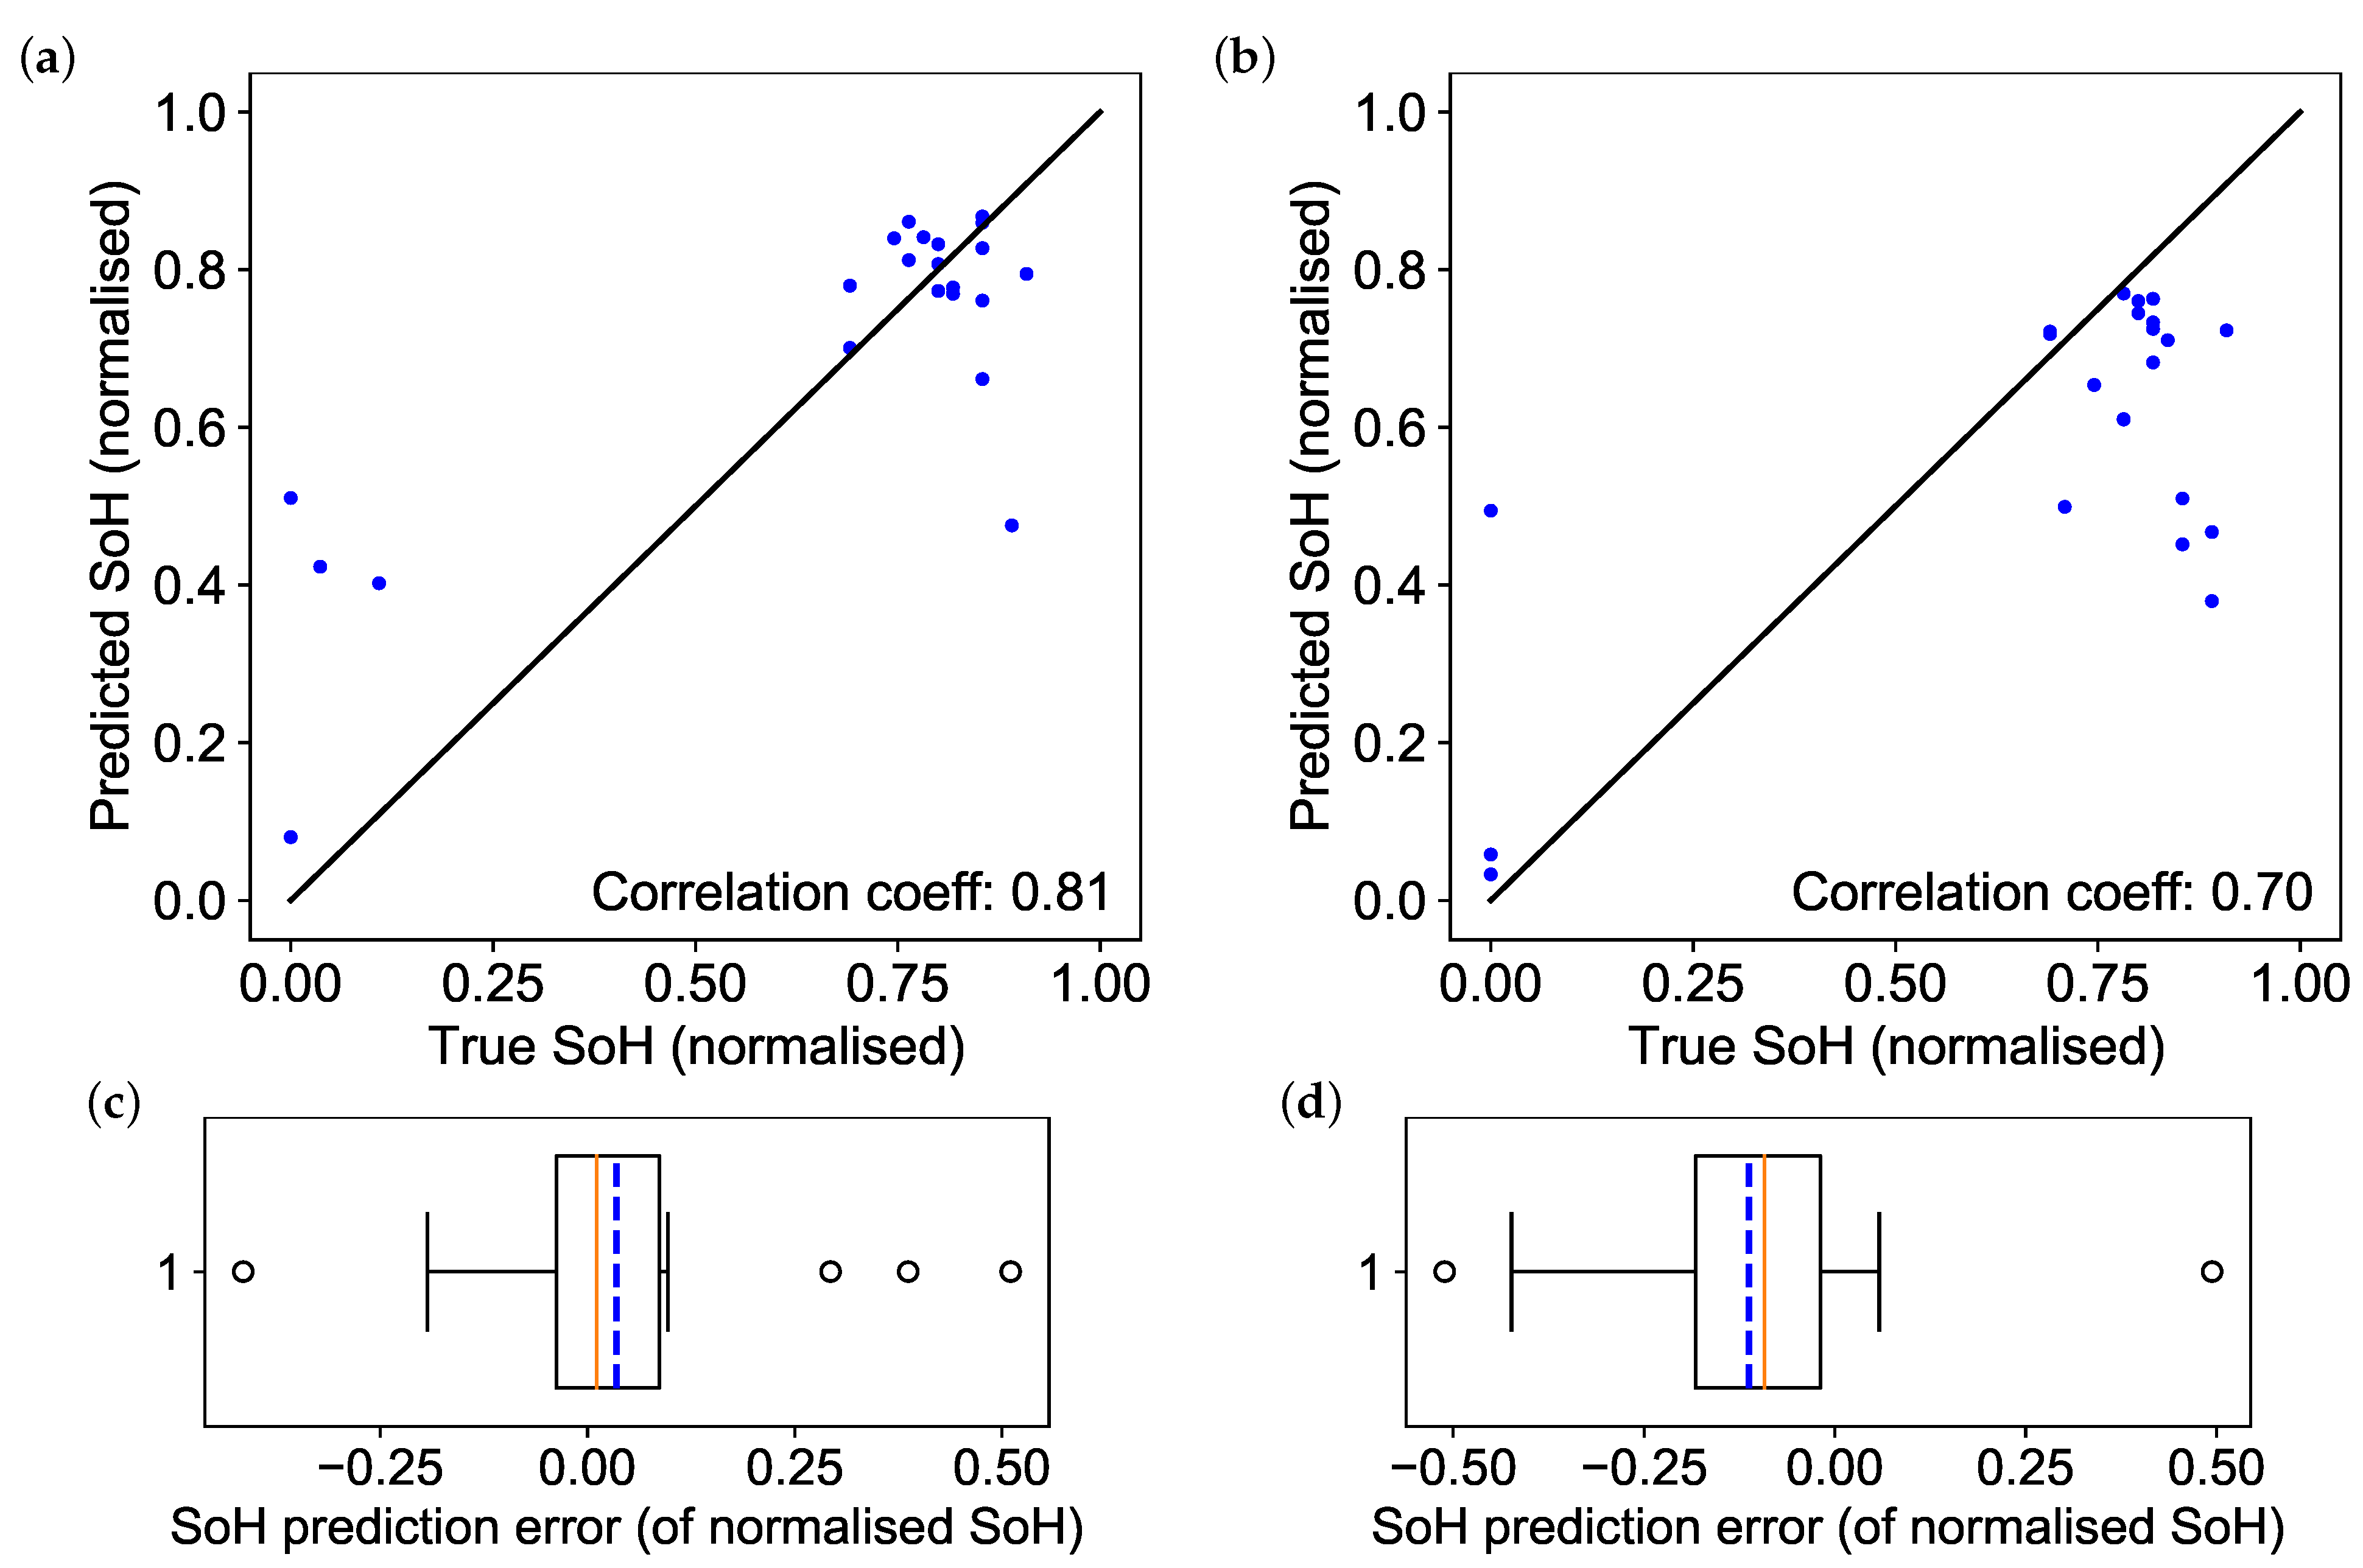
3.3. Comparison of Models

A combined comparison between the baseline ANN and CNN models is presented in Figure 5 showing the sample efficiency or variation in model accuracy with training dataset size. Each point represents the six-fold cross-validated RMS prediction error of each model averaged over 10 runs in total. More complex models such as the CNN are expected to lose efficiency as the size of the dataset decreases; this is corroborated by the inferior accuracy of the CNN to the simpler baseline ANN model, in spite of its advantages in flexibility and simplicity over model-based interpretations of the battery impedance data.
Beyond evaluation of estimation error, typical reuse criteria screen batteries on the basis of their capacity, such as batteries above and below 80% of baseline capacity; however, matching of cells with similar SoH is also of concern. The distribution of network predictions hence represents an important factor for accurate SoH estimation of cells at their end-of-life, necessitating a low tendency of over-/underestimation of SoH, high consistency, and good correlation between prediction and ground truth, in addition to low estimation error. Figure 6 presents the model predictions (Figure 6a,b) and distribution of errors as box plots (Figure 6c,d) from a single cross-validation trial for the CNN and baseline ANN model, respectively. Across both trials in Figure 6a,b, there is relatively good agreement between the predicted and ground truth SoH. Here, the baseline ANN shows a high correlation, with a Pearson correlation coefficient of 0.81, between predicted and ground truth SoH values. Considering the null hypothesis, ρ 0 —that is, the true correlation ρ is zero or negative—the t-test p statistic for a single-tailed distribution was calculated as p = 4.30 × 10 6 , which suggests that the correlation is significant. Furthermore, there is a good distinction between high and low SoH cells, which is crucial for the screening of end-of-first-life batteries. Comparing the residual distribution in Figure 6c,d for the CNN model, predictions are similarly consistent to the baseline ANN, although there is a tendency towards underestimation of the SoH of high-capacity batteries. Critically, however, there is a high and significant correlation (0.70, p = 2.06 × 10 4 ) between predicted and ground truth SoH, with high and low SoH cells being well-distinguished. Hence, the applicability of the CNN approach to SoH estimation for the screening of end-of-first-life cells is demonstrated, even in the absence of manual-model-based extraction of indicators of the SoH.

3.4. Comparison with Alternative SoH Models

To provide grounding for the performance of the baseline and CNN approaches to SoH estimation, the results obtained are brought into the context of related learning-based methods for SoH estimation, as well as popular machine learning approaches commonly applied with small datasets. The results obtained are compared with findings in [18,29,30,38,43] and evaluated where possible by the same metrics described in Section 2.2. In line with similar works such as [43], the methods described in Section 2.3 are reapplied to estimate SoH with Gaussian process (GP) and random forest extra trees (RF-ET) regression using the same set of ECM parameters used in the baseline ANN case. In Table 4, these results are summarised for comparison.
From Table 4, it is shown that although the RMS and mean absolute errors for the CNN are higher than for the ECM parameter-based baseline ANN, the proposed method for model-free SoH estimation still outperforms the majority of similar learning-based methods despite the small training dataset considered. This includes the baseline ANN with a Randles ECM without modifications to improve fit quality for the considered dataset, yielding improvements of 0.117 SoH% and 0.697 SoH% for RMS and peak error, respectively. As suggested by results of the fitting process in Table 2, the equivalent series resistance and charge transfer resistance were obtained with high accuracy, hence minimising the effect of the fitting error on SoH estimation based on these parameters. However, it is noted that despite this, the performance of simpler SoH estimation methods, such as relating SoH with the charge transfer resistance using a linear relationship, is greatly reduced compared with the proposed method. This is apparent even for methods that are not strictly model-based, such as in [30], where inputs for a single hidden layer ANN are instead extracted by direct measurement with hybrid pulse-power characterisation. More complex learning-based approaches such as DCNN–ETL [43] for online SoH monitoring based on the battery terminal voltage and current represent the potential of the model-free method, with the application of an ensemble of pre-trained neural networks suggested to further improve SoH estimation accuracy.
For future work, further investigation is required to quantify the influence on model accuracy if the ECM is not well-chosen or if additional phenomena are observed in the collected impedance data, such as the appearance of a second film capacitive loop at mid- to high-probing frequencies. Additional factors influencing SoH estimation, such as temperature, will require consideration of a larger, temperature-dependent dataset to guarantee robustness to a range of environmental conditions if climate-controlled measurements are not feasible or desirable. In particular, while this study considers offline estimation of battery SoH at end-of-first-life, this would be a necessary consideration for the potential online deployment of the described methods for SoH monitoring through online measurement of the battery impedance. Notably, the online application of EIS presents considerable challenges; typically, measurements are obtained under the strict constraints of pseudolinearity and after a long rest period, which is not realistic for online deployment. The effectiveness of the existing dataset is unclear when considering differences between data collected online and offline, as well as changes observed over the full first life cycle of the battery as opposed to the end-of-first-life considered in this work, warranting datasets collected specifically for this purpose. Nonetheless, implementations of online EIS, such as in [54], present a potential platform for extension of the proposed method to online SoH estimation. While SoH is an important factor in the screening of cells for second life application, other health indicators, such as power fade, also form a crucial part of this process. In principle, power fade in lithium-ion batteries is related to the formation of solid electrolyte interphase with age, which results in changes in measurable properties such as internal resistance. Since these quantities are measurable through EIS [9], there is potential for further expansion of the described methods for coestimation of power fade and SoH. These applications represent open avenues for future work.

4. Conclusions

A model-free neural-network-based method based on a convolutional neural network (CNN) has been proposed to estimate the state of health (SoH) of 2P arrangements of high-power lithium-ion batteries based on measurements of the battery impedance spectrum and state of charge. Compared by 6-fold cross-validation with a similar equivalent-circuit-model-based (ECM) neural network (ANN) approach from our previous work, both models were demonstrated to be robust to factors affecting battery impedance measurements such as the state of charge (SoC) dependence across a range of 20–100% SoC, resulting in an average RMS prediction error competitive with popular existing data-driven approaches (∼2.5–1.5 SoH%) for SoH estimation. Comparing the CNN and ECM-based ANN with dataset-specific modifications to improve model fit quality shows good distinction of cells above and below the typical screening criterion of 80% SoH and high correlation between prediction and ground truth SoH—0.70 and 0.81 Pearson correlation coefficients for the CNN and ANN, respectively—with the CNN showing slight reductions in estimation consistency. We posit that the proposed method provides benefits in flexibility through the abstraction of the manual model and initial fitting parameter selection required with the model-based method. Critically, when the dataset-specific modifications are removed, the CNN yields improvements in accuracy by RMS (0.117%) and peak error (0.697%) over the model-based approach. Overall, the proposed method achieves accuracy competitive with many model-based and model-free SoH estimation schemes, maintaining low (1.974 ± 0.132 SoH%) RMS and peak (5.944 SoH%) estimation error. This is demonstrated with the use of a small dataset of 106 training samples, demonstrating the applicability of our method even with limited availability of training data.

Author Contributions

Conceptualization, A.R. and J.H.; methodology, A.R. and J.H.; software, J.H.; validation, J.H.; formal analysis, A.R. and J.H.; investigation, J.H.; resources, A.R.; data curation, A.R.; writing—original draft preparation, A.R., R.S. and J.H.; writing—review and editing, A.R., R.S. and J.H.; visualization, J.H.; supervision, A.R. and R.S.; project administration, A.R. and R.S.; funding acquisition, A.R. and R.S. All authors have read and agreed to the published version of the manuscript.

Funding

This research was conducted as part of the project called “Reuse and Recycling of Lithium-Ion Batteries” (RELIB). This work was funded by the Faraday Institution [grant number FIRG005].

Data Availability Statement

The data that support the findings of this study are openly available in Figshare with DOI (10.6084/m9.figshare.12227282) [52].

Acknowledgments

The authors would like to thank Mohamed Ahmeid for his collaboration and work on the dataset applied in this study.

Conflicts of Interest

The authors declare no conflict of interest.

References

  1. Law, E.U. Global EV Outlook 2020. Available online: https://www.iea.org/reports/global-ev-outlook-2020 (accessed on 26 March 2021).
  2. Elwert, T.; Goldmann, D.; Römer, F.; Buchert, M.; Merz, C.; Schueler, D.; Sutter, J. Current Developments and Challenges in the Recycling of Key Components of (Hybrid) Electric Vehicles. Recycling 2015, 1, 25–60. [Google Scholar] [CrossRef]
  3. Diekmann, J.; Hanisch, C.; Frobose, L.; Schalicke, G.; Loellhoeffel, T.; Folster, A.S.; Kwade, A. Ecological recycling of lithium-ion batteries from electric vehicles with focus on mechanical processes. J. Electrochem. Soc. 2017, 164, A6184–A6191. [Google Scholar] [CrossRef]
  4. Pinegar, H.; Smith, Y. Recycling of End-of-Life Lithium Ion Batteries, Part I: Commercial Processes. J. Sustain. Metall. 2019, 5, 402–416. [Google Scholar] [CrossRef]
  5. Tong, S.; Fung, T.; Klein, M.; Weisbach, D.; Park, J. Demonstration of reusing electric vehicle battery for solar energy storage and demand side management. J. Energy Storage 2017, 11, 200–210. [Google Scholar] [CrossRef]
  6. Lambert, S.; Armstrong, M.; Attidekou, P.; Christensen, P.; Widmer, J.; Wang, C.; Scott, K. Rapid nondestructive-testing technique for in-line quality control of Li-ion batteries. IEEE Trans. Ind. Electron. 2017, 64, 4017–4026. [Google Scholar] [CrossRef]
  7. Muhammad, M.; Ahmeid, M.; Attidekou, P.S.; Milojevic, Z.; Lambert, S.; Das, P. Assessment of spent EV batteries for second-life application. In Proceedings of the 2019 IEEE 4th International Future Energy Electronics Conference (IFEEC), Singapore, 25–28 November 2019; pp. 325–329. [Google Scholar]
  8. Tröltzsch, U.; Kanoun, O.; Tränkler, H.R. Characterizing aging effects of lithium ion batteries by impedance spectroscopy. Electrochim. Acta 2006, 51, 1664–1672. [Google Scholar] [CrossRef]
  9. Pastor-Fernández, C.; Uddin, K.; Chouchelamane, G.; Widanage, W.; Marco, J. A Comparison between Electrochemical Impedance Spectroscopy and Incremental Capacity-Differential Voltage as Li-ion Diagnostic Techniques to Identify and Quantify the Effects of Degradation Modes within Battery Management Systems. J. Power Sources 2017, 360, 301–318. [Google Scholar] [CrossRef]
  10. Schindler, S.; Danzer, M. A novel mechanistic modeling framework for analysis of electrode balancing and degradation modes in commercial lithium-ion cells. J. Power Sources 2017, 343, 226–236. [Google Scholar] [CrossRef]
  11. Zhu, J.; Dewi Darma, M.; Knapp, M.; Sörensen, D.; Heere, M.; Fang, Q.; Wang, X.; Dai, H.; Mereacre, L.; Senyshyn, A.; et al. Investigation of lithium-ion battery degradation mechanisms by combining differential voltage analysis and alternating current impedance. J. Power Sources 2020, 448. [Google Scholar] [CrossRef]
  12. Xie, Y.; Li, J.; Yuan, C. Mathematical modeling of the electrochemical impedance spectroscopy in lithium ion battery cycling. Electrochim. Acta 2014, 127, 266–275. [Google Scholar] [CrossRef]
  13. Liu, L.; Zhu, M. Modeling of SEI layer growth and electrochemical impedance spectroscopy response using a thermal-electrochemical model of Li-ion batteries. ECS Trans. 2014, 61, 43–61. [Google Scholar] [CrossRef]
  14. Barai, A.; Uddin, K.; Dubarry, M.; Somerville, L.; McGordon, A.; Jennings, P.; Bloom, I. A comparison of methodologies for the non-invasive characterisation of commercial Li-ion cells. Prog. Energy Combust. Sci. 2019, 72, 1–31. [Google Scholar] [CrossRef]
  15. Li, Y.; Liu, K.; Foley, A.; Zülke, A.; Berecibar, M.; Nanini-Maury, E.; Van Mierlo, J.; Hoster, H. Data-driven health estimation and lifetime prediction of lithium-ion batteries: A review. Renew. Sustain. Energy Rev. 2019, 113. [Google Scholar] [CrossRef]
  16. Ahmeid, M.; Muhammad, M.; Milojevic, Z.; Lambert, S.; Attidekou, P. The Energy Loss Due to Interconnections in Paralleled Cell Configurations of Lithium-Ion Batteries in Electric Vehicles. In Proceedings of the 2019 IEEE 4th International Future Energy Electronics Conference (IFEEC), Singapore, 25–28 November 2019; pp. 1–4. [Google Scholar]
  17. Waag, W.; Käbitz, S.; Sauer, D. Experimental investigation of the lithium-ion battery impedance characteristic at various conditions and aging states and its influence on the application. Appl. Energy 2013, 102, 885–897. [Google Scholar] [CrossRef]
  18. Wang, X.; Wei, X.; Dai, H. Estimation of state of health of lithium-ion batteries based on charge transfer resistance considering different temperature and state of charge. J. Energy Storage 2019, 21, 618–631. [Google Scholar] [CrossRef]
  19. Leng, Y.; Ge, S.; Marple, D.; Yang, X.G.; Bauer, C.; Lamp, P.; Wang, C.Y. Electrochemical cycle-life characterization of high energy lithium-ion cells with thick Li(Ni0.6Mn0.2Co0.2)O2 and graphite electrodes. J. Electrochem. Soc. 2017, 164, A1037–A1049. [Google Scholar] [CrossRef] [Green Version]
  20. Oldenburger, M.; Bedürftig, B.; Gruhle, A.; Grimsmann, F.; Richter, E.; Findeisen, R.; Hintennach, A. Investigation of the low frequency Warburg impedance of Li-ion cells by frequency domain measurements. J. Energy Storage 2019, 21, 272–280. [Google Scholar] [CrossRef]
  21. Attidekou, P.; Lambert, S.; Armstrong, M.; Widmer, J.; Scott, K.; Christensen, P. A study of 40 Ah lithium ion batteries at zero percent state of charge as a function of temperature. J. Power Sources 2014, 269, 694–703. [Google Scholar] [CrossRef] [Green Version]
  22. Bonfitto, A.; Ezemobi, E.; Amati, N.; Feraco, S.; Tonoli, A.; Hegde, S. State of health estimation of lithium batteries for automotive applications with artificial neural networks. In Proceedings of the 2019 AEIT International Conference of Electrical and Electronic Technologies for Automotive (AEIT AUTOMOTIVE), Turin, Italy, 2–4 July 2019; pp. 1–5. [Google Scholar] [CrossRef]
  23. Park, J.; Lee, M.; Kim, G.; Park, S.; Kim, J. Integrated approach based on dual extended kalman filter and multivariate autoregressive model for predicting battery capacity using health indicator and SOC/SOH. Energies 2020, 13, 2138. [Google Scholar] [CrossRef]
  24. Gholizadeh, M.; Yazdizadeh, A. Systematic mixed adaptive observer and EKF approach to estimate SOC and SOH of lithium–ion battery. IET Electr. Syst. Transp. 2020, 10, 135–143. [Google Scholar] [CrossRef]
  25. Jabeur Telmoudi, A.; Soltani, M.; Chaouech, L.; Chaari, A. Parameter estimation of nonlinear systems using a robust possibilistic c-regression model algorithm. Proc. Inst. Mech. Eng. Part J. Syst. Control. Eng. 2020, 234, 134–143. [Google Scholar] [CrossRef]
  26. Telmoudi, A.; Soltani, M.; Ben Belgacem, Y.; Chaari, A. Modeling and state of health estimation of nickel–metal hydride battery using an EPSO-based fuzzy c-regression model. Soft Comput. 2020, 24, 7265–7279. [Google Scholar] [CrossRef]
  27. Wei, Z.; Zhao, J.; Ji, D.; Tseng, K.J. A multi-timescale estimator for battery state of charge and capacity dual estimation based on an online identified model. Appl. Energy 2017, 204, 1264–1274. [Google Scholar] [CrossRef]
  28. Wei, Z.; Leng, F.; He, Z.; Zhang, W.; Li, K. Online State of Charge and State of Health Estimation for a Lithium-Ion Battery Based on a Data–Model Fusion Method. Energies 2018, 11, 1810. [Google Scholar] [CrossRef] [Green Version]
  29. Densmore, A.; Hanif, M. Modeling the condition of lithium ion batteries using the extreme learning machine. In Proceedings of the 2016 IEEE PES PowerAfrica Conference, Livingstone, Zambia, 28 June–2 July 2016; pp. 184–188. [Google Scholar] [CrossRef]
  30. Yang, D.; Wang, Y.; Pan, R.; Chen, R.; Chen, Z. A Neural Network Based State-of-Health Estimation of Lithium-ion Battery in Electric Vehicles. Energy Procedia 2017, 105, 2059–2064. [Google Scholar] [CrossRef]
  31. Rastegarpanah, A.; Hathaway, J.; Ahmeid, M.; Lambert, S.; Walton, A.; Stolkin, R. A rapid neural network–based state of health estimation scheme for screening of end of life electric vehicle batteries. Proc. Inst. Mech. Eng. Part I J. Syst. Control. Eng. 2020, 1–17. [Google Scholar] [CrossRef]
  32. He, J.; Wei, Z.; Bian, X.; Yan, F. State-of-Health Estimation of Lithium-Ion Batteries Using Incremental Capacity Analysis Based on Voltage–Capacity Model. IEEE Trans. Transp. Electrif. 2020, 6, 417–426. [Google Scholar] [CrossRef]
  33. Bian, X.; Wei, Z.; He, J.; Yan, F.; Liu, L. A Novel Model-based Voltage Construction Method for Robust State-of-health Estimation of Lithium-ion Batteries. IEEE Trans. Ind. Electron. 2020. [Google Scholar] [CrossRef]
  34. Sarmah, S.; Kalita, P.; Garg, A.; Niu, X.D.; Zhang, X.W.; Peng, X.; Bhattacharjee, D. A Review of State of Health Estimation of Energy Storage Systems: Challenges and Possible Solutions for Futuristic Applications of Li-Ion Battery Packs in Electric Vehicles. J. Electrochem. Energy Convers. Storage 2019, 16. [Google Scholar] [CrossRef] [Green Version]
  35. Lu, L.; Han, X.; Li, J.; Hua, J.; Ouyang, M. A review on the key issues for lithium-ion battery management in electric vehicles. J. Power Sources 2013, 226, 272–288. [Google Scholar] [CrossRef]
  36. Jiao, M.; Wang, D.; Qiu, J. A GRU-RNN based momentum optimized algorithm for SOC estimation. J. Power Sources 2020, 459. [Google Scholar] [CrossRef]
  37. Mamo, T.; Wang, F.K. Long short-term memory with attention mechanism for state of charge estimation of lithium-ion batteries. IEEE Access 2020, 8, 94140–94151. [Google Scholar] [CrossRef]
  38. Eddahech, A.; Briat, O.; Bertrand, N.; Delétage, J.Y.; Vinassa, J.M. Behavior and state-of-health monitoring of Li-ion batteries using impedance spectroscopy and recurrent neural networks. Int. J. Electr. Power Energy Syst. 2012, 42, 487–494. [Google Scholar] [CrossRef]
  39. Kwon, S.J.; Han, D.; Choi, J.; Lim, J.H.; Lee, S.E.; Kim, J. Remaining-useful-life prediction via multiple linear regression and recurrent neural network reflecting degradation information of 20Ah LiNixMnyCo1-x-yO2 pouch cell. J. Electroanal. Chem. 2020, 858. [Google Scholar] [CrossRef]
  40. Li, P.; Zhang, Z.; Xiong, Q.; Ding, B.; Hou, J.; Luo, D.; Rong, Y.; Li, S. State-of-health estimation and remaining useful life prediction for the lithium-ion battery based on a variant long short term memory neural network. J. Power Sources 2020, 459. [Google Scholar] [CrossRef]
  41. Kim, J.; Yu, J.; Kim, M.; Kim, K.; Han, S. Estimation of Li-ion Battery State of Health based on Multilayer Perceptron: As an EV Application. IFAC-PapersOnLine 2018, 51, 392–397. [Google Scholar] [CrossRef]
  42. Shen, S.; Sadoughi, M.; Chen, X.; Hong, M.; Hu, C. A deep learning method for online capacity estimation of lithium-ion batteries. J. Energy Storage 2019, 25, 100817. [Google Scholar] [CrossRef]
  43. Shen, S.; Sadoughi, M.; Li, M.; Wang, Z.; Hu, C. Deep convolutional neural networks with ensemble learning and transfer learning for capacity estimation of lithium-ion batteries. Appl. Energy 2020, 260. [Google Scholar] [CrossRef]
  44. Liu, C.; Tan, J.; Shi, H.; Wang, X. Lithium-ion cell screening with convolutional neural networks based on two-step time-series clustering and hybrid resampling for imbalanced data. IEEE Access 2018, 6, 59001–59014. [Google Scholar] [CrossRef]
  45. Chang, L.; Wang, C.; Zhang, C.; Xiao, L.; Cui, N.; Li, H.; Qiu, J. A novel fast capacity estimation method based on current curves of parallel-connected cells for retired lithium-ion batteries in second-use applications. J. Power Sources 2020, 459. [Google Scholar] [CrossRef]
  46. Love, C.; Dubarry, M.; Reshetenko, T.; Devie, A.; Spinner, N.; Swider-Lyons, K.; Rocheleau, R. Lithium-ion cell fault detection by single-point impedance diagnostic and degradation mechanism validation for series-wired batteries cycled at 0 °C. Energies 2018, 11, 834. [Google Scholar] [CrossRef] [Green Version]
  47. Sun, Y.; Li, Y.; Yu, M.; Zhou, Z.; Zhang, Q.; Duan, B.; Shang, Y.; Zhang, C. Variable fractional order—A comprehensive evaluation indicator of lithium-ion batteries. J. Power Sources 2020, 448. [Google Scholar] [CrossRef]
  48. Abadi, M.; Agarwal, A.; Barham, P.; Brevdo, E.; Chen, Z.; Citro, C.; Corrado, G.S.; Davis, A.; Dean, J.; Devin, M.; et al. TensorFlow: Large-Scale Machine Learning on Heterogeneous Systems. 2015. Available online: tensorflow.org (accessed on 13 February 2020).
  49. Kingma, D.; Ba, J. Adam: A Method for Stochastic Optimization. In Proceedings of the 2015 3rd International Conference on Learning Representations, San Diego, CA, USA, 7–9 May 2015. [Google Scholar]
  50. Hastie, T.; Tibshirani, R.; Friedman, J.H. The Elements of Statistical Learning: Data Mining, Inference, and Prediction, 2nd ed.; Springer Series in Statistics; Springer: New York, NY, USA, 2009. [Google Scholar]
  51. Chollet, F. Deep Learning with Python, 1st ed.; Manning: Shelter Island, Hong Kong, 2018. [Google Scholar]
  52. Rastegarpanah, A. Data library: Electrochemical impedance spectroscopy Dataset and Neural Network code. Figshare 2020. [Google Scholar] [CrossRef]
  53. Pedregosa, F.; Varoquaux, G.; Gramfort, A.; Michel, V.; Thirion, B.; Grisel, O.; Blondel, M.; Prettenhofer, P.; Weiss, R.; Dubourg, V.; et al. Scikit-learn: Machine Learning in Python. J. Mach. Learn. Res. 2011, 12, 2825–2830. [Google Scholar]
  54. Din, E.; Schaef, C.; Moffat, K.; Stauth, J.T. A Scalable Active Battery Management System with Embedded Real-Time Electrochemical Impedance Spectroscopy. IEEE Trans. Power Electron. 2017, 32, 5688–5698. [Google Scholar] [CrossRef]
Figure 1. Diagram of the convolutional neural network architecture employed for direct estimation of state of health using impedance spectroscopy measurements—with the real and imaginary components of the battery impedance at each sampling frequency forming a 29 × 2 input matrix, respectively—and battery state of charge.
Energies 14 02597 g001
Figure 2. Structure of the baseline artificial neural network (ANN) generated using Bayesian hyperparameter optimisation. State of health is estimated from parameters ( R e , R c t , …) extracted from impedance spectra using a modified Randles equivalent circuit model.
Energies 14 02597 g002
Figure 3. Schematic Nyquist representation of EIS data from a lithium-ion cell conforming to the Randles circuit model (bottom right). High-frequency phenomena (left) are modelled by an inductor L; capacitive behaviour at mid frequencies by a parallel combination of capacitor and resistor C d l , R c t ; and solid-state diffusion (right) by a Warburg element R W , T W .
Energies 14 02597 g003
Figure 4. Nyquist plot of fit to modification of the equivalent circuit shown in Figure 3 with experimental impedance data obtained at 60% SoC, 25 °C, frequency range 1 KHz–15 mHz over the red and white terminals of module 1 of 13, and capacity 54.9 Ah.
Energies 14 02597 g004
Figure 5. Sample efficiency plot of 6-fold cross-validated RMS state of health prediction error for the model-based baseline and model-free CNN.
Energies 14 02597 g005
Figure 6. Distribution of predicted vs. ground truth state of health values over a single cross-validation trial shown as scatter (a,b) and box plots of the model errors (c,d) for the baseline ANN (left) and CNN (right) models. The SoH values (range 77–85%) are normalised to 0–1 for clarity. Each point in (a,b) represents a prediction of the CNN and ANN respectively versus the corresponding true SoH, with the diagonal line showing the case of equal prediction and ground truth, i.e. zero prediction error. The solid red and dotted blue lines in (c,d) denote median and mean prediction error respectively.
Energies 14 02597 g006
Table 1. 6-fold cross-validated RMS, mean absolute (MA), and peak prediction errors of state of health estimation for the convolutional neural network model.
Trial (CNN)123456Average
RMS error (SoH%)2.1351.4291.8252.2292.3021.9211.974 ± 0.132
MA error (SoH%)1.7541.0501.4201.8551.6971.2941.512 ± 0.126
Peak error (SoH%)4.9393.9703.8915.3665.9945.4504.935 ± 0.346
Table 2. Fitted values obtained from equivalent-circuit-model-based parameter extraction from EIS data collected from module 1 of 13 at 60% SoC, with modification of ECM in Figure 3. This fit is presented graphically in Figure 4.
Fit ParameterValueError (±)Unit
R e 9.69 × 10 4 6.85 × 10 6 Ω
R c t 1.77 × 10 4 8.81 × 10 6 Ω
Q d l 35.3 8.33 Ω 1 s n d l
n d l 0.852 0.0480
R W 1.08 × 10 3 2.61 × 10 4 Ω
τ W 92.5 41.4 s
L 5.84 × 10 8 1.35 × 10 9 H
Table 3. Six-fold cross-validated RMS, mean absolute (MA), and peak prediction errors of state of health estimation for the baseline neural network model based on modified and unmodified Randles equivalent circuit model parameter extraction.
Trial (Baseline)123456Average
RMS error (SoH %)1.6711.8311.9201.7581.3642.1951.790 ± 0.112
MA error (SoH %)1.1471.3411.1721.1431.0161.3851.200 ± 0.056
Peak error (SoH %)4.1045.2866.1414.0983.6806.0074.886 ± 0.435
Trial (Baseline, unmodified)123456Average
RMS error (SoH %)1.8573.0021.7542.2422.0271.8682.125 ± 0.189
MA error (SoH %)1.2642.2111.1391.5951.3021.2471.460 ± 0.163
Peak error (SoH %)5.4346.3845.2845.0895.3284.6795.366 ± 0.231
Table 4. Overview of RMS, mean absolute, and peak prediction errors between this work, machine learning approaches covered by existing studies, and commonly used learning-based methods—Gaussian process (GP) and random forest extra-trees (RF-ET) regression.
MethodRMS Err. (SoH %)MA Err. (SoH %)Peak Err. 1 (SoH %)# Training Samples
Linear regression6.7805.91114.326
( R c t , 60% SoC) [18] 2
ANN [30] 3 4.053.487.2∼40
GP regression [53]2.6812.3537.431106
ELM [29] 4 2.4∼520
RF-ET regression [53]2.0921.7797.123106
Prev. work2.091 ± 0.3601.447 ± 0.3456.641106
(unmodified Randles)
This work (CNN)1.974 ± 0.1321.512 ± 0.1265.944106
Prev. work1.790 ± 0.1121.200 ± 0.0566.141106
(baseline ANN)
DCNN–ETL [43]1.5039.505340 (+25,338 initial training)
RNN [38]0.462500
1 Peak error is the maximum quoted error from each study: for this and previous work, it is the maximum recorded error over 6-fold cross-validation. 2 Linear regression of the charge transfer resistance as a measure of SoH proposed by [18] at 60% SoC on this work’s dataset. 3 Avg. errors calculated from published SoH prediction errors, number of samples estimated from authors’ quotation of 5 cells for training. 4 Number of samples not quoted: estimated from samples available in the open source NASA Ames dataset used.
Publisher’s Note: MDPI stays neutral with regard to jurisdictional claims in published maps and institutional affiliations.

