Article

A Multi-Frequency Electrical Impedance Spectroscopy Technique of Artificial Neural Network-Based for the Static State of Charge

Department of Electrical Engineering, National Taiwan University of Science and Technology, Da’an District, Taipei 10607, Taiwan
Energies 2021, 14(9), 2526; https://doi.org/10.3390/en14092526
Submission received: 29 March 2021 / Revised: 14 April 2021 / Accepted: 23 April 2021 / Published: 28 April 2021

Abstract

:
An artificial neural network (ANN) based multi-frequency electrical impedance spectroscopy (EIS) technique is proposed to estimate the static state of charge (SOC) of lithium-ion (Li-ion) battery in this paper. The proposed ANN-based multi-frequency EIS technique firstly collects the data of AC independence and their corresponding static SOC. With battery discharging current and multi-frequency EIS results, an ANN model is built and trained to estimate SOC. The measurement data is obtained using the potentiostats/galvanostats device, and the ANN is trained using the neural network toolbox in MATLAB. According to the experimental results, the performance of the proposed ANN model is dependent on the number of neurons in the hidden layer. The proposed method is validated with a set of random discharging processes. The high accuracy of SOC estimation is able to be achieved with the average error reduced to 1.92% when the number of neurons in the hidden layer is 35. Therefore, the proposed ANN-based multi-frequency EIS technique can be utilized to measure the static SOC of random discharge of Li-ion batteries.

1. Introduction

The soaring oil price and environmental issues have significantly affected the global automotive industry. In recent years, electric vehicles (EVs) have been rapidly developed and expanded in automotive markets, with policy support from many countries. Among a variety of technologies related to EV, Li-ion batteries play an important role in the increase of EVs. Therefore, the estimation of battery SOC with high accuracy is inevitable in the development of EVs. Similar to the gas gauge, the SOC serves as key information for drivers, and it must have high reliability. In fact, SOC estimation turns out to be challenging because of the changing current in the discharging period. Moreover, when EV stops running, the Li-ion battery voltage will recover to the open-circuit voltage (OCV) state. The non-linearity of battery characteristics makes SOC estimation more complicated. To prevent estimation error which causes unreliability of EVs, some approaches, such as rise cut-off voltage level or increase of battery capacity, are available. However, they not only waste the usable capacity but also increase the cost of the EVs.
In recent studies, many techniques have been proposed for SOC estimation, such as open circuit voltage, loaded voltage method [1,2,3], Coulomb integral method [4,5], impedance track technique [6,7,8,9] and Kalman Filter [10,11,12], etc. Among them, methods based on AC impedance analysis have been widely investigated. For example, the electrochemical characteristic of Li-ion battery was presented with the measurement of single frequency in [13]. A dynamic electrochemical impedance spectroscopy (DEIS) by continuous impedance measurement of a single frequency during on charging and discharging in [14]. In addition, due to the non-linearity and high dynamics of battery characteristics, ANN-based techniques have been widely used to estimate the SOC of a battery. In [15], open-loop and closed-loop neural network structures were proposed to estimate SOC. With the feedback mechanism, the accuracy of the network can be significantly improved. On the other hand, there are also some studies developed by combining the above techniques. For example, authors in [16], have proposed a fractional order calculus (FOC) method to model the constant phase element (CPE) in the impedance model and utilized Kalman filter to estimate the SOC. Authors in [17] have proposed an enhanced recurrent neural network-based lighting search algorithm (LSA) model to increase the robustness of the estimation results using less computation time. Authors in [18] have utilized electrochemical impedance spectroscopy (EIS) and analytical polynomial functions to analyze the nonlinear relation between SOC and the parameters of battery equivalent circuit. With the leave-one-out cross-validation (LOOCV) method applied for fitting, the proposed method is able to systematically analyze the impact of polynomial. Experimental results show that the usage of 7th-order polynomials can accurately reflect the nonlinear effects of battery internal parameters. A SOC estimation approach using ANN and EKF with battery equivalent circuit has been proposed in [19]. Both experimental and simulation results show the proposed method has the advantage of high accuracy for SOC estimation. Authors in [20] have proposed a fast and effective online measurement of battery impedance for EVs. The frequency of measurement is between 1 Hz and 2 kHz. The observed voltage and current waveforms are amplified and filtered by the circuit. Compared with the measurement from EIS, even under an environment with noise, the proposed technique can reduce the error of RMS measurement between 1.9% to 5.8%. An OCV-SOC-temperature model was built and Kalman filter is used to adjust the model parameters. This model is able to simply and efficiently improve the accuracy of SOC estimation under different ambient temperatures [21]. Based on the Thevenin equivalent model of Li-ion battery, an adaptive extended Kalman filter was used to perform online estimation of the parameters in an equivalent battery model. The maximum error is reduced to 4.1% [22]. Based on the analysis of the impedance spectrum of the Li-ion battery, a multi-time scale extended Kalman filter was applied to estimate the SOC in [23]. To improve the accuracy of SOC estimation, the amount of charge transferring between the two different of SOC of a battery cell was calculated in [24]. A Coulomb integral based method was proposed in [25] to enhance the accuracy of the SOC initial value. With voltage, current, and battery OCV information, a fast and online SOC estimation method was proposed in [26]. In [27], an observation method based on proportional-integral (PI) was applied to analyze the RC battery model and estimate SOC. The error of estimation can be constrained within 2%. In [28], an Elman neural network estimation method was proposed to perform SOC estimation. Compared to traditional back-propagation neural network estimation method, it has higher accuracy. The authors in [29] have established a table describing the nonlinear relationship of RC equivalent circuit of a Li-ion battery and OCV-SOC. Using the voltage and current information from the experiment, the battery parameters can be updated, and used to estimate battery SOC. Estimation errors of less than 5% can be obtained. To improve the first-order equivalent circuit model of Li-ion battery, a neural network model incorporated with Thevenin’s theorem was used in [30]. The experimental results showed that it is able to achieve high accuracy for SOC estimation with less calculation time.
The Coulomb integral method is commonly used to obtain the SOC for EV applications. To update the SOC, initial SOC is usually calibrated by measuring OCV during the pauses of driving. However, it should be noted that OCV is highly dependent on battery internal resistance. The estimation error is then caused by the inaccurate initial SOC with OCV method. Therefore, this paper aims to propose a technique using multi-frequency EIS and ANN algorithm to determine the SOC of the Li-ion battery under the static state. When EVs are not running, this method is able to update the SOC accurately and provide a precise initial SOC state for the coulomb integral method. Due to the high complexity of mapping the AC impedance result to battery SOC, an ANN-based model is developed to perform the estimation static SOC of Li-ion battery. To prepare training datasets, a potentiostat/galvanostat device VMP3 from Bio-Logic Corp. is used to inject a multi-frequency voltage sine wave into the Li-ion battery, and the static impedance of the Li-ion battery can be obtained. The information of multi-point static impedance and the discharging current are inputs of the ANN. With the input data and the corresponding SOC output data, ANN is trained with MATLAB software. In the experiment, the proposed model is validated with a set of random discharging process. With the proposed ANN model, the error of the estimated results can be reduced to 1.92%.

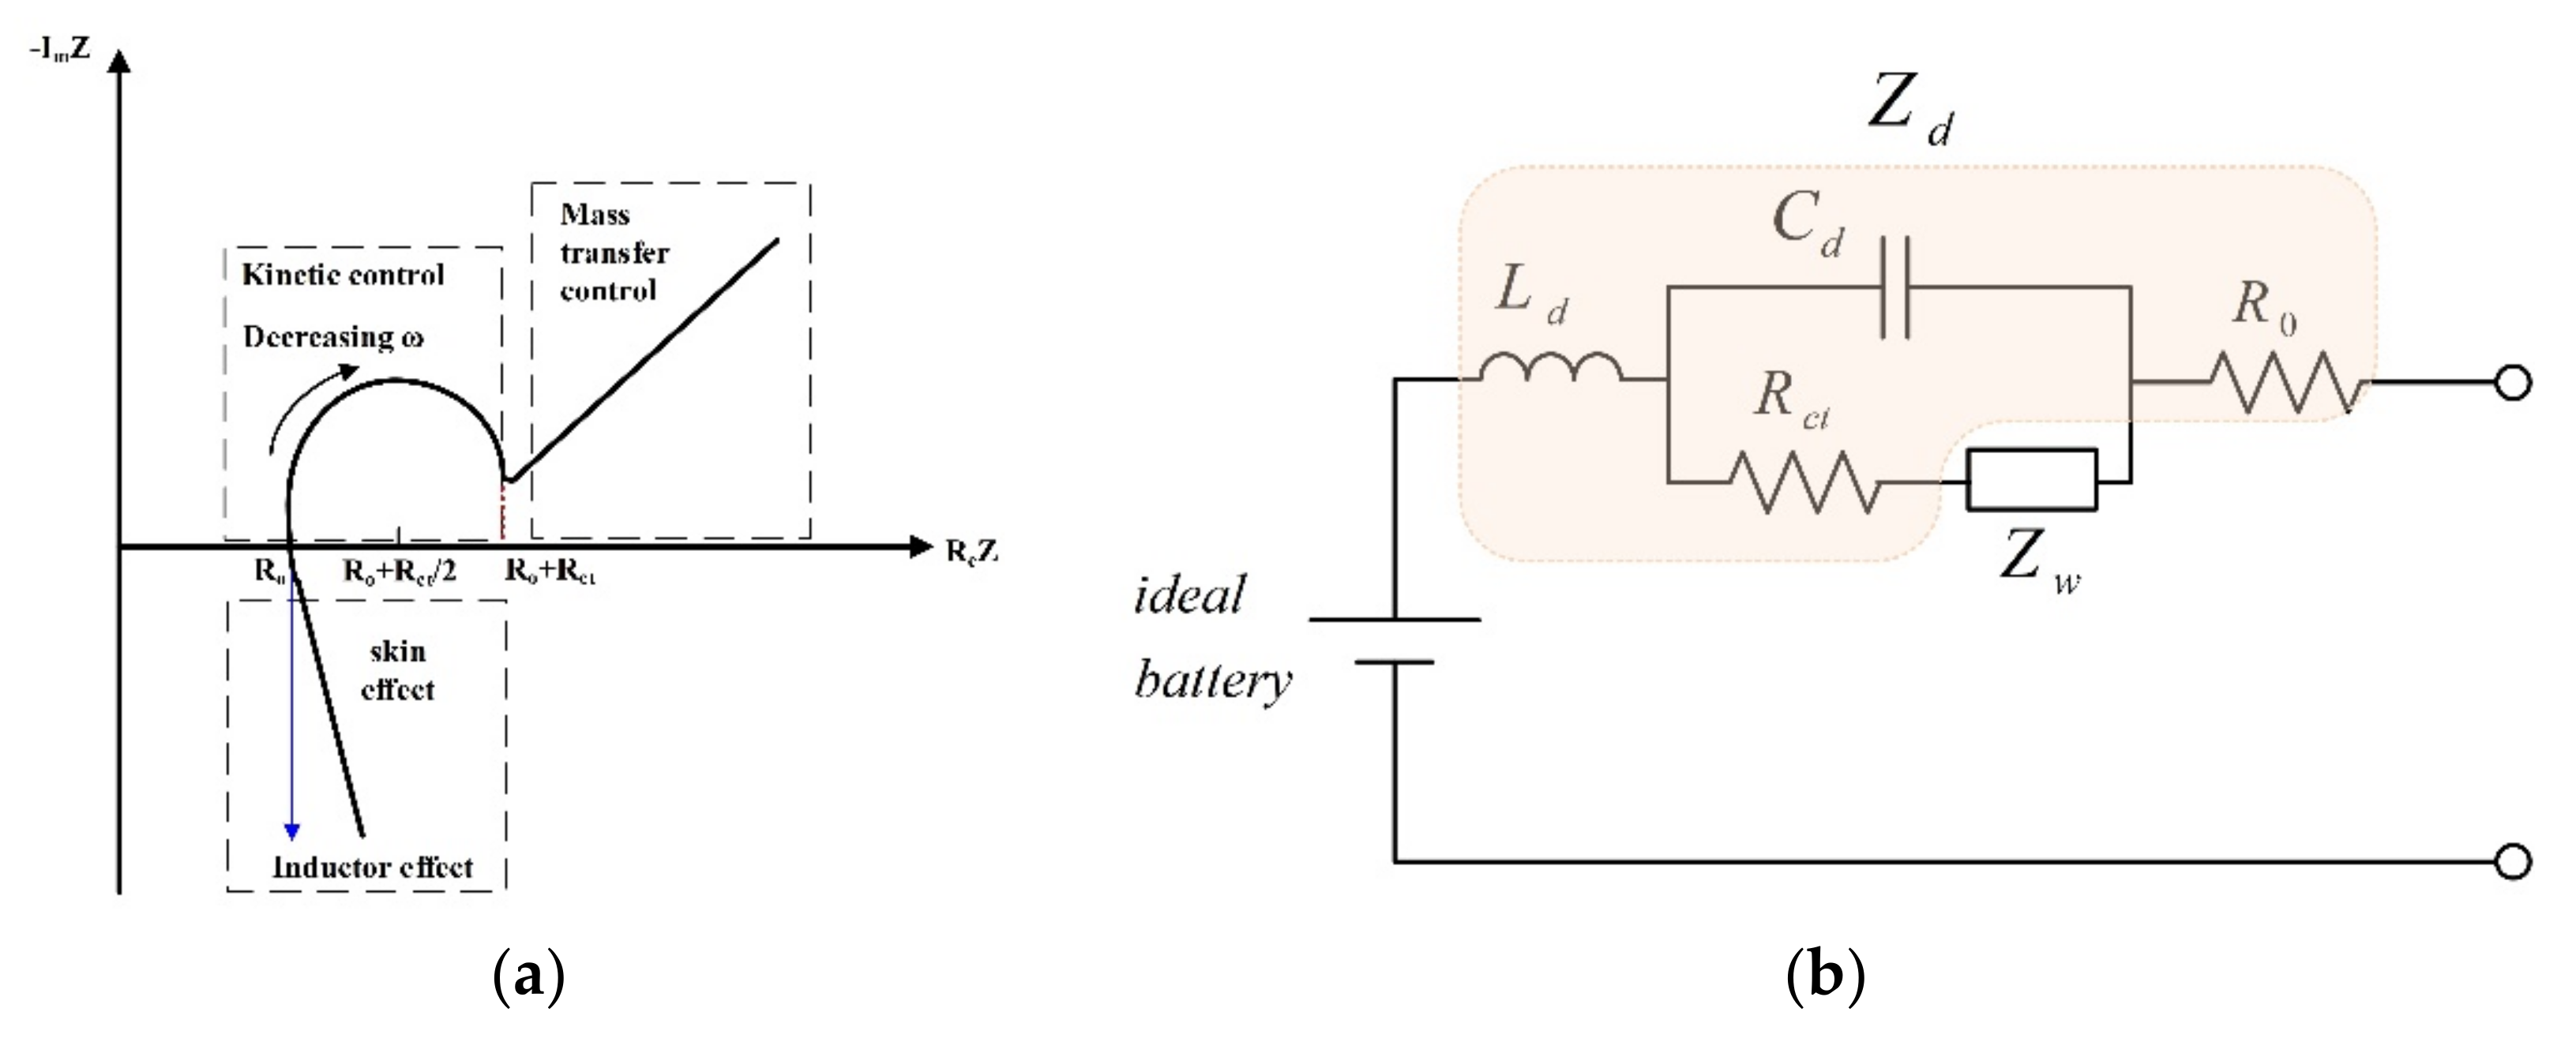
2. Multi-Frequency Electrical Impedance Spectroscopy Analysis

Multi-frequency EIS, also known as AC impedance technique, is a non-invasive measurement method widely applied to observe electrochemical mechanisms of battery properties. As a series of electrochemical processes occur in a battery cell, battery impedance serves as a crucial information for investigating battery parameters and states, such as SOC, aging effect (state-of-health) and thermal behaviors. Multi-frequency EIS analysis has become a powerful technique to characterize property changes in battery cells under different circumstances of usage or storage condition.

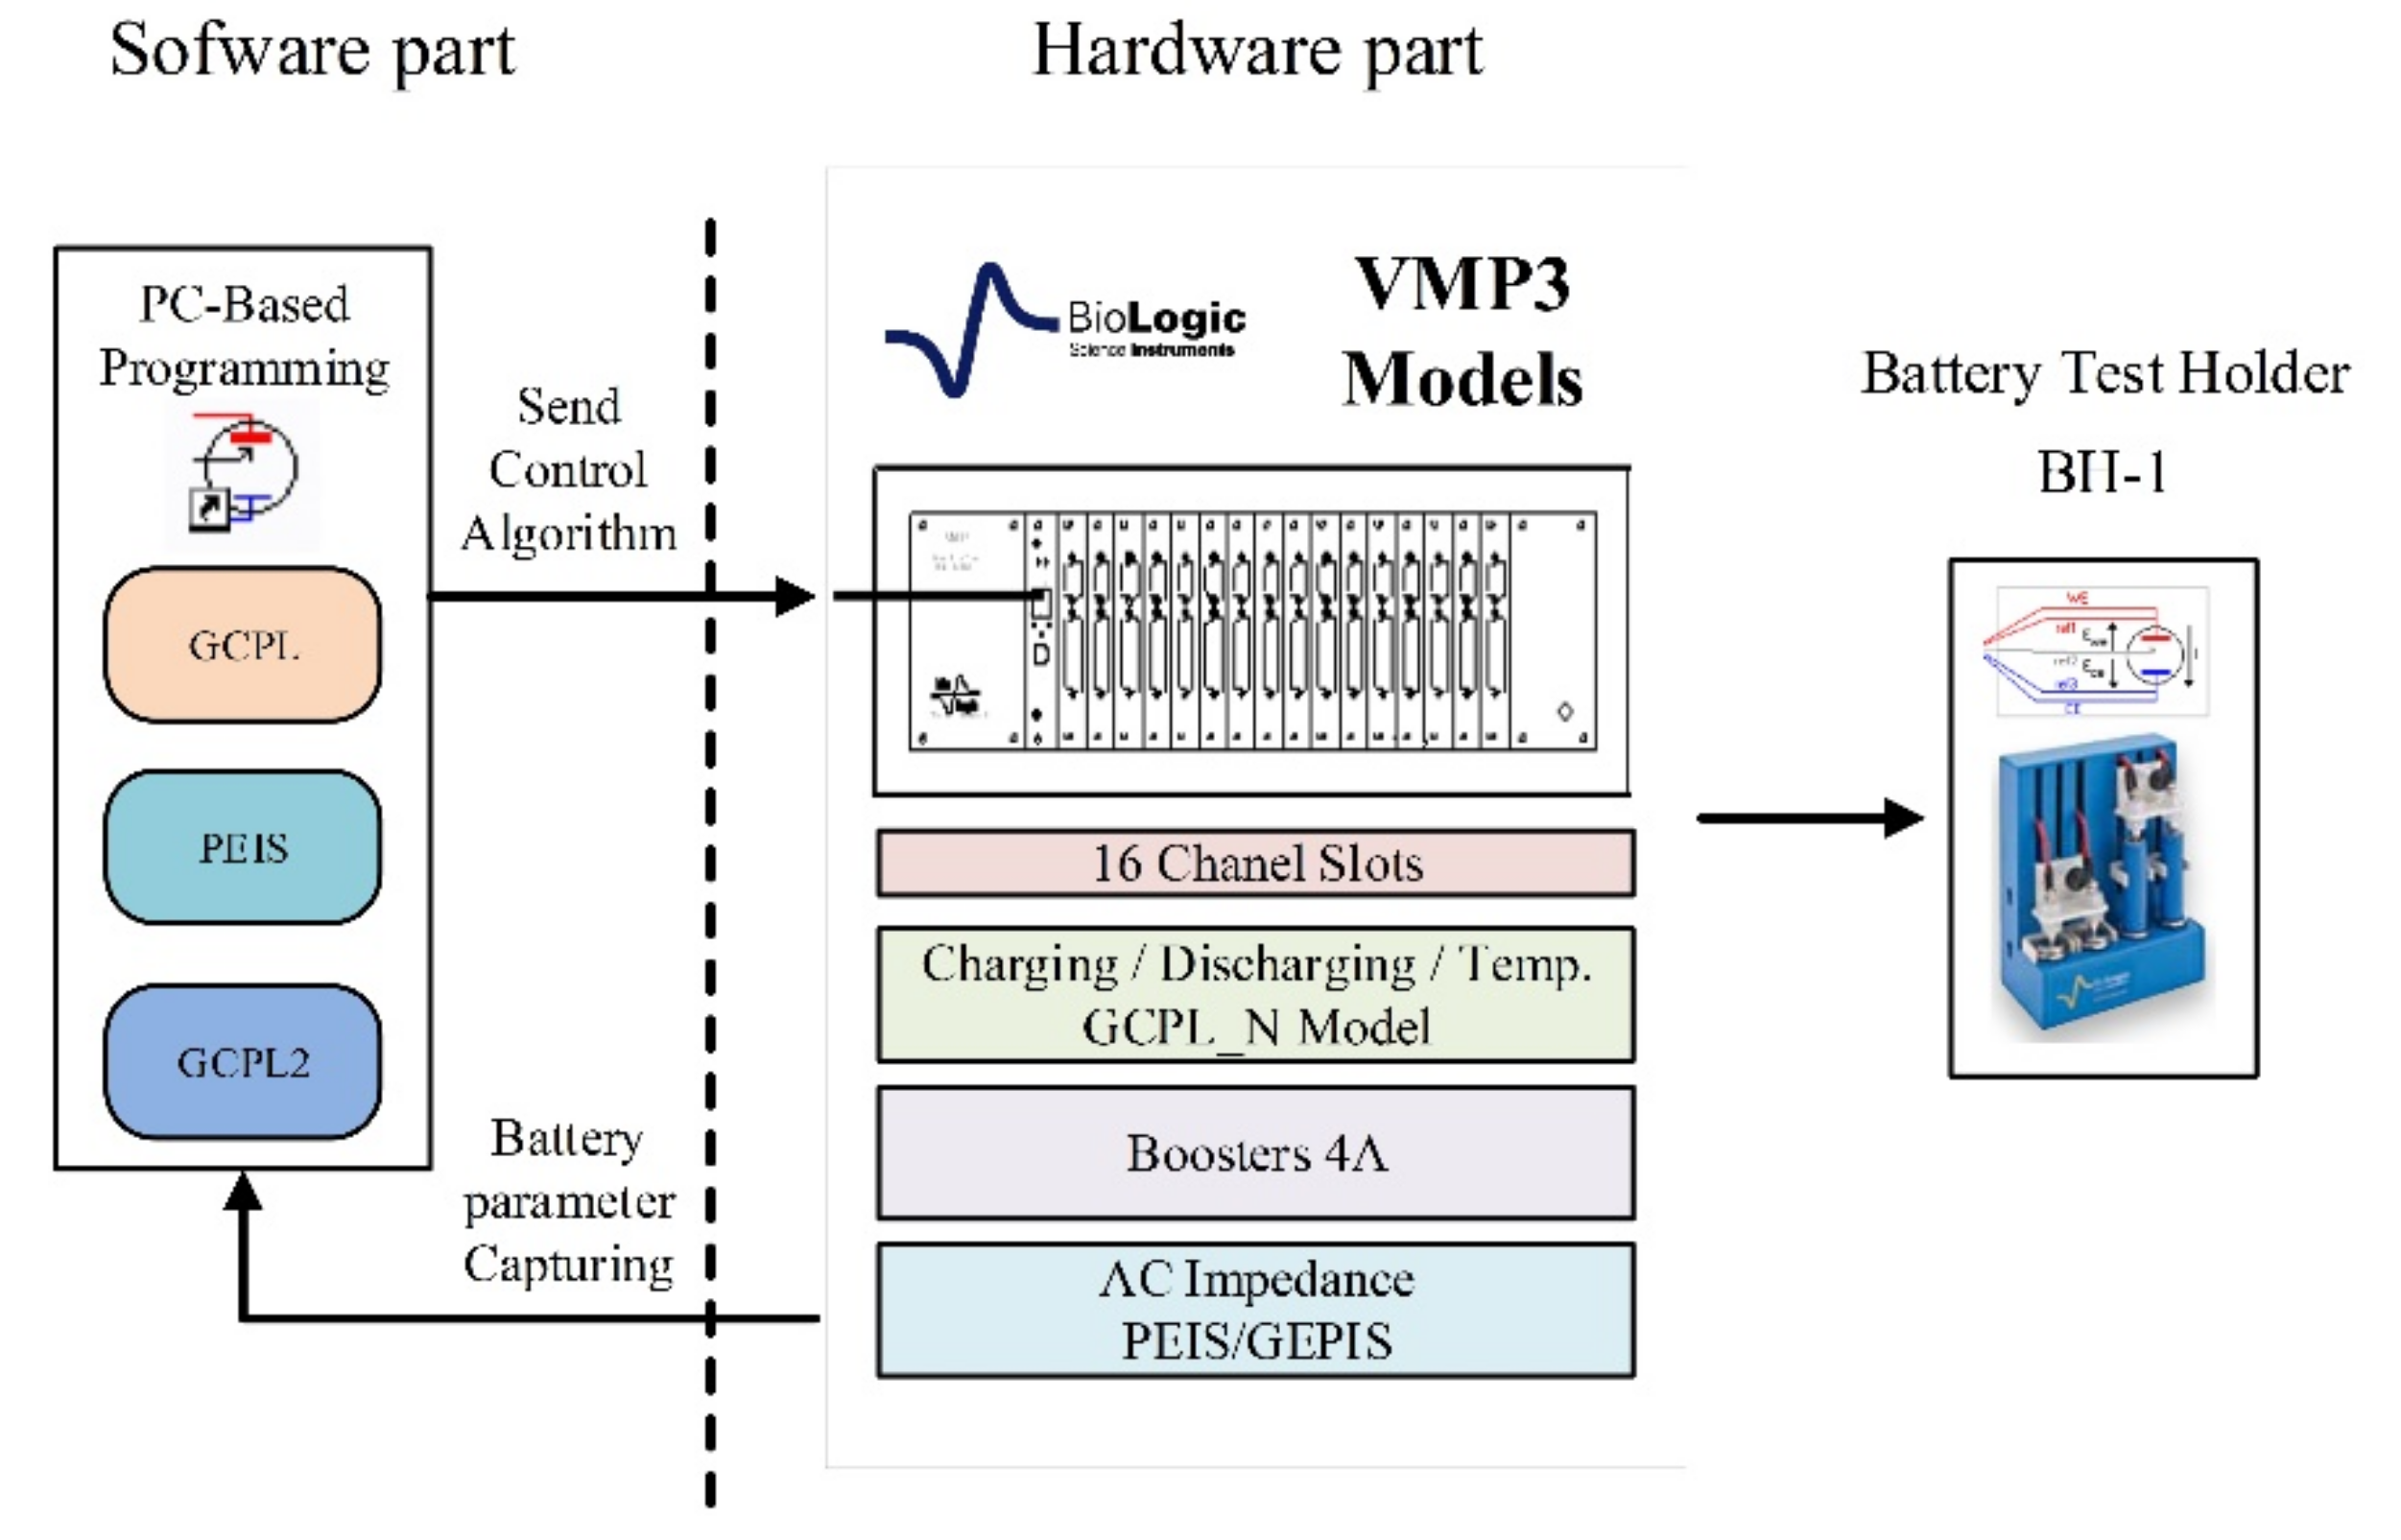
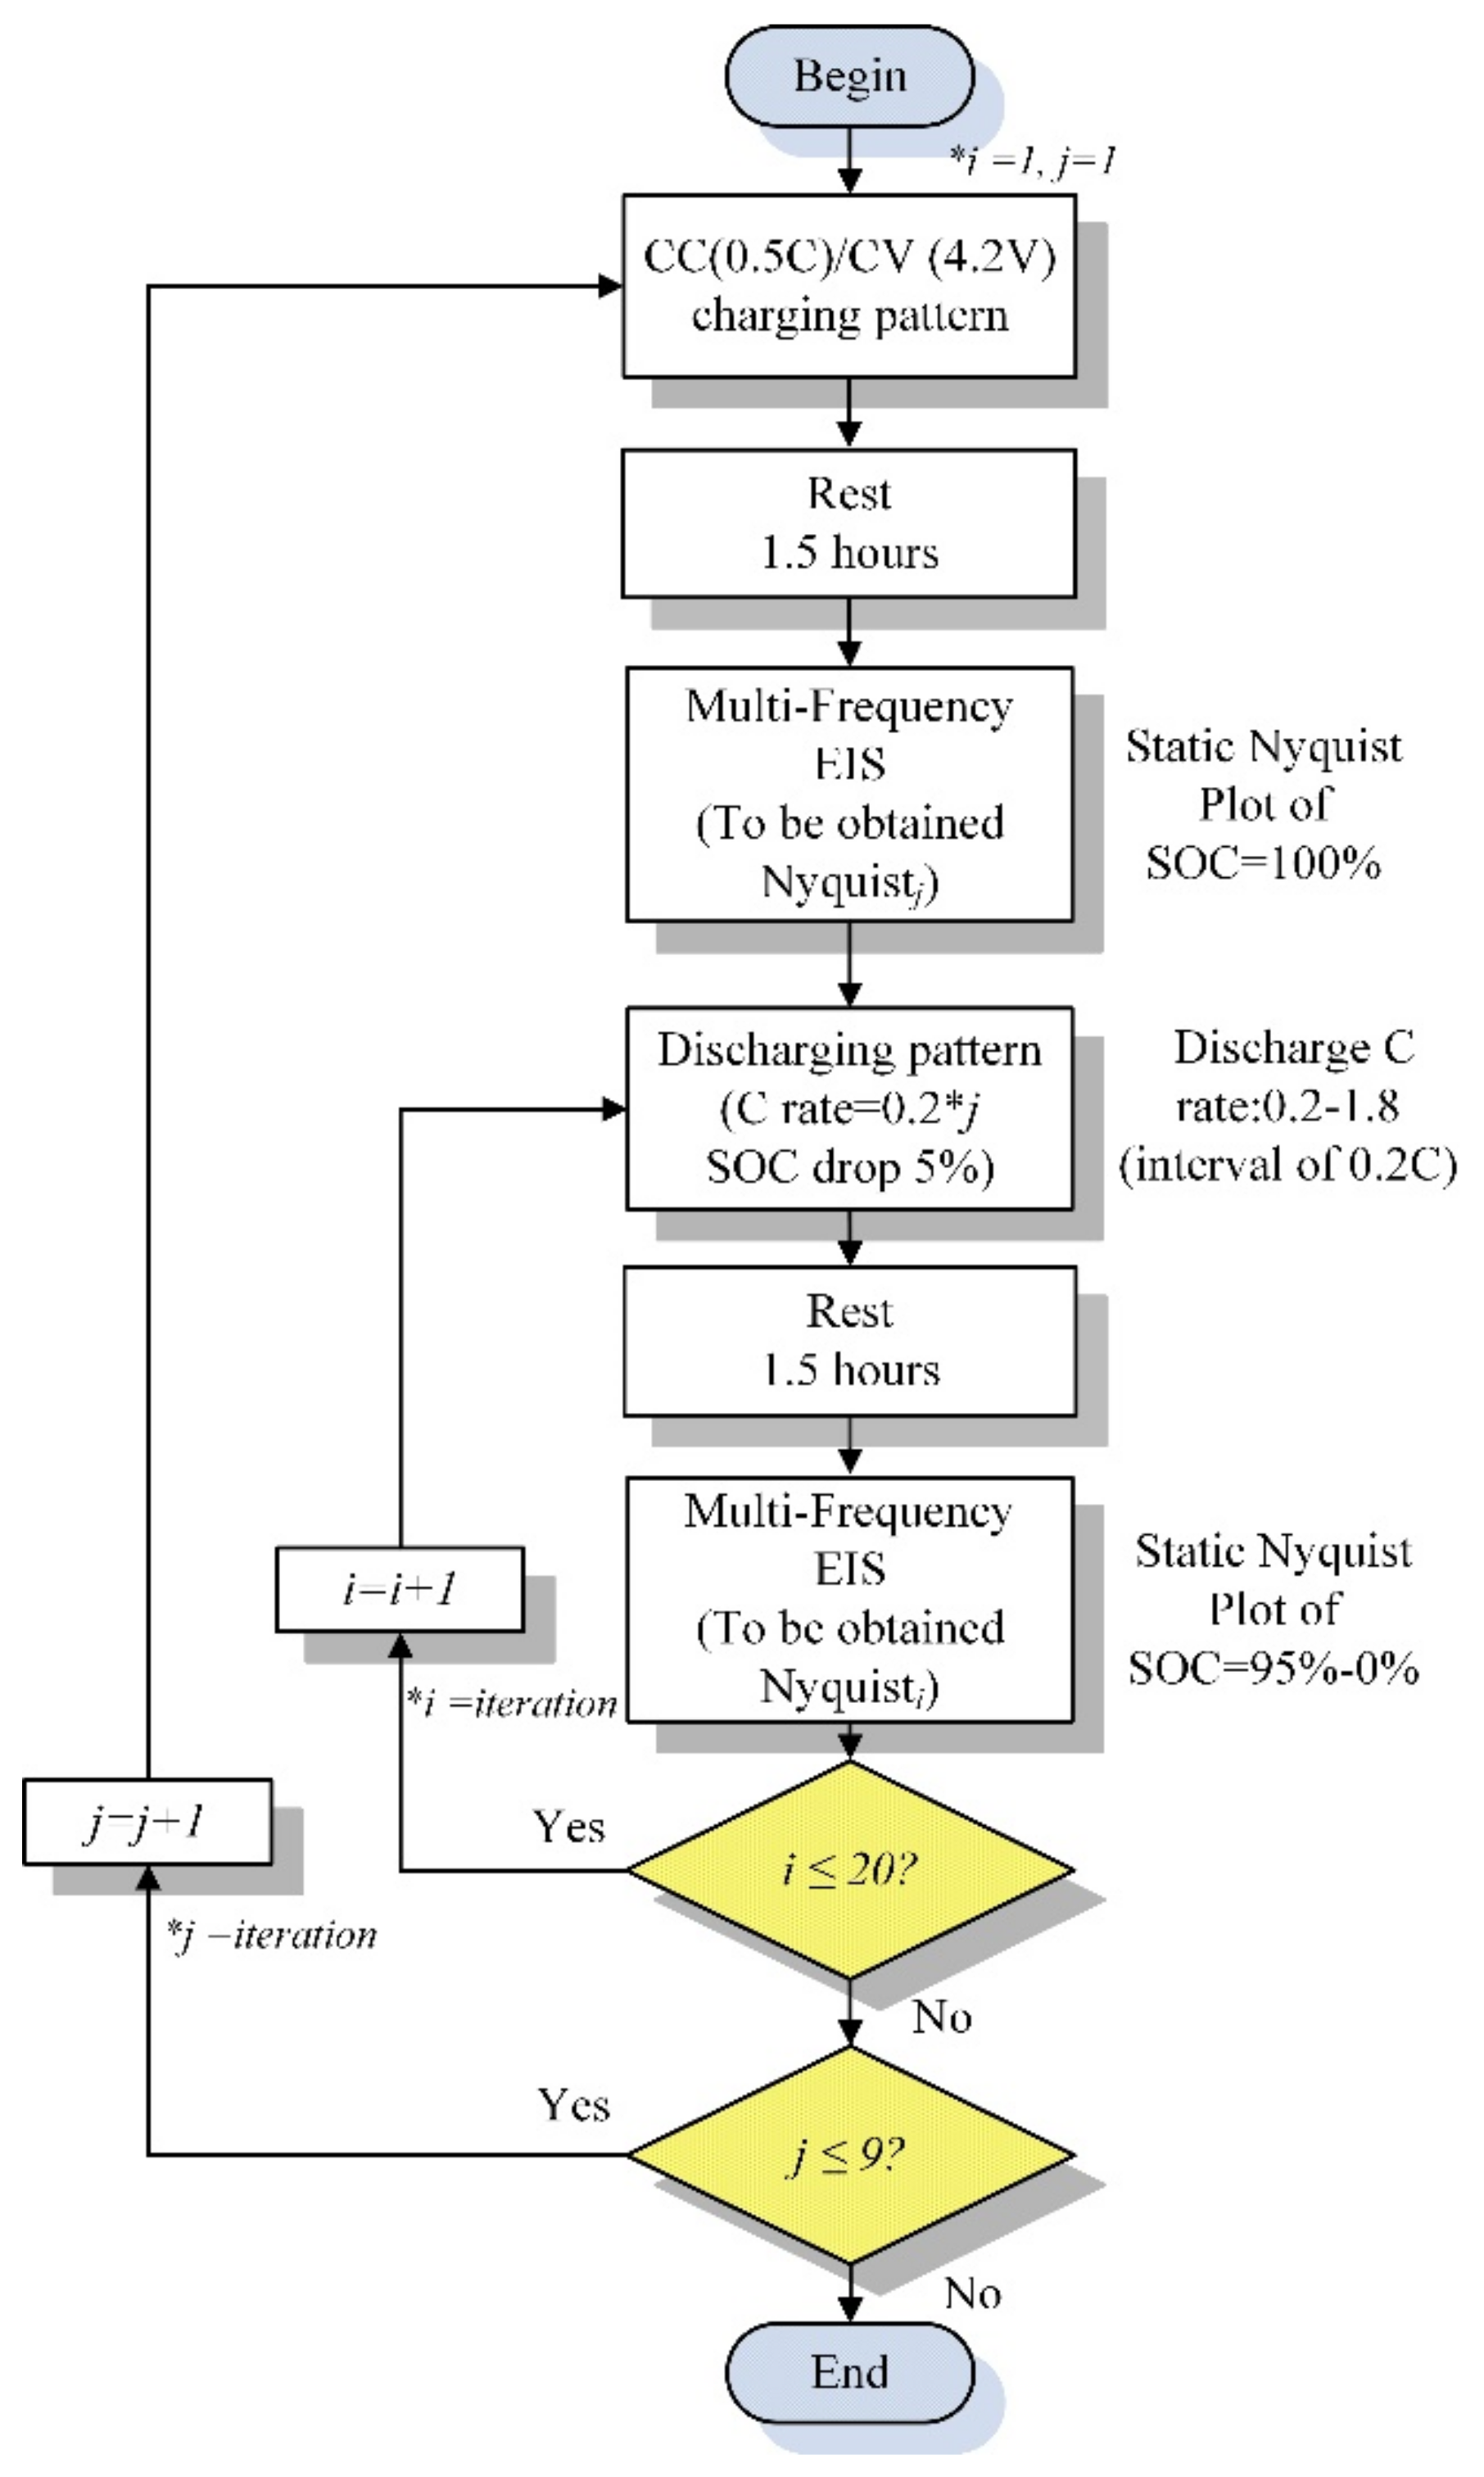
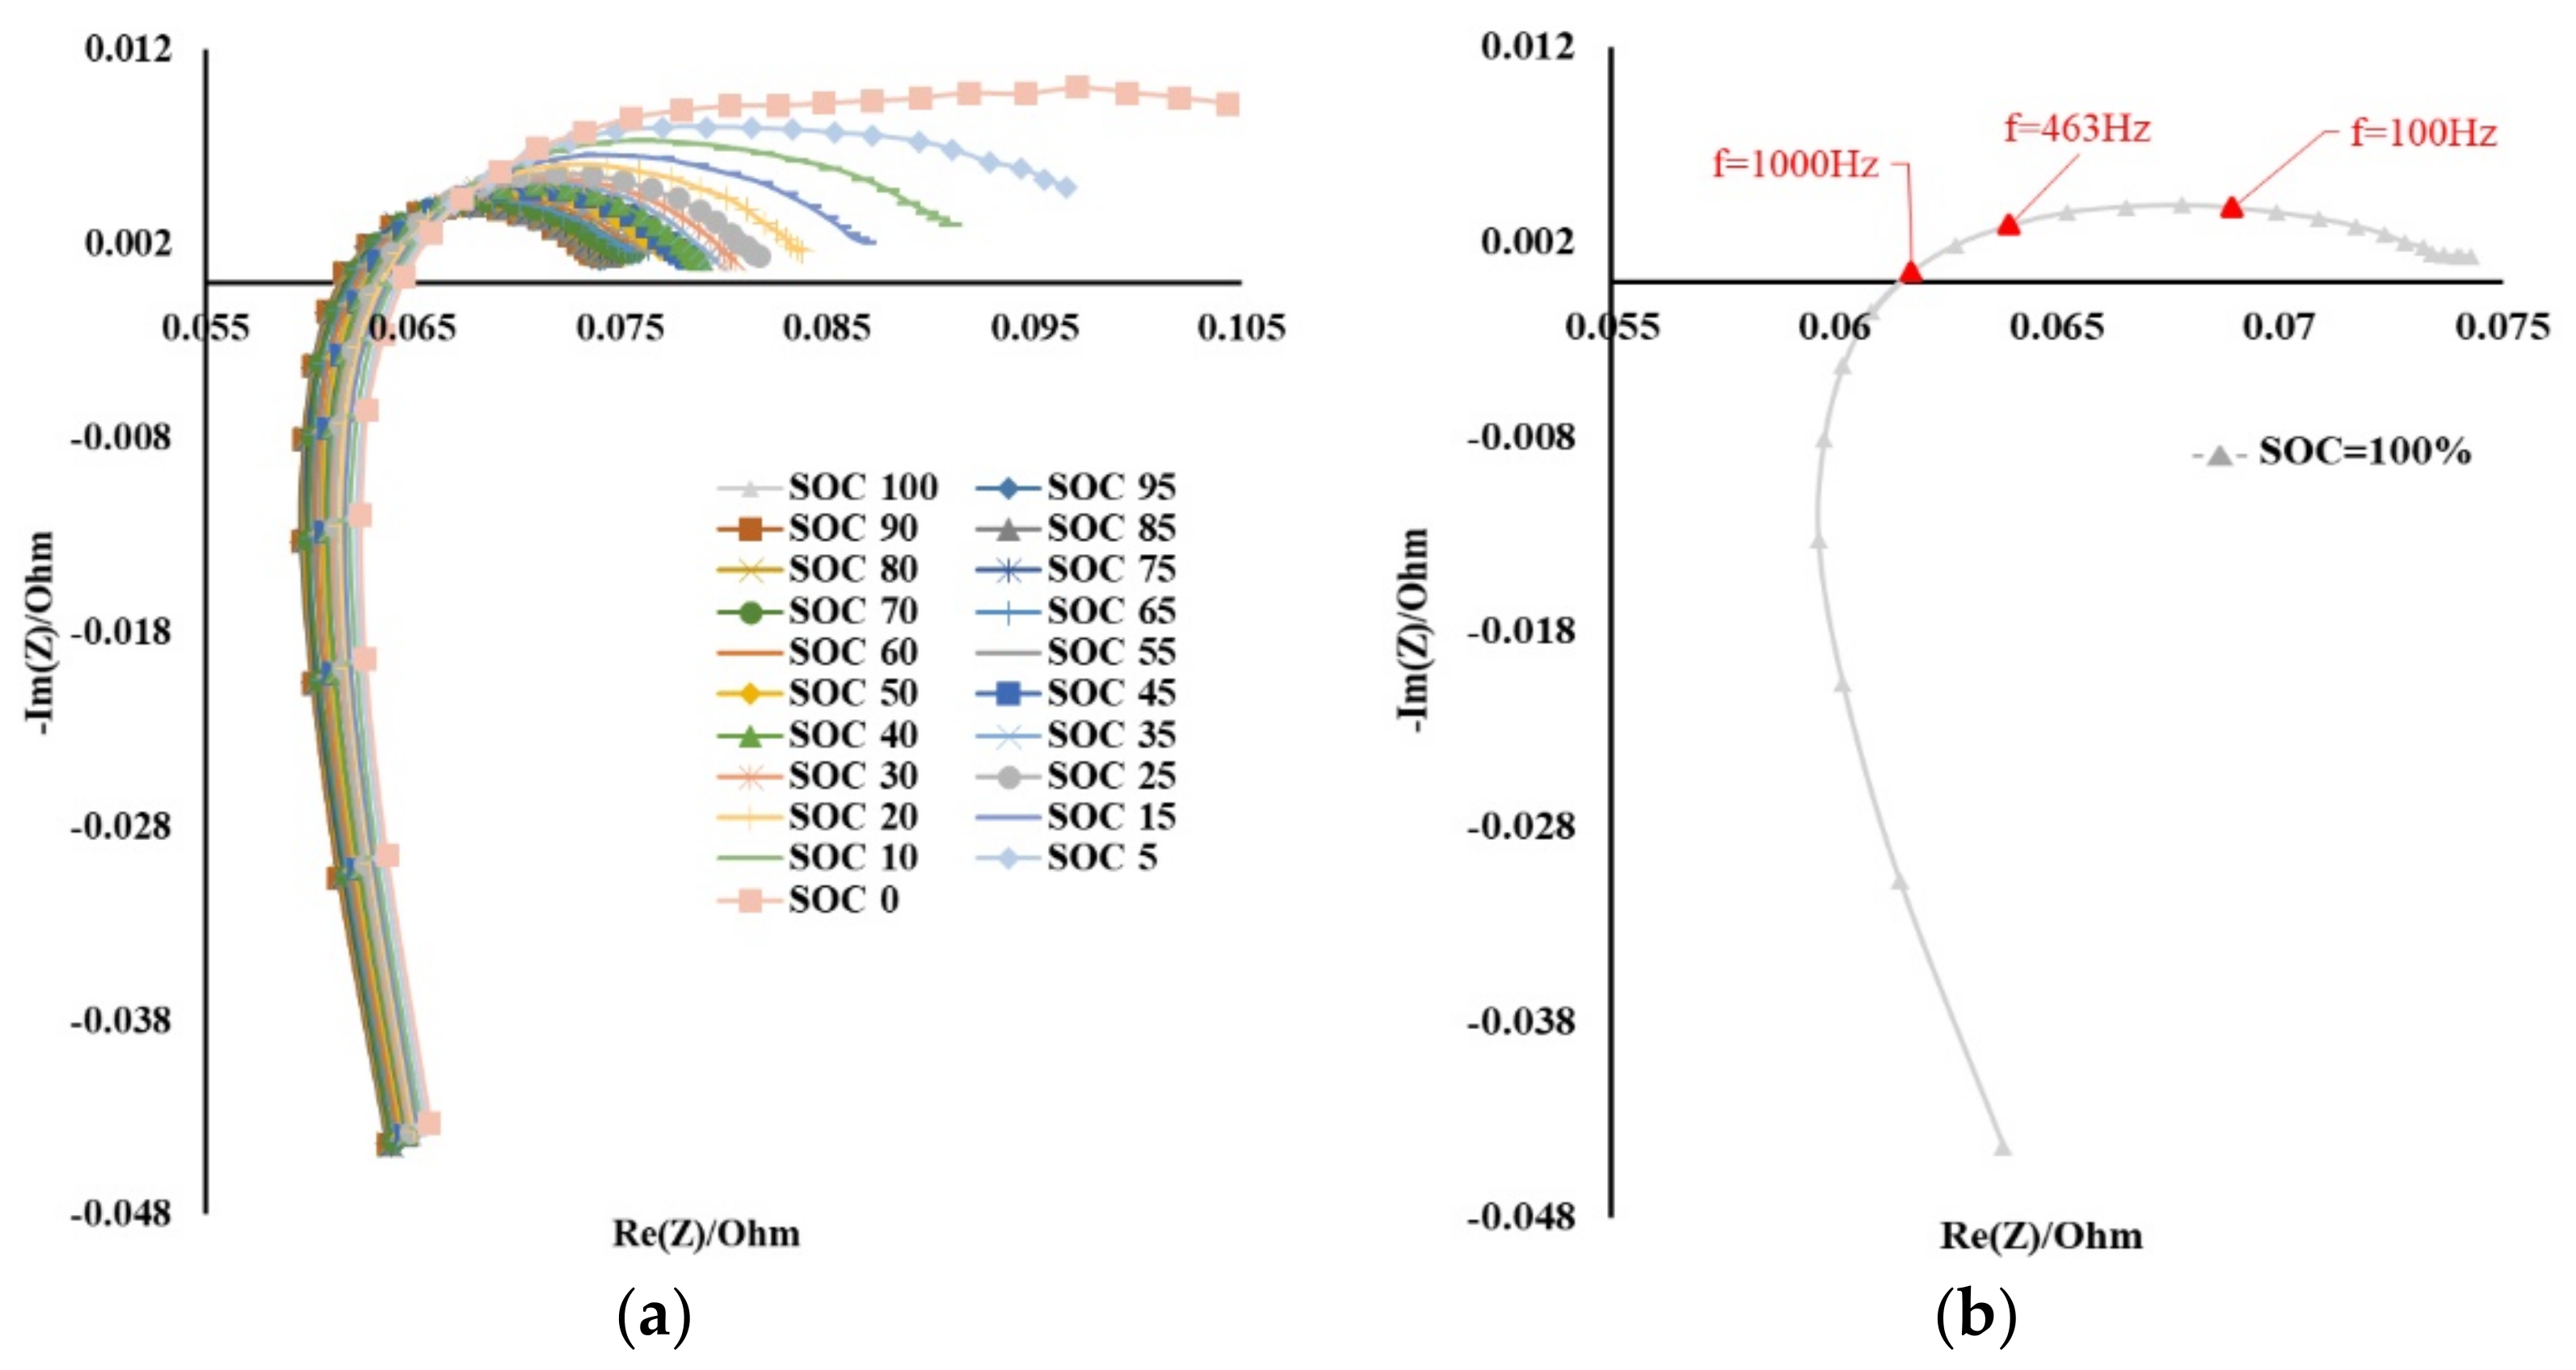
2.1. Multi-Frequency EIS Measurement

During an EIS measurement, a small perturbing AC sine wave of voltage or current is applied to the positive and negative electrodes of the battery. Depending on the types of analysis, EIS can be performed in either potentiostatic (constant voltage) or galvanostatic (constant current) mode [13]. Given a sinusoidal perturbation voltage in Equation (1) with the angular frequency w = 2πf.
Δ V = V a m p sin ( 2 π f t )
The oscillating current response can be obtained as in Equation (2) with a phase shift from the applied signal.
Δ I = I a m p sin ( 2 π f t θ )
Thus, the impedance is determined as:
Z = V a m p I a m p e i θ
With Euler’s formula, Equation (3) can be written as Equation (4)
Z ( w ) = V a m p e i w t I a m p e i ( w t θ ) = V a m p ( cos w t + i sin w t ) I a m p [ cos ( w t θ ) + i sin ( w t θ ) ] = Z 0 ( cos θ + i sin θ )
In this way, the impedance spectroscopy can be easily illustrated in a Nyquist plot. A single detection of battery impedance at a certain frequency generates a single point in a Nyquist plot. Hence, multiple points of battery impedance value can be obtained from multi-frequency EIS scanning.

2.2. Multi-Frequency EIS Measurement

Figure 1a shows the impedance spectroscopy of a Li-ion cell. It is composed of a curve intersecting with horizontal axis in the high frequency region, a semicircle in the medium frequency region, and a straight line in the low frequency region. Figure 1b shows the equivalent circuit model of the Li-ion battery where Ro is solution resistance, Rct is charge transfer resistance, Cd is double layer capacitance, Zw is Warburg impedances, and Ld is an electrode inductance, respectively [31]. The link between impedance spectroscopy and the equivalent circuit model can be summarized as follows: The high frequency region at several kHz reflects battery’s inductance Ld. The medium frequency region ranges from Hz to kHz is regarded as kinetic control region where resistance Ro, a charge transfers resistance Rct, and a double layer capacitance Cd are involved. In the low frequency region between Hz to mHz, also called Mass transfer control, Warburg impedances Zw is presented.
A potentiostat from Bio-Logic VMP3 (Bio-Logic SAS: 4, rue de Vaucanson Seyssinet-Pariset—France) is employed to perform constant current/constant voltage (CC/CV) charging, discharging, and multi-frequency EIS detection. One can design a charging/discharging schedule and place Li-ion battery in battery testing rack for multi-frequency EIS analysis. After the cycling schedule is completed, the measurement data, such as voltage, current, impedance, temperature, and capacity, will be recorded in computer via the VMP3 module, as shown in Figure 2 and analyzed with EC-Lab software.

3. ANN-Based Model Introduction

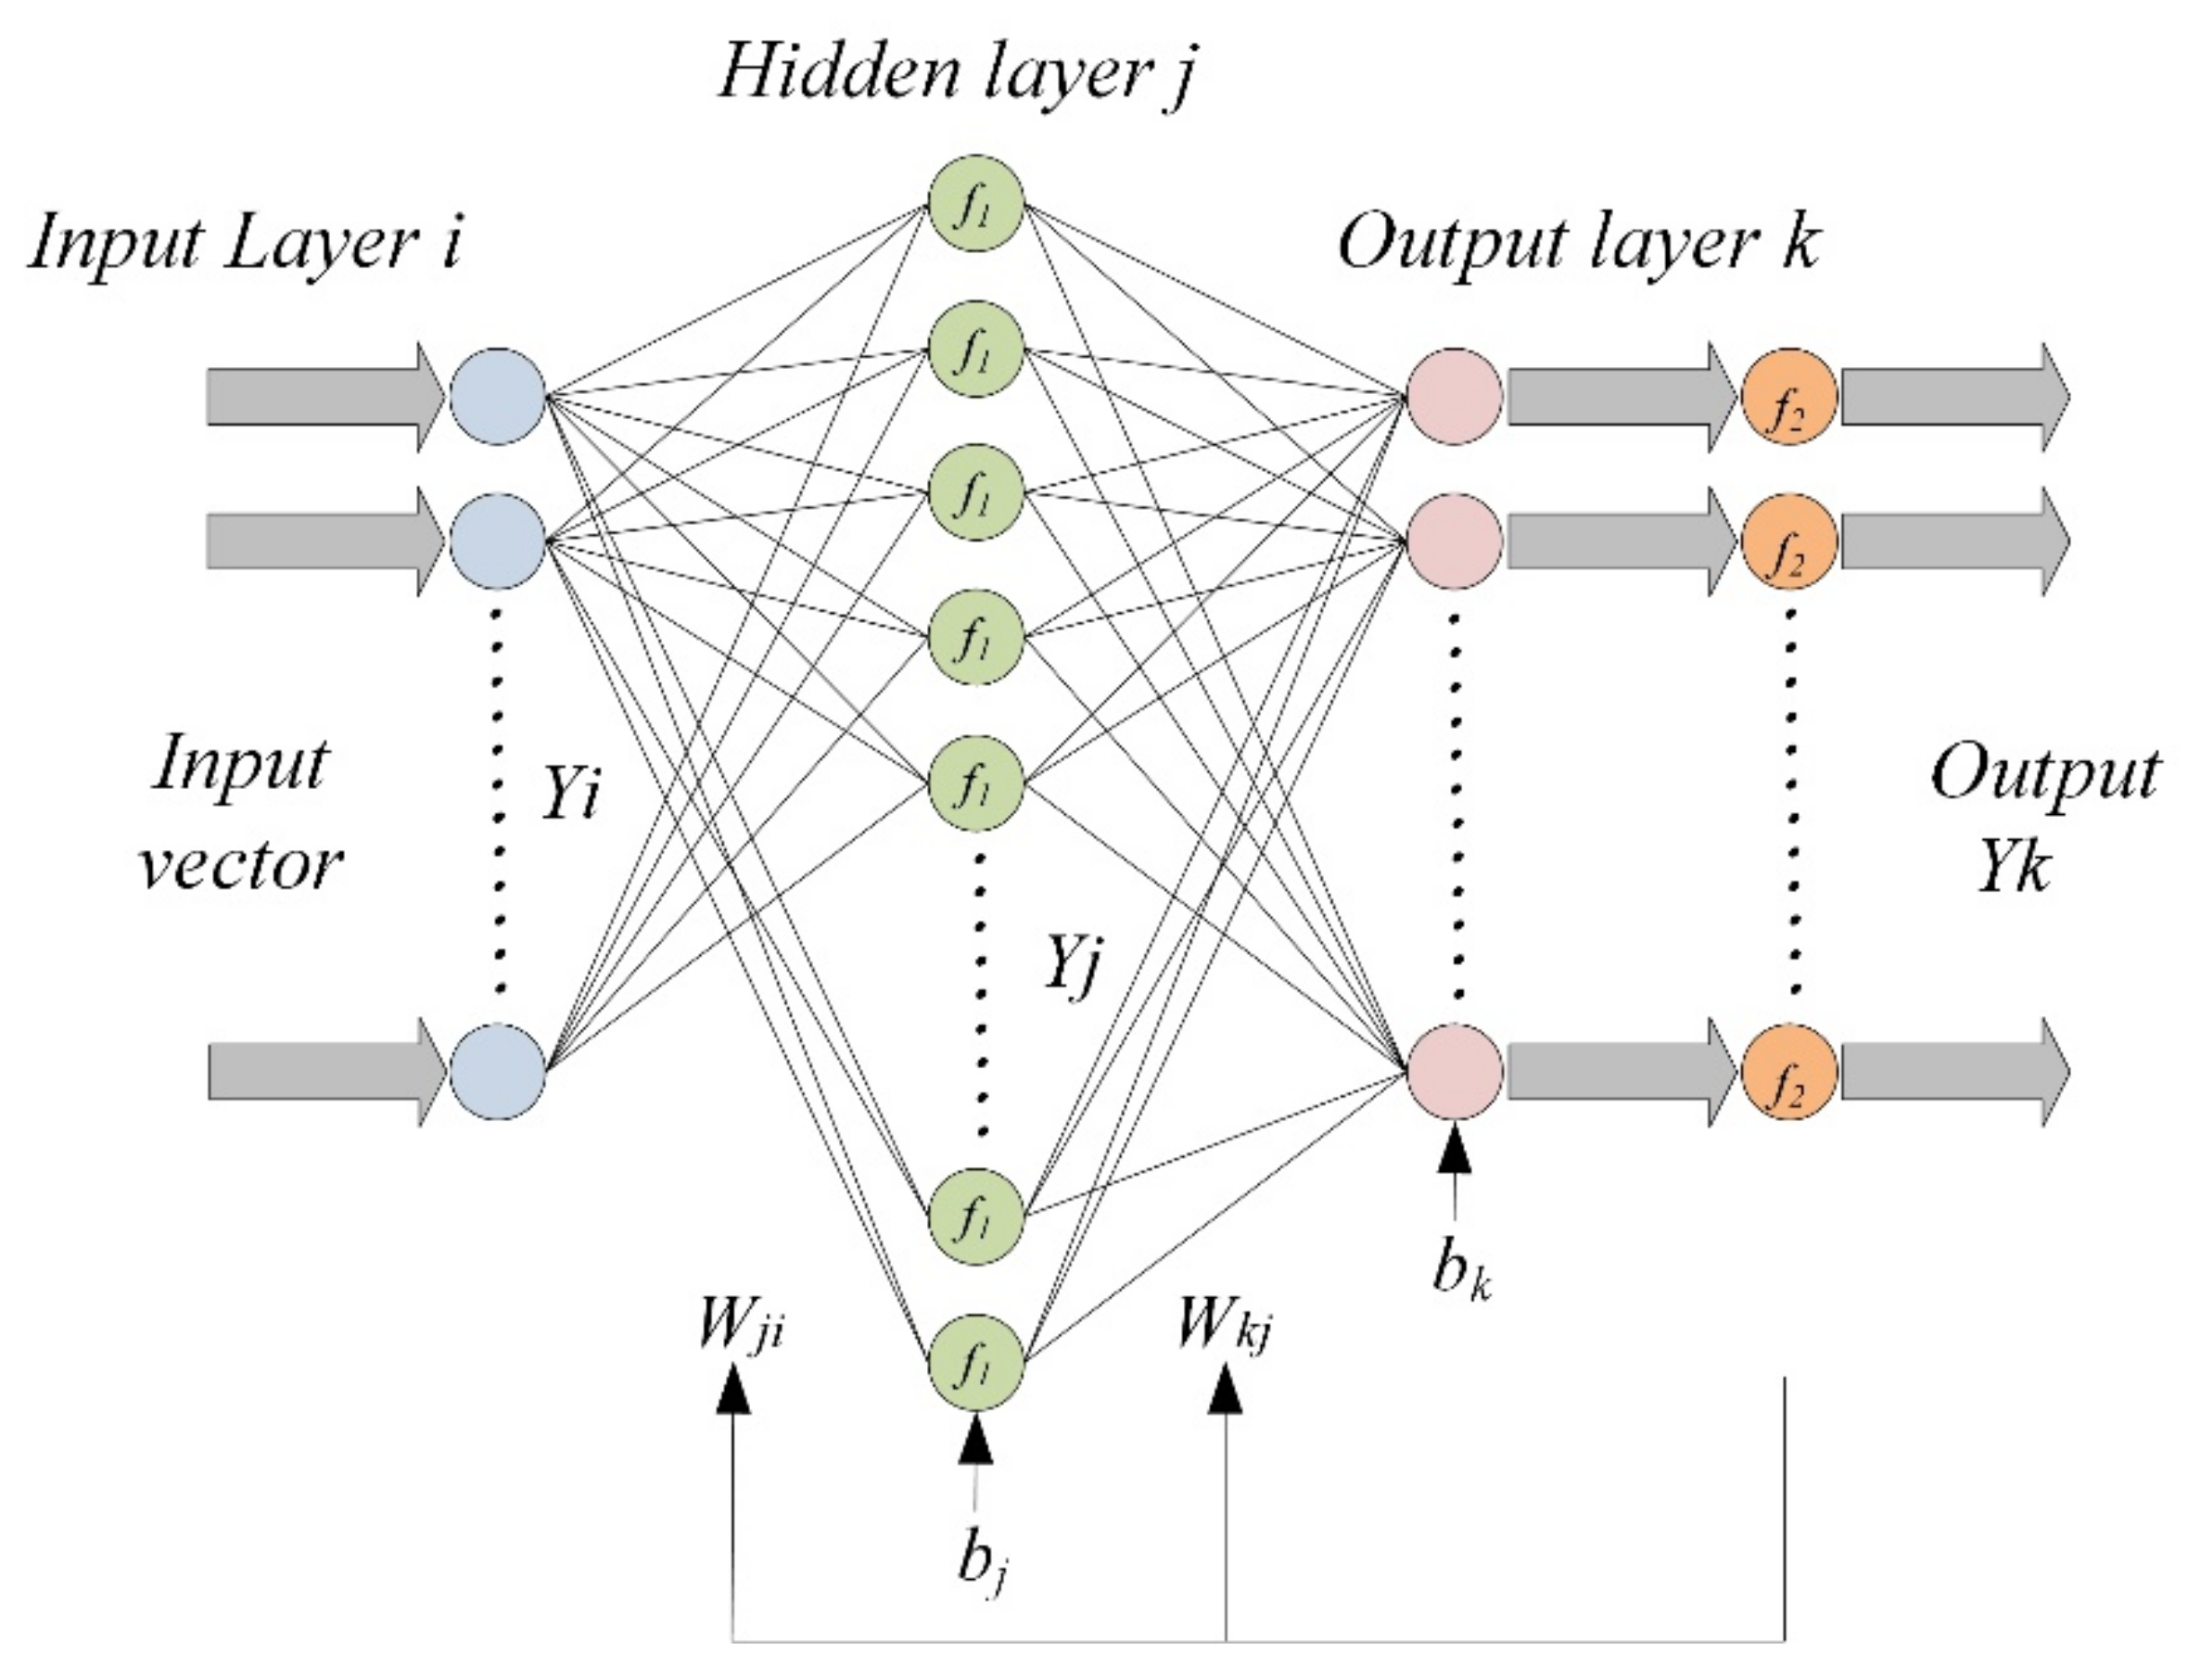
3.1. ANN-Based Basic Introduction

ANNs are inspired from biological neural systems and are built to simulate the behaviors of biological neuron in mathematical. Without the prior knowledge of the system’s internal dynamics, ANN is able to solve nonlinear problems, such as classification, clustering, and pattern recognition. ANN is often used in complex conditions where mathematical model is not completed or difficult to derive. This paper has utilized the ANN model to estimate the SOC based on the information of static AC impedance. The proposed method is beneficial from high adaptability of the ANN model under the varying operating condition.
An individual artificial neuron is a basic unit where computations are performed. The basic model of an artificial neuron with m inputs. Similar to a biological neuron, an artificial neuron also has several inputs and outputs. Weightings are associated with the inputs and they determine the stimulus or affect to the output. If the value of weighting is large, the connected neurons are easy to be excited, hence cause strong impact on the output. On the contrary, when the weighting is relatively small, the less influence is on the neural network. In this way, update the weightings properly means training a network to achieve the desired output prediction. The relationship between the input and output signal can be expressed as Equation (5).
Y j = f ( i W j i X i + θ j )
where Yj is output variable of the neuron model, f represents an activation function of the neuron model, Wji represents the weighting, θj represents the bias and Xi is input variable of the neuron model.

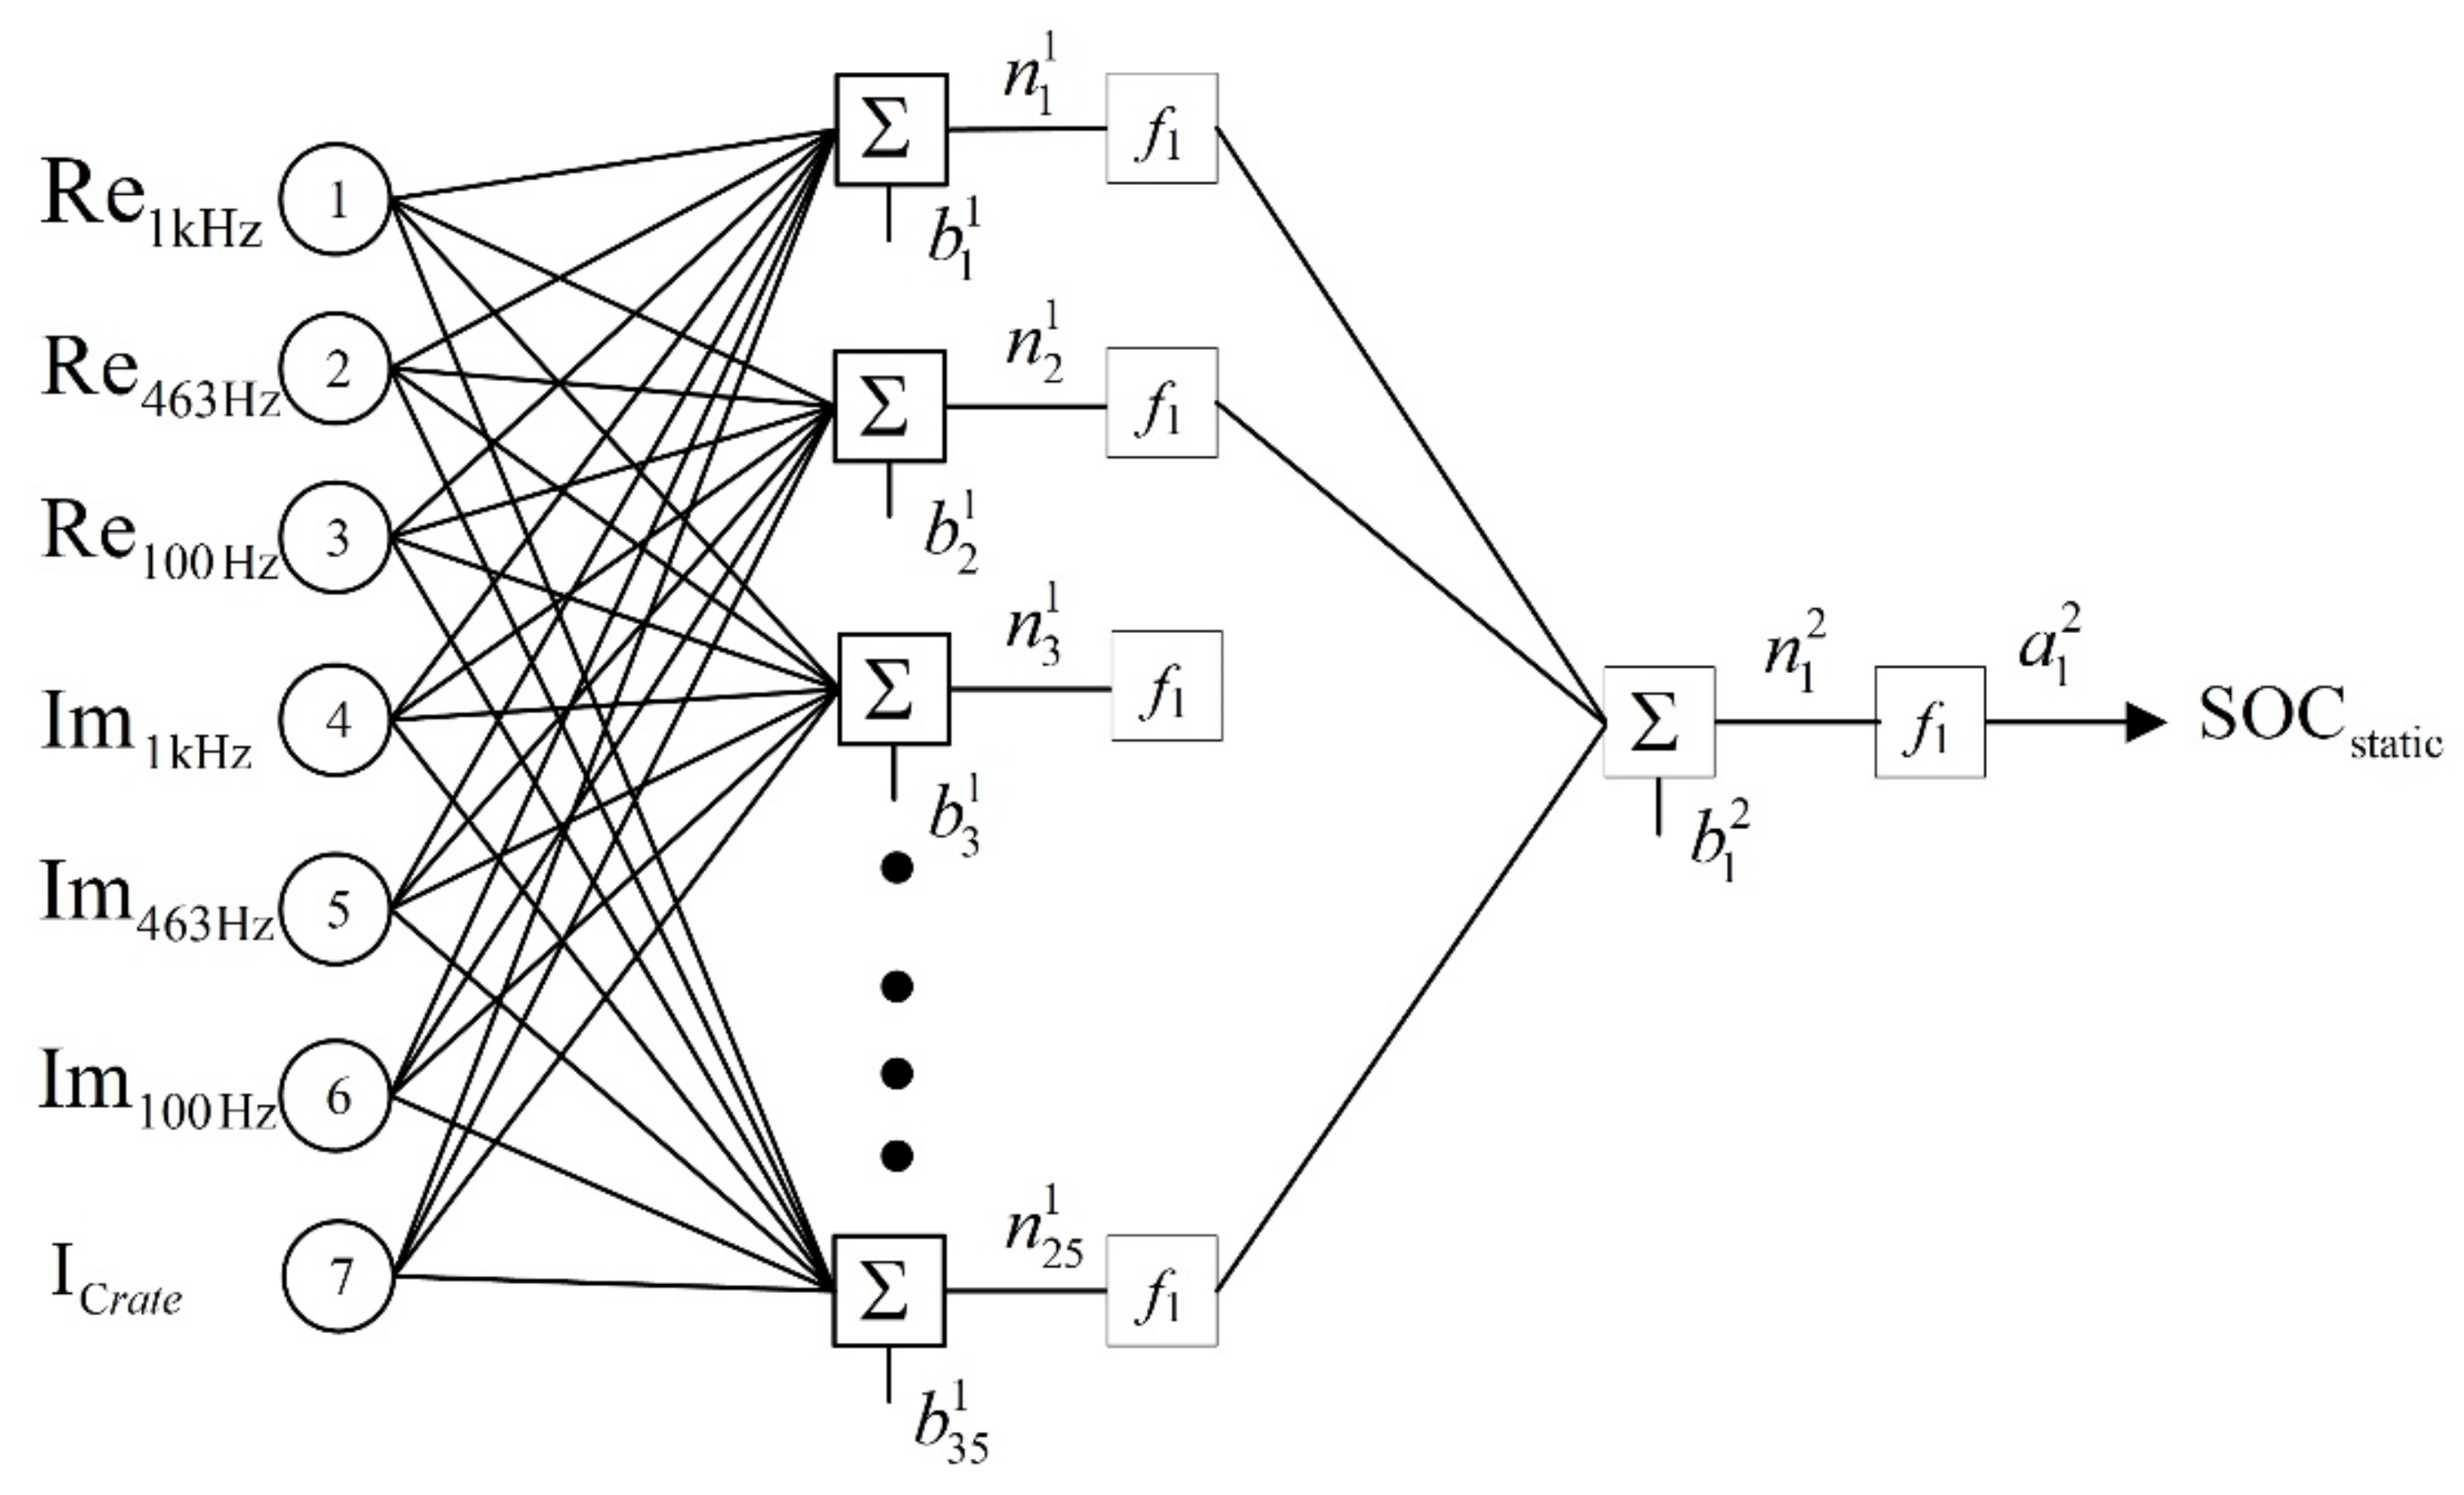
3.2. Back-Propagation Neural Network Design

In general, an ANN network is composed of several layers, including the input layer, hidden layer and output layer. In each layer, there are nodes, also known as neurons. Every node between the layers is connected by weightings. These weightings determine which input signal and how much degree of the input signal affect the final outcome. Through updating the weightings properly, the ANN is able to consistently reflect the desired output with the input of observation dataset.
Given a three-layer feed-forward neural network as shown in Figure 3, there are i neurons in the input layer, j neurons in the hidden layer and k neurons in the output layer [15]. The output of the network can be calculated using the Equations (6) and (7).
Y j = f 1 ( ( Y i × w j i ) + b j )
where Yj represents the output from the jth neuron in the hidden layer. wji is the input weight between the ith neuron of input layer and the jth neuron of hidden layer, bj represents the bias to the jth hidden layer neuron and f1 represents the hidden layer activation function.
Y k = f 2 ( ( Y j × w k j ) + b k )
where Yk represents the kth output, wkj represents the weight between the jth neuron of hidden layer and the kth neuron of output layer, bk the output layer bias and f2 represents the output layer activation function [15].
In this paper, back-propagation is applied as the learning mechanism for the proposed model. Initially, the weights and bias are initialized randomly in [1, −1]. With the dataset input to the network, the outputs can be obtained. The outputs are compared with the actual value and the errors (or predefined cost function) are generated. The errors are then fed back through the network. These errors serve as the key information to adjust the weightings and biases to make the output close to the desired value. The new weightings wji for each layer is calculated by (8). [15] On the other hand, error is calculated in (9), which is the dot product of output Yk, the complement of Yk and the difference between output tk and Yk.
w j i = w j i + l r × e k × Y i
where wji is the previous weight, lr learning rate, ek the error term calculated during the iteration.
e k = Y k   × ( 1 Y k ) × ( t k Y k )
where ek is error, tk is the corresponding target and Yk is output.
After repeating the processes for a sufficient number of training cycles, the network is able to converge to the state with the minimum error. In this way, the proposed ANN model is designed and trained for the SOC estimation. The detailed parameters and demonstration of the ANN model is given in Section 4.2.

4. Design of ANN-Based Model for Multi-Frequency Impedance

The ANN-based model design for multi-frequency EIS includes three parts: Firstly, a static SOC database for ANN training is prepared. Secondary, a BPN model is built. Third, testing the BPN model of the training completed.

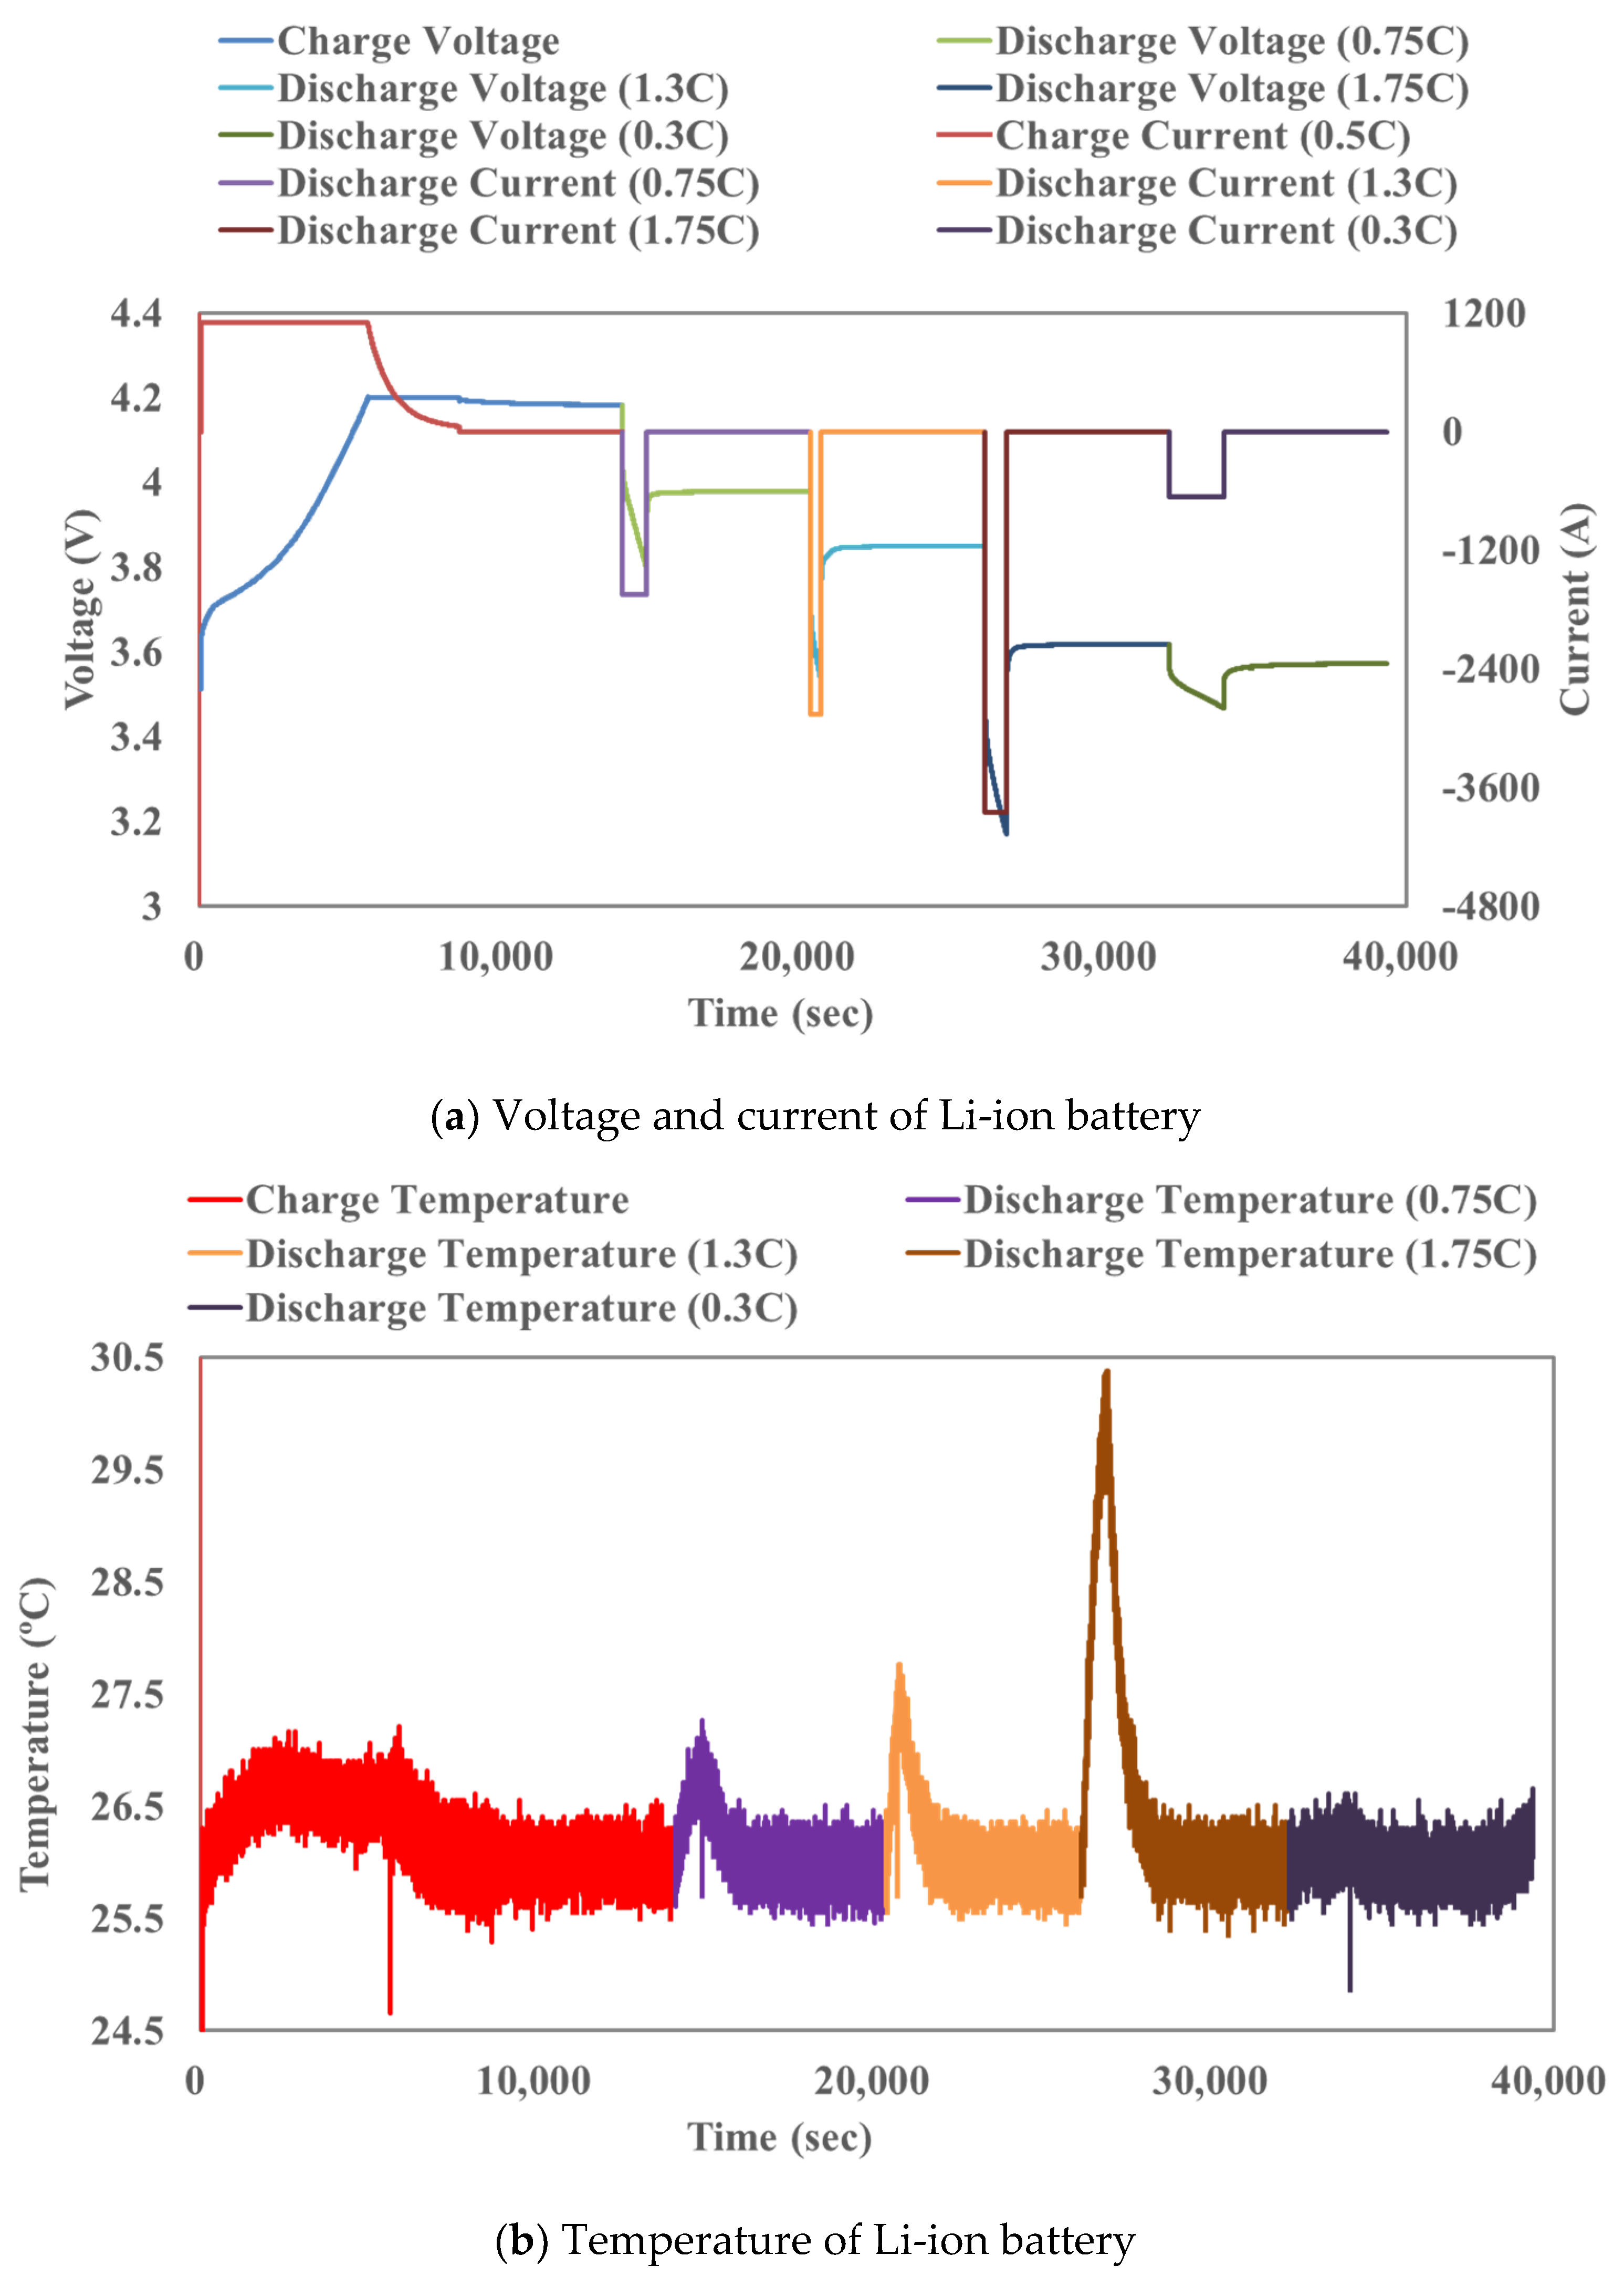
4.1. Static SOC Database of ANN-Based Model for Li-ion Battery

This paper used the cylindrical rechargeable Li-ion battery LG18650 to carry out the research of static SOC estimation. The Li-ion battery has rated capacity 2200 mAh and nominal voltage 3.6 V. During the charging and discharge process, multi-frequency EIS are measured by a Bio-Logic VMP3 potentiostats/galvanostats device at 25 °C as shown in Figure 2. However, there is a lack of accurate mathematical model describing the relationship between SOC and its AC impedance characteristics on a Nyquist plot. As a result, ANN’s high adaptability makes it a promising technique to realize SOC estimation via AC impedance observation. To realize nonlinear mapping with ANN, training turns out to be an important task. The network is expected to learn from sample observations, namely input-output pairs, and adapt itself to reflect the desired target. For ANN, the process of learning involves adjusting the weights of the network to minimize the observed errors. Therefore, ANN must have sufficient samples to ensure the training quality.
Figure 4 shows the flowchart to collect the static SOC training data of Li-ion battery. Firstly, the Li-ion battery is charged to 100% SOC with CC/CV. After having a rest for 1.5 h, the multi-frequency EIS is measured to obtain a static Nyquist plot of 100% SOC. An AC signal with amplitude of 10 mV is used to perform the multi-frequency EIS on Li-ion battery. The impedance spectrums are measured by sweeping frequency between 1 Hz and 10 kHz with 6 points/decade. Next, the discharging rate ranging from 0.2 C-rate to 1.8 C-rate with the interval of 0.2 C is configured. For each discharging rate, when battery is discharged for 5% SOC’s reduction, it would rest for 1.5 h and perform EIS measurement. The discharging process finishes until SOC is 0%. Therefore, the static Nyquist plot of Li-ion battery with the interval of 5% SOC can be obtained. In this way, there are combinations of 21 states of battery SOC and 9 levels of discharge current. Eventually, 189 datasets in total can be used as a database for ANN training.
The measurement results are illustrated in a Nyquist plot, such as Figure 5. Figure 5a shows the impedance results of different SOC with the discharging 0.2 C-rate. From Figure 5a, it can be observed that major difference of SOC locates at medium frequency region ranging from several Hz to kHz. To extract the features of different SOC from Nyquist plot and simplify the input parameters for ANN, static AC impedance at frequency 1 kHz, 463 Hz, 100 Hz as shown in Figure 5b are determined for input parameters. Namely, Re (Zac, f = 1000 Hz), Re (Zac, f = 463 Hz), Re (Zac, f = 100 Hz), Im (Zac, f = 1000 Hz), Im (Zac, f = 463 Hz), Im (Zac, f = 100 Hz).

4.2. Establishing a BPN Model

In Figure 6, this paper uses the BPN to estimate SOC of a Li-ion battery. This paper designs a three-layer feed-forward backpropagation architecture with the input layer, hidden layer, and output layer. The surface temperature data of Li-ion battery is ignored for the static SOC estimation. Because the Li-ion battery surface temperature keeps the same as the ambient temperature after 1.5 h rest. The input information for ANN includes six inputs of static AC impedance and one input of discharge C-rate. The desired output is the estimated SOC of Li-ion battery. Therefore, the number of the input nodes is 7, the number of the output node is 1, and the number of hidden layer nodes is 35.
For the proposed ANN model, the Tansig function given in Equation (10) is used as the transfer function in the hidden layer as f1. Thus, the output of the hidden layer is scaled between −1 and 1. The transfer function f2 in output layer is Purlin function. Other parameters for the three-layer BPN are given in Table 1 This paper used the Graphic User Interface (GUI) of MATLAB to implementation the ANN-based model.
a = e n e n e n + e n = T a n s i g n

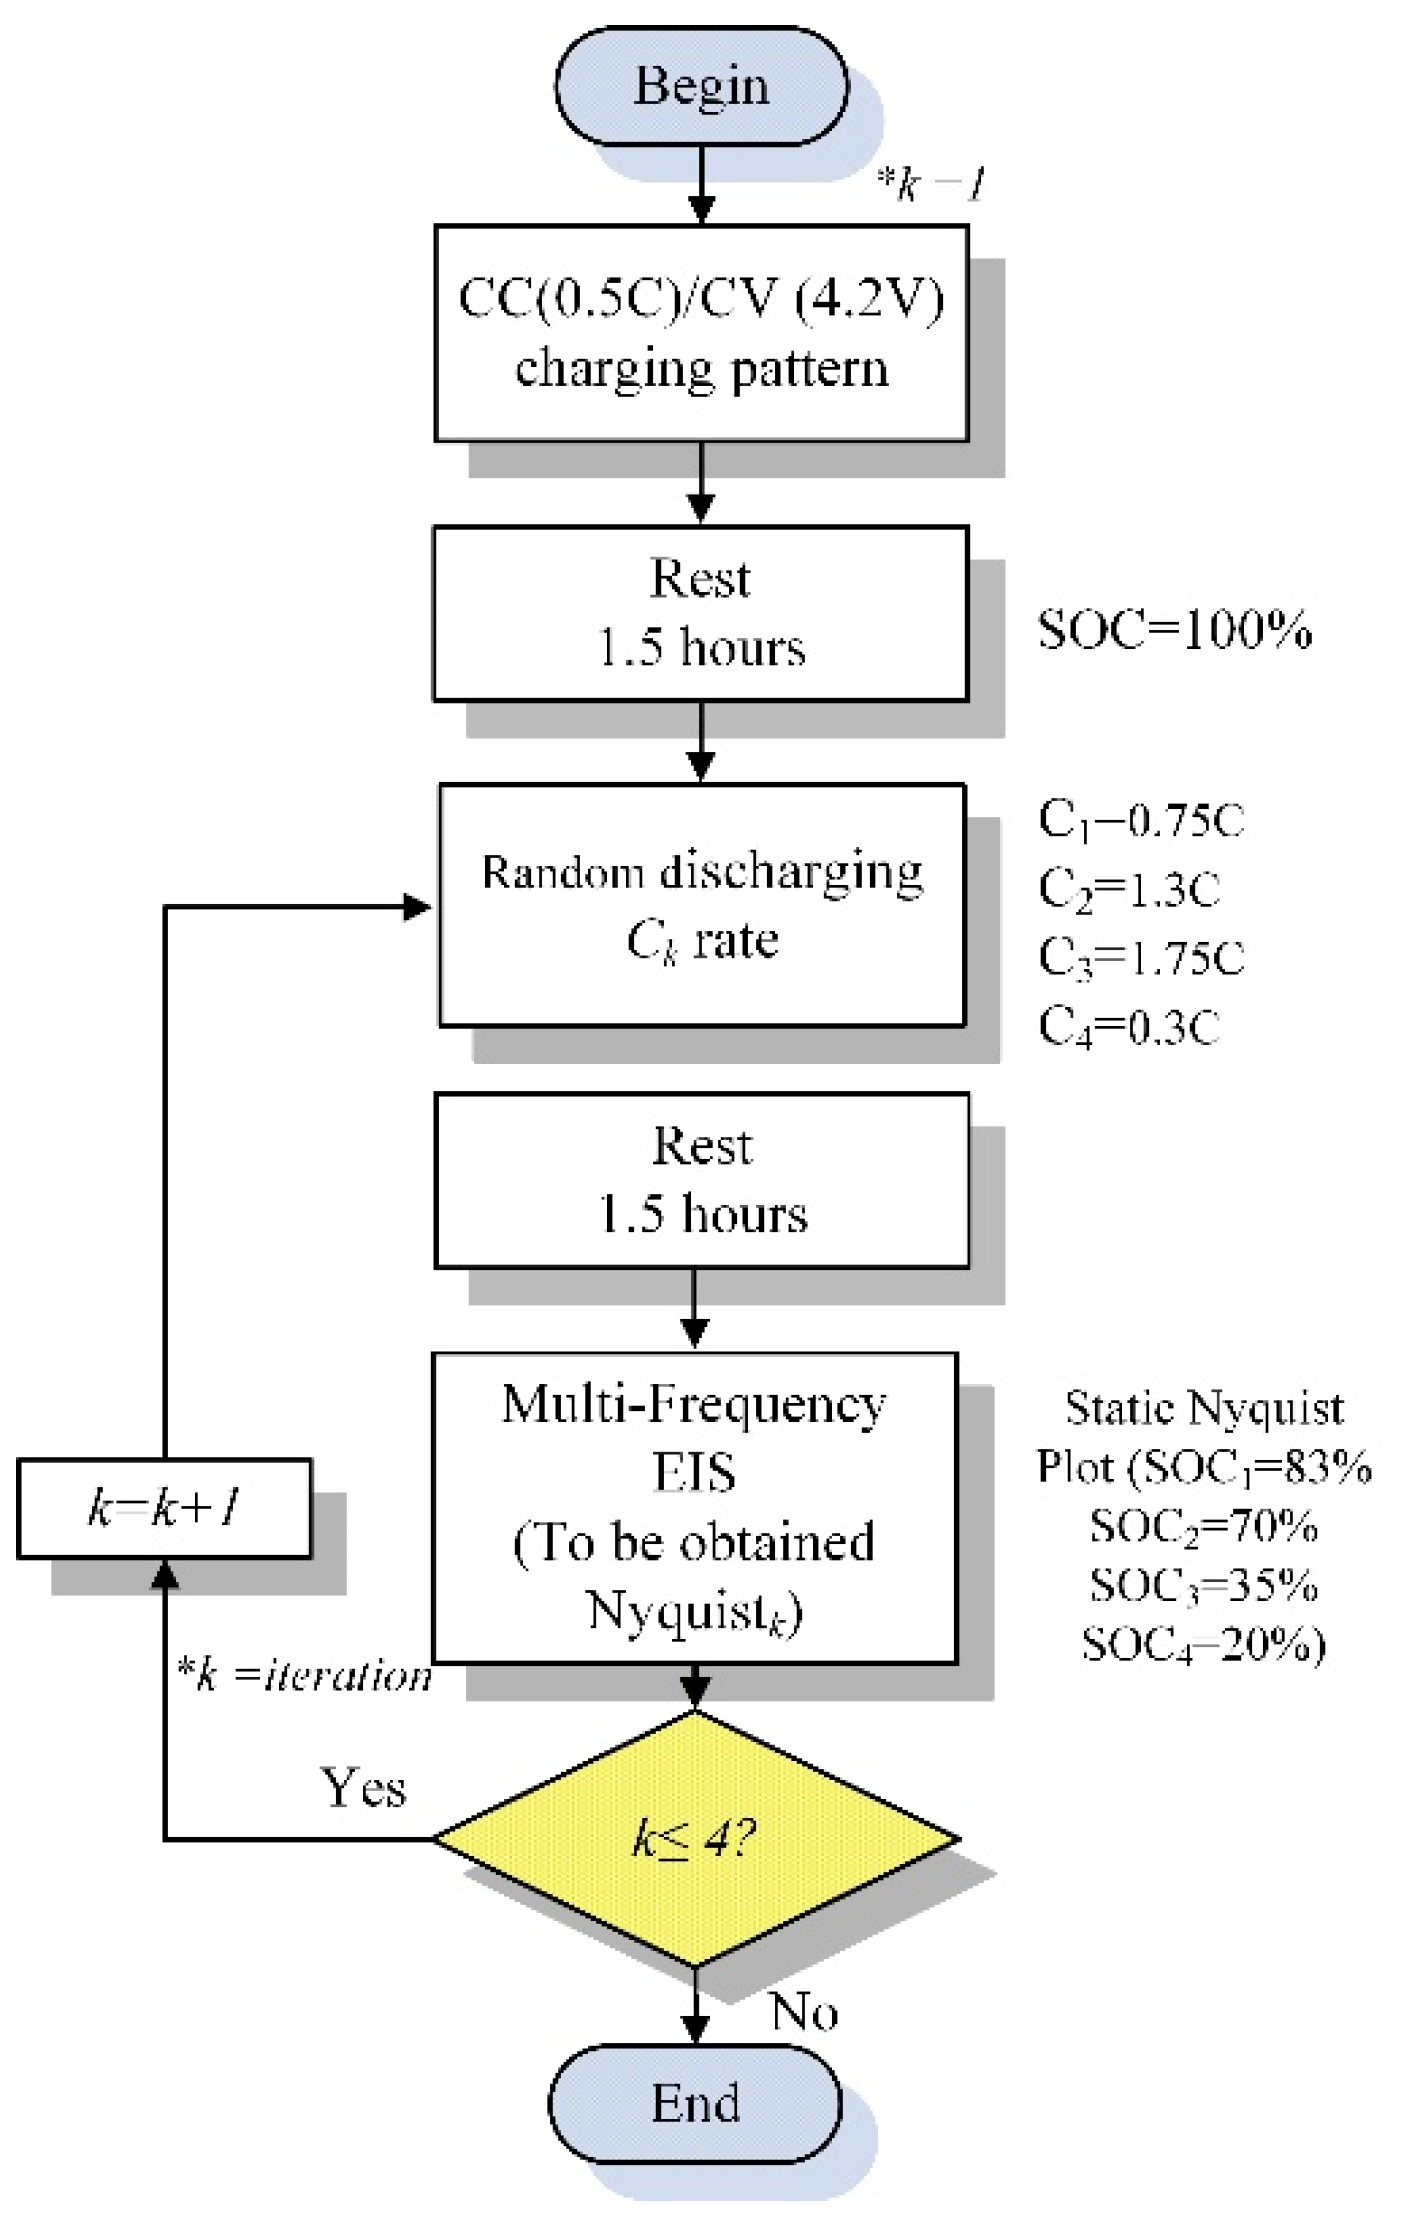
4.3. Testing the BPN Model of the Training Completed

In order to validate the proposed BPN network, the datasets for testing are not included in the training datasets. The testing data are imported to the BNP network using GUI tool of MATLAB and the estimated SOC is obtained through the ANN. An error is computed as in Equation (11) by comparing the actual SOC of the Li-ion battery and the estimated SOC by the ANN.
S O C e r r o r = ( S O C r e a l S O C t a r g e t ) 2 S O C t a r g e t × 100 %

5. Experimental Results

To verify the effectiveness of the proposed method, the experiment with a set of random discharging current is demonstrated. Figure 7 shows a flowchart of the experiment to validate the proposed ANN model with 4 arbitrary discharging currents. Firstly, Li-ion cell is charged using CC/CV until SOC is equal to 100%. Next, the battery cell will rest for 1.5 h to reach to static state. Then, Li-ion battery will discharge to a predefined level of SOC with 4 different discharging currents of 0.75 C, 1.3 C, 1.75 C, and 0.3 C, respectively. After each discharge process is completed, the battery cell will take a rest for 1.5 h to ensure the static state. After that, the multi-frequency EIS technique is used to obtain the AC impedance parameters of the Li-ion battery.
The parameters obtained from the experiments are given in Table 2 The information of discharging C-rates, AC impedance are input to the trained ANN model.
The output of the ANN model is compared with predefined target value to evaluate its accuracy in Table 3.
Figure 8a,b shows voltage, current, and cell surface temperature waveforms during the process of CC/CV charging and four periods of discharging. From Figure 8b, the temperature settled down to approximately 25 °C after a 1.5 h rest between the discharging processes of different current. As a result, temperature is not taken as the inputs for ANN model.
To look into the effect caused by the number of neurons, 5 difference scenarios are investigated. They are ANN model with 15, 20, 25, 30, and 35 neurons in the hidden layer, respectively. Table 3 shows the estimation result for each scenario. The output estimated SOC is compared with the target SOC, and the error is calculated by Equation (11). The maximum, minimum and average error are given in the Table 4 as well. It can be observed that the averaged errors are within 5% except the result from the model of 15 neurons. Among them, the model with 35 neuron has the best average accuracy error of 1.9%. As a result, 35 neurons are employed in the proposed method for SOC estimation.

6. Conclusions

This paper has proposed an ANN-based SOC estimation method. The multi-frequency EIS technique is used to collect the AC impedance of the Li-ion battery in advance, and the measurement results of EIS are taken as the training data for the BPN-based model. A set of random discharging currents are used in an experiment to validate the effectiveness of the proposed method. The estimated results are compared with the target SOC value and the error is computed to evaluate the estimation performance. Moreover, this paper discusses the effect of the number of the neurons on the prediction result. Five different scenarios with different numbers of neurons in the hidden layer are demonstrated. The results show that except the model of 15 neurons, the model with 20, 25, 30, 35 neurons can achieve the accuracy with the error lower than 5%. Additionally, the model with 35 neurons has the highest accuracy with the average error less than 2%. In conclusion, the proposed ANN-based multi-frequency EIS technique is able to estimate static SOC under an arbitrary discharging current with high accuracy.

Author Contributions

Y.-F.L. made considerable contributions in this research; Y.-F.L. proposed the ideas and research concepts and completed the battery characteristic experiments, construction of the simulation and the experimental platform, analysis of the experimental data, and writing of the manuscript. Y.-F.L. is responsible for the integrity of the work as a whole. The authors has read and agreed to the published version of the manuscript.

Funding

This research received no external funding.

Institutional Review Board Statement

The study did not require ethical approval.

Informed Consent Statement

The study did not require informed consent statement.

Data Availability Statement

The data presented in this study are available on request from the corresponding author.

Acknowledgments

This work was supported by the Information and Communications Research Laboratories, Division for Biomedical & Industrial IC Technology, Green Electronics Design & Application Dept, Industrial Technology Research Institute (ITRI) and Ministry of Science and Technology Taiwan under the grant number of MOST 108-2218-E-011-025_.

Conflicts of Interest

The authors declare no conflict of interest.

References

  1. Lee, S.; Kim, J.; Lee, J.; Cho, B. State-of-charge and capacity estimation of lithium-ion battery using a new open-circuit voltage versus state-of-charge. J. Power Sources 2008, 185, 1367–1373. [Google Scholar] [CrossRef]
  2. Weng, C.; Sun, J.; Peng, H. A unified open-circuit-voltage model of lithium-ion batteries for state-of-charge estimation and state-of-health monitoring. J. Power Sources 2014, 258, 228–237. [Google Scholar] [CrossRef]
  3. Tong, S.; Klein, M.P.; Park, J.W. On-line optimization of battery open circuit voltage for improved state-of-charge and state-of-health estimation. J. Power Sources 2015, 293, 416–428. [Google Scholar] [CrossRef]
  4. Roscher, M.A.; Assfalg, J.; Bohlen, O.S. Detection of Utilizable Capacity Deterioration in Battery Systems. IEEE Trans. Veh. Technol. 2011, 60, 98–103. [Google Scholar] [CrossRef]
  5. Ressela, S.; Billa, F.; Holtza, L.; Janshena, N.; Chicab, A.; Flowera, T.; Weidlichc, C.; Struckmanna, T. State of charge moni-toring of vanadium redox flow batteries using half cell potentials and electrolyte density. J. Power Sources 2018, 378, 776–783. [Google Scholar] [CrossRef]
  6. Vega, M. Single-Cell Impedance Track™ Gas. Gauge for Novices; Texas Instruments Application Report; Texas Instruments: Dallas, TX, USA, 2007; pp. 1–9. [Google Scholar]
  7. Chiang, Y.-H.; Sean, W.-Y.; Ke, J.-C. Online estimation of internal resistance and open-circuit voltage of lithium-ion batteries in electric vehicles. J. Power Sources 2011, 196, 3921–3932. [Google Scholar] [CrossRef]
  8. Coleman, M.; Lee, C.K.; Zhu, C.; Hurley, W.G. State-of-Charge Determination from EMF Voltage Estimation: Using Impedance, Terminal Voltage, and Current for Lead-Acid and Lithium-Ion Batteries. IEEE Trans. Ind. Electron. 2007, 54, 2550–2557. [Google Scholar] [CrossRef]
  9. Hung, M.-H.; Lin, C.-H.; Lee, L.-C.; Wang, C.-M. State-of-charge and state-of-health estimation for lithium-ion batteries based on dynamic impedance technique. J. Power Sources 2014, 268, 861–873. [Google Scholar] [CrossRef]
  10. Mastali, M.; Vazquez-Arenas, J.; Fraser, R.; Fowler, M.; Afshar, S.; Stevens, M. Battery state of the charge estimation using Kalman filtering. J. Power Sources 2013, 239, 294–307. [Google Scholar] [CrossRef]
  11. Mawonou, K.S.; Eddahech, A.; Dumur, D.; Beauvois, D.; Godoy, E. Improved state of charge estimation for Li-ion batteries using fractional order extended Kalman filter. J. Power Sources 2019, 435, 226710. [Google Scholar] [CrossRef]
  12. Propp, K.; Auger, D.J.; Fotouhi, A.; Longo, S.; Knap, V. Kalman-variant estimators for state of charge in lithium-sulfur batteries. J. Power Sources 2017, 343, 254–267. [Google Scholar] [CrossRef]
  13. Huet, F. A Review of impedance measurements for determination of the sate-of charge or sate-of-health of secondary batteries. J. Power Sources 1998, 70, 59–69. [Google Scholar] [CrossRef]
  14. Huang, J.; Li, Z.; Zhang, J. Dynamic electrochemical impedance spectroscopy reconstructed from continuous impedance measurement of single frequency during charging/discharging. J. Power Sources 2015, 273, 1098–1102. [Google Scholar] [CrossRef]
  15. Kurian, S.; Krishnan, S.T.; Cheriyan, E.P. Real time implementation of artificial neural networks-based controller for battery storage supported wind electric generation. IET Gener. Transm. Distrib. 2015, 9, 937–946. [Google Scholar] [CrossRef]
  16. Xu, J.; Mi, C.C.; Cao, B.; Cao, J. A new method to estimate the state of charge of lithium-ion batteries based on the battery impedance model. J. Power Sources 2013, 233, 277–284. [Google Scholar] [CrossRef]
  17. Lipu, M.S.H.; Hannan, M.A.; Hussain, A.; Saad, M.H.M.; Ayob, A.; Blaabjerg, F. State of Charge Estimation for Lithium-Ion Battery Using Recurrent NARX Neural Network Model Based Lighting Search Algorithm. IEEE Access 2018, 6, 28150–28161. [Google Scholar] [CrossRef]
  18. Wang, Q.K.; He, Y.J.; Shen, J.N.; Hu, X.S.; Ma, Z.F. State of charge-dependent polynomial equivalent circuit modeling for electrochemical impedance spec-troscopy of lithium-ion batteries. IEEE Trans. Power Electron. 2017, 33, 8449–8460. [Google Scholar] [CrossRef]
  19. Chen, J.; Ouyang, Q.; Xu, C.; Su, H. Neural Network-Based State of Charge Observer Design for Lithium-Ion Batteries. IEEE Trans. Control Syst. Technol. 2018, 26, 313–320. [Google Scholar] [CrossRef]
  20. Howey, D.A.; Mitcheson, P.D.; Yufit, V.; Offer, G.J.; Brandon, N.P. Online Measurement of Battery Impedance Using Motor Controller Excitation. IEEE Trans. Veh. Technol. 2014, 63, 2557–2566. [Google Scholar] [CrossRef]
  21. Xing, Y.; He, W.; Pecht, M.; Tsui, K.L. State of charge estimation of lithium-ion batteries using the open-circuit voltage at various ambient temperatures. Appl. Energy 2014, 113, 106–115. [Google Scholar] [CrossRef]
  22. He, H.; Xiong, R.; Guo, H. Online estimation of model parameters and state-of-charge of LiFePO4 batteries in electric vehicles. Appl. Energy 2012, 89, 413–420. [Google Scholar] [CrossRef]
  23. Yang, C.; Wang, X.; Fang, Q.; Dai, H.; Cao, Y.; Wei, X. An online SOC and capacity estimation method for aged lithium-ion battery pack considering cell inconsistency. J. Energy Sources 2020, 29, 101250. [Google Scholar]
  24. Einhorn, M.; Conte, F.V.; Kral, C.; Fleig, J. A method for online capacity estimation of lithium ion battery cells using the state of charge and the transferred charge. IEEE Trans. Ind. Appl. 2012, 48, 736–741. [Google Scholar] [CrossRef]
  25. Zhang, Y.; Song, W.; Lin, S.; Feng, Z. A novel model of the initial state of charge estimation for LiFePO4 batteries. J. Power Sources 2014, 248, 1028–1033. [Google Scholar] [CrossRef]
  26. Poloei, F.; Bakhshai, A.; Liu, Y.-F. A novel online adaptive fast simple state of charge estimation for Lithium Ion batteries. In Proceedings of the 2017 IEEE 6th International Conference on Renewable Energy Research and Applications (ICRERA), San Diego, CA, USA, 5–8 November 2017; pp. 914–918. [Google Scholar]
  27. Xu, J.; Mi, C.C.; Cao, B.; Deng, J.; Chen, Z.; Li, S. The state of charge estimation of lithium-ion batteries based on a proportional-integral observer. IEEE Trans. Veh. Technol. 2014, 63, 1614–1621. [Google Scholar]
  28. Qingsheng, S.; Chenghui, Z.; Naxin, C.; Xiaoping, Z. Battery state-of-charge estimation in electric vehicle using elman neural network method. In Proceedings of the 29th Chinese Control Conference, Beijing, China, 29–31 July 2010. [Google Scholar]
  29. Eichi, H.R.; Chow, M. Adaptive parameter identification and state-of-charge estimation of lithium-ion batteries. In Proceedings of the IECON—38th Annual Conference on IEEE Industrial Electronics Society, Montreal, QC, Canada, 25–28 October 2012. [Google Scholar]
  30. Zhang, H.; Na, W.; Kim, J. State-of-charge estimation of the lithium-ion battery using neural network based on an improved thevenin circuit model. In Proceedings of the IEEE Transportation Electrification Conference and Expo (ITEC), Long Beach, CA, USA, 13–15 June 2018. [Google Scholar]
  31. Yuan, X.-Z.; Song, C.; Wang, H.; Zhang, J. Electrochemical Impedance Spectroscopy in PEM Fuel Cells; Springer: London, UK, 2010. [Google Scholar]
Figure 1. Nyquist plot and equivalent model of a Li-ion battery: (a) Nyquist plot; (b) an equivalent circuit model.
Energies 14 02526 g001
Figure 2. Battery testing rack.
Energies 14 02526 g002
Figure 3. Three-layer feed-forward network architecture.
Energies 14 02526 g003
Figure 4. Flowchart of the static SOC data training (initial i = 1).
Energies 14 02526 g004
Figure 5. Nyquist plot when using 0.2 C-rate discharge: (a) Nyquist plot of 0% to 100% SOC; (b) AC impedance under 3 different frequency.
Energies 14 02526 g005
Figure 6. Configuration of the utilized artificial neural network.
Energies 14 02526 g006
Figure 7. Experiment flowchart to validate the ANN-based model.
Energies 14 02526 g007
Figure 8. Voltage, current, and cell surface temperature for CC/CV charging and four sets of random discharging.
Energies 14 02526 g008
Table 1. Parameters of back-propagation neural network.
DescriptionParameter
Network TypeFeed forward backpropagation
Number of Layers2 (include hidden and output layer)
Layer1 number of neurons35 (hidden layer neurons)
Layer1 transfer functionTansigmoid
Layer 2 transfer functionPurelin
Training methodBack-propagation neural network
Training function
Adaption Learning Function
Trainlm (Levenberg–Marquardt)
Leardgdm
Performance functionMean square error
Table 2. Input parameters of the ANN-based model.
Input ValueInput 01Input 02Input 03Input 04
Crate0.751.31.750.3
Re (Z, f = 1001 Hz)0.0612850.061650.0631860.063667
Re (Z, f = 100 Hz)0.0632030.0635990.0655410.066083
Re (Z, f = 463 Hz)0.0683470.0689570.0718910.07295
Im (Z, f = 1001 Hz)0.0015530.0013520.0007250.000453
Im (Z, f = 100 Hz)−0.00188−0.00208−0.00287−0.00326
Im (Z, f = 463 Hz)−0.00403−0.00429−0.00539−0.00613
Table 3. Output parameters of the ANN-based model.
Input ValueOutpu t01Output 02Output 03Output 04
Target SOC83703520
Table 4. Output SOC of ANN-based and target SOC comparison.
EstimationError (%)Max. Error (%)Min. Error (%)Avg. Error (%)
SOC8370352083703520
Neur 1580.673.436.921.92.864.895.439.639.632.866.21
Neur 2080.272.235.721.43.333.131.916.996.991.914.28
Neur 2581.67233.219.81.692.865.011.015.011.013.05
Neur 3081.367.235.019.52.083.970.002.293.970.002.52
Neur 3581.269.835.520.52.200.341.542.732.730.341.92
Publisher’s Note: MDPI stays neutral with regard to jurisdictional claims in published maps and institutional affiliations.

