Article

Surface Deformations Resulting from Abandoned Mining Excavations

by
Piotr Strzałkowski
*,
Roman Ścigała
*,
Katarzyna Szafulera
* and
Konrad Kołodziej
*
Faculty of Mining, Safety Engineering and Industrial Automation, Silesian University of Technology, 44-100 Gliwice, Poland
*
Authors to whom correspondence should be addressed.
Energies 2021, 14(9), 2495; https://doi.org/10.3390/en14092495
Submission received: 9 March 2021 / Revised: 30 March 2021 / Accepted: 23 April 2021 / Published: 27 April 2021
(This article belongs to the Section H: Geo-Energy)

Abstract

:
The occurrence of surface discontinuous deformations in post-mining areas is currently a significant and important problem, due to both the frequency of their occurrence and the threat they pose to public safety. This paper presents the results of research concerning the possibility of sinkhole formation in the areas of abandoned mining excavations. For the purpose of assessing the condition of the rock mass disturbed by the existence of numerous mining excavations, electrical resistivity tomography investigations were carried out for the selected area where mining was undertaken in the past at shallow depths and many underground workings accessing the deposit exist. The sinkhole hazard was also analysed theoretically with a new original model based on the solution of A. Sałustowicz’s pressure arch theory.

Graphical Abstract

1. Introduction

In recent years, there has been a move away from coal-based energy in Europe. The high CO2 emissions associated with the production of energy from coal is causing climate warming. This, in turn, affects glacial regression [1], groundwater recharge and plant vegetation [2]. Unfortunately, this entails limiting the extraction of hard coal and the liquidation of some mines. Such a tendency is also observed in Poland, where 72 mines extracting this raw material were in operation in the 1970s, while currently only 20 are still active. Limiting exploitation results in reduction of the negative environmental impact of mining. As shown by the works [3,4], this influence covers a wide spectrum of factors. The following can be distinguished: formation of continuous deformations (mining subsidence troughs and other deformation indices [5,6], formation of discontinuous linear deformations (mainly steps in ground) [7,8,9]; surface discontinuous deformations—sinkholes [10,11,12,13], as well as mining-induced tremors of the rock mass, which could even lead to rock outbursts [14]. However, the impact of underground mining on the environment does not end with the cessation of mining [15]. After the liquidation of mines, some negative effects of mining activities are still observed [16]. They are associated with changes in hydrogeological conditions [17], gas release from underground workings connected to the surface [16,18], and the occurrence of surface discontinuous deformations—mainly sinkholes. The latter threat is often associated with the loss of stability of shallow galleries and mining shafts [10,11,19] which results in the formation of sinkholes. They are also created in association with natural voids occurring in the rock mass as a result of karst phenomena [20,21]. Although there are a number of methods for forecasting sinkhole hazard [10,12,13]; it is still difficult due to the randomness of the process, which results from the impact of factors that are difficult to predict, such as rock mass tremors or the suffosion phenomenon [22].
A separate problem in the case of liquidated mines, mining areas, or former workings are mine shafts [19,23]. The methods of liquidation of abandoned shafts used in the past usually do not ensure the removal of the sinkhole hazard due to their inadequate protection [4,19]. In some cases, it is also very difficult to precisely determine their location [18,24]. Works performed in order to eliminate the risks associated with inoperative shafts begin with locating the shafts. For this purpose, geophysical methods are used, the results of which can be verified by uncovering the ground [23,25,26]. Among the geophysical methods for the detection of such voids, the following methods are most often used: georadar; gravimetric [27,28]; seismic; electrical resistivity [8,29].
This paper presents the results of research related to the determination of the degree of sinkhole formation hazard in post-mining areas. This hazard is related to the presence of underground galleries and shallow mining workings. In order to investigate the possible location of shallow voids in the rock mass, electrical resistivity tomography (ERT) method was used. The possibility of sinkholes creation as a result of collapse of shallow mining workings was examined using the method developed by Strzałkowski [12,13].

2. Material and Methods

The method proposed in the papers [12,13,30] was used to assess the degree of sinkhole formation hazard posed to post-mining areas as a result of the collapse of shallow galleries. On the other hand, geophysical tests were performed based on the electrical resistivity method. The following sections present the basics of both applied solutions.

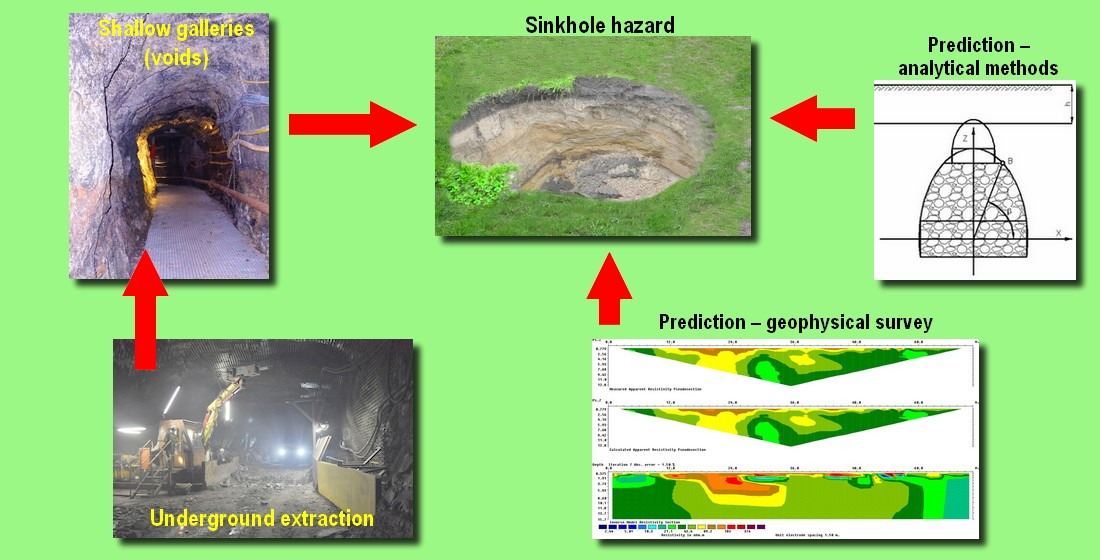
2.1. The Method of Sinkhole Hazard Assessment

It is a deterministic method, taking into account the possibility of maintaining the void in the rock mass in a stable state in the case of rocks characterised by high-tensile strength. The mathematical model uses the pressure arch theory developed by Sałustowicz [31] based on the solution for a flat disk with an elliptical hole provided by Huber (1904). It is based on the assumption that an ellipse-shaped fracture zone (Figure 1) is formed around the working (void) if the following condition is met:
σ x max R r
where: Rr—tensile strength, Pa; σx max—maximum stress in the x direction, Pa.
Then, the following conditions are met in the roof and the floor of void:
σ z = 0 σ x = σ x max = p x 1 + 2 n p z
where n—ratio of the ellipse axis lengths a and b.
This condition results from Equation (2), assuming that σxmax = Rr. The ellipse axis length ratio is:
a b = R r + p z p x 2 p x = n
where pz, px—vertical and horizontal components of the primary pressure, Pa.
Sałustowicz [31] assumed that the part of the stress-relieved zone located above the working exerts pressure (load) on the working supports. In his calculations, he made a simplifying assumption consisting in treating a part of the ellipse as a parabola, due to the ease of integrating the function.
The proposed method assumes integrating over the whole ellipse cross-section, taking into account also the part of the elliptical cross-section in the sidewalls area.
The area of the stress-relieved zone—Pe (the hatched area in Figure 2), without considering its part under the heading, is expressed by the equation:
P e = S 1 w   l 2 + 2   S 2 = π   a   b 8 w   l 2 + 2   a   b   k 2   w   l 8 = a   b π + 2   k     6   w   l 8
If the working support loses its load bearing capacity, which is often the case with the wooden supports of the old shallow workings, a collapse will occur and rocks from the stress-relieved zone will fill the working. This method uses the following designations:
P 1 = P e k r P 2 = P e + w l
where: P1—maximum volume of rocks contained in the stress-relieved zone per 1 m of the gallery length; P2—sum of the volumes of stress-relieved zone and the excavation per 1 m of its length; kr—coefficient of loosening of rocks; w—height of the working; l—width of the working.
If P1 = P2, a self-backfilling of the void will occur and the rocks contained in the stress-relieved zone will fill the working tightly; there will be no secondary void in the rock mass. If P1 < P2, a secondary void will form in the area of the upper apex of the stress-relief zone, with a volume resulting from the difference of P2–P1 areas (Figure 3).
Bearing in mind that the area of the secondary void is Sw = P2 − P1, it is possible to simplify the calculations for practical purposes by assuming that the secondary void has the shape of a rectangle with the ratio of sides having the same value as the primary void. With the above assumptions, a computer program was developed that performs the calculations in an iterative manner. The algorithm of the program together with the block diagram is presented in [30,32].

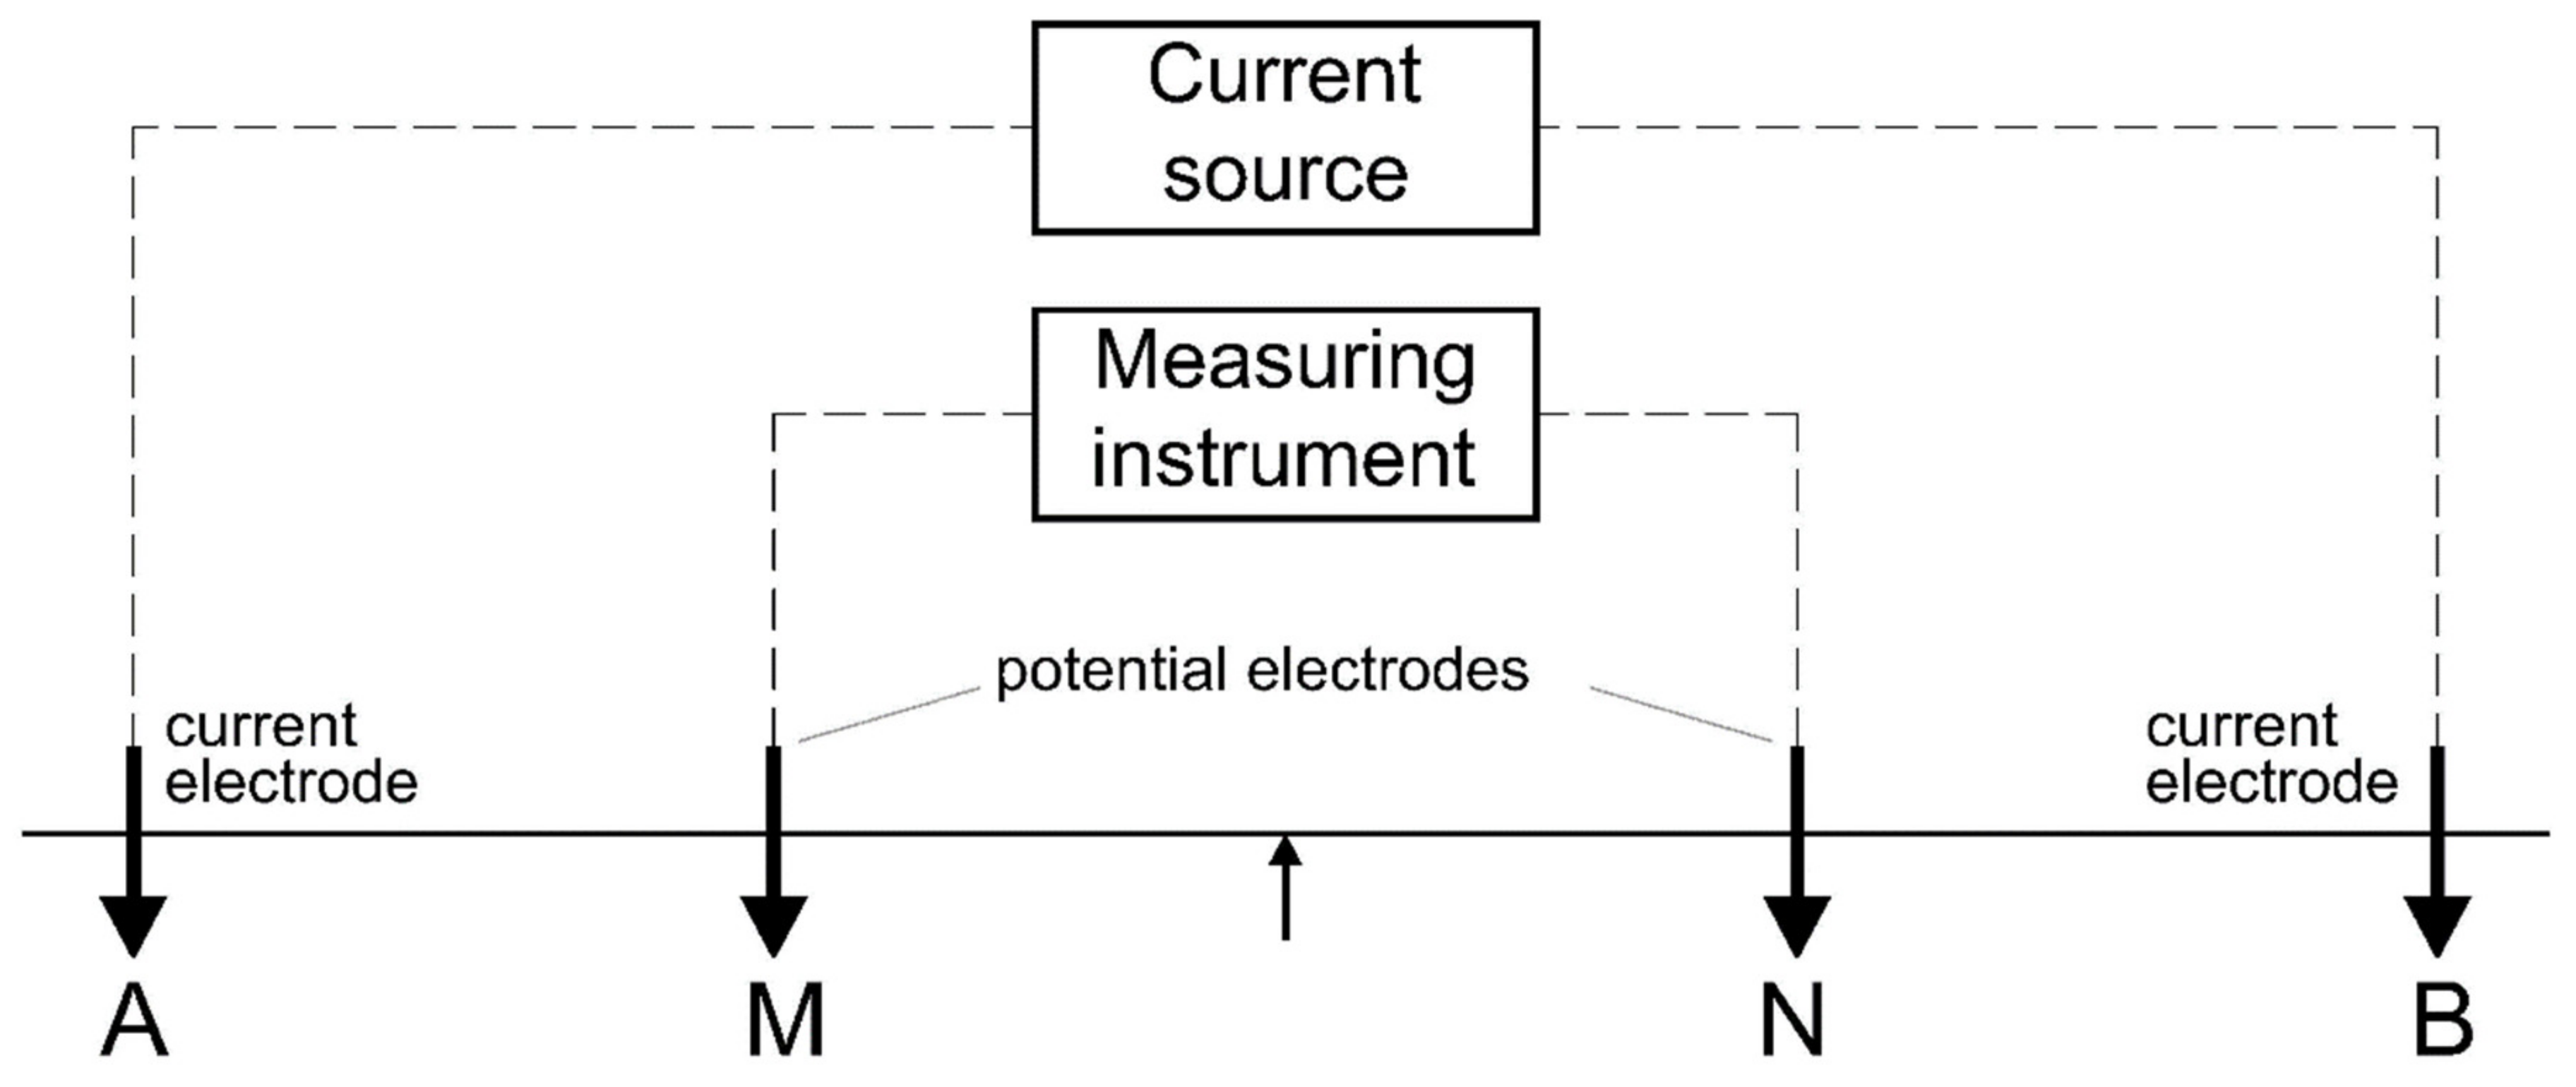
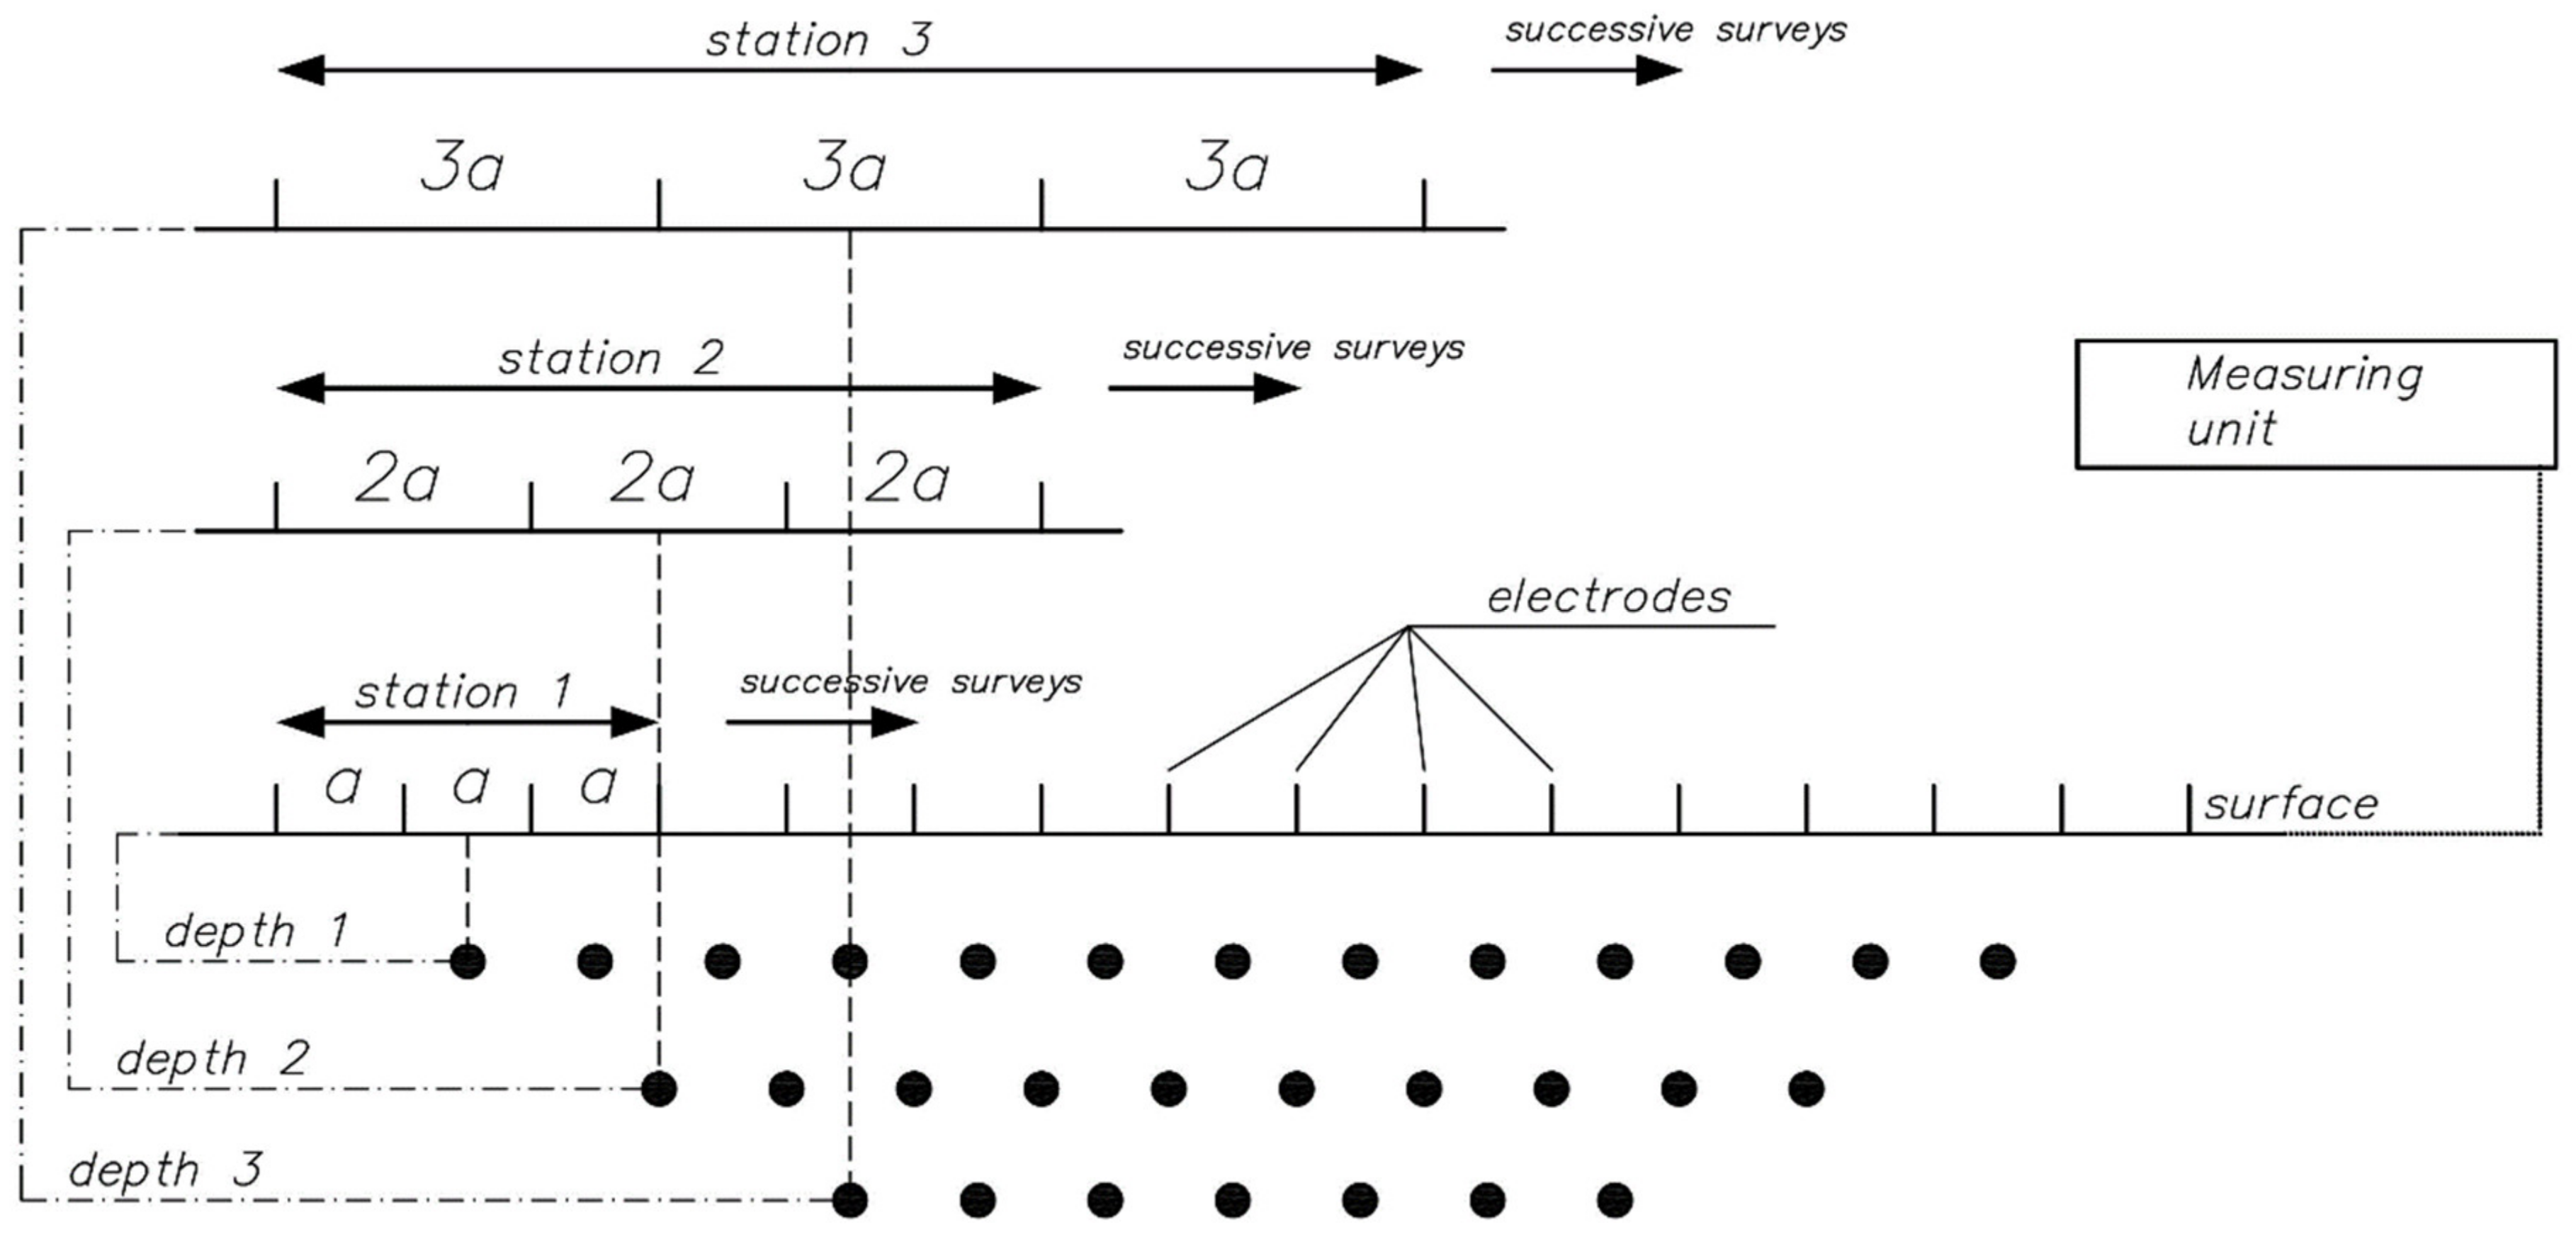
2.2. Basic Information on Measurements Using Electrical Resistivity Method
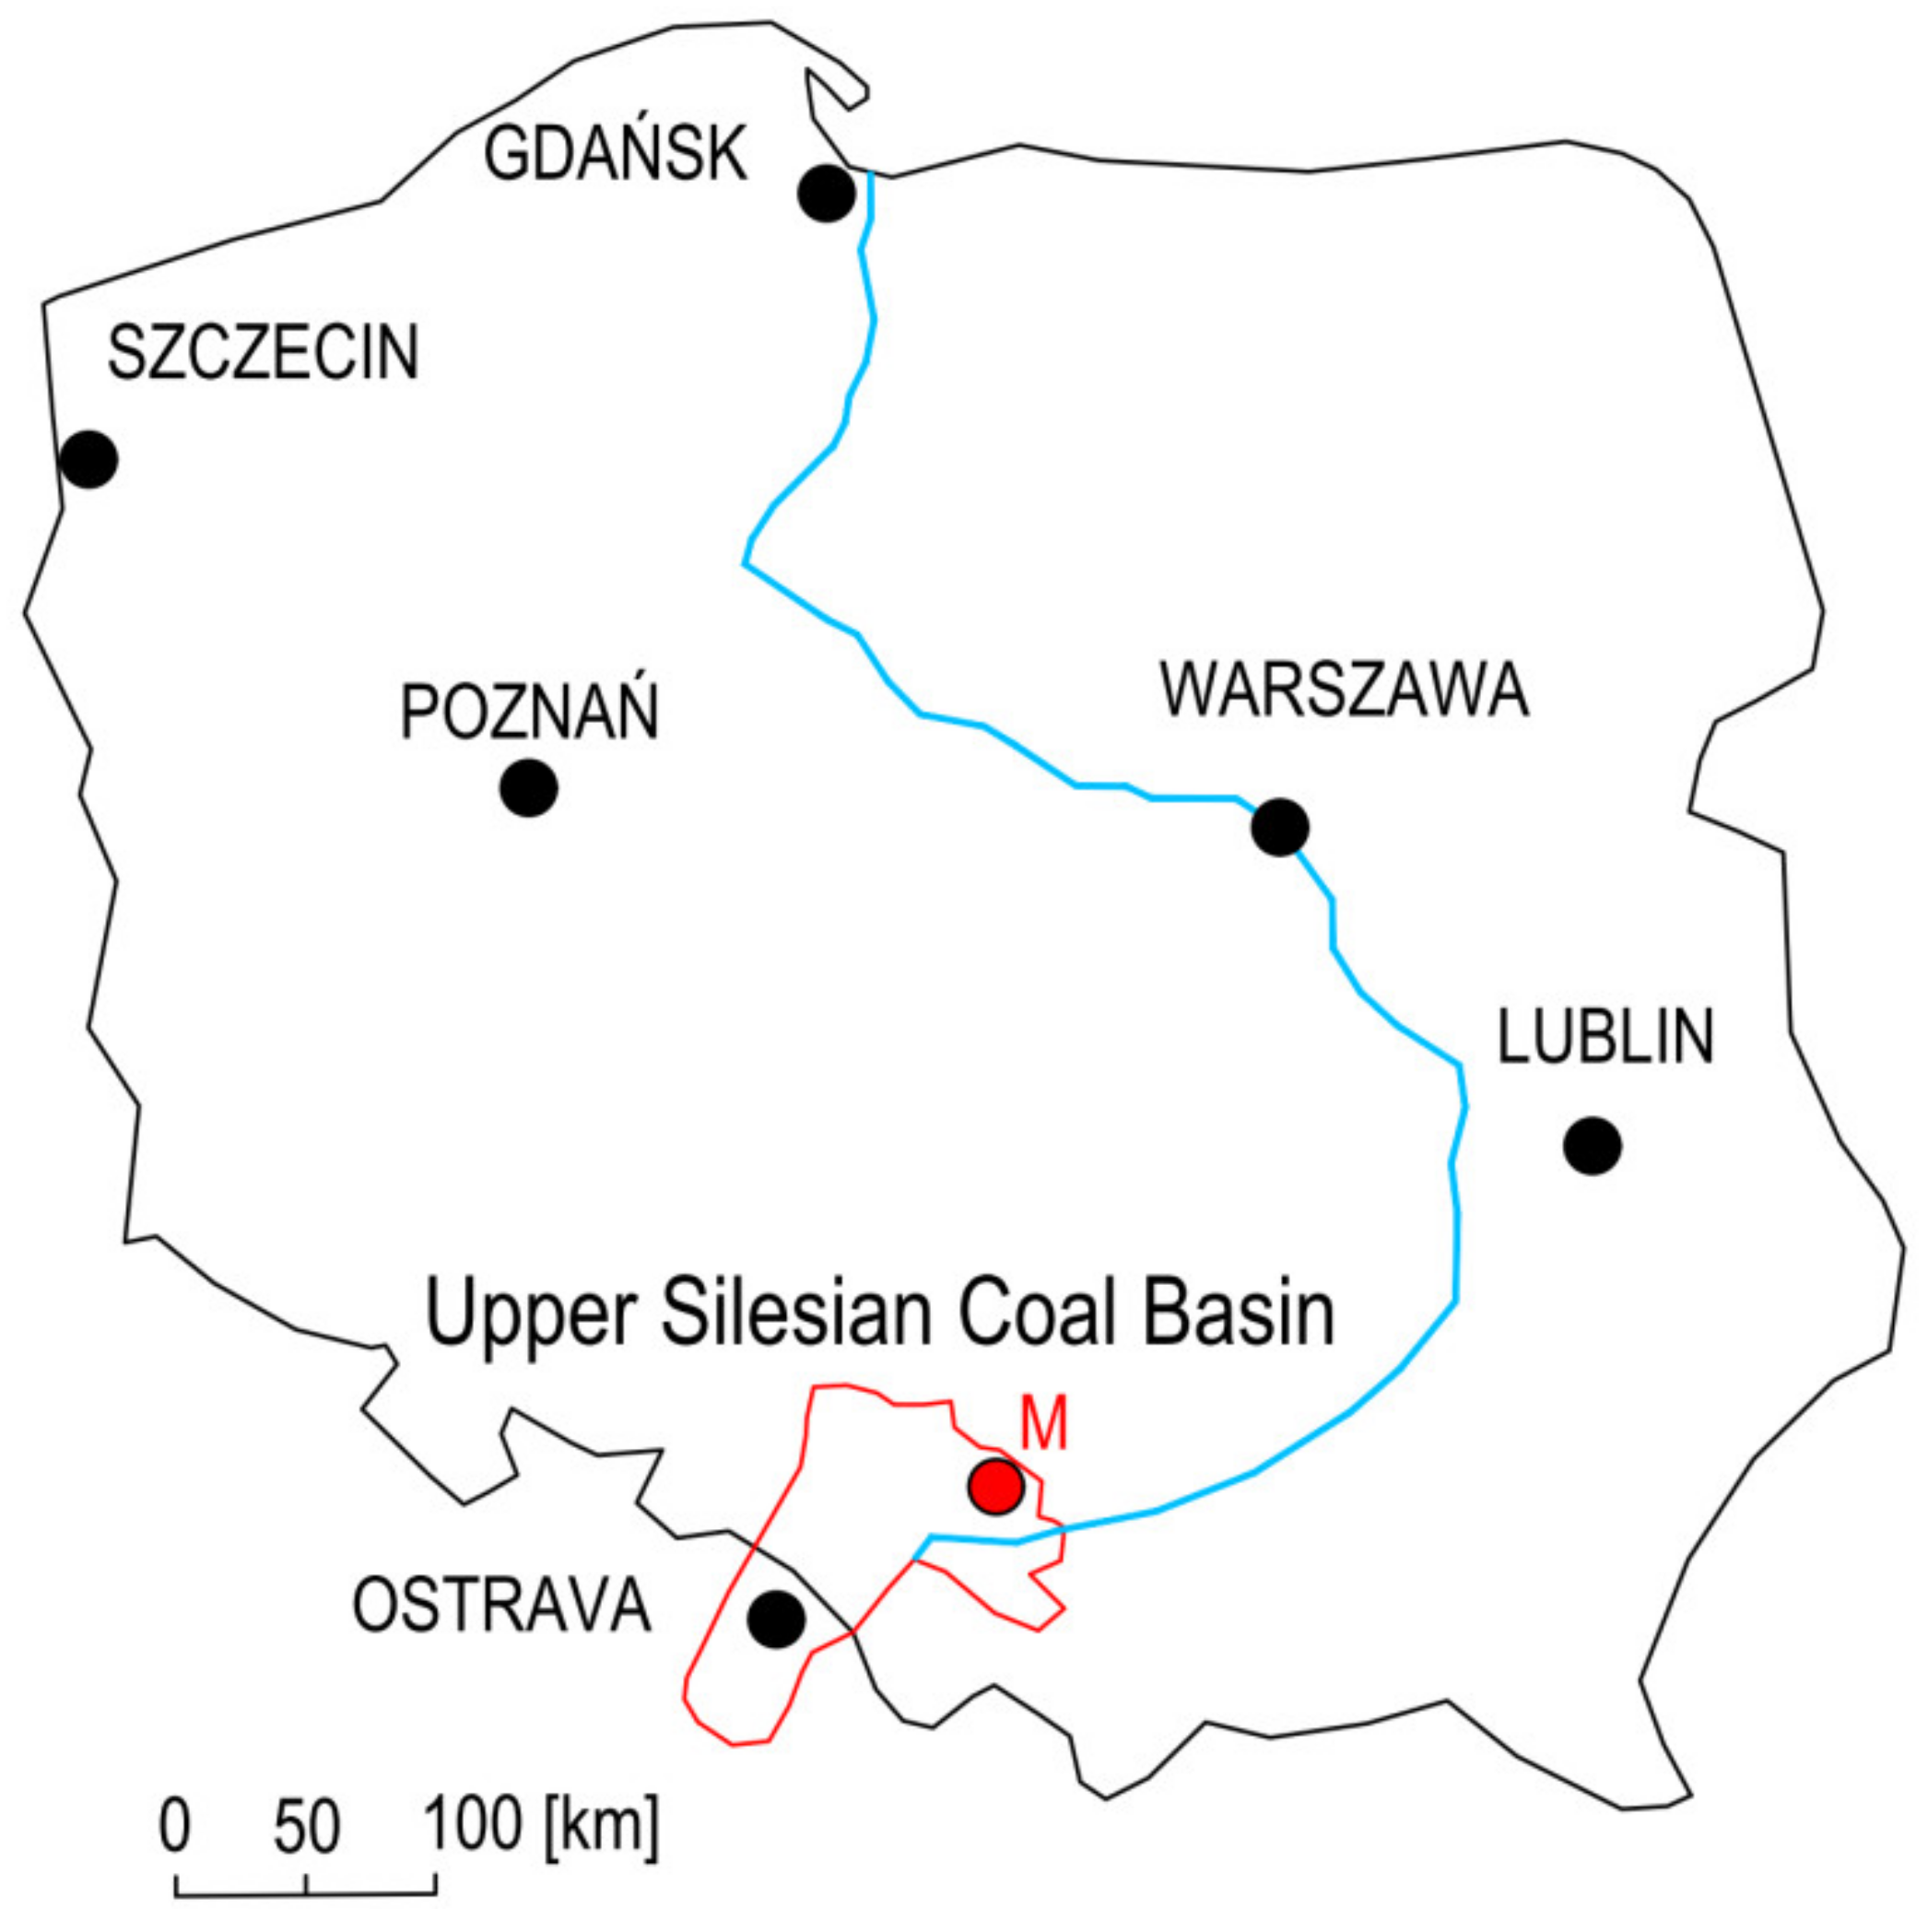
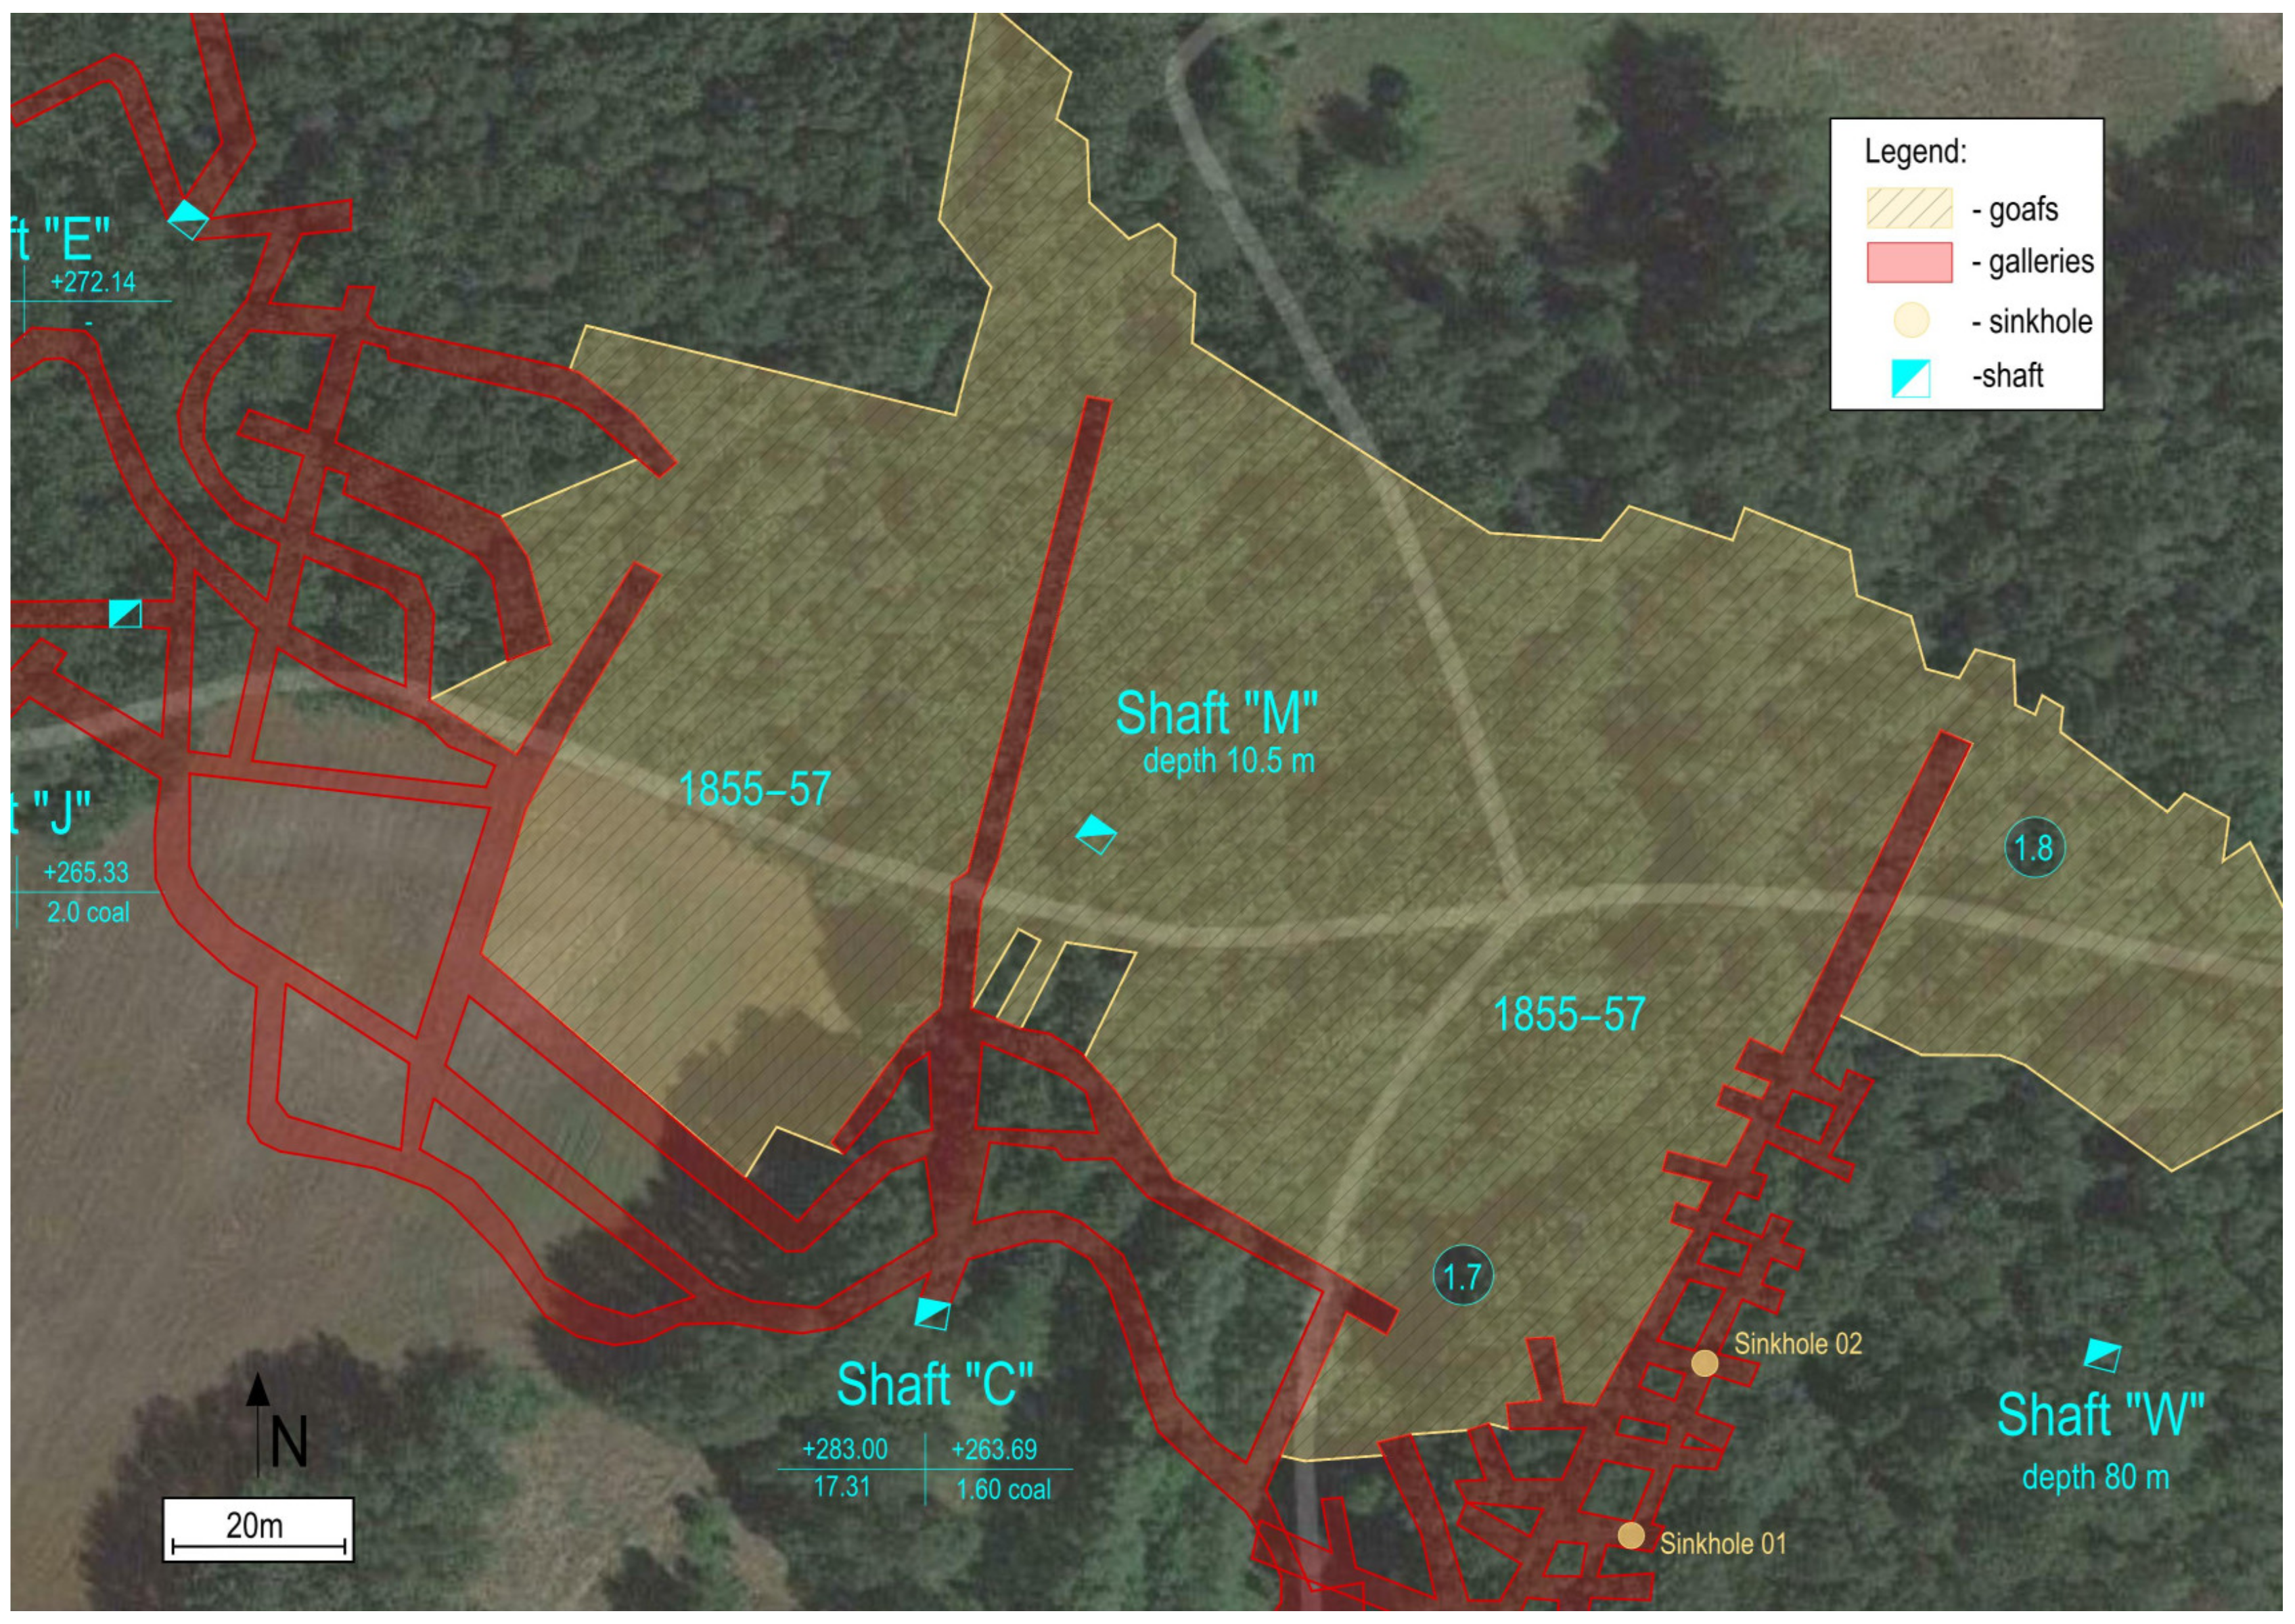
The essence of the electrical resistivity method is the utilization of the phenomenon of current flow through layers of rock mass. The basic measurement method, which has been known for decades, uses four electrodes (Figure 4). Two are used for current (A–B) and two for measurement (M–N)—measuring the potential difference generated by the current flowing through the subsurface layers. The penetration depth is a function of the distance between the electrodes—the greater the distance, the greater the depth. The average penetration depth, depending on the configuration of the electrodes, ranges from about 20% to 40% of their distance.
Nowadays, measurement systems are based on a larger number of electrodes—Figure 5. The electrodes are located along specific profile lines (2D measurement) or in the area of the analysed surface (3D measurement). A measuring device which is a specialised computer that selects the appropriate electrodes for a given measurement, emits a current pulse for a given pair of electrodes and records the response on the measuring ones. This is called ERT. The measuring equipment ARES-II of the Czech company GF Instruments [33] was used to carry out the tests. GEOTOMO Software—Res2Dinv [34] was used to interpret the measurement results.

3. Research Area

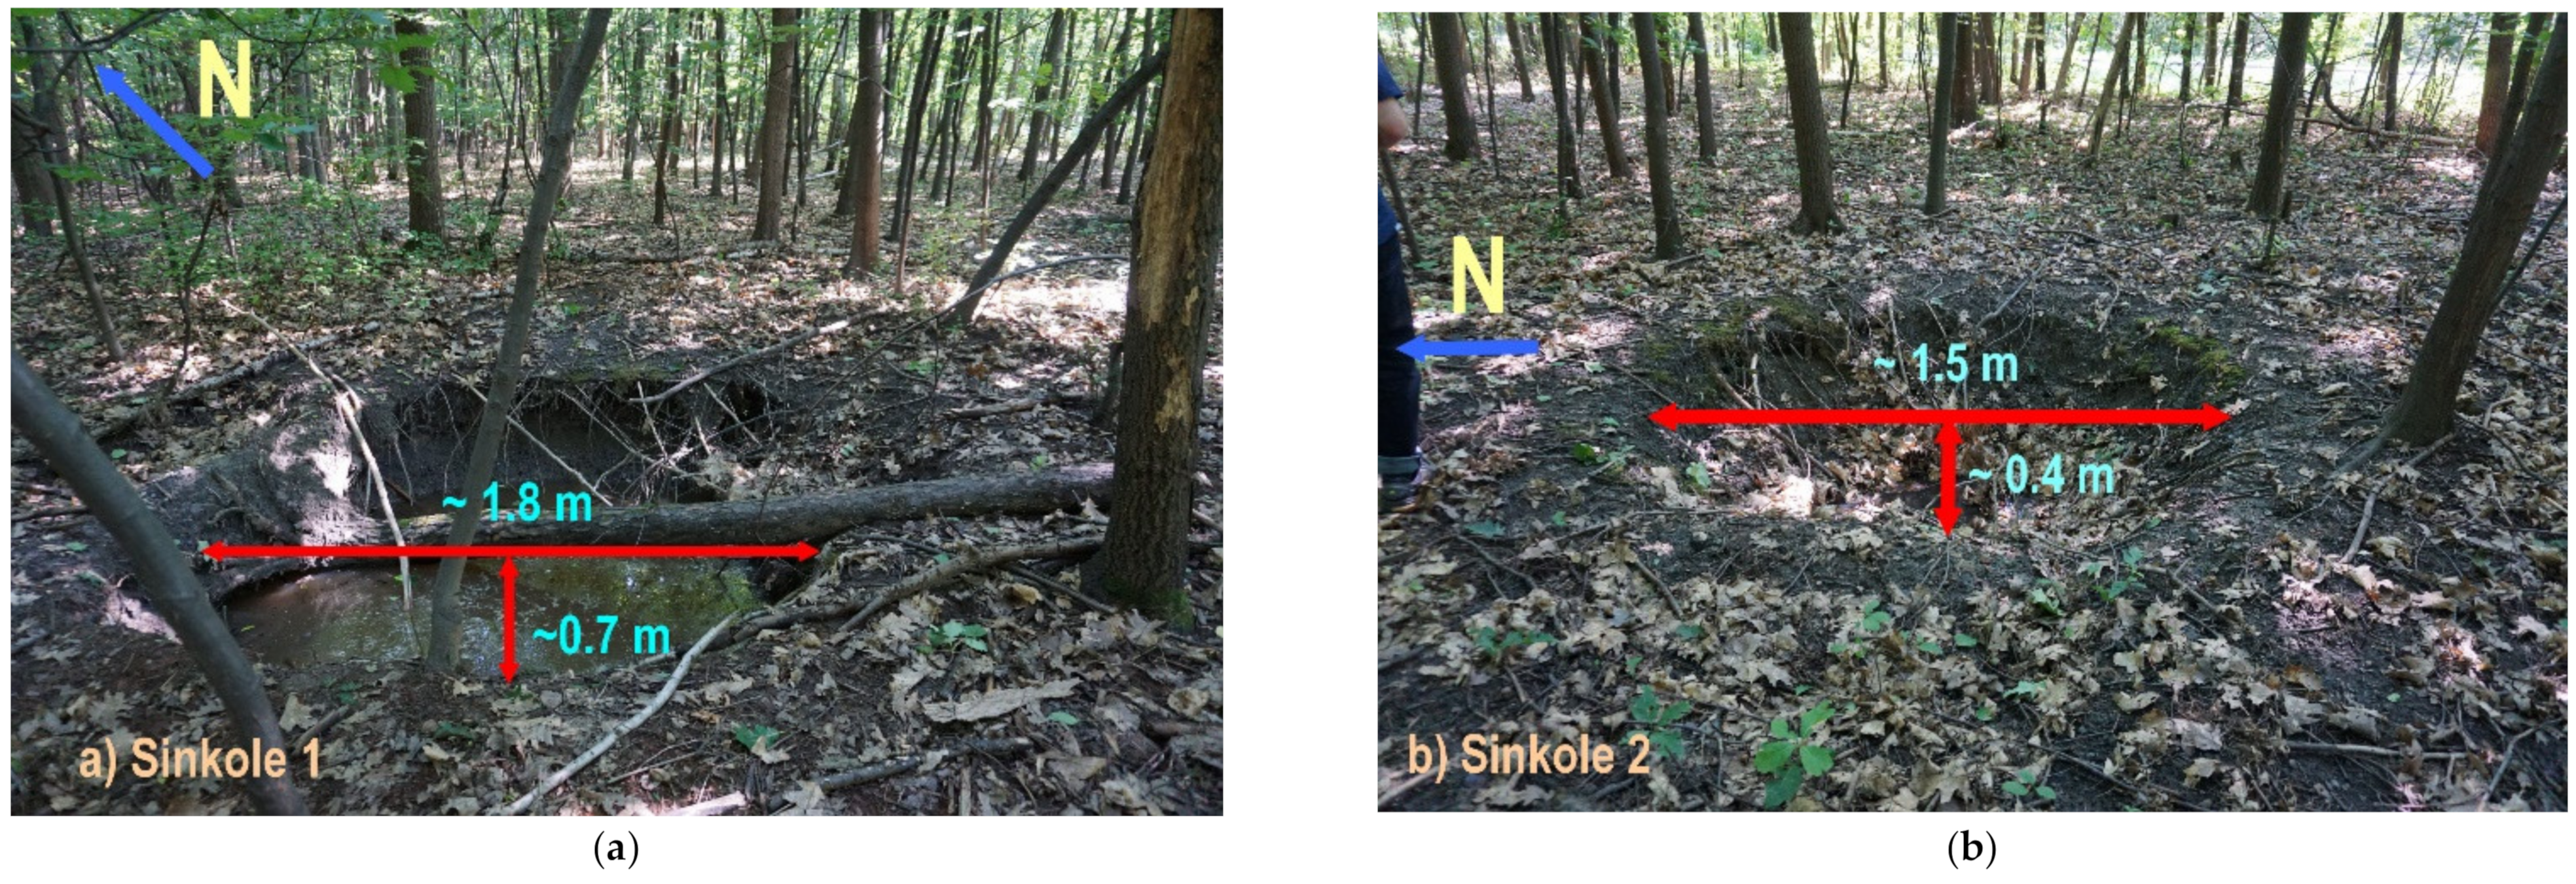
3.1. A Short Analysis of the Causes of Sinkholes Creation in the Research Area
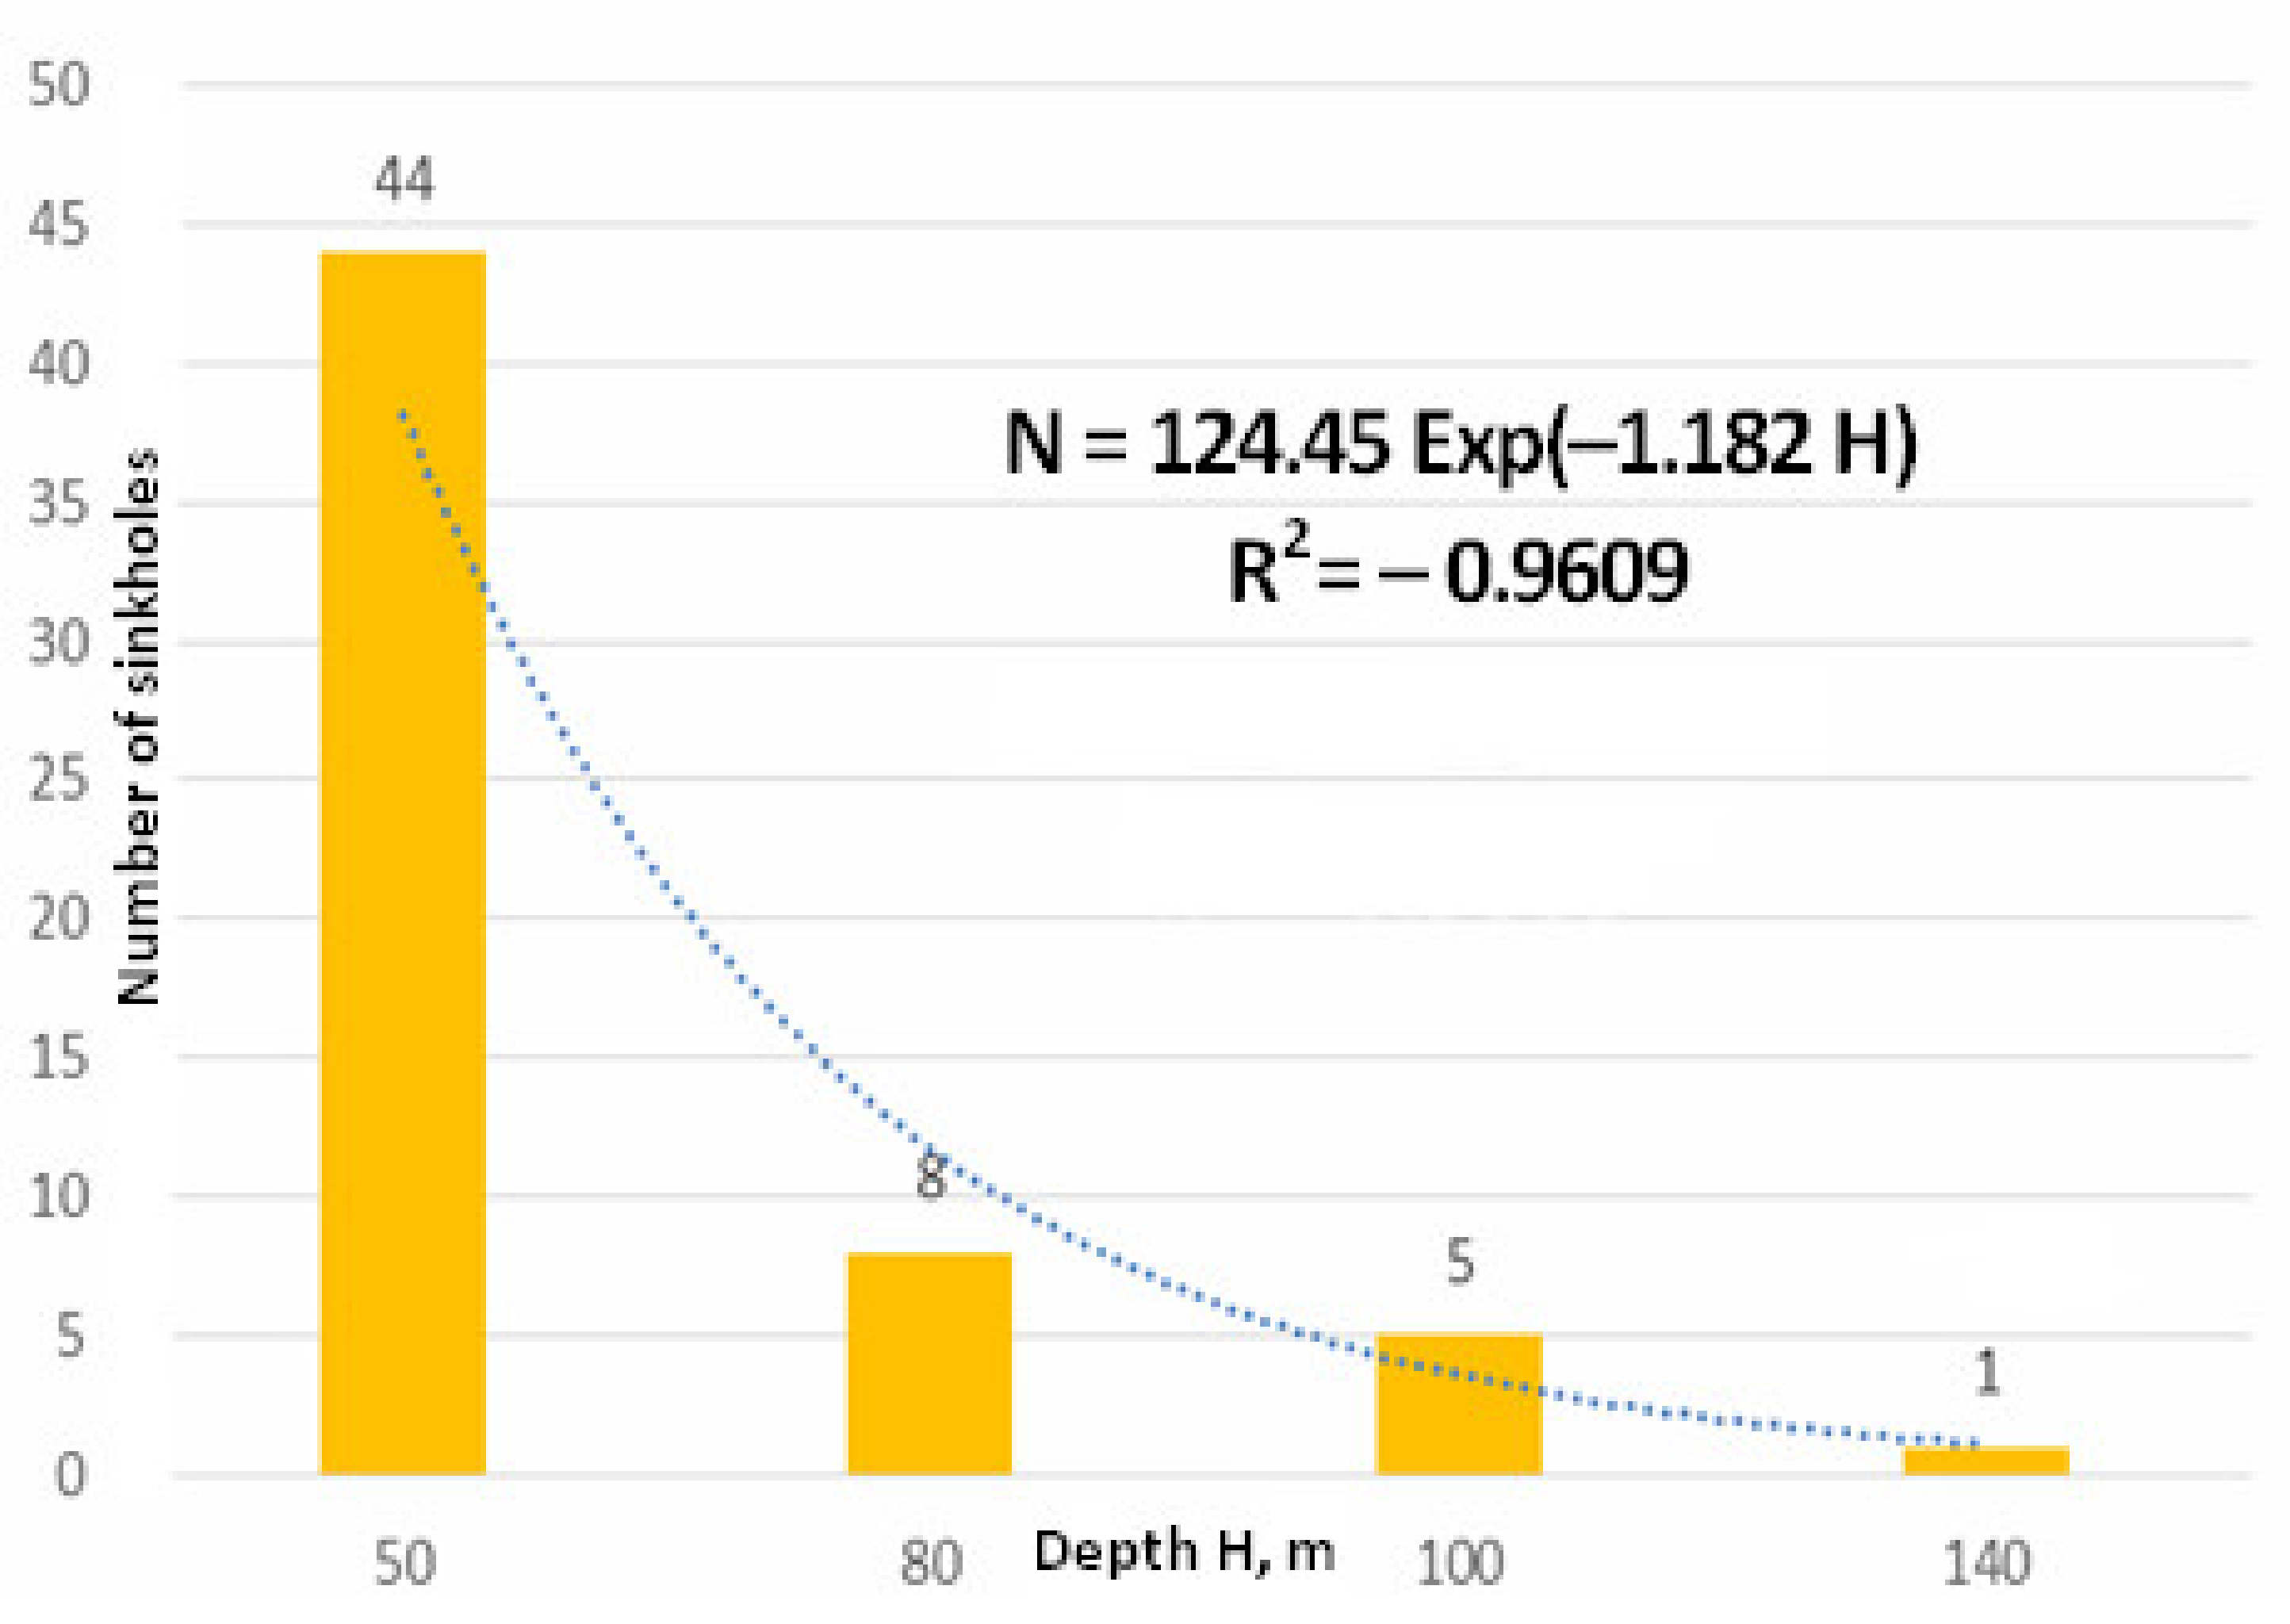
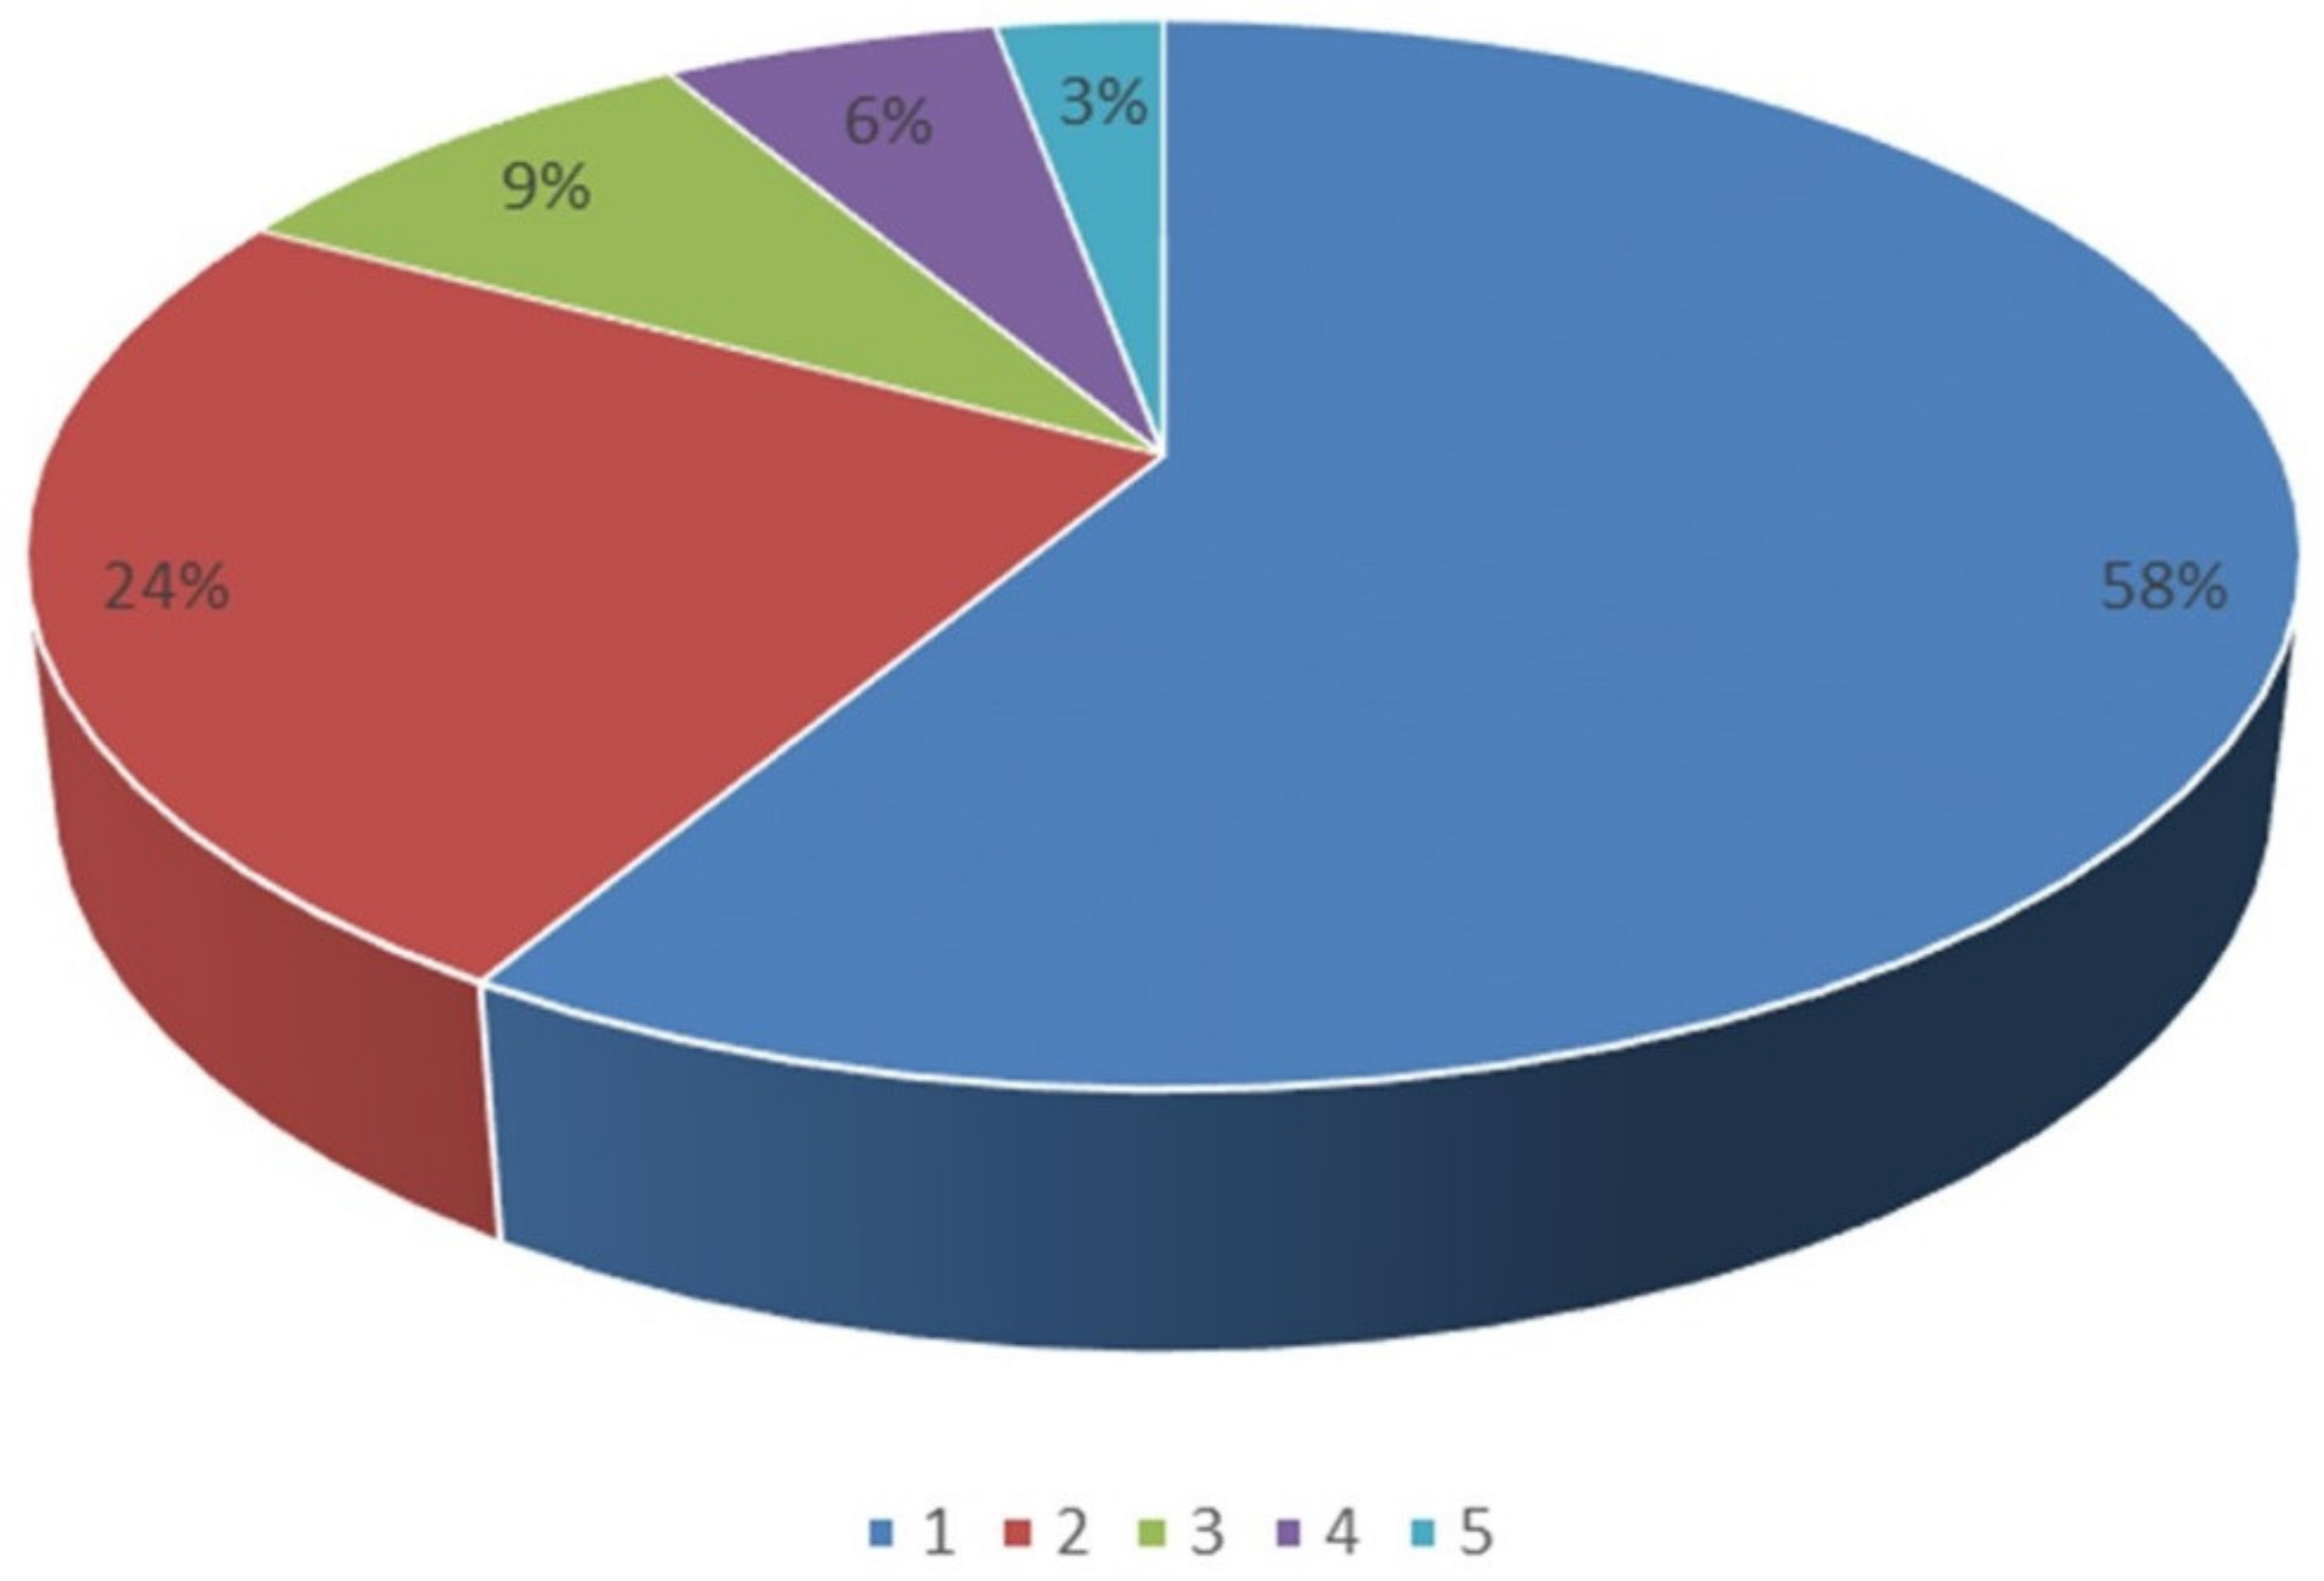
The research area is located in the Upper Silesian Coal Basin and lies within the administrative boundaries of the city of M. In the past, it was an area of shallow hard coal mining in Poland—Figure 6, which results in the formation of sinkholes on the surface.
In order to establish the source causes of the sinkholes arising in the area of the city of M, the data from the set of identified sinkholes was analysed. Then, the galleries over which the sinkholes formed in the past, were grouped into 4 depth ranges. Shafts were excluded from this set, as well as voids related to open pits. The final classification of voids depth has been arranged as follows:
  • depth up to 50 m;
  • depth from 50 to 80 m;
  • depth from 80 to 100 m;
  • depth more than 100 m.
The results are shown in Figure 7, where it can be seen that 52 deformations formed above the workings located at a depth of up to 80 m, which constitutes 90% of the total number of sinkholes. Only 5 deformations formed above workings located at a depth of 100 m and one above 100 m. Therefore, it can be concluded that a significant range of the depth of the void in this area in terms of surface sinkhole formation hazard is up to 80 m.
The strong relationship between the number of sinkholes and the depth of the void was confirmed by the regression equation given in Figure 7. It also seems interesting to trace the type of workings over which the discontinuous deformations formed. The results of the analyses in this area are presented in Figure 8.
As can be seen, most of the sinkholes (approximately 58%) formed above galleries and extracted parts of deposit (24%), and in connection with the loss of stability of shafts (approximately 9%).

3.2. Local Conditions of the Research Area

The study area covers a fragment of the mining area of the closed coal mine where shallow underground extraction was conducted in the XIX and XX centuries. Presently, there are several abandoned shafts, and shallow galleries below the surface level—Figure 9. They are located mainly in forest areas and in the vicinity of loose buildings consisting of single-family houses. The workings were probably made with wooden supports with a rectangular cross-section, and the method of their liquidation is unknown. The existing documentation does not contain information on the dimensions of the shafts’ cross-sections. The discontinuous deformation hazard in the area is evidenced by the fact that during the inspection in the forest area, sinkholes were identified—Figure 10. They were located in the area of inactive abandoned galleries—Figure 9. A field inspection also indicated that the shaft outset was not covered with a concrete slab. Therefore, in the light of the above comments, there is a real risk of sinkhole formation in this area.

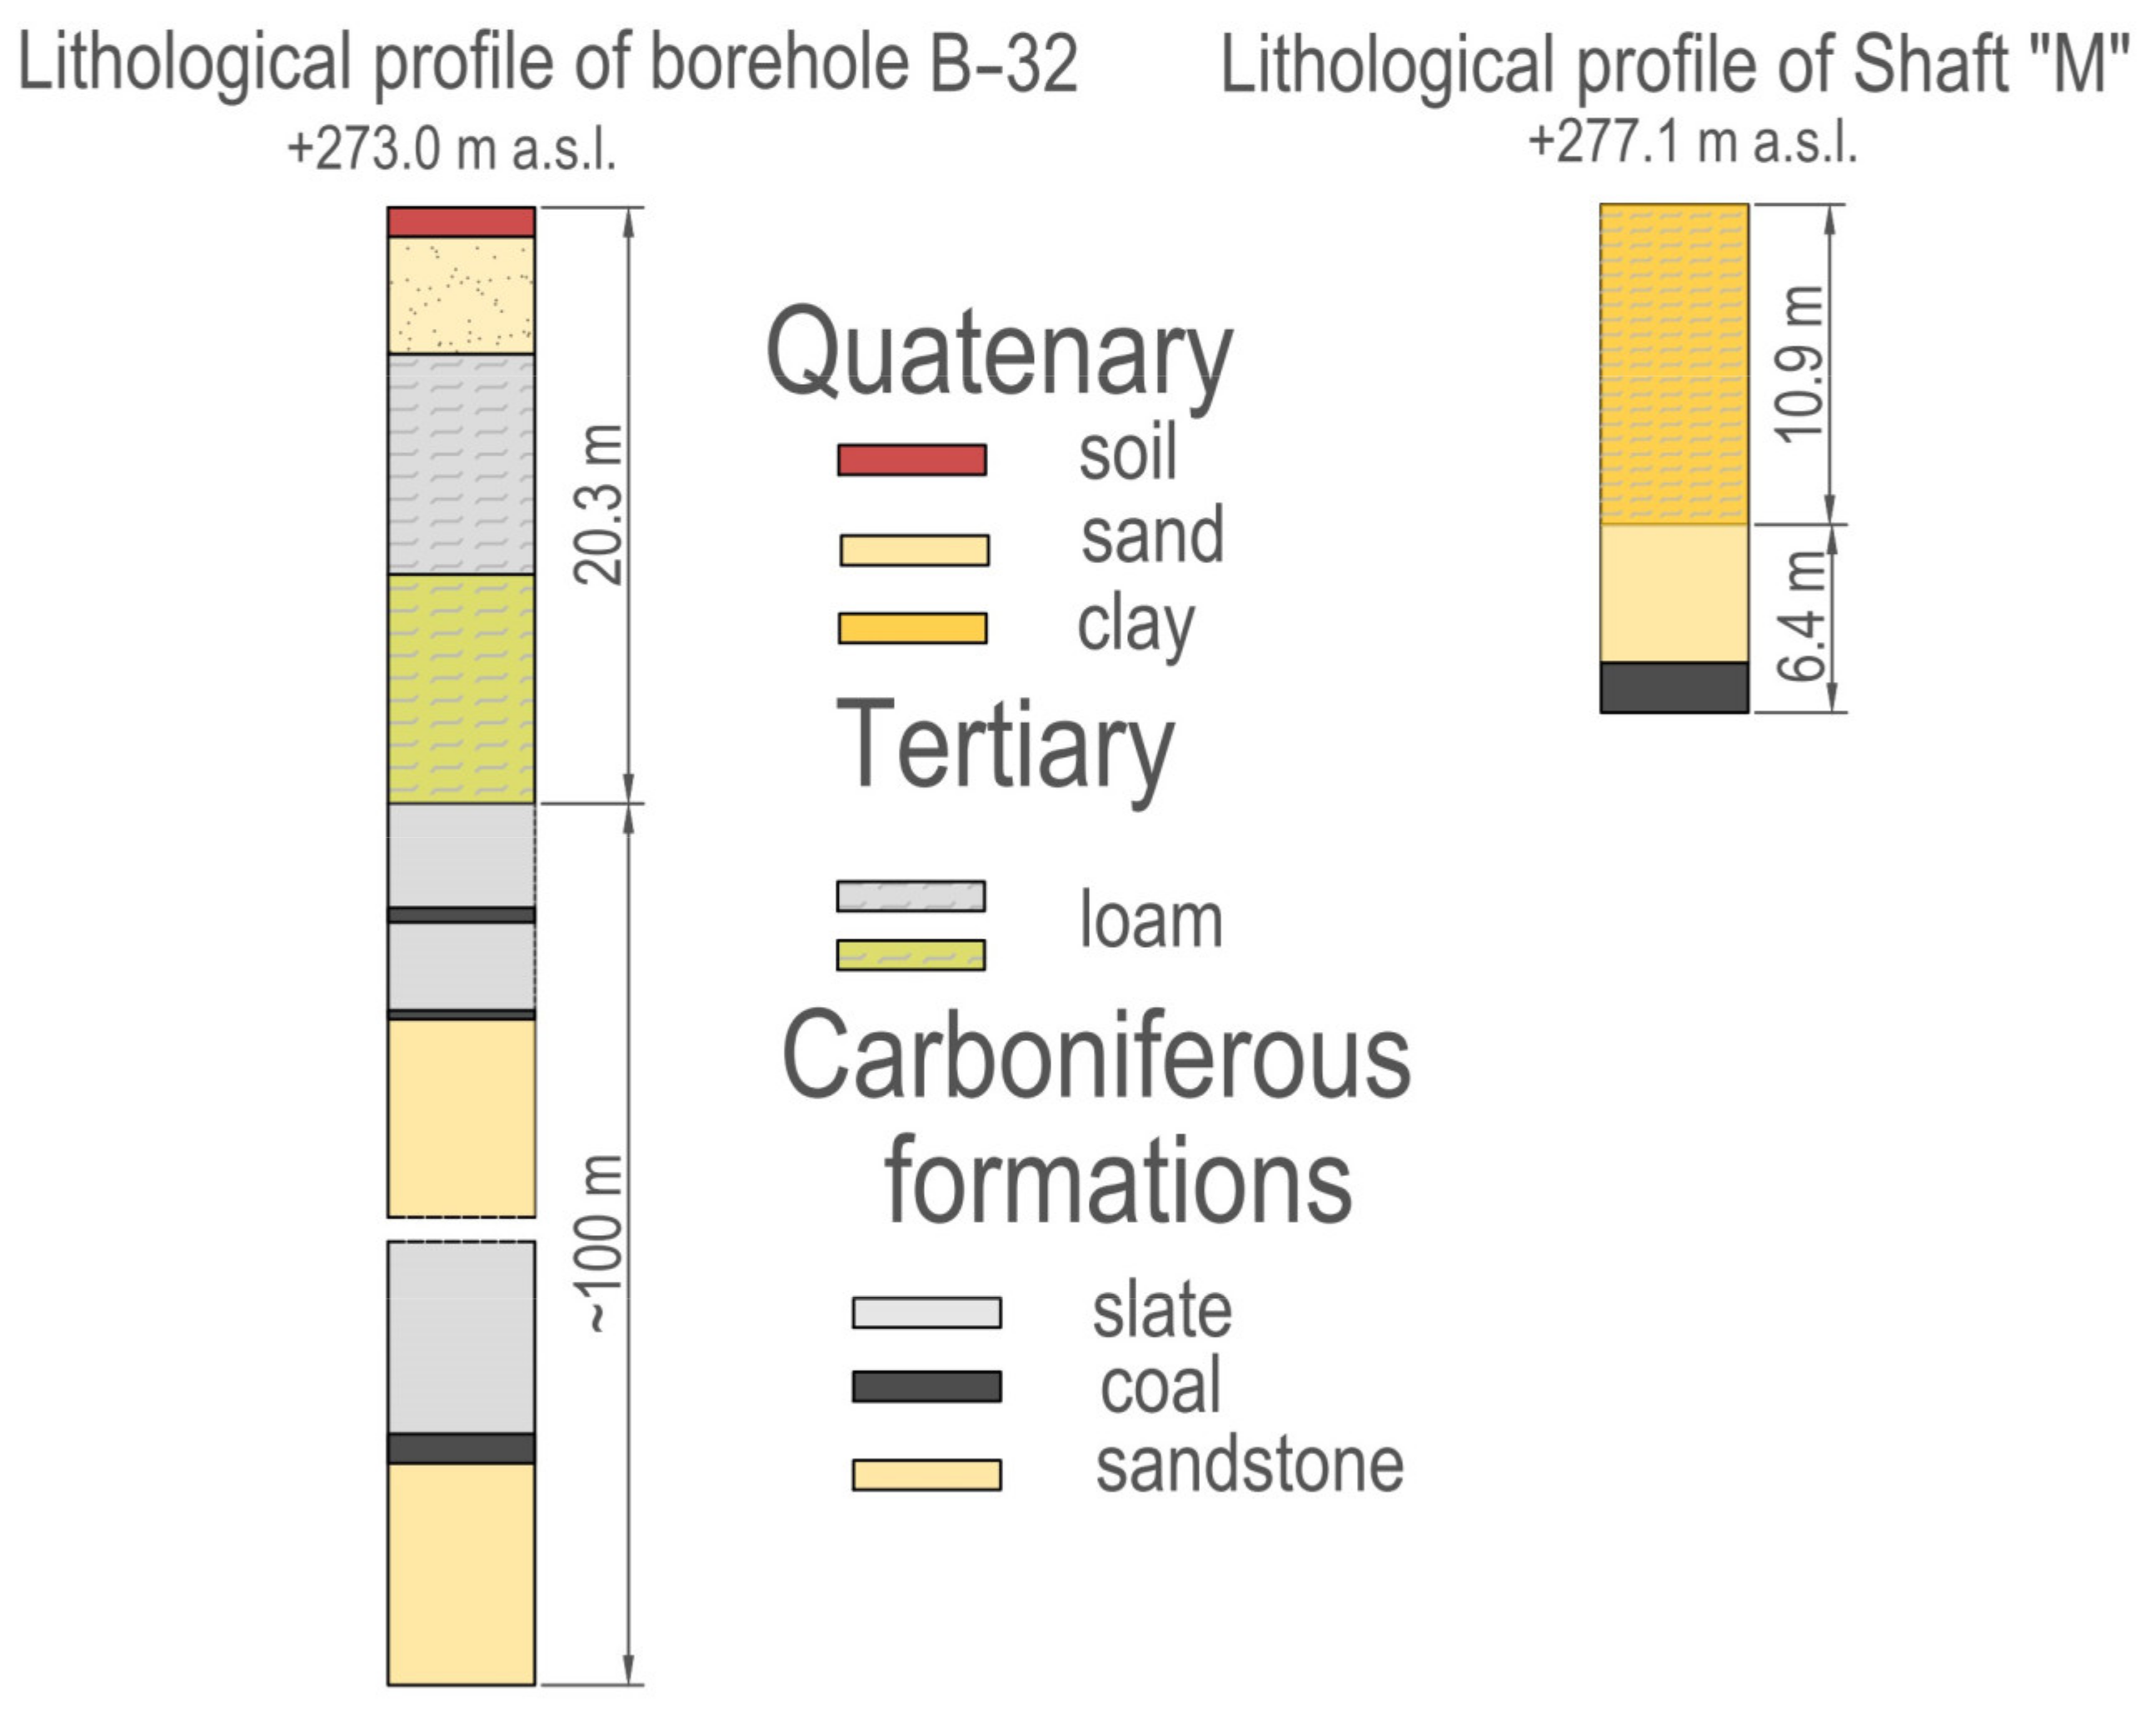
3.3. Geological Structure of the Rock Mass

The geological structure of the rock mass was identified on the basis of the “M” shaft profile and the B-32 borehole (1961)—Figure 11. On their basis, it can be concluded that the rock mass was built of overburden and coal measures. The overburden is made of Quaternary layers consisting of soil, fine sand, and clay. Underneath these rocks, there are layers of Tertiary clays composed of dark grey loams with a green and gray shade. The thickness of the overburden is from 10 m to 20 m.
Coal measures are located under the overburden. In the B32 borehole and the “M” shaft, the presence of Orzesze beds was established directly in the Carboniferous roof. The Orzesze beds are approximately 600 m thick. They are mainly composed of alternating clay and sandy slates with sandstone interbedding, from a few centimetres to several metres thick. In the lithological cross-section, the share of sandstones is approximately 20–30% of the total thickness of the beds. In the Orzesze beds, there are numerous coal seams with numbers from 308 to 364.

3.4. Shallow Mining Extraction

The workings driven in the 308 coal seam are located closest to the surface. The exploitation in this seam was carried out in the years 1855–1857, with a shortwall system with caving to a height of about 2.2 m. The average depth of exploitation was about 15 m. The location of headings in seam 308 in relation to the surface is shown in Figure 9.
At the depth of approx. 80 m, in the years 1904–1907, the mine exploited the coal seam 318. The deposit was mined with a shortwall system with caving to a height of approximately 1.2 m.

4. Results of Investigations

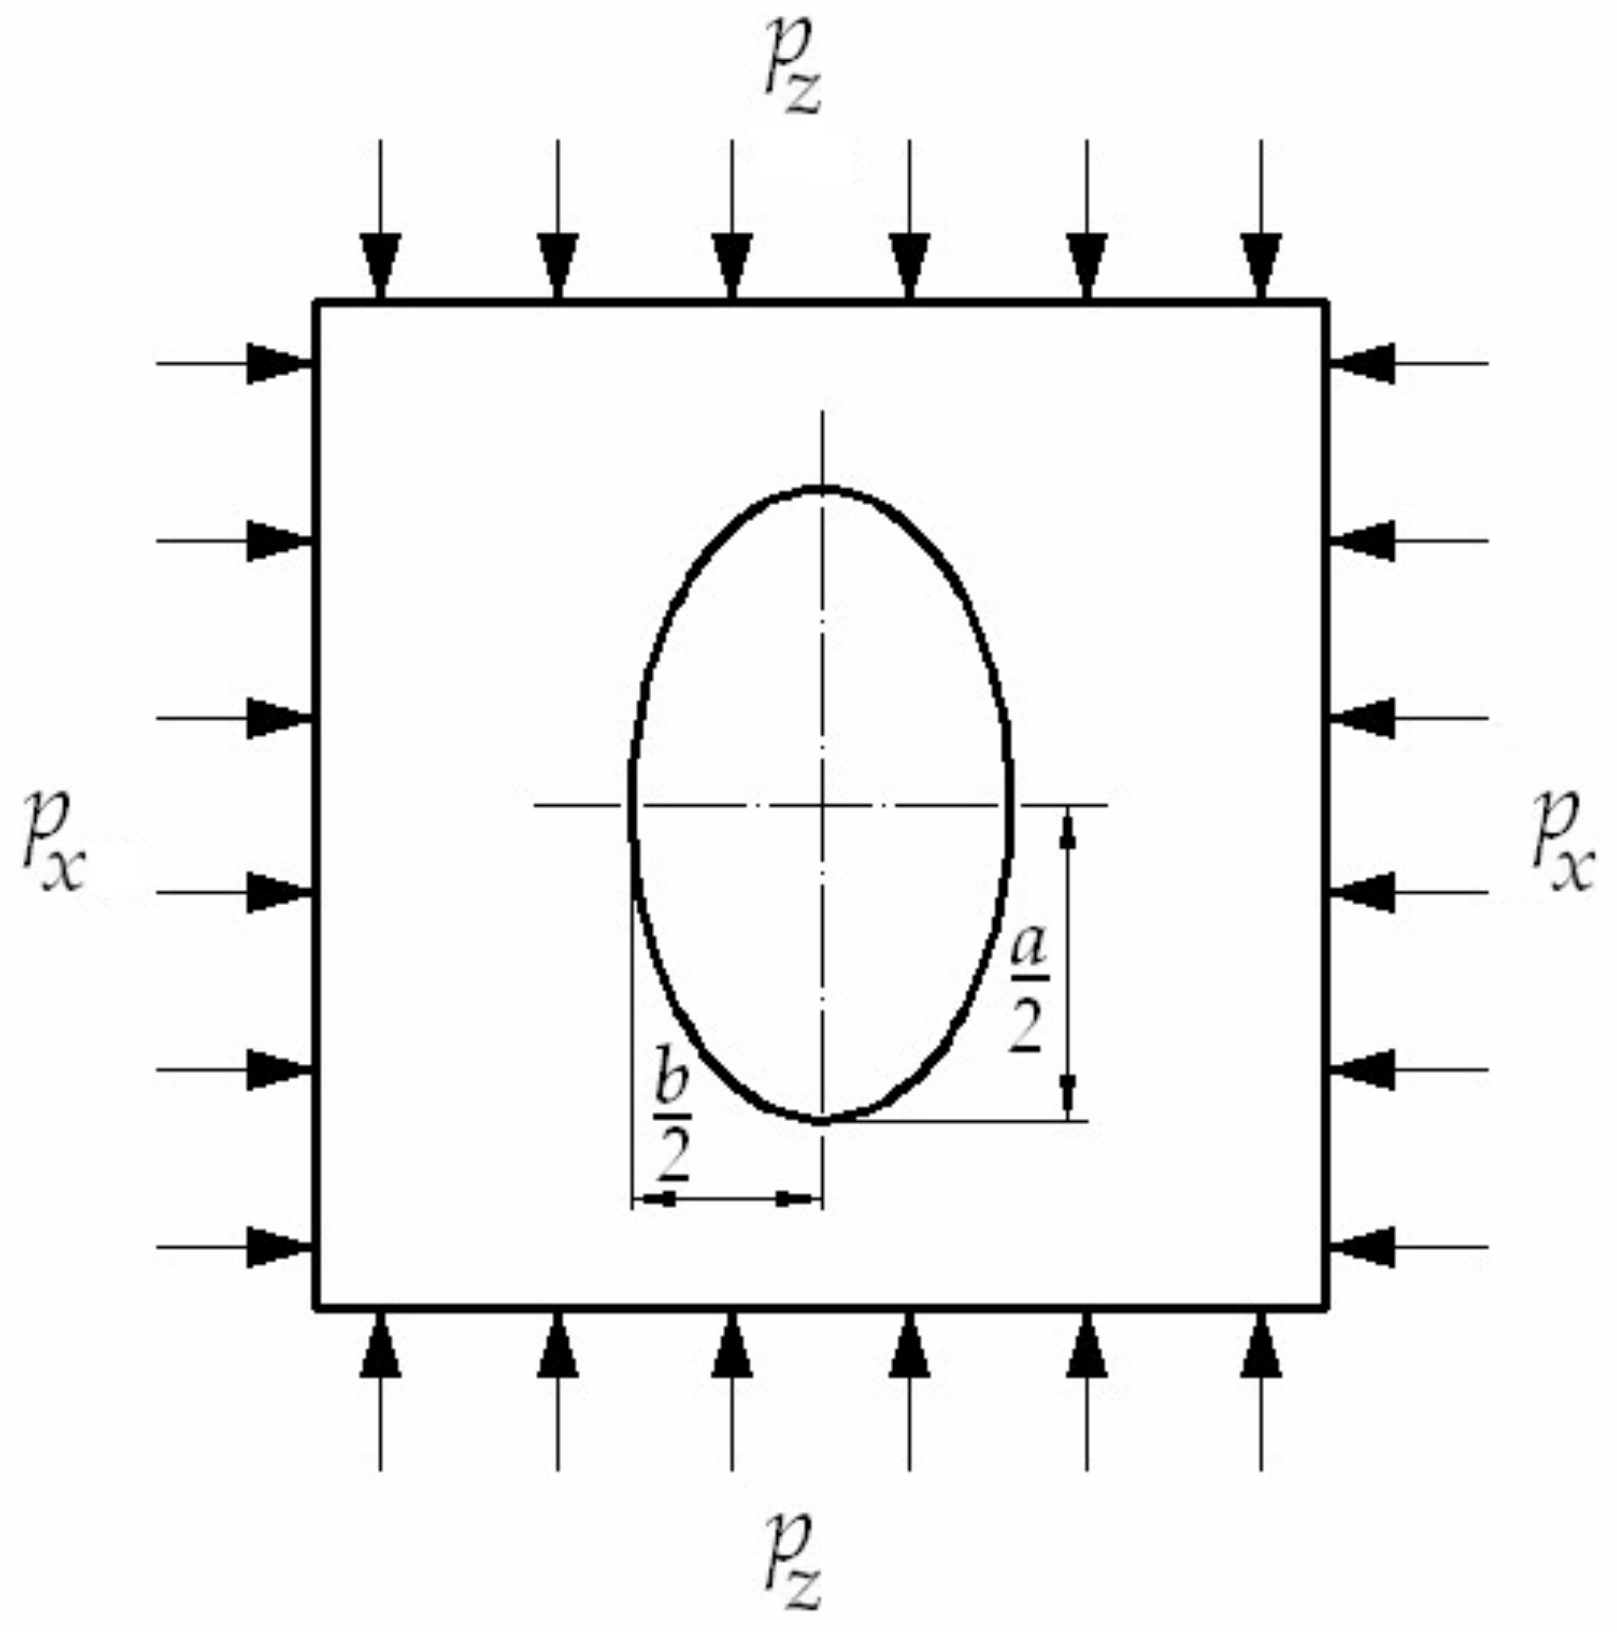
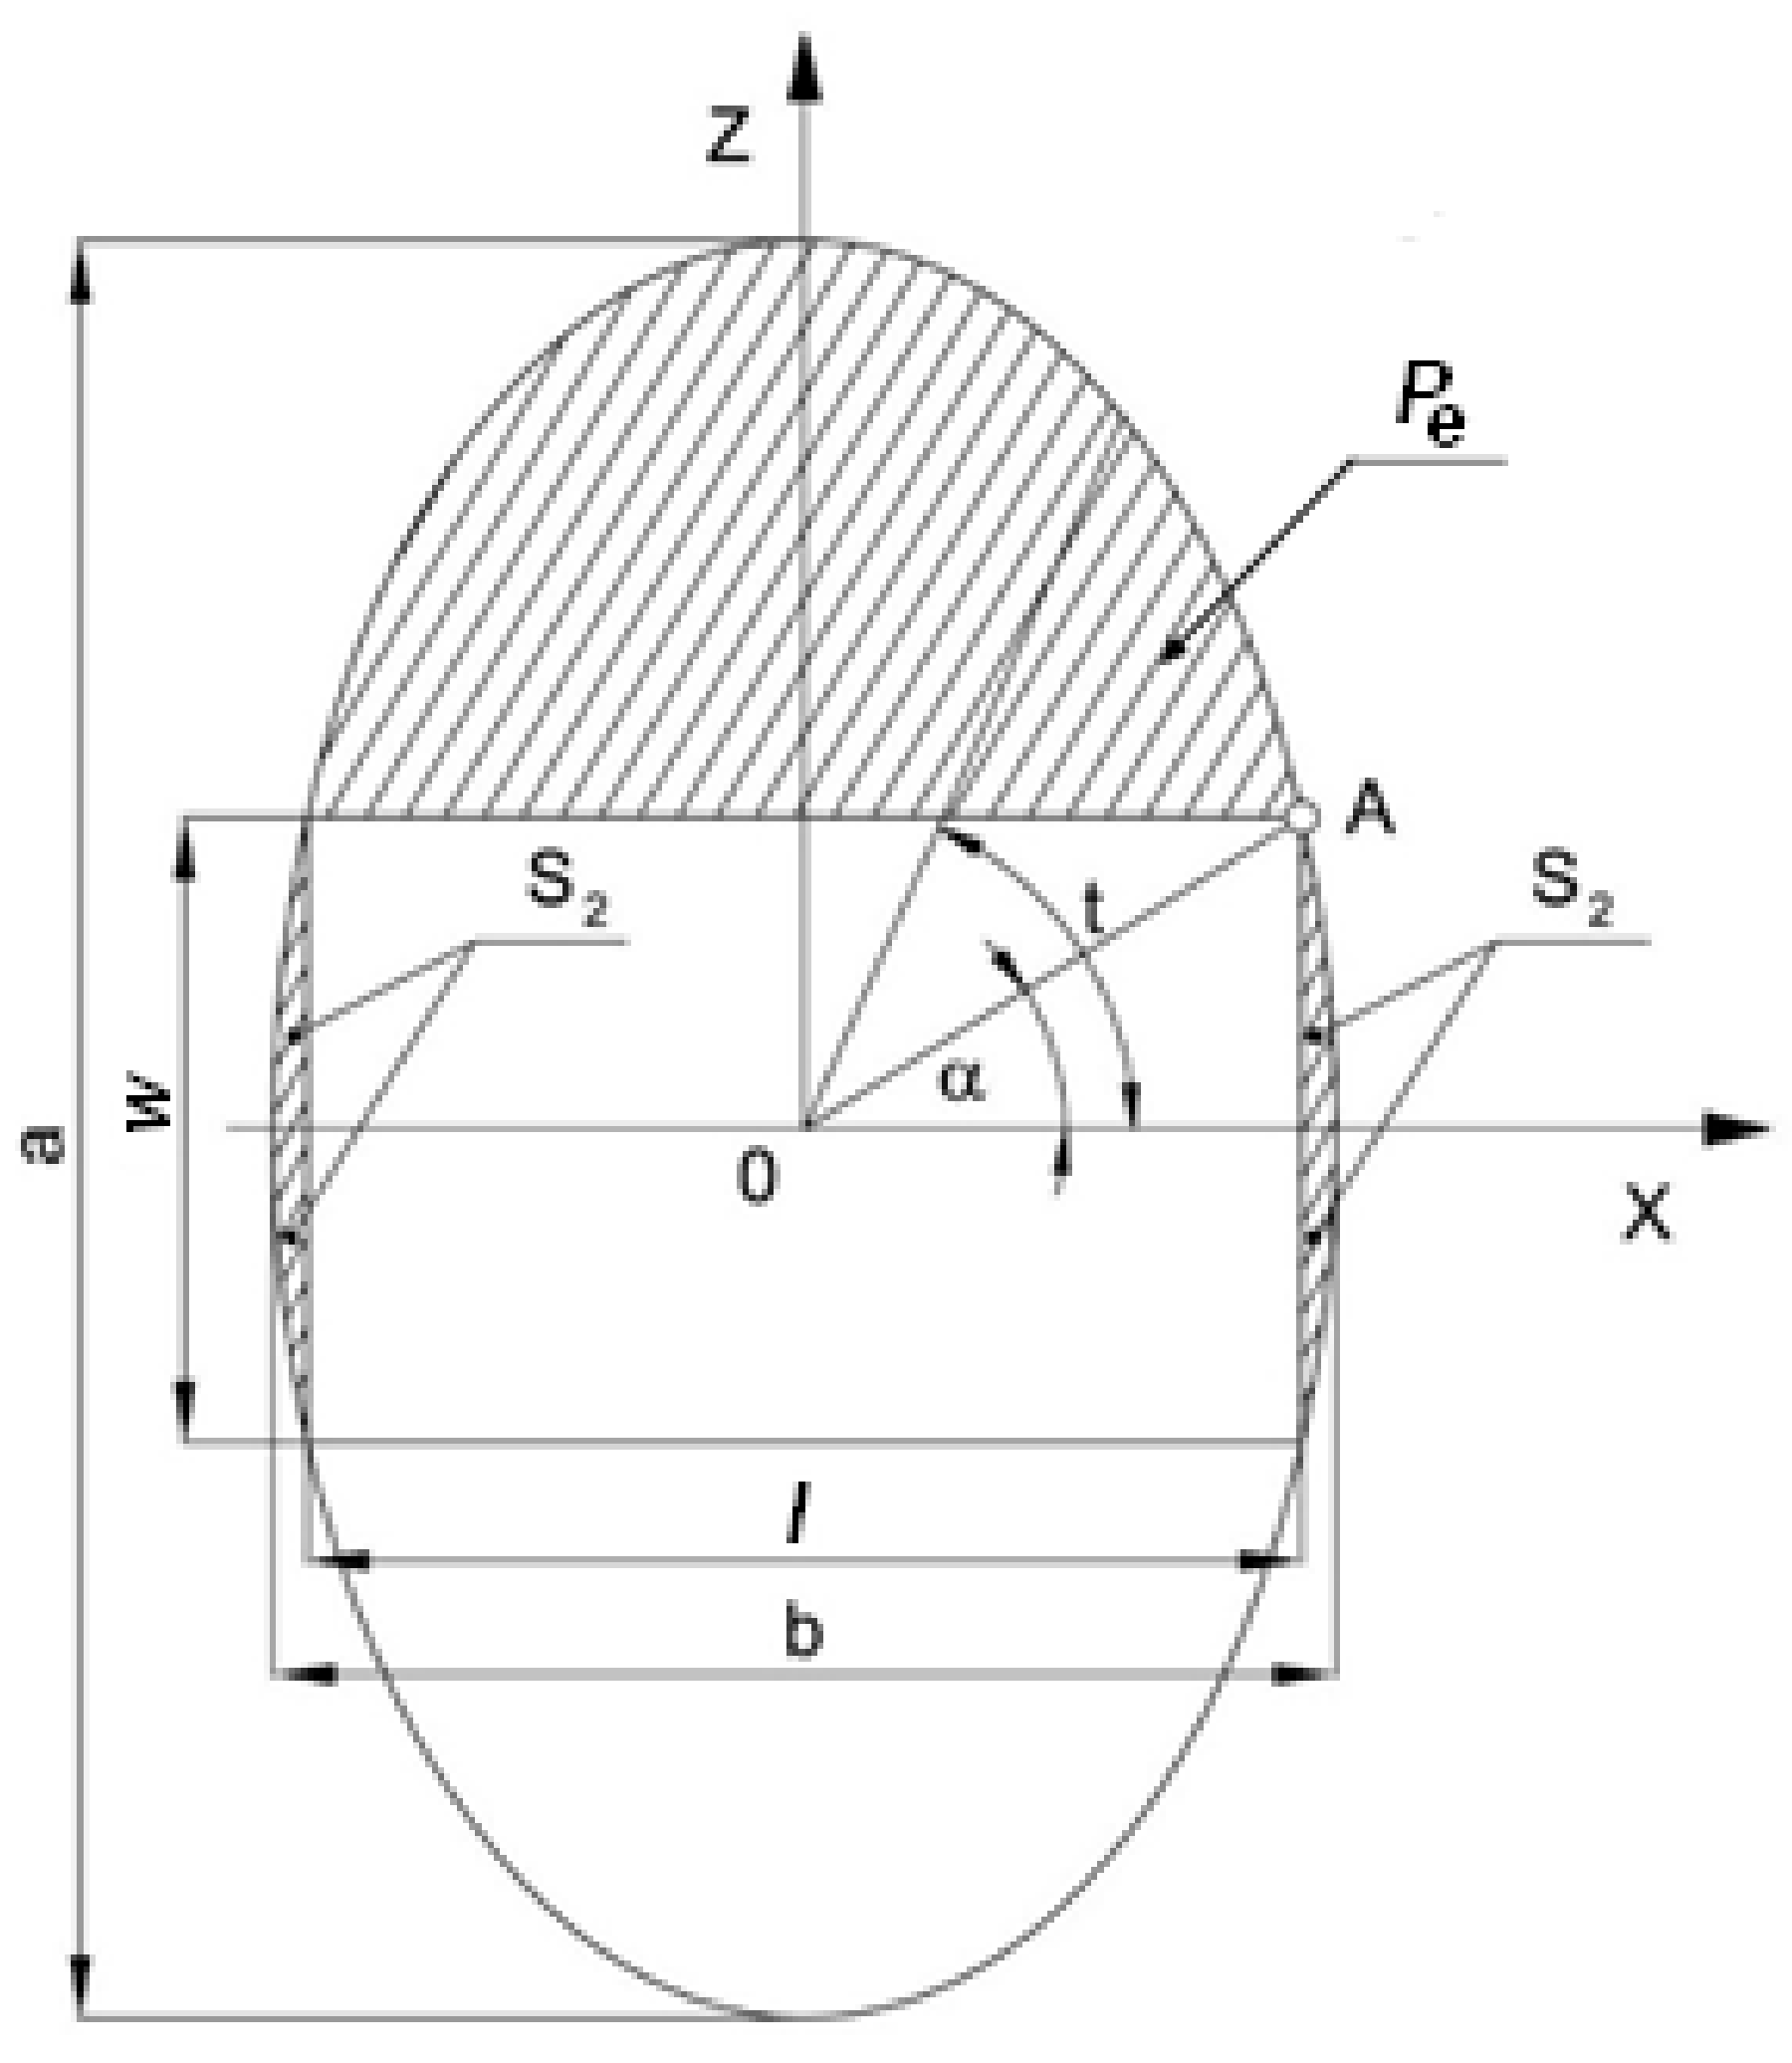
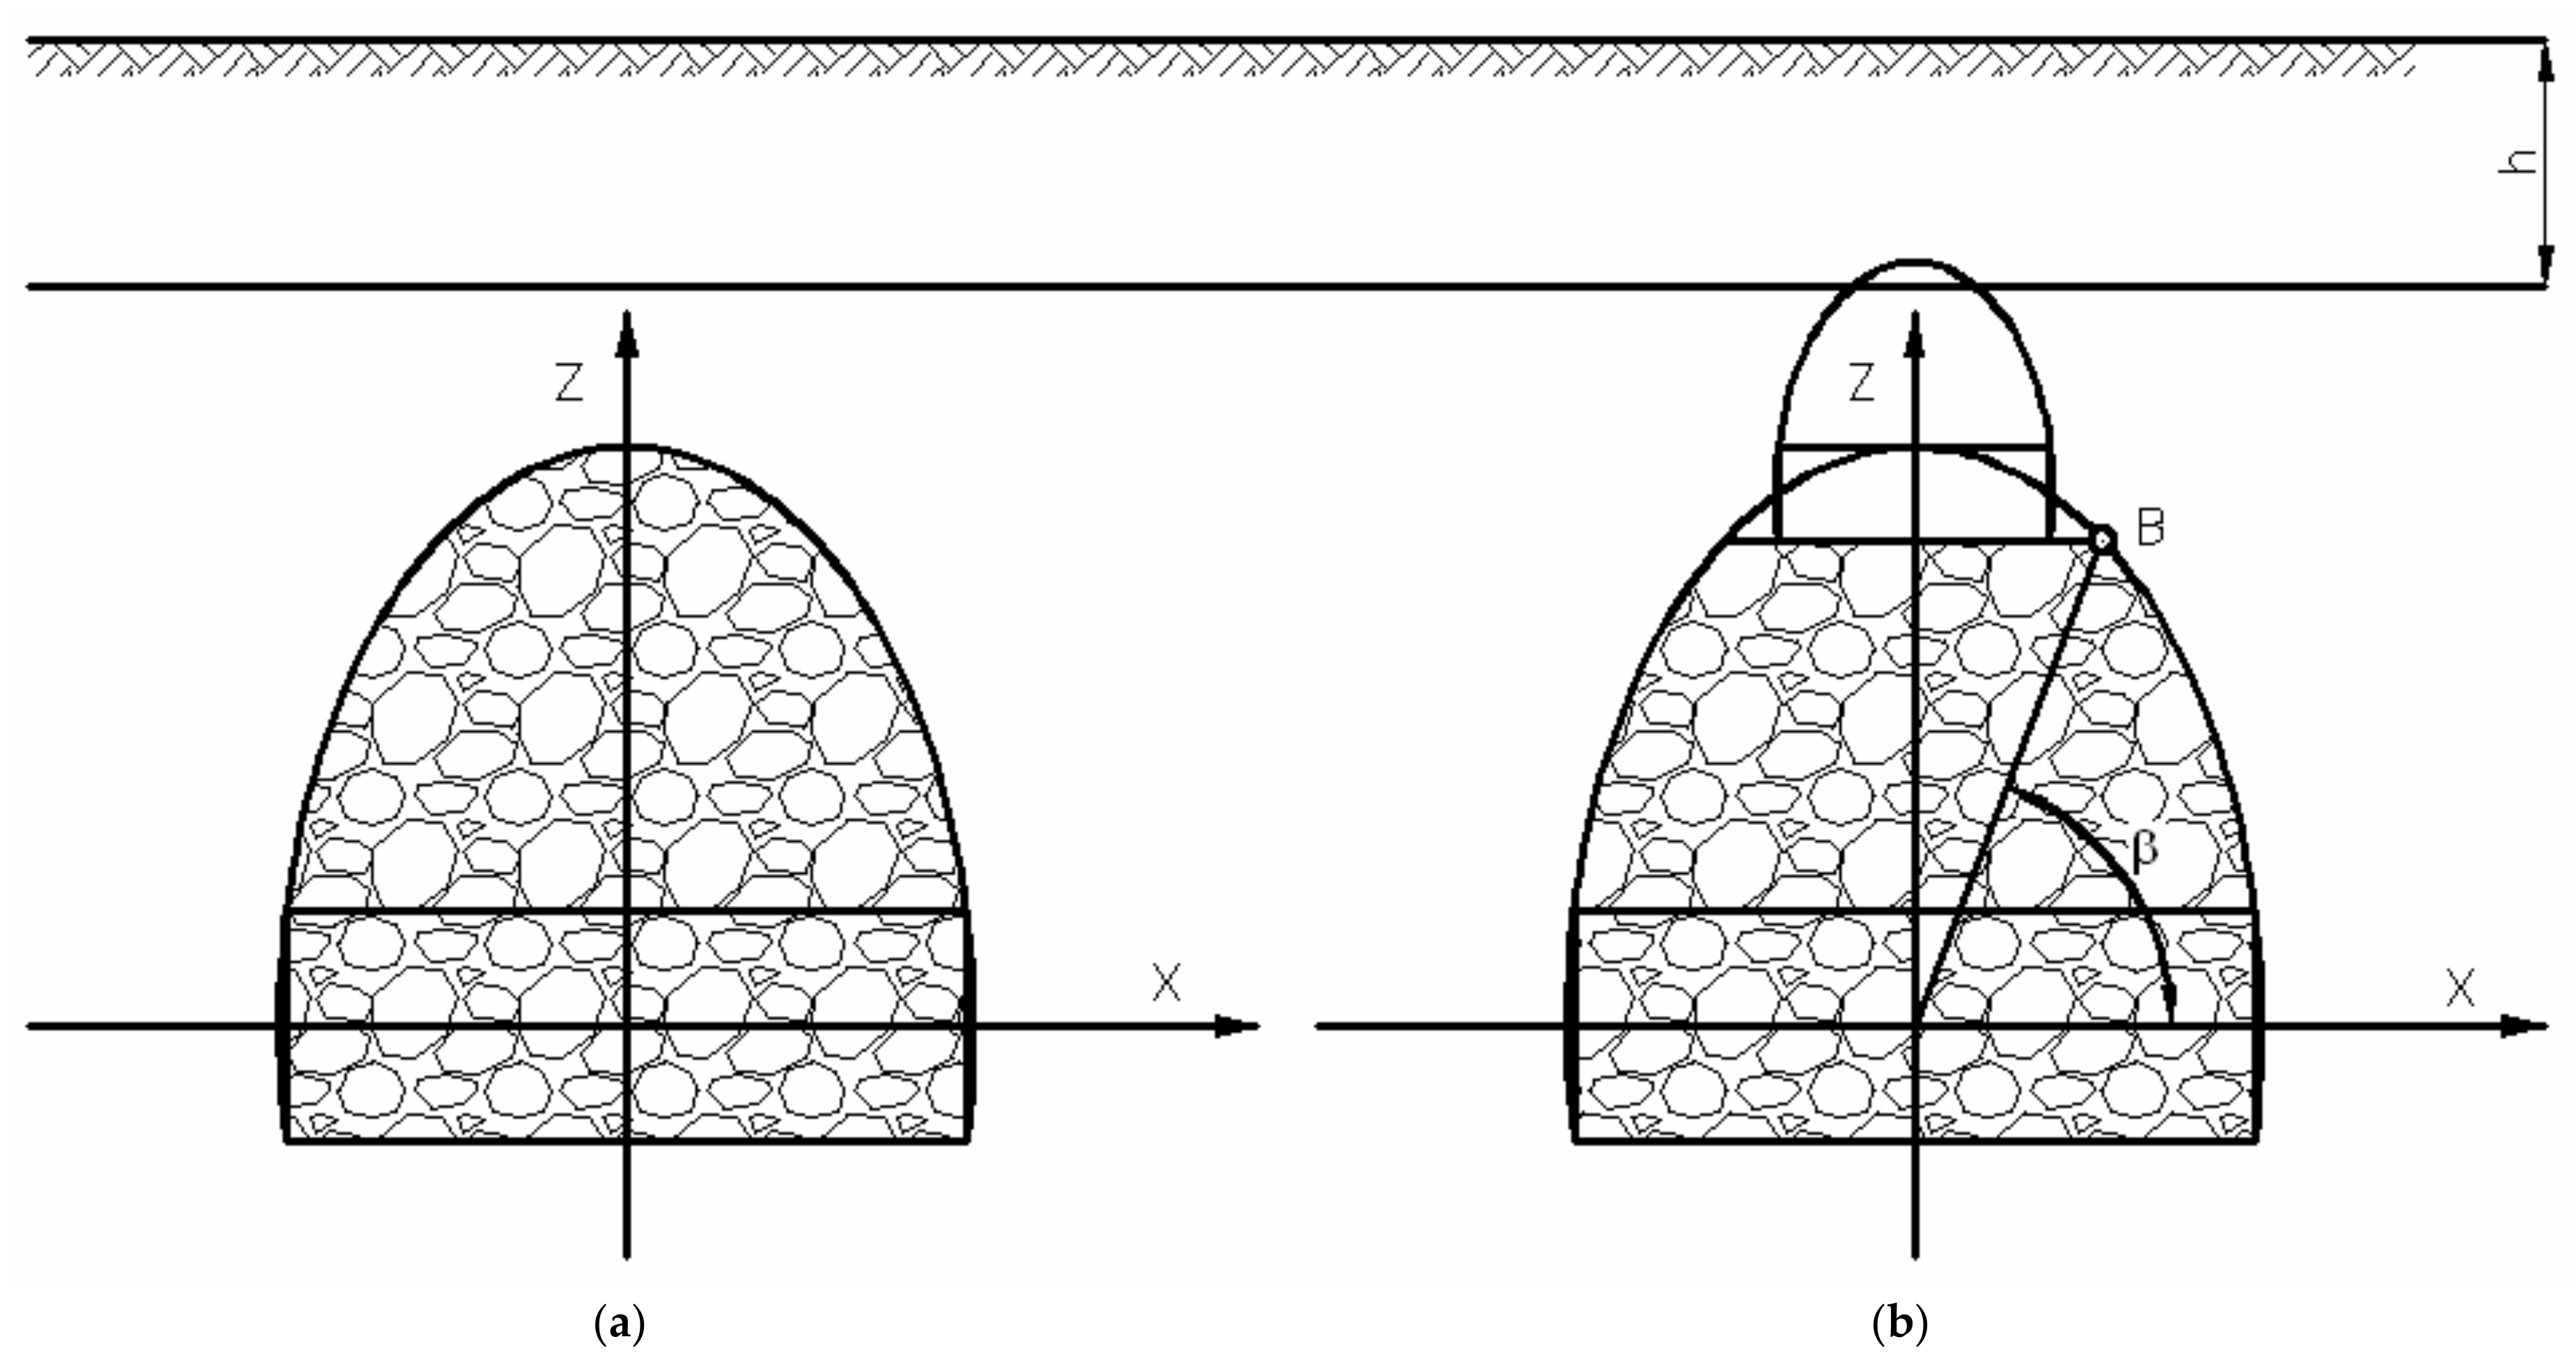
4.1. The Forecast of Sinkhole Formation Hazard

For sinkhole formation hazard, P. Strzałkowski’s method described in Section 2.1 was used. Based on the geological profile of the “M” shaft, the strength parameters of individual rock layers were adopted based on the papers [35,36]. Their summary is presented in Table 1.
Because there is no possibility to directly investigate the underground workings due to complete closure of the mining plant, some assumptions were made basing on the mine documentation—maps and cross sections. According to the thickness of the extracted coal seam, the following dimensions of the gallery with a rectangular cross-section were assumed: height 1.7 m, width 2.0 m. The floor of the gallery was assumed at a depth of 17.3 m.
For sinkhole hazard assessment the software developed for P. Strzałkowski’s method was used [12]. Using the data in accordance with Table 1 and taking the above dimensions of the gallery, the following results were obtained:
  • Vertical component of the primary pressure—pz = −0.412 MPa
  • Horizontal component of the primary pressure—px = −0.059 MPa
  • The fracture ellipse axes length ratio n = −1.25
The above values of pz, px and n suggest that no fracture zone was formed around the underground working—the gallery should be in a stable state—even assuming a lack (destruction) of its support. Therefore, it should be assumed there is no sinkhole formation hazard for this location.

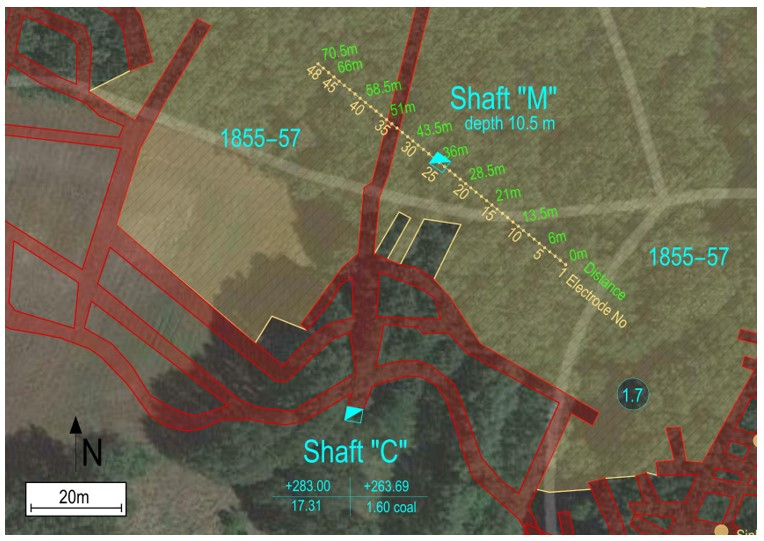
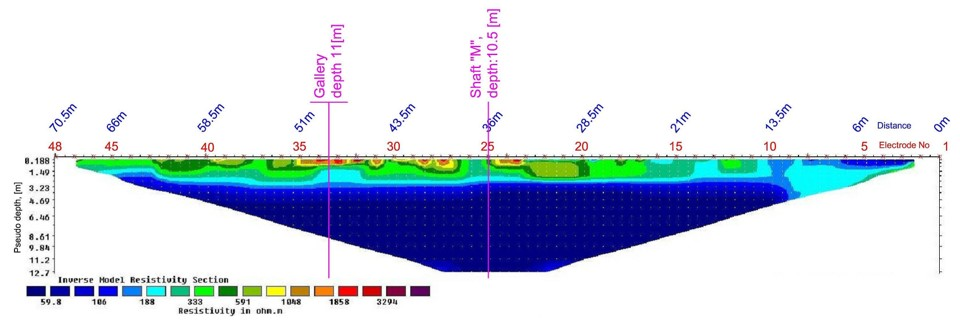
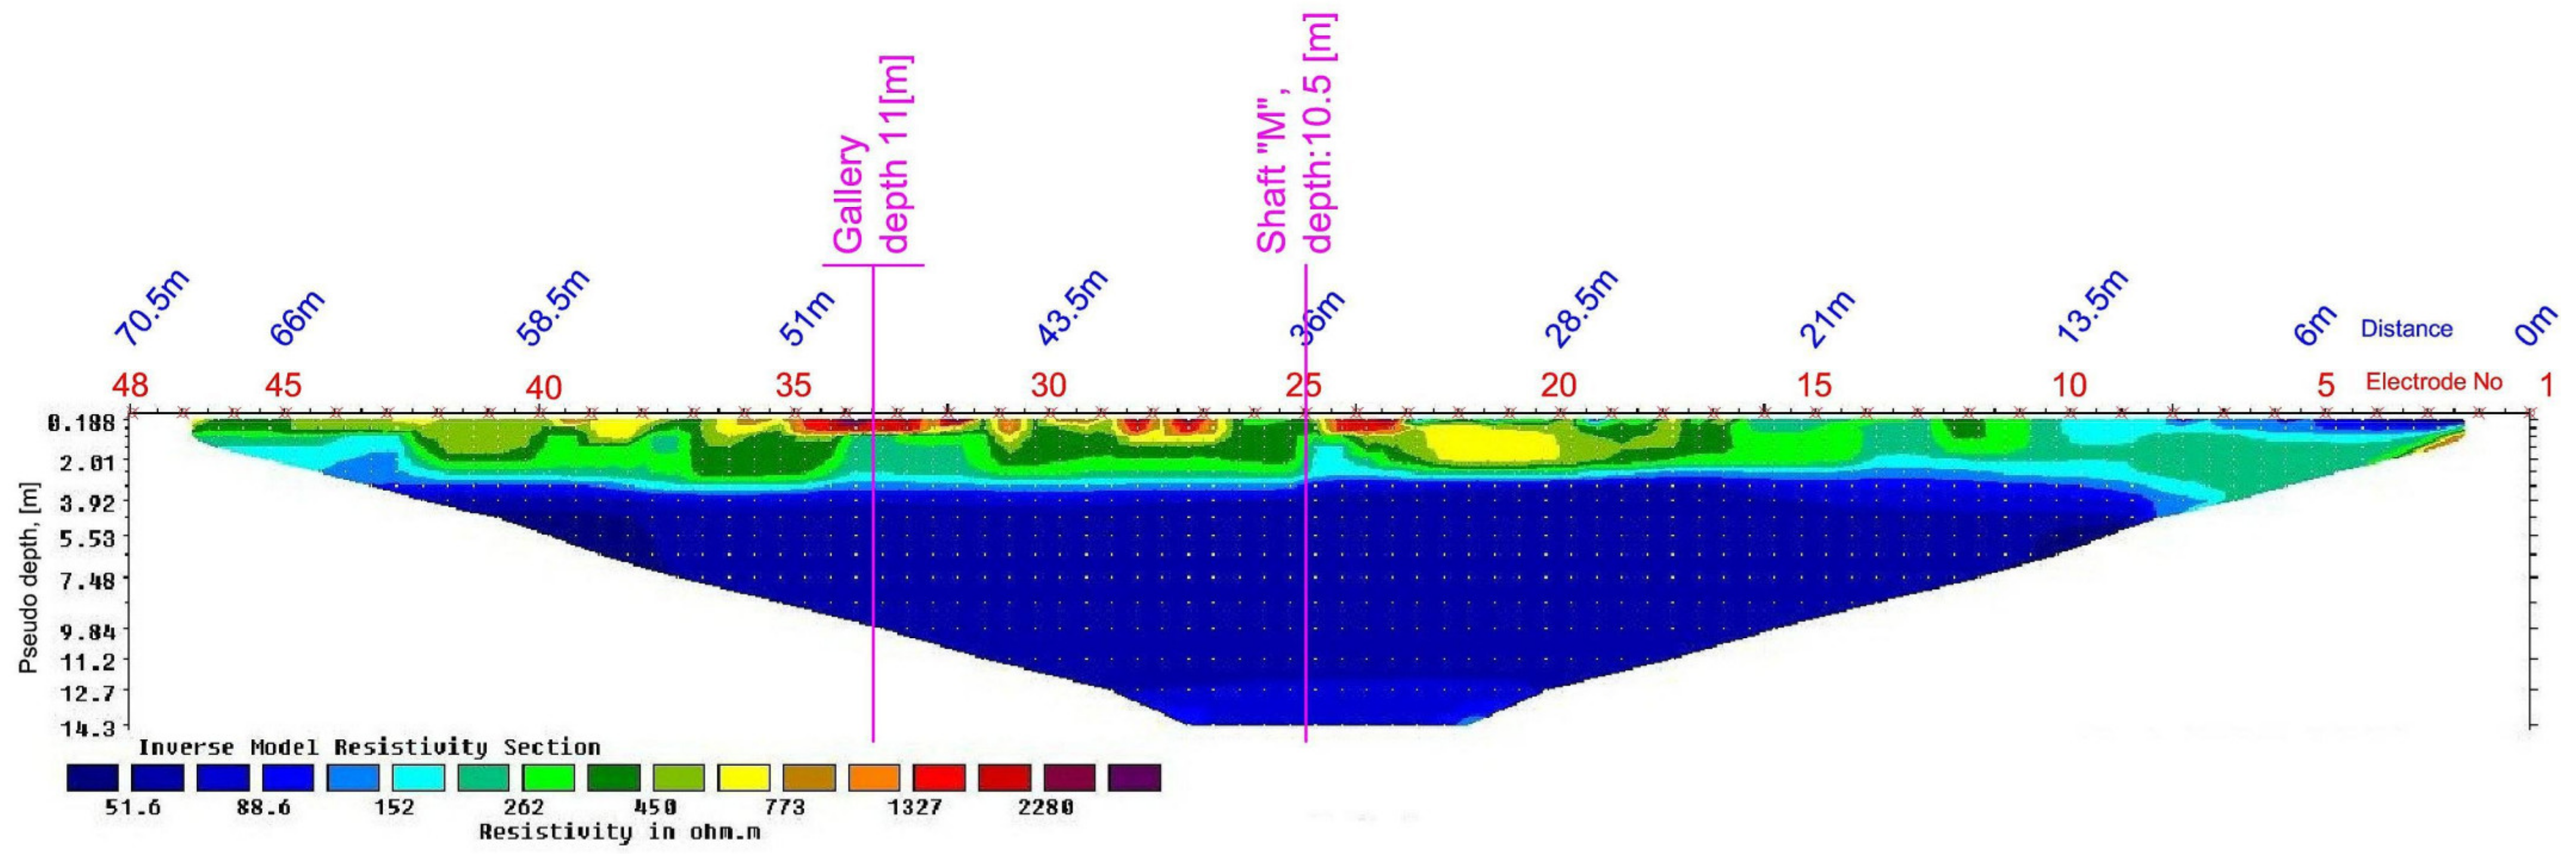
4.2. The Study of the Rock Mass Structure in the Vicinity of Underground Workings Using the Electrical Resistivity Tomography Method

The study was carried out using the ERT method on the profile running through the location of the “M” shaft and the gallery accompanying this shaft from the north. The profile line consisted of 48 electrodes fixed at mutual distances of 1.5 m. Due to the above, the total length of the profile was 70.5 m. The location of the profile in relation to the land surface development and mining workings is shown in Figure 12.
ERT investigation was carried out on the line with 3 electrode arrays: Wenner α, Wenner-Schlumberger and Dipole-Dipole. The results of the investigations are presented in the following figures:
  • Figure 13—ERT profile determined on the basis of measurement with the Wenner α array;
  • Figure 14—ERT profile determined on the basis of measurement with the Wenner—Schlumberger array;
Dipole–dipole results has not been further considered due to poor inversion results. Figure 15 and Figure 16 show a simplified error analysis of the obtained model in relation to the measurement for both analysed arrays. Part “(a)” shows the error histogram; part “(b)” exhibits the correlation of the relative resistivity measured versus obtained from the inversion conducted with Res2Dinv software.
After the analysis of the inversion results with Res2DInv software, the following can be stated:
  • Due to the length of the measuring line equal to 70.5 m, the estimated depth of penetration was about 11–12 m;
  • In both presented cases, the ERT image obtained indicates two characteristic structures in the subsurface layers:
    a thin layer of anthropogenic bulk material;
    a layers of the base subsoil, in this case constituting Carboniferous layers, in particular weathered, weak Carboniferous sandstones, highly waterlogged;
  • In the ERT images at the location of the “M” shaft, there are no clearly visible anomalies that would indicate the loosening of the backfill material used to liquidate the shaft. Only a slight disturbance (lower values of apparent resistivity) in the anthropogenic subsurface layers can be identified. This disturbance may be associated with the location of the shaft, however, this is very local, minor anomaly. The above indicates no hazard to the surface due to the possibility of sinkhole formation in the location of the shaft.
  • The second characteristic place is the intersection of the profile line with the gallery—in the vicinity of electrodes No. 32–35. At that location, a slight resistivity anomaly may be observed, which may be the result of the loosening of rocks over the shallow gallery (at a depth of about 11 m). However, similar to the above described location of shaft “M”, the anomaly is limited to the shallow subsoil layer, so it is hard to prove without using different geophysical method or direct drilling, that it is related to the existence of underground gallery.
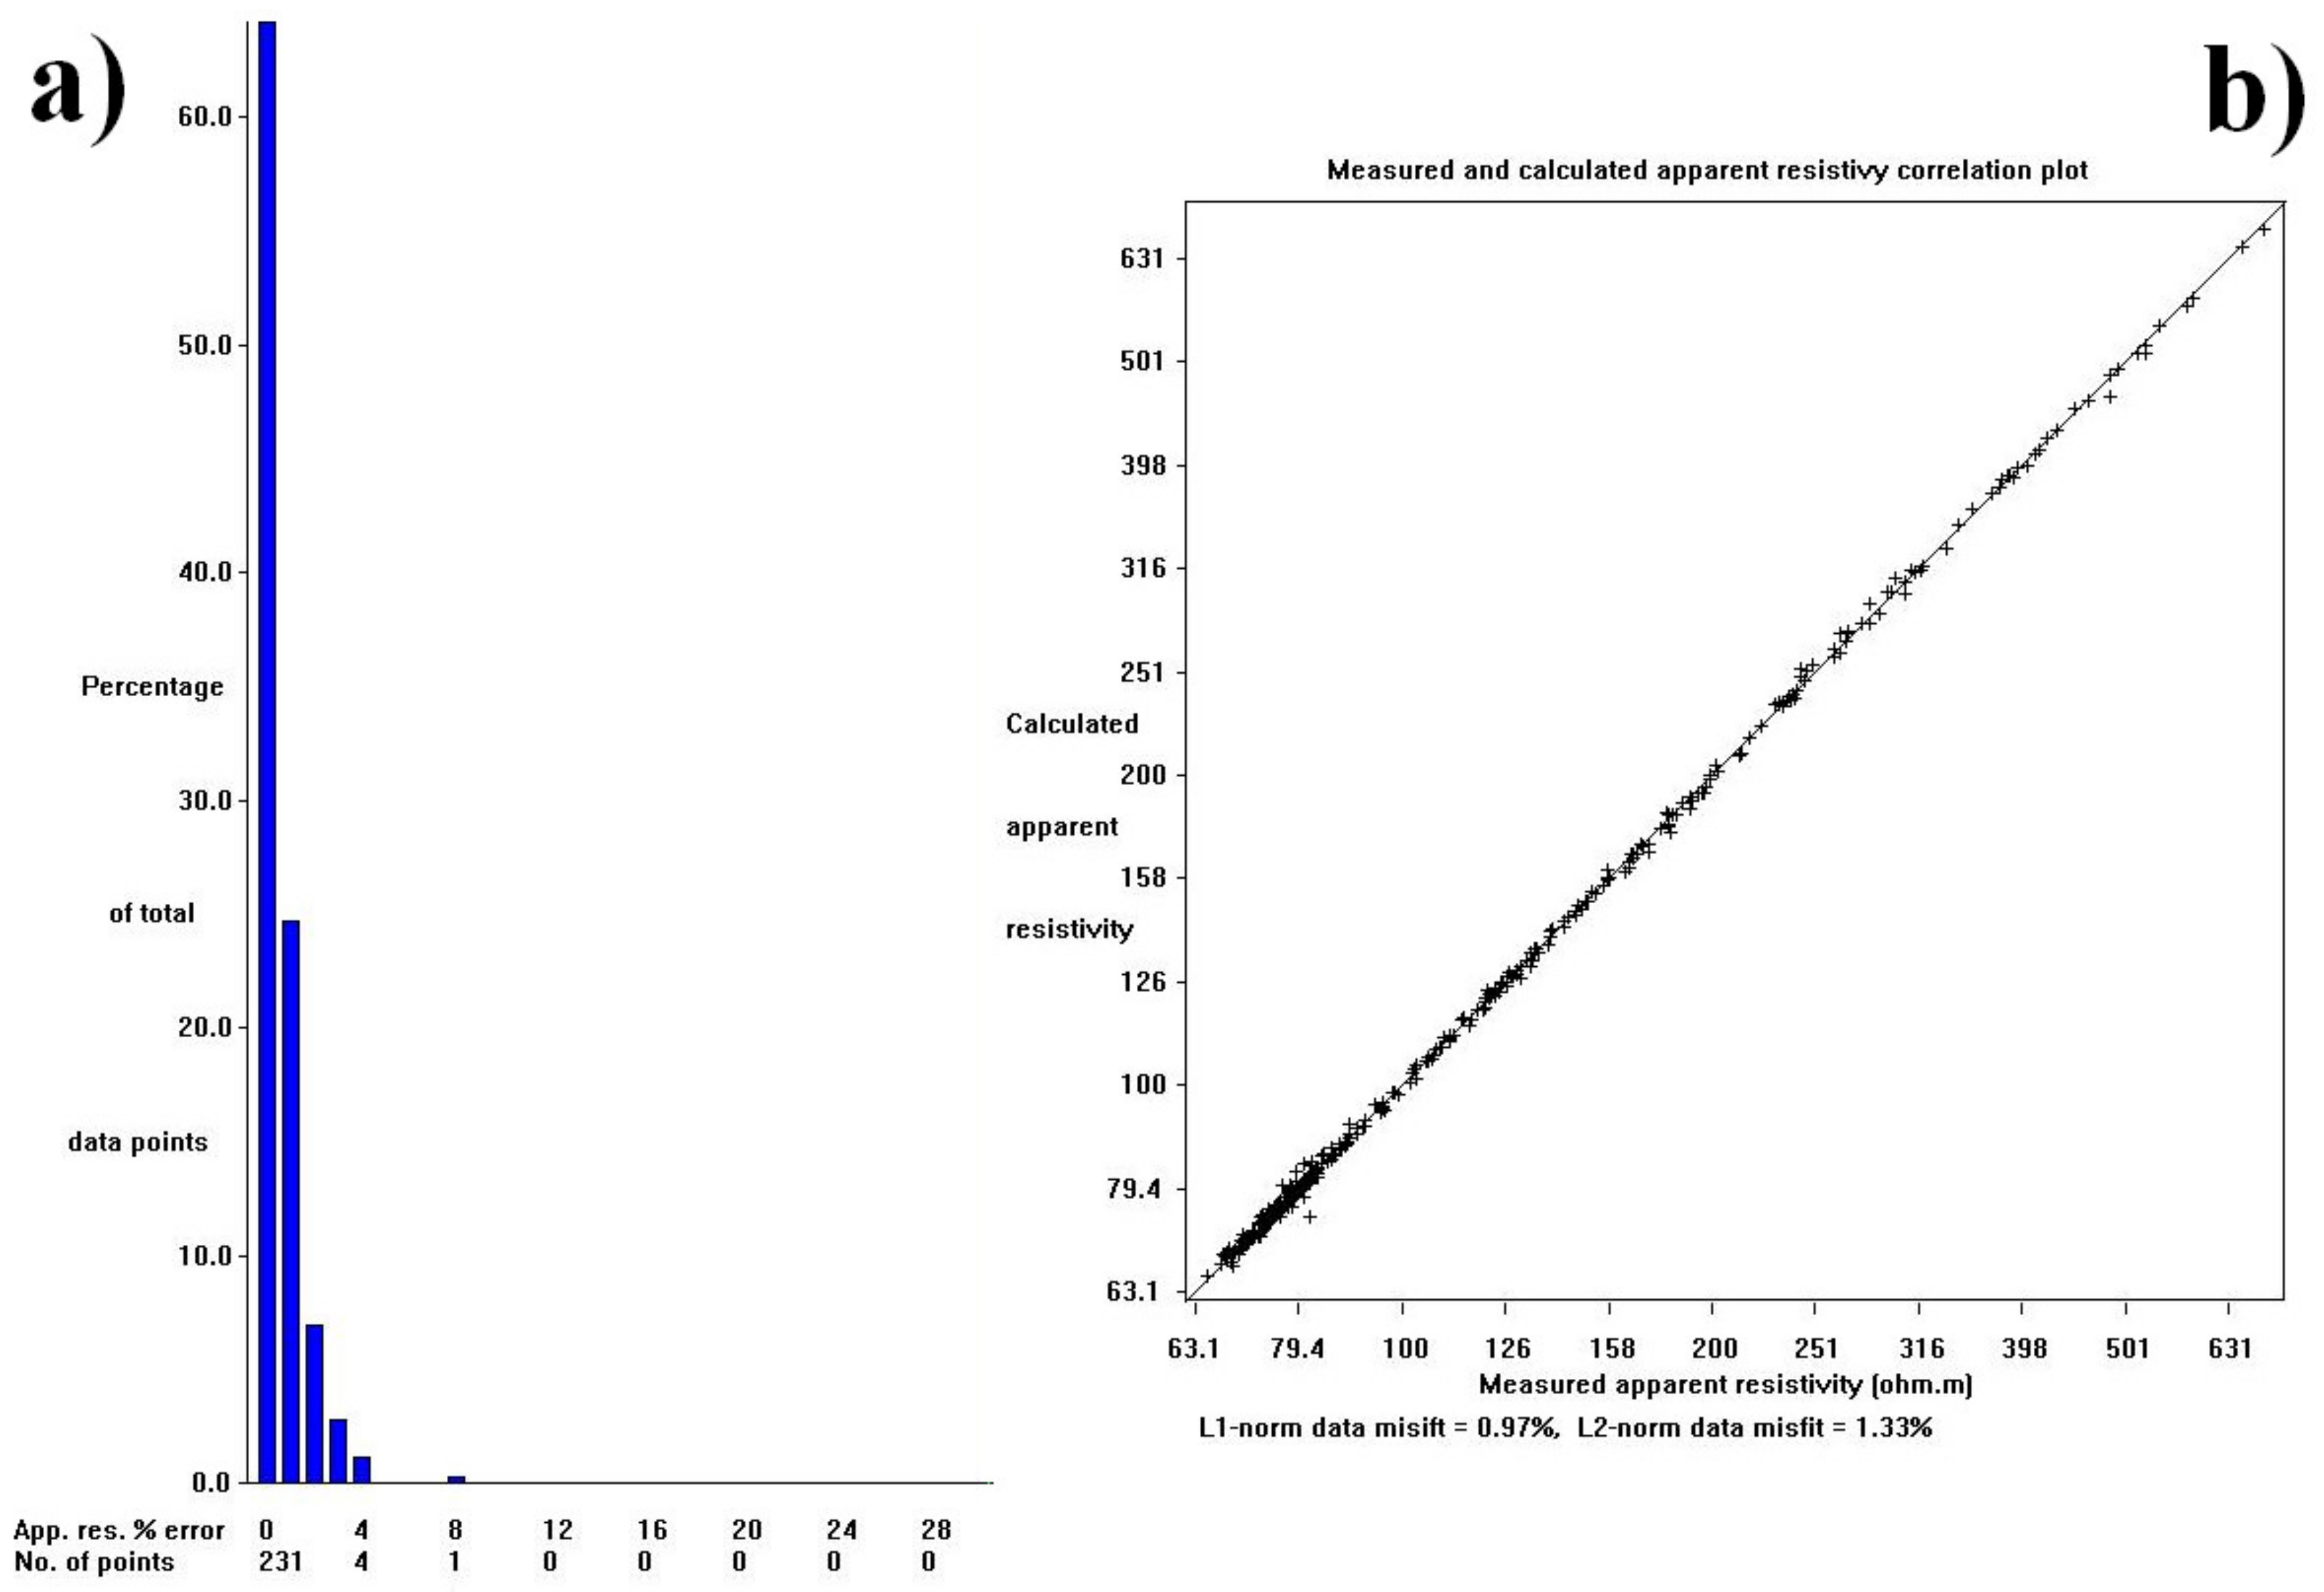
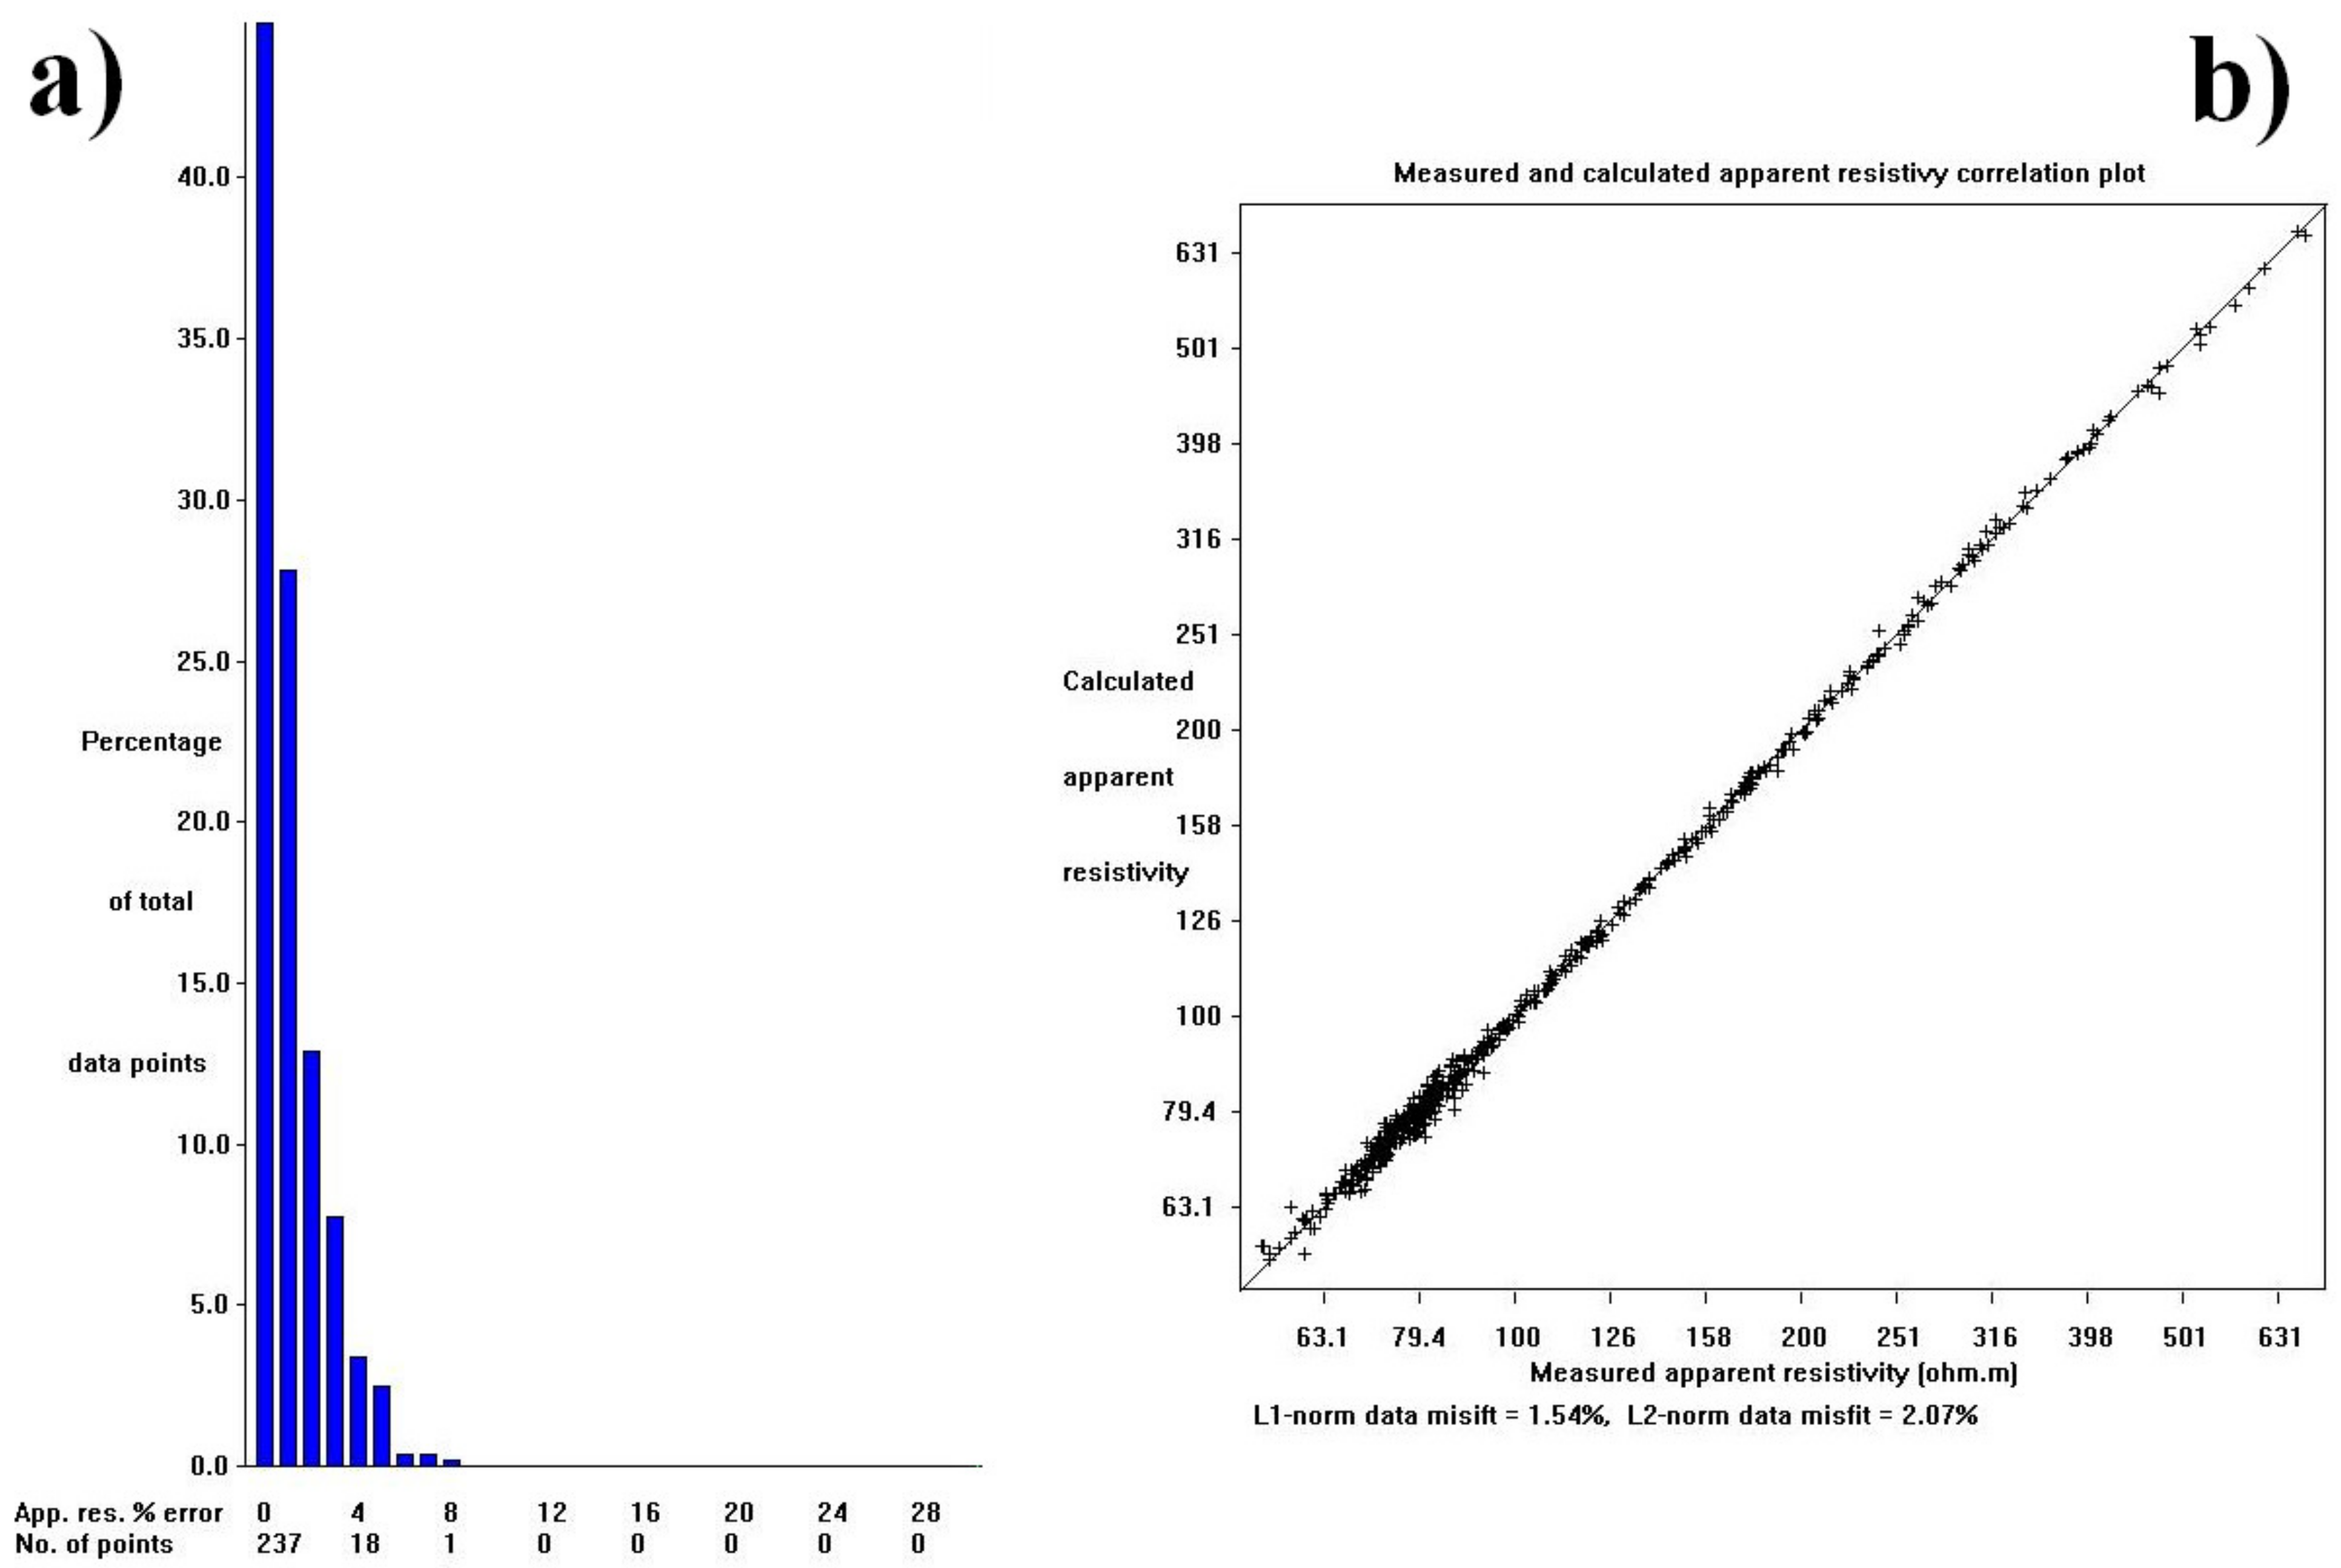
  • The results of the statistical analysis of measurement errors presented in Figure 15, performed with the Res2Dinv program for the Wenner–Schlumberger array, indicate that the quality of the measurement and the calculated inversion of the apparent resistance model does not raise any objections—the percentage error in matching the model to the measurement results was in the range of 1.1–1.5%. For the Wenner α array, the errors obtained are characterised by a similar distribution. Due to the limited volume of this paper, no further details will be provided.

5. Conclusions

This paper presents the results of research on the sinkhole formation hazard in the areas of abandoned mining excavations of a liquidated mining plant. Identification of such a hazard is a problem of great importance, especially in case of highly urbanized areas, as well as in planning of land surface development. It should also be noted that these deformations are not uncommon—neither in Poland nor in other mining countries of the world. The analyses carried out as part of this paper support the following conclusions:
  • The primary reason for the formation of sinkholes over the mining area of considered coal mine are abandoned mining workings located at a depth of up to approximately 80 m. Underground workings located deeper do not pose a threat of sinkhole creation.
  • In the specific case of workings located in the vicinity of the “M” shaft, existing voids in the rock mass will remain stable. Therefore, it should not lead to their transformation into the state of collapse and, as a result, to the occurrence of sinkholes. However, this conclusion should be treated “locally”, referring only to a small part of the whole area. In order to obtain a broader risk assessment, such analyses should be carried out independently for a given location on the basis of local geological and mining conditions.
  • The location of the anomaly found in the ERT surface survey (Figure 13 and Figure 14) coincides with the location of the gallery in the seam 308 at the depth of approximately 11 m. This location should be indicated as posing a threat of future sinkholes. There are no clearly visible anomalies in the locality of the “M” Shaft, which would indicate loosening of the backfilling material used for liquidating of the shaft. Therefore, the occurrence of a sinkhole at the location of the shaft can be regarded as unlikely.
  • The application of the presented methodology combining an analytical model and geophysical surveys makes it possible to assess the degree of hazard posed by a sinkhole on the surface of a post-mining area. The results of such tests can be useful in defining the land use and developing technical projects for reclamation and revitalisation of post-mining areas. However, for a more precise risk assessment, it is recommended to use an additional geophysical method and perform drilling confirming the occurrence of voids determined by non-invasive methods.

Author Contributions

Conceptualization, P.S. and R.Ś.; methodology, P.S. and R.Ś.; software, P.S.; validation, P.S. and K.S.; formal analysis, P.S., R.Ś., K.S.; investigation, R.Ś., K.S.; resources, P.S. and R.Ś.; data curation, K.S.; writing—original draft preparation, P.S., R.Ś.; K.S.; writing—review and editing, P.S. and K.S.; visualization, K.S.; K.K.; supervision, K.S.; project administration, K.S.; K.K. All authors have read and agreed to the published version of the manuscript.

Funding

This work was supported by the “Excellence Initiative Research University” Programme, Silesian University of Technology, Gliwice, project: 31/010/SDU20/0006-10.

Institutional Review Board Statement

Not applicable.

Informed Consent Statement

Not applicable.

Data Availability Statement

The data presented in this study are available on request from the corresponding author.

Acknowledgments

The authors thankfully acknowledge the Silesian University of Technology, Poland, for providing all the facilities to perform the research work.

Conflicts of Interest

The authors declare no conflict of interest.

References

  1. Wu, Z.; Zhang, W.H.; Liu, Y.S.; Ren, D.; Xun, J.Z.; Bai, J.X. Analysis of the response of glaciers to climate change based on the glacial dynamics model. Environ. Earth Sci. 2020, 79, 438. [Google Scholar] [CrossRef]
  2. Wang, J.; Huo, A.; Zhang, X.; Lu, Y. Prediction of the response of groundwater recharge to climate changes in Heihe River basin, China. Environ. Earth Sci. 2020, 79, 13. [Google Scholar] [CrossRef]
  3. Kratzsch, H. Mining Subsidence Engineering; Springer: Berlin/Heidelberg, Germany; New York, NY, USA, 1983; p. 543. [Google Scholar]
  4. Whittaaker, B.N.; Reddish, D.J. Subsidence. Occurrence, Prediction and Control; Elsevier: New York, NY, USA, 1989; p. 528. [Google Scholar]
  5. Knothe, S. Forecasting the Impact of Mining Exploitations; Publishing House “Śląsk”: Katowice, Poland, 1984; p. 122. [Google Scholar]
  6. Orwat, J. Depth of the mining exploitation and its progress in the time, and a random dispersion of observed terrain subsidence and their derivatives. IOP Conf. Ser. Earth Environ. Sci. 2019, 261, 012037. [Google Scholar] [CrossRef]
  7. Orwat, J.; Gromysz, K. Occurrence consequences of mining terrain surface discontinuous linear deformations in a residential building. J. Phys. Conf. Ser. 2021, 1781, 012013. [Google Scholar] [CrossRef]
  8. Ścigała, R.; Szafulera, K. Linear discontinuous deformations created on the surface as an effect of underground mining and local geological conditions—Case study. Bull. Eng. Geol. Environ. 2019, 1–10. [Google Scholar] [CrossRef]
  9. Strzałkowski, P.; Szafulera, K. Occurrence of linear discontinuous deformations in Upper Silesia (Poland) in conditions of intensive mining extraction—Case study. Energies 2020, 13, 1897. [Google Scholar] [CrossRef] [Green Version]
  10. Chudek, M.; Janusz, W.; Zych, J. Study on diagnosis and prognosis of the formation of discontinuous deformation due to underground mining. Res. J. Silesian Univ. Technol. Gliwice 1988, 141, 165. (In Polish) [Google Scholar]
  11. Singh, K.B.; Dhar, B.B. Sinkhole subsidence due to mining. Geotech. Geol. Eng. 1997, 15, 327–341. [Google Scholar] [CrossRef]
  12. Strzałkowski, P. Mathematical model of forecasting the formation of sinkhole using Salustowicz’s theory. Arch. Min. Sci. 2015, 1, 63–71. [Google Scholar] [CrossRef] [Green Version]
  13. Strzałkowski, P. Sinkhole formation hazard assessment. Environ. Earth Sci. 2019, 78, 9. [Google Scholar] [CrossRef] [Green Version]
  14. Dubiński, J.; Mutke, G. Characteristics of mining tremors within the near-wave field zone. Pure Appl. Geophys. 1996, 249–261. [Google Scholar] [CrossRef]
  15. Strzałkowski, P.; Ścigała, R. Assessment of post-mining terrain suitability for economic use. Int. J. Environ. Sci. Technol. 2020, 17, 3143–3152. [Google Scholar] [CrossRef] [Green Version]
  16. Wrona, P.; Różański, Z.; Pach, G. Closed coal mine shaft as a source of carbon dioxide emissions. Environ. Earth Sci. 2016, 75, 1139. [Google Scholar] [CrossRef] [Green Version]
  17. Hutcheson, S.M.; Kipp, J.A.; Dinger, J.S.; Carey, D.I.; Sendlein, L.V.A.; Secrist, G.L. Effects of Longwall Mining on Hydrogeology, Leslie County, Kentucky Part. 3: Post-Mining Conditions; University of Kentucky: Lexington, KY, USA, 2018. [Google Scholar]
  18. Lagny, C. The emissions of gases from abandoned mines: Role of atmospheric pressure changes and air temperature on the surface. Environ. Earth Sci. 2014, 71, 923. [Google Scholar] [CrossRef] [Green Version]
  19. Hunter, J. Old mines and new sinkholes along the Hucklow Edge vein, Derbyshire. Am. Geol. 2015, 18, 213–226. [Google Scholar]
  20. Özel, S.; Darıcı, N. Environmental hazard analysis of a gypsum karst depression area with geophysical methods: A case study in Sivas (Turkey). Environ. Earth Sci. 2020, 79, 115. [Google Scholar] [CrossRef]
  21. Bathrellos, G.D.; Gaki-Papanastassiou, K.; Skilodimou, H.D.; Papanastassiou, D.; Chousianitis, K.G. Potential suitability for urban planning and industry development by using natural hazard maps and geological—Geomorphological parameters. Environ. Earth Sci. 2012, 66, 537–548. [Google Scholar] [CrossRef]
  22. Strzałkowski, P. The influence of selected mining and natural factors on the sinkhole creation hazard based on the case study. Environ. Earth Sci. 2021, 80, 117. [Google Scholar] [CrossRef]
  23. Bell, F.G. Land development. State of the art in the location of old mine shafts. Bull. Inst. Ass. Eng. Geol. 1988, 37, 91–98. [Google Scholar] [CrossRef]
  24. Stałęga, S. Principles of Liquidation of Shafts and Surrounding Workings in Hard Coal Mines. In Technical Handbook; Publishing House of Central Mining Institute: Katowice, Poland, 1988. [Google Scholar]
  25. Kotyrba, A.; Kortas, Ł. Sinkhole hazard assessment in the area of abandoned mining shaft basing on microgravity survey and modelling—Case study from the Upper Silesia Coal Basin in Poland. J. Appl. Geophys. 2016, 130, 62–70. [Google Scholar] [CrossRef]
  26. Pilecki, Z. The role of geophysical methods in the estimation of sinkhole threat in the post-mining areas of shallow exploitation in the Upper Silesian Coal Basin, Poland. Mineral. Resour. Manag. 2008, 24/3, 27–40. [Google Scholar]
  27. Fajklewicz, Z. Applied Gravimetry; AGH University of Science and Technology Press: Kraków, Poland, 2007; p. 434. [Google Scholar]
  28. Fajklewicz, Z. Outline of Applied Geophysics; Geological Publishing House: Warsaw, Poland, 1972; p. 923. [Google Scholar]
  29. Loke, M.H.; Barker, R.D. Practical techniques for 3D resistivity surveys and data inversion. Geophys. Prospect. 1996, 44, 499–523. [Google Scholar] [CrossRef]
  30. Strzałkowski, P. The proposal of predicting formation of sinkholes with an exemplary application. J. Min. Sci. 2017, 53, 53–58. [Google Scholar] [CrossRef]
  31. Sałustowicz, A. Outline of Rock Mass Mechanics; Publishing House “Śląsk”: Katowice, Poland, 1956; p. 191. [Google Scholar]
  32. Strzałkowski, P.; Ścigała, R.; Szafulera, K.; Tomiczek, K. Forecasting of Discontinuous Deformations of Surface Type on the Mining and Post-Mining Areas; Publishing House of Silesian University of Technology: Gliwice, Poland, 2020; p. 127. [Google Scholar]
  33. GF Instruments. ARES II—Automatic Resistivity and IP System, Brno, Czech Republic. 2014. Available online: http://www.gfinstruments.cz (accessed on 30 March 2021).
  34. Loke, M.H. Electrical Imaging Surveys for Environmental and Engineering Studies, a Practical Guide to 2-D and 3-D Surveys; Malaysia, 1997–2000. Available online: https://www.yumpu.com/en/document/read/7478873 (accessed on 20 April 2021).
  35. Chudek, M. Rock Mass Mechanics with Basics of Environment Management in Mining and Post-Mining Areas; Publishing House of Silesian University of Technology: Gliwice, Poland, 2010; p. 499. [Google Scholar]
  36. Kidybiński, A. Fundamentals of Mine Geotechnics; Publishing House “Śląsk”: Katowice, Poland, 1982; p. 515. [Google Scholar]
Figure 1. Schematic diagram of the load of a flat plate with an elliptic opening: px—horizontal component of the primary pressure, pz—vertical component of the primary pressure.
Energies 14 02495 g001
Figure 2. The relaxed zone around the void (excavation) in the rock mass [12,13].
Energies 14 02495 g002
Figure 3. Possibilities of caved zone occurrence in the vicinity of a void [12,13]: (a) rocks originally contained in the relaxed zone, after crushing, tightly fill the excavation (void) and the relaxed zone; (b) when void is filled with crushed rocks from the relaxed zone, a secondary void is created at the upper point of the ellipse.
Energies 14 02495 g003
Figure 4. Diagram of the basic measurement in the electrical resistivity method.
Energies 14 02495 g004
Figure 5. A schematic sketch of the electrical resistivity tomography (ERT) method for three penetration levels of subsurface layers.
Energies 14 02495 g005
Figure 6. Location of the research area on the map of Poland.
Energies 14 02495 g006
Figure 7. Depth ranges of workings above which sinkholes formed along with the number of observed sinkholes.
Energies 14 02495 g007
Figure 8. The genesis of the formed sinkholes: 1—galleries; 2—extracted parts of deposit; 3—shafts; 4—open pit working; 5—faults.
Energies 14 02495 g008
Figure 9. Location of the research area against the underground workings.
Energies 14 02495 g009
Figure 10. The sinkholes identified in the research area: sinkhole 1—(a) sinkhole 2—(b).
Energies 14 02495 g010
Figure 11. Lithological profile of the B–32 borehole and the “M” shaft.
Energies 14 02495 g011
Figure 12. Location of the ERT profile against mining workings.
Energies 14 02495 g012
Figure 13. ERT profile obtained on the line with the Wenner α electrode array.
Energies 14 02495 g013
Figure 14. ERT profile obtained on the line with the Wenner–Schlumberger electrode array.
Energies 14 02495 g014
Figure 15. (a) Error histogram for Wenner array; and (b) the correlation plot of the relative resistivity measured and obtained on the basis of inversion carried out with Res2Dinv program.
Energies 14 02495 g015
Figure 16. (a) Error histogram for Wenner-Schlumberger array; and (b) the correlation plot of the relative resistivity measured and obtained on the basis of inversion carried out with Res2Dinv program.
Energies 14 02495 g016
Table 1. Strength properties of the rocks constituting the rock mass.
No.γ (MN/m3)Rr(MPa)kr(−)hi (m)
10.0270.02110.9
20.0250.51.154.7
30.0151.11.11.7
Explanation: γ—bulk density of rocks, Rr—tensile strength, kr—rock loosening coefficient, hi—thickness of the i-th layer.
Publisher’s Note: MDPI stays neutral with regard to jurisdictional claims in published maps and institutional affiliations.

