Abstract
This article reports an investigation into ferrite and nanocrystalline materials for the medium-frequency transformer of a dual active bridge DC-DC converter, which plays a key role in the converter’s efficiency and power density. E65 MnZn ferrite cores and toroidal and cut nanocrystalline cores are selected for the construction of 20-kHz transformers. Transformer performance is evaluated with a 1.1-kW (42–54 V)/400 V dual active bridge DC-DC converter with single-phase shift and extended phase shift modulations. The experimental results indicate that the toroidal nanocrystalline transformer had the best performance with an efficiency range of 98.5–99.2% and power density of 12 W/cm3, whereas the cut-core nanocrystalline transformer had an efficiency range of 98.4–99.1% with a power density of 9 W/cm3, and the ferrite transformer had an efficiency range of 97.6–98.8% with a power density of 6 W/cm3. A small mismatch in the circuit parameters is found to cause saturation in the nanocrystalline toroidal core, due to its high permeability. The analytical and experimental results suggest that cut nanocrystalline cores are suitable for the dual active bridge DC-DC converter transformers with switching frequencies up to 100 kHz.
1. Introduction
A dual active bridge (DAB) DC-DC converter, shown in Figure 1, is widely employed in modern electrical power generation and distribution systems for bidirectional power transfer between two DC sources with galvanic isolation [1]. DAB DC-DC converters are normally applied in solid-state transformers (SSTs) for photovoltaic and wind energy systems [2,3,4], on-board battery chargers in electric vehicles [5], railway traction systems [6,7], electric aircraft applications [8], and grid energy storage systems [9,10,11,12].
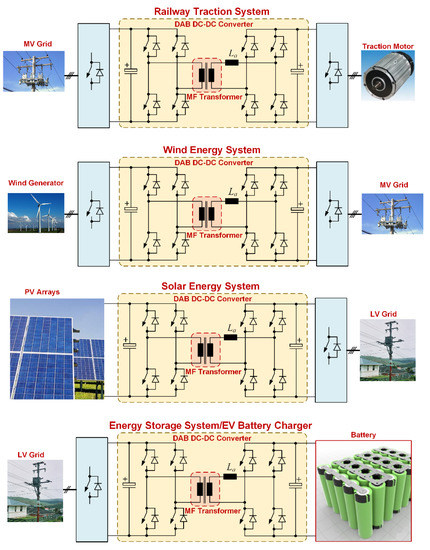
Figure 1.
Application of DAB DC-DC converters in electricity generation and distribution systems.
The transformer of the DAB DC-DC converter is a key component that has a direct impact on converter performance. The switching frequency of the DAB DC-DC converter is normally in the medium frequency range, between a few kHz [13] to hundreds of kHz [5]. Transformer losses depend on the operating frequency, core materials, peak flux density, and winding configurations. Core materials with high saturation flux density and low loss at higher operating frequency result in high power density. Applications of soft magnetic materials for power conversion have been thoroughly surveyed and summarized by the authors of [14]. Silicon steels are typically used in high power applications with an operating frequency of approximately 1 kHz [13,15,16], due to high peak flux density, and low material cost. Ribbon-wound amorphous cores are employed at operating frequencies below 10 kHz [17], due to a lower core loss than silicon steels. The application of ferrite cores for DAB DC-DC converter transformers dominates frequency ranges between 5 kHz to 500 kHz [5,7,8,18,19,20]. However, iron-based ribbon-wound nanocrystalline cores have become competitive with ferrite cores in the frequency range of 5 kHz up to 100 kHz [4]. Ribbon-wound nanocrystalline cores exhibit a lower specific core loss and a higher peak flux density compared to ferrite cores, leading to greater power density and efficiency. Moreover, core loss of the ferrite material varies with core temperature, due to a lower Curie temperature compared to other materials.
Several studies have focused on the design and performance evaluation of the transformer of the DAB DC-DC converter. Silicon steels and nanocrystalline materials were compared for the construction of 1-kVA 120 V/240 V transformers operating under at 1 kHz [21], in which reported the silicon steel transformer was reported to exhibit much lower efficiency and power density than the nanocrystalline core. Nonetheless, the advantage of the nanocrystalline materials over the silicon steels cannot be justified in this work, since the silicon steel transformer was tested under a reduced power rating. P. Huang [22] reported on the design and construction of a 1.5-kV, 35-kW, 1-kHz transformer for a DAB DC-DC converter using a 0.18-mm thick silicon steel, which was compared with an amorphous transformer with a similar rating. It was found that the silicon steel transformer exhibited a considerably greater no-load loss (i.e., greater core loss) with a slightly higher power density than the amorphous transformer. Note that the on-load test of the transformers was conducted by the authors of [22] with a full bridge rectifier at the secondary winding, rather than an active bridge. Researchers from Gazi University, Turkey, compared N87 MnZn ferrite material from TDK Electronics AG with a cut ribbon wound nanocrystalline core for a 35-kVA 10-kHz transformer under a square wave voltage excitation [18]. The finite element analysis (FEA) results indicate that the nanocrystalline transformer has a lower total loss and better power density than the ferrite transformer. A prototype of the nanocrystalline transformer was constructed [23], with the total experimental loss found to tend to be greater than that obtained from the FEA. The total experimental loss was found to be 120 W under a resistive load of 6 kW, whereas the total loss from the FEA was calculated at 155 W under a resistive load of 35 kW.
Three configurations (toroidal, C cores with the core type winding, and C cores with shell type winding) of 1750-VA 5-kHz transformers were constructed from Vitroperm500F nanocrystalline cores [24]. The toroidal configuration exhibited the highest efficiency at 98.5% and the highest magnetizing inductance, whereas the core type structure had the lowest efficiency at 96%. The core type transformer has the highest leakage inductance, which is suitable for the DAB DC-DC converter application. A multi-objective design method for 10-kVA 20-kHz transformers for LLC DC-DC resonant converters and DAB DC-DC converters using a genetic algorithm was presented [19]. The two transformers were constructed on E100/60/28 cores of the 3C90 MnZn ferrite material. The calculated efficiency for the DAB DC-DC converter transformer was claimed at 99.31% and 99.43% for the LLC DC-DC converter transformer. However, no experimental efficiency was reported.
The improved generalized Steinmetz equation (iGSE) was applied in an optimized design methodology of a 1-MW 3 kV/6 kV 5-kHz transformer with thermal and dielectric, and thermal considerations [25]. The optimized result suggests that using the Vitroperm500F nanocrystalline material in the transformer core exhibited better efficiency and power density than using the 3C95 MnZn ferrite. The proposed design methodology was validated with a down-scaled prototype using the 3C95 ferrite material, which was tested under open-circuit and short-circuit measurements for efficiency evaluation. M. Mogorovic and D. Dujic [26] presented a design methodology for a 100-kW 10-kHz transformer for a medium voltage LLC DC-DC resonant converter. The prototype transformer, constructed with N87 SIFERRIT ferrite U-cores was evaluated to have an efficiency above 99.3% at the rated condition. Other aspects of MF transformer design are leakage inductance modeling, local electric field distribution inside the transformer [27], and inductor-integrated MF transformer design [20].
As mentioned above, no studies have compared experimental performance with different core materials under the same operating conditions in a DAB DC-DC converter. Moreover, the prototype transformers in the literature were mostly tested or evaluated at the rated condition. In some applications, for example, the battery application [10], one of the DC voltage sides of the DAB DC-DC converter is not constant. The battery voltage varies with the state of charge, which directly impacts the operating performance of the MF transformer, i.e., flux density and core losses.
In this work, we report our investigation through a performance comparison of DAB DC-DC converter transformers constructed from an MnZn ferrite core and ribbon-wound nanocrystalline cores. Three prototype transformers were tested with a 1.1-kW 20-kHz DAB DC-DC converter. The test conditions were performed under different peak flux densities, which are suitable for battery applications.
2. DAB DC-DC Converter in This Study
Figure 2 depicts the DAB converter in this study which can be used to integrate a lithium-ion battery with a single-phase AC grid. The DAB DC-DC converter is operated at a switching frequency of 20 kHz. The low voltage (LV) bridge is connected to a DC power supply to emulate a battery pack in discharging mode where the battery voltage varies in the range of 42–54 V with the nominal voltage = 48 V. This topology is suitable for testing the prototype transformers, since the core flux density varies with the battery voltage and the primary voltage waveform. The DC side of the high voltage (HV) bridge is connected to the DC bus of the voltage source converter (VSC) connected to a 220-V, 50-Hz single-phase grid through an LCL filter. The DC bus voltage of the VSC is regulated at 400 V. An auxiliary inductor , to limit the transferred power, is placed on the HV side for ease of construction, due to a smaller current. The transformer turn ratio is set at
where and are the turn number of the primary and secondary windings. Thus, the voltage conversion ratio is given by
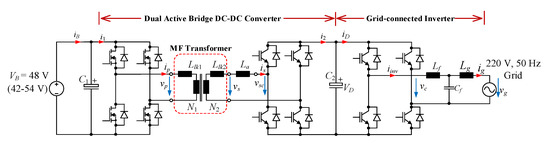
Figure 2.
DAB DC-DC converter in this study.
Figure 3a illustrates the key waveforms of the DAB DC-DC converter with the single-phase shift (SPS) modulation strategy [28], where the flux density waveform is triangular. Under this SPS modulation, the voltage conversion ratio should be maintained close to unity to satisfy the zero-voltage switching (ZVS) condition for efficient power transfer. The extended phase shift (EPS) modulation is applied at a higher battery voltage level where the primary voltage is modulated with the duty ratio , as shown in Figure 3b. This EPS modulation was reported to enhance the ZVS range and reduce the current stress in the transformer windings, in addition to transformer losses [28]. The flux density waveform under this EPS modulation is trapezoidal, as illustrated in Figure 3b, which affects the transformer core loss. Referring to the LV side of the transformer, the transferred power is given by,
where is the switching angular frequency, and is the total leakage inductor with the auxiliary inductor [28]. The RMS current of the primary winding is necessary information for the design of the transformer [28], which is expressed as,
Neglecting voltage drops across the MOSFETs, the peak flux density in the transformer core is approximately proportional to the battery voltage
where is the cross-sectional area of the transformer core.
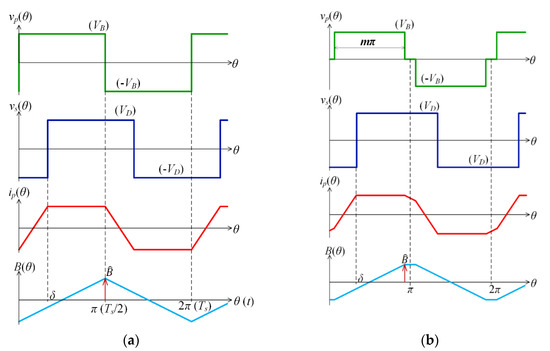
Figure 3.
Key waveforms of the DAB DC-DC converter in this study: (a) The SPS modulation; (b) the EPS modulation.
Table 1 summarizes the parameters of the DAB DC-DC converter in this study.

Table 1.
Parameters of the DAB DC-DC converter.
3. Design and Construction of the MF Transformers
N87 MnZn ferrite material from EPCOS [29] and two nanocrystalline materials from MK magnetics [30], with 17-µm thick ribbons, and King Magnetics [31], with 20-µm thick ribbons were selected in this study for the construction of three prototype transformers, due to their commercial availability. Table 2 compares the key parameters of the N87 ferrite with the two nanocrystalline materials. Loss densities of the selected materials were reproduced from the manufactures’ data using the GSE. Figure 4a shows that the two nanocrystalline materials have loss densities lower than that of the N87 ferrite material at fs = 20 kHz. However, the N87 ferrite material exhibits a smaller loss density at = 0.30 T for the frequency above 200 kHz, as illustrated in Figure 4b. The King magnetics nanocrystalline material has a lower loss density than the MK magnetics for < 0.7 T and fs < 60 kHz. However, the eddy current loss, due to the thicker ribbon of the King magnetics nanocrystalline material, causes the loss density to be greater than that of the MK magnetics nanocrystalline material at a higher peak flux density and magnetizing frequency.
Table 2.
Key parameters of the transformer core materials.
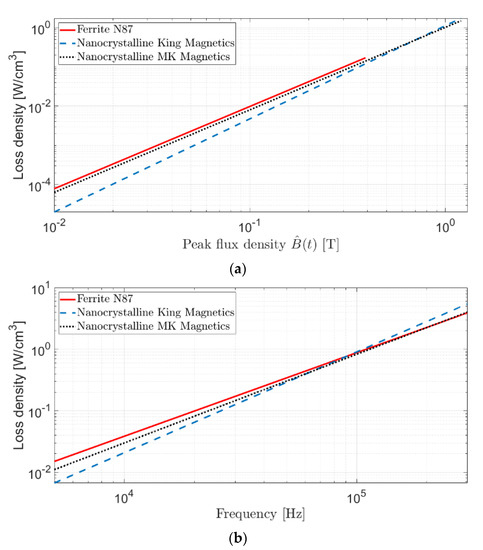
Figure 4.
Loss densities of the N87 ferrite material, and nanocrystalline materials from MK magnetics and King magnetics: (a) Peak flux density from 0.01 T to 1.20 T at 20 kHz; (b) magnetizing frequency from 5 kHz to 300 kHz at 0.30 T.
A well-established analytical method [32] was selected to design the MF transformers. This method optimizes the core size and peak flux density constrained by the total allowable loss. The core loss is given by the generalized Steinmetz equation and the copper loss. All the parameters in this design methodology are referenced to the primary winding. Thus, the copper loss is calculated from the total RMS current referenced to the primary winding, which is given by,
where is the RMS secondary current. Neglecting the magnetizing current, . Thus, calculated from (4) was used in the design. The output of this design yields an optimal core size and an optimal peak flux density. From there, a transformer core was selected as close as possible to the optimal core.
Each MF transformer was designed at the nominal battery voltage of 48 V with m = 1.0. The maximum allowable power loss at the nominal battery voltage of 48 V was set to 10 W, which is 0.91% of the rated power. The maximum peak flux density at the battery maximum voltage of 54 V with the duty ratio m = 1.0 was constrained to be lower than 50% of the saturation flux density, as presented in Table 2.
Table 3 summarizes the parameters of the three prototype transformers, denoted as transformers A, B, and C. Core loss, copper loss, and total loss of each transformer were estimated during the design stage.
Table 3.
Parameters of the prototype transformers.
Figure 5 depicts core geometry, winding configurations, and photographs of the three transformers. Litz wires assembled from AWG36 and AWG40 conductors were used in the windings to minimize losses, due to as the skin effect and the proximity effect. The primary magnetizing inductance and the total leakage inductance referred to the secondary winding were determined using an LCR meter at 2 V 20 kHz. Nanocrystalline transformer C has the greatest magnetizing inductance , due to its highest initial permeability, as given in Table 2. However, nanocrystalline transformer B has the lowest magnetizing inductance despite its high initial permeability. This is believed to be due to the presence of air gaps and core deterioration during the cutting process.
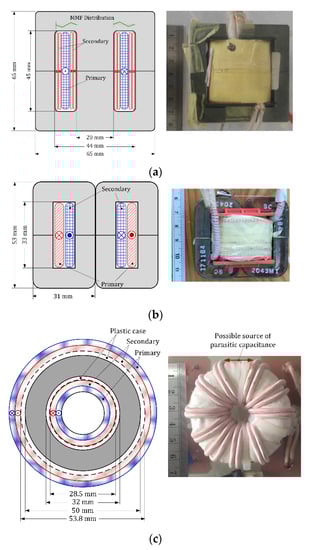
Figure 5.
Core geometry, winding configuration, and photographs of the prototype transformers densities of the N87 ferrite material, and nanocrystalline materials from MK magnetics and King magnetics: (a) Ferrite transformer A; (b) nanocrystalline transformer B; (c) nanocrystalline transformer C.
4. Core Loss Evaluation
Core loss measurement in the MF range is challenging. The calorimetric concept is regarded as the most accurate method [33], but this method is time-consuming and requires a special test chamber. Moreover, the measured loss is not only the core loss, but also the copper loss and other losses in the chamber. Furthermore, the calorimetric method is not suitable for temperature-dependent materials, such as ferrite. The Watt-meter method is more convenient and is widely used for loss measurement of inductors and transformers in power converters [34]. With this method, core loss is calculated from measurements of the magnetizing current in the primary winding and the induced voltage in the secondary winding. Measurement accuracy is difficult to evaluate and was frequently not supplied in the existing literature [34,35,36].
A 1-MHz Yokogawa WT3000E power meter [37] was selected to measure core losses of the prototype transformers. Figure 6 depicts the open-circuit test to determine core losses . This setup is essentially identical to the Watt-meter method with guaranteed measurement accuracy. The primary winding of each transformer was excited by the LV bridge with the peak voltage in the primary winding approximately equal to the battery voltage , which was in the range of 42 V to 54 V and the duty ratio of 0.7 ≤ m ≤ 1.0. The primary current is fed to an internal shunt resistor of the power meter, and the secondary voltage is used as the measured voltage. The measured power is
The core loss is then determined from
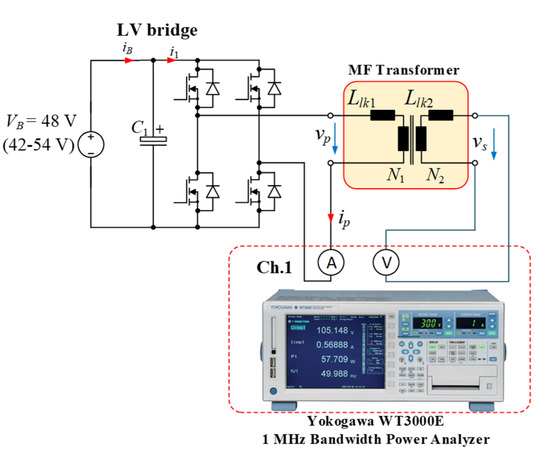
Figure 6.
Transformer core loss measurement setup.
The power measurement accuracy for the WT3000E power meter is stated at ±(0.3% of reading + 0.2% of range) in the frequency between 10–50 kHz for the sinusoidal input waveforms [37]. The measurement range for was selected at 600 V, whereas the measurement range for varied between 1 A and 5 A. The power measurement range was between 600 W to 3000 W. According to the readings of , the core loss measurement accuracy was approximated between ±(3–8)% for ferrite transformer A, ±(20–40)% for nanocrystalline transformer B, and ±(15–20)% for nanocrystalline transformer C. The estimated accuracy depended on the indicated values and the measurement ranges. The best measurement accuracy of each transformer occurred at the highest indicated value. The poorest power measurement accuracy for transformer B was caused by using the 5-A measurement range, due to its high magnetizing current. The approximated accuracies were poorer than the calculated values to account for the non-sinusoidal waveforms. Although the loss measurement accuracy is considerably poor, averaging of several measurement numbers gives a reasonable tendency of the loss in each material [38]. This measurement setup should be compared with the calorimetric method for accuracy evaluation. However, this work provides a reasonable comparison of the three transformer materials under the same setup.
The induced voltage in the secondary winding was measured by a 100-MHz differential probe, and the magnetizing current (t) was measured by a 50-MHz HIOKI 3273-50 current probe. Experimental signals were recorded in a 70-MHz oscilloscope (ISO-TECH IDS1074B) with 1000 data points per cycle. The instantaneous flux density and magnetic field can be calculated as follows,
The measured core losses were compared with the improved generalized Steinmetz equation (iGSE) [39], which is considered to be accurate for the non-sinusoidal flux density waveforms, shown in Figure 3. The core material parameters , and in Table 2 are adopted in the iGSE loss modeling, which is written as,
where,
Figure 7 compares the measured core loss of ferrite transformer A and nanocrystalline transformers B and C with the predicted values using the GSE and iGSE models. Each indicated value is the average of 10 readings, and each reading was from the average of 256 switching cycles. The indicated peak flux density of each transformer was calculated from the peak voltage using (5). The peak voltage was in the range of 42–54 V with a voltage step of 2 V. Figure 8 compares the B-H curves of the three transformer cores at = 54 V and m = 1.0. Large oscillation in the B-H curve of nanocrystalline transformer C is believed to be due to parasitic capacitance caused by large space between turns in the primary winding as illustrated in Figure 5c, in addition to parasitic capacitance in the measuring probes. Moreover, transformer C has the largest magnetizing inductance and leakage inductance, as shown in Table 3, which caused resonance at a lower frequency compared with transformers A and B. The parasitic capacitance can be minimized using a multi-section winding configuration [40] or separating the primary and secondary windings on opposite sides of the toroidal core [41].
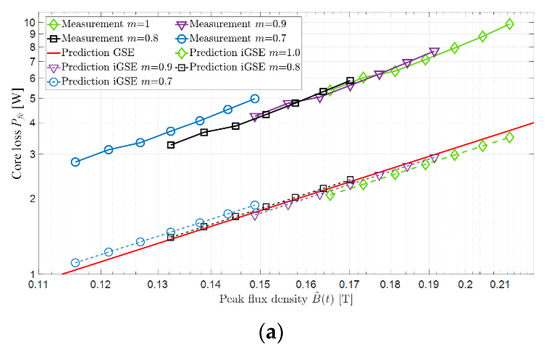
Figure 7.
The core loss of the prototype transformers: (a) Ferrite transformer A; (b) nanocrystalline C-core transformer B; (c) nanocrystalline toroidal transformer C.
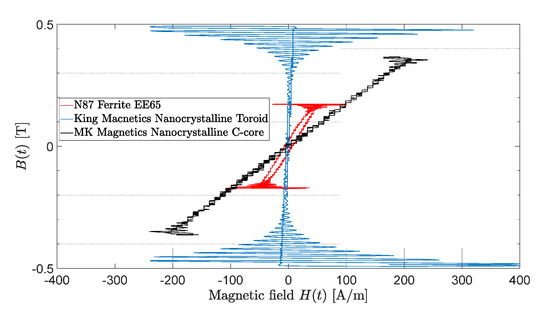
Figure 8.
B-H curves of the prototype transformers at = 54 V and m = 1.0.
The measured core losses and the predicted core losses from the iGSE model of the three transformers indicate that the duty ratio m has a direct impact on the core loss at the same peak flux density. A square wave excitation m = 1.0 resulting in a triangular flux density waveform in the core has a core loss lower than that under a quasi-square wave m < 1 with a higher peak voltage where the flux density waveform is trapezoidal. This is because the triangular flux density has a fundamental flux density component smaller than that with the trapezoidal flux density waveform [42].
The measured core loss of the ferrite transformer core is greater than those of the other two nanocrystalline transformer cores B and C. This is confirmed by the widest hysteresis loop, as shown in Figure 8. The measured core loss of ferrite transformer A is approximately three times greater than the predicted values. This is believed to be due to the temperature-dependent characteristic of the N87 ferrite. The core material parameters , and of the N87 ferrite were derived from the typical core loss values of the R34 toroids at 100 °C [29]. The measurements were taken in a 25 °C air-conditioned room where the core temperature was approximately 30 °C. According to the manufacturer’s data, the core loss of the N87 ferrite at 30 °C is approximately 60% greater than at 100 °C. Moreover, the segregated core structure of transformer A is expected to contribute greater loss than that of the lump configuration of the R34 toroid.
Nanocrystalline transformer C has the lowest core loss, partly due to its smaller cross-sectional area . Another explanation is believed to be due to the toroidal core configuration, which did not deteriorate during the manufacturing process. This can be observed from the highest slope in the B-H curves in Figure 8. Nanocrystalline transformer B has the lowest slope in the B-H curve— even lower than that of ferrite transformer A, which contradicts the permeability values indicated in Table 3. This is considered to be largely due to the presence of gaps between the cores. The measured core loss of nanocrystalline transformer B is approximately 70% greater than the predicted value at the lowest peak flux density = 42 V, m = 0.7, and the difference is smaller with higher flux densities, down to approximately 45% at the highest peak flux density = 54 V, m = 1.0. Meanwhile, the measured core loss of nanocrystalline transformer C is slightly smaller than the predicted values, where the loss error difference is between −0.1 W to −0.8 W.
Eddy current created by short circuits between the ribbons is considered a major cause of the excess core loss and the low permeability of nanocrystalline transformer B. A cut surface of an MK magnetics SC2043M1 nanocrystalline C-core used in transformer B cores was examined by an optical microscope with a magnification of 100X, as shown in Figure 9. It is evident that there are possible short circuit paths for the eddy current circulating between the adjacent ribbons. The surface short circuits could be due to an oxidation reaction of iron on the cut surface during the core manufacturing process or the transformer construction process [36,42]. Removal of the surface short circuits by etching with a 40% ferric chloride (FeCl3) solution can reduce such excessive core loss [36], although this could be impractical for commercial production.
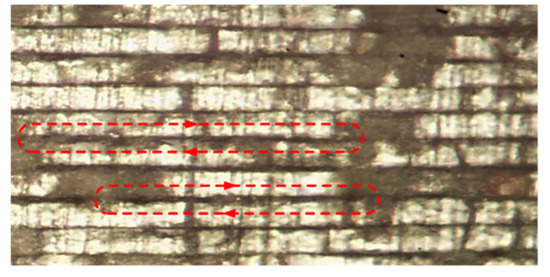
Figure 9.
A part of the cut surface of an MK magnetics SC2043M1 nanocrystalline C-core (transformer B).
5. Operating Performance of the MF Transformers with the DAB DC-DC Converter
An auxiliary inductor was added to the secondary winding to form the required total leakage inductance close to 808 µH, as given in Table 1. This allowed the required maximum power to be limited. In high power applications, the required leakage inductance is small, where the design of the MF transformer with integrated leakage inductance is possible [20,25,26]. A 786-µH inductor wound on ETD49 N87 ferrite cores was connected to ferrite transformer A. Another 765-µH inductor wound on a pair of MK magnetics SC2043M1 C-cores was selected for the nanocrystalline transforms B and C. The phase shift was set at 15°, 30°, 45°, and 60°, while the battery voltage was adjusted so that the peak voltage was maintained at the minimum 42 V, nominal 48 V and maximum 54 V values of the battery voltage. At = 48 V and = 54 V, the duty ratio m was adjusted between 0.7 to 1.0. The primary and secondary side powers and were obtained from the 1-MHz Yokogawa WT3000E power meter with the connection diagram depicted in Figure 10. Total power loss and efficiency are determined as follows
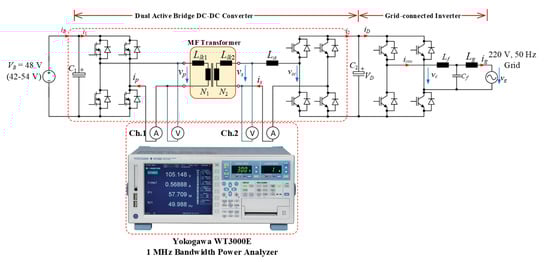
Figure 10.
Transformer total loss measurement setup.
The measured powers and occupied approximately 6% to 35% of the power measurement range. The measurement accuracies of and ( and ) were approximated between ±(2–5)%, which were better than of in Section 3. Again, the approximated accuracies of and were conservative considering the non-sinusoidal waveforms. The accuracy of the efficiency can be then determined by the authors of [38],
Thus, the accuracy of the efficiency was approximated to be between ±(3–8)% of the calculated values. Each reported value is the average of 10 readings, and each reading was from the average of 256 switching cycles.
Figure 11 compares the operating waveforms of the transformers A-C with the DAB DC-DC converter at the nominal battery voltage = 48 V, m = 1.0, and at the highest battery voltage = 54 V, m = 0.8 with corresponding peak flux densities indicated in the figure. Oscillations in the primary voltage are believed due to resonance caused by parasitic inductance and capacitance of the LV bridge and the transformers. Minor current spikes appear in the primary current of ferrite transformer A at 48 V, m = 1.0 as circled in Figure 11a, and the spikes disappear for a smaller peak flux density at 54 V, m = 0.8. Large current spikes in the primary current of nanocrystalline transformer C are found both at 48 V, m = 1.0 and 54 V, m = 0.8, as circled in Figure 11c. These phenomena are caused by asymmetry in the output voltage of the LV bridge, due to a mismatch in device parameters which pushes the transformer cores close to saturation [36], which can be observed from the asymmetry in the B-H of nanocrystalline transformer C in Figure 8. Nanocrystalline transformer C has a safety margin of = 0.82 T at 48 V, m = 1.0—much larger than that of ferrite transformer A of = 0.20 T. However, large permeability in nanocrystalline transformer C, due to its material properties and the uncut core structure, drives the flux density interval close to saturation easily. Nanocrystalline transformer B has the largest safety margin = 0.98 T at 48 V, m = 1.0. Moreover, it has the lowest permeability, as observed from the B-H curve in Figure 8, due to the cut-core structure, which together prevents saturation in the core.
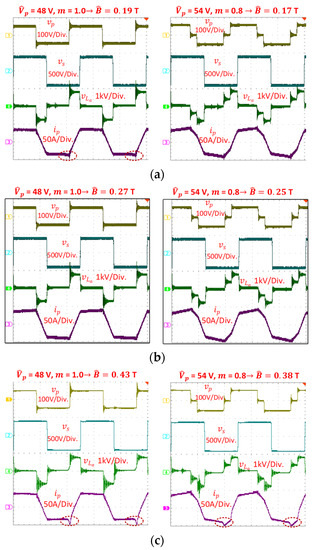
Figure 11.
Operating waveforms of the MF transformers with the DAB DC-DC converter: (a) Ferrite transformer A; (b) nanocrystalline C-core transformer B; (c) nanocrystalline toroidal transformer C.
Transformer core saturation can be passively prevented by adding air gaps [43] or adding a DC-blocking capacitor in series with the primary winding of the transformer [44]. The volt-second imbalance can be actively compensated with a duty offset obtained from auxiliary magnetic cores [45], extra flux density sensors [46], or measurements of the transformer current slopes near the saturation boundaries [47]. The uncut toroidal structure has limited choices for the prevention of saturation in the core.
Figure 12, Figure 13 and Figure 14 depict measurement results of the output power , power loss , total RMS current and efficiency of ferrite transformer A and nanocrystalline transformers B and C at = 42, 48, and 54 V with the SPS modulation m = 1.0. At the nominal operating condition = 48 V, nanocrystalline transformer C exhibits the best performance with the highest power output of 1171 W, while 1132 W for nanocrystalline transformer B and 1054 W ferrite transformer A. It can be observed that the highest efficiency of each curve of the three transformers occurs when the total loss approximately doubles the core loss obtained from the measurement results in Section 4. Note that the N87 ferrite decreases approximately in linear with the core temperature from 25 °C to 95 °C [29]. Thus, the core loss of ferrite transformer A with the DAB DC-DC converter is scaled to 70% of the measured core loss, due to the elevated temperature in the core dissipated from the winding. The efficiency ranges of the transformers cover 97.6–98.5% for ferrite transformer A, 98.4–99.0% for nanocrystalline transformer B, and 98.5–99.1% for nanocrystalline transformer C. Copper loss dominates in nanocrystalline transformer C, since the peak efficiency occurs at the light load = 15°. This is due to the extra length of the primary winding, which distributes around the core, as illustrated in Figure 5c.
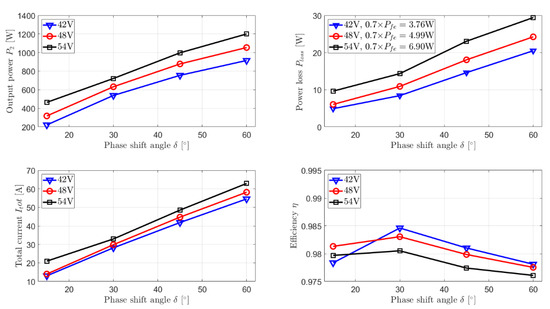
Figure 12.
Output power, power loss, total current, and efficiency of ferrite transformer A at = 42, 48, and 54 V under the SPS modulation m = 1.0.
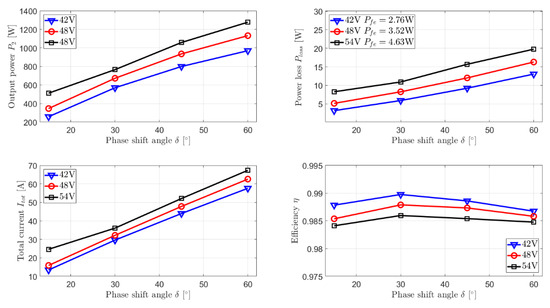
Figure 13.
Output power, power loss, total current, and efficiency of nanocrystalline transformer B at = 42, 48, and 54 V under the SPS modulation m = 1.0.
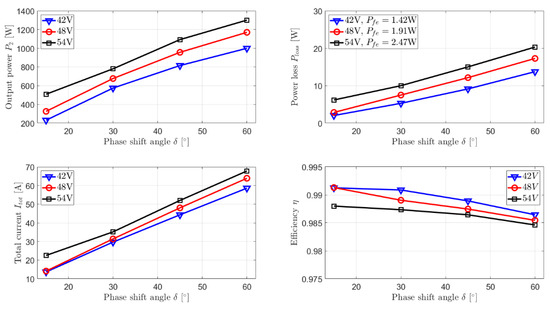
Figure 14.
Output power, power loss, total current, and efficiency of nanocrystalline transformer C at = 42, 48, and 54 V under the SPS modulation m = 1.0.
Figure 15, Figure 16 and Figure 17 show the output power , and power loss of ferrite transformer A and nanocrystalline transformers B and C under the EPS modulation at = 48 and 54 V with m = 0.7 to 1.0. The core loss of each operating condition is also given in the figures. The indicated core loss of the ferrite transformer is scaled to 70% of the measured core loss, due to the temperature-dependence. Core loss and the RMS current [28] decreases with the duty ratio m, which consequently raises the efficiency for all the transformers. It can be observed from the three transformers that the output power at m = 0.9 curves are slightly lower than at m = 1.0, as given in (3). The core loss reduction at from m = 1.0 to m = 0.9 is more pronounced than adjusting the duty ratio m at a lower value which can be observed from Figure 10. For control simplicity and enhanced efficiency, the DAB DC-DC converter can, therefore, be operated with the SPS modulation with a fixed duty ratio m = 0.9 in the primary voltage .
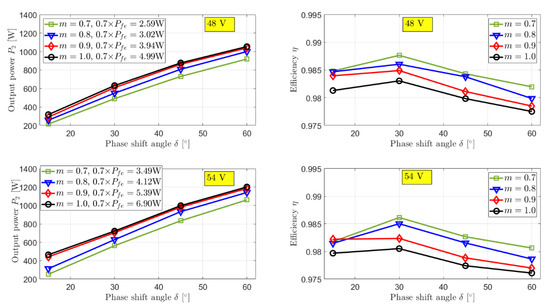
Figure 15.
Output power and efficiency of ferrite transformer A at = 48 and 54 V with m = 0.7 to 1.0.
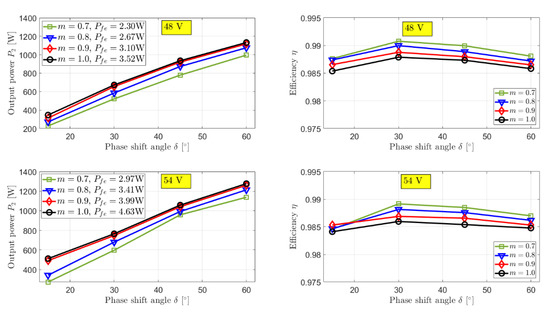
Figure 16.
Output power and efficiency of nanocrystalline transformer B at = 48 and 54 V with m = 0.7 to 1.0.
Figure 17.
Output power and efficiency of nanocrystalline transformer C at = 48 and 54 V with m = 0.7 to 1.0.
Figure 18 shows the thermal images of the MF transformers after being operated at the nominal power for one hour. The hottest section occurs at the winding of each transformer. Ferrite transformer A is hotter than the two nanocrystalline transformers, which agrees with the predicted loss in Table 3.
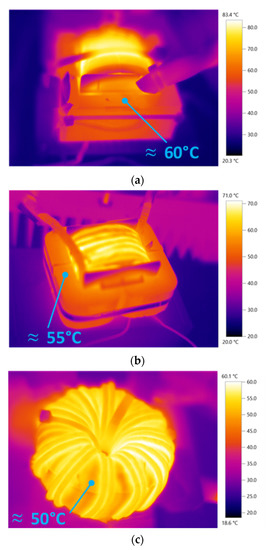
Figure 18.
Steady-state thermal images of the MF transformers with the DAB DC-DC converter: (a) Ferrite transformer A; (b) nanocrystalline C-core transformer B; (c) nanocrystalline toroidal transformer C.
Table 4 summarizes the test results of the three MF transformers. The calculated power density of each transformer includes the winding geometry. Although the toroidal nanocrystalline transformer C exhibits the highest power density and efficiency, its geometry makes it difficult to construct the windings, and a small parameter mismatch in the DAB DC-DC converter could lead to saturation in the core with limited prevention schemes. The C-core nanocrystalline transformer B is a good choice considering its power density, efficiency, winding manufacturing, and saturation management. Figure 4 indicates that the nanocrystalline material for transformer B can potentially operate at frequencies up to 100 kHz with core loss lower than the N87 ferrite, while the nanocrystalline material for transformer C is optimized for operating at 20 kHz [31]. Ferrite is the best candidate for frequencies above 100 kHz.
Table 4.
Test results of the prototype MF transformers.
The test results of the prototype transformers with the DAB DC-DC converter are comparable with the literature. The authors of [19] calculated that an E100 3C90 ferrite transformer for a 400-V 20-kHz DAB DC-DC converter has an efficiency of 99.31% with a power density of 13 W/cm3. A Vitroperm500F transformer for a 120 V/240 V 5-kHz DAB DC-DC converter was tested at a partial load with an efficiency of 99.41% and power density of 15 W/cm3 [48]. However, it cannot be directly justified due to different operating conditions.
The total core cost used in this study is also summarized in Table 4. The E65 N87 ferrite cores for transformer A and the King Magnetics KMN503220T nanocrystalline cores for transformer C are manufactured in bulk and are commercially available at a low unit cost. Meanwhile, a small number of MK magnetics SC2043M1 nanocrystalline C-cores were ordered for this study only. The MK magnetics SC2043M1 nanocrystalline C-cores would be competitive if manufactured in bulk.
6. Conclusions
Three 20-kHz transformers were constructed on E65 N87 MnZn ferrite cores, 17-µm thick ribbon-wound nanocrystalline C cores, and a 20-µm thick ribbon-wound nanocrystalline toroid. Their experimental performances with a 1.1-kW 48 V/400 V DAB DC-DC converter were compared. The two nanocrystalline transformers exhibited better efficiency and power density with lower core loss and temperature rise compared to the ferrite transformer. A nanocrystalline transformer with the uncut toroid was found to offer better performance than the transformer with cut C-cores, since no deterioration occurred during the cutting process. The core loss of the ferrite transformer varies with core temperature, which is difficult to design optimally. However, high permeability in the toroidal nanocrystalline transformer tended to saturate, due to a minor mismatch in circuit parameters. Considering the performance, saturation prevention, and winding manufacturing, cut nanocrystalline cores are suitable for transformers in DAB DC-DC converters with a switching frequency of up to 100 kHz. Ferrite material is a better choice for a switching frequency above 100 kHz. Furthermore, the difference between the calculated core loss, using the iGSE, and the measured core loss indicates that the core loss data for each core geometry should be provided to accurately design the transformer.
Author Contributions
Conceptualization, S.S., T.S. (Toshiro Sato) and V.C.; methodology, S.S.; software, S.S.; validation, S.S., A.P., P.N. and T.S. (Tawat Suriwong); formal analysis, S.S.; investigation, S.S.; resources, S.S.; data curation, S.S., A.P. and P.N.; writing—original draft preparation, S.S.; writing—review and editing, S.S.; visualization, S.S.; supervision, T.S. (Toshiro Sato) and V.C.; project administration, S.S.; funding acquisition, S.S. All authors have read and agreed to the published version of the manuscript.
Funding
This research was funded by the Thailand Research Fund and the Office of the Higher Education Commission, Thailand, research grant number MRG6080051.
Institutional Review Board Statement
Not applicable.
Informed Consent Statement
Not applicable.
Data Availability Statement
Not applicable.
Acknowledgments
Many thanks to Roy I. Morien and David James Sims for their editing assistance and advice on English expressions in this document.
Conflicts of Interest
The authors declare no conflict of interest.
References
- Ríos, S.J.; Pagano, D.J.; Lucas, K.E. Bidirectional Power Sharing for DC Microgrid Enabled by Dual Active Bridge DC-DC Converter. Energies 2021, 14, 404. [Google Scholar] [CrossRef]
- Abu-Siada, A.; Budiri, J.; Abdou, A.F. Solid State Transformers Topologies, Controllers, and Applications: State-of-the-Art Literature Review. Electronics 2018, 7, 298. [Google Scholar] [CrossRef]
- Ruiz, F.; Perez, M.A.; Espinosa, J.R.; Gajowik, T.; Stynski, S.; Malinowski, M. Surveying Solid-State Transformer Structures and Controls: Providing Highly Efficient and Controllable Power Flow in Distribution Grids. IEEE Ind. Electron. Mag. 2020, 14, 56–70. [Google Scholar] [CrossRef]
- Rahman, M.A.; Islam, M.R.; Muttaqi, K.M.; Sutanto, D. Modeling and Control of SiC-Based High-Frequency Magnetic Linked Converter for Next Generation Solid State Transformers. IEEE Trans. Energy Convers. 2020, 35, 549–559. [Google Scholar] [CrossRef]
- Xue, L.X.; Shen, Z.Y.; Boroyevich, D.; Mattavelli, P.; Diaz, D. Dual Active Bridge-based Battery Charger for Plug-in Hybrid Electric Vehicle with Charging Current Containing Low Frequency Ripple. IEEE Trans. Power Electron. 2015, 30, 7299–7307. [Google Scholar] [CrossRef]
- Claesens, M.; Dujic, D.; Canales, F.; Steinke, J.K.; Stefanutti, P.; Veterli, C. Traction Transformation: A Power-Electronic Traction Transformer (PETT). In Proceedings of the 7th International Power Electronics and Motion Control Conference, Harbin, China, 2–5 June 2012; pp. 11–17. [Google Scholar]
- Adamowicz, M.; Szewczyk, J. SiC-Based Power Electronic Traction Transformer (PETT) for 3 kV DC Rail Traction. Energies 2020, 13, 5573. [Google Scholar] [CrossRef]
- Buticchi, G.; Costa, L.; Liserre, M. Improving System Efficiency for the More Electric Aircraft: A Look at DC-DC Converters for the Avionic Onboard dc Microgrid. IEEE Ind. Electron. Mag. 2017, 11, 26–36. [Google Scholar] [CrossRef]
- Zhao, B.; Song, Q.; Liu, W.; Sun, Y. A Synthetic Discrete Design Methodology of High-Frequency Isolated Bidirectional DC/DC Converter for Grid-Connected Battery Energy Storage System Using Advanced Components. IEEE Trans. Ind. Electron. 2014, 61, 5402–5410. [Google Scholar] [CrossRef]
- Jeong, D.K.; Ryu, M.H.; Kim, H.G.; Kim, H.J. Optimized Design of Bi-Directional Dual Active Bridge Converter for Low-Voltage Battery Charger. J. Power Electron. 2014, 14, 468–477. [Google Scholar] [CrossRef]
- Kazerani, M.; Tehrani, K. Grid of Hybrid AC/DC Microgrids: A New Paradigm for Smart City of Tomorrow. In Proceedings of the IEEE International Conference of System of Systems Engineering (SoSE), Budapest, Hungary, 2–4 June 2020. [Google Scholar] [CrossRef]
- Tehrani, K.; Weber, M.; Rasoanarivo, I. Design of High Voltage Pulse Generator With Back to Back Multilevel Boost Buck Converters Using Sic-Mosfet Switches. In Proceedings of the IEEE International Conference of System of Systems Engineering (SoSE), Budapest, Hungary, 2–4 June 2020. [Google Scholar] [CrossRef]
- Voss, J.; Engel, S.P.; Doncker, R.W.D. Control Method for Avoiding Transformer Saturation in High-Power Three-Phase Dual-Active Bridge DC–DC Converters. IEEE Trans. Power Electron. 2020, 35, 4332–4341. [Google Scholar] [CrossRef]
- Leary, A.M.; Ohodnicki, P.R.; Mchenry, M.E. Soft Magnetic Materials in High-Frequency, High-Power Conversion Applications. JOM 2012, 64, 772–781. [Google Scholar] [CrossRef]
- Soltau, N.; Eggers, D.; Hameyer, K.; Doncker, R.W.D. Iron Losses in a Medium-Frequency Transformer Operated in a High-Power DC–DC Converter. IEEE Trans. Magn. 2014, 50, 953–956. [Google Scholar] [CrossRef]
- Kauder, T.; Belgrand, T.; Lemaître, R.; Thul, A.; Hameyer, K. Medium-Frequency Power Transformer using GOES for A Three-Phase Dual Active Bridge. J. Magn. Magn. Mater. 2020, 504, 166672. [Google Scholar] [CrossRef]
- Moonem, M.A.; Pechacek, C.L.; Hernandez, R.; Krishnaswami, H. Analysis of a Multilevel Dual Active Bridge (ML-DAB) DC-DC Converter Using Symmetric Modulation. Electronics 2015, 4, 239–260. [Google Scholar] [CrossRef]
- Balci, S.; Sefa, I.; Altin, N. An Investigation of Ferrite and Nanocrystalline Core Materials for Medium-Frequency Power Transformers. J. Electron. Mater. 2016, 45, 3811–3821. [Google Scholar] [CrossRef]
- Garcia-Bediaga, A.; Villar, I.; Rujas, A.; Mir, L.; Rufer, A. Multiobjective Optimization of Medium-Frequency Transformers for Isolated Soft-Switching Converters Using a Genetic Algorithm. IEEE Trans. Power Electron. 2017, 32, 2995–3006. [Google Scholar] [CrossRef]
- Bin, C. Design Optimisation of An Inductor-Integrated MF Transformer for A High-Power Isolated Dual-Active-Bridge DC–DC Converter. IET Power Electron. 2019, 12, 2912–2922. [Google Scholar] [CrossRef]
- Ruiz-Robles, D.; Ortíz-Marín, J.; Venegas-Rebollar, V.; LMoreno-Goytia, E.; Granados-Lieberman, D.; R Rodríguez-Rodriguez, J. Nanocrystalline and Silicon Steel Medium-Frequency Transformers Applied to DC-DC Converters: Analysis and Experimental Comparison. Energies 2019, 12, 2062. [Google Scholar] [CrossRef]
- Huang, P.; Mao, C.; Wang, D.; Wang, L.; Duan, Y.; Qiu, J.; Xu, G.; Cai, H. Optimal Design and Implementation of High-Voltage High-Power Silicon Steel Core Medium-Frequency Transformer. IEEE Trans. Ind. Electron. 2017, 64, 4391–4401. [Google Scholar] [CrossRef]
- Balci, S.; Sefa, I.; Altin, N. Design and Analysis of A 35 kVA Medium Frequency Power Transformer with the Nanocrystalline Core Material. Int. J. Hydrog. Energy 2017, 42, 17895–17909. [Google Scholar] [CrossRef]
- Ruiz-Robles, D.; Figueroa-Barrera, C.; Moreno-Goytia, E.L.; Venegas-Rebollar, V. An Experimental Comparison of the Effects of Nanocrystalline Core Geometry on the Performance and Dispersion Inductance of the MFTs Applied in DC-DC Converters. Electronics 2020, 9, 453. [Google Scholar] [CrossRef]
- Bahmani, M.A.; Thiringer, T.; Kharezy, M. Design Methodology and Optimization of a Medium-Frequency Transformer for High-Power DC–DC Applications. IEEE Trans. Ind. Appl. 2016, 52, 4225–4233. [Google Scholar] [CrossRef]
- Mogorovic, M.; Dujic, D. 100 kW, 10 kHz Medium-Frequency Transformer Design Optimization and Experimental Verification. IEEE Trans. Power Electron. 2019, 34, 1696–1708. [Google Scholar] [CrossRef]
- Mogorovic, M.; Dujic, D. FEM-Based Statistical Data-Driven Modeling Approach for MFT Design Optimization. IEEE Trans. Power Electron. 2020, 35, 10863–10872. [Google Scholar] [CrossRef]
- Oggier, G.G.; Garc, G.O.; Oliva, A.R. Switching Control Strategy to Minimize Dual Active Bridge Converter Losses. IEEE Trans. Power Electron. 2009, 24, 1826–1838. [Google Scholar] [CrossRef]
- Ferrites and Accessories SIFERRIT Material N87; EPCOS AG: Munich, Germany, 2006.
- Tape Wound Core Specialist; MK Magnetics: Adelanto, CA, USA, 2017.
- Nanocrystalline and Amorphous Cores and Components; King Magnetics: Zhuhai, Guangdong, China, 2017.
- Erickson, R.W.; Maksimovic, D. Fundamentals of Power Electronics, 2nd ed.; Kluwer Academic: New York, NY, USA, 2001; pp. 565–586. [Google Scholar]
- Mu, M. High Frequency Magnetic Core Loss Study. Ph.D. Thesis, Virginia Polytechnic Institute and State University, Blacksburg, VA, USA, 2013. [Google Scholar]
- Wang, Y. Modelling and Characterisation of Losses in Nanocrystalline Cores. Ph.D. Thesis, University of Manchester, Manchester, UK, 2015. [Google Scholar]
- Muhlethaler, J.; Biela, J.; Kolar, J.W.; Ecklebe, A. Improved Core-Loss Calculation for Magnetic Components Employed in Power Electronic Systems. IEEE Trans. Power Electron. 2012, 27, 964–973. [Google Scholar] [CrossRef]
- Cougo, B.; Tuysüz, A.; Mühlethaler, J.; Kolar, J.W. Increase of Tape Wound Core Losses due to Interlamination Short Circuits and Orthogonal Flux Components. In Proceedings of the 37th Annual Conference of the IEEE Industrial Electronics Society (IECON2011), Melbourne, Australia, 7–10 November 2011. [Google Scholar] [CrossRef]
- WT3000E Series Precision Power Analyzers; Yokogawa: Tokyo, Japan, 2004.
- Kirkup, L.; Frenkel, R.B. An Introduction to Uncertainty in Measurement: Using the GUM (Guide to the Expression of Uncertainty in Measurement); Cambridge University Press: Cambridge, UK, 2006; pp. 35–63. [Google Scholar]
- Venkatachalam, K.; Sullivan, C.R.; Abdallah, T.; Tacca, H. Accurate Pediction of Ferrite Core Loss with Nonsinusoidal Waveforms using Only Steinmetz Parameters. In Proceeding of the 2002 IEEE Workshop on Computers in Power Electronics, Mayaguez, PR, USA, 3–4 June 2002. [Google Scholar] [CrossRef]
- Deng, L.; Wang, P.; Li, X.; Xiao, H.; Peng, T. Investigation on the Parasitic Capacitance of High Frequency and High Voltage Transformers of Multi-Section Windings. IEEE Access 2020, 8, 14065–14073. [Google Scholar] [CrossRef]
- Singh, H.; Kumar, P.S.; Ali, M.U.; Lee, H.Y.; Khan, M.A.; Park, G.S.; Kim, H.J. High Frequency Transformer’s Parasitic Capacitance Minimization for Photovoltaic (PV) High-Frequency Link-Based Medium Voltage (MV) Inverter. Electronics 2018, 7, 142. [Google Scholar] [CrossRef]
- Shen, W.; Wang, F.; Boroyevich, D.; Tipton, C.W. Loss Characterization and Calculation of Nanocrystalline Cores for High-Frequency Magnetics Applications. IEEE Trans. Power Electron. 2008, 23, 475–484. [Google Scholar] [CrossRef]
- Tan, N.M.L.; Abe, T.; Akagi, H. Design and Performance of A Bidirectional Isolated DC-DC Converter for a Battery Energy Storage System. IEEE Trans. Power Electron. 2012, 27, 1237–1248. [Google Scholar] [CrossRef]
- Qin, Z.; Shen, Y.; Loh, P.C.; Wang, H.; Blaabjerg, F. A Dual Active Bridge Converter With an Extended High-Efficiency Range by DC Blocking Capacitor Voltage Control. IEEE Trans. Power Electron. 2018, 33, 5949–5966. [Google Scholar] [CrossRef]
- Ortiz, G.; Fässler, L.; Kolar, J.W.; Apeldoorn, O. Flux Balancing of Isolation Transformers and Application of “The Magnetic Ear” for Closed-Loop Volt–Second Compensation. IEEE Trans. Power Electron. 2014, 29, 4078–4090. [Google Scholar] [CrossRef]
- Dutta, S.; Bhattacharya, S. A Method to Measure the DC bias in High Frequency Isolation Transformer of the Dual Active Bridge DC to DC Converter and Its Removal using Current Injection and PWM Switching. In Proceedings of the 2014 IEEE Energy Conversion Congress and Exposition (ECCE), Pittsburgh, PA, USA, 14–18 September 2014. [Google Scholar] [CrossRef]
- Assadi, S.A.; Matsumoto, H.; Moshirvaziri, M.; Nasr, M.; Zaman, M.S.; Trescases, O. Active Saturation Mitigation in High-Density Dual-Active-Bridge DC–DC Converter for On-Board EV Charger Applications. IEEE Trans. Power Electron. 2020, 35, 4376–4387. [Google Scholar] [CrossRef]
- Ruiz-Robles, D.; Venegas-Rebollar, V.; Anaya-Ruiz, A.; Moreno-Goytia, E.L.; Rodríguez-Rodríguez, J.R. Design and Prototyping Medium-Frequency Transformers Featuring a Nanocrystalline Core for DC–DC Converters. Energies 2018, 11, 2081. [Google Scholar] [CrossRef]
Publisher’s Note: MDPI stays neutral with regard to jurisdictional claims in published maps and institutional affiliations. |
© 2021 by the authors. Licensee MDPI, Basel, Switzerland. This article is an open access article distributed under the terms and conditions of the Creative Commons Attribution (CC BY) license (https://creativecommons.org/licenses/by/4.0/).