Article

On the Characterisations of the Impulse Breakdown in High Resistivity Soils by Field Testing †

by
Abdul Wali Abdul Ali
and
Normiza Mohamad Nor
*
Faculty of Engineering, Multimedia University, Cyberjaya 63100, Selangor, Malaysia
*
Author to whom correspondence should be addressed.
This paper is an extended version of our paper published in International Conference on High Voltage Engineering and Application 2020, Beijing, China, 6–10 September 2020.
Energies 2021, 14(9), 2401; https://doi.org/10.3390/en14092401
Submission received: 18 March 2021 / Revised: 11 April 2021 / Accepted: 20 April 2021 / Published: 23 April 2021
(This article belongs to the Section F: Electrical Engineering)

Abstract

:
This paper presents experimental results of high-current impulse tests on six ground electrode configurations. A high impulse current generator is employed to inject different magnitudes of current into these rod electrodes, under both positive and negative impulse polarities. The effect of increasing the number of rod electrodes, hence the resistance at DC or steady-state (RDC), on the impulse response of ground electrodes is analysed. From the analysis of the results, it was found that the larger the size of rod electrodes, the less current-dependent Zimpulse becomes. The percentage of reduction of impulse impedance, Zimpulse from its steady state, and RDC values are found to be independent of impulse polarity. However, as the voltage magnitudes were increased, an occurrence of breakdown was seen, with higher breakdown voltage seen in negative impulse polarity in comparison to positive impulse polarity. Relatively, the higher the breakdown voltage is, seen in the ground electrodes subjected to negative polarity, the faster the time to breakdown is.

1. Introduction

Effective grounding systems are needed to ensure current is dissipated to the ground effectively, ensuring safety for persons and equipment in the vicinity of electrical installations. Many published standards [1,2,3,4] on grounding systems have given emphasis to low ground resistance values, to provide an effective path for currents to ground at power frequency and transient fault conditions. There are two main parameters that should be considered in order to achieve low ground resistance values: electrode and soil properties. Larger electrode and low resistivity values are preferred in order to obtain the required low resistance values at the power frequency. However, it was found in several studies [5,6,7,8,9] that the inductive effect can be significant in large grounding systems. Harid et al. [5] observed the presence of inductive effects when impulse tests were performed on vertical rods from 1.2 m to 4.8 m. Predominantly inductive behaviour was also seen for horizontal electrodes, particularly in long horizontal electrodes, when impulse tests were conducted on horizontal electrodes from 14 m to 88 m. Longer rise time in current waveform in larger horizontal electrodes was also seen in [8], when horizontal earth electrodes of 10 m to 60 m were subjected to fast impulses.
In some studies [6,7,9], the inductive effect was also thought to be present, which can be observed as a relatively higher impulse impedance (Zimpulse) than the steady state resistance (RDC). This is normally seen in low RDC values, where extended electrodes are normally used to obtain a low resistance value. Hence, with the steep fronted transients, higher frequencies are produced, making inductive effects become more significant. As generally accepted, there have been many published works showing impulse impedance values (Zimpulse) obtained under high impulse conditions are lower than those of RDC [8,10,11,12,13,14,15,16]. Lower Zimpulse values than RDC values have been well understood to be associated with the ionization process in soil. During this process, the ionization zone causes an effective increase in the dimension of the ground electrode, reducing impulse impedance values. Furthermore, several studies [17,18,19] have shown that soil conductivity increases, and relative permittivity decreases at higher frequencies, thus expectedly producing lower impedance values than those measured at the low frequency range. However, many studies [10,11,12,13] have shown that the reduction of Zimpulse from its RDC value is more pronounced in the grounding systems with high RDC (smaller electrode’s geometry and lower soil resistivity). Thus, with the addition of earth electrodes, the RDC will be improved, but it may not be as effective when these electrodes are subjected to high impulse conditions, due to a higher inductive effect, and to a lower percentage of reduction of Zimpulse from its RDC, in comparison to smaller ground electrodes.
Due to a much-preferred low RDC in the design of ground electrodes, it may be possible that ground electrodes are not as effective when subjected to impulse conditions, where it may be possible that the inductive component become more significant, hence increasing the Zimpulse. At the same time, however, it is difficult to confirm that the performance of the ground electrodes with high RDC can be more effective than low RDC when subjected to various magnitudes of impulse current, as it is conceptually understood that the lower the RDC, the better the soil conduction is. Further, a limited study can be found in the observation of breakdown in practical ground electrodes, showing that good conduction can still be achieved in ground electrodes with high RDC, which can be due to a large soil mass, and low RDC values, hence lowering the electric field value of the soil, preventing the breakdown occurring in the soil. A remarkable, and the most recent, work on the occurrence of breakdown in soil in relation to electric field computation, using field testing, can be found in [20], where the ionisation and breakdown occurs at the high electric field region, which is at the interfaces of electrode and soil. In this current paper, the characterizations of impulse breakdown are carried out in high-resistivity soil, of more than 1000 Ωm, and under both impulse polarities.
Ionization is typically indicated by a clear trend of current traces following the voltage trace, while some initial oscillations are seen in some publications [11], and some delays in current traces are noted [5]. As highlighted in some publications [8,11,21], the ionization process in soil is thought to be caused by dielectric difference between the air voids and the soil, which produces the ionization zone and reduces the ground impedance values. The rate of growth of the ionization zone is dependent on several factors, such as current magnitudes, soil resistivity, grain sizes, impulse polarity, and current rise times. As for the testing at field sites, due to large soil mass, having the majority of the air gaps filled with water, and small air gaps that may appear in natural soil, more current/energy is needed to create dielectric difference between wet soil and air gaps. Due to these factors, slower ionisation growth and shorter current paths may occur, which are shown as the current traces follow the voltage traces, as seen in several other publications [5,6,7,8,9,10,11,12,13]. However, in this paper, all the ground electrodes are installed in high-resistivity soil, more than 1000 Ωm for the upper layer, which may be drier and have more air voids than the other test sites presented in much research work [6,7,8,9,10,12,13]; hence, at certain voltage levels, it resulted in larger ionization zones, indicated as the occurrence of breakdown in soil.
This paper is aimed at investigating the performance of fast impulses of ground electrodes installed in high-resistivity soil, hence high RDC, which leads to the occurrence of breakdown in soil. In this work, experimental results of six ground electrodes installed in high-resistivity soil are presented. Since little emphasis on the time to peak current, current discharged time, and impulse impedance during the breakdown in soil has been presented in literature, this paper is directed towards this measurement.

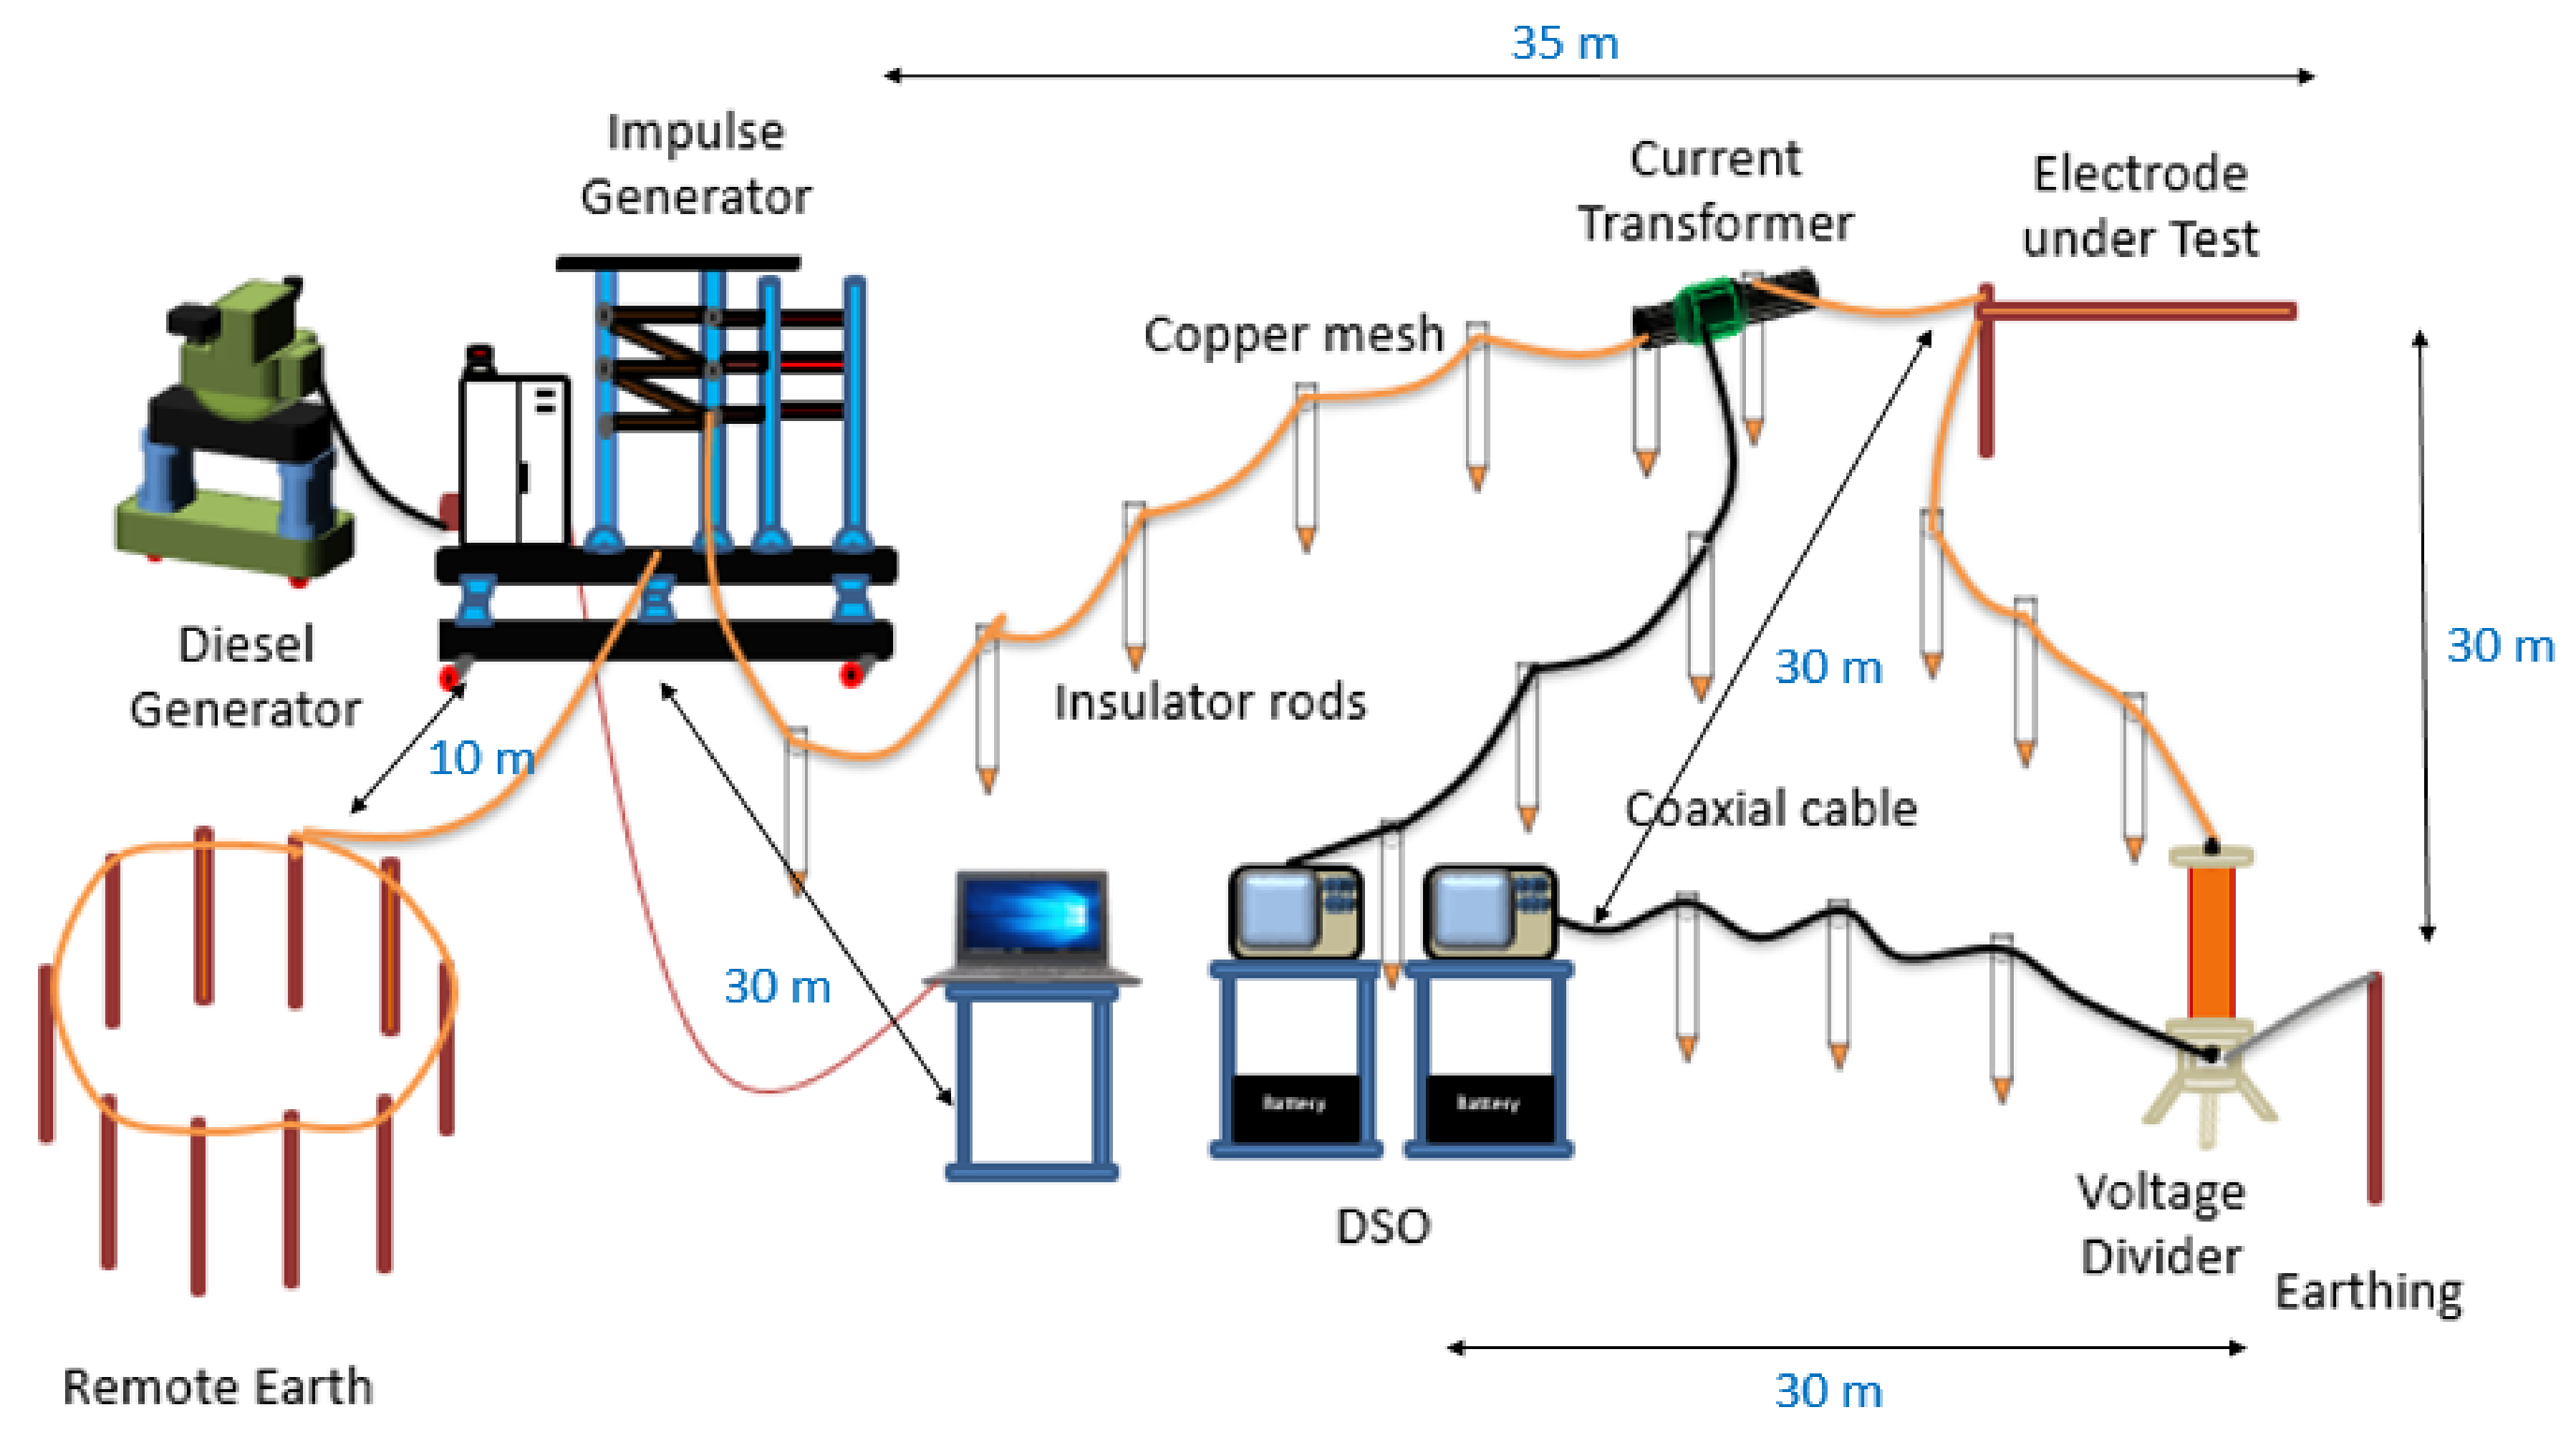
2. Experimental Arrangement

A 1-rod electrode consists of a vertical copper rod of 16 mm diameter and 1.5 m length. This 1-rod electrode was joined by a clamp to another vertical rod with a copper tape with a width of 2.5 cm, and with length of 3 m from one electrode to another, and buried 30 cm below the ground’s surface. The grounding device with spike rods (GDSR) and the remote ground electrode were similar to those presented in [13]. Six similar practically tested electrodes are adopted in the present work, as in [13], where ground electrode (GE) 1 consists of a single rod electrode; GE 2 consists of a GDSR; GE 3 consists of two rod electrodes in parallel; GE 4 consists of a single rod, in parallel to GDSR; GE 5 consists of three rod electrodes in parallel; and GE 6 consists of two rod electrodes in parallel to GDSR. In order to provide easy references to the readers, the diagrams of all six electrodes are presented in Table 1. With the Wenner method, the soil resistivity data of the site was obtained, and CDEGS was used, interpreting the soil data into two layers of soil, with the upper layer found to be 1464.4 Ωm, with a height of 8.14 m, and the lower layer 443.4 Ωm with an infinite height. Resistance values (RDC) for all electrodes were measured with a fall-of-potential method, and expectedly, due to high soil resistivity, high RDC values were seen, which were 833.78 Ω, 704.18 Ω, 372.38 Ω, 364.18 Ω, 267.58 Ω, and 253.38 Ω, respectively, for GE1, GE2, GE3, GE4, GE5, and GE6. Return earth for the current during the testing is needed to dissipate high current into the ground during testing, or during the switching on and off of the impulse generator. Though the measured RDC value for the return earth is high, 32 Ωm, the value is considerably accepted, since it is lower than all the six tested electrodes, which are in a range of 253 Ωm to 834 Ωm. Figure 1 shows the test arrangement, which is similar to that used in previous studies [10], where an impulse generator of 300 kV, a resistive divider, a current transformer, and digital storage oscilloscopes (DSO) were used. A divider with a ratio of 3890:1, a Pearson current transformer with a sensitivity of 0.01 V/A, and Lecroy HDO4054 high-definition oscilloscopes of 500 MHz, with 2.5 GS/s and 12.5 Mpts/Ch, were used in the measurements. Distances from one piece of equipment to another are also indicated in the figure; however, the diagram and distances shown are not drawn to scale. With the same test set up, impulse tests were carried out on a linear resistive load, to conform that its voltage and current traces were of a standard impulse and acceptably reliable [22]. In the work [22], it was observed that the current trace follows the voltage trace, and the resistance value under impulse is linear, independent of current magnitudes, and 14% lower than that specified by the manufacturer. A similar result is also seen in [23], where a linear resistor under high impulse conditions was found to be lower than its RDC in a laboratory setting. Here, despite longer meshed copper wires being used, and with other challenges at the field site, it can be concluded that the test set-up used in the study is acceptably accurate and reliable enough to be used for field testing.

3. Test Results

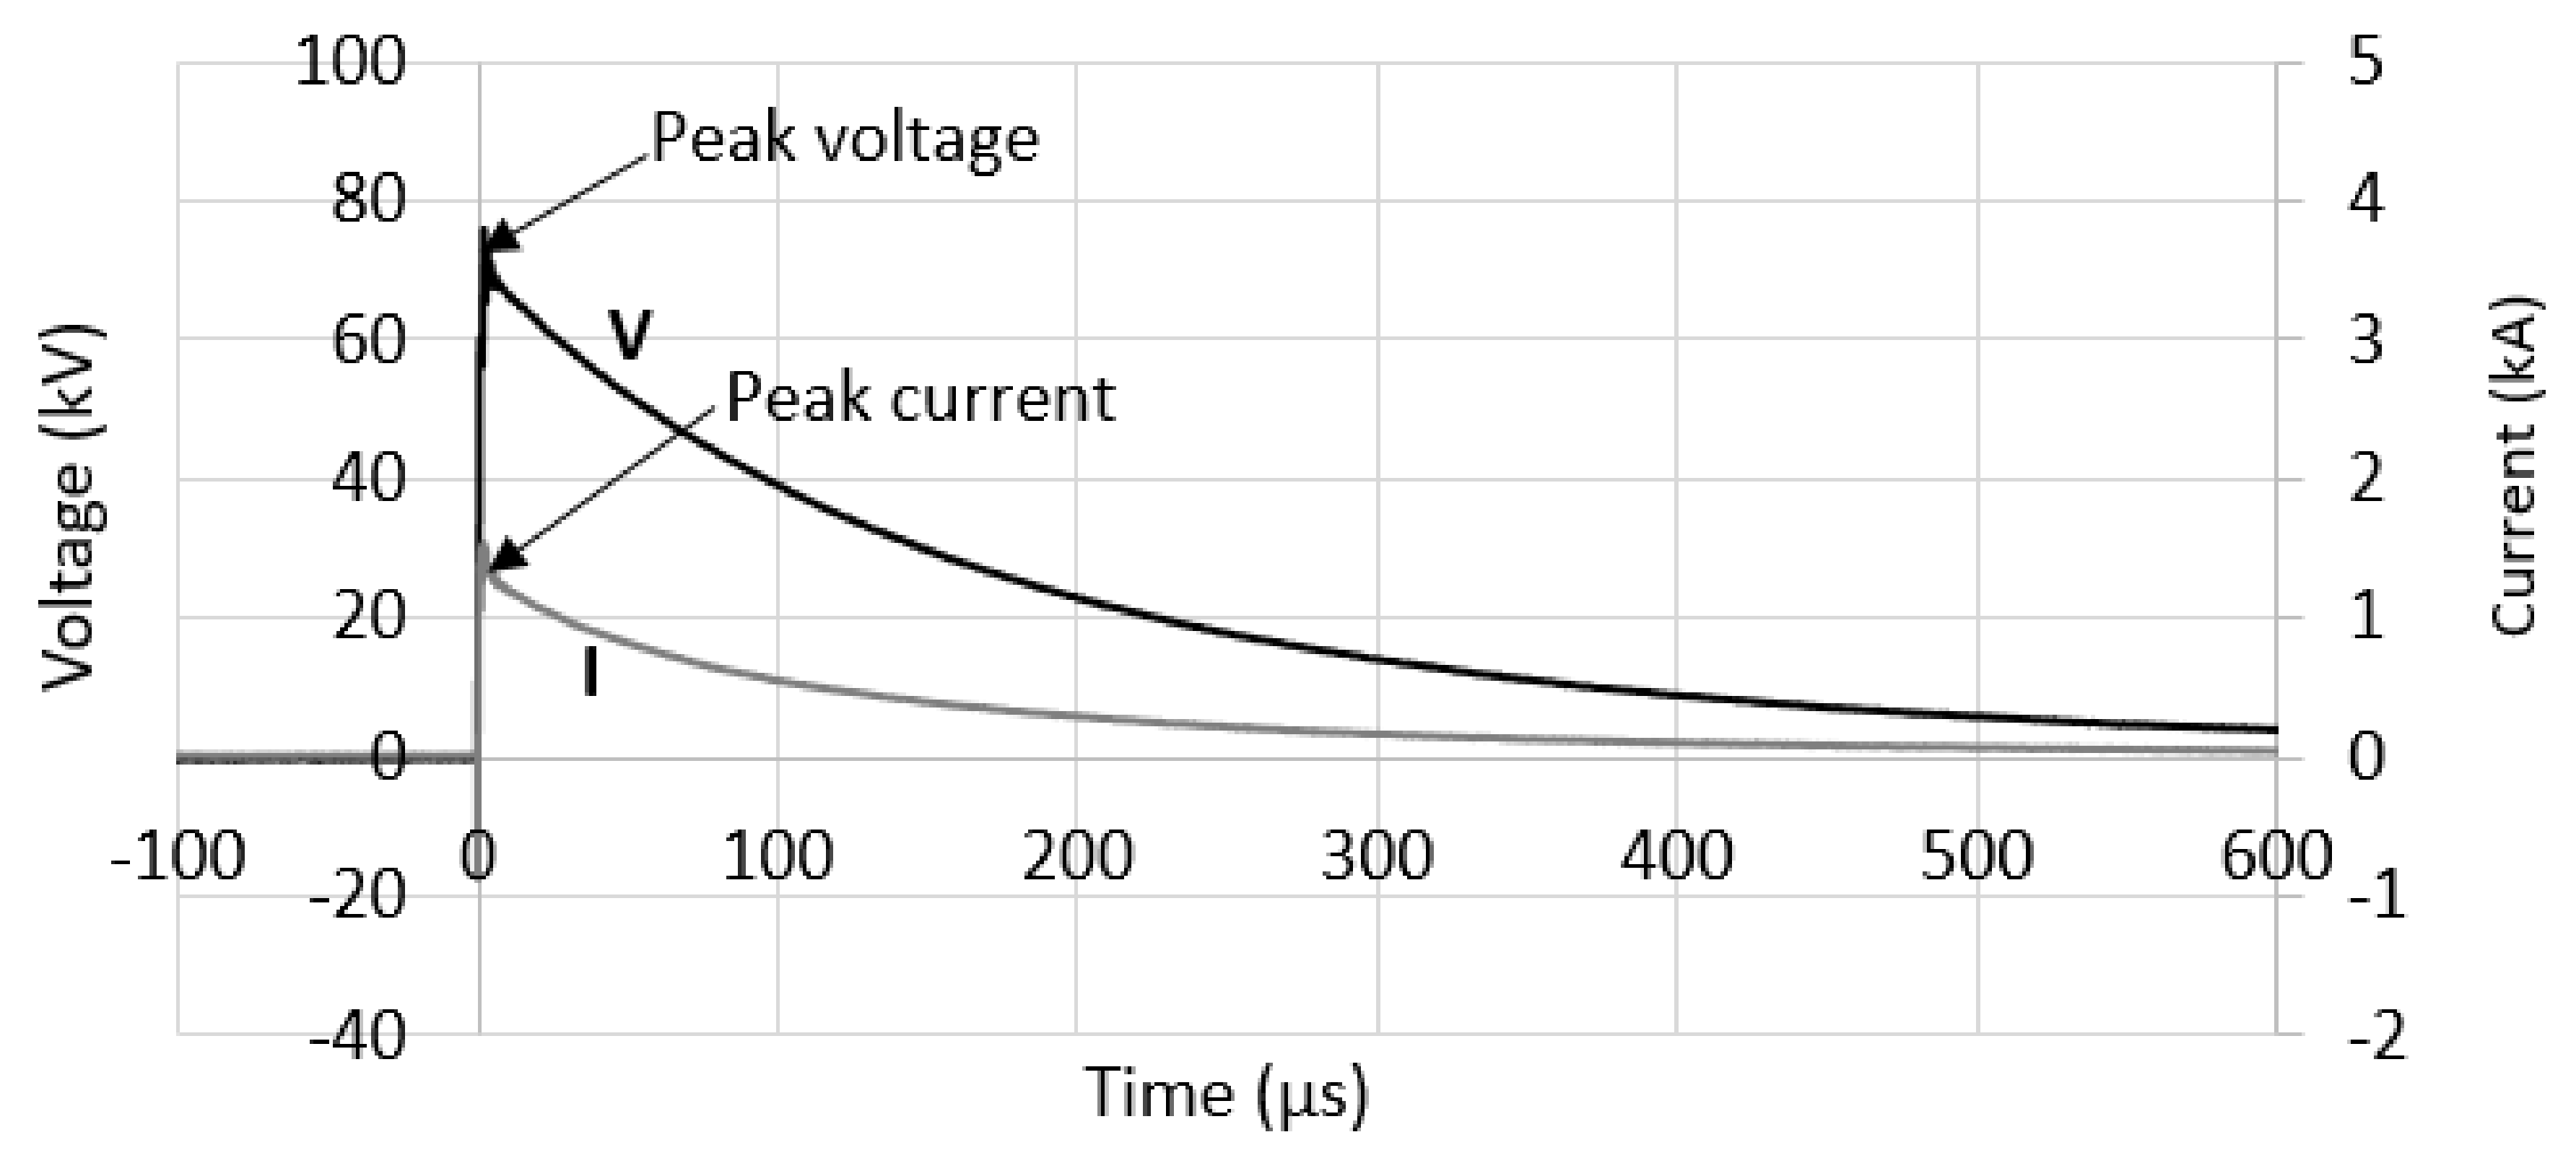
3.1. Before the Occurrence of Breakdown

Figure 2 shows the voltage and current waveforms obtained for GE5 at 100 kV. Similar voltage and current impulse shapes were seen for all six GEs, at different voltage/current levels. From these voltage and current traces, Zimp values are measured, taken as the ratio of peak voltage to the peak current (indicated in the figure); these values are plotted later on for all GEs. Figure 3a,b show the current waveforms obtained for GE5 when subjected to various charging voltages, at short and long time scales, respectively. As can be seen from Figure 3a, there are clear differences in the current rise times, despite the presence of oscillations on the initial current trace. These current rise times are plotted in Figure 4 and Figure 5, for positive and negative impulse polarity, respectively. These initial oscillations are thought to be caused by the capacitive component that may be present due to air voids within the soil, and between the electrode and the soil, as mentioned in [11]. It can be also seen in Figure 3b that the current discharged times are dependent on the current magnitudes: the higher the current magnitudes, the faster the current discharge times are. From the voltage and current waveforms for all test ground electrodes, the current rise and discharged times, and impulse impedance vs. peak current magnitudes are plotted for both impulse polarities. Figure 4 and Figure 5 show the current rises times, for positive and negative impulse polarities, respectively. It can be seen in both figures that the larger the ground electrode configurations (low RDC), the faster the current rise times become, indicating a better conduction in ground electrodes. A better conduction is also seen at higher current magnitudes: the current rise times decrease with increasing current magnitudes. There are, however, some inconsistencies in the current rise times, which can be due to several factors, such as uneven air voids, water movement in soil, soil heterogeneity, and grain size distribution in soil, as well as the initial oscillations that are present in the current traces. GE 6 (with the lowest RDC) has the fastest current rise times for both impulse polarities, indicating good conduction of ground electrodes, due to a relatively low RDC value.
A similar trend can also be seen in the current discharged times, where the fastest discharged times can be seen in the GE6 (with the lowest RDC), while for other electrodes, they are not affected by the RDC values, for both impulse polarities (see Figure 6 and Figure 7, respectively, for positive and negative impulse polarity). This could be due to the presence of the five needles of the GDSR, and its low RDC in GE 6, providing a better conduction level in comparison to other electrodes. In this work, current discharged time is defined as the time taken for the current trace to discharge to zero. It can also be seen from the figures that these current discharged times are high, more than 1000 μs, which are two times higher than those in previously published work [10,13] for practical ground electrodes. This is due to the ground electrodes used in this paper being installed in much higher soil resistivity in comparison to those earlier publications [10,13]. It was, however, highlighted in [21] that it is important to have the ionisation occur in a shorter time, so that the impulse impedance can decrease quickly, hence reducing the potential at the top of the tower. Further, the flashover time of the insulator is stated in [21] as occurring within 3 s to 4 s; thus, the ionisation would be expected to occur in a faster time in order to reduce the tripping out rate of the systems. In relation to this study, though the soil resistivity and, relatively, the values of RDC are high, the current discharged times are found to occur below 0.002 s, faster than the flashover time of the insulator.
In this paper, the impulse impedance parameter is defined as the ratio of voltage at peak current to the peak current value. Figure 8 shows the impulse impedance (Zimpulse values) at different peak current magnitudes for positive and negative impulse polarities, respectively. As can be seen, the Zimpulse decreases with increasing current magnitudes, in both impulse polarities, indicating non-linearity behaviour in soil. Impulse impedance values are plotted with increasing current for all GEs, and it is found that the higher the RDC values, the higher the impulse impedance values are, and the steeper the curves are. It can be seen from the dashed lines that the impulse impedance values of the same GEs are in the same range, for both impulse polarities, indicating that no observable impulse polarity effect is seen for all GEs. The percentage differences are calculated from (RDC − Zimp)/RDC) × 100%, where the Zimp values are considered for their maximum and the minimum. It was noted that percentage differences are found to be in a range of 73% to 89% for these GEs, and these percentages are not affected by impulse polarity. Table 2 summarises the percentage differences for all GEs under both impulse polarities.

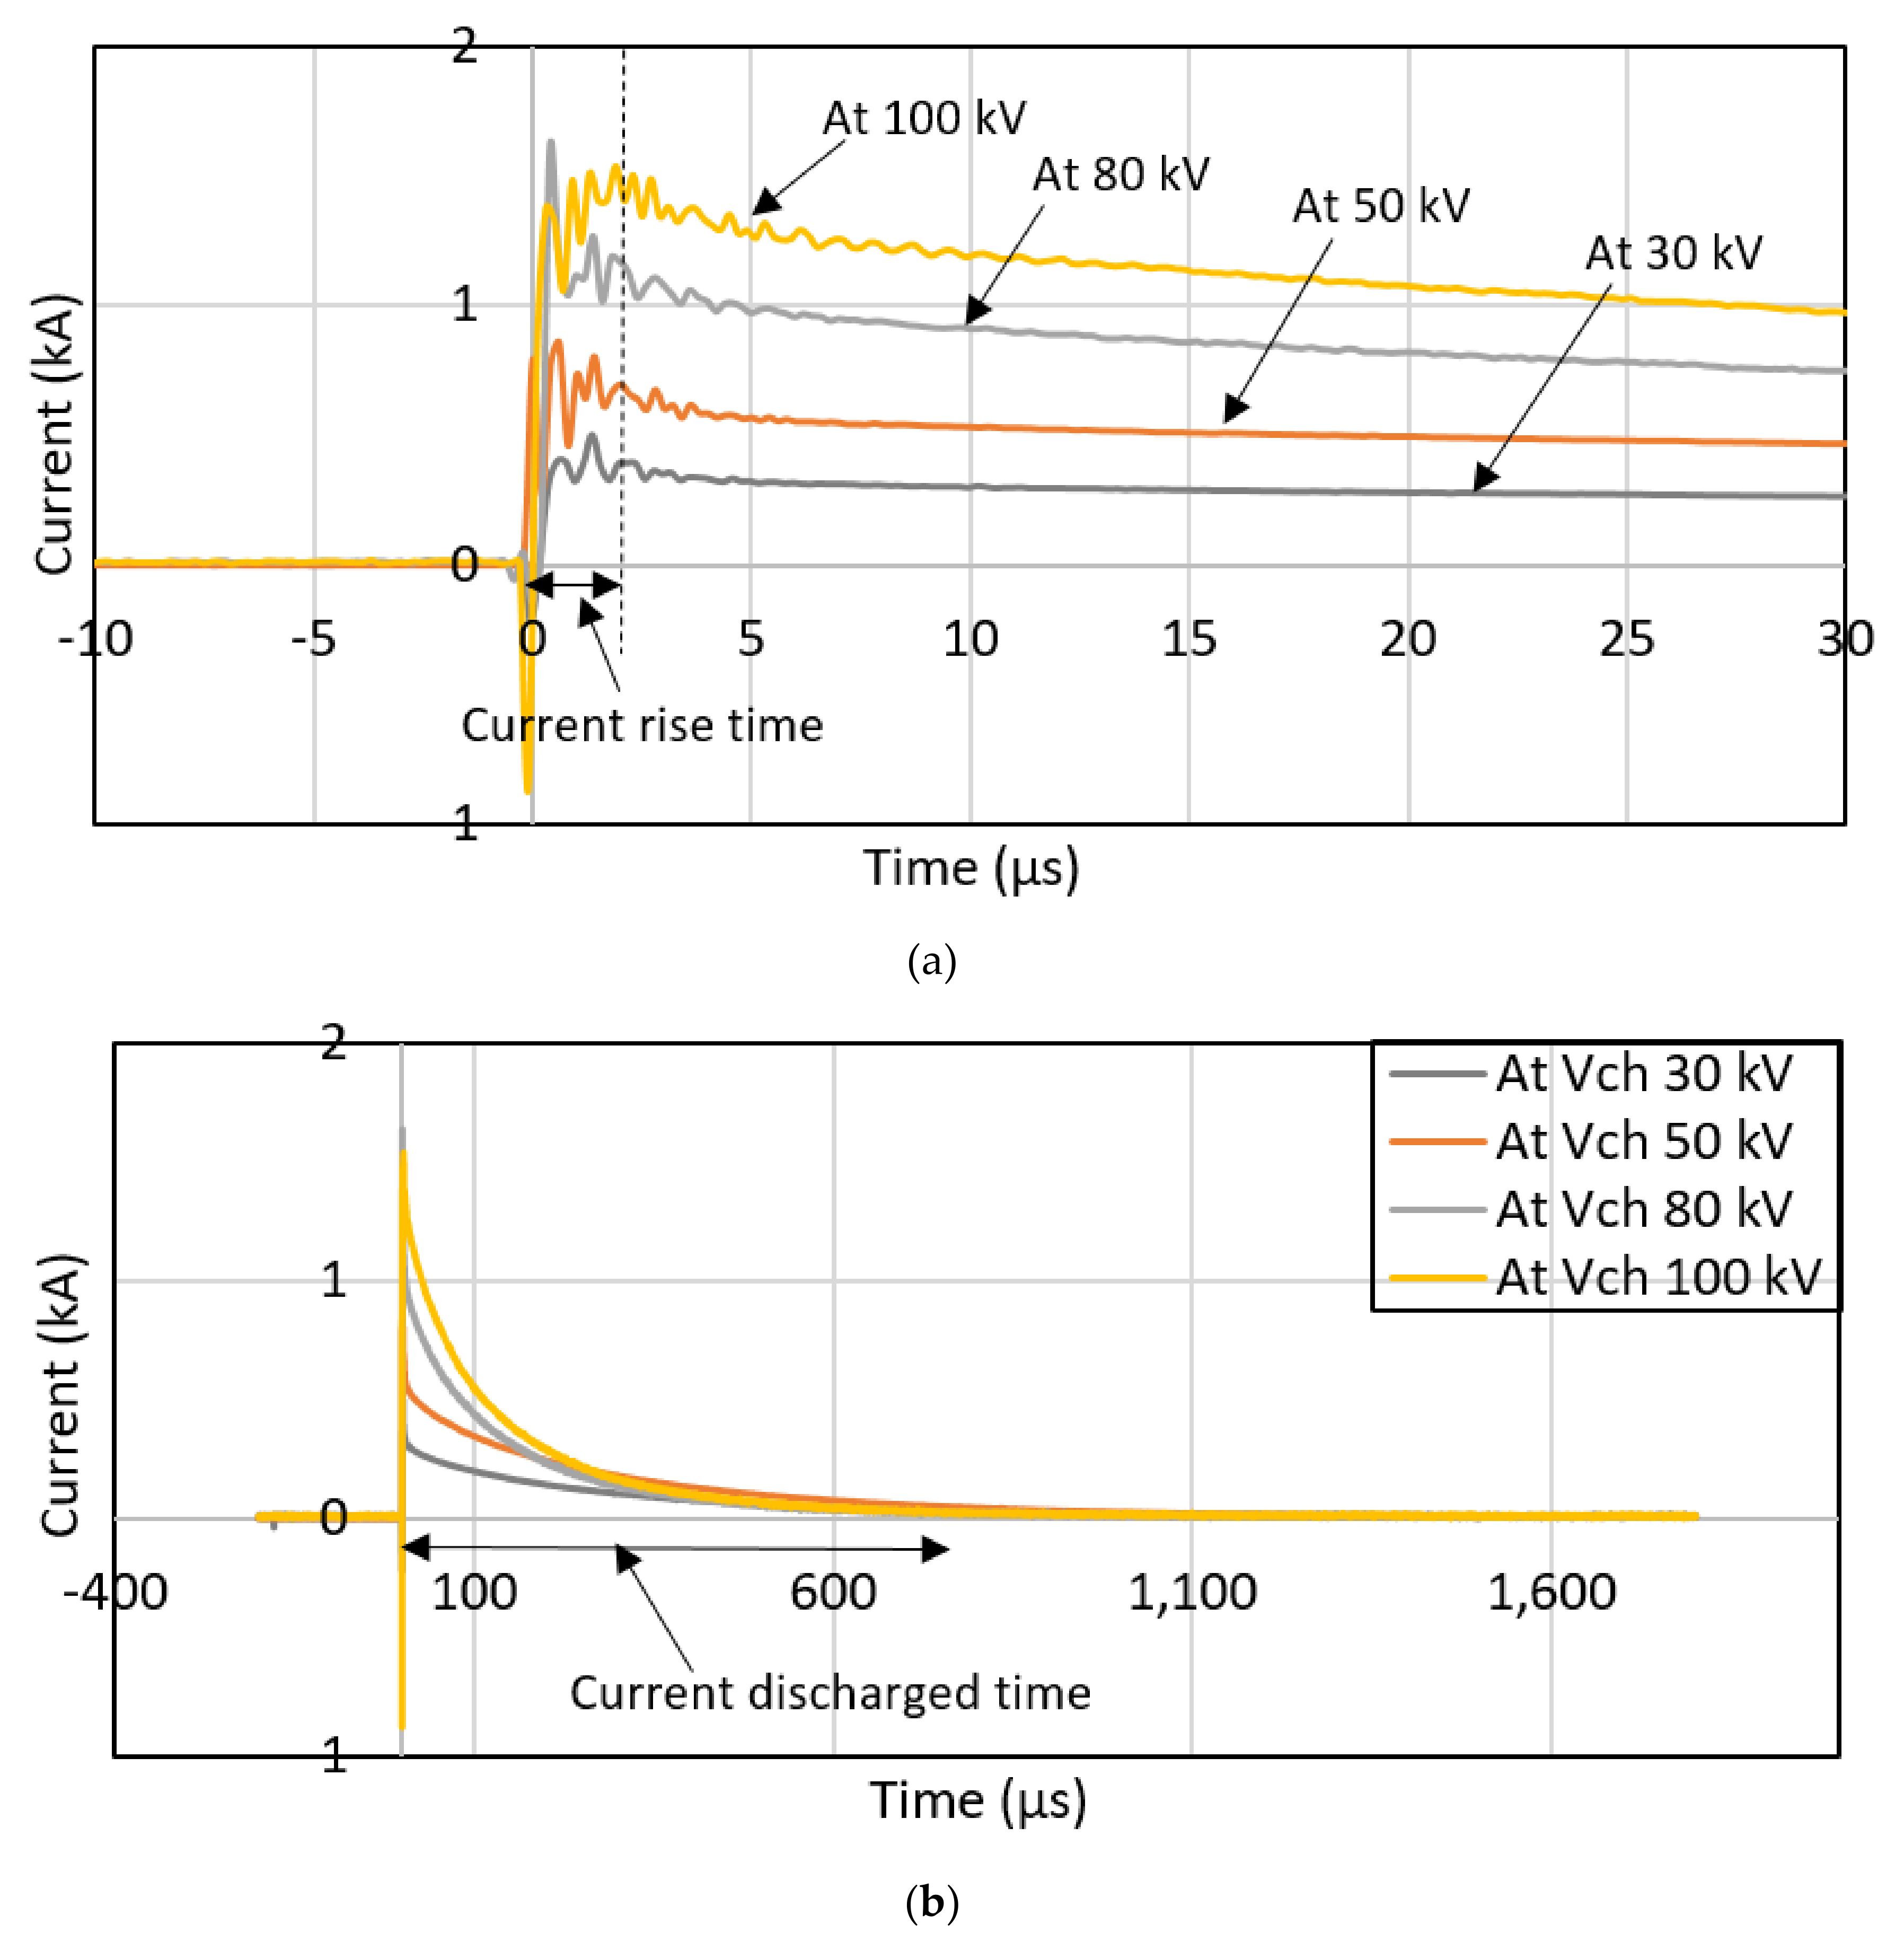
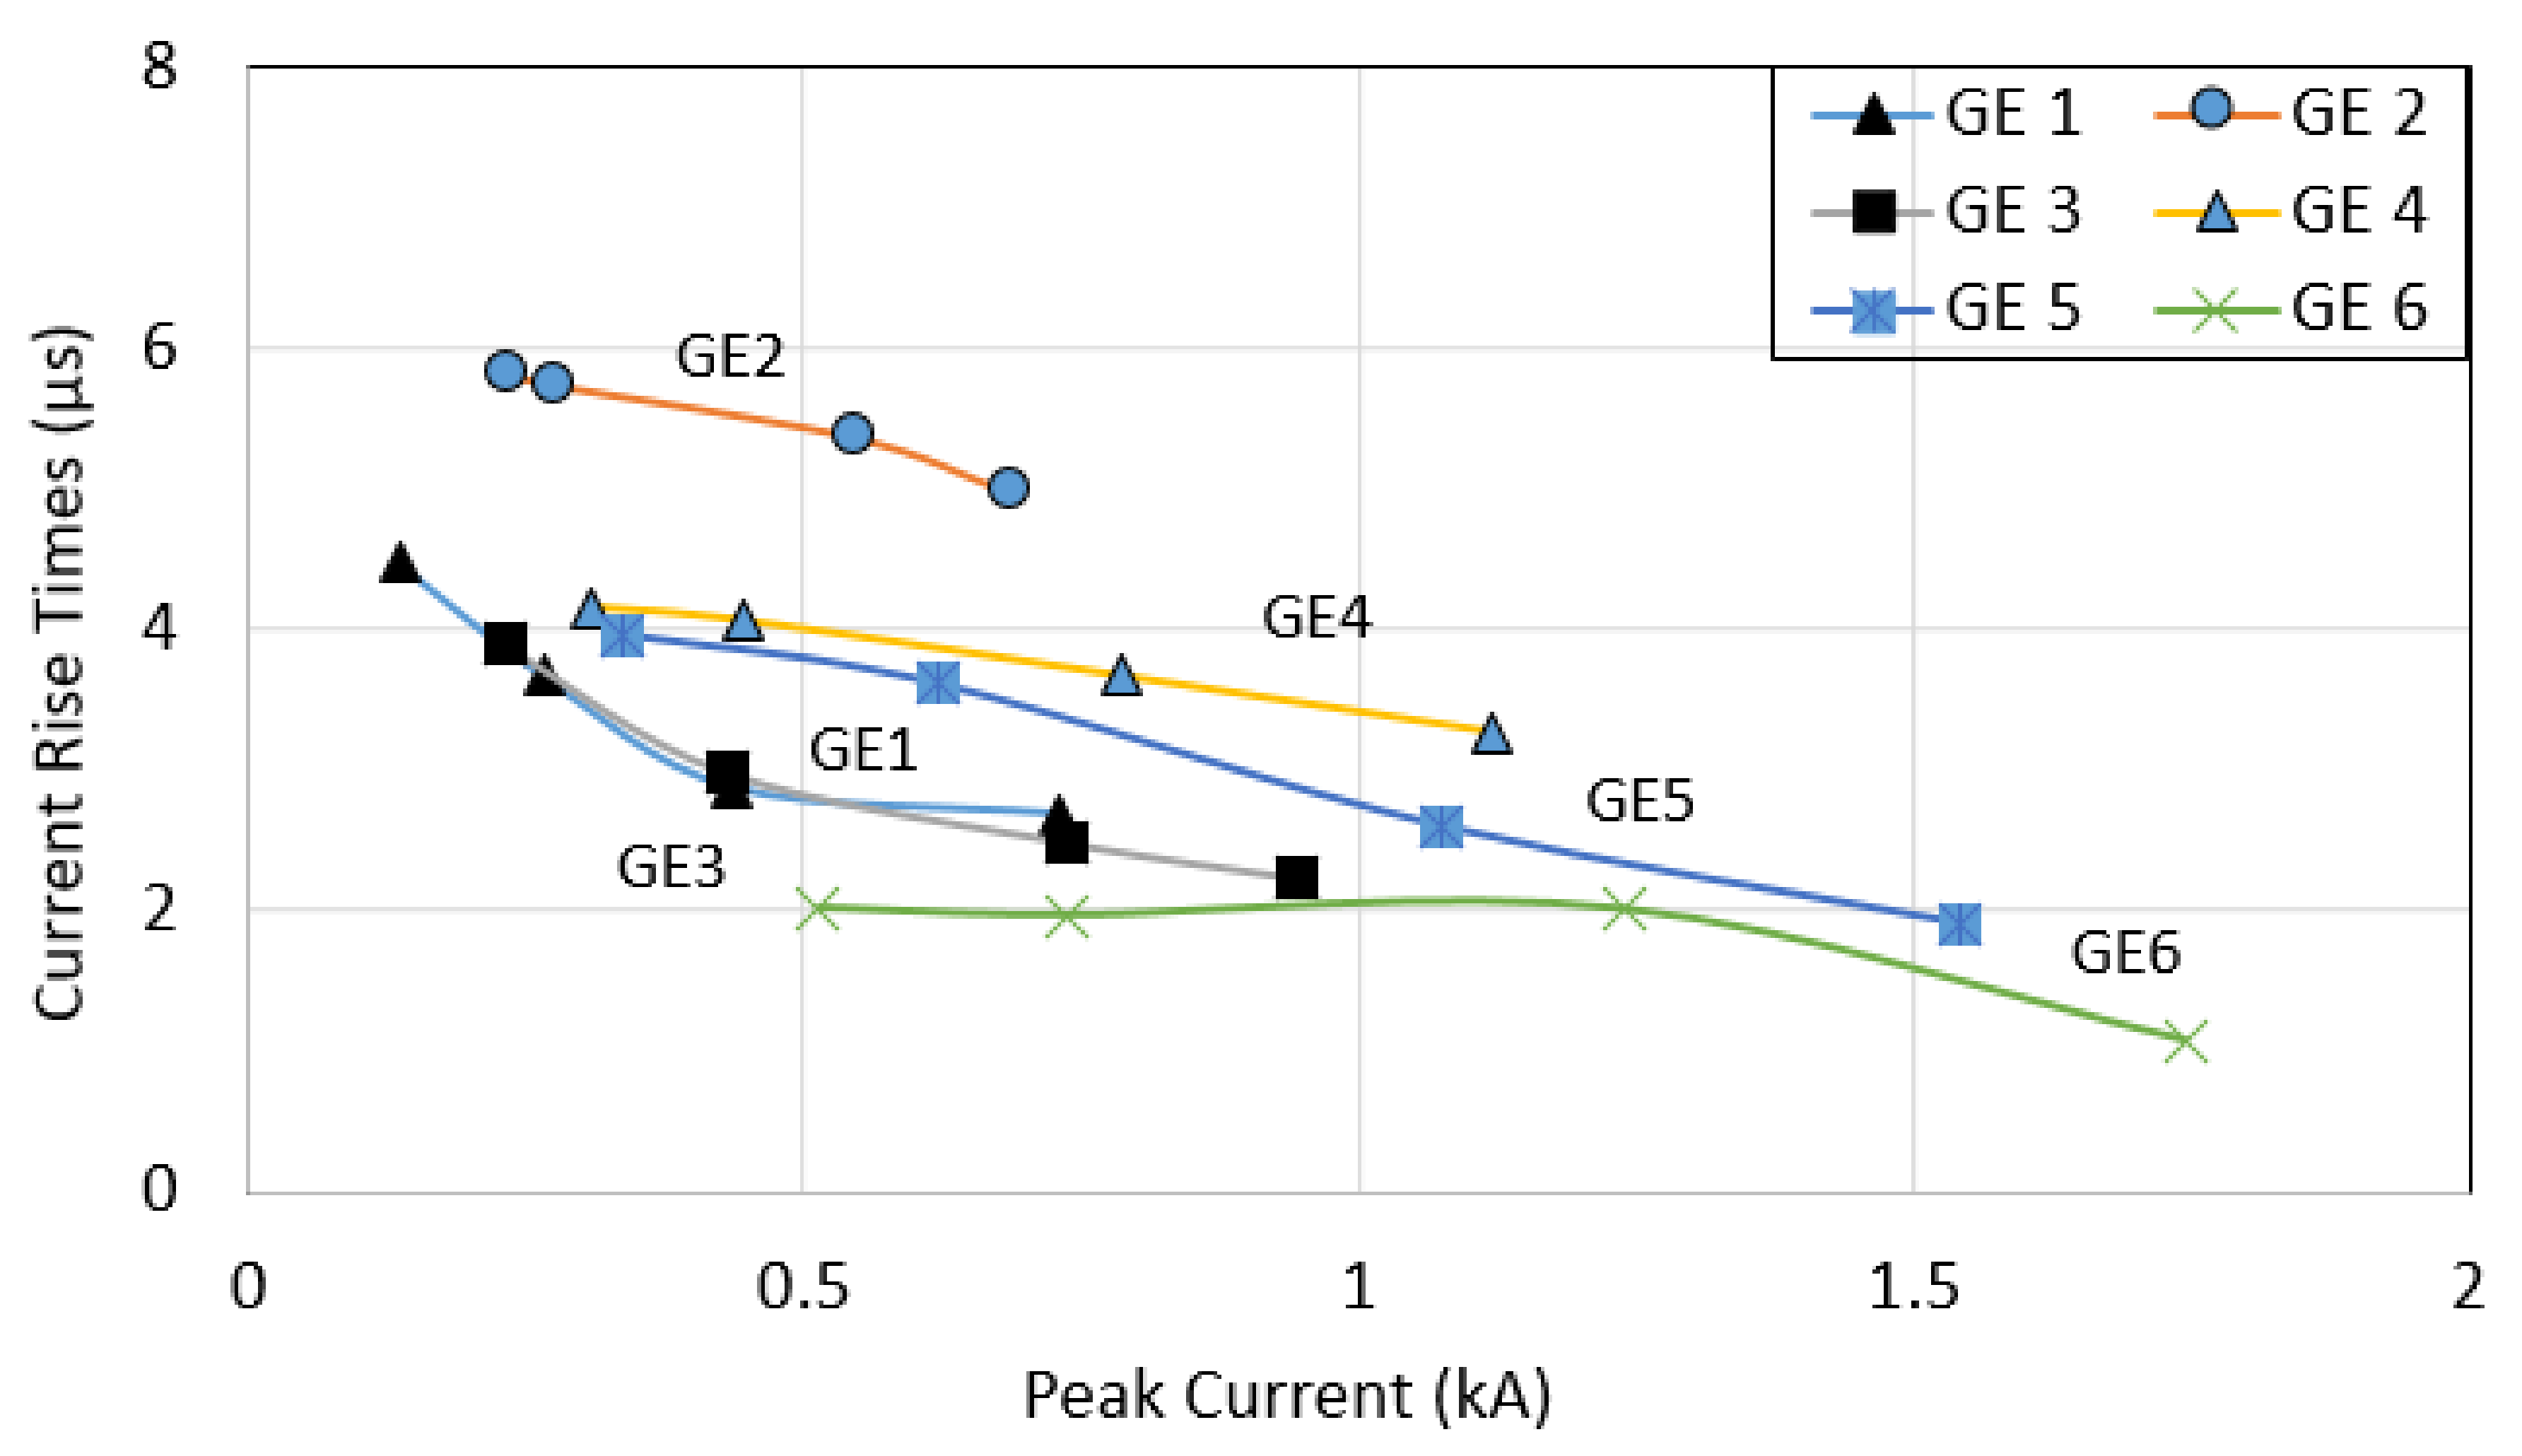
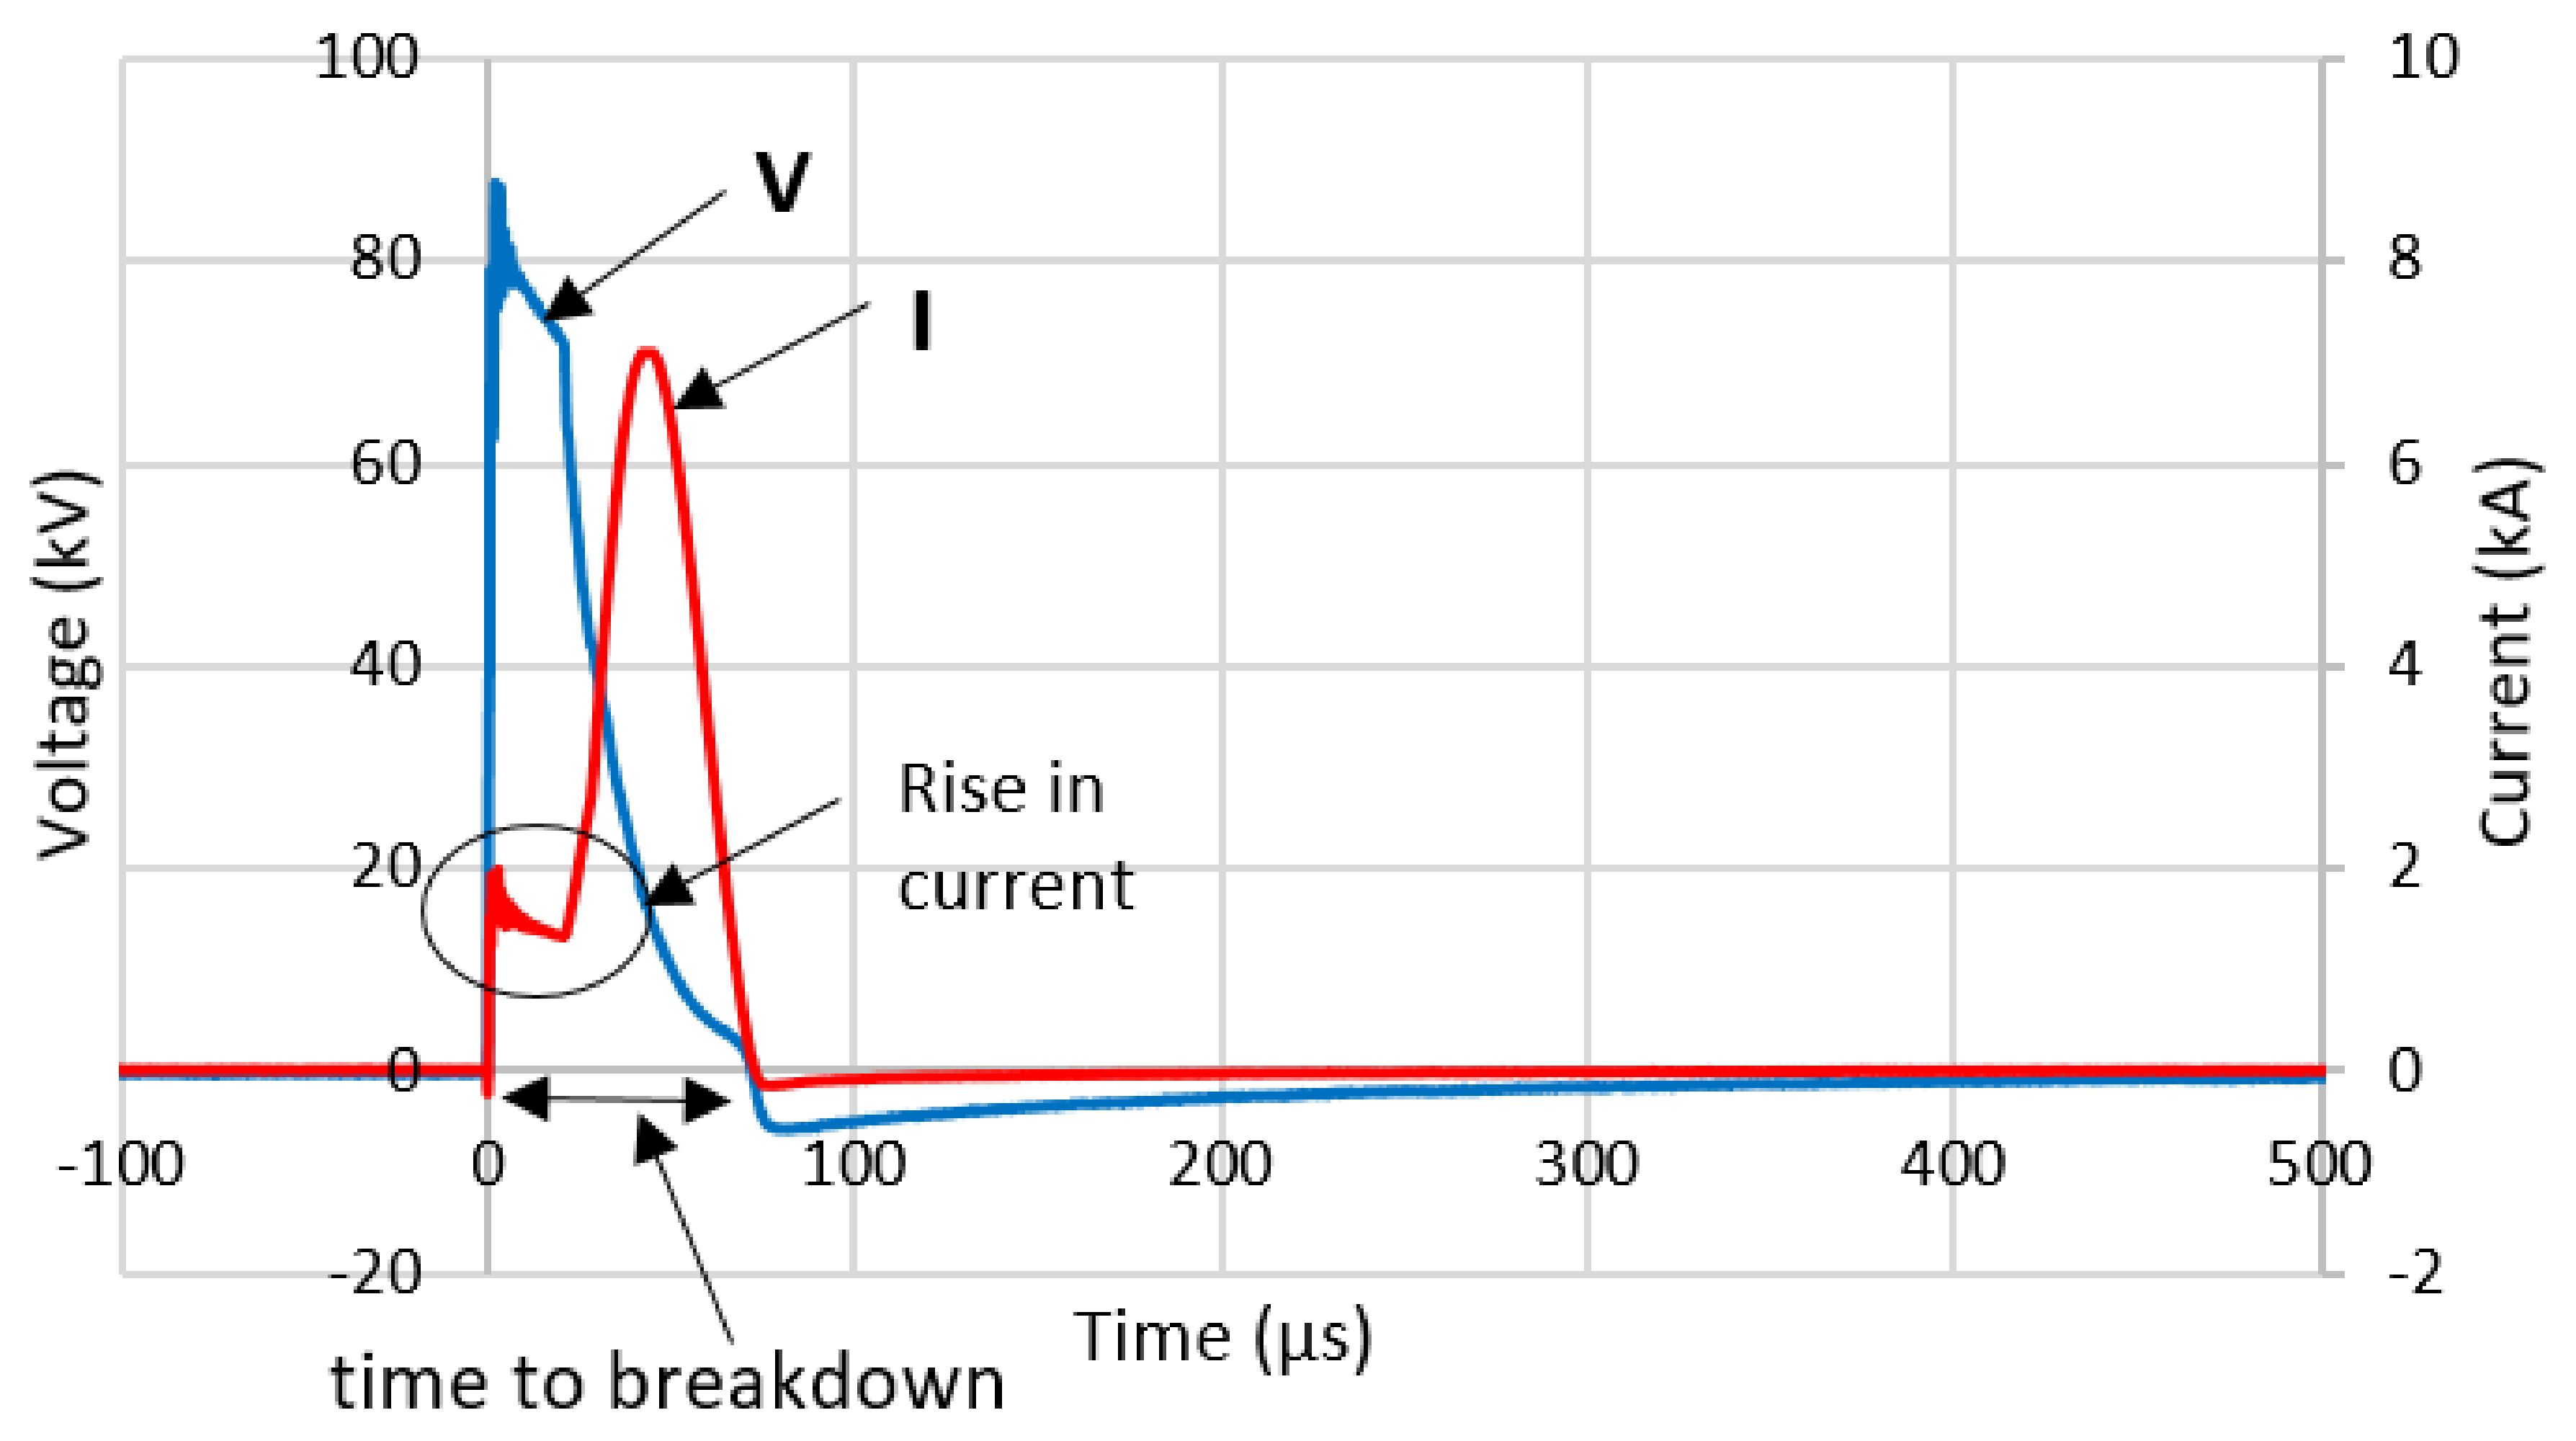
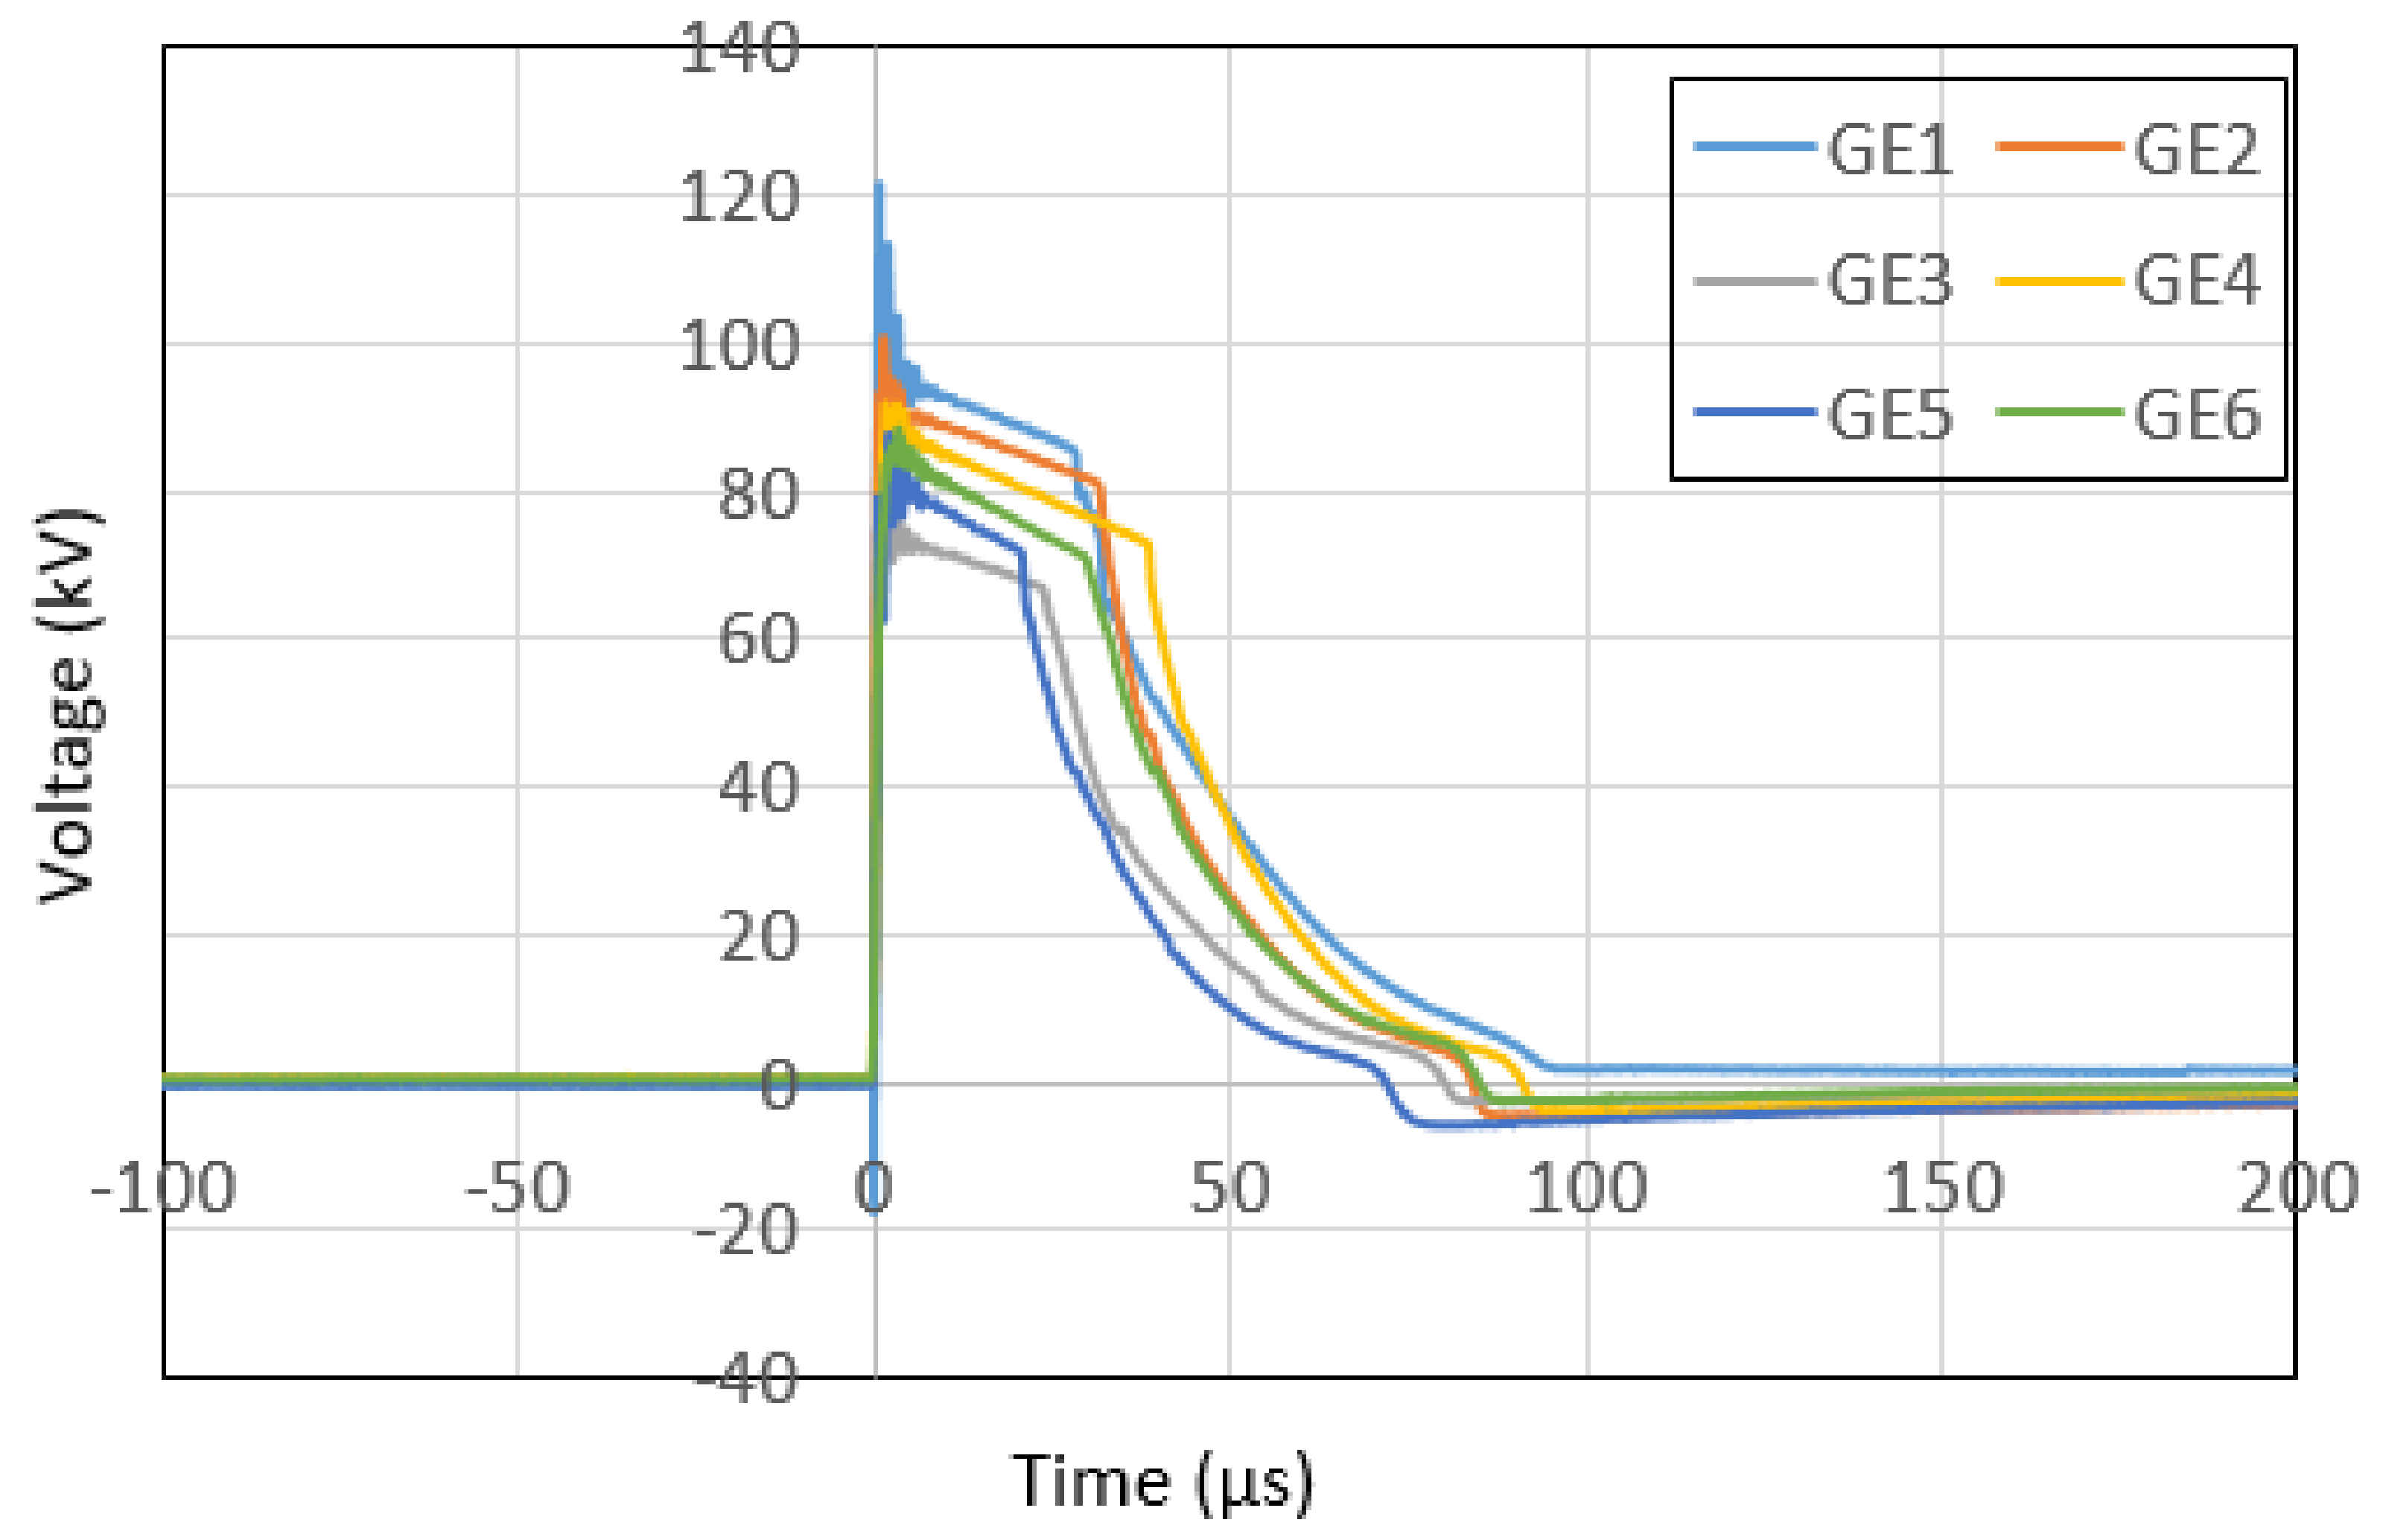
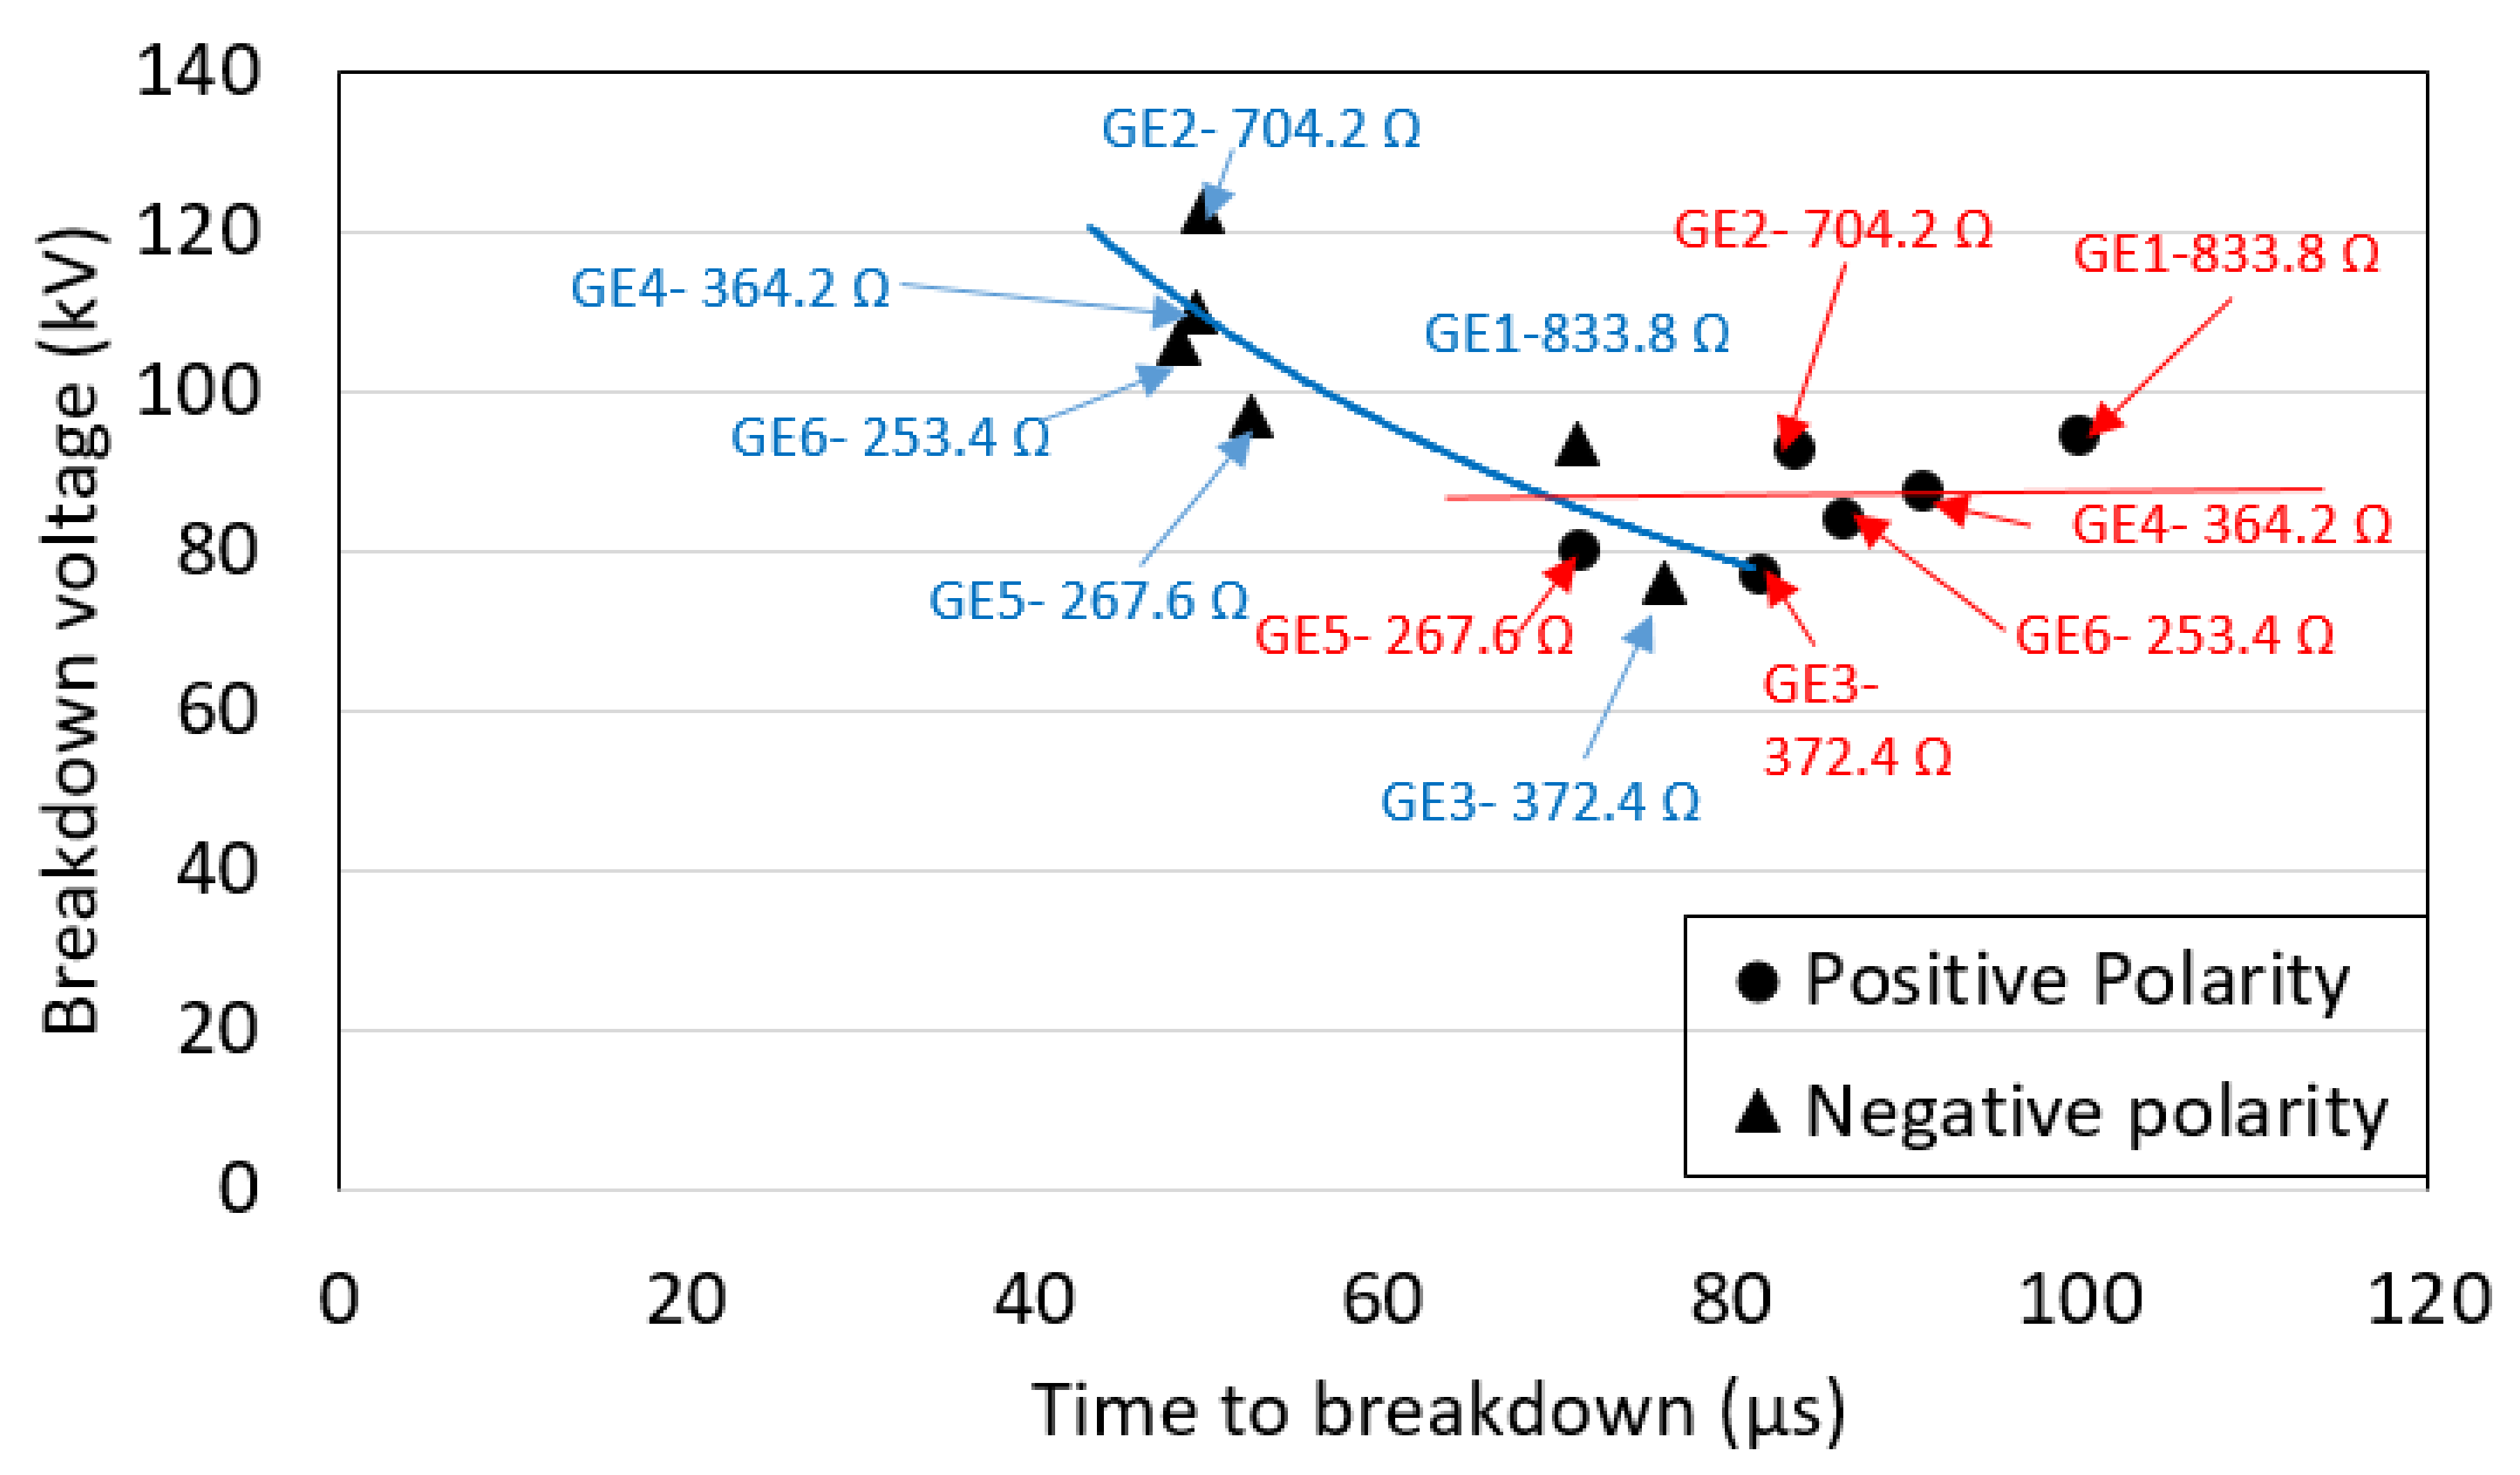
3.2. During Occurrence of Breakdown

As the voltage magnitudes are increased, breakdown in the soil was observed, as shown in Figure 9. It was noticed from the figure that there was a small rise in current magnitude, during a slow rate of decrease in voltage magnitudes. Upon measuring the impedance values in this pre-breakdown region, it was found that the impedance values were 125 Ω, 90 Ω, 70 Ω, 90 Ω, 44.4 Ω, and 60 Ω, respectively, for GE 1, GE 2, GE 3, GE 4, GE 5, and GE 6 for positive impulse polarity. These values are within the dashed lines, shown in Figure 8. Close values, within the dashed lines indicated in Figure 8, are seen for the case of negative impulse polarity: 100 Ω, 69 Ω, 83 Ω, 69 Ω, 50 Ω, and 52 Ω, respectively, for GE 1, GE 2, GE 3, GE 4, GE 5, and GE 6. These impedance values, which are within the obtained values presented in Section 3.1, indicate that the small current rise in the pre-breakdown region could possibly be due to the growth of conduction, with a smaller ionisation zone, exhibited the during ionisation process, as seen in Section 3.1. After a short time, further conduction in soil had occurred, which resulted in a sudden fall in voltage, and a sharp increase in current, indicating a bigger ionisation zone was produced. The current magnitudes were found to reach more than 9 kA in several GEs, hence reducing the impulse impedance significantly. Taking the impulse impedance as a ratio of breakdown voltage to peak current, the impulse impedance values are found to be below 20 Ω, pronouncedly reduced from RDC values. The percentage difference between the impulse impedance and the RDC is calculated as (RDC − Zimp)/RDC × 100% (i.e., for GE 1, RDC is 833.78 Ω, and Zimp during breakdown, taken as peak voltage divide by peak current, is 100 kV/5.7 kA, which gives Zimp of 17.5 Ω; thus, (833.78 − 17.5)/833.78 × 100% yields 98%). It was noticed that during breakdown, the Zimp of all GEs dropped more than 95% from RDC values.
It was also observed that the discharged time for current is reduced sharply in comparison to the case without breakdown, presented earlier in Section 3.1, indicating a more effective performance of ground electrodes in discharging high current into the ground. These times to breakdown are also lower than the discharged times for the same tested electrodes that were installed in very low-resistivity soil, and under higher magnitudes of currents, presented in [13]. It was also noted in [21] that with an increase of the peak voltage, a decrease in breakdown time delay is seen for the ground electrodes of rod-to-plate electrodes. Figure 10 shows the typical voltage and current traces during breakdown in soil for all GEs under positive impulse polarity. From these traces, the applied voltage and the time to breakdown are measured for all GEs, as presented in Figure 11. As can be seen in Figure 11, the breakdown voltage of negative impulse was found to occur at higher voltage, and the times to breakdown occurred at shorter times than for positive impulse polarity. It was also noticed that the time to breakdown decreases with increasing breakdown voltage in soil for negative impulse polarity, which was also seen in [11]. On the other hand, the breakdown voltage was found to be constant for positive impulse polarity. The breakdown voltages are found to be independent of the RDC values for both impulse polarities.

4. Conclusions

Experimental tests on six practical ground electrodes under impulse currents by field measurements are presented. From close examination of the current waveforms, it can be seen that current rise times are the lowest in electrodes with low RDC values, while other electrodes have slower current rise times, indicating the inductive effect can be significant in high RDC values. The fastest current discharged times are also noted for GE 6 (with the lowest RDC), whilst the current discharged time are not affected by the RDC for other electrodes. Adding the rod electrodes relatively reduces the RDC. Under impulse conditions, it was found that the percentage drops of Zimpulse from the resistance of steady state (RDC) are in a range of 73% to 89%, and these percentages are independent of the RDC values and impulse polarities. It was, however, observed that Zimpulse becomes less dependent on current magnitudes for the GEs with low RDC (GEs 5 and 6). As the voltage magnitudes were increased, breakdown in soil was observed, with a sudden increase of current reaching up to 9 kA in several electrodes, giving a drop of impulse impedance values from their RDC of more than 95%. It was observed that the breakdown voltage of negative impulse polarity is higher than that of positive impulse polarity, giving a corresponding faster breakdown time in negative impulse polarity. The study also found that the impulse impedance is remarkably reduced to below 20 Ω, indicating an effective grounding system during the occurrence of breakdown in soil for these tested electrodes installed in high-resistivity soil. It can be recommended that for hard and high-resistivity soil, where it is difficult to reduce the RDC, impulse tests should be conducted, which can provide some reasonable justification, to some extent, for allowing certain RDC values as adequate, especially for the tower footing, which are normally located in hilly sites, with high soil resistivity, in which it is more challenging to obtain the required RDC.

Author Contributions

A.W.A.A. and N.M.N. were involved in setting up the experiment; A.W.A.A. and N.M.N. sorted out the data; A.W.A.A. prepared the draft; N.M.N. helped with validation of analysis. All authors have read and agreed to the published version of the manuscript.

Funding

This research was funded by TELEKOM MALAYSIA RESEARCH AND DEVELOPMENT (TMR&D) under grant number MMUE190085.

Conflicts of Interest

The authors declare no conflict of interest.

References

  1. BS7430-2015. Code of Practice for Protective Earthing of Electrical Installations; BSI Standards Limited: London, UK, 2015. [Google Scholar]
  2. IEEE 142-2007. IEEE Recommended Practice for Grounding of Industrial and Commercial Power Systems; IEEE Xplore: Piscataway, NJ, USA, 2007. [Google Scholar]
  3. IEEE 81-2012. IEEE Guide for Measuring Earth Resistivity, Ground Impedance, and Earth Surface Potentials of a Grounding System; IEEE Xplore: Piscataway, NJ, USA, 2012. [Google Scholar]
  4. IEEE 80-2013. IEEE Guide for Safety in AC Substation Grounding; IEEE SA: Piscataway, NJ, USA, 2013. [Google Scholar]
  5. Harid, N.; Griffiths, H.; Mousa, S.; Clark, D.; Robson, S.; Haddad, A. On the Analysis of Impulse Test Results on Grounding Systems. IEEE Trans. Ind. Appl. 2015, 51, 5324–5334. [Google Scholar] [CrossRef]
  6. Nor, N.M.; Abdullah, S.; Rajab, R.; Othman, Z. Comparison between utility sub-station and imitative earthing systems when subjected under lightning response. Int. J. Electr. Power Energy Syst. 2012, 43, 156–161. [Google Scholar]
  7. Stojkovic, Z.; Savic, M.; Nahman, J.; Salamon, D.; Bukorovic, B. Sensitivity analysis of experimentally determined grounding grid impulse characteristics. IEEE Trans. Power Deliv. 1998, 13, 1136–1142. [Google Scholar] [CrossRef]
  8. Vainer, A.L. Impulse Characteristics of Complex Earth Grids. Elektrichestvo 1965, 3, 107–117. [Google Scholar]
  9. Yang, S.; Zhou, W.; Huang, J.; Yu, J. Investigation on Impulse Characteristic of Full-Scale Grounding Grid in Substation. IEEE Trans. Electromagn. Compat. 2017, 60, 1993–2001. [Google Scholar] [CrossRef]
  10. Reffin, M.S.; Nor, N.M.; Ahmad, N.N.; Abdullah, S. Performance of Practical Grounding Systems under High Impulse Conditions. Energies 2018, 11, 3187. [Google Scholar] [CrossRef] [Green Version]
  11. Nor, N.M.; Haddad, A.; Griffiths, H. Characterisation of Ionisation Phenomena in Soils Under Fast Impulses. IEEE Trans. Power Deliv. 2005, 21, 353–361. [Google Scholar] [CrossRef]
  12. Sekioka, S. Frequency and Current-Dependent Grounding Resistance Model for Lightning Surge Analysis. IEEE Trans. Electromagn. Compat. 2018, 61, 419–425. [Google Scholar] [CrossRef]
  13. Ali, A.W.A.; Ahmad, N.N.; Nor, N.M.; Reffin, M.S.; Abdullah, S.A.S. Investigations on the Performance of a New Grounding Device with Spike Rods under High Magnitude Current Conditions. Energies 2019, 12, 1138. [Google Scholar]
  14. Koehler, F.; Swingler, J. Practical model for tower earthing systems in lightning simulations. Electr. Power Syst. Res. 2018, 158, 306–314. [Google Scholar] [CrossRef]
  15. Kherif, O.; Chiheb, S.; Teguar, M.; Mekhaldi, A.; Harid, N. Time-Domain Modeling of Grounding Systems’ Impulse Response Incorporating Nonlinear and Frequency-Dependent Aspects. IEEE Trans. Electromagn. Compat. 2018, 60, 907–916. [Google Scholar] [CrossRef]
  16. Datsios, Z.G.; Mikropoulos, P.N.; Staikos, E.T.; Tsovilis, T.E.; Vlachopoulos, D.; Ganatsios, S. Laboratory Measurement of the Impulse Characteristics of Wet Sand. In Proceedings of the IEEE International Conference on Environment and Electrical Engineering, Madrid, Spain, 9–12 June 2020; pp. 1642–1647. [Google Scholar]
  17. Alipio, R.; Visacro, S. Modeling the Frequency Dependence of Electrical Parameters of Soil. IEEE Trans. Electromagn. Compat. 2014, 56, 1163–1171. [Google Scholar] [CrossRef]
  18. Datsios, Z.G.; Mikropoulos, P.N. Characterization of the Frequency Dependence of the Electrical Properties of Sandy Soil with Variable Grain Size and Water Content. IEEE Trans. Dielectr. Electr. Insul. 2019, 26, 904–912. [Google Scholar] [CrossRef]
  19. CIGRE Working Group C4.33. Impact of Soil-Parameter Frequency Dependence on the Response of Grounding Electrodes and on the Lightning Performance of Electrical Systems; Technical Brochure 781; CIGRE: Paris, France, 2019. [Google Scholar]
  20. Clark, D.; Mousa, S.; Harid, N.; Griffiths, H.; Haddad, A. Lightning Current Performance of Conventional and Enhanced Rod Ground Electrodes. IEEE Trans. Electromagn. Compat. 2021. early access. [Google Scholar] [CrossRef]
  21. He, J.; Zhang, B.; Zeng, R.; Zhang, B. Experimental Studies of Impulse Breakdown Delay Characteristics of Soil. IEEE Trans. Power Deliv. 2011, 26, 1600–1607. [Google Scholar] [CrossRef]
  22. Hizamul-Din, H.; Mohamad, N.N. On the Analysis of Zinc Oxide (ZnO) Surge Arrester Connected to Various Ground Electrodes. Energies 2021. submitted. [Google Scholar]
  23. Metwally, I.A. D-Dot Probe for Fast-Front High-Voltage Measurement. IEEE Trans. Instrum. Meas. 2010, 59, 2211–2219. [Google Scholar] [CrossRef]
Figure 1. Impulse test arrangement on practical ground electrodes.
Energies 14 02401 g001
Figure 2. Voltage and current traces of GE 5, at charging voltage of positive impulse polarity at 100 kV.
Energies 14 02401 g002
Figure 3. Current traces of GE 5, at various charging voltages of positive impulse polarity: (a) short time scale, (b) long time scale.
Energies 14 02401 g003
Figure 4. Current rise times for GEs at various peak current magnitudes under positive impulse polarity.
Energies 14 02401 g004
Figure 5. Current rise times for GEs at various peak current magnitudes under negative impulse polarity.
Energies 14 02401 g005
Figure 6. Current discharged times for GEs at various peak current magnitudes under positive impulse polarity.
Energies 14 02401 g006
Figure 7. Current discharged times for GEs at various peak current magnitudes under negative impulse polarity.
Energies 14 02401 g007
Figure 8. Impulse impedance for GEs at various peak current magnitudes.
Energies 14 02401 g008
Figure 9. Voltage and current traces during breakdown in GE 5, at charging voltage of 120 kV.
Energies 14 02401 g009
Figure 10. Voltage traces during breakdown at various applied voltages for all GEs at their breakdown voltages.
Energies 14 02401 g010
Figure 11. Breakdown voltages vs. time to breakdown for all GEs, with their corresponding RDCs.
Energies 14 02401 g011
Table 1. Various ground electrodes and measured RDC values.
Ground Electrodes
Energies 14 02401 i001 Energies 14 02401 i002
GE 1, RDC is 833.78 ΩGE 2, RDC is 704.18 Ω
Energies 14 02401 i003 Energies 14 02401 i004
GE 3, RDC is 372.38 ΩGE 4, RDC is 364.18 Ω
Energies 14 02401 i005 Energies 14 02401 i006
GE 5, RDC is 267.58 ΩGE 6, RDC is 253.38 Ω
Table 2. Percentage drop of Zimp values from its RDC.
Ground Electrodes Percentage Drop (%) for Positive PolarityPercentage Drop (%) for Negative Polarity
GE 1The highest Zimp78.678.5
The lowest Zimp87.385
GE 2The highest Zimp79.777.9
The lowest Zimp84.185.4
GE 3The highest Zimp7573.7
The lowest Zimp79.579.2
GE 4The highest Zimp75.375.1
The lowest Zimp80.280
GE 5The highest Zimp77.176.5
The lowest Zimp81.683.8
GE 6The highest Zimp78.676.7
The lowest Zimp85.283.3
Publisher’s Note: MDPI stays neutral with regard to jurisdictional claims in published maps and institutional affiliations.

