
An Experimental Investigation on Photovoltaic Array Power Output Affected by the Different Partial Shading Conditions


Abstract
:1. Introduction
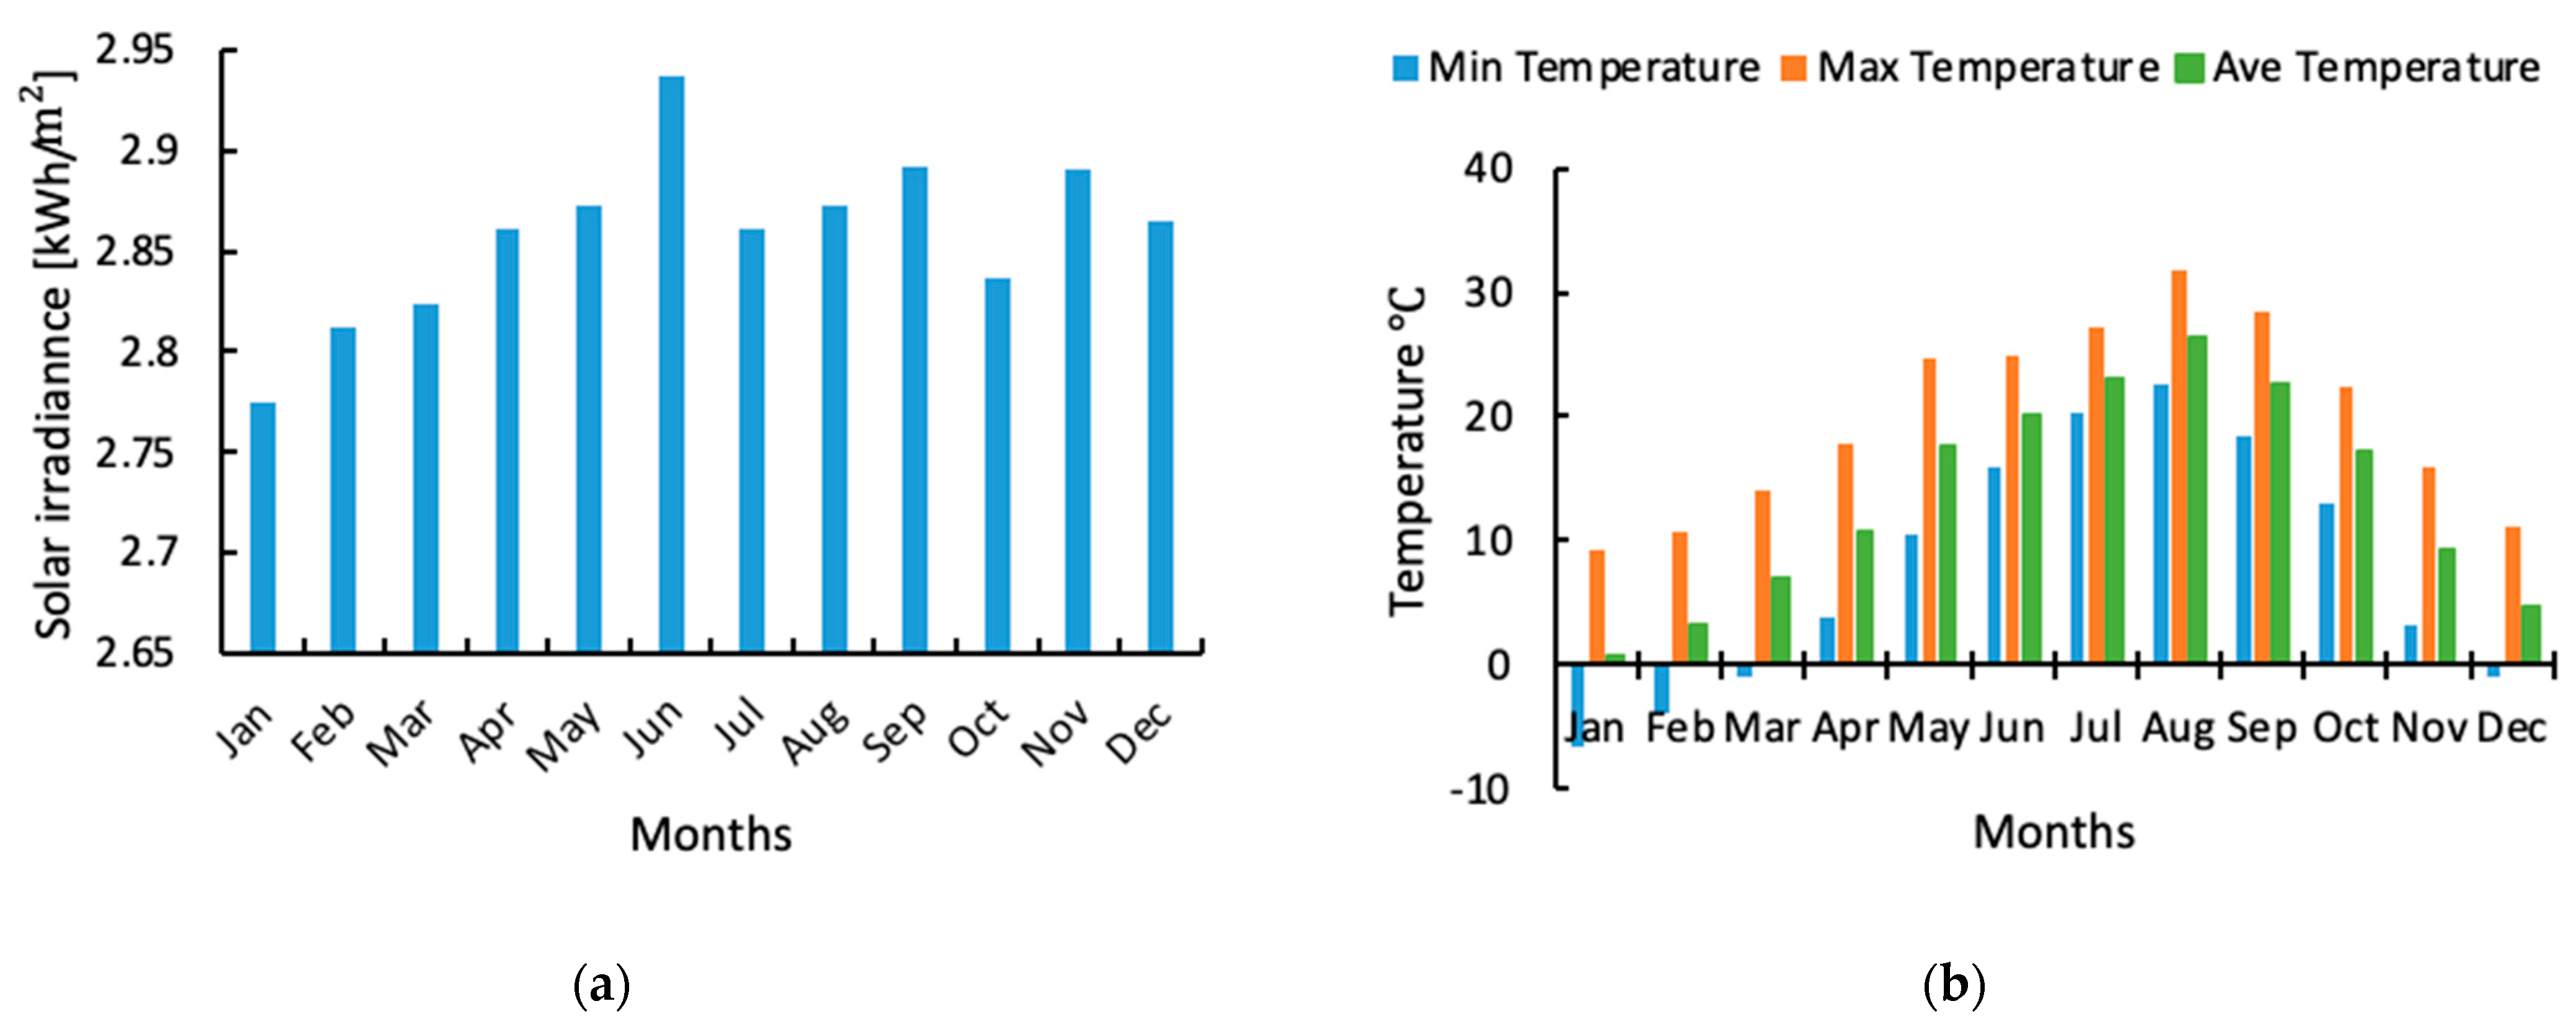
- The literature so far focuses on shading due to trees, clouds, close buildings, or any other objects that appear close to a PV module. In this research, an experimental setup of a PV array with series configuration using 2 4 PV modules was built.
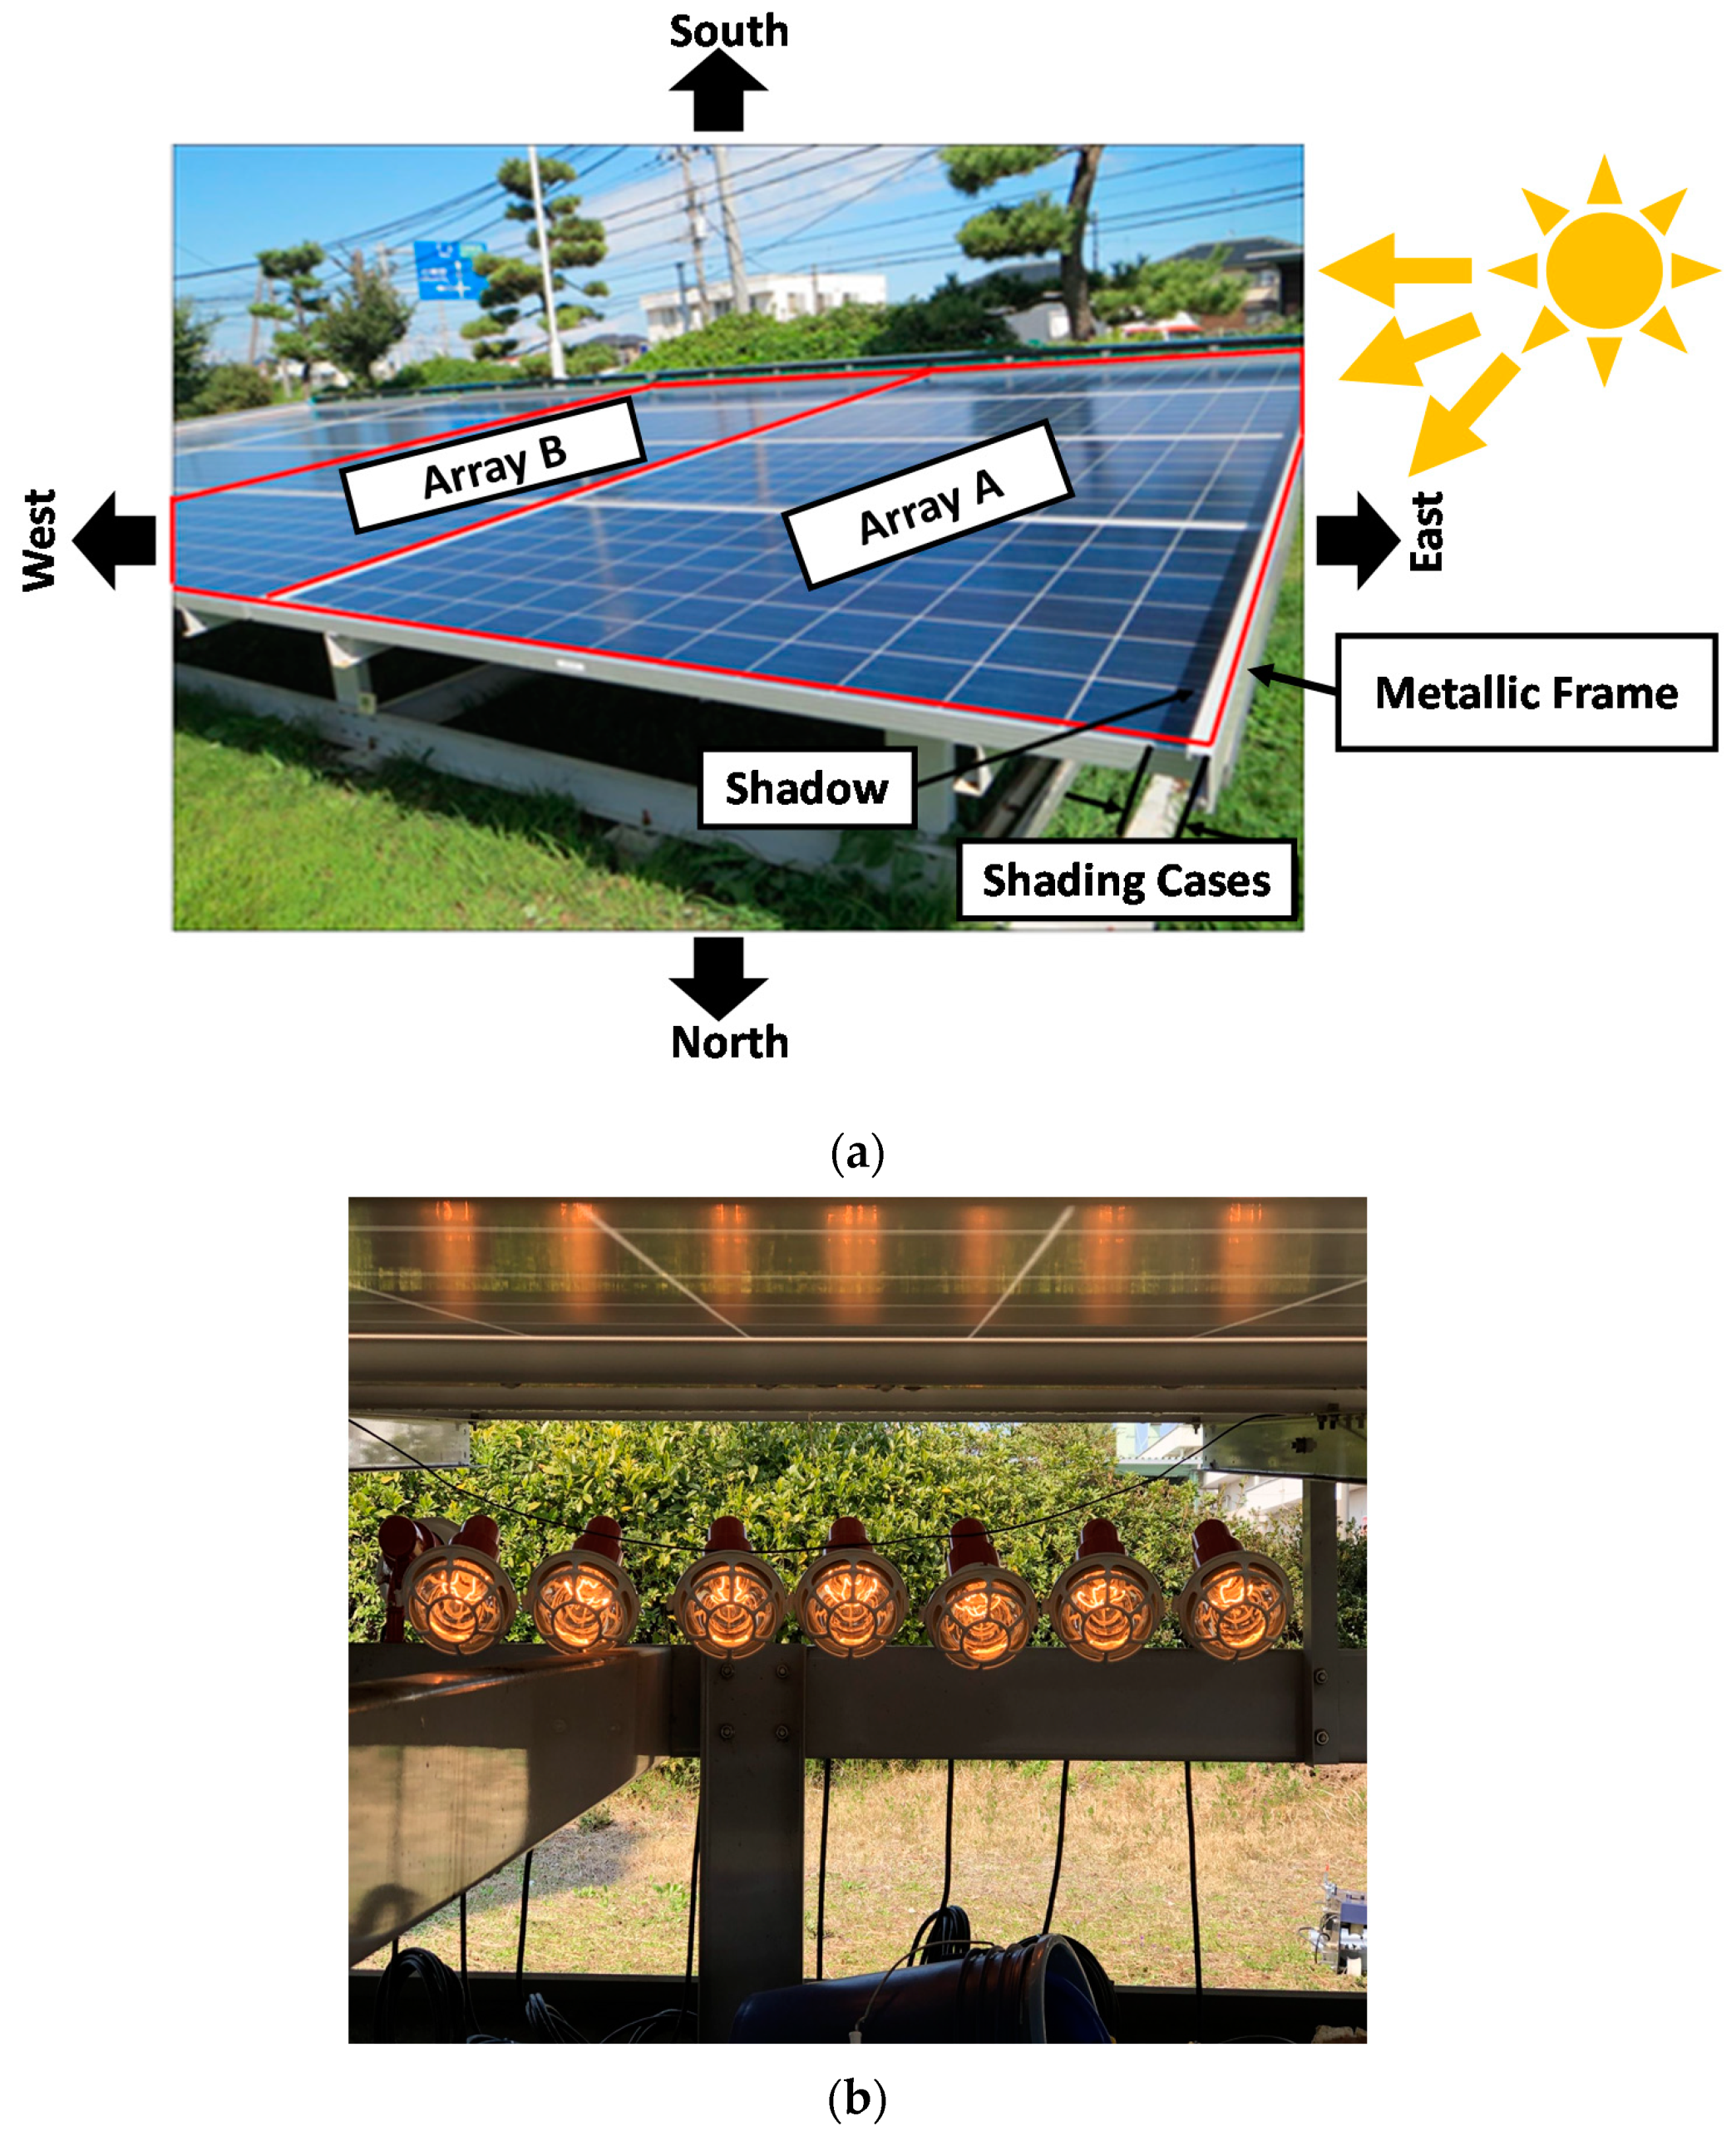
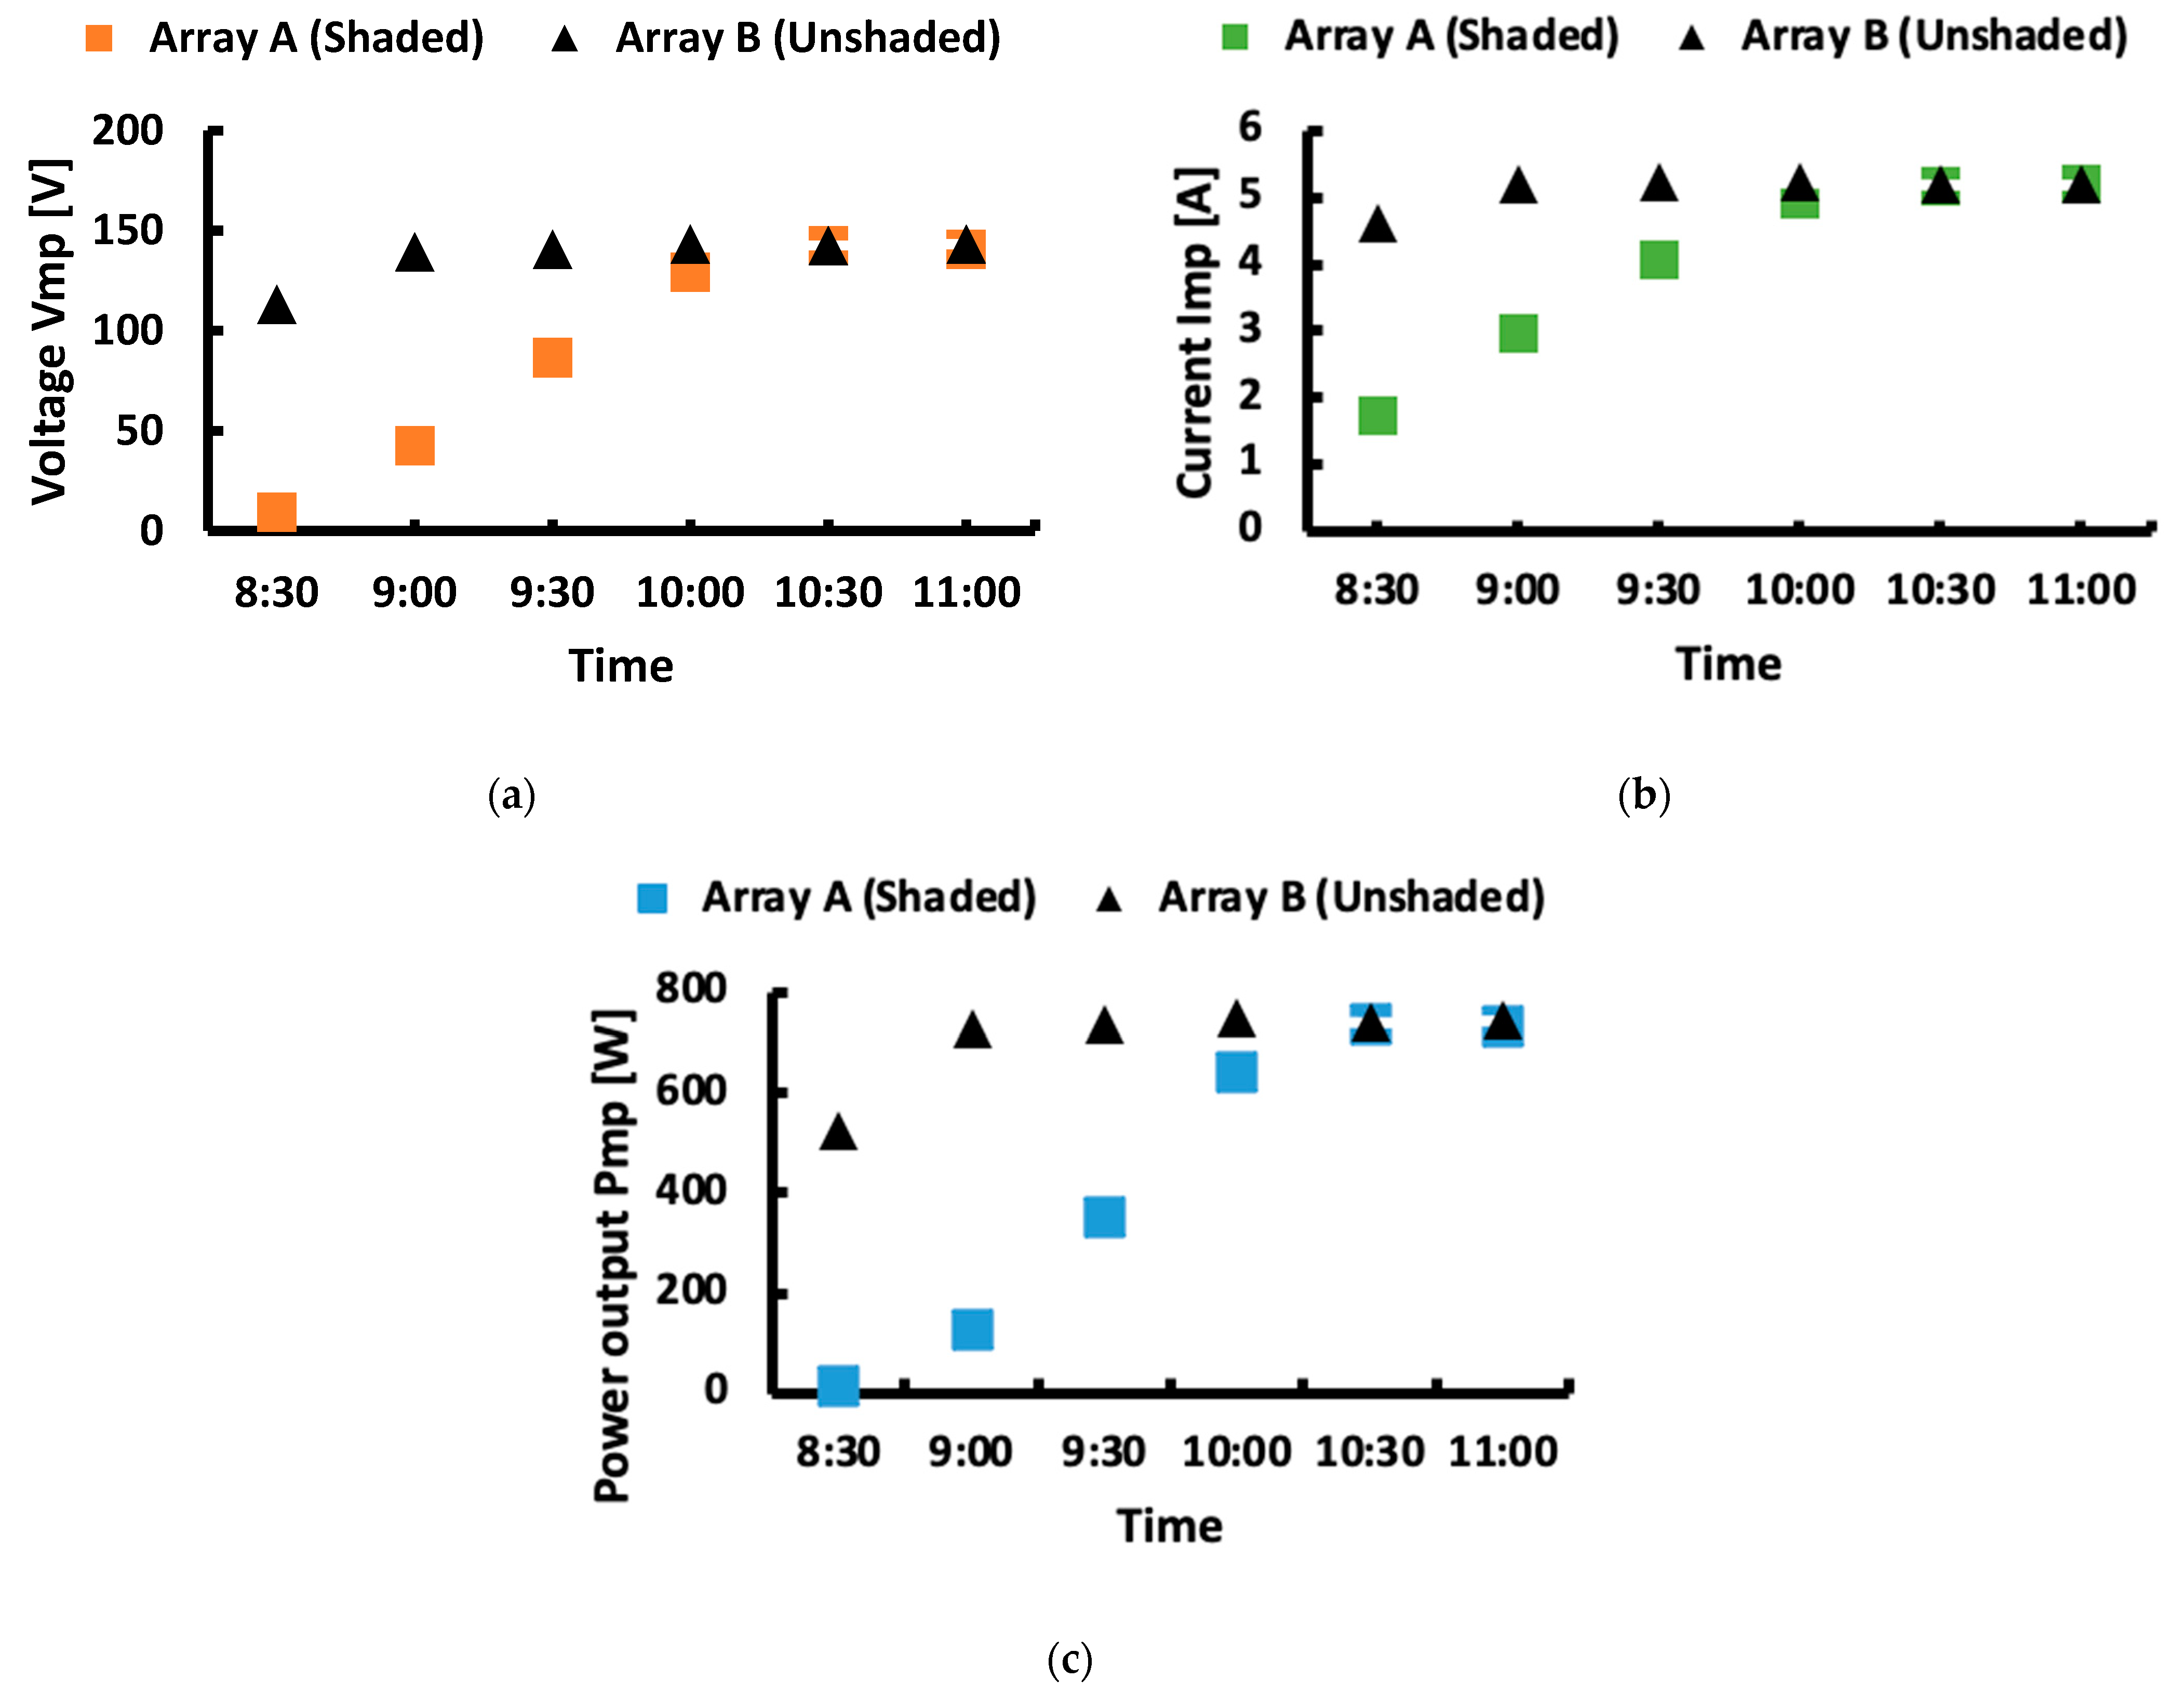
- Depending on the sun’s direction relative to the PV module installation, and due to the metallic frame close to the PV array, different PSCs with different percentages were recorded at 30-min intervals from 8:30–11:00 a.m. The power output loss due to the shading effect was evaluated and compared with the PV array at the same time and under the same conditions.
- The current and voltage values of the PV array were obtained. The performance evaluation of the PV array configurations is referred to with respect to the values of maximum power voltage, maximum power current, maximum power output, power output losses, and fill factor (FF).
2. Experimental Setup
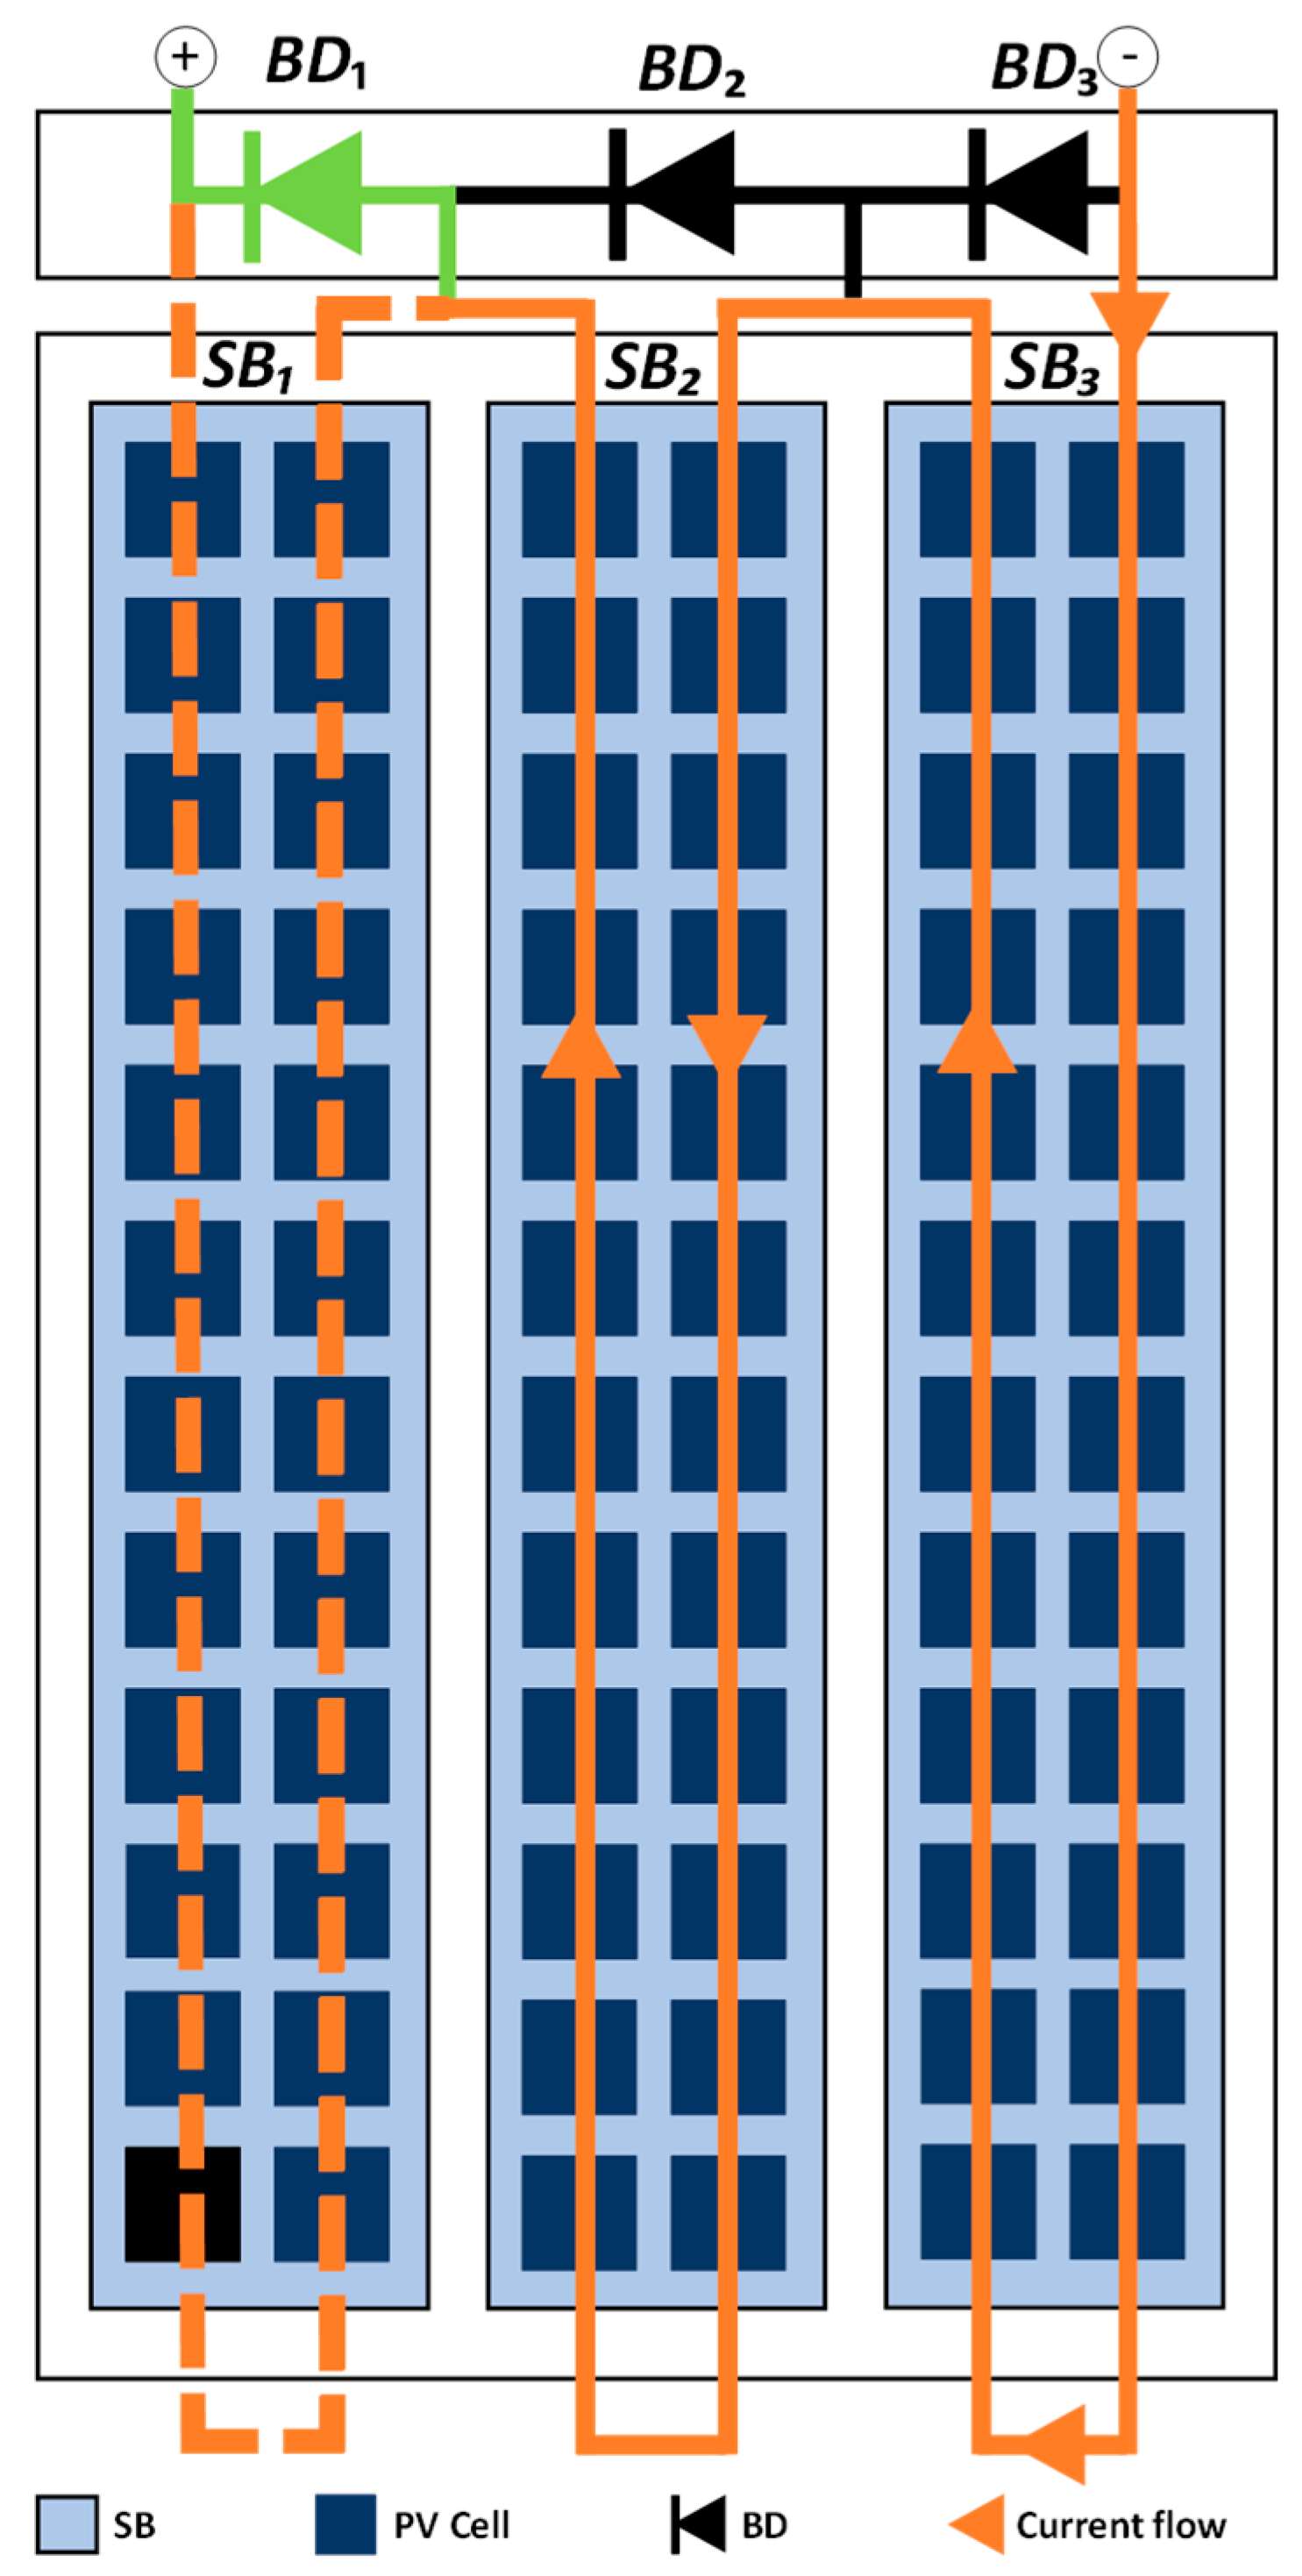
2.1. The PV Module Configuration and I-V Characteristics
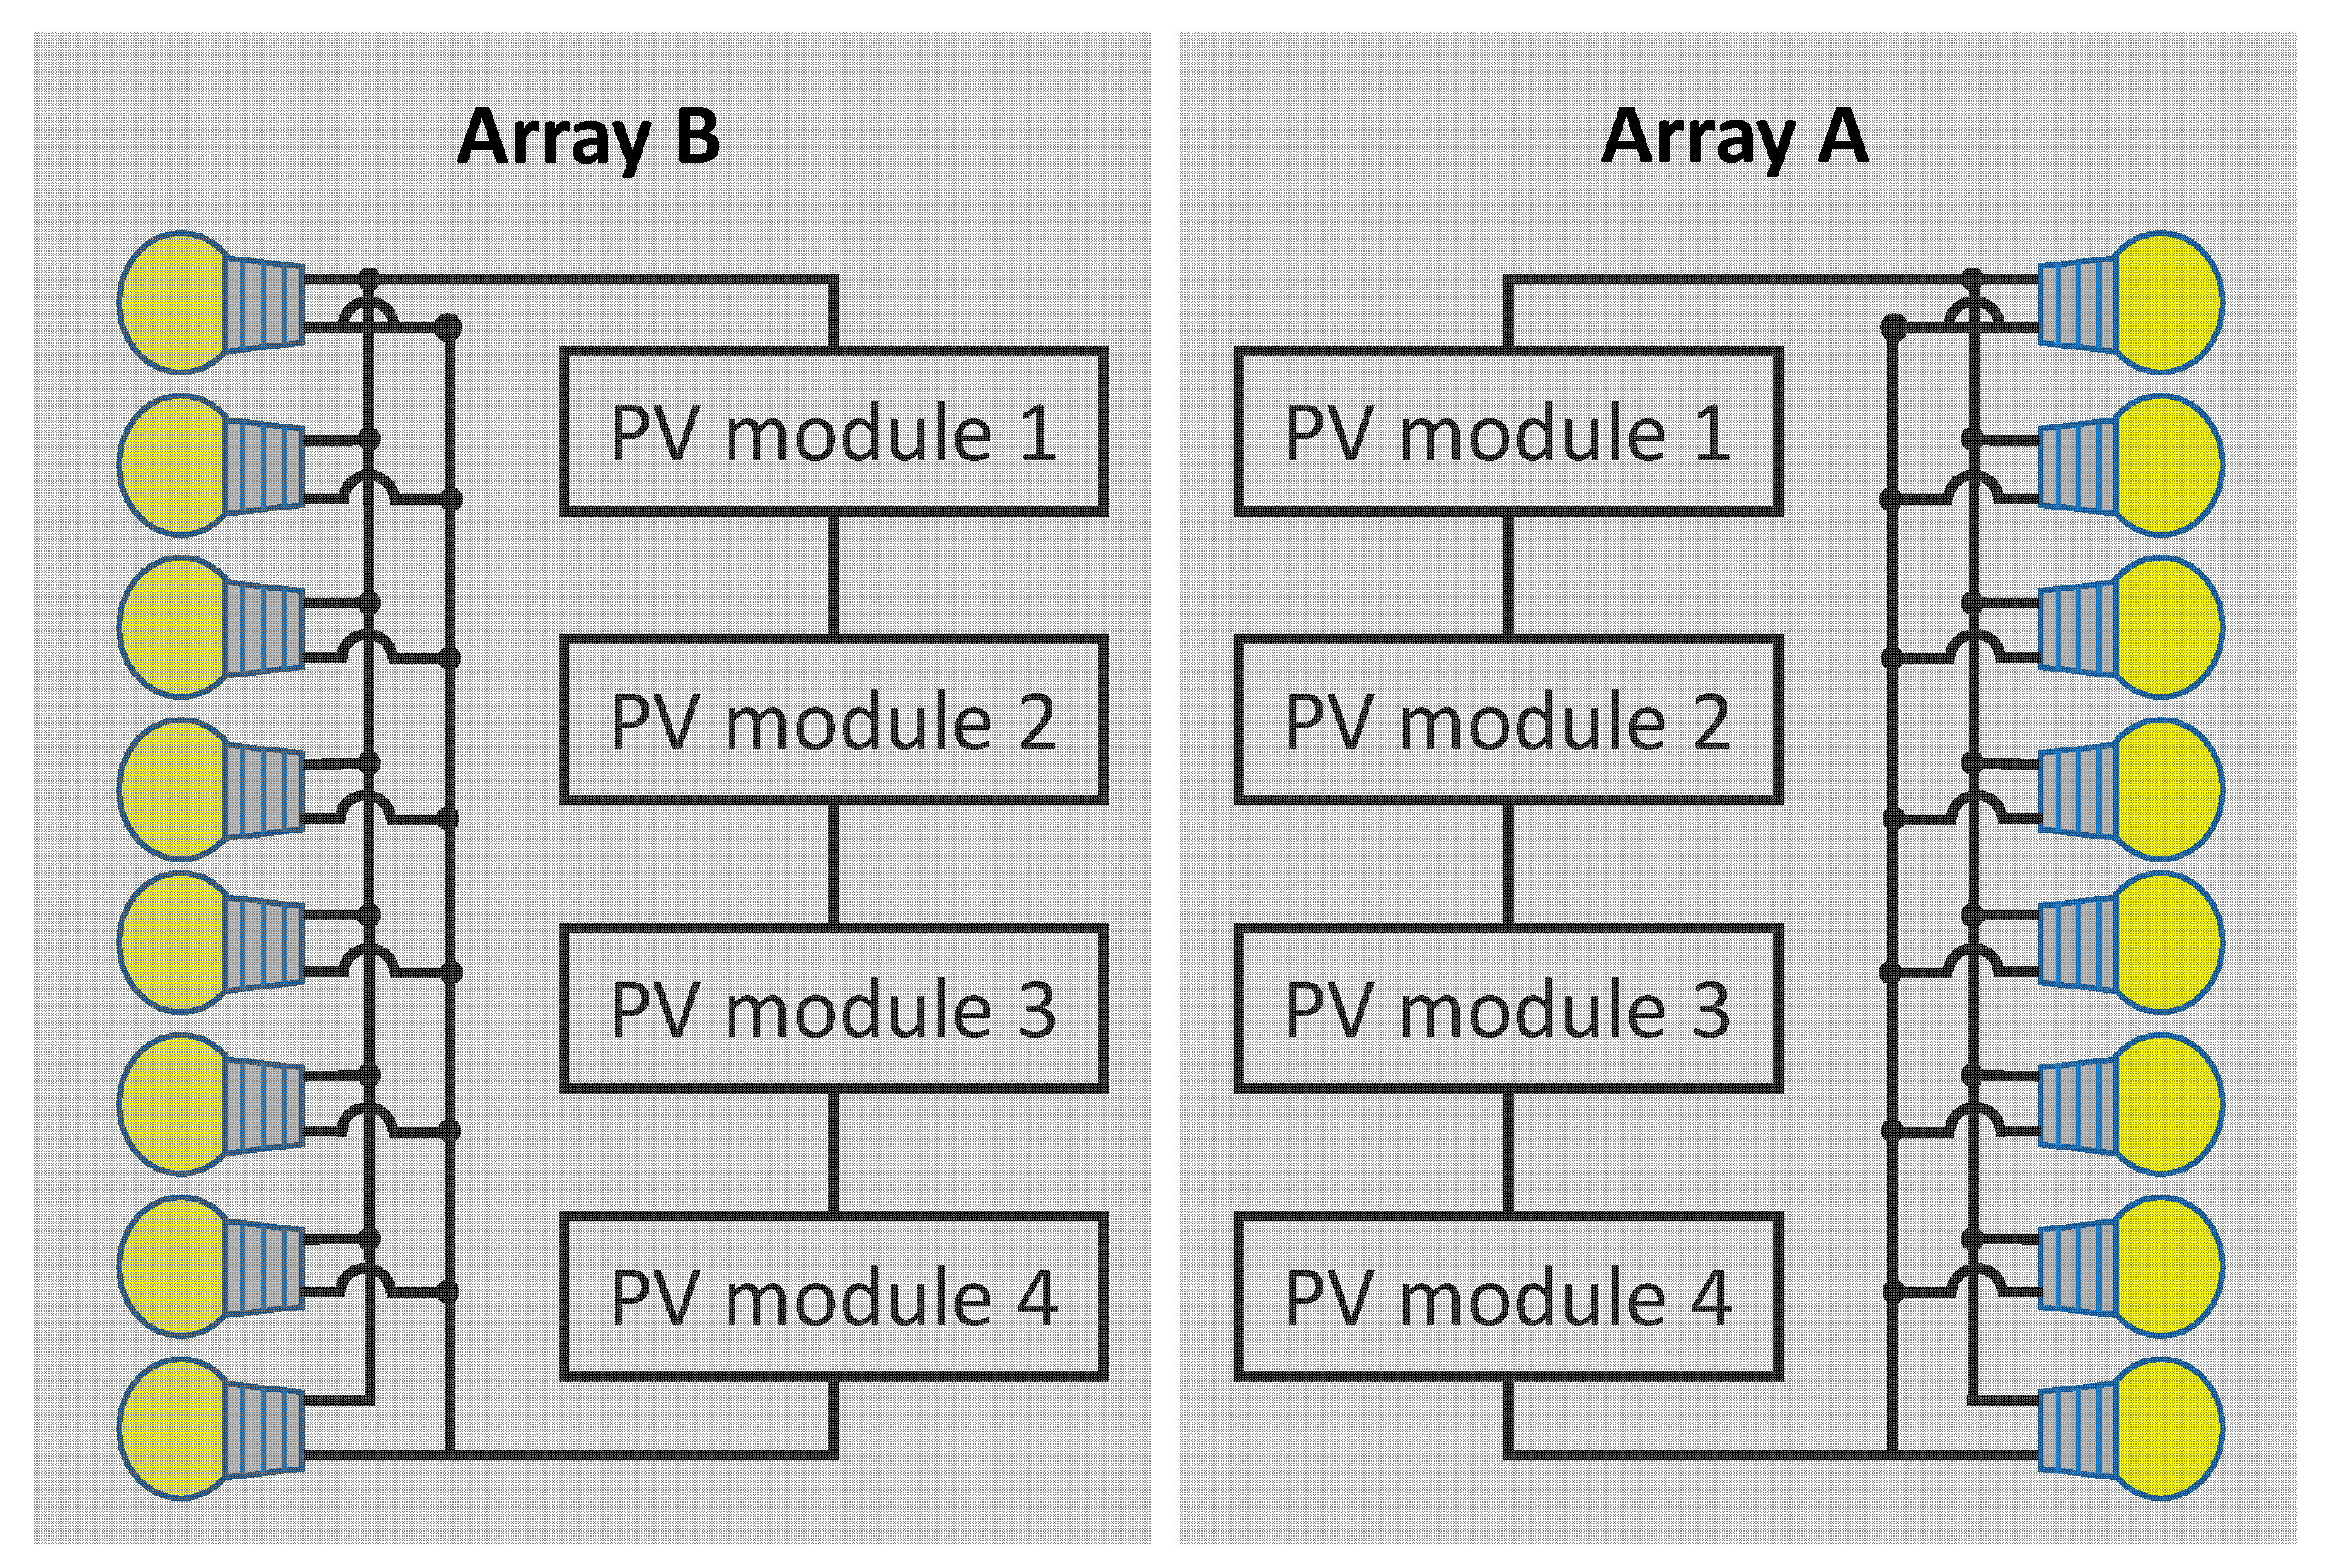
2.2. The PV Array Configuration and Load Profile
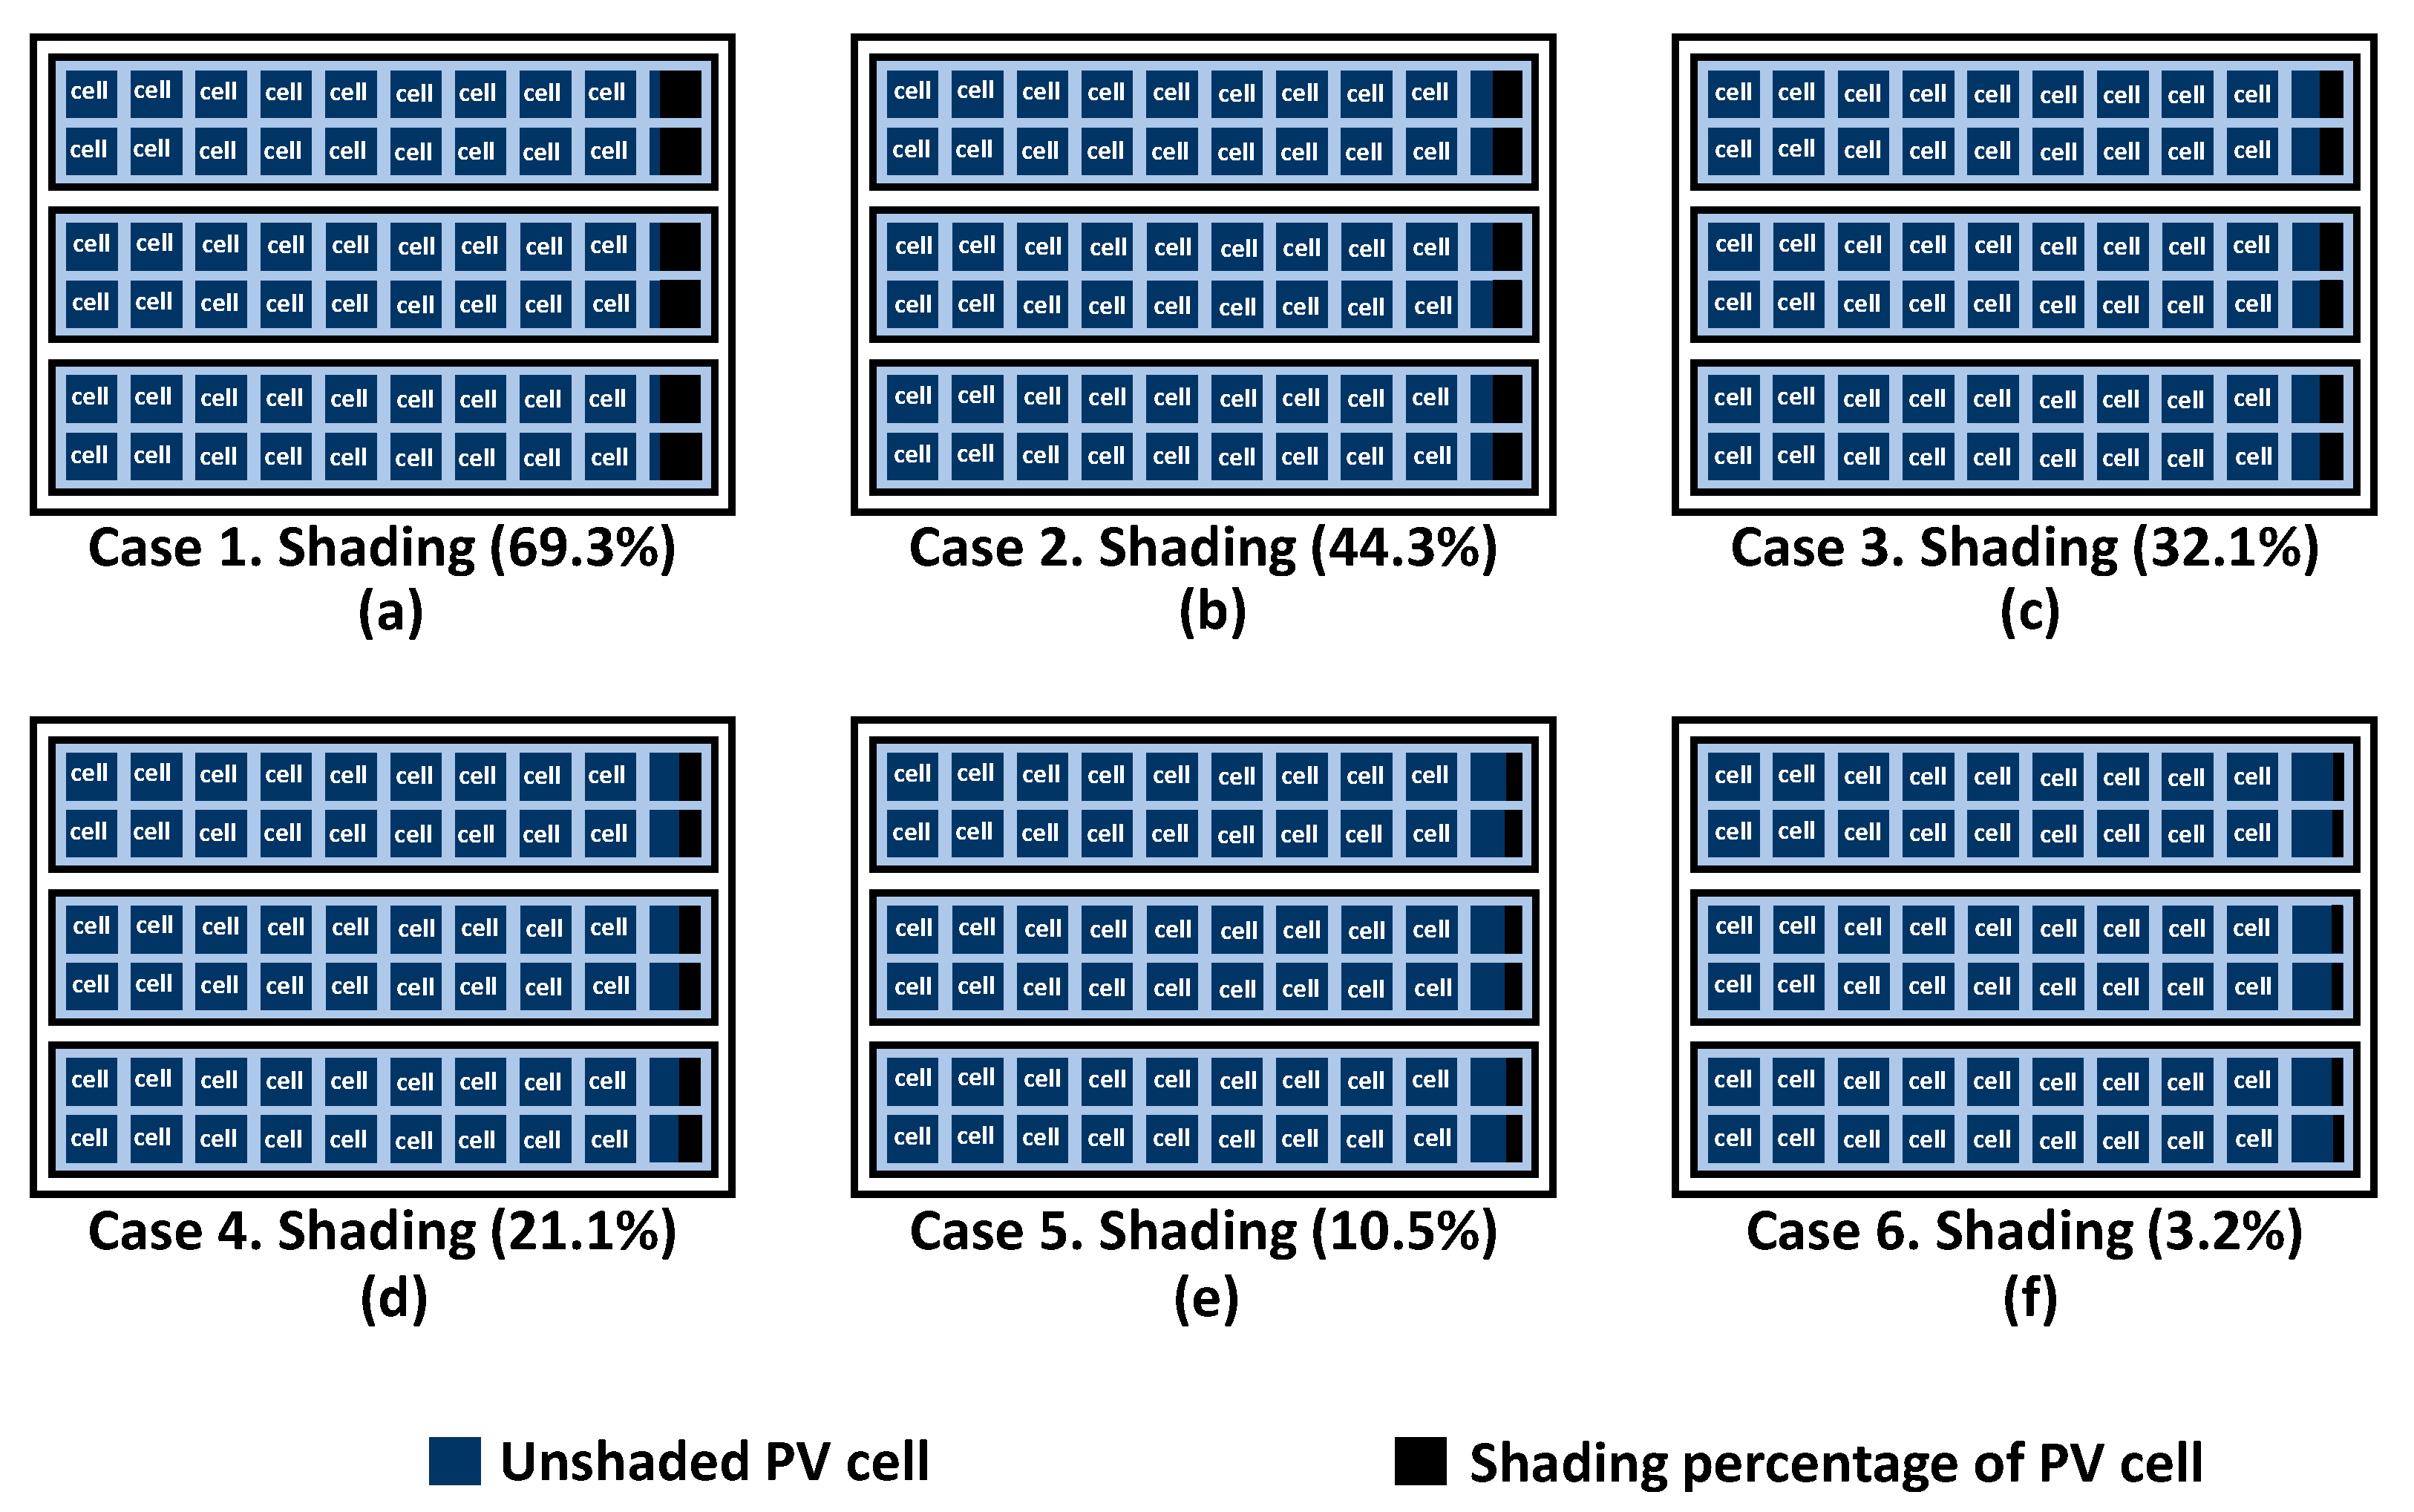
2.3. Partial Shading Conditions (PSCs)
2.4. Uncertainty Analysis
3. Experimental Results of PSCs
3.1. The Effect of PSCs on PV Array Configuration
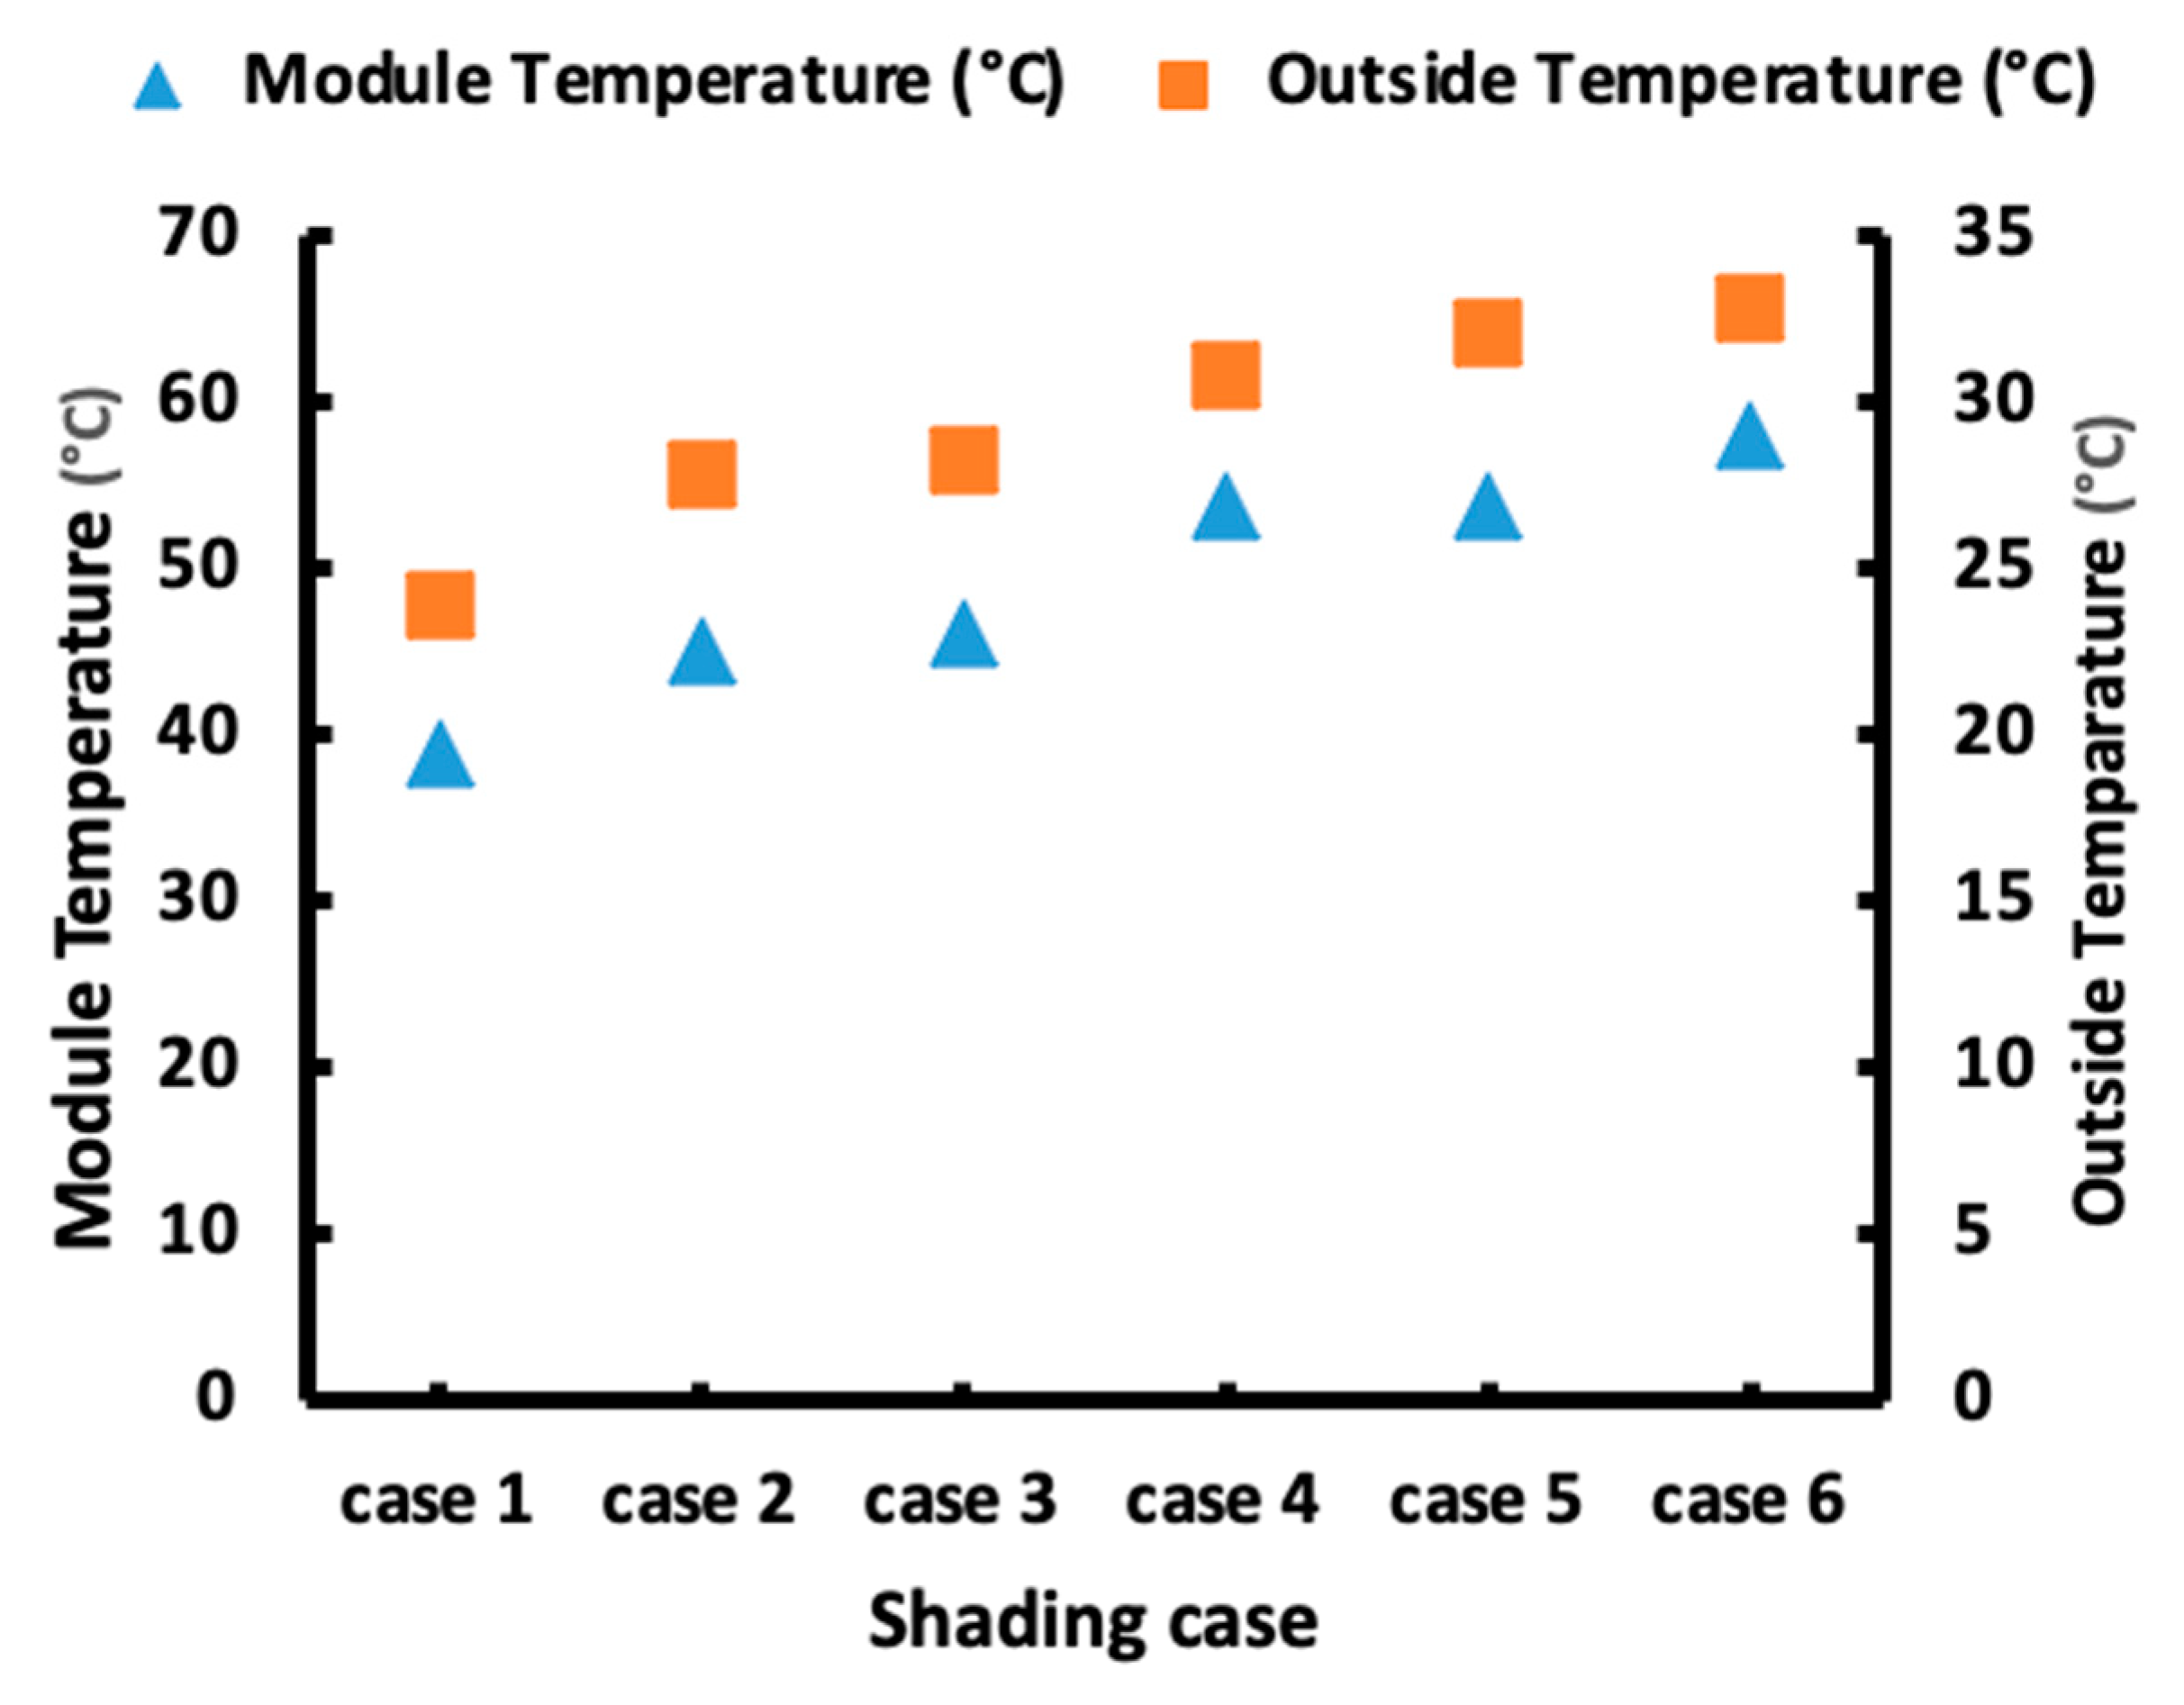
3.2. The Effect of PSCs on PV Module Temperature
4. Discussion
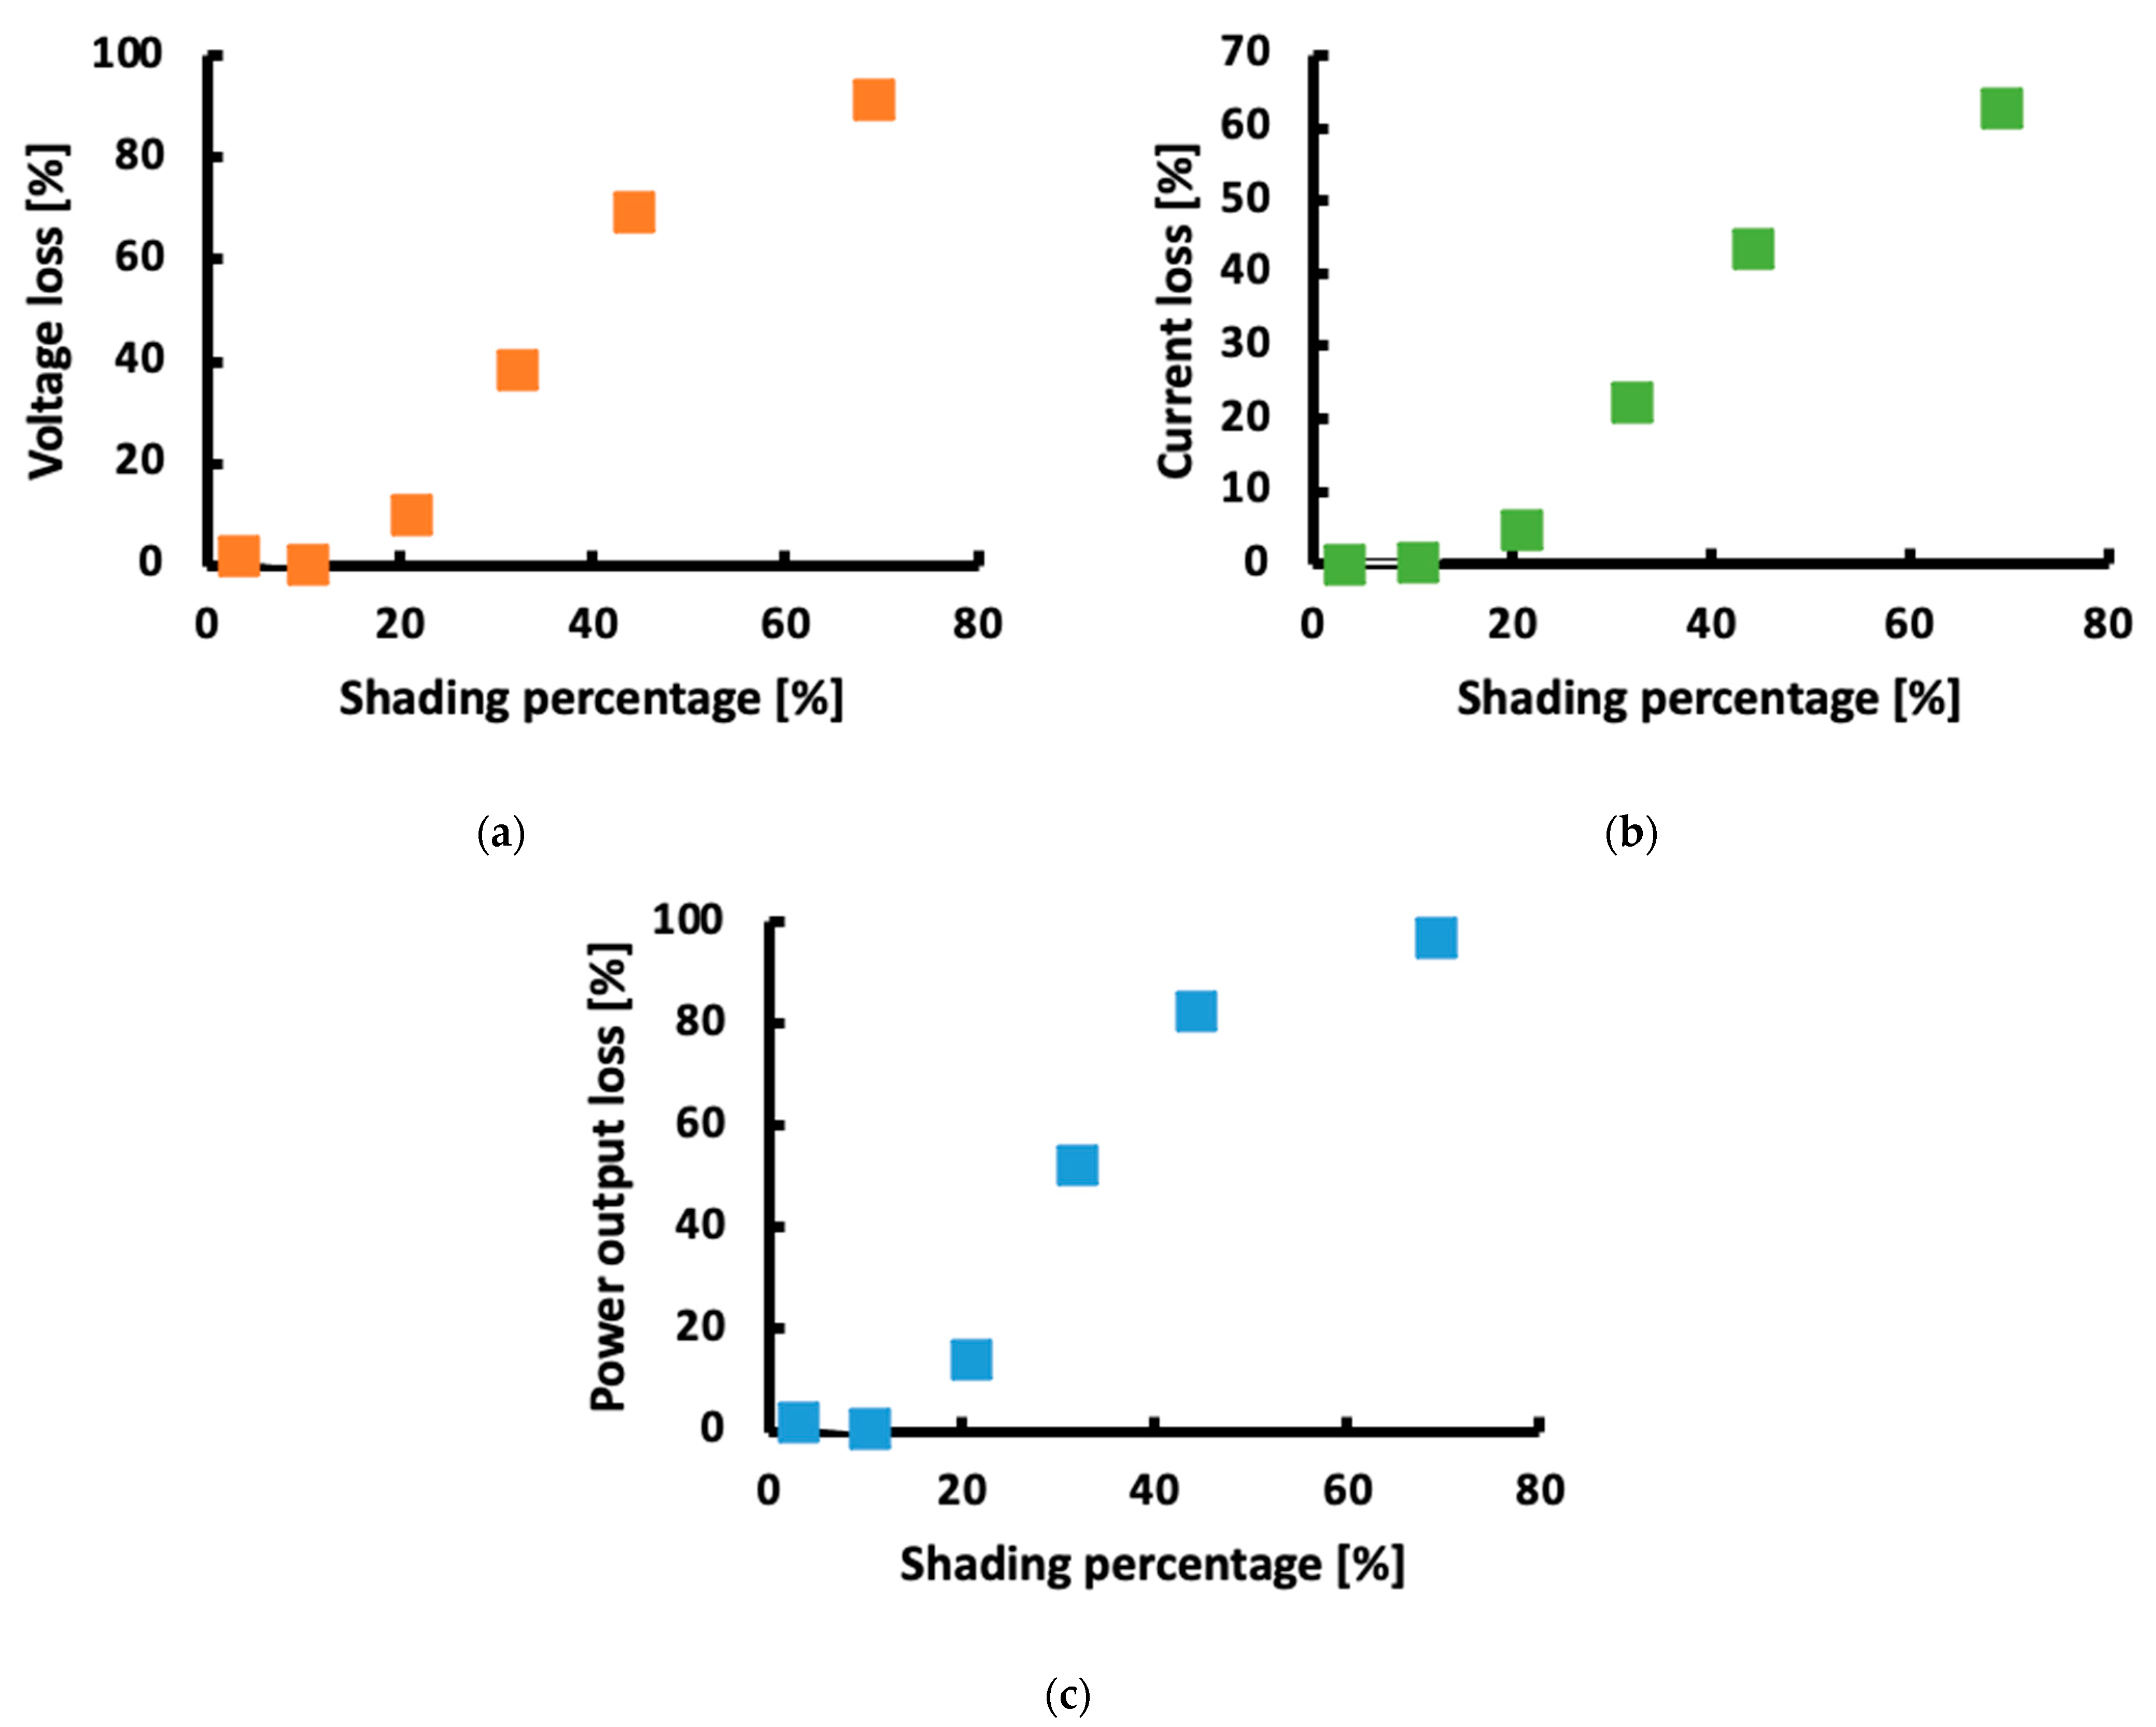
4.1. Power Output Loss
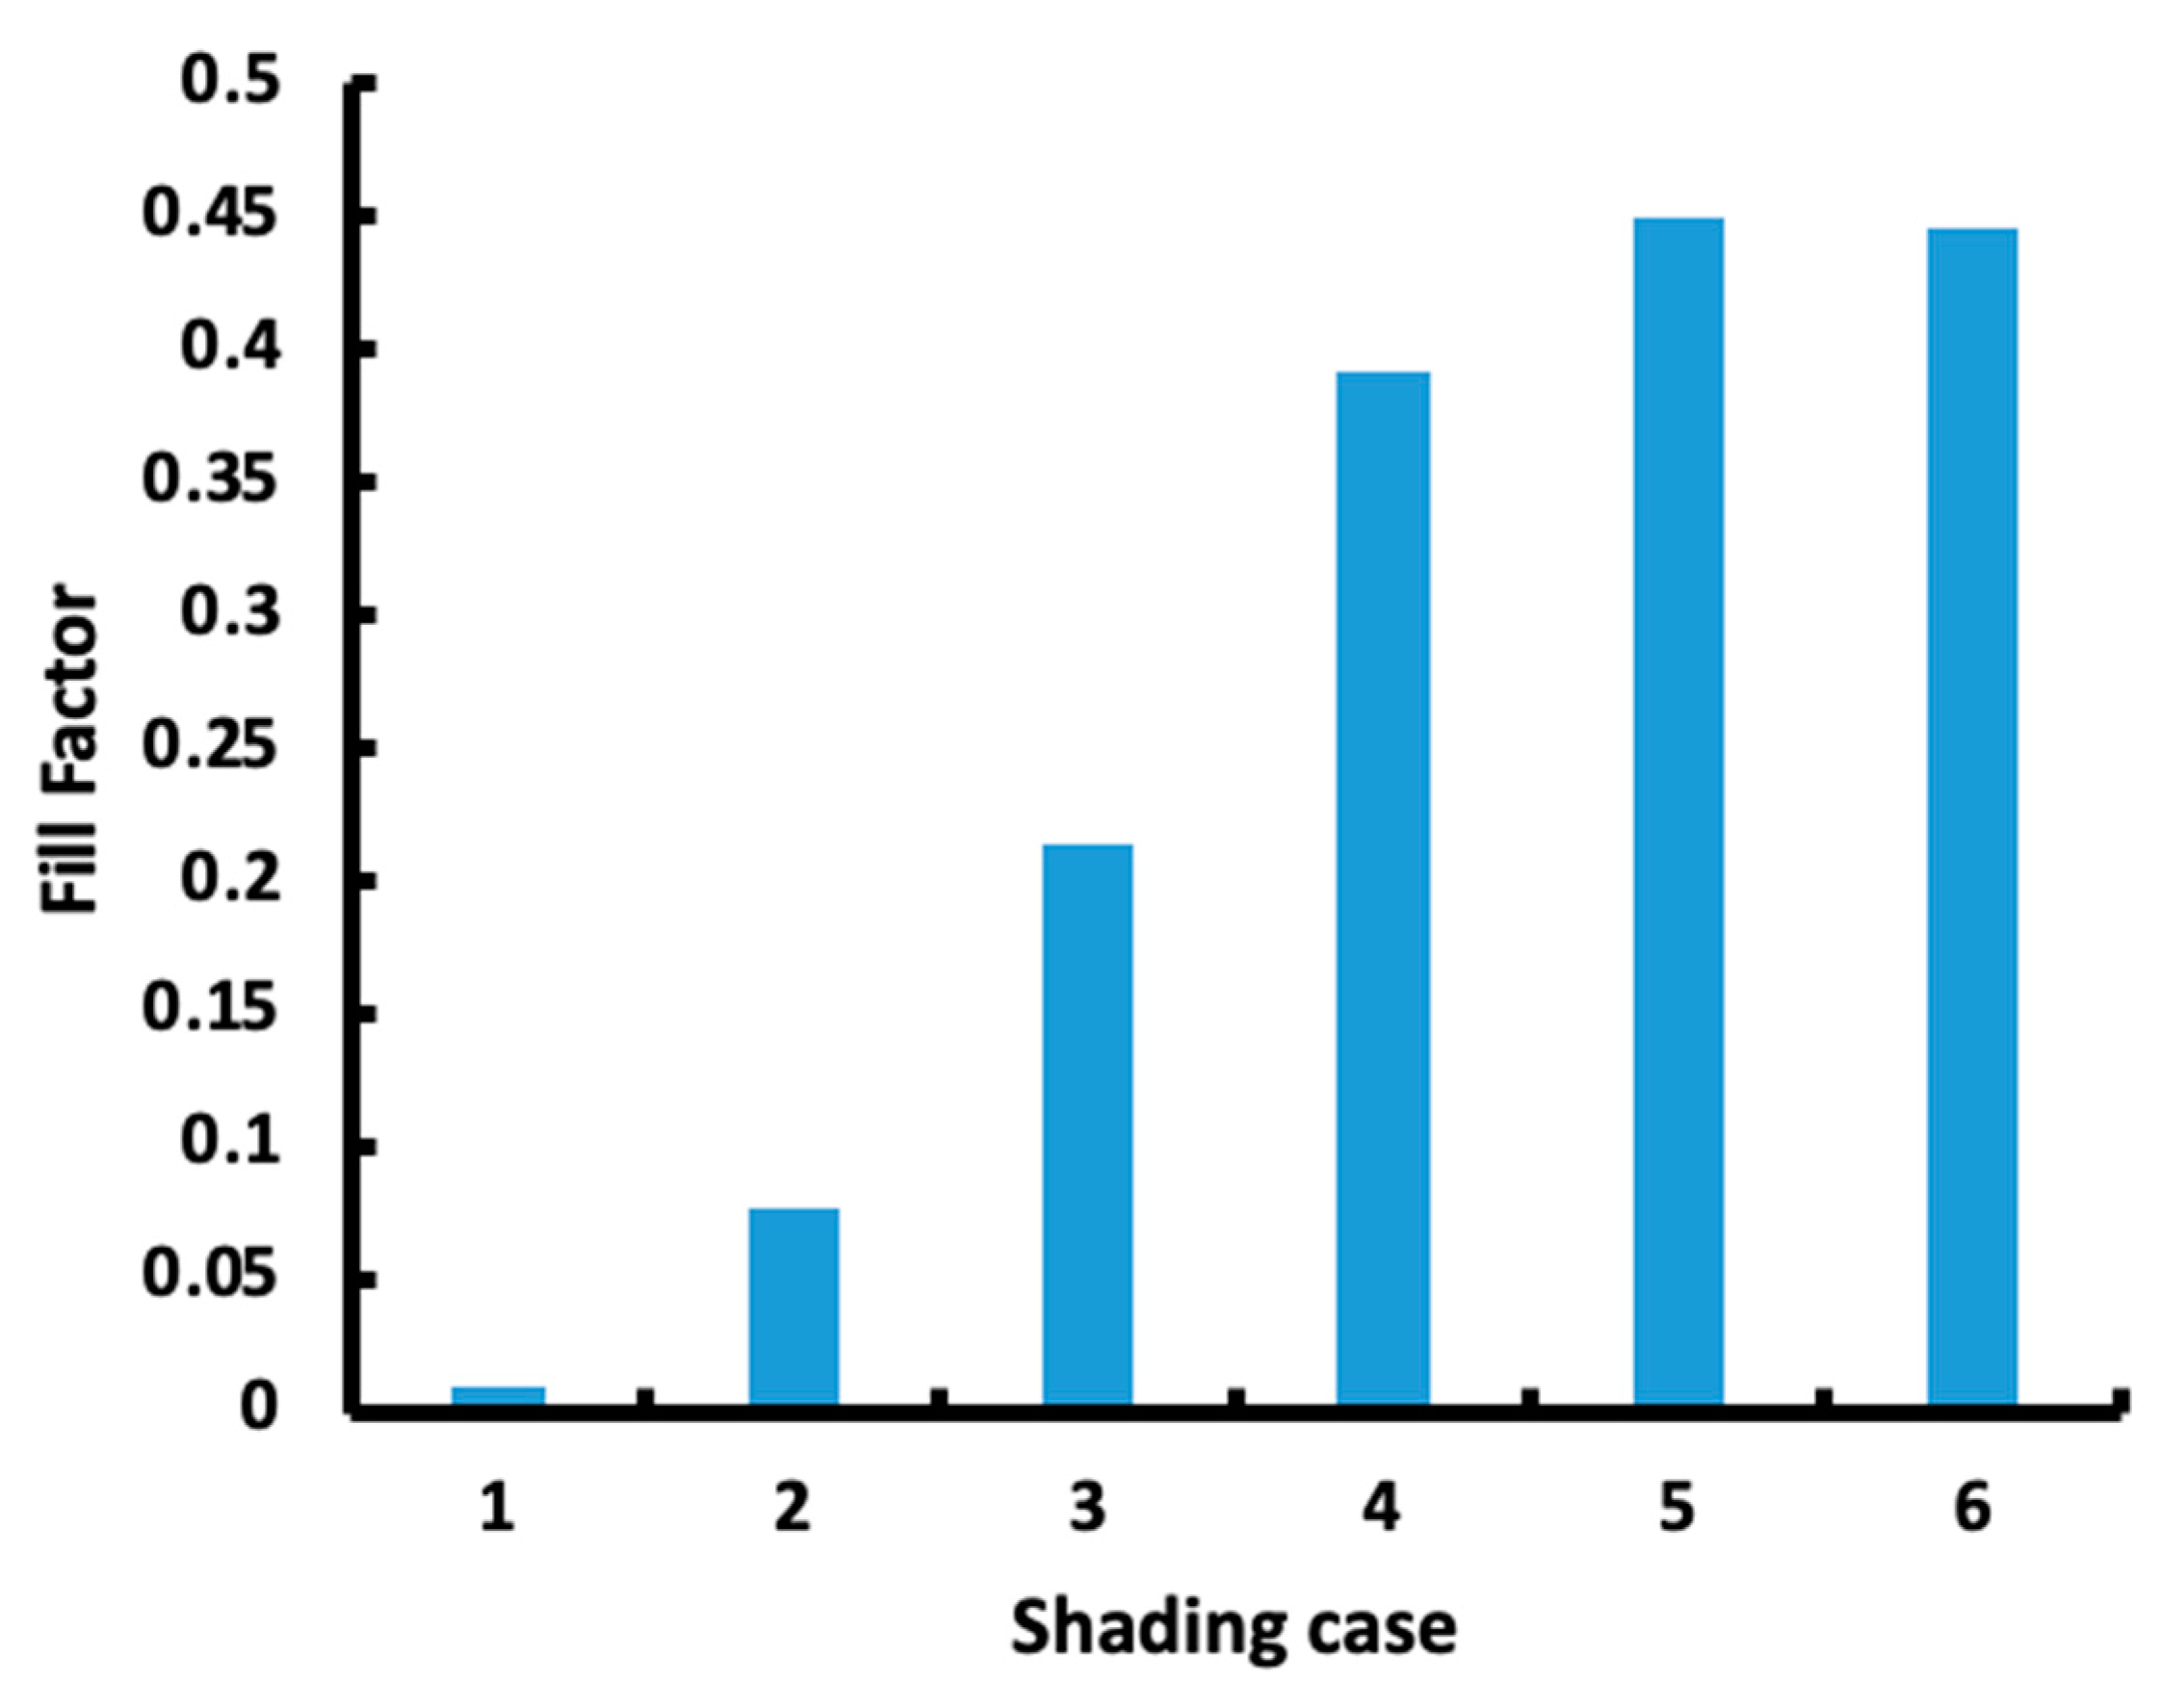
4.2. Fill Factor
5. Conclusions and Future Work
Author Contributions
Funding
Institutional Review Board Statement
Informed Consent Statement
Data Availability Statement
Acknowledgments
Conflicts of Interest
References
- Sumathi, S.; Ashok Kumar, L.; Surekha, P. Solar PV and Wind Energy Conversion Systems; Green Energy and Technology; Springer International Publishing: Cham, Switzerland, 2015; ISBN 978-3-319-14940-0. [Google Scholar]
- Nigeria, C. Effect of Shading on Photovoltaic Cell. IOSR J. Electr. Electron. Eng. 2013, 8, 01–06. [Google Scholar] [CrossRef]
- Pendem, S.R.; Mikkili, S. Performance Evaluation of Series, Series-Parallel and Honey-Comb PV Array Configurations under Partial Shading Conditions. In Proceedings of the 2017 7th International Conference on Power Systems (ICPS), Pune, India, 21–23 December 2017; pp. 749–754. [Google Scholar]
- Murtaza, A.; Chiaberge, M.; Spertino, F.; Boero, D.; De Giuseppe, M. A Maximum Power Point Tracking Technique Based on Bypass Diode Mechanism for PV Arrays under Partial Shading. Energy Build. 2014, 73, 13–25. [Google Scholar] [CrossRef]
- Trzmiel, G.; Głuchy, D.; Kurz, D. The Impact of Shading on the Exploitation of Photovoltaic Installations. Renew. Energy 2020, 153, 480–498. [Google Scholar] [CrossRef]
- Pandiarajan, N.; Muthu, R. Mathematical Modeling of Photovoltaic Module with Simulink. In Proceedings of the 2011 1st International Conference on Electrical Energy Systems, Chennai, India, 3–5 January 2011; pp. 258–263. [Google Scholar]
- Yin, O.W.; Babu, B.C. Simple and easy approach for mathematical analysis of photovoltaic (PV) module under normal and partial shading conditions. Optik 2018, 169, 48–61. [Google Scholar] [CrossRef]
- Patel, H.; Agarwal, V. MATLAB-Based Modeling to Study the Effects of Partial Shading on PV Array Characteristics. IEEE Trans. Energy Convers. 2008, 23, 302–310. [Google Scholar] [CrossRef]
- Hong, L.T.; Ahmed, J.; Nabipour-Afrouzi, H.; Kashem, S. Designing a PSCAD Based PV Simulator for Partial Shading to Validate Future PV Application Planning. In Proceedings of the 2018 IEEE PES Asia-Pacific Power and Energy Engineering Conference (APPEEC), Kota Kinabalu, Malaysia, 7–10 October 2018; pp. 526–531. [Google Scholar]
- Gallardo-Saavedra, S.; Karlsson, B. Simulation, Validation and Analysis of Shading Effects on a PV System. Sol. Energy 2018, 170, 828–839. [Google Scholar] [CrossRef]
- Mamun, M.A.A.; Hasanuzzaman, M.; Selvaraj, J. Experimental Investigation of the Effect of Partial Shading on Photovoltaic Performance. IET Renew. Power Gener. 2017, 11, 912–921. [Google Scholar] [CrossRef]
- Hanifi, H.; Dassler, D.; Turek, M.; Schneider, J. Evaluation and Comparison of PV Modules With Different Designs of Partial Cells in Desert and Moderate Climates. IEEE J. Photovolt. 2018, 8, 1266–1273. [Google Scholar] [CrossRef]
- Tatabhatla, V.M.R.; Agarwal, A.; Kanumuri, T. Performance Enhancement by Shade Dispersion of Solar Photo-Voltaic Array under Continuous Dynamic Partial Shading Conditions. J. Clean. Prod. 2019, 213, 462–479. [Google Scholar] [CrossRef]
- Guo, S.; Walsh, T.M.; Aberle, A.G.; Peters, M. Analysing Partial Shading of PV Modules by Circuit Modelling. In Proceedings of the 2012 38th IEEE Photovoltaic Specialists Conference, Austin, TX, USA, 3–8 June 2012; pp. 002957–002960. [Google Scholar]
- Dolara, A.; Lazaroiu, G.C.; Leva, S.; Manzolini, G. Experimental Investigation of Partial Shading Scenarios on PV (Photovoltaic) Modules. Energy 2013, 55, 466–475. [Google Scholar] [CrossRef]
- Rabanal-Arabach, J.; Schneider, A.; Mrcarica, M.; Kopececk, R.; Heckmann, M. The need of frameless mounting structures for vertical mounting of bifacial pv modules. Available online: https://www.eupvsec-proceedings.com/proceedings?paper=38928 and https://www.researchgate.net/publication/306018161_The_Need_of_Frameless_Mounting_Structures_for_Vertical_Mounting_of_Bifacial_PV_Modules/citations (accessed on 11 March 2021).
- Zhu, Q.; Zhu, C.; Liu, S.; Shen, C.; Zhao, W.; Chen, Z.; Chen, L.; Wang, J.; Wang, L.; Zhang, S.; et al. A Model to Evaluate the Effect of Shading Objects on the Energy Yield Gain of Bifacial Modules. Sol. Energy 2019, 179, 24–29. [Google Scholar] [CrossRef]
- Müller, B.; Hardt, L.; Armbruster, A.; Kiefer, K.; Reise, C. Yield Predictions for Photovoltaic Power Plants: Empirical Validation, Recent Advances and Remaining Uncertainties: Yield Predictions for Photovoltaic Power Plants. Prog. Photovolt. Res. Appl. 2016, 24, 570–583. [Google Scholar] [CrossRef]
- Joseph, A.; Kamala, J. PV Array Characteristics Analysis under Partial Shading & Modeling of P&O MPPT Applied Boost Convertor Using Matlab/Simulink. In Proceedings of the 2013 International Conference on Energy Efficient Technologies for Sustainability, Nagercoil, India, 10–12 April 2013; pp. 596–601. [Google Scholar]
- El-Adawi, M.K.; Al-Nuaim, I.A. The Temperature Functional Dependence of VOC for a Solar Cell in Relation to Its Efficiency New Approach. Desalination 2007, 209, 91–96. [Google Scholar] [CrossRef]
- Pradhan, R.; Kar, S. A Comprehensive Study of Partial Shading Effect on the Performance of PV Array with Different Configuration. In Proceedings of the 2020 International Conference on Renewable Energy Integration into Smart Grids: A Multidisciplinary Approach to Technology Modelling and Simulation (ICREISG), Bhubaneswar, India, 14–15 February 2020; pp. 78–83. [Google Scholar]
- Bingöl, O.; Özkaya, B. Analysis and Comparison of Different PV Array Configurations under Partial Shading Conditions. Sol. Energy 2018, 160, 336–343. [Google Scholar] [CrossRef]
- Saiprakash, C.; Mohapatra, A.; Nayak, B.; Ghatak, S.R. Performance Enhancement of PV Array under Partial Shading Condition by Modified BL Configuration. In Proceedings of the 2020 IEEE Calcutta Conference (CALCON), Kolkata, India, 28–29 February 2020; pp. 308–312. [Google Scholar]
- POWER Data Access Viewer. Available online: https://power.larc.nasa.gov/data-access-viewer/ (accessed on 8 March 2021).
- Japan Meteorological Agency. Available online: https://www.jma.go.jp/jma/indexe.html (accessed on 11 March 2021).
- Radwan, A.; Ookawara, S.; Mori, S.; Ahmed, M. Uniform Cooling for Concentrator Photovoltaic Cells and Electronic Chips by Forced Convective Boiling in 3D-Printed Monolithic Double-Layer Microchannel Heat Sink. Energy Convers. Manag. 2018, 166, 356–371. [Google Scholar] [CrossRef]


| Item | Info |
|---|---|
| Manufacturer | Jinko Solar |
| Model no. | JKM310P |
| No. of cells | 72 (6 × 12) |
| Cell material | Poly-crystalline |
| Cell dimension | 156 × 156 mm |
| Open circuit voltage (Voc) | 45.9 V |
| Short circuit current (Isc) | 8.96 A |
| Maximum power current (Imp) | 8.38 A |
| Maximum power voltage (Vmp) | 37.0 V |
| Maximum power (Pmax) | 310 W |
| Time | Outside Temp (°C) | Humidity (%) | Module Temp (°C) |
|---|---|---|---|
| 8:30 | 23.9 | 50 | 38.8 |
| 9:00 | 27.9 | 43 | 45.1 |
| 9:30 | 28.3 | 31 | 46.2 |
| 10:00 | 30.8 | 30 | 53.7 |
| 10:30 | 32.1 | 33 | 53.7 |
| 11:00 | 32.9 | 31 | 58.1 |
| Parameters | Accuracy |
|---|---|
| Current, (A) | ±1.3% |
| Voltage, (V) | ±0.7% |
| Humidity | ±2.5% |
| PV module temperature, (°C) | ±1 |
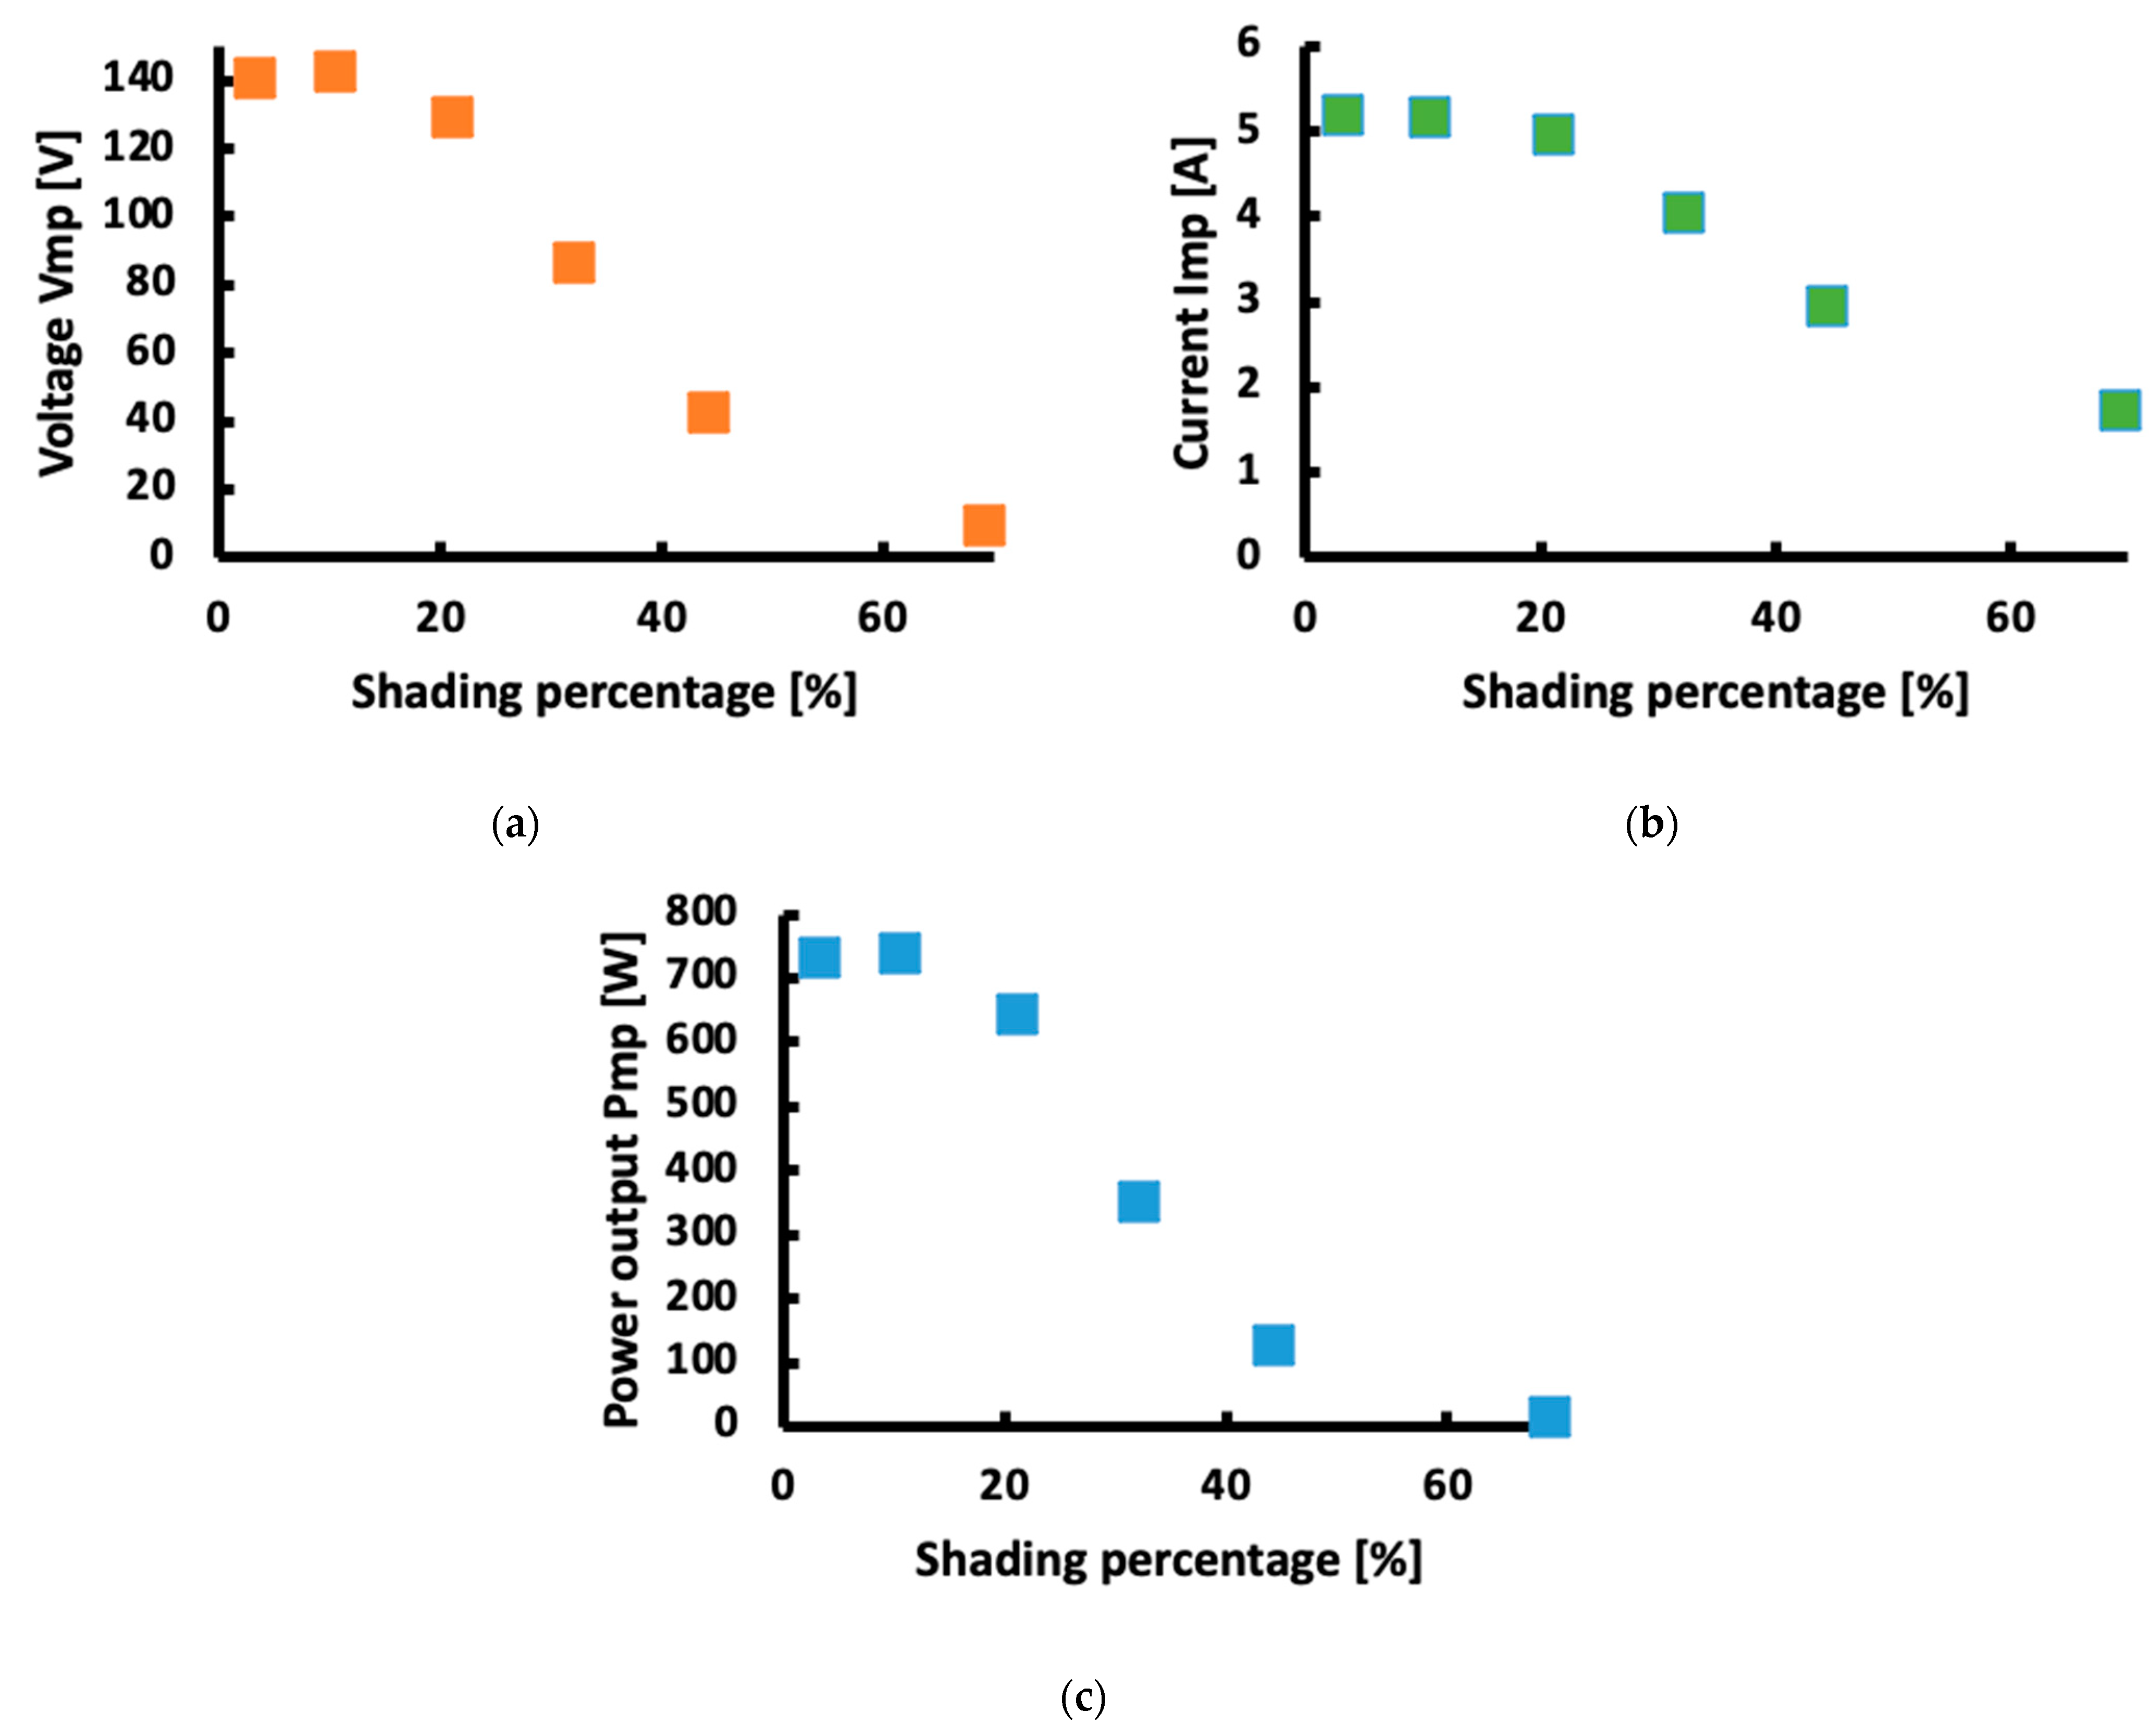
| Case | Time | Array A with Shading (4 PV Modules) | Array B without Shading (4 PV Modules) | |||||
|---|---|---|---|---|---|---|---|---|
| Shading Percentage [%] | Vmp [V] | Imp [A] | Pmp [W] | Vmp [V] | Imp [A] | Pmp [W] | ||
| Case 1 | 8:30 | 69.3 | 9.51 | 1.72 | 16.36 | 113.3 | 4.63 | 524.5 |
| Case 2 | 9:00 | 44.3 | 42.6 | 2.95 | 129.2 | 139.5 | 5.21 | 726.8 |
| Case 3 | 9:30 | 32.1 | 86.7 | 4.06 | 352.0 | 140.8 | 5.23 | 736.3 |
| Case 4 | 10:00 | 21.1 | 129.3 | 4.98 | 643.9 | 143.4 | 5.23 | 749.9 |
| Case 5 | 10:30 | 10.5 | 142.5 | 5.18 | 738.1 | 142.6 | 5.19 | 740.0 |
| Case 6 | 11:00 | 3.2 | 140.9 | 5.20 | 732.6 | 143.4 | 5.20 | 745.8 |
| Case | Time | Shading Percentage [%] | Loss of Array A to Array B [%] | Pmp | |
|---|---|---|---|---|---|
| Vmp | Imp | ||||
| Case 1 | 8:30 | 69.3 | 91.6 | 62.8 | 96.8 |
| Case 2 | 9:00 | 44.3 | 69.3 | 43.3 | 82.6 |
| Case 3 | 9:30 | 32.1 | 38.4 | 22.3 | 52.2 |
| Case 4 | 10:00 | 21.1 | 9.83 | 4.78 | 14.1 |
| Case 5 | 10:30 | 10.5 | 0.07 | 0.19 | 0.26 |
| Case 6 | 11:00 | 3.2 | 1.74 | 0.00 | 1.70 |
| Case 1 | Case 2 | Case 3 | Case 4 | Case 5 | Case 6 | |
|---|---|---|---|---|---|---|
| Fill factor | 0.009 | 0.07 | 0.21 | 0.39 | 0.44 | 0.44 |
Publisher’s Note: MDPI stays neutral with regard to jurisdictional claims in published maps and institutional affiliations. |
© 2021 by the authors. Licensee MDPI, Basel, Switzerland. This article is an open access article distributed under the terms and conditions of the Creative Commons Attribution (CC BY) license (https://creativecommons.org/licenses/by/4.0/).
Share and Cite
Abdullah, G.; Nishimura, H.; Fujita, T. An Experimental Investigation on Photovoltaic Array Power Output Affected by the Different Partial Shading Conditions. Energies 2021, 14, 2344. https://doi.org/10.3390/en14092344
Abdullah G, Nishimura H, Fujita T. An Experimental Investigation on Photovoltaic Array Power Output Affected by the Different Partial Shading Conditions. Energies. 2021; 14(9):2344. https://doi.org/10.3390/en14092344
Chicago/Turabian StyleAbdullah, Ghoname, Hidekazu Nishimura, and Toshio Fujita. 2021. "An Experimental Investigation on Photovoltaic Array Power Output Affected by the Different Partial Shading Conditions" Energies 14, no. 9: 2344. https://doi.org/10.3390/en14092344
APA StyleAbdullah, G., Nishimura, H., & Fujita, T. (2021). An Experimental Investigation on Photovoltaic Array Power Output Affected by the Different Partial Shading Conditions. Energies, 14(9), 2344. https://doi.org/10.3390/en14092344