1. Introduction
In recent years, the effects of energy production on the environment are increasingly being questioned, thus entering more and more into the forefront of the sustainable development agenda. The United Nations, along with other important international actors, has called on national governments to significantly increase their renewable energy sources (RES) quotas, but the main difficulty is to encourage resource-rich countries to switch to greener technologies and to support more disadvantaged countries.
For the European Union, but not only, the subject of climate change, environmental degradation, renewable energy, is extremely sensitive, a priority and present in long-term growth and development strategies. In fact, the paradigm of change in the context of the sustainable development of regional, national and local economies, in this case and within the EU, is a real challenge, not to be neglected and underestimated.
The answer to these challenges lies exclusively in the way medium/long-term strategies are implemented, in direct correlation with the Sustainable Development Goals (SDGs), with the requirements set by the 2030 Agenda [
1]. In fact, energy in the context of climate change is at the heart of both the 2030 Agenda for Sustainable Development and the Paris Agreement [
2]. To the same end, SDG 7 complements a set of targets and impact indicators, with direct reference to the implementation of innovative solutions, investments and partnerships at all levels directly involved in the supply of RES [
3].
Thus, SDG 7–Ensure access to affordable, reliable, sustainable and modern energy for all, together with the other SDGs (17 in total), aims to increase people’s well-being, economic development and poverty reduction, pointing out that, energy, especially renewable energy, is a major priority pillar for all states and governments in the world [
1,
4].
Undoubtedly, the priority targets for development place a strong emphasis on increasing the global percentage of RES, to which is added increasing energy efficiency, increasing investment in research, technology, clean energy, etc., the ultimate goal being to increase the share of RES in the global energy mix [
5,
6,
7,
8,
9].
On the other hand, in the past, RES were not competitive enough to provide a real incentive for investors and companies to divert their financial and technological efforts to support accelerated development, so the market was a reflection on the policy framing. The situation changed in recent years, solar photovoltaic power generation and wind turbines have become more and more technologically advanced, which places them at the limit of profitability, sometimes even becoming advantageously profitable in terms of subsidies provided by national governments. Through the financial support and more targeted governmental policies for EU countries, the preoccupation of all stakeholders will be directed with priority towards the improvement of the technical and economic performances of RES but within the limitations of SDG assumed targets [
10,
11].
These are the reasons that prompted us to investigate the relationship between sustainable development and RES progress, as a foundation for future assessments of RED II targets and SDGs achievement. Using the hierarchical analysis of clusters, as a different approach from previous research, the results of our research fill the knowledge gap on RES exploitation, bringing more information about the characteristic features of EU countries in the context of sustainable development ambitious goals. The proposed analysis framework can provide a fresh and useful perspective to policy makers, academics and other stakeholders, highlighting the existing development gaps between countries. Based on the research results, future in-depth analyzes can be developed at different regional or country-level, aiming to improve the effectiveness of public policies to support the increase of RES for a sustainable transition to a low carbon economy.
Grouping different Member States on the basis of criteria highlighted by this research can provide the opportunity to explore targeted solutions for each cluster of countries, or can lead to the development of more efficient resource allocation models and more precise tailoring of public policies to support the achievement of the desired level of performance.
2. Literature Review
In terms of resources, RES includes wind energy, solar energy, hydroelectric energy, tidal energy, geothermal energy, ambient heat captured by heat pumps, solid, gaseous and liquid biofuels and the renewable part of waste, sources that can vary from the point of view of exploitation from one country to another, reason for which the evaluation, the definition of the trend and the highlighting of the disparities between countries for each of them, can sometimes be difficult to measure [
6,
12].
However, the specific problems of RES must not omit the fact that the lack of reliable access to clean energy and the services they provide, generates a growing problem in terms of diseases of the low-income population and prevents at the same time the prospects for long-term sustainable development. In addition, imminent climate change, mainly driven by energy use, is increasingly threatening people’s long-term quality of life and the existence of future generations [
13,
14,
15].
Today, more and more technological options arise, governmental policies or economic instruments, especially for priority economic sectors, such as electricity generation, green transport, agriculture and green construction. However, barriers to change include in many situations personal interests, political inertia, inability to take meaningful action, deep global inequalities, weak technology transfer mechanisms, and knowledge gaps that need to be addressed separately [
9,
16].
Therefore, identifying country-specific energy issues is a priority challenge of the current period, implying the need for a complex clean energy program to adapt stakeholder behavior to climate emergency challenges. We also emphasize the need to intensify cross-sectoral research but also specific actions, both nationally and internationally. There is a clear segmentation of the literature on renewable energy in several areas, depending on global priority objectives, such as: evaluating energy policies, selecting the most appropriate source of renewable energy for electricity generation, evaluation of renewable energy resources, identification of the optimal place for a renewable energy installation, selection of the best energy alternative, etc. [
17,
18,
19].
As a consequence of recent challenges and opportunities, at EU level can be spotted a radical change in energy policy, especially by setting new ambitious goals for 2050. Consequently, in response to international commitments on greenhouse gas emissions, the EU has imposed urgent and decisive measures that have led to its leadership in renewable energy, as in many European countries renewable energy is a possible and very viable option. Today, solar, wind and photovoltaic energy are new nuclei of electricity production, a real support for the EU’s low-carbon economy and the transition to climate-neutral stage [
20,
21].
At the same time, by including efficient algorithms to determine the optimal exploitation of renewable energy, but also by identifying the neuralgic points in each country, starting points can be established in the associated energy planning decisions and consequently, an increase can be obtained. of energy performance for all [
22,
23].
Even if the large-scale implementation of renewable energy sources for electricity generation (RES-E) is a major pillar of the decarbonisation strategy of the electricity sector, the other components of the energy balance should not be lost sight of either. Thus, the use of renewables for heating or cooling purposes (RES-H/C) reduces GHG emissions since in many cases fossil fuels are replaced, or the increase in the use of biofuels as renewable sources in transport (RES-T) contributes to the achievement of EU targets. It should be mentioned that the transport sector represents about a quarter of Europe’s GHG emissions and is the main cause of air pollution in cities, and a major reduction in transport emissions is needed to achieve climate-neutrality by 2050.
The targets set by SDG7 for 2030 clearly highlight the decision-making directions that each EU Member State is expected to follow, proposing targets to fulfill based on their own legal and policy guidelines or laws. Moreover, it is undeniable that income, human capital, energy productivity, energy prices and eco-innovation are important factors in stimulating renewable energy consumption, and all these are key elements in the decision-making process at local/regional level [
24]. Thus, in order to provide viable solutions to environmental problems and to achieve the objectives set out in the Paris Climate Agreement, we support the idea that policies and strategies should be devised to increase the share of renewable energy in the overall energy mix of each country, adapted to local specificities of the renewable energy resources specific to each country.
Another aspect not to be neglected is the one related to the fact that the trend of the evolution of the sustainable economy at the level of regions and states of the world is directly dependent on the current state of society, a state that can be synthetically characterized by the following: based on wood, coal, or animal waste for cooking and heating; energy accounts for about 60% of total global greenhouse gas emissions; since 1990, global CO
2 emissions have increased by more than 46%; hydropower is the largest source of renewable electricity today, providing 16% of the world’s electricity at competitive prices; bioenergy is the largest source of renewable energy today, providing 10% of the world’s primary energy supply [
25,
26,
27].
The fact that the need to increase renewable energy consumption at EU level also demonstrates that renewable energy has an undeniably positive impact on the sustainable development of the economy [
28,
29,
30]. It is estimated the share of renewable energy in gross final energy consumption will continue to increase to 55%–75% in 2050 in the European Union, and an important aspect is the contribution of bioenergy as a major source of renewable energy in the European Union [
31,
32,
33].
However, the full implementation of the national climate and energy plans by 2030 would allow the EU to exceed the proposed climate and renewable energy targets for 2030. However, such progress may still be considered insufficient to achieve GHG emission reduction targets by 2030. Thus, in order to achieve climate neutrality by 2050, renewable power should increase to over 80% by 2050 to meet these commitments, requiring a diversification of theoretical and practical approaches [
34].
To the above we add the recent research attesting to the presence of correlations between gross domestic product (GDP) per capita, greenhouse gas emissions and renewable energy in total final energy consumption, correlations that can be measured by private investment, jobs created, and the gross value added of the sectors of the circular economy. Research also points out that green investment could increase GDP per capita by 6.4% and increase renewable energy in total final energy consumption by 5.6% [
35,
36,
37,
38].
Our research on the importance of renewable energy sources for the sustainable development of EU countries, completes the views regarding the long-term evolution of local economies in terms of implementing sustainable energy targets. Moreover, through this research, we aimed to offer new perspective the relationship between RES and sustainable development, but also to highlight both the existing disparities and the performing EU countries that can become model of good practices.
4. Empirical Results and Discussion
Based on the research method described above and the available data for 2019, five representative clusters were identified at the level of the 27 EU member states selected for analysis (
Table 7,
Table 8,
Table 9,
Table 10 and
Table 11).
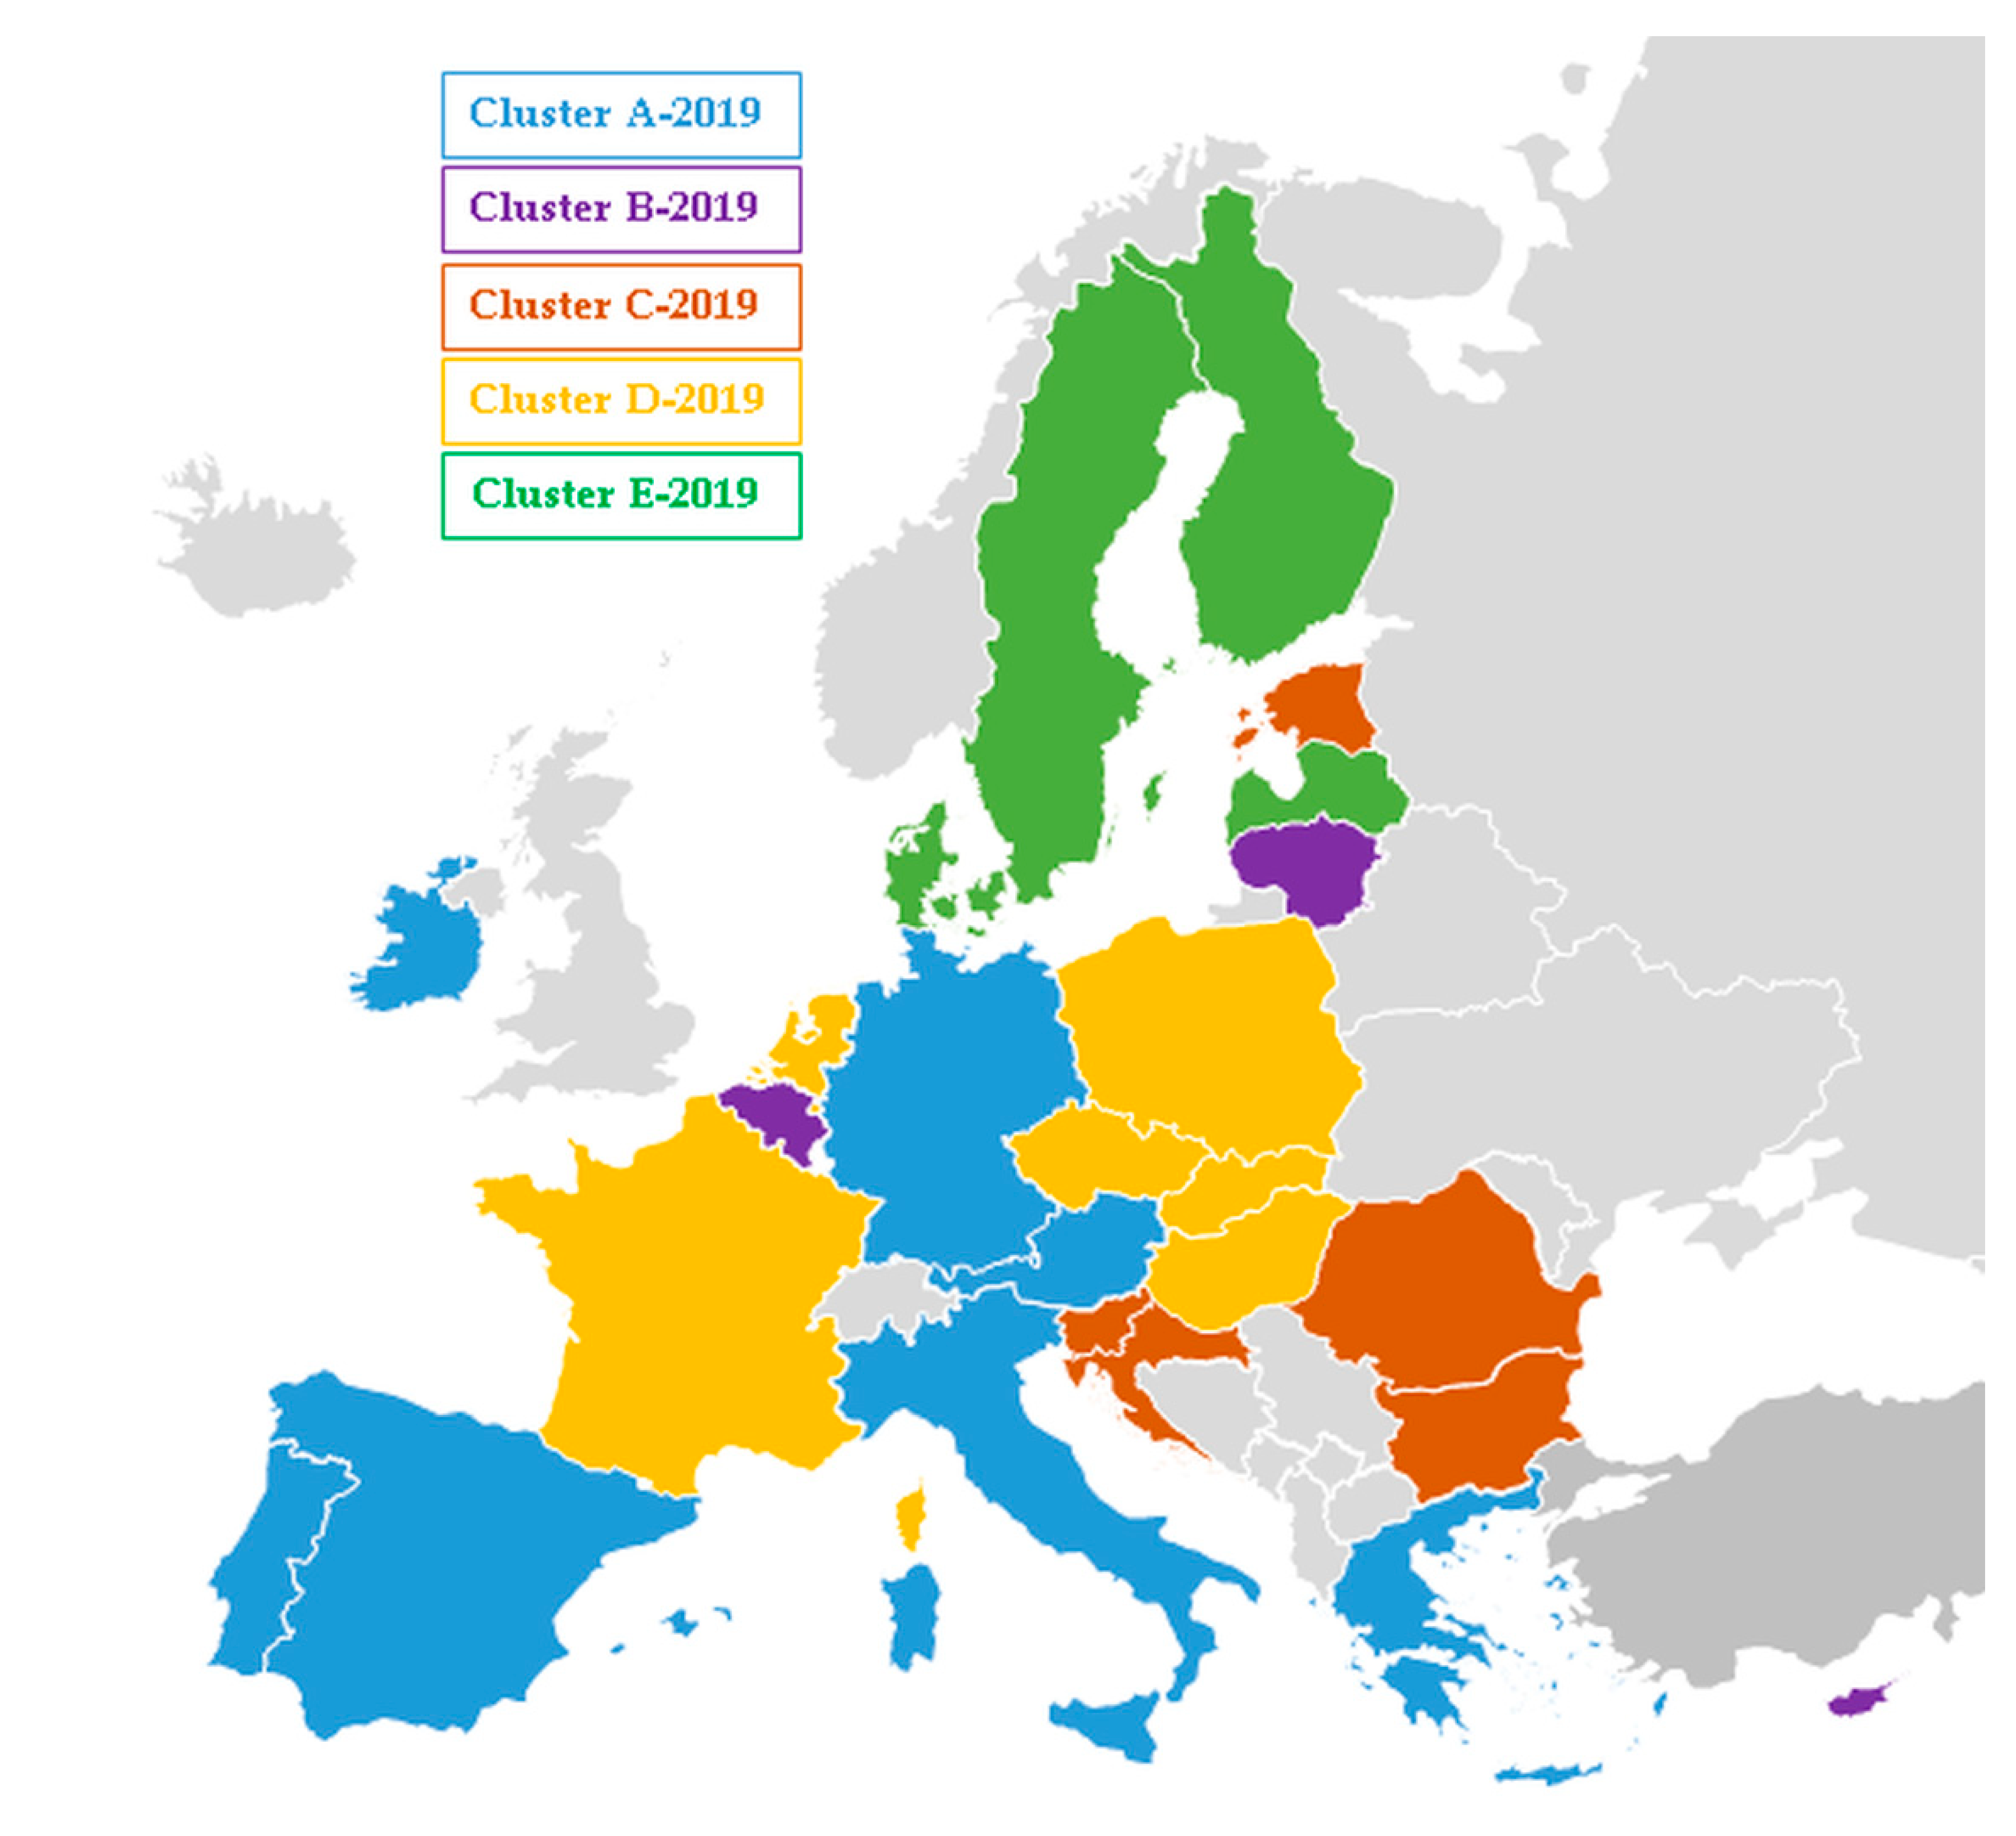
The first selected cluster (A-2019) brings together seven countries (
Table 7). The characteristic value for the countries thus grouped is the highest average value of Energy productivity (10.39 Euro per Kg of oil equivalent), which is a value 38.7% higher than the EU average of 7.49 Euro per Kg of oil equivalent.
Also, compared to the EU average, the countries grouped in this cluster register higher values for Share of renewable energy in electricity (+36.1%), Energy import de-pendency (+22.0%) and GHG emissions intensity (+0.9%), along with lower average values recorded for Share of renewable energy in transport (−8.3%) and Share of renewable energy in heating and cooling (−21.2%).
In the B-2019 cluster, a number of 5 European countries were grouped (
Table 8). The characteristic values for the countries covered in this way are the lowest average value of Share of renewable energy in transport (6.10%, representing a decline of 30.6% compared to the EU average), the lowest average value of Share of renewable energy in energy (13.65%, representing a decline of 57.9% compared to the EU average), and highest average value of Energy import dependency (88.12%, representing an increase of 53.2% compared to the EU average).
Among the other values that characterize the countries grouped in the B-2019 cluster, we can mention that, compared with EU average values, we find lower values for Energy productivity (−10.1%) and Share of renewable energy in heating and cooling (−16.3%), but also higher average values than the EU average for GHG emissions intensity (+1.4%).
In cluster C-2019 five Member States were reunited (
Table 9). The main features of these five countries are that they record the highest average values for Greenhouse gas emissions intensity (89.56, representing an increase of 8.0% compared to the EU average), along with the lowest average values for Energy productivity (4.81 Euro per Kg of oil equivalent, representing a decrease of 35.8% compared to the EU average), but also Energy import dependency (33.90%, which represents an improved performance with 41.1% compared to the EU average).
Regarding the other average values registered by the selected variables compared to the EU average, we mention that Share of renewable energy in electricity and Share of renewable energy in heating and cooling register higher values (+4.6% and, respectively, +22.0%), and Share of renewable energy in transport registers a lower average value (−20.9%).
At the level of 2019, the D-2019 cluster brings together 6 EU countries (
Table 10), having as defining key value the lowest average level of Share of renewable energy in heating and cooling (17.67%, representing a decrease of 41.0% compared to the EU average).
Regarding the average values of the other variables analyzed compared to the EU average value, the countries grouped in this cluster register lower values for Energy productivity (−19.0%), Share of renewable energy in transport (−2.2%), Share of renewable energy in energy (−49.7%), Energy import dependency (−10.3%), but in terms of GHG emissions intensity there is a higher marginal average value (+0.1%).
In the E-2019 cluster, 4 EU member states were grouped (
Table 11), characterized by highest average value of Share of renewable energy in transport (15.97%, exceeding the EU average with 81.7%), highest average value of Share of renewable energy in electricity (57.01%, representing an increase of 75.7% compared to the EU average), highest average value of Share of renewable energy in heating and cooling (57.35%, exceeding the EU average with a remarkable 91.6%), next to the lowest average value of Greenhouse gas emissions intensity (71.77%, representing a decrease of 13.4% compared to the EU average).
Also, the countries grouped in this cluster have better average values than the EU average. Thus, the average value of Energy productivity is higher than the EU average (+18.6%), and the average value of Energy import dependency is lower than the EU average (−48.2%).
For a better visualization of spatial distribution, the research clusters are graphically illustrated in
Figure 2.
To facilitate the comparative analysis of the results obtained from the research, they were summarized in
Table 12.
The approach of the relations between renewable energy sources and the sustainable development of EU countries through cluster analysis offers a unique and comprehensive overview, but also numerous details regarding the evolution of each country included in the analysis. Thus, high-performing countries can be identified, both in terms of the use of RES and consistent progress in the field of sustainable development (Cluster E-2019), along with Member States that do not perform as well in these areas (Cluster B-2019).
Using the hierarchical cluster analysis method, we can group the EU Member States according to the characteristics of the analyzed variables, revealing the existing structures as well as the way in which the analyzed countries are associated in hierarchical structures. Thus, by approaching these clusters in a unitary way, it is possible to increase the efficiency and to target more effectively the public policies as well as the financial support instruments for renewable energy sources, so as to produce effects in the countries grouped in the same cluster.
Also, the follow-up in time of the redistribution of EU countries between the identified clusters, can reveal the effects of the measures adopted and implemented to support the development of RES, but also the path taken by the analyzed countries to achieve sustainable development objectives.
Through this research, we can get an overview of how and in which EU countries are grouped according to the variables analyzed, but we can also obtain information on potential grouping anomalies and performance limitations. For example, the presence of The Netherlands in the D-2019 cluster, along with not so economically and socially developed countries, which, however, prove higher performances in terms of RES. Thus, The Netherlands is in a way penalized by the not very high performances of RES_HC. Moreover, the presence in the same cluster together with countries that are more disadvantaged in terms of geographical positioning or economic performance suggests the existence of other causes of this RES_HC underperformance, which suggests different possible directions of investigation and remediation of identified issues.
Similarly, France is included in the same D-2019 cluster, alongside The Netherlands. In terms of economic performance and energy productivity, the two countries perform similarly, but due to its more advantageous geographical position compared to The Netherlands, France registers higher values of RES_HC. In this case, France’s penalty is due to the more modest performances recorded by RES_T, which indicates the need for further investigations and targeted support in this direction.
The research also highlights a number of countries that have adopted certain strategic directions (such as the case of Estonia and Latvia), which generates potential different results, but also potentiate each other in terms of RES level. In this case, Estonia has decided to decrease energy dependence by sourcing for its own shale oil sources with the cost of increasing GHG emissions from energy sector, while Latvia decided to increase the imports to have cleaner energy mix. However, even in this particular case, the two neighboring countries have joined forces and recently signed an agreement to implement a joint project of the offshore wind farm construction, which will facilitate their progress for moving towards higher RES level.
In fact, the case of the Baltic States can be considered a special case that should be analyzed in more detail, from multiple perspectives, given the differences both in terms of results obtained from the application of the analysis methodology and in terms of strategic directions and policies adopted by national governments. Based on these detailed investigations, it is possible to determine the most suitable development options for the future that will be promoted and implemented in other EU or non-EU countries.
Therefore, the analysis and development of a multi-level decision-making structure, using multiple criteria for energy planning and exploitation of RES at regional level, is a strategic requirement that all European countries and beyond can meet. The results show that the exploitation RES at the regional level can meet the growing energy requirements through green energy systems that combine wind, biomass and photovoltaic systems, offering excellent opportunities for private investors to invest in renewable energy generation [
57,
58].
An analysis of the research results can be performed also at the level of the selected variables, which provide additional information related to the research objective. For example, from the point of view of energy productivity we notice that the first 3 countries with the highest productivity (Ireland, Denmark, and Luxembourg) are in different clusters. The arguments underlying this depreciation are based on extremely different values with respect to the rest of the variables analyzed. Thus, Denmark has one of the lowest GHG emissions, while Luxembourg is at the opposite pole. Similarly, of energy import dependence in Luxembourg is four times higher than that of Denmark, which is understandable. The difference is that in Luxembourg have a fossil fuel-intensive energy mix driven by a high demand for transportation fuels, notably from transiting freight trucks, while in Denmark has successfully decoupled its economic growth from greenhouse gas emissions, thanks to a combination of energy efficiency improvements, and fuel switching to renewables.
According to the research results, in 2019 there is a major gap regarding the differences in energy productivity in EU countries, the difference recorded between the lowest energy productivity value (Bulgaria, 2.52 Euro per Kg of oil equivalent of 13.98 Euro) and the highest energy productivity value (Ireland, 19.64 Euro per Kg of oil equivalent) being about 7.8 times larger. These unfavorable differences in energy productivity will obviously have repercussions in the medium and long term on the ability of countries to improve their performance in terms of renewable energy sources, as well as achieving sustainable development goals.
Another worrying aspect of the research refers to the consistent differences between the level of energy import dependency of the EU countries, respectively a level between a minimum value of 4.83% (Estonia) and a maximum value of 96.47% (Malta). It is clear that EU countries with high and very high levels of energy dependence on imports must make additional efforts to direct their future development towards improving renewable energy sources and the energy mix, which will have a positive impact. on sustainable development indicators. However, only the individual efforts of these states will not be enough, requiring a reallocation of funds in the European Union to support achieving the highest possible degree of energy independence, which is expected to happen through the implementation of the European Green Deal.
In conclusion, we highlight the fact that, at international level, the importance of renewable energy in the energy mix is increasingly reflected in specific actions and policies. Practically, the advantages of using renewable energy for the world’s energy security and for the environment are indisputable today and are increasingly researched and analyzed in the literature. Therefore, not only the impact of renewable energy consumption on economic well-being, but also the effects of renewable energy on countries’ performance are still the subject of research and debate, even if the influence of renewable energy consumption or its share on the total energy mix is positive and statistically significant [
7,
59].
5. Conclusions
Through this research, which sought to emphasize the relationship of the renewable energy sources and the sustainable development of EU countries, we identified a series of relevant information for the stakeholders involved.
In implementing sustainable development strategies, RES are proving to be a critical choice for countries. It has become clear that energy is the critical element in stimulating economic and social development, as well as achieving a high level of well-being. The development of renewable energies can be accelerated by promoting public policies accompanied by specific legislation, including relevant incentives. The main objectives related to RES are thus materialized by pursuing increased economic competitiveness, ensuring supply, as well as protecting the environment, and reducing GHG emissions.
A first general conclusion of the research is, even though many states have significantly improved their performance on renewable energy sources, there are still significant disparities between Member States in terms of performance exploiting renewable energy sources, which can lead to medium and long-term performance gaps, with effects on overall well-being but also on implications for potential achievement of the SDGs and targets assumed at EU level.
Although some countries have shown a real concern for this strategic and security issue by improving their level of energy independence in the last years, especially based on RES (Estonia, Belgium, Greece, Ireland, Luxembourg), there are countries which recorded a decline (Denmark, Bulgaria, Romania, Latvia, Sweden). This negative trend must be carefully followed and the most appropriate measures must be identified to counter this trend, possibly even on examples of good practice identified in countries that have proven successful in this regard.
Through the research conducted, high-performing countries are analyzed and identified, both in terms of the use of RES and consistent progress in the field of sustainable development (Cluster E-2019), along with Member States that do not perform as well in these areas. Cluster B-2019.
Also, the research results suggest details on the individual performances of EU countries compared to other countries included in the same cluster, but also highlights the discrepancies within each cluster, offering the possibility of conducting in-depth analyzes more precisely targeted, based on variables that suggest a less optimal level of performance.
We also highlight the fact that the key strategies for an upward evolution and for reducing disparities between states must include mainly private sector financing, with the aim being to reduce the gaps between developed and least developed countries, such as gaps between urban and rural areas.
The rapid implementation of renewable energy sources has been determined mainly by a variety of factors, including progress in economic and technological development, increasing energy security, improving access to energy for all, along with growing concern about the effects of change climate. While such benefits are mentioned as key factors in political and energy debates, the concrete evidence as well as the documented justifications for these benefits remains quite limited due to methodological challenges as well as limited access to relevant data.
Returning to a new way of saving, producing, creating, and developing products and services that bring together nature’s resources through the most advanced technology for their exploitation, in direct correlation with a circular economy, are indisputably aspects which we support as a necessity of the present for the future generations to be much more connected to the environment, to the recirculation of resources, and to the support for progress exclusively through the regeneration and reuse of available resources.


 ,
, 

