1. Introduction
Currently, to reduce the environmental impact of the transport sector, governments and institutions have been introducing increasingly stringent regulations and limits on pollutant emissions [
1,
2]. To meet such demanding emission standards and reduce fuel consumption while maintaining the required durability of the drive unit, car manufacturers must develop more and more advanced drive systems and energy conversion systems. This is followed by an increasing number of unforeseen aperiodic factors of a stochastic nature that affect the long-term cost of the solution used. Due to the high cost of batteries, electric vehicles are still not able to fully meet the requirements [
3,
4,
5]. The current energy policy objectives result from a correlation between limitations due to the depletion of natural energy resources, the risk of environmental pollution, and the strategy of creating an infrastructure that allows for the efficient use of electromobility systems. Energy is an added value that has various forms; it is a function of the state and thermodynamic potential, which describes the interaction of physical objects, physical and chemical transformations, and processes occurring in nature. The prospect of the conventional energy reserves being exhausted and the restrictive environmental protection measures have boosted the interest in alternative energy sources used in internal combustion engine vehicles (ICEV). The efficient use of alternative energy sources is hampered by technological, economic, political, and legal constraints. Today’s petroleum fuels are used in ICEVs, e.g., gasoline and diesel (fossil fuels). The conversion of the chemical energy in petroleum-based fuels into thermal energy is associated with a harmful impact on the environment, and forecasts for this form of energy resources necessitate the development of alternative fuels that can be used in battery electric vehicles (BEV) and plug-in hybrids (PHEV). Energy is an indispensable factor that determines the chain of obtaining and processing power for specific technologies. Since petroleum-based fuels belong to a group of nonrenewable energy sources, this necessitates their limited use in vehicle propulsion. The extraction, processing, and transport of petroleum fuel for internal combustion engines have a massive impact on the natural environment. Previous research into the use of alternative fuels as the primary form of energy and an efficient replacement for conventional fuels have not produced conclusive results. This is determined by energy conditions and technology that converts a given state of life into the required mechanical work necessary to achieve the desired range and dynamics of passenger vehicles, trucks, and public transport vehicles.
The current studies do not promote the adoption of an unambiguous substitute for petroleum fuels for vehicle propulsion following design parameters, i.e., vehicle range and dynamics, the emission of harmful combustion substances, and the economic factors. Just like gasoline and diesel oil, the currently available alternative fuels, e.g., liquefied petroleum gas (LPG), despite their fairly common use, are a petroleum products. Another example is natural gas, the resources of which are also limited due to the irreversible course of the combustion process. Hydrogen obtained from water through electrolysis is used as an energy source for fuel cells used in electric motors. The introduction of hydrogen propulsion in traction vehicles brings advantages resulting from the overall efficiency of the fuel cell (more generous than in internal combustion engines), fuel energy efficiency (translating into range when compared to vehicles with tanks of equal volume), and environmentally neutral emission. From an economic point of view, alternative fuels from biological products, e.g., ethanol, biodiesel, are a good energy source, limited only by the cultivation capacity of the raw material. Due to the limitation of land available, the demand for biodiesel as a replacement for conventional fuel cannot be met. The use of alternative fuel vehicles (AFV) has been followed by the introduction of a primary terminological differentiation: dedicated—vehicles powered by one energy source, having low emissions to the optimization of the engine operating parameters; dual-fuel—vehicles that use conventional fuel and alternative fuel as energy sources; bifuel—a two-tank car running on traditional fuel (gasoline or diesel) and, depending on the type of fuel system (propane or natural gas), using a single or combined cycle switched by the driver or an automatic control unit based on an algorithm (emission optimization point and vehicle economy); flex-fuel—single-tank vehicles fueled by petrol, methanol or ethanol, which form a homogeneous mixture.
The demand for conventional energy has forced the development of innovative vehicle designs based on alternative sources that promote the correlation between the following parameters: fuel consumption, the emission of toxic exhaust gas components, and the comfort of the vehicle movement. Energy consumption depends mainly on the vehicle’s energy demand, the efficiency of its drive system, and the energy source. In 2030, on the North American market, hybrid cars are expected to account for 10% of the total number of cars. Hybrid and electric motors will create significant competition for internal combustion engines on the European market. Sales of hybrid and electric engines in OECD countries, mainly Australia, New Zealand, and Japan, will secure the leading share of these countries in the automotive industry in the coming years. According to the 2030 forecast, the US market demand for fossil fuel (petroleum derivatives) will remain at a steady level. Internal combustion engine vehicles show a limited capacity to reduce fuel consumption, due to the Euro 6 emission standard for LDVs. Combustion taking place in the cylinder working space translates into the engine’s efficiency and the emission of harmful combustion products. These are unavoidable processes that accompany energy conversion in internal combustion engines.
Fuel cell hybrid electric vehicles are fitted with fuel cells as a source of power. It enables manufacturers to switch from using a piston internal combustion engine and exclude fossil fuels (petroleum derivatives). The hydrogen energy contained in the fuel cells is sufficient for the electric motor to operate. An electric vehicle generates zero emissions of harmful combustion products. Alternative fuels, used as a source of energy to propel vehicles, enable the reduction of substances toxic to the environment to a predefined level. By analyzing driving and energy properties in electric cars, it is possible to determine the operating conditions to maintain a sufficient durability and economic aspects of vehicles equipped with a given drive unit.
The currently adopted energy indicators determine the nature of the experimental research. These include the vehicle range at selected constant speeds depending on the vehicle class or capacity consistent with a speed profile, including the required phases, e.g., acceleration, motion at a constant speed and constant load, deceleration during braking, and standstill (static condition). In electric vehicles, the energy stored in electrochemical batteries may cause well-known repercussions. Scheduled test conditions are determined in terms of the energy balance. The parameters specific to a vehicle model, such as the total weight, the front surface (aerodynamic model), the rolling resistance coefficients, the efficiency of the drive unit and the entire drive train, and other electronic systems of the vehicle, are used to determine the energy status of the car. Many models undergo energy analysis to assess the effective use of the energy source for propulsion. Much attention is also paid to the vehicle’s range, the technical possibility of accumulating energy, and the efficiency of its recovery, e.g., the recovery of kinetic energy during braking. As it turns out, relatively little attention is paid to aperiodic factors of a stochastic nature, contributing to the reduction in the vehicle operating cost. In the case of electric and hybrid vehicles, these are the main factors related to the unforeseen energy capacity loss of the primary energy source, failures of the energy management system pieces, damage to the drive of smaller components, changes in the driving conditions when traveling long-distance in unknown territory. Then, the values recorded by the energy management system are unsuitable for determining the future range of the vehicle. Other factors include the limitations of the charging technology and the availability of spare parts in the event of minor driveline failures. It should be remembered that in cars with an internal combustion engine, unforeseen external losses of, for example, the drive system or other energy management system components can be quickly rectified due to the well-developed service station networks and the availability of spare parts. The same applies to the availability of power supply stations for a given energy system.
The basic limitation for BEVs is their energy source, which in most cases is a set of electrochemical cells, e.g., lithium-ion cells. Their durability over a longer period of operation is insufficient, the charging time is very long, and the purchase cost is very high in relation to the energy benefits [
6,
7,
8]. Additionally, many design measures are required to ensure maximum durability for various drive system operating conditions, energy load resulting from energy consumption by electrical equipment, and the nature of driving over a given distance [
9,
10]. Apart from these fundamental disadvantages of BEVs, there are also difficulties related to the progress in the development of the fast charging infrastructure in rural areas and smaller towns [
11,
12,
13]. Therefore, these difficulties make long distances traveling in nonurban areas with limited access to the charging infrastructure reduce the energy and economic viability of BEVs [
14,
15]. In this case, it is necessary to apply appropriate management strategies while introducing BEVs to the automotive market to ensure the maximum efficiency of the electromobility system [
16,
17]. To reduce certain limitations related to driving system solutions, the use of the PHEV, which combines BEV and ICEV systems, should be considered during the transition period [
18,
19,
20]. The ability to improve the overall efficiency of ICEV’s drive units is minimal. Therefore, it is not possible to achieve a significant reduction in fuel consumption, i.e., 20–30%, assuming the necessary power and torque of the engine [
21,
22,
23]. The problem becomes more complicated in the case of large internal combustion engines designated for trucks and buses, since they require engines of significantly increasing and modified mechanical efficiency to reach the desired reliability and structural strength of the main kinetic unit. The combination of the two power sources in PHEV vehicles may contribute to the vehicle’s range [
24,
25]. This will significantly extend the time needed for BEVs to adapt to the development of the charging infrastructure in nonurban areas. In real terms, this allows the vehicle range to be increased from about 70–100 km to 600 km [
26,
27,
28], and maintain mobility in case batteries are completely discharged, and the electric drive unit is excluded [
29,
30,
31]. To determine appropriate energy balances, many complex algorithms for forecasting the potential energy consumption are used. They take into account the route to be covered based on satellite navigation [
32,
33,
34]. Such energy management models and strategies are used in various vehicle energy management concepts [
35,
36,
37]. Due to the complexity of the system, the capabilities vary and allow different effects to be achieved depending on route planning and the availability of charging stations [
38,
39,
40].
Modern PHEVs with an electrochemical energy source are still equipped with an internal combustion engine, electric motor, electric generator, and an electrochemical energy source. They can work in series and in parallel. In a series configuration, the total energy of the internal combustion engine with a generator is converted into electric energy, which determines the mechanical work of the drive unit. The piston internal combustion engine drives a direct current or alternating current generator (integrated with rectifier) [
41,
42]. An automatic transmission coupled with an electric motor drives the wheels. The system consists of primary and secondary energy sources. The power balance in a series configuration distinguishes between two operating states. An energy shortage in an electrochemical energy source is compensated by the internal combustion engine energy surplus resulting from the combustion engine’s work schedule. Internal combustion engine stabilizers force its operation at constant useful power adjusted to the energy balance. This determines the optimal overall efficiency of the internal combustion engine [
43,
44,
45].
Kinetic energy is recovered when braking enables the energy necessary to charge the secondary source with only the electric motor working as a generator. In a parallel hybrid system, electrical energy, transferred from mechanical work to the crankshaft of the internal combustion engine, is converted into energy supplying the secondary energy source and transmitted through the mechanical units to the driving wheels. The drive train clutch enables the separation of the electric and combustion engines. The automatic transmission in the power unit enables the connection in parallel of the electric and combustion engines. The torque measured on the motor output shafts is the sum of the unit torques. When the drive wheels are heavily loaded, the internal combustion engine is supported by an electric motor that uses energy from an electrochemical source. When the nominal useful power of the internal combustion engine exceeds the capacity of motion resistance and the braking mode is applied in a vehicle, the electric motor works as a generator. The main criterion determining the use of a given design solution in a PHEV with electric electrochemical energy accumulation is to fulfill conditions for optimal energy accumulation resulting from the excess useful power of the internal combustion engine and its healing, i.e., secondary recovery of the energy in vehicles with electric or hybrid drive by using an electric motor as a generator and the conversion of the kinetic energy into electricity supplying an electrochemical energy source. The use of secondary energy generation to drive the vehicle significantly increases its overall efficiency. The research carried out as part of the energy accumulation and recuperation project has helped to develop prototype solutions, which have been then implemented into serial production. The hybrid electrochemical drive system in PHEVs that uses a secondary mechanical or hydraulic energy source constitutes a separate group of energy accumulation systems cooperating with the electrochemical energy source.
In traction vehicles, the primary energy source is an internal combustion engine (ICE), from which the chemical energy from the combustion process is converted into mechanical work. The specific mass-energy of the fossil fuel (gasoline) is 9000 J/kg. The efficiency of its use depends on the overall traction efficiency of a piston internal combustion engine and the range of the crankshaft rotation speeds. The combustion engine used in conventional vehicles is characterized by the low overall efficiency of the primary energy source. In hybrid systems, the combustion engine does not require changes in the rotation speed of the crankshaft throughout the vehicle operation mode when generating a constant rated power. The combustion engines used in hybrid systems must have a low weight and increased durability, as well which as their rated power needs to exceed the power demand of a given vehicle. Based on the heat strength tests of the engine materials, it has been found that spark ignition engines, compression ignition engines, rotary engines with a rotating piston, Stirling engines, and gas turbine engines meet the requirements of an electromechanical hybrid drive in PHEVs.
The preliminary analytical studies of the thermal engine as a primary source of energy in LDVs with a hybrid drive have fully confirmed that the original internal combustion engine can fulfill all of the operating conditions. Due to the durability required (piston–rings–cylinder assemblies), a spark-ignition internal combustion engine cannot work continuously while transferring useful work to the crankshaft with loads equal to the rated power more significant than 50%. To rectify the above, it is necessary to improve the kinetic properties of the main engine mechanisms. The optimization of these parameters determines the improvement of the overall efficiency of the engine. The ignition internal combustion engines used in PHEVs need to have a regular output of their rated power at a constant load of 50% to 80% of the maximum capacity. Considerable resistance to wear and tear during the combined operation of the LDV and PHEV drives is characteristic of compression–ignition combustion engines due to their reduced rotation speed of the crankshaft and the combustion process. This comparison shows a specific limitation that depends on the weight of the compression–ignition internal combustion engine, curb weight, which is considerably larger than in spark-ignition internal combustion engines. Rotary combustion engines have the lowest curb weight but a significantly lower overall efficiency. Stirling engines and gas turbine engines require higher quality materials due to thermal loads and operating conditions. This excludes their service as the primary source of energy. The heat engine in traction LDVs with a series connection of a hybrid electromechanical PHEV drive is connected to a direct or alternating current generator. Mechanical work is transformed into electricity in an electric generator. The energy is transferred to the alternator, the second primary energy source in the internal combustion engine assembly.
Regarding the method of excitation, direct current generators can be divided into individually excited and self-excited (shunt, series, and shunt–series). In the first assembly, the excitation current is taken from the secondary energy source, and in the second, from the armature circuit. The demand for mechanical work is proportional to the electrical output power, which is determined by the generator’s efficiency. Losses of the electric energy output result from internal friction in the bearings, conditioned by the construction of the reception unit (electric energy) or the rings. There may also be winding losses, hysteresis losses (magnetization losses), and rectifier losses. The combination of the internal combustion engine with the PHEV hybrid drive of LDV traction vehicles and a variety of energy sources—diesel engines, ZI engines with a flywheel, gas turbines, batteries, and ultracapacitors—may contribute to the compliance with the exhaust gas toxicity standards for ULEV (Ultra Low Emission Vehicle) and SULEV (Super Ultra Low Emission Vehicle).
Most of the complex systems dealing with energy consumption and the development of the energy–mobility infrastructure of motor vehicles, which are considered for aperiodic reasons, e.g., unforeseen damage to drive systems contributing to the loss of vehicle range, are based on incomplete and uncertain information about their structure and behavior. The methods used for their analysis and evaluation (probability, fuzzy and coarse sets), can be extended with the gray system theory (GST). The advantage is that the method does not require many assumptions about the size and distribution of samples relevant for the abovementioned methods, and the minimum number of data that justifies the use of the GST (n ≥ 4). By using the technique, one can predict the future behavior of the system, mainly the occurrence of unforeseen phenomena for a given power source, assess the interdependence of the observation vectors, and evaluate the effectiveness of reactions to possible situations and make optimal decisions, as well as group them and study them. This allows for a realistic comparison of the grounds for using specific systems depending on several side factors not directly related to the promised benefits of a given solution. It also enables the analysis of the stochastic parameters that affect the economic aspects of data application in terms of the territorial nature and available infrastructure supporting the operation and service of ICEV, PHEV, and BEVs.
To optimize energy consumption in hybrid PHEV and BEV electric powertrains, several complex control strategies have been developed. However, not all of these models consider aperiodic phenomena affecting the energy balance in propulsion engines in regional electromobility systems. In such a model, engine efficiency indicators should also be introduced, based on the energy balance regarding the quantity and efficiency of the resources required. The adopted method enables the evaluation of the scale of the compromise between the effective range with the primary batteries, which are fully charged, the payload and the required minimum amount of vehicle resources to create the necessary infrastructure. If the operational parameters of BEVs are similar to those of vehicles powered by internal combustion engines (ICEV), a complete analysis of the vehicle’s energy balance is an effective solution. By adopting the economic compromise criterion, it is necessary to establish whether the increase in the capacity of the main corresponds to the expansion of the fast charging infrastructure in terms of the stochastic operation of the drive units. Intelligent systems analyzing the engine energy balance based on advanced algorithms can contribute to the effective use of electromobility systems not only in urban but also nonurban systems, where the vehicle range is more important.
2. Materials and Methods
2.1. Resistance to Motion in Classic ICEVs, PHEVs, and BEVs in Terms of Energy Consumption by Selected Operation Schedules—Gray System Theory (GST)
The LDV traction vehicle traffic within a metropolitan agglomeration and in the undeveloped area diversifies the actual speed profile. Operating conditions of the drive system determined by the period and frequency of starting and braking phases and standstill periods, are stochastic in terms of the vehicle’s energy demand. This makes it difficult to determine resistance to motion data throughout the drive cycle for different drive units. Each drive system is characterized by various operating conditions. It is challenging to adjust them during one cycle due to energy consumption and the maximum total efficiency of the vehicle. Additionally, there are operational and utility factors of an aperiodic nature, the determination of which can only be performed using predictive methods. For this purpose, one can use a computational system based on the GST, divided into five phases: generation and smoothing of observation vectors, impact analysis, gray cluster analysis, forecasting, and analysis and decision making. The Gray System Theory (GST) was developed in China in 1982. It was created by Juo-Long Deng, a professor at Huazhong University, who presented the concept in a publication [
46]. Complex systems encompass different types of notions, such as matter, energy, and information [
47,
48,
49]. To a large extent, their organization is hierarchical, and often heterarchical, where each of the subassemblies are linked to one another and constitute a compatible chain of cause-and-effect relationships. Then, the positive synergy of the activity can be fully manifested. Therefore, we are talking about a wide class of systems, from complex systems in the entire cycle of service, operation, design, and reliability of a vehicle to socio-engineering systems with a several subsystems, e.g., impact of the nature of infrastructure in a given territory on user preferences as to the nature of the speed profile and the scale of traffic resistance [
50,
51,
52].
2.2. Comparison of Drive System General Efficiency and the Character of a Speed Profile
In classic ICEVs, the internal combustion engine operates in a variable, indefinite range of changes at rated power, the rotational speed of the crankshaft, and general efficiency. The kinetic energy released during the deceleration of a vehicle (braking) determines the decrease in the overall efficiency of the classic drive system. The motion of a traction vehicle expressed in the EPA-Highway schedule occurs in constant operating conditions of the drive system. The operating conditions of the ICEV driveline with the LDV variable speed profile significantly reduce the efficiency of the system. This is similar to the use of combustion engines in PHEVs. The research on the balance of LDV traction traffic shows the benefits of an urban speed profile in most areas where motor vehicles are used for passenger transport. The situation is changing in the case of heavy vehicles operated in nonurban areas. There, operating conditions change dramatically. In this timeframe, ICEVs show certain overall advantages. It is worth mentioning that the operational capacity is largely primarily influenced by the support infrastructure in PHEVs and BEVs in the country or the region. Based on a speed profile adapted to the operating conditions of a the vehicle, it is possible to determine the value of the energy generated during the vehicle’s motion that can be accumulated in a secondary energy source. Apart from losses due to air and motion resistance, ideal conditions for the recovery of braking energy determine the overall accumulation of power between the initial speed and the end of the decelerated motion. The urban driving schedule enables the collection of power by recuperating the kinetic energy of the vehicle in the deceleration of the car and taking over the excess of the instantaneous engine rated power over the required output power necessary for the movement of the driving wheels. Due to the way energy is accumulated in secondary sources in traction vehicles with PHEV drive, such vehicles require electrochemical, kinetic (mechanical), hydropneumatic accumulators, and batteries, and ultracapacitors. The efficiency of energy transmission and transformation systems that cooperate with batteries (secondary energy source) is not constant and depends on energy losses.
In LDV traction vehicles, moving at a low speed, the combustion engine is connected to the wheel drive via a generator and an electric (drive) motor. The increase in demand for power applied to driving wheels, which exceeds the rated capacity of the internal combustion engine, is supplemented by energy from the secondary energy source. The surplus energy generated by the internal combustion engine is used to increase energy in the secondary energy source. By introducing a stabilizer into the assembly of an internal combustion engine, it is possible to obtain a constant power output at a constant rotation speed of the crankshaft. Optimal operating conditions of a combustion engine enable a reduction in fuel consumption (i.e., more effective use of the chemical energy contained in the fuel by improving the overall efficiency of the machine). The hybrid drive in series with the PHEV series is more economical than in a parallel arrangement at an unfavorable power-to-weight ratio. The internal combustion engine in series with the PHEV hybrid drive operates in a narrow range of rotational speeds, which improves the stability of the rotational speed and load changes during the assembly operation. This reduces the emission of toxic combustion products. The traction range of the LDV in serial production is much more extensive, provided the dimensions of the interior combustion engine and the power generator are small. For BEVs, there is no internal combustion engine assembly, but only electric drive components such as propulsion motors, power converters, and an energy source. A significant disadvantage of this solution is its low energy efficiency and significant production and operation costs. In case of any failure of the auxiliary equipment used to control the process of charging and propulsion in PHEVs and BEVs, the cost-effectiveness of introducing the system as a replacement for ICEV vehicles is significantly reduced and in the case of traffic in extraurban mode becomes uneconomical.
The only advantage of this solution is the protection of the natural environment. The presented relationships make it difficult to determine the parameters that influence the assumed conditions, i.e., the range of a vehicle, economy, durability, and the optimal overall capacity. The operating needs and the requirements for LDV traction vehicles powered by an alternative energy source must also take into account driving comfort within a given schedule resulting from the intended use of the car. Regardless of its arrangement (parallel or series), a heat engine can operate at reduced consumption of chemical energy (fuel). The target parameter can be met only by the proper selection of the energy parameters, based on assessing the energy consumption and efficiency of the mechanical–electrical assembly. A critical parametric condition for the bodies of the presented hybrid PHEV systems with electric electrochemical energy accumulation provides the possibility of obtaining energy from excess power of the internal combustion engine and regenerative braking. This enables the effective use of the mechanical energy generated by the internal combustion engine based on inner energy transformation determined by general efficiency. The value of the average energy consumption of the vehicle determines its fuel consumption. This enables the optimization of the traveling profile (speed profile), while taking into account partial phases of movement, e.g., acceleration, training at a constant speed, and deceleration, depending on the nature of a given area. The determination of the exact value of the vehicle’s energy consumption with a minor deviation (transient conditions) determines the effectiveness of forecasting and designing these systems. The fuel consumption of the car in real motion and its energy consumption, supported by the general adaptive characteristics of the engine, makes it possible to select the optimal operating conditions for the PHEV hybrid system. The increase in the overall efficiency of the electromechanical drive unit ensures a weight reduction of the secondary energy source (electrochemical batteries) and an increase in the vehicle range, while maintaining constant dynamics of the vehicle’s movement. The main disadvantages of modern electromechanical hybrid drives are the low durability of the batteries depending on the technology, the method of energy resource control, and the frequency of charging. The increase in the overall efficiency and power of the combustion engine–power generator unit enables a weight reduction of the secondary energy source. The efficiency of the LDV traction vehicle, which uses an electrochemical battery to accumulate the energy necessary to increase the vehicle’s range and increase the power with a temporary load increase over the electric motor power, strictly depends on the number of cells of the secondary energy source.
The electrochemical battery requires periodic replacement due to the side reactions (active wear) depending on the number of charging cycles and the value of the charging current delivered through the booster (internal combustion engine–power generator). Providing the optimal conditions for the accumulation and recovery of energy extends the life cycle of the secondary energy source by increasing its durability. These conditions and all other indirect factors influencing the economics of ICEV, PHEV, and BEV systems are aperiodic parameters. Their separation must be determined individually for a given group of vehicles, comfort class, range, and energy source technology. Thus, it is possible to assess the justification of using PHEVs and BEVs in a given area, taking into account all external factors, including technological possibilities of making a given vehicle and adapting it to the site concerned. In this case, the economic efficiency of the solutions is determined by the durability of the batteries, their operation based on forecast traveling profiles, and access to the charging infrastructure and service centers. It is mostly influenced by the frequency of the defects in a given group of vehicles and their potential repair costs.
2.3. General Mathematical Relations Concerning the Determination of Vehicle Energy Losses
ICEVs, PHEVs, and BEVs have common features that affect energy consumption in motion. It is mainly the resistance to motion, which consists of: air resistance, rolling resistance, hill resistance, and acceleration resistance. In general terms, this relation can be expressed by the equation:
The resulting inflow velocity
is the vector sum of the vehicle speed
and the wind speed
. The airflow resistance depends on the air attack angle β and the vehicle motion parameters, which can be expressed by the average drag coefficient
at any angle of air attack:
With the incoming air (supporting the movement) or the opposite inflow of air, the equation expressing the air resistance
can be derived from the above relations:
In the absence of air, which is an unusual case in reality, this relation can be written as follows:
This enables us to determine the average dependence of the power demand of the drive unit needed to overcome the resistance to motion. This parameter is significantly influenced by components of the total efficiency of all ICEV, PHEV, and BEV systems.
For PHEVs and BEVs, there are additional factors such as braking energy recovery efficiency
and the charging efficiency of batteries and capacitors
:
Based on these considerations, assuming the same body shape for all drive system solutions, their energy consumption is determined by the efficiency of: drive systems, steering systems, drive transmission systems, systems supporting energy recovery from braking, other systems supporting the charging of batteries, and capacitors, all intermediate mechanisms accompanying the electric and internal combustion drive, and other components necessary to ensure the required comfort and safety of the vehicle. The overall efficiency depends mainly on energy losses resulting from the electrical and mechanical equipment. Therefore, PHEVs are characterized by the highest general energy consumption, followed by ICEVs and BEVs. This means that BEVs can achieve the highest overall efficiency compared to ICEVs and PHEVs. However, other features must also be taken into account, such as the durability and reliability of the BEV system and potential repairs at a low cost. In fact, all service activities for these vehicles are currently not very popular, and the network of private garages is insufficiently developed. This translates into a significant increase in the cost of repair and parts compared to ICEVs. In PHEVs, due to the dual-source of propulsion, the frequency of probable malfunctions of the drive system, drive train, and energy storage system is significantly higher than in other systems. Therefore, appropriate algorithms should be used to assess the economic aspects of using all propulsion sources due to aperiodic features, limiting the efficiency of the system due to the damage of components and unforeseen road situations.
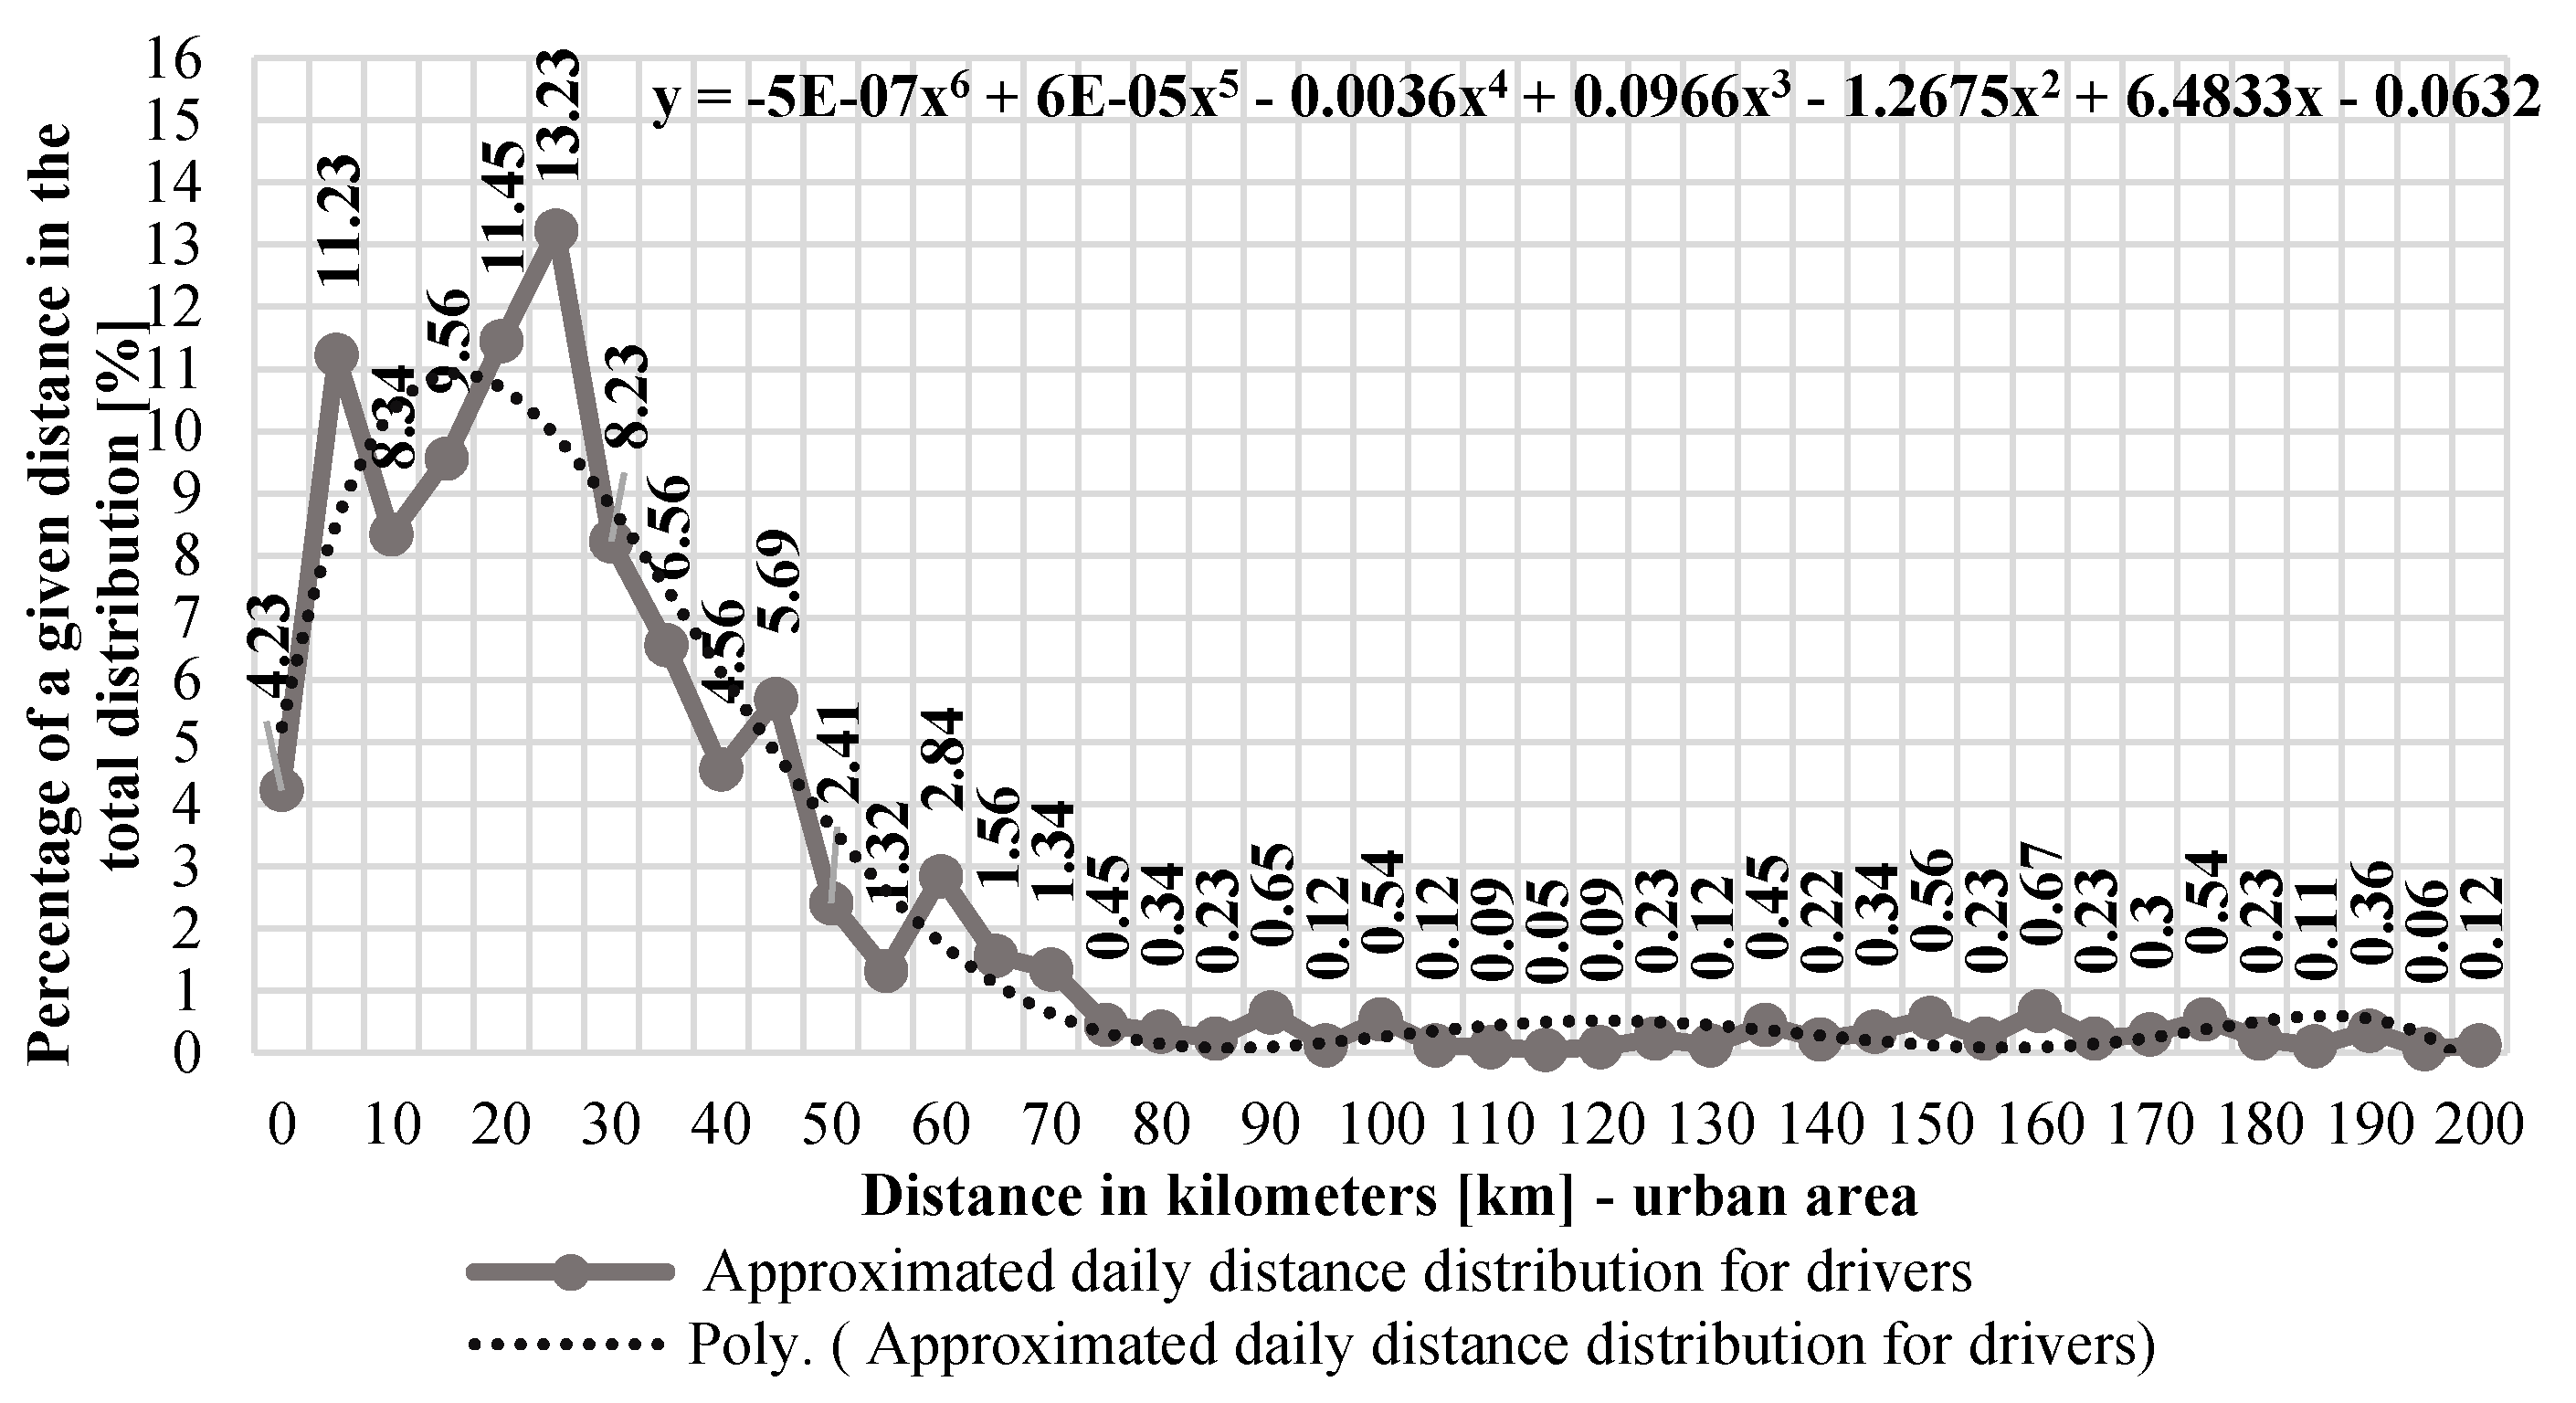
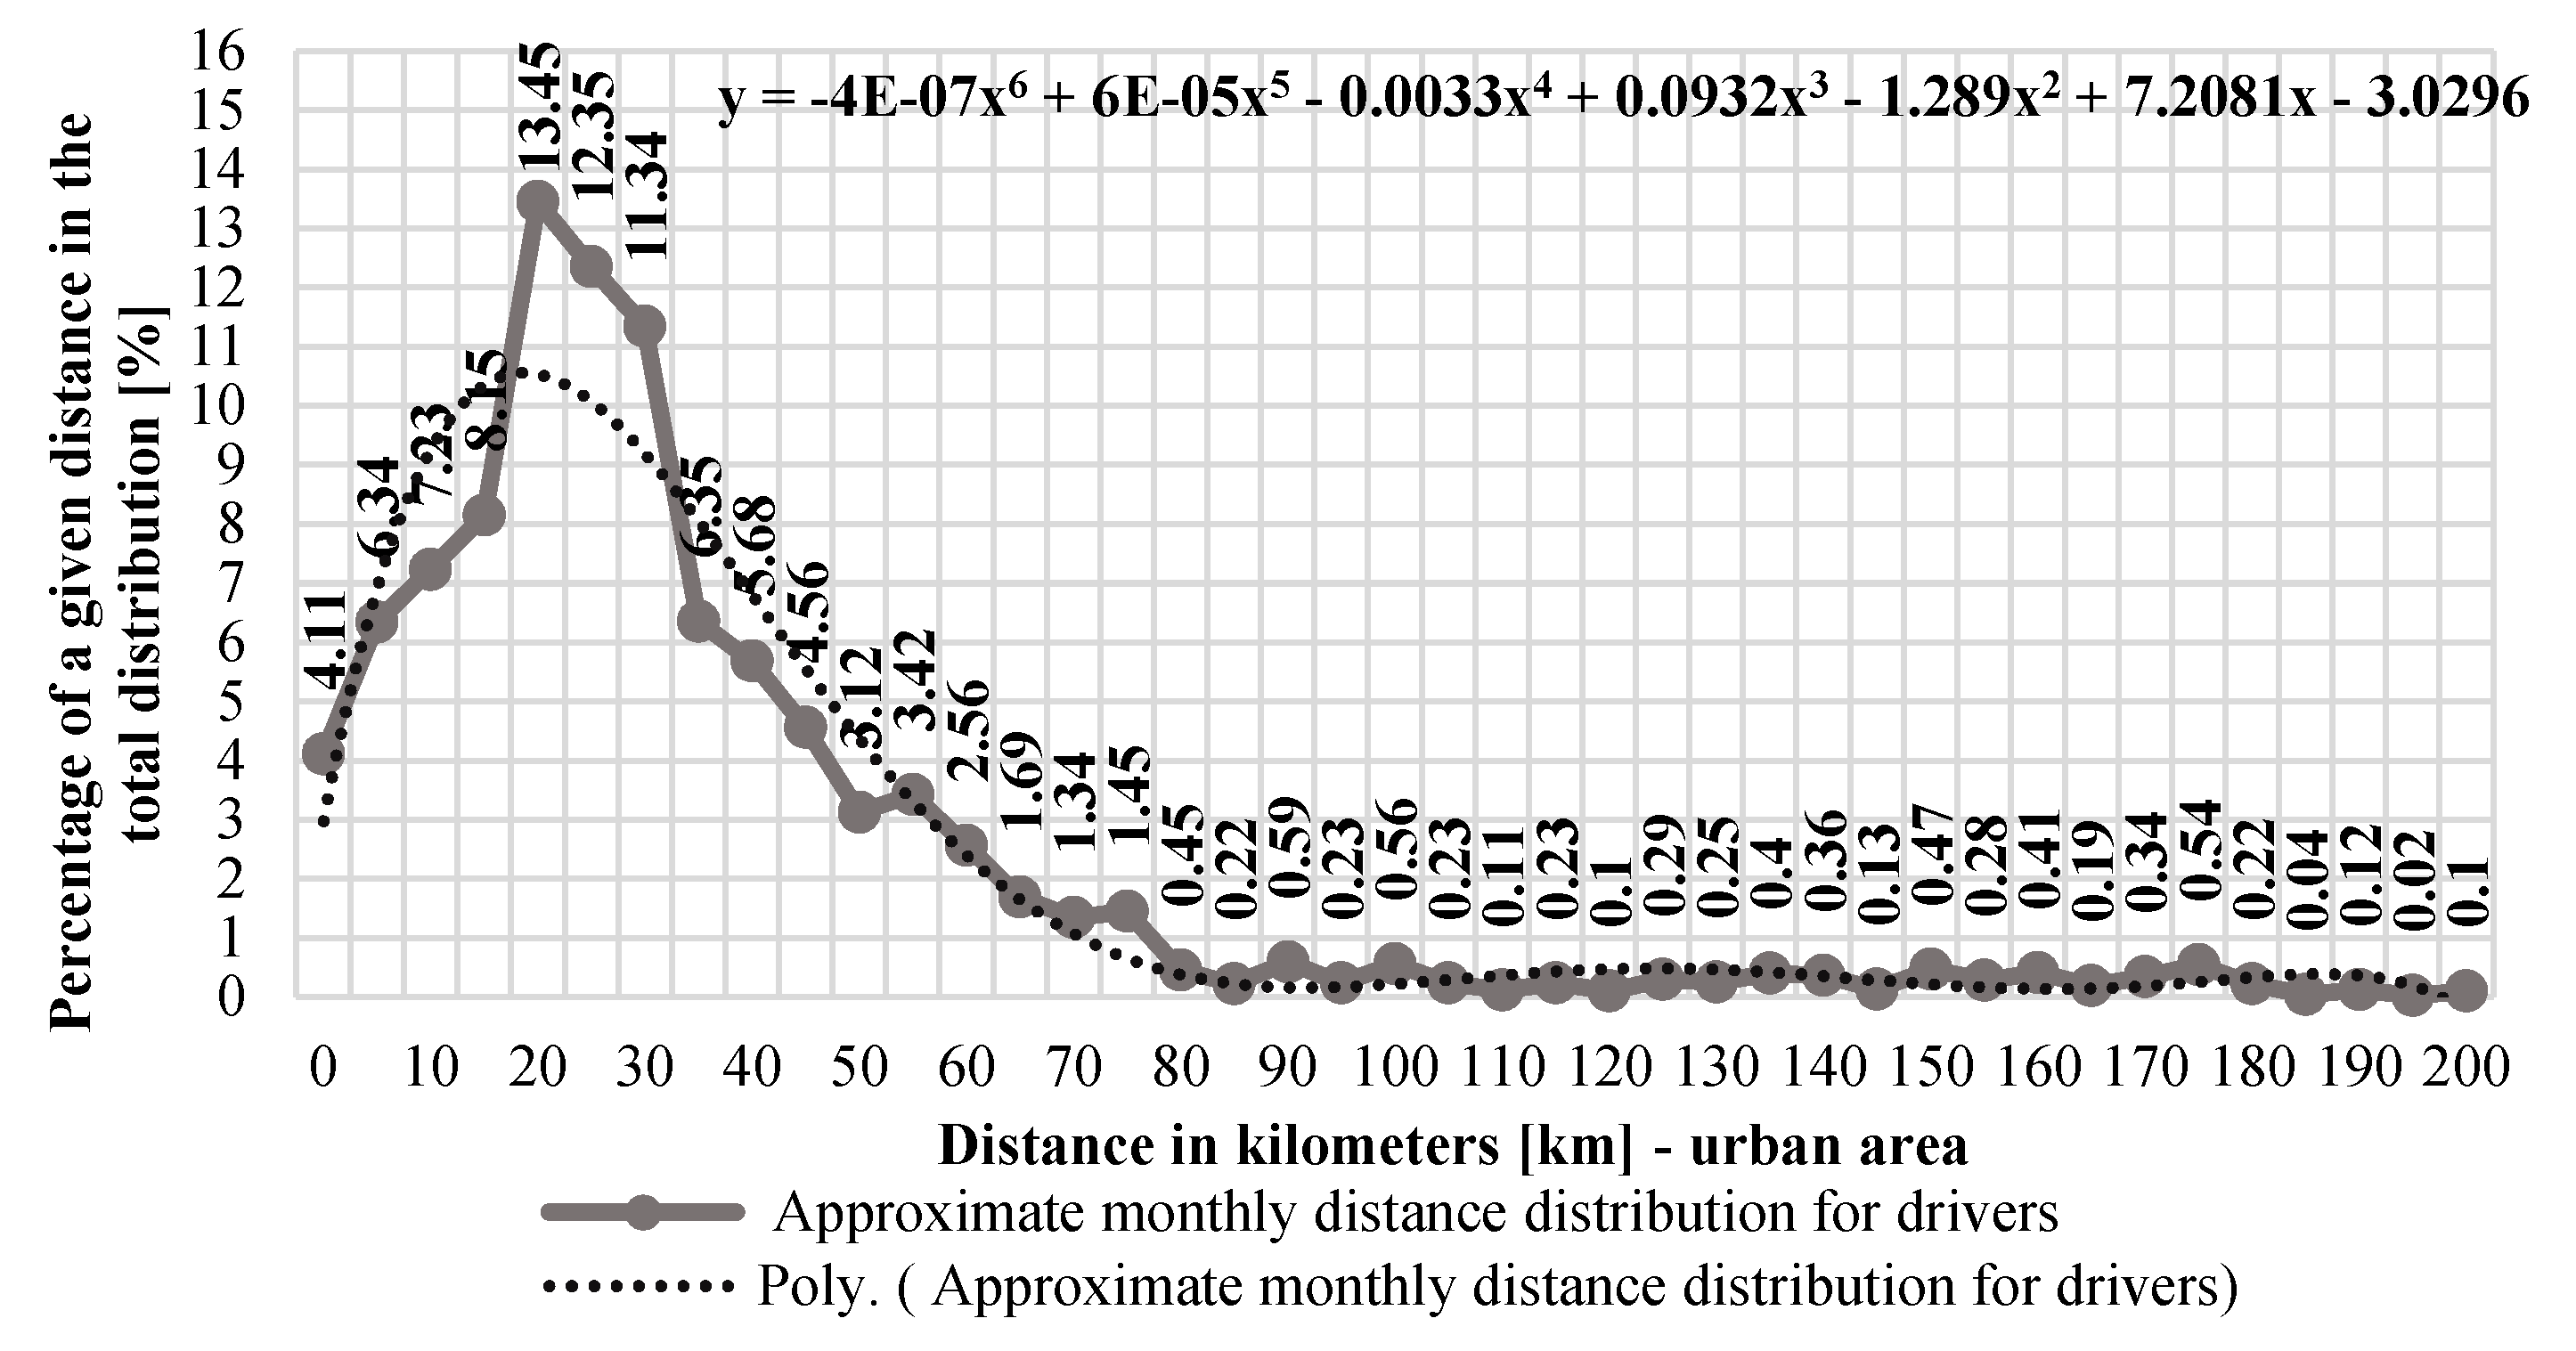
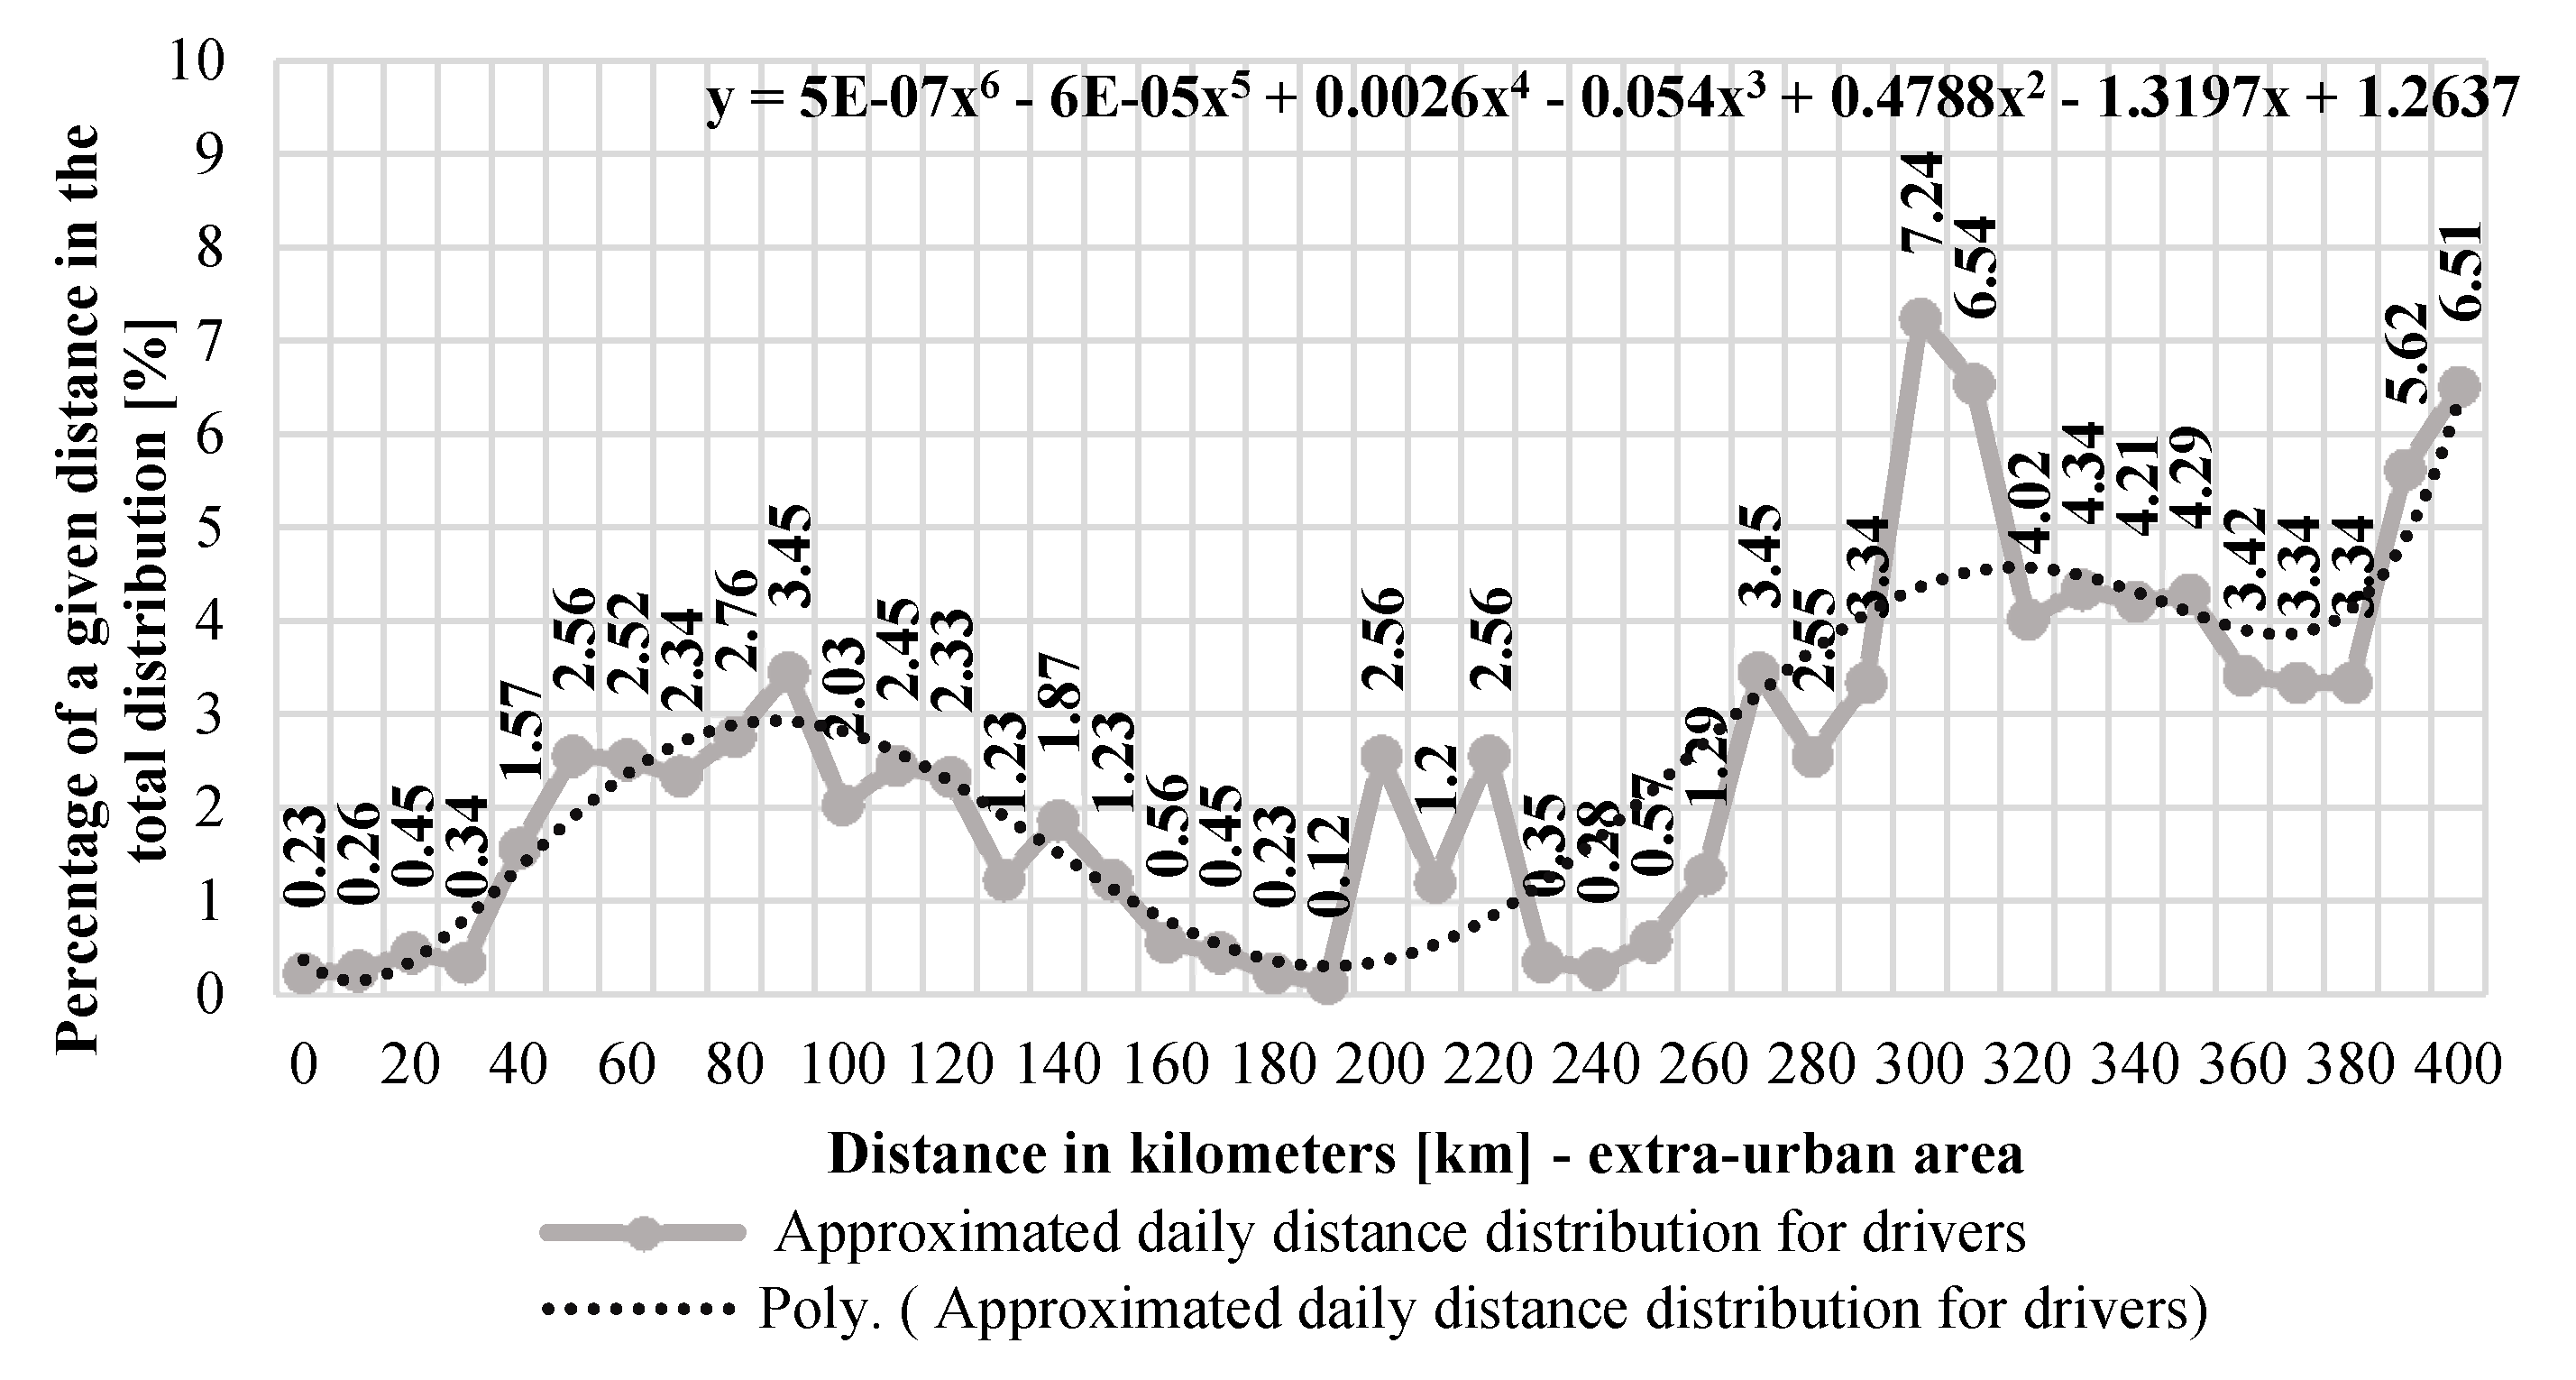
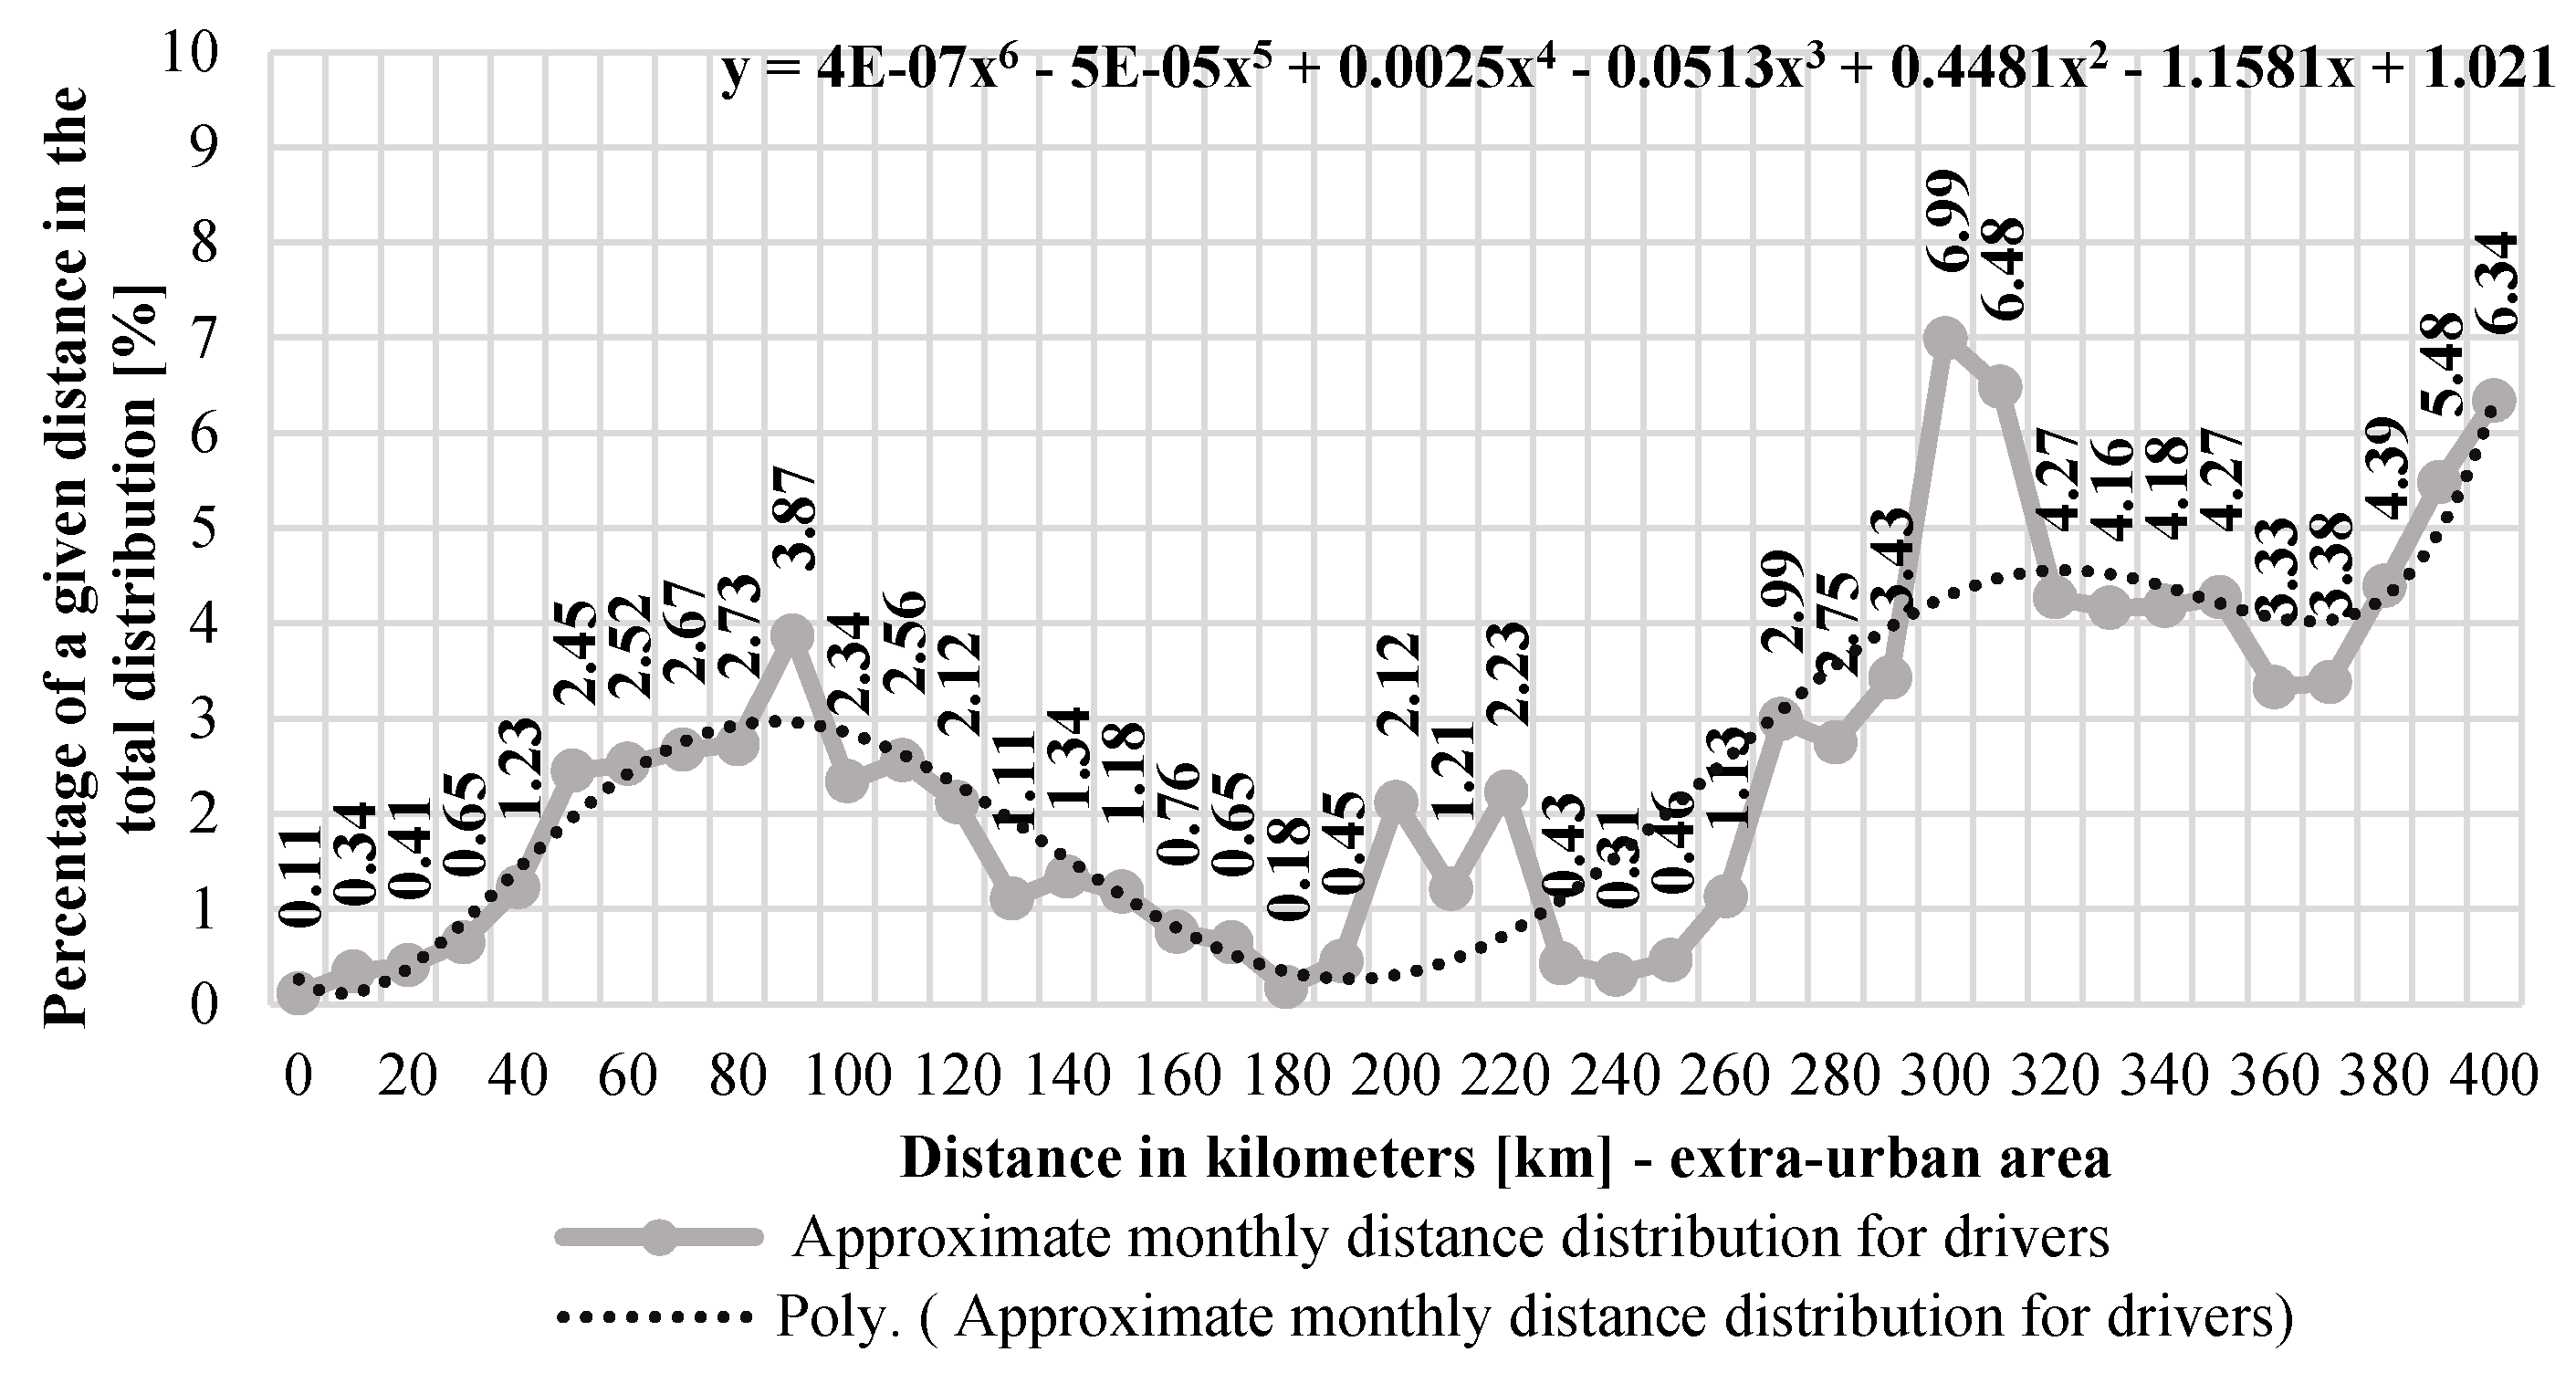
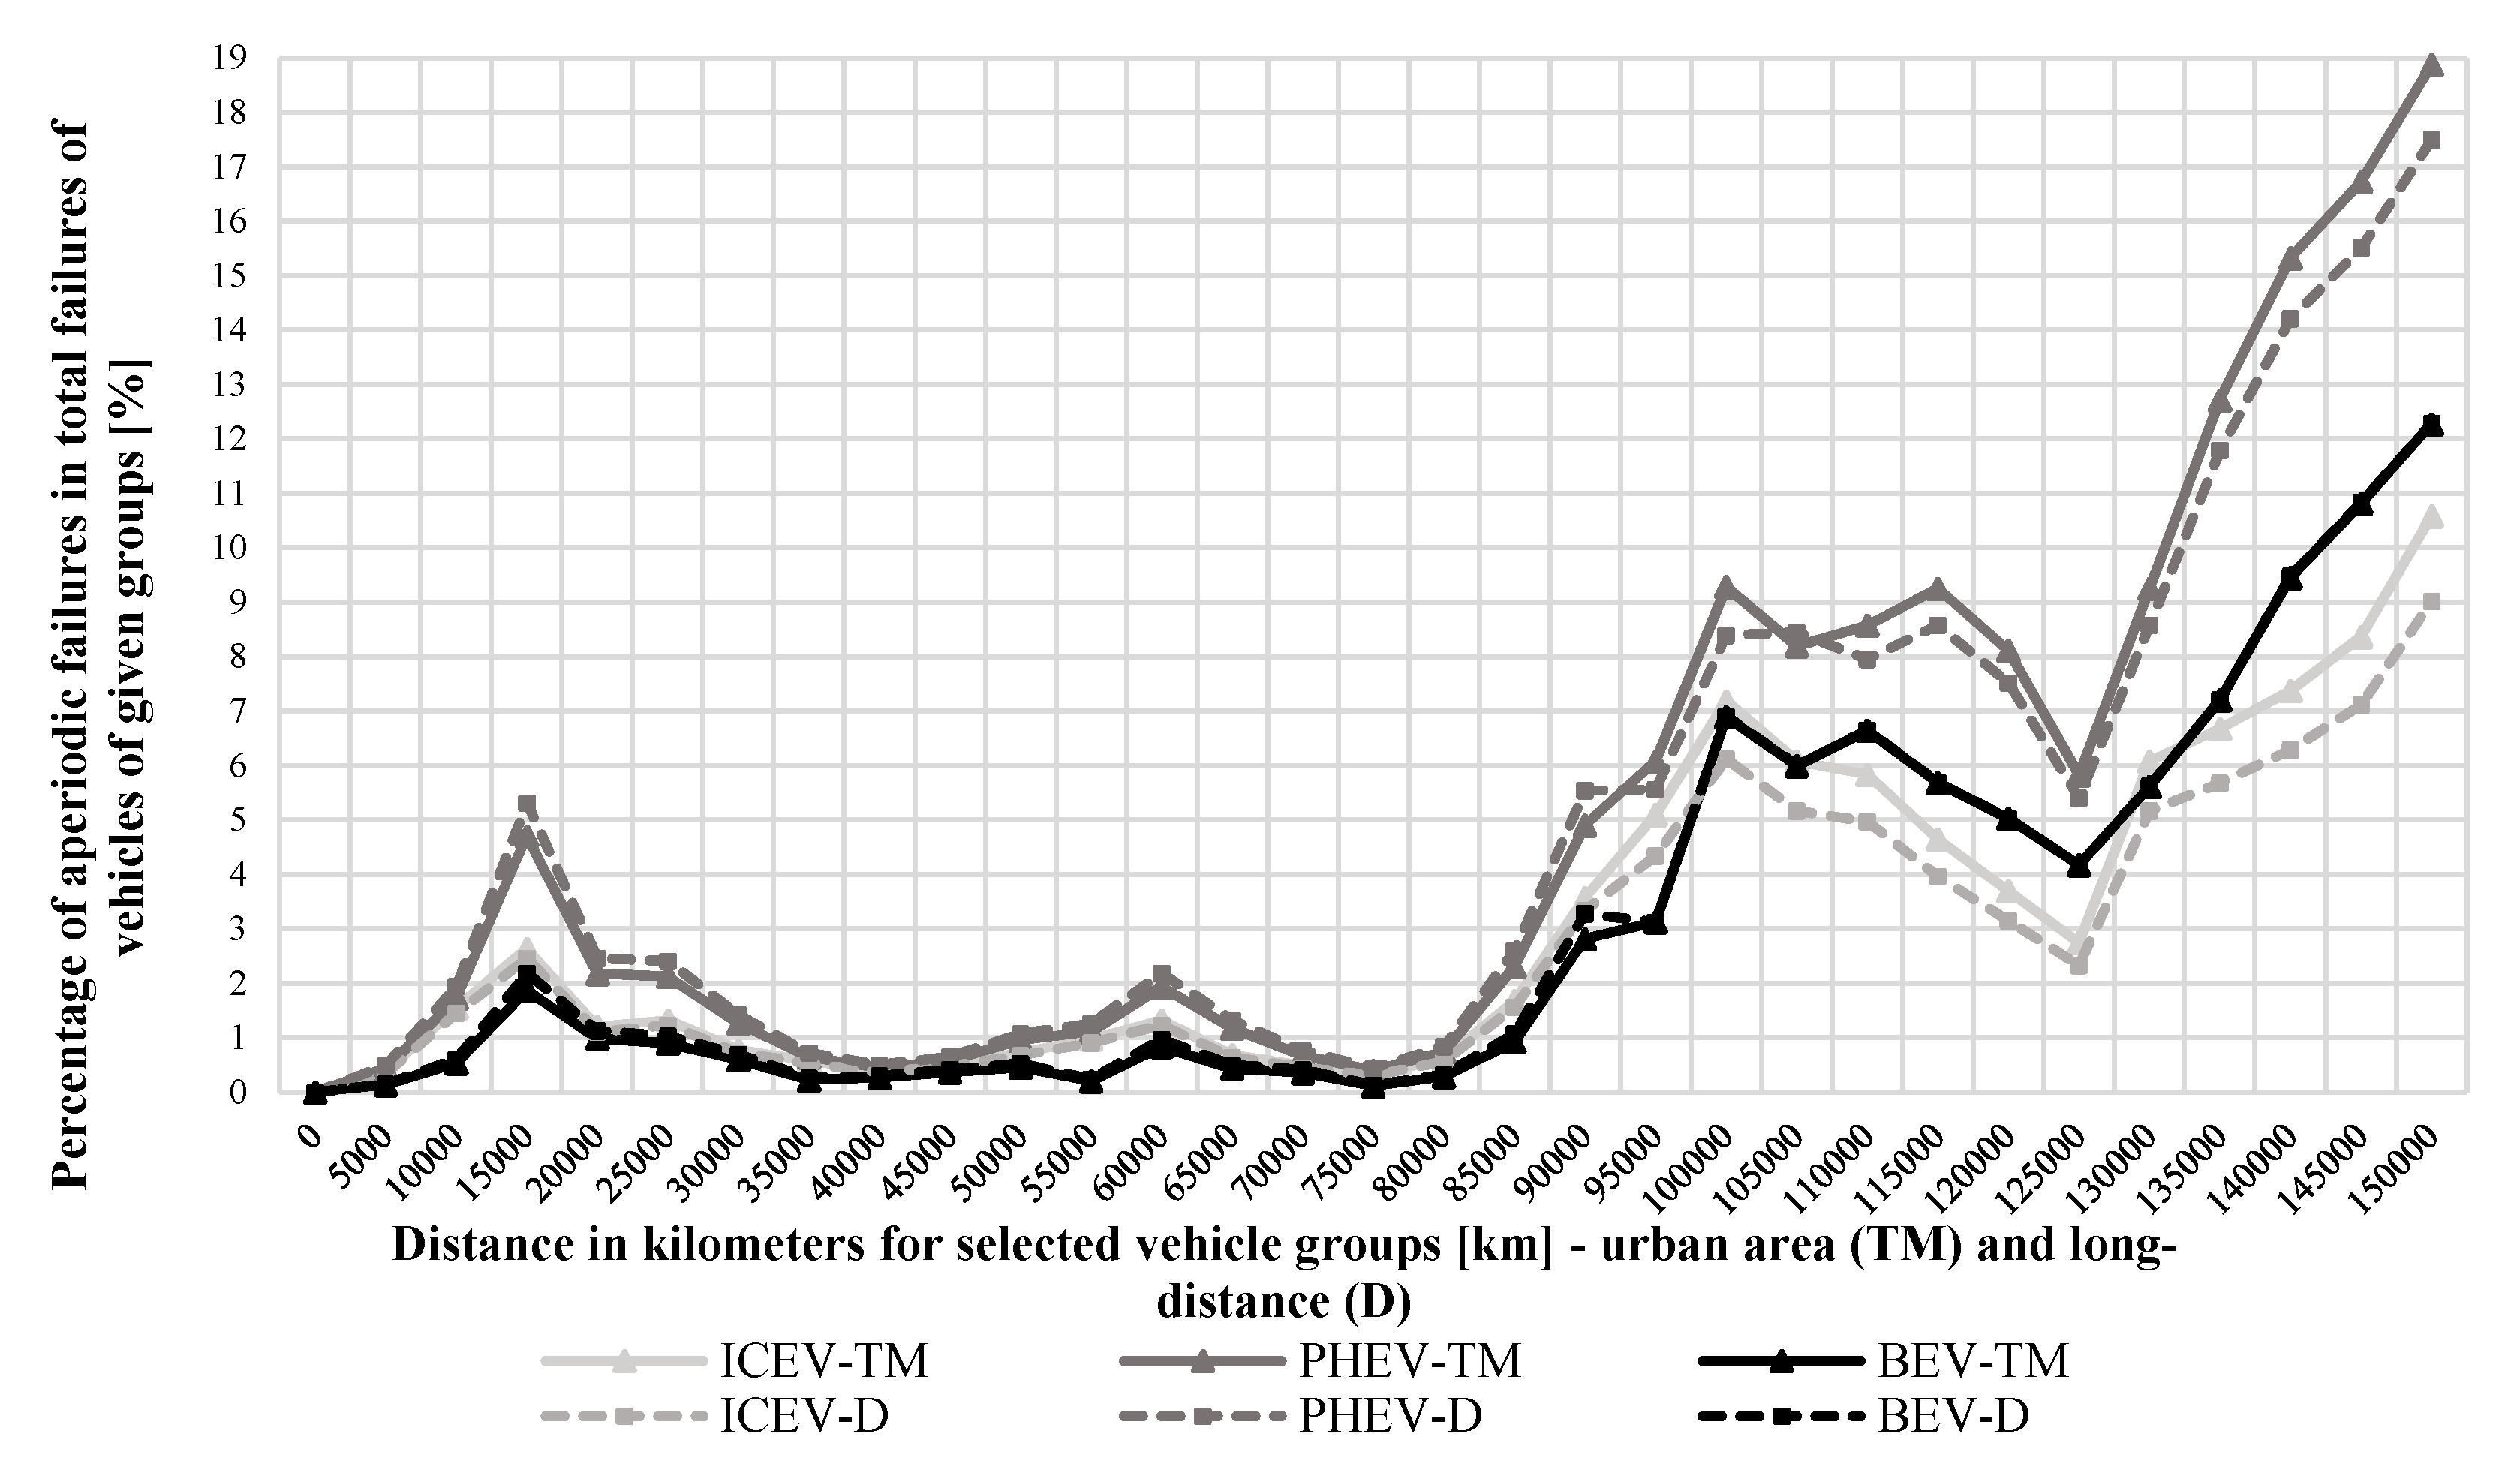
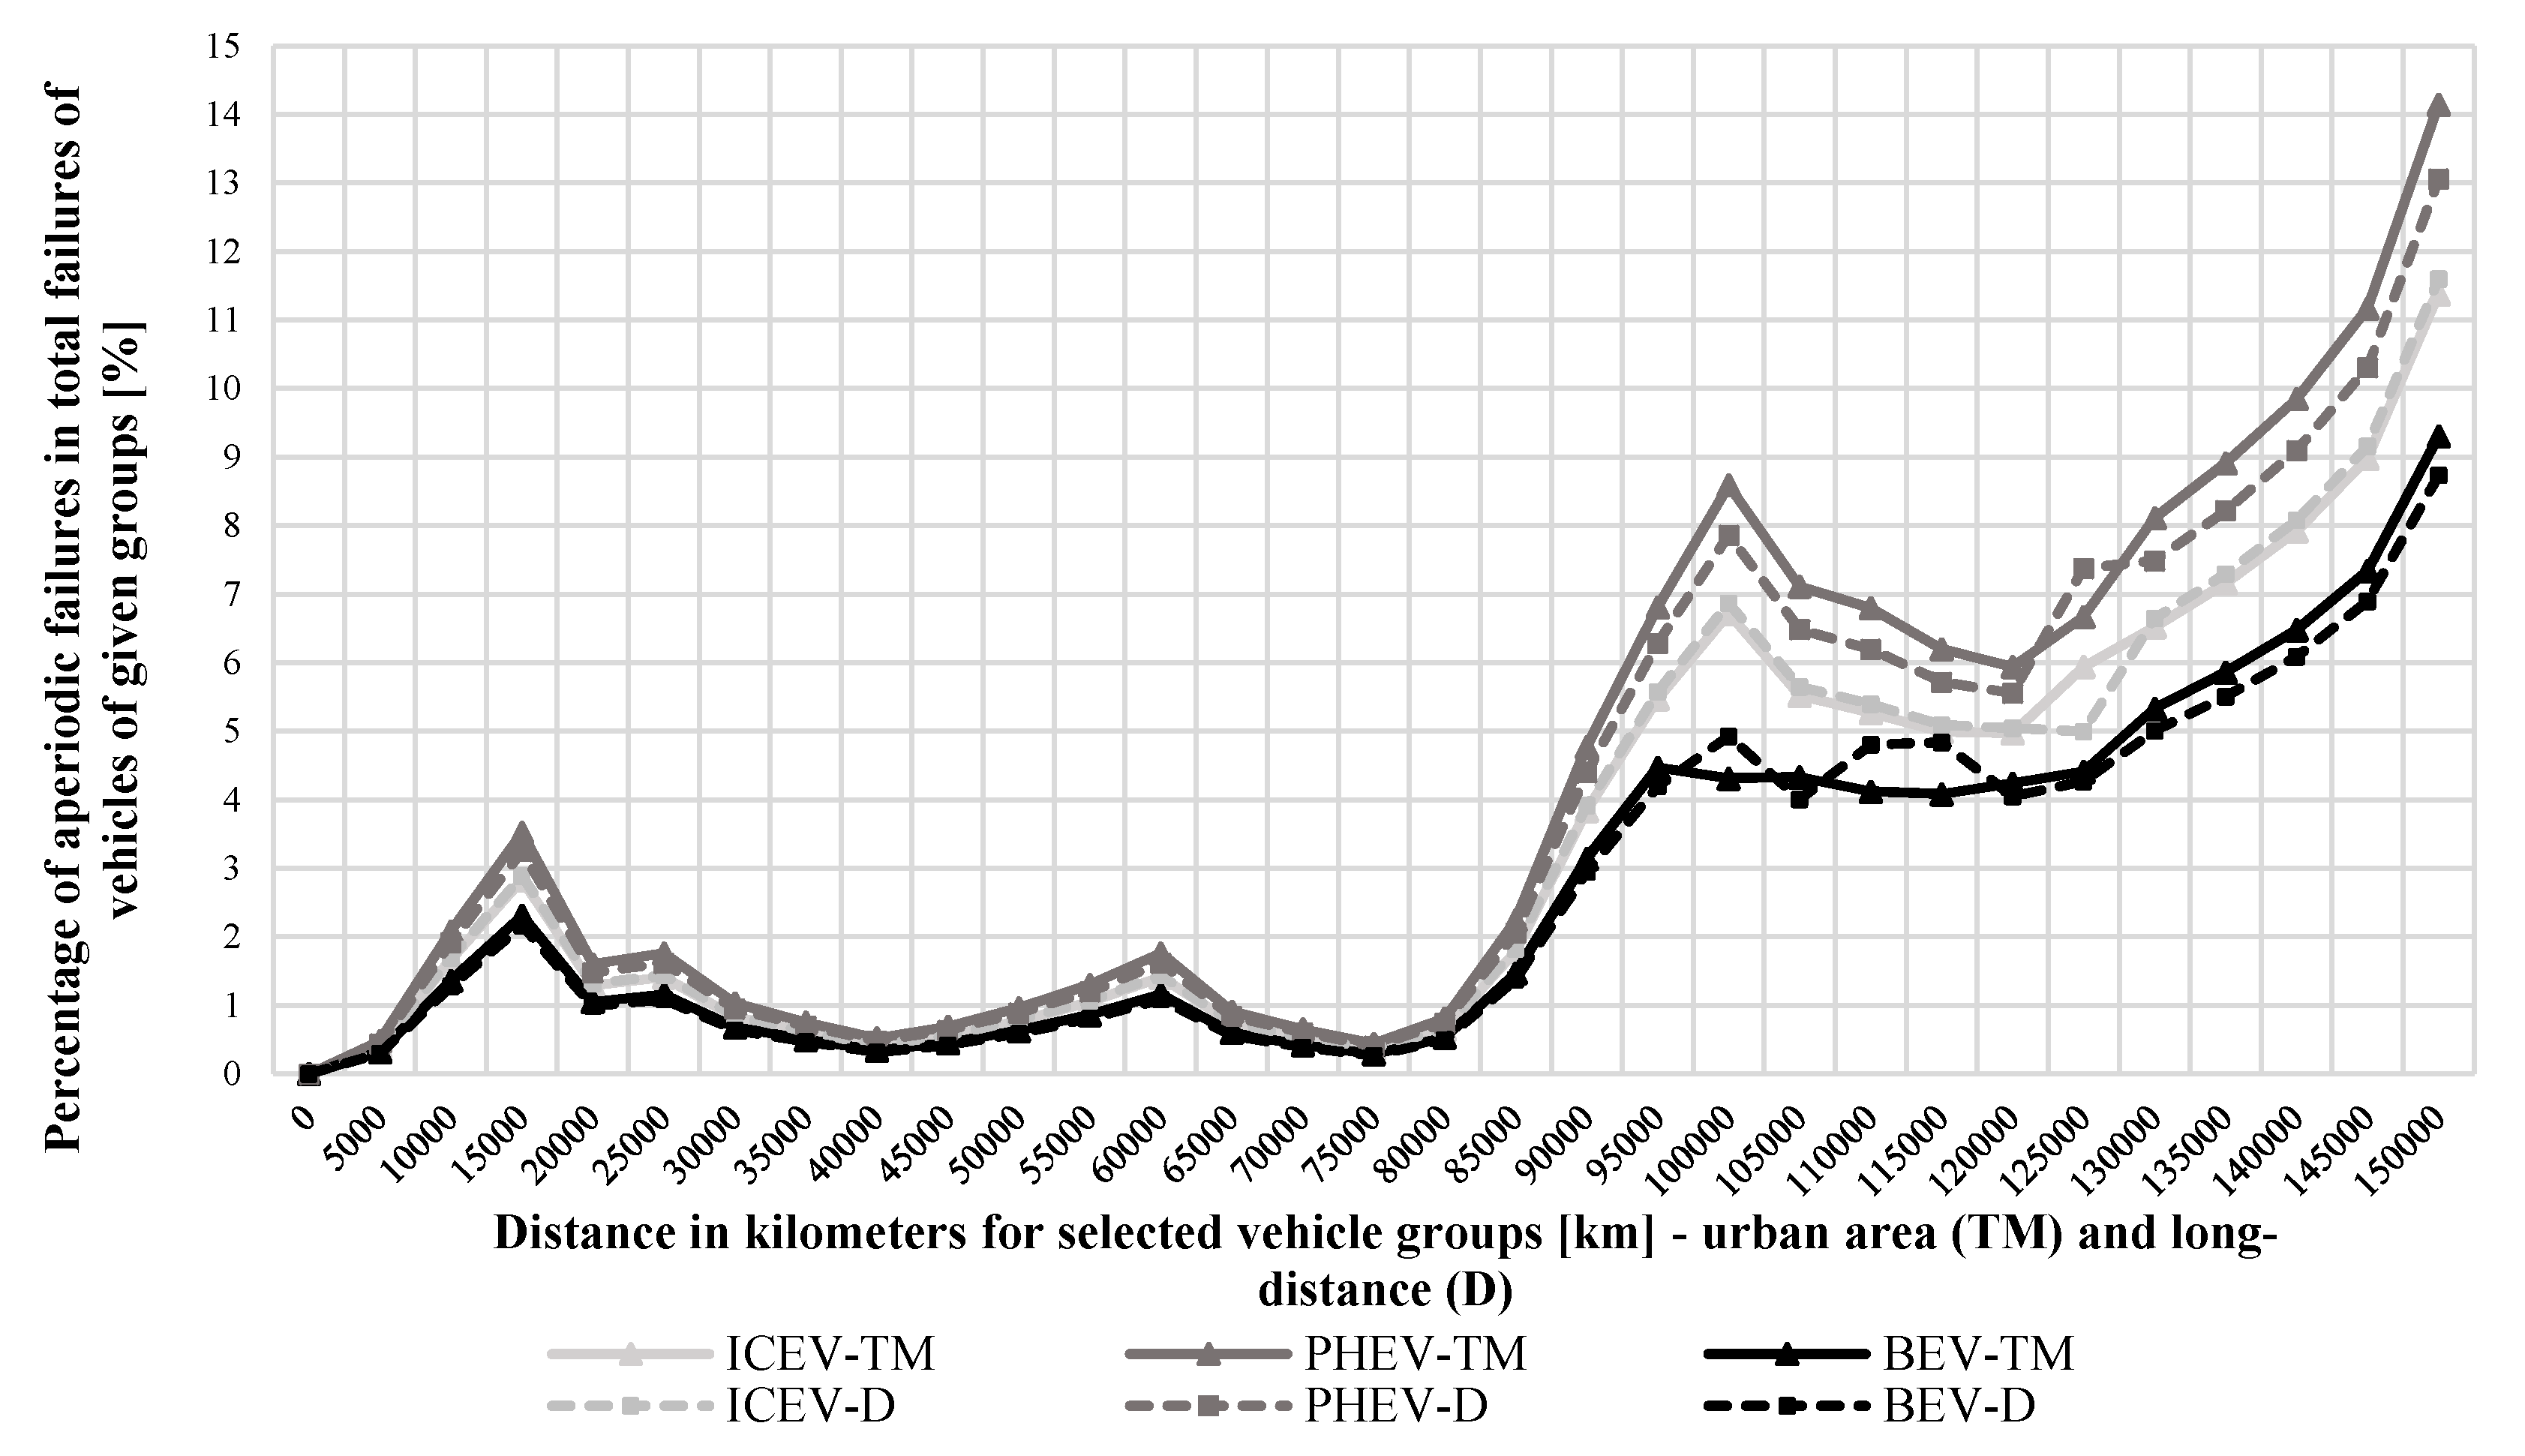
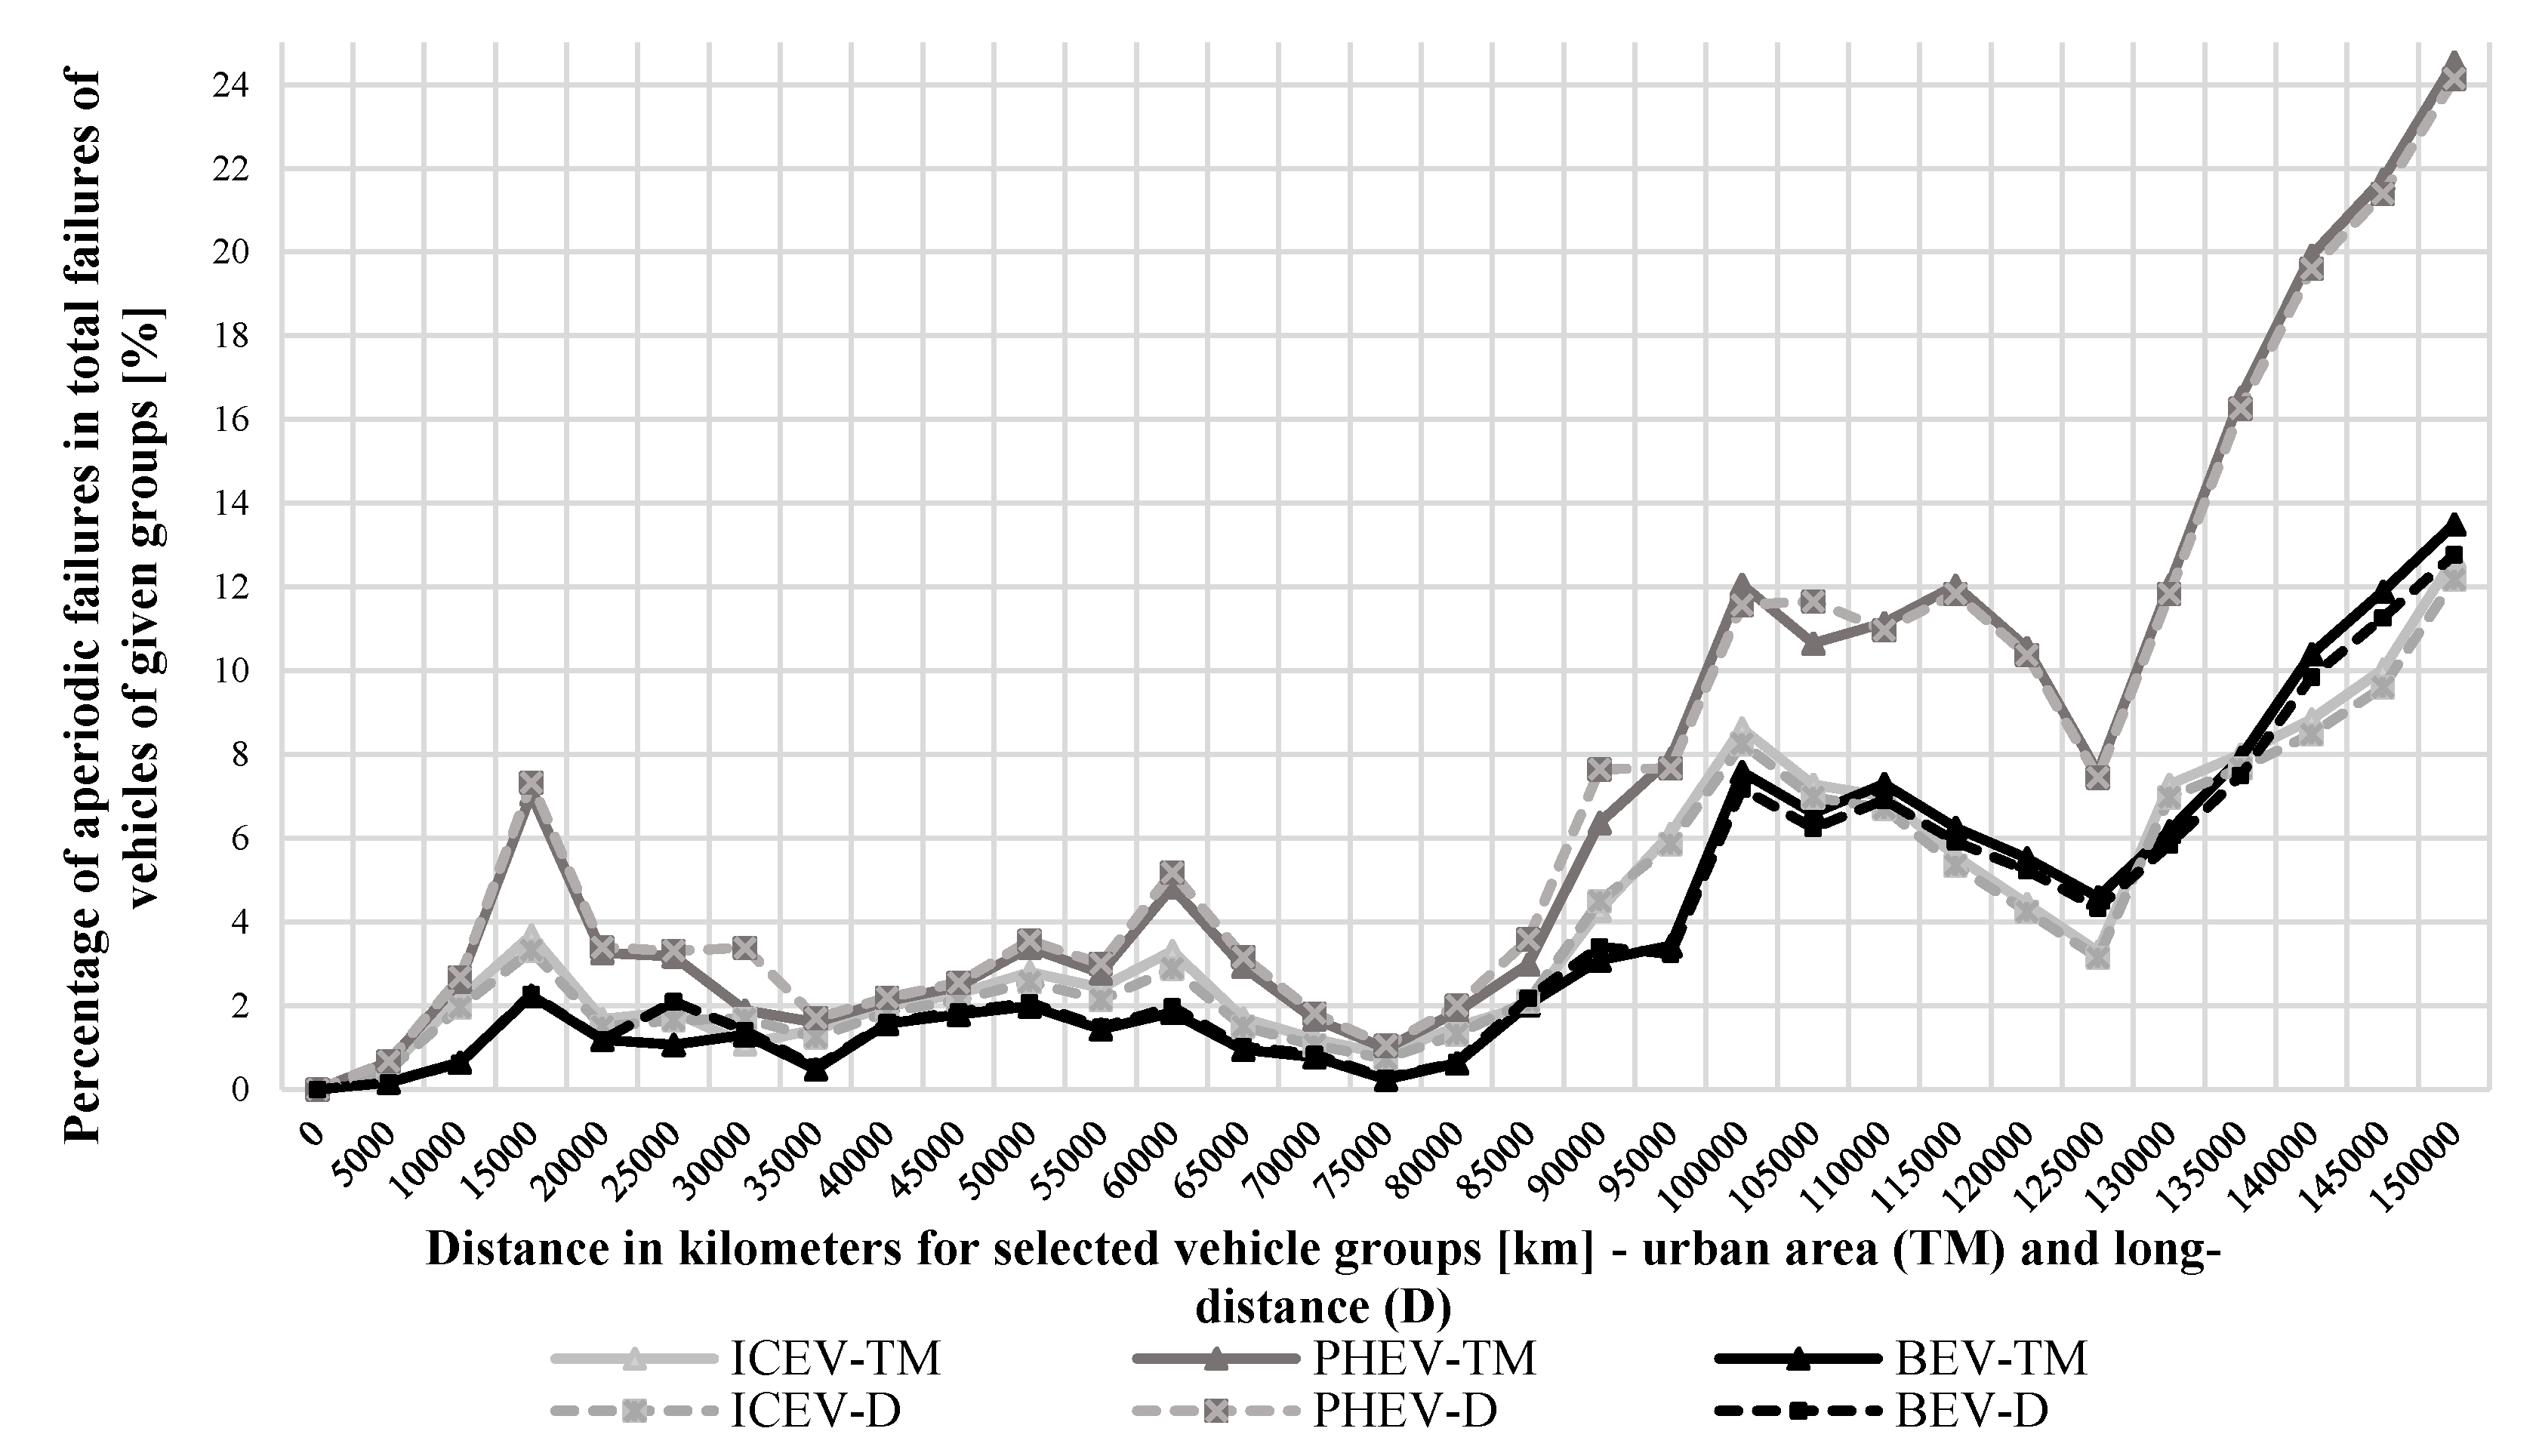
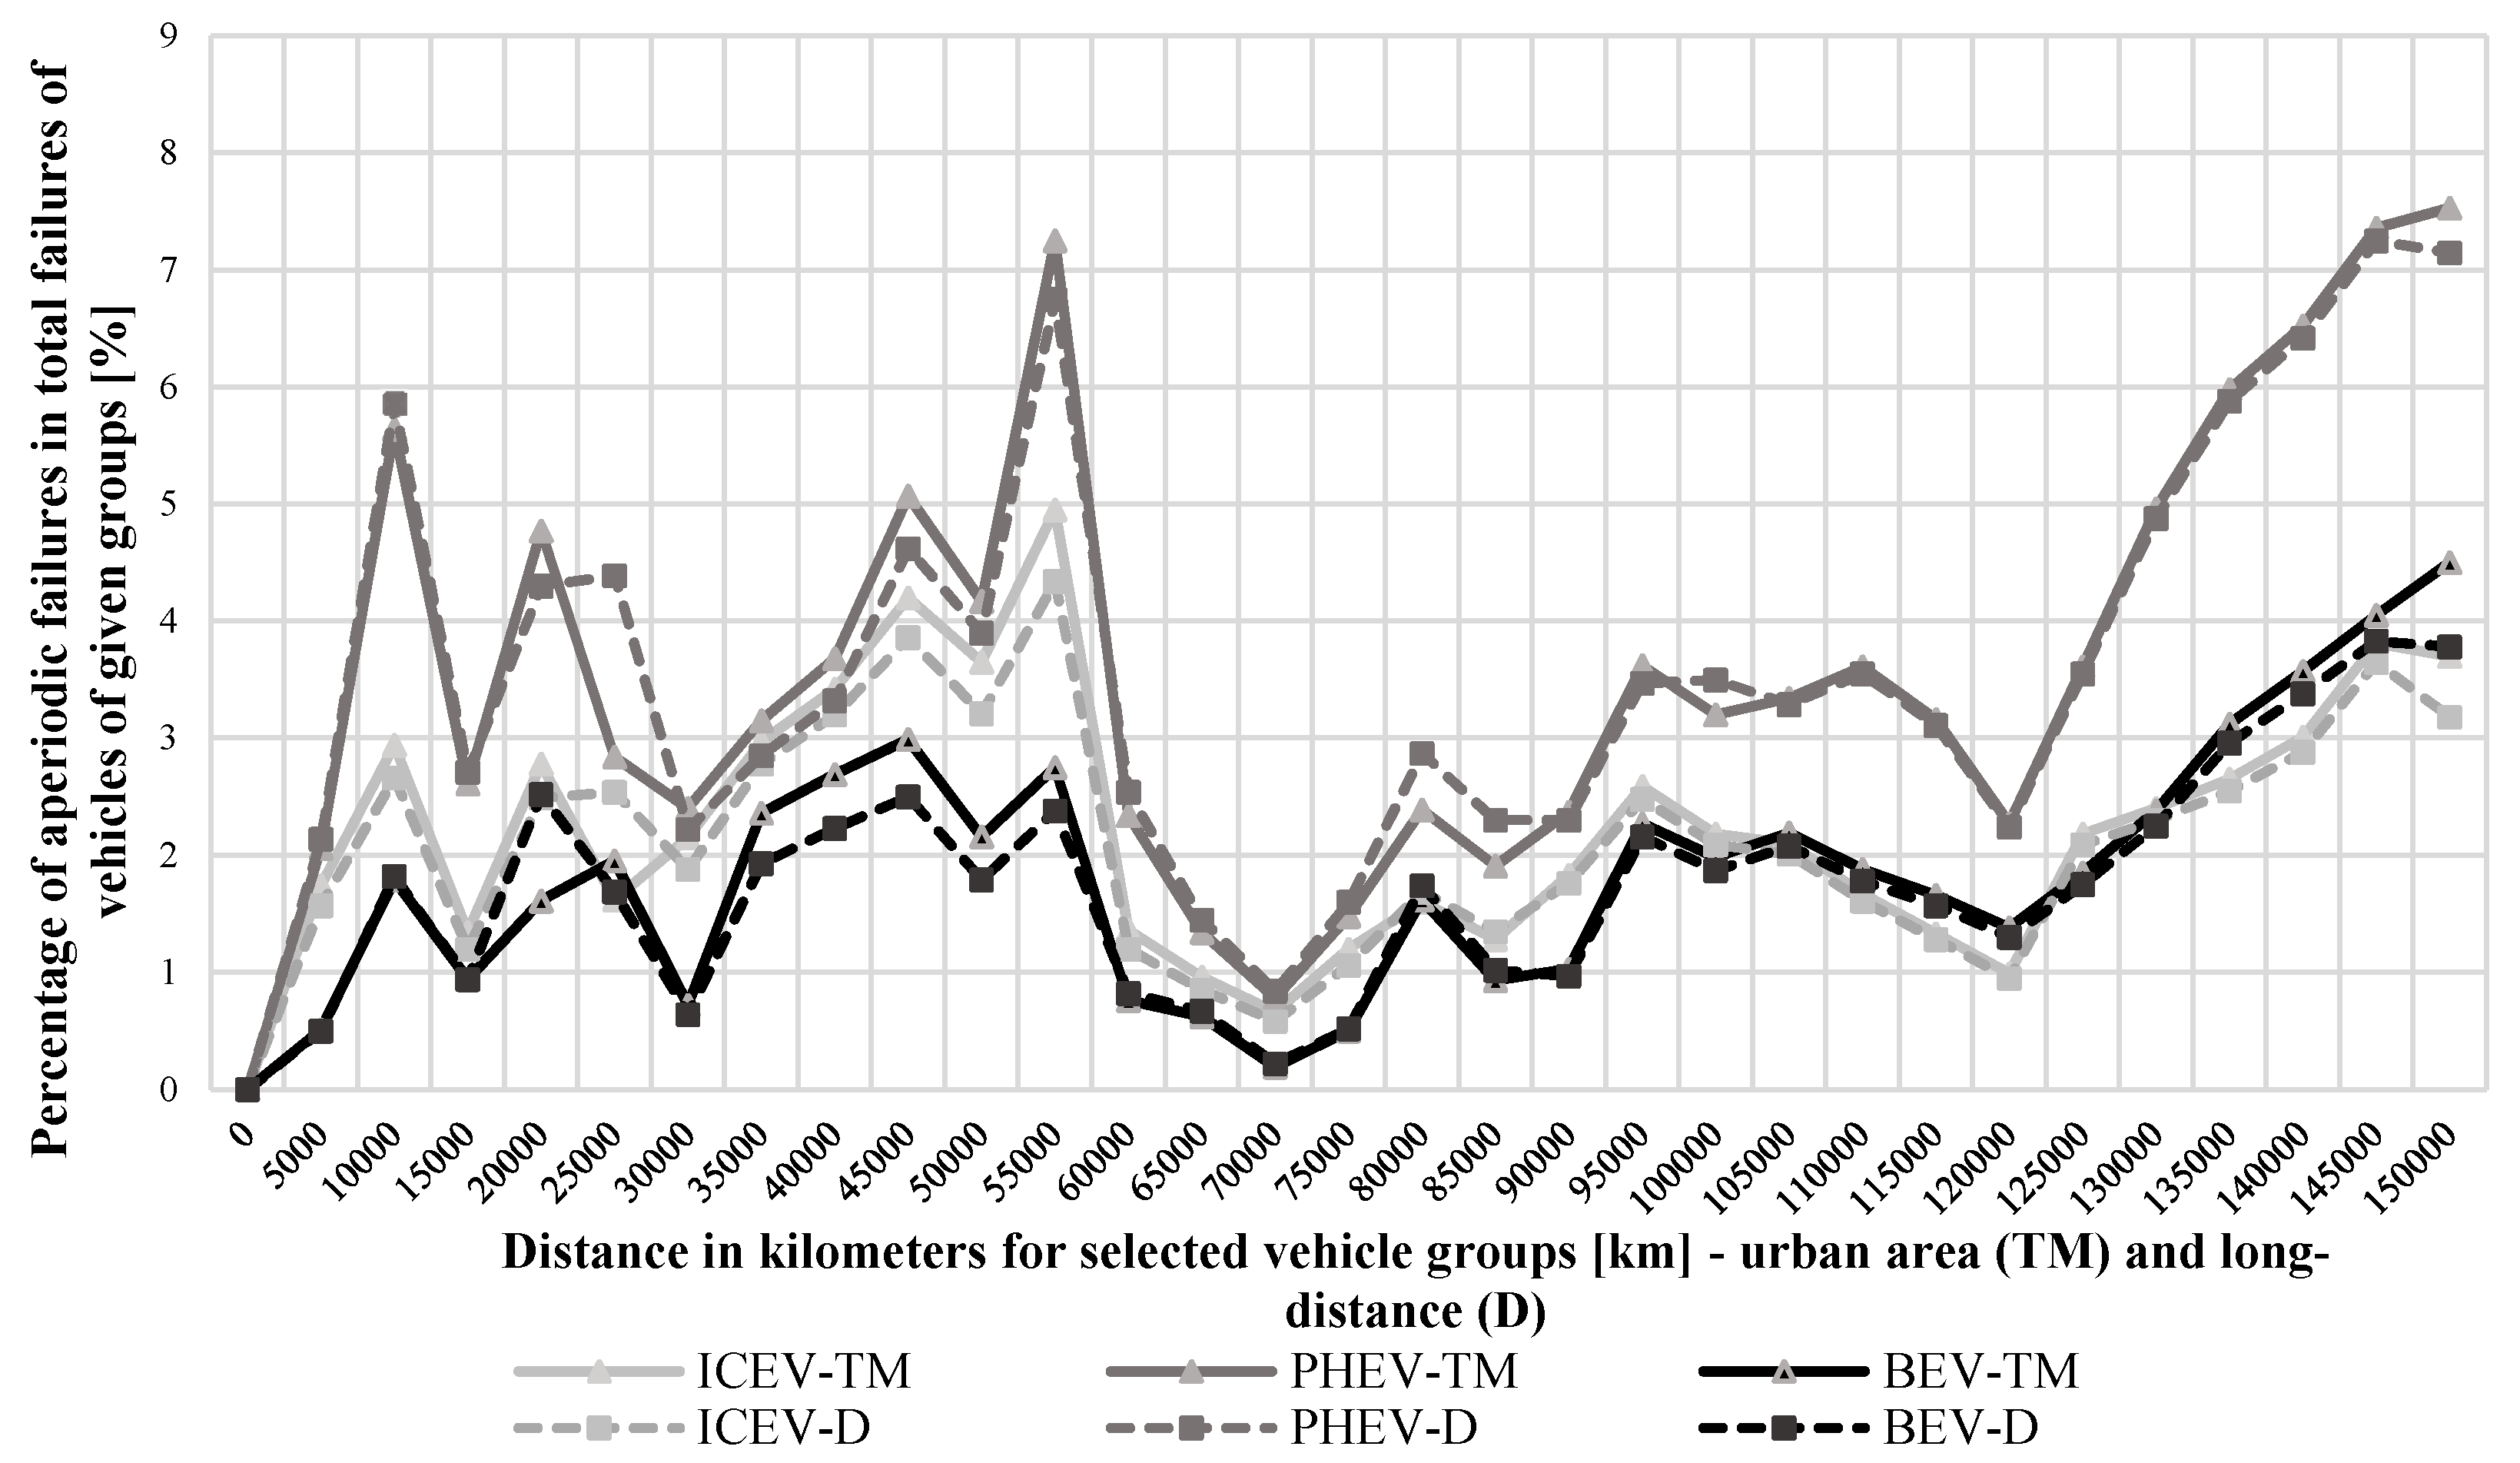
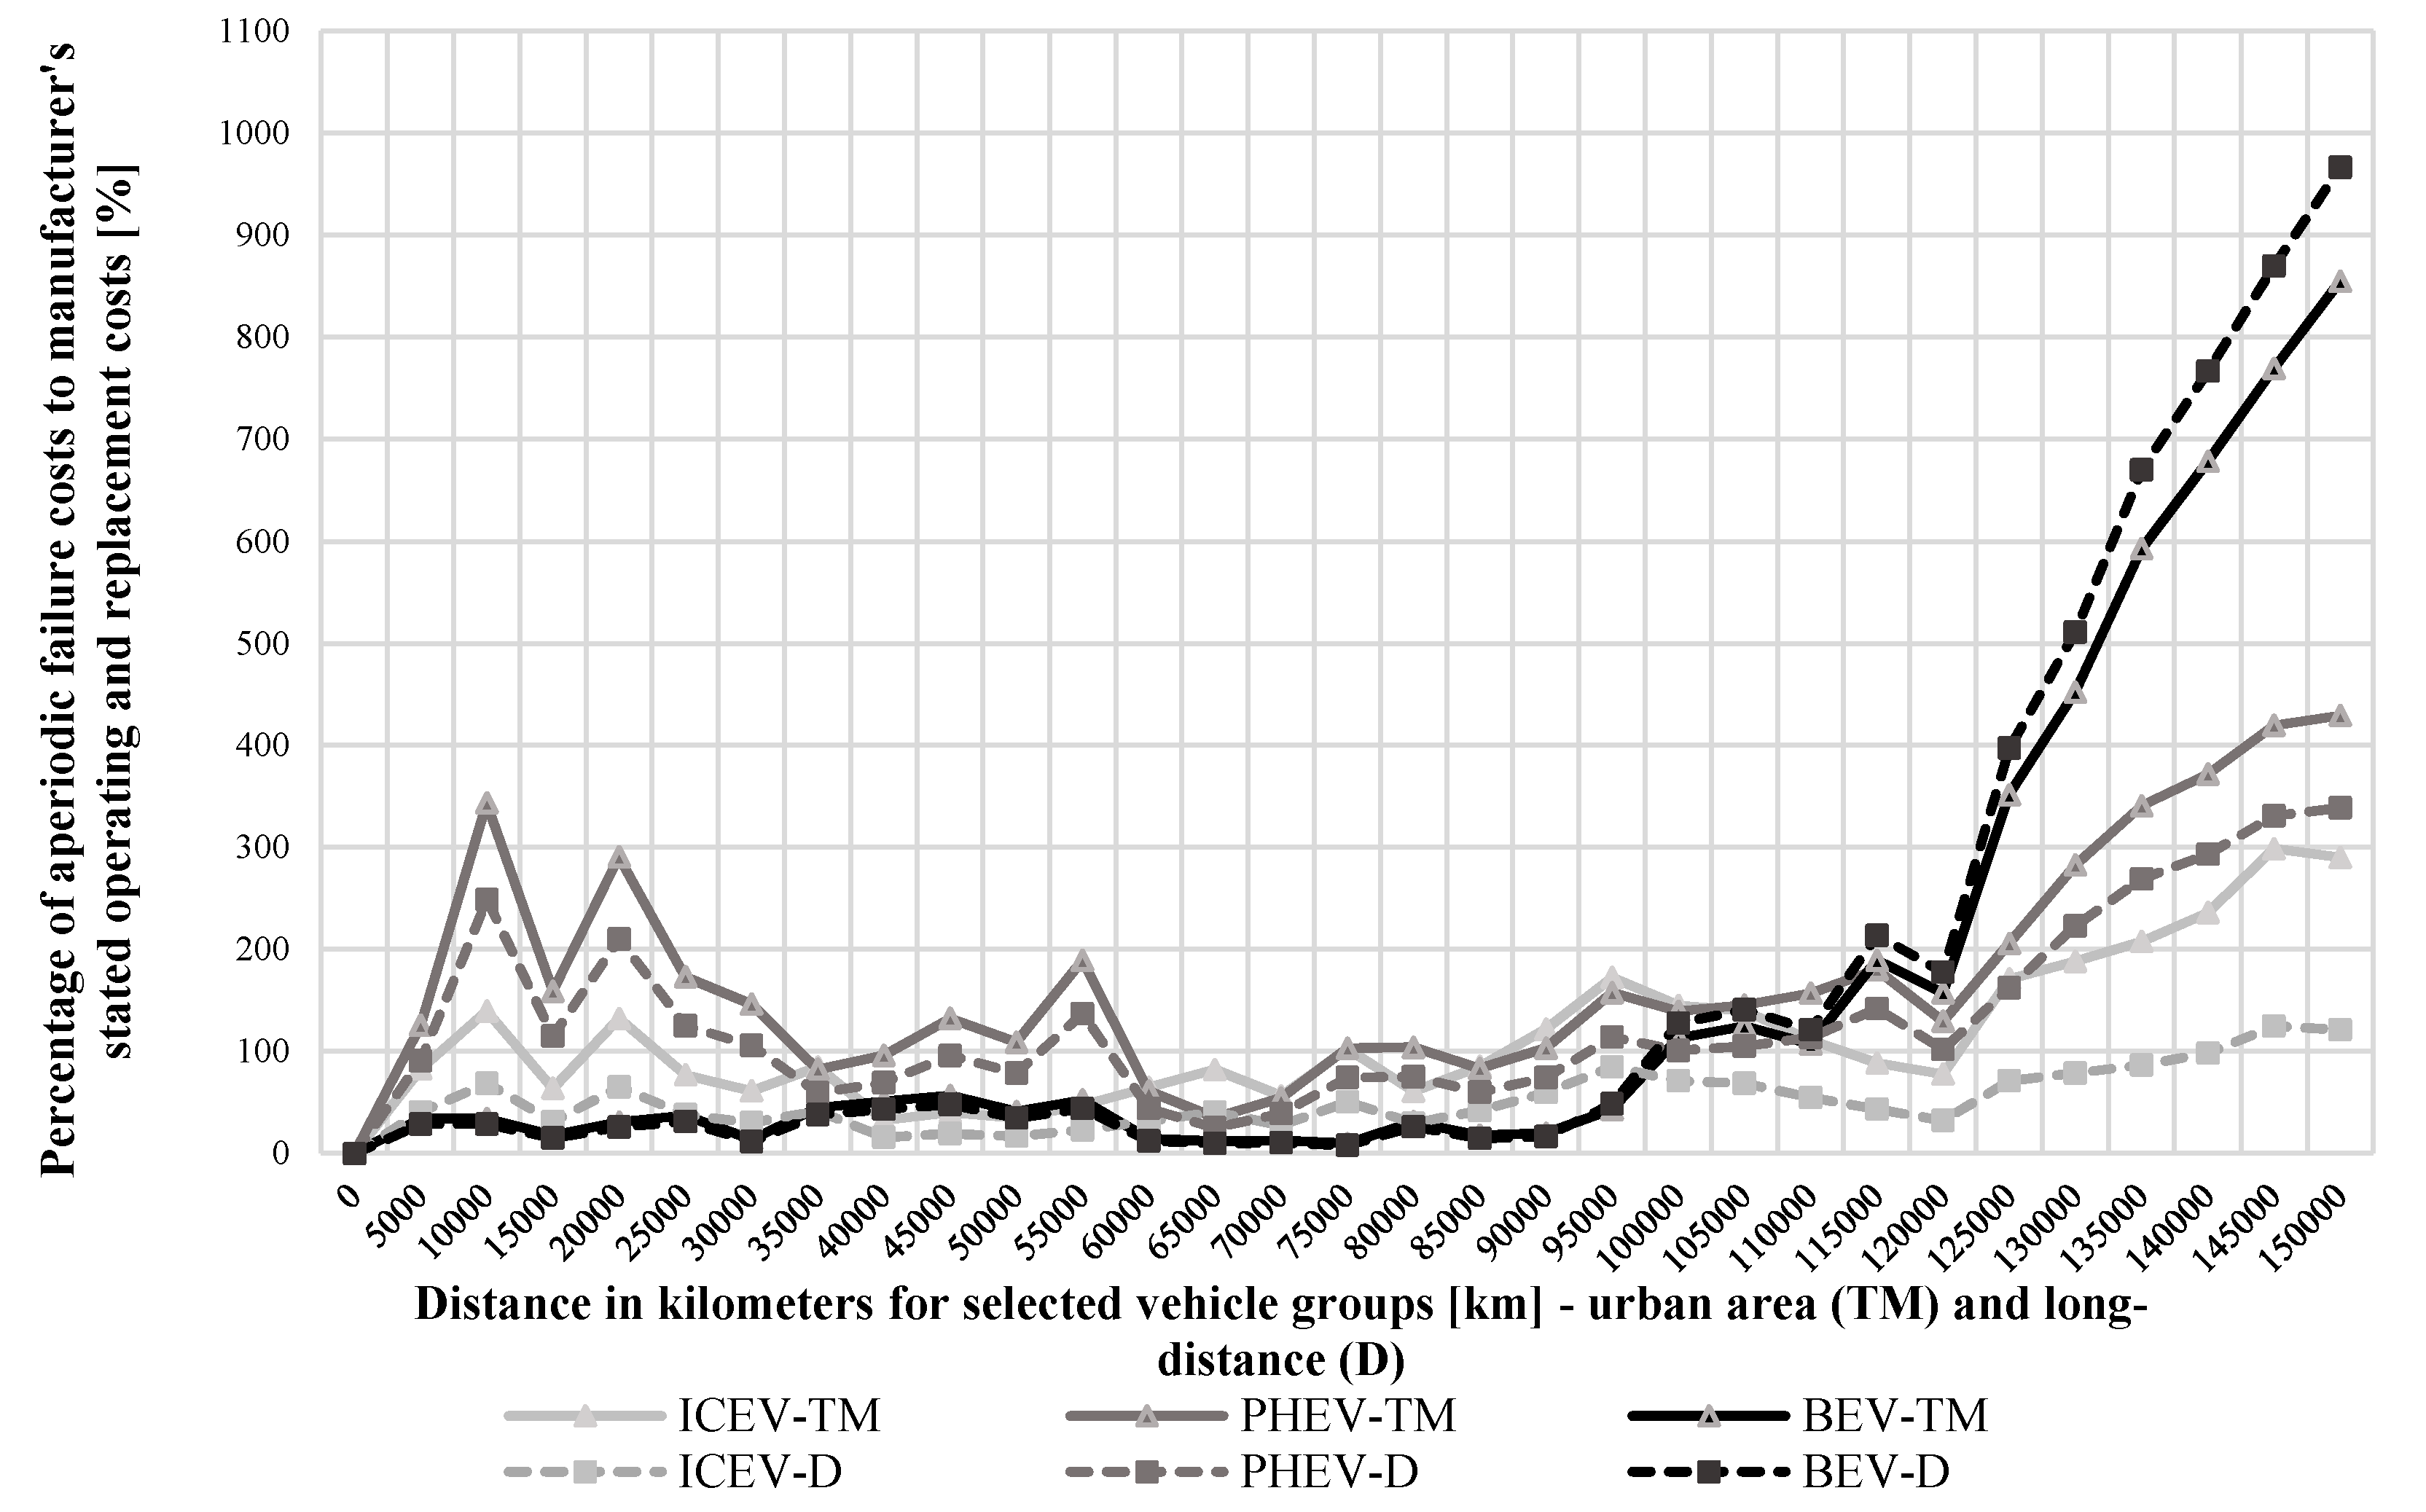
Table 1 shows the characteristics of example vehicles from a given group. The intention was to compare cars with identical values of resistance to motion, total weight, and the power of an electric motor or an electric motor in combination with an internal combustion engine. Therefore, since the given parameters for the PHEV and BEV groups are identical, the effective range of the vehicle was mainly influenced by the energy consumption by individual components. These were included in calculations based on the above mathematical equations. The given algorithmic relations are only examples, and measures have been extended to a more significant number of factors determining the individual efficiency of a given drive system. By taking into account aperiodic phenomena in the general data analysis, it is possible to decide on the economic efficiency of a given group of vehicles. Such studies were carried out on long-distance routes and in urban mode over a more extended vehicle operation of approximately 150,000 km. These data are presented in
Figure 1,
Figure 2,
Figure 3 and
Figure 4. Listed below are a few example speed profiles in the daily process. Their repeatability is high. Hence, the conditions of using a given drive system are very similar, which translates into high reliability of statistical data over a more extended period. The approximate operating conditions of individual drive systems, drive train, and energy management systems are necessary for the correct assessment of economic effects. Speed profiles were prepared for 24 vehicles, and average results were calculated in a given group (urban or extraurban). For this purpose, advanced GPS devices were used, with the possibility of recording driving techniques and locations. The analysis of aperiodic factors, such as unforeseen damage to the power and drive systems, which determine the economy of ICEVs, PHEVs, and BEVs, was carried out for a group of 1200 vehicles operating in two areas (urban and long-distance). Data were obtained from websites dealing with servicing selected groups of cars, with their breakdown by comfort class.
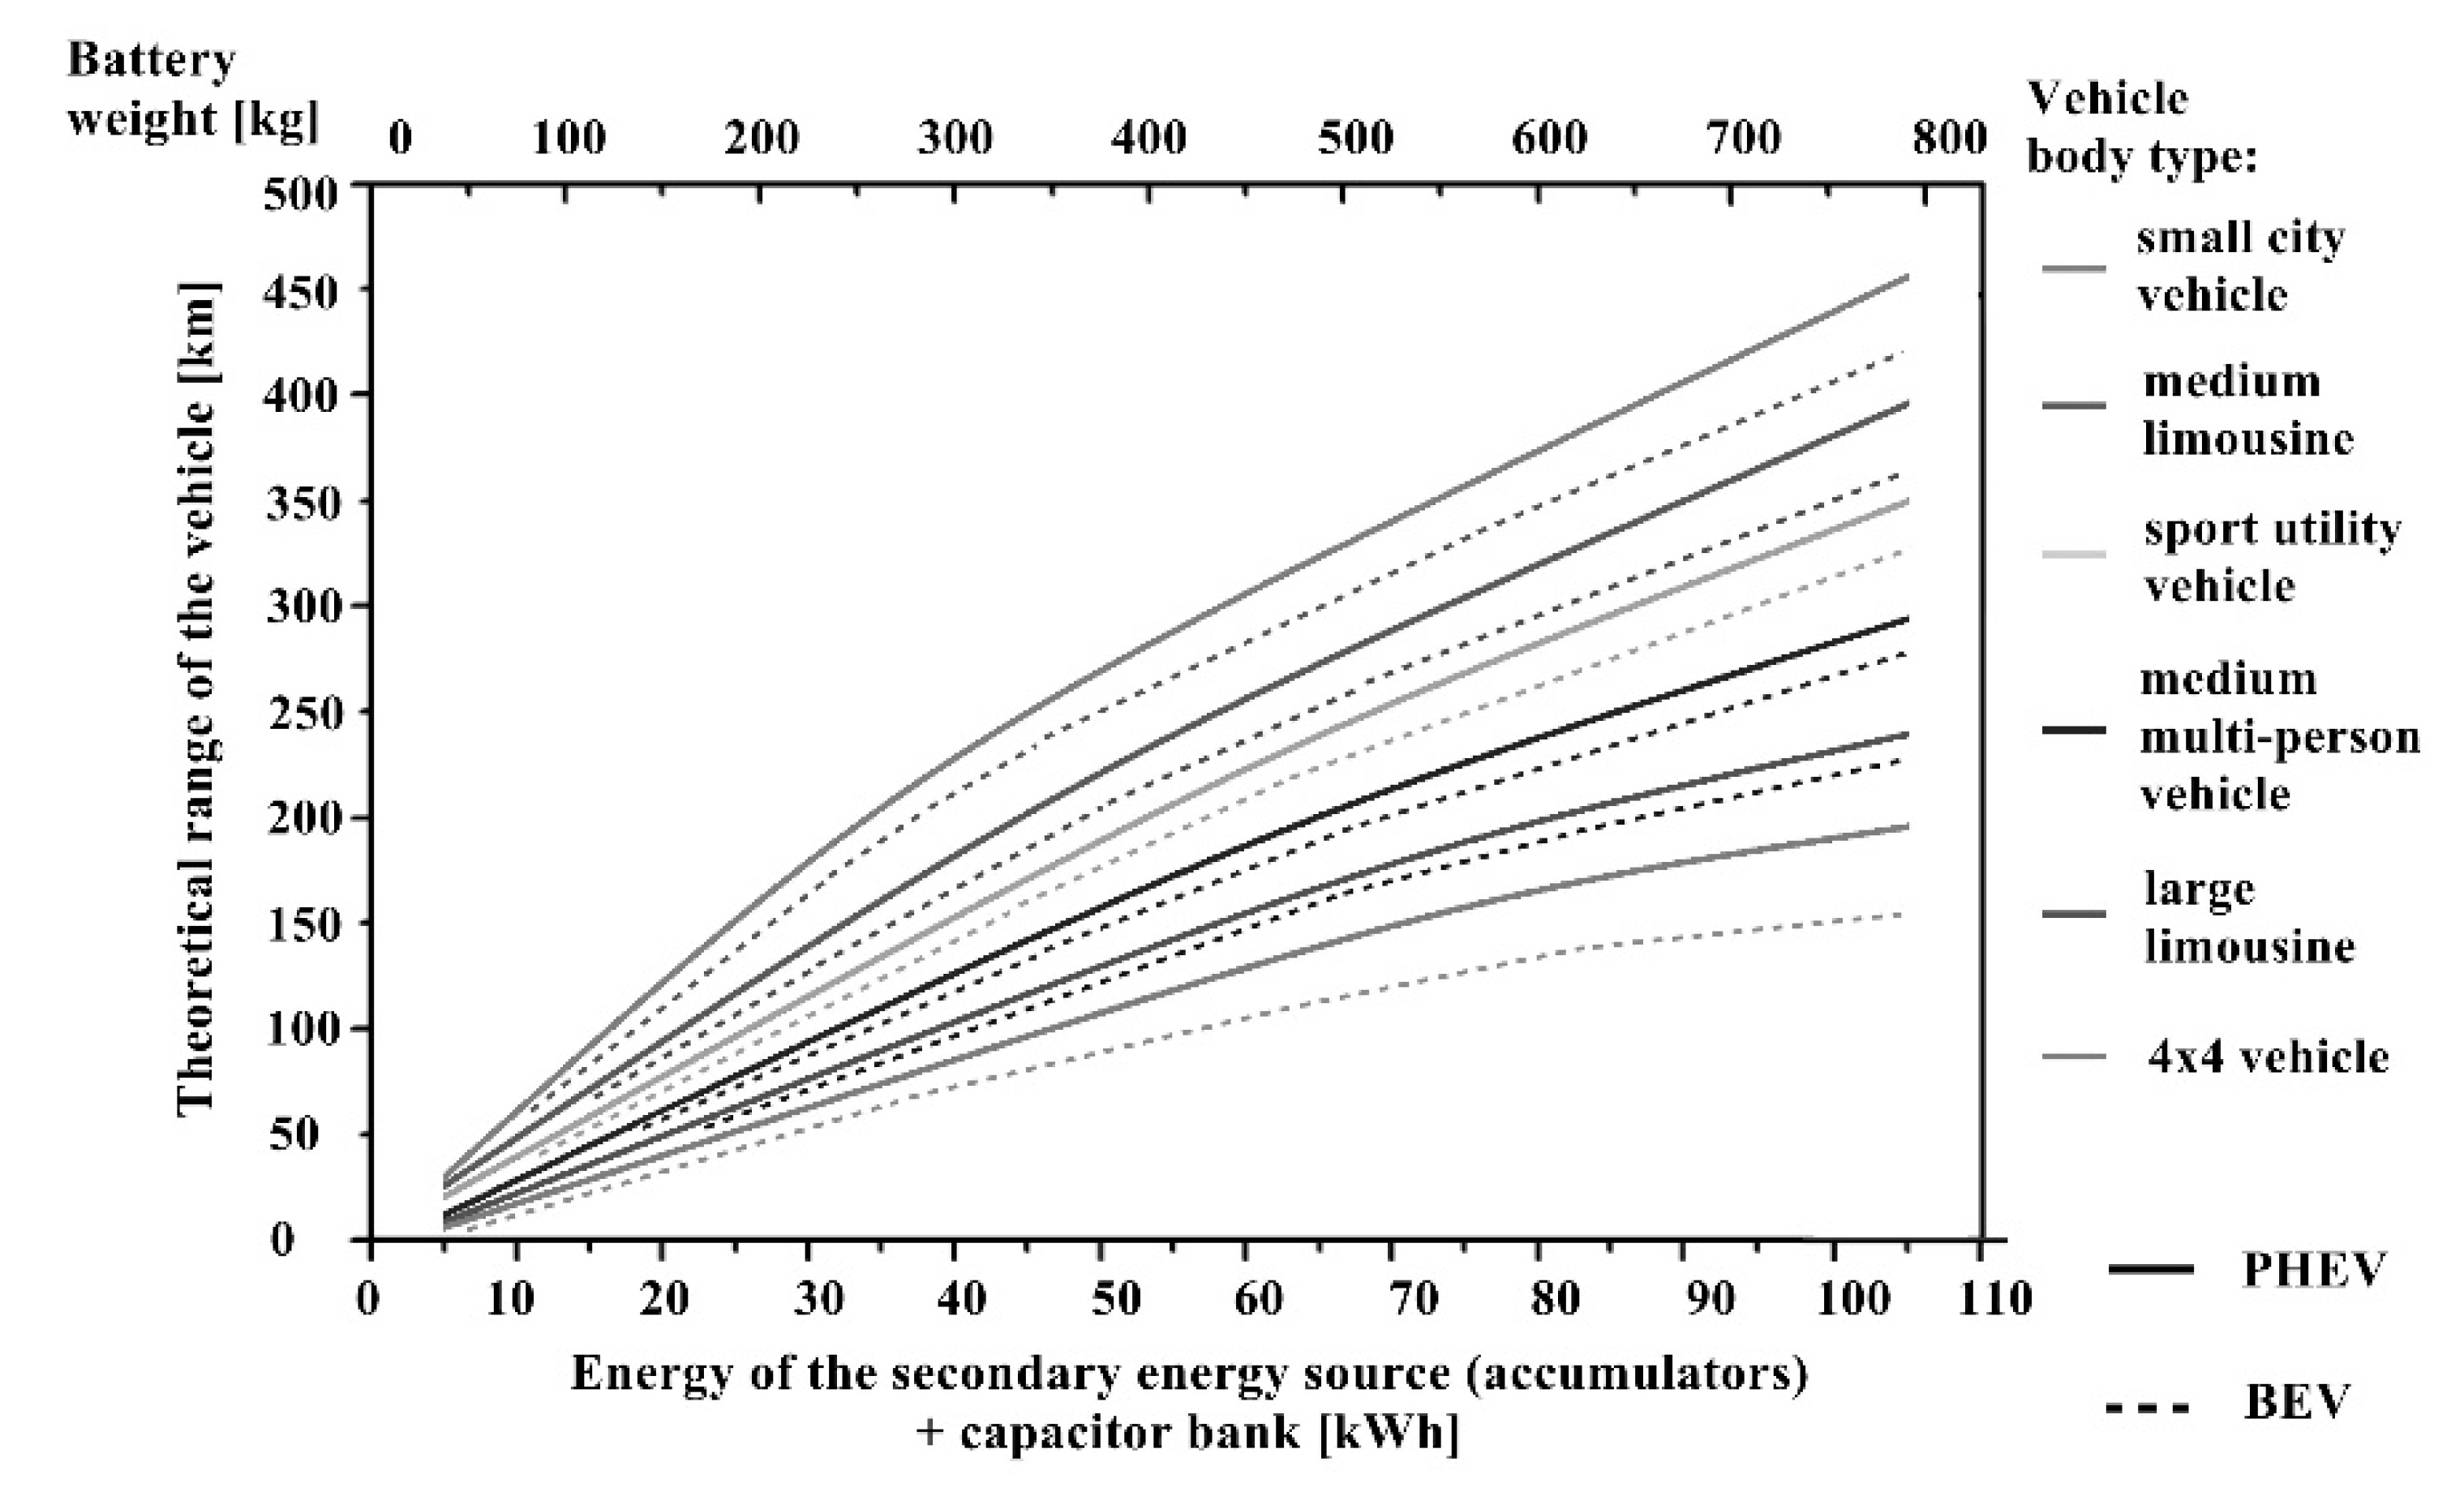
As shown in
Figure 5, depending on the type of battery, the demand for power and weight is proportional to the resistance to motion. This means that vehicles with appropriately selected aerodynamics can generate significant energy benefits, especially in the case of BEVs. It is evident that 4x4 vehicles are characterized by the most considerable energy demand. This is related to the design of their drive system. In particular, a significant difference can be seen in the energy demand in BEVs and PHEVs, where PHEVs have a much higher demand for electricity from batteries and capacitors. This is related to additional energy losses associated with the double drive system. This causes a significant increase in the resistance to motion in moving mechanisms and a greater demand for electricity in additional actuating and measuring equipment. Comparing BEVs (small city vehicles) of an appropriate design, e.g., energy demand of about 50 kWh, with higher comfort vehicles (limousines), we can see that the battery weight doubles to ensure the same range. This means that for higher-class vehicles, the theoretical capacity of these vehicles with the permissible curb weight of the energy source must be reduced to maintain an appropriate energy consumption level. The use of larger batteries increases the weight and thus reduces the efficiency of the drive system in PHEVs and BEVs. This means that PHEVs and BEVs must have an appropriate body shape that reduces aerodynamic drag and a low battery weight, that does not exceed 300 kg. Further increase in the mass of the source of electrical energy deteriorates the overall energy efficiency of the vehicle resulting in low cost-efficiency of such solutions. Therefore, in larger vehicles, the ICEV driveline is much more efficient and does not significantly affect the overall efficiency of the drive system.
Despite these shortcomings of PHEVs, a growing number of stringent CO
2 emission regulations [
53] along with rising fuel prices [
54] have led to a significant change in the perception of specific vehicle design solutions, including PHEVs and BEVs. The growing demand for city-type vehicles indicates a positive attitude of vehicle users to this group of cars, despite the inconvenience of battery charging, low range, and low availability of charging stations and repair services. Despite the fact that the operating cost of these vehicles is very high in the event of even a minor failure, users often decide to buy such a car. This is probably related to the social pressure on ecology and low emissions.
For this purpose, we may use integrated systems of operational suitability indicators and intermediate systems based on the energy balance, which depends on the quantity and efficiency of the required resources. The complexity of the system is unlimited and involves the implementation of individual efficiencies for each component of the system. Additionally, we need to introduce a method for assessing the probability and predicting potential aperiodic phenomena affecting the total efficiency of the system in a given area.
2.4. Research Capacity of the Gray System Theory (GST) and Statistical Models While Considering Aperiodic Phenomena in the Energy Consumption Balance
The model studies are based on the GST and GM prognostic models (1,1). Various sizes of windows were adopted for the calculation of energy balance parameters and aperiodic features. Such models have several indirect features that are favorable due to the characteristics of data in the model, e.g., diagnostics and the frequency of failures [
55,
56,
57]. When using a moving window, the GM (1,1) models are especially adaptable. Adopting the wrong window size can amplify the measurement error and lead to wrong conclusions. These models have been developed in several studies. They are mainly used to assess machine reliability and social engineering issues [
58,
59,
60]. If we observe a selected number of damage symptoms to a given component, e.g., a PHEV, we can obtain specific damage information using the so-called Symptomatic Observation Matrix (SOM) [
61]. One method of further extracting this Diagnostic information is to use the Specific Value Distribution (SVD) to the SOM [
62,
63,
64].
The multidimensional nature of the inefficiency space in machine operation monitoring is now well defined and analyzed in terms of existing model errors through the use of neural networks [
65], singular value decomposition [
66], or principal component analysis [
67]. A more difficult task is the multidimensional decision-making process, where we have a data fusion method [
68] and the concept of symptom reliability applied to a general failure obtained by using singular value decomposition (SVD) [
69]. Based on the model presented in the above publications, a generalization of the SVD method was used. It considers other SOMs of similar objects with the same number of symptoms (columns); however, the number of rows (observations) may differ [
70,
71]. The intelligent model learning has been applied [
72,
73,
74]. The GSVD concept based on a prior SVD application has been used until initial results can be seen as possible use of the GSVD in machine condition monitoring, especially when looking for similar symptoms and wear based on aperiodic damage in the entire energy system in ICEVs, PHEVs, and BEVs [
75,
76,
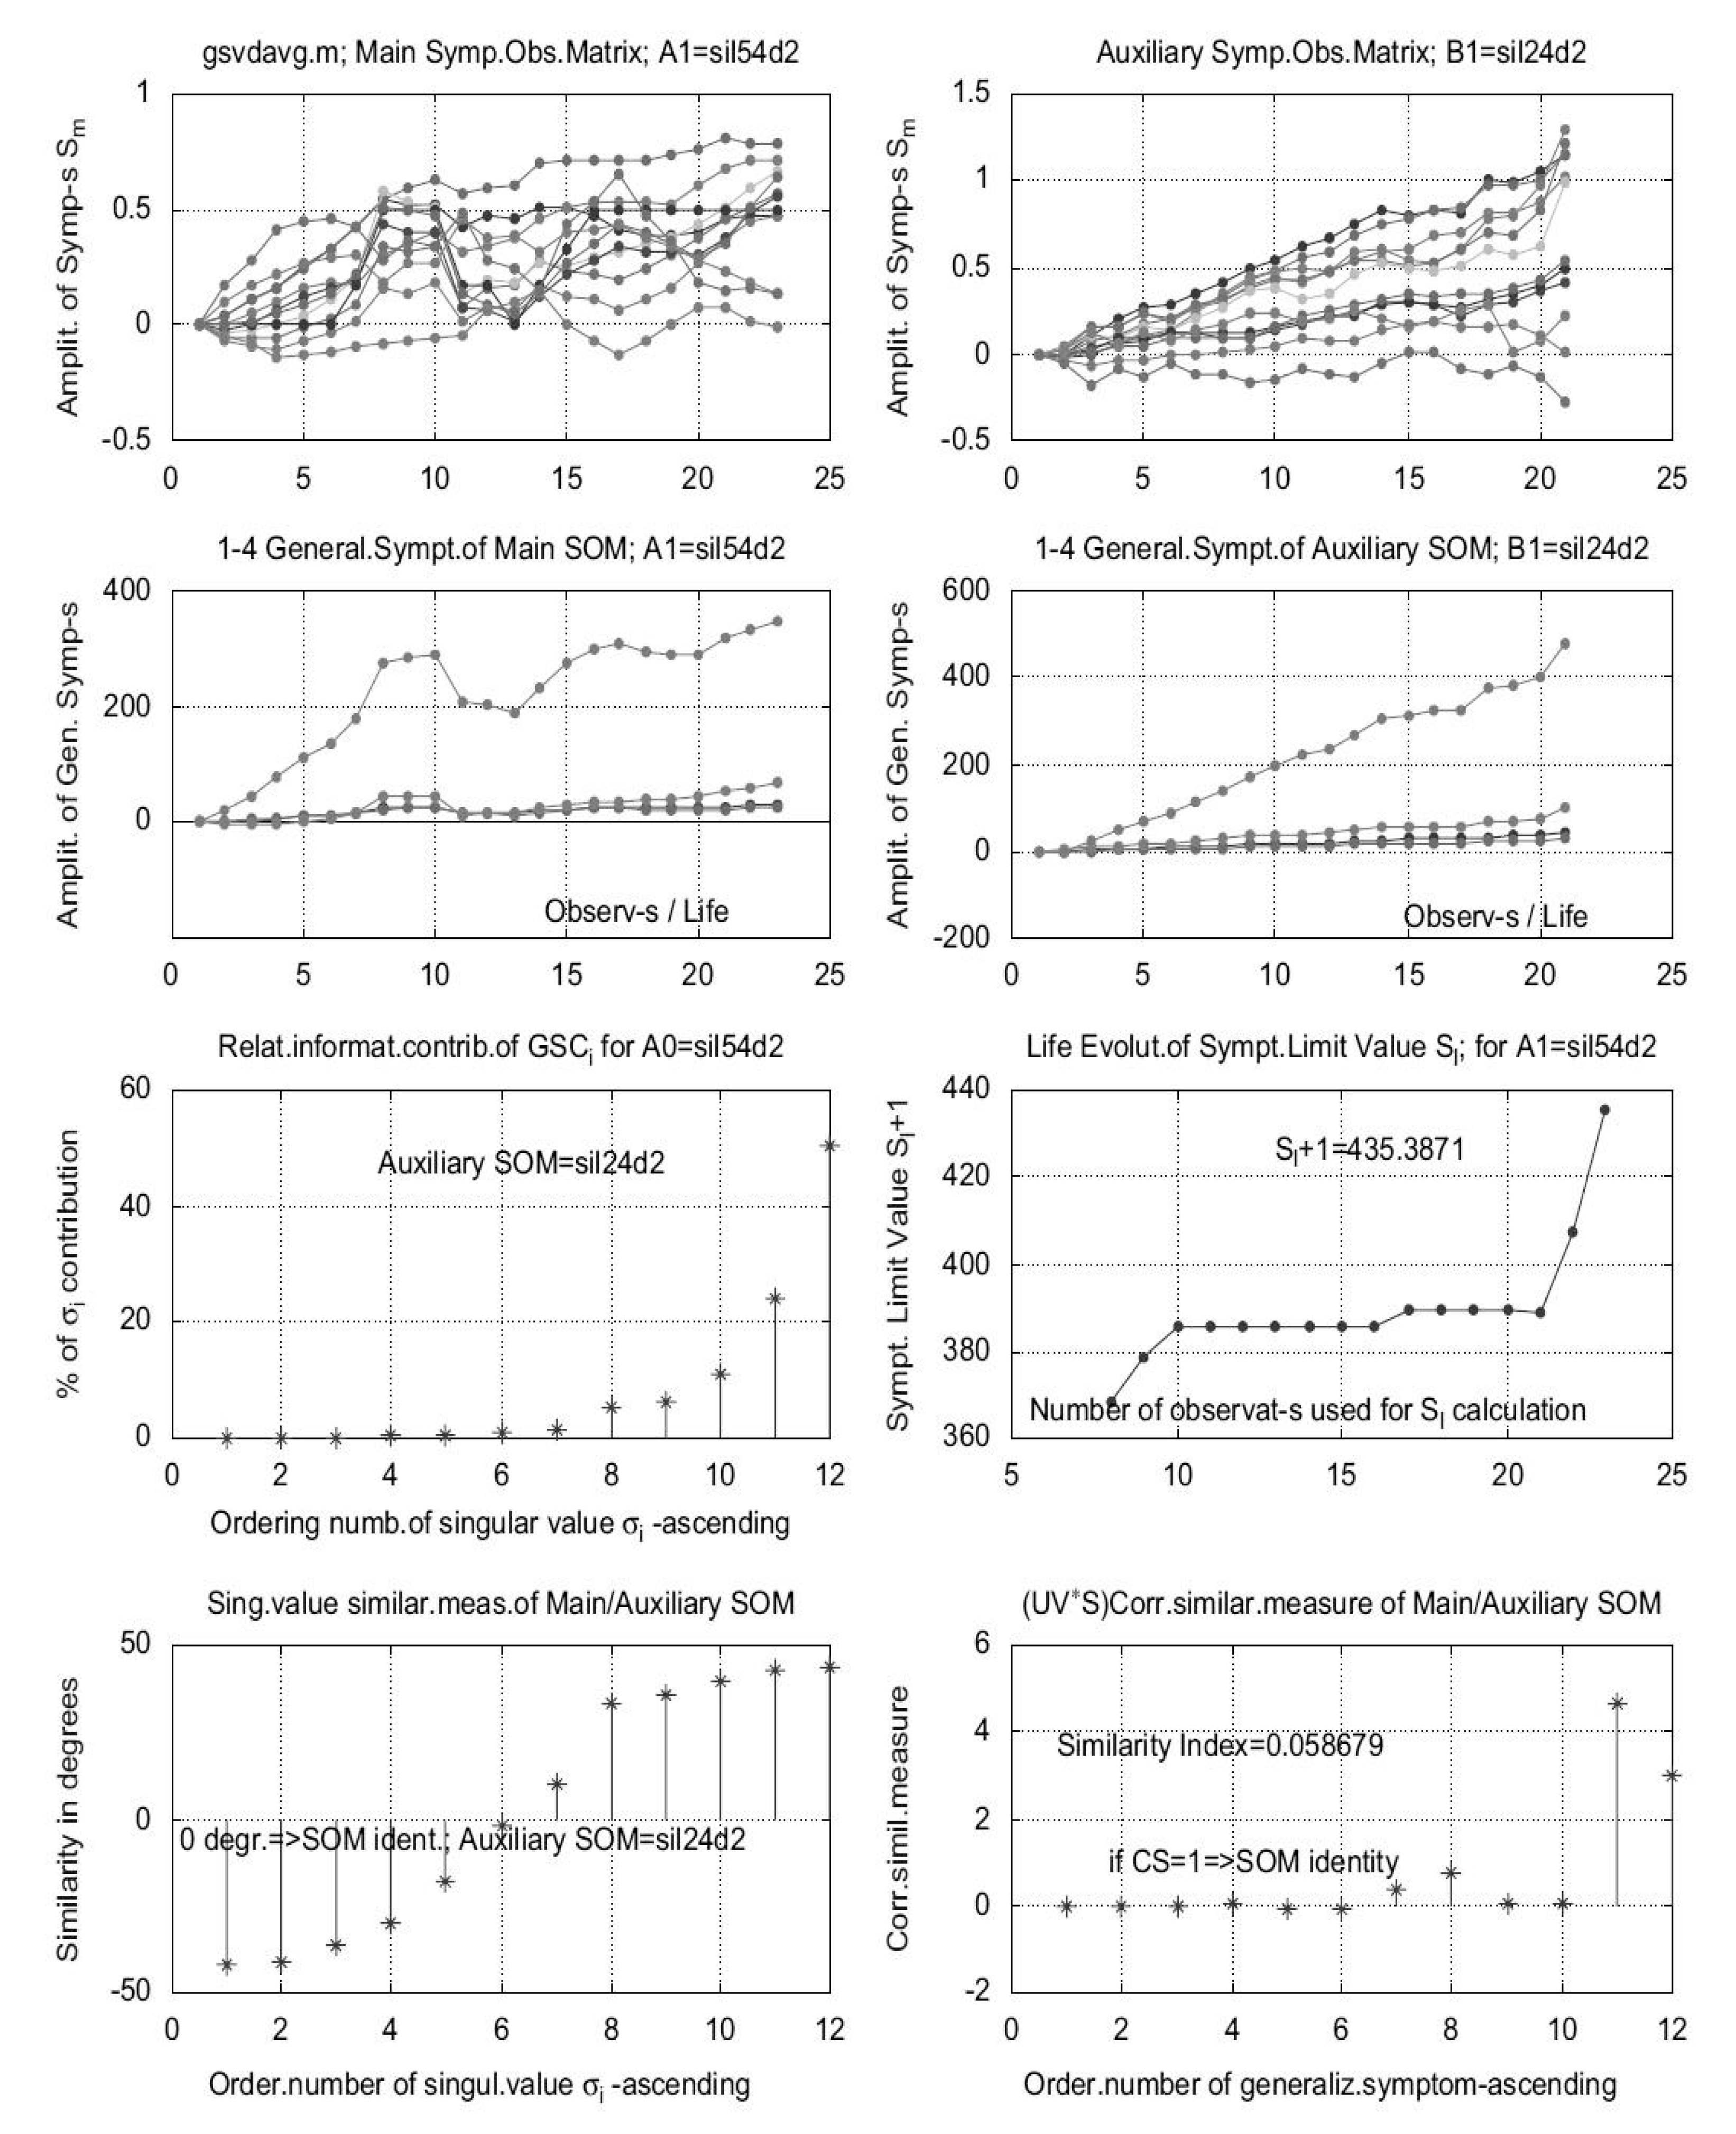
77]. An example of the use of the model has been shown in
Figure 6, which shows the results of using the model for a diesel engine.
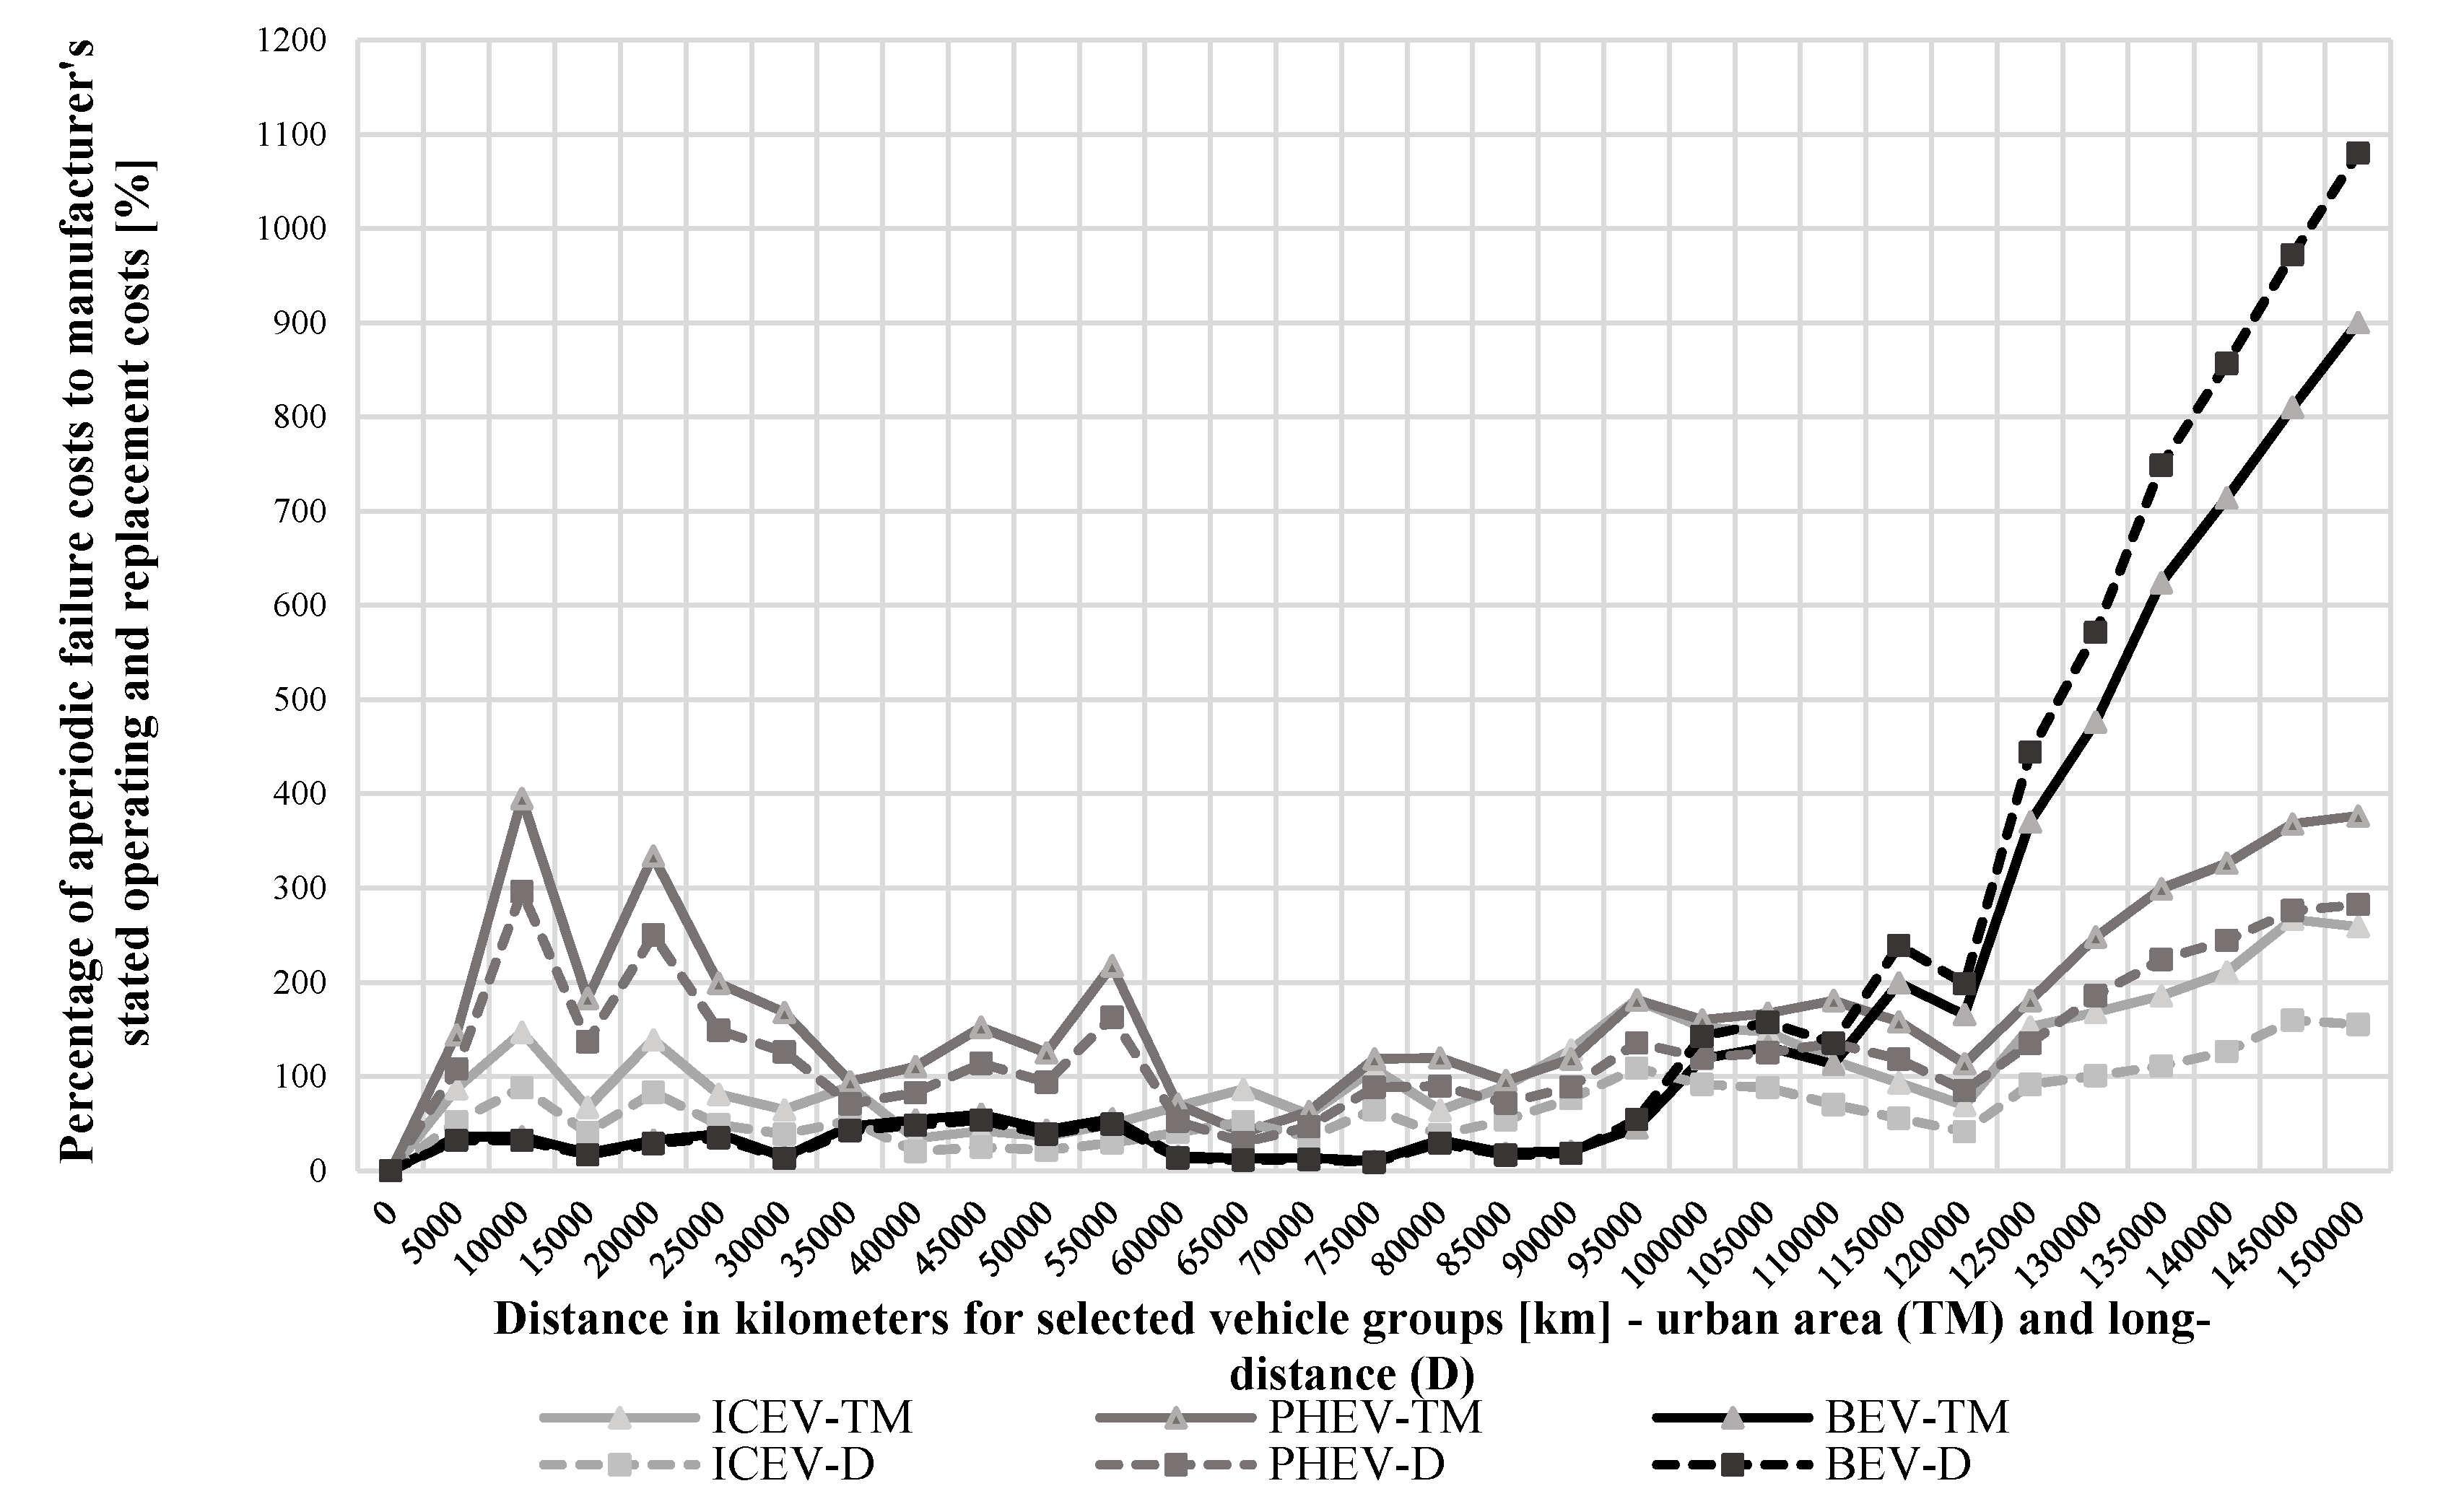
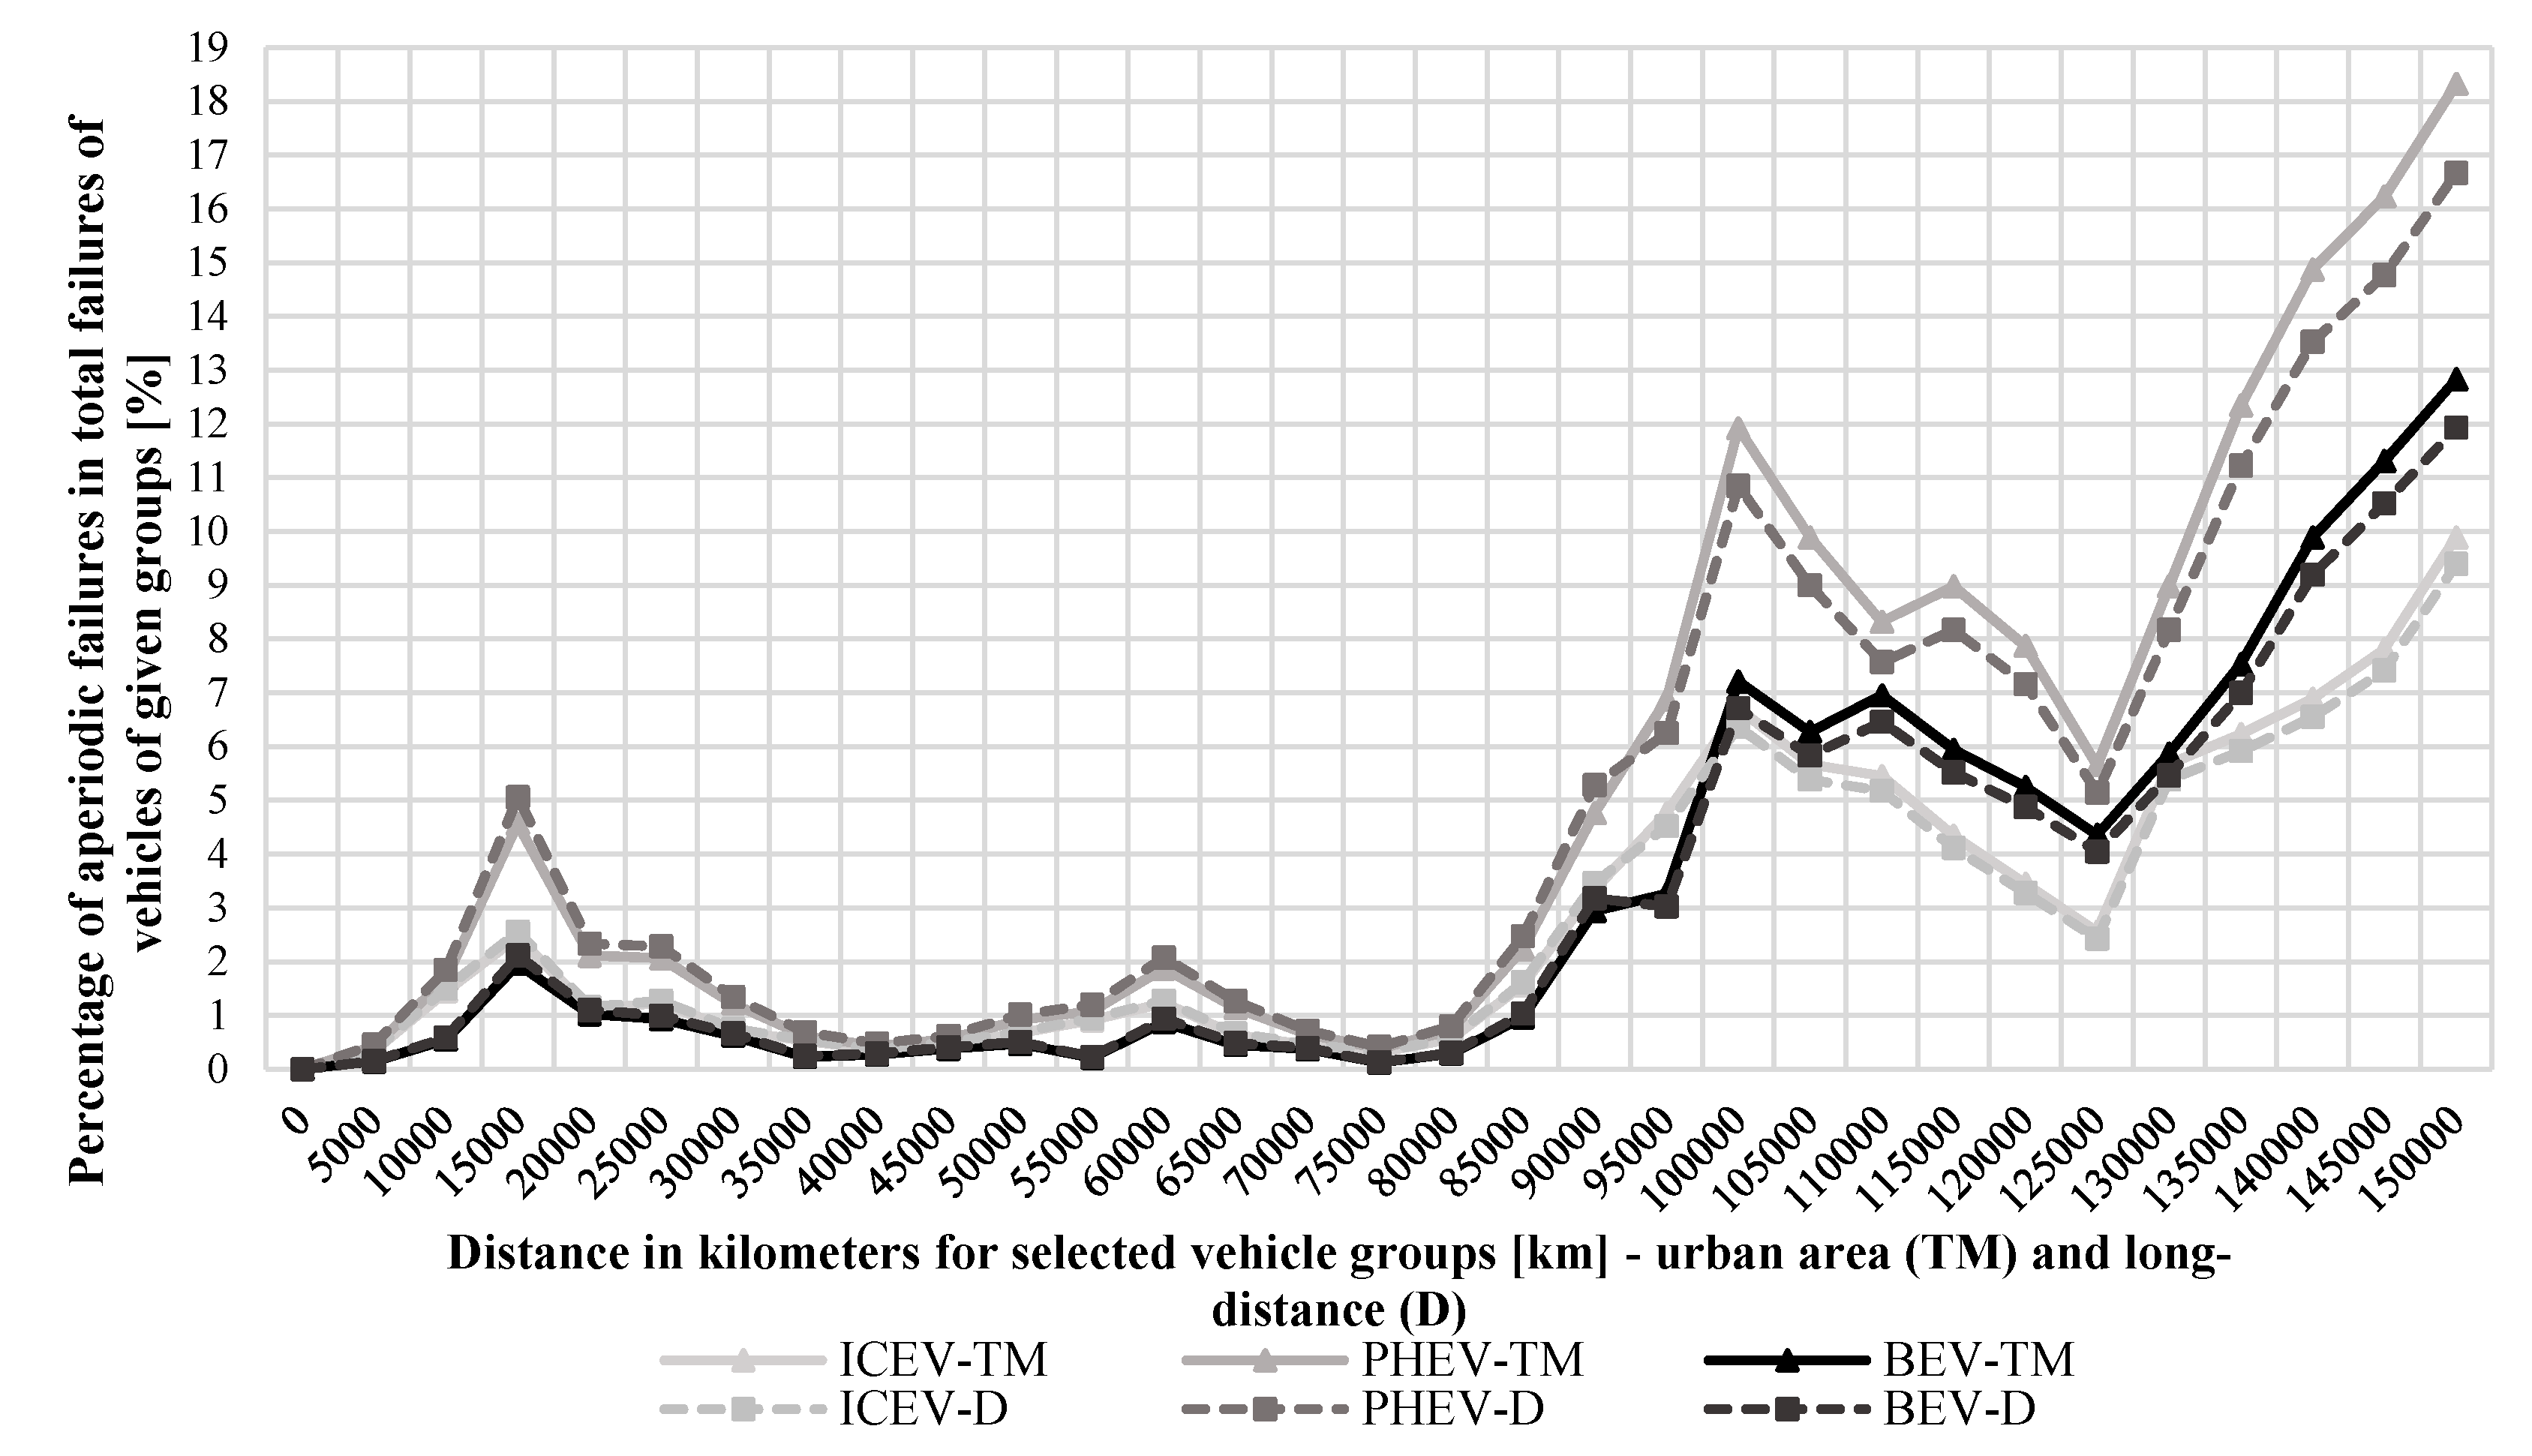
The paper uses a predictive method for the comparative verification of GST models with statistical data about the frequency of aperiodic failures. Six vehicle classes (
Figure 5) and three types of ICEV, PHEV, and BEV drivelines were taken into account in a group of 1200 vehicles. It was assumed that speed profiles for individual groups in urban and long-distance modes are very similar for the total population of 1200 vehicles analyzed against aperiodic phenomena during their operation over a distance of 150,000 km.


