Review

A Review of Electric Vehicle Load Open Data and Models

1
Laboratoire de Mathématiques d’Orsay (LMO), CNRS, Faculté des Sciences d’Orsay, Université Paris-Saclay, 91405 Orsay, France
2
EDF Lab, 7 bd Gaspard Monge, 91120 Palaiseau, France
3
Université de Paris, IUT de Paris—Rives de Seine, dept STID, 143 avenue de Versailles, 75016 Paris, France
*
Author to whom correspondence should be addressed.
Energies 2021, 14(8), 2233; https://doi.org/10.3390/en14082233
Submission received: 20 March 2021 / Revised: 9 April 2021 / Accepted: 11 April 2021 / Published: 16 April 2021
(This article belongs to the Special Issue Data Mining Applications for Charging of Electric Vehicles)

Abstract

:
The field of electric vehicle charging load modelling has been growing rapidly in the last decade. In light of the Paris Agreement, it is crucial to keep encouraging better modelling techniques for successful electric vehicle adoption. Additionally, numerous papers highlight the lack of charging station data available in order to build models that are consistent with reality. In this context, the purpose of this article is threefold. First, to provide the reader with an overview of the open datasets available and ready to be used in order to foster reproducible research in the field. Second, to review electric vehicle charging load models with their strengths and weaknesses. Third, to provide suggestions on matching the models reviewed to six datasets found in this research that have not previously been explored in the literature. The open data search covered more than 860 repositories and yielded around 60 datasets that are relevant for modelling electric vehicle charging load. These datasets include information on charging point locations, historical and real-time charging sessions, traffic counts, travel surveys and registered vehicles. The models reviewed range from statistical characterization to stochastic processes and machine learning and the context of their application is assessed.

1. Introduction

Assuming a low-carbon energy mix, Electric Vehicles (EVs) are a credible alternative to internal combustion engine vehicles (ICEVs) supporting the transportation sector in its low-carbon transition. A substantial number of governments are heavily investing in electric mobility with more than 5.1 million electric passenger cars on the roads globally in 2018, according to the International Energy Agency (IEA) [1]. Several countries are achieving high rates of EV adoption such as Norway which approached an EV market share of almost 47% in 2019 [1]. This is due in large part to major incentives implemented by governments to foster EV uptake [2]. The EV30@30 Campaign [3] sets a target of 30% EV market share by 2030 for the member countries of the Electric Vehicle Initiative (EVI) [4]. This enthusiasm for EVs comes hand in hand with great concern about how to manage the surge in electricity demand which could greatly disrupt the current schedule [5].
In order to overcome potential pitfalls, businesses and researchers are proposing solutions including pricing strategies [6] and smart charging [7]. The goal of these solutions is to avoid dramatically shifting EV users’ behaviours and power plants production schedules. However, their implementation requires a precise understanding of charging behaviours. Thus, EV load models are necessary in order to better understand the impacts of EVs on the grid. With this information, the merit of EV charging strategies can be realistically assessed.
In this article, the term “EVs” refers to small vehicles (e.g., light motorcycles), passenger vehicles (e.g., cars) and goods-carrying vehicles (e.g., trucks) as per the classification from the European Commissions’ official report “Mobility and Transport: Vehicle Categories” refs. [8,9]. Passenger vehicles constitute the majority of EVs. Additionally, all energy system management are considered: Battery EV, Fuel-Cell EV or Plug-In Hybrid EV [10]. Furthermore, Electric Vehicle Supply Equipment (EVSE) will be referred to as any type of charging point, be it public or private. Finally, an EV charging session (or transaction) refers to the period of time an EV has spent charging at an EVSE.

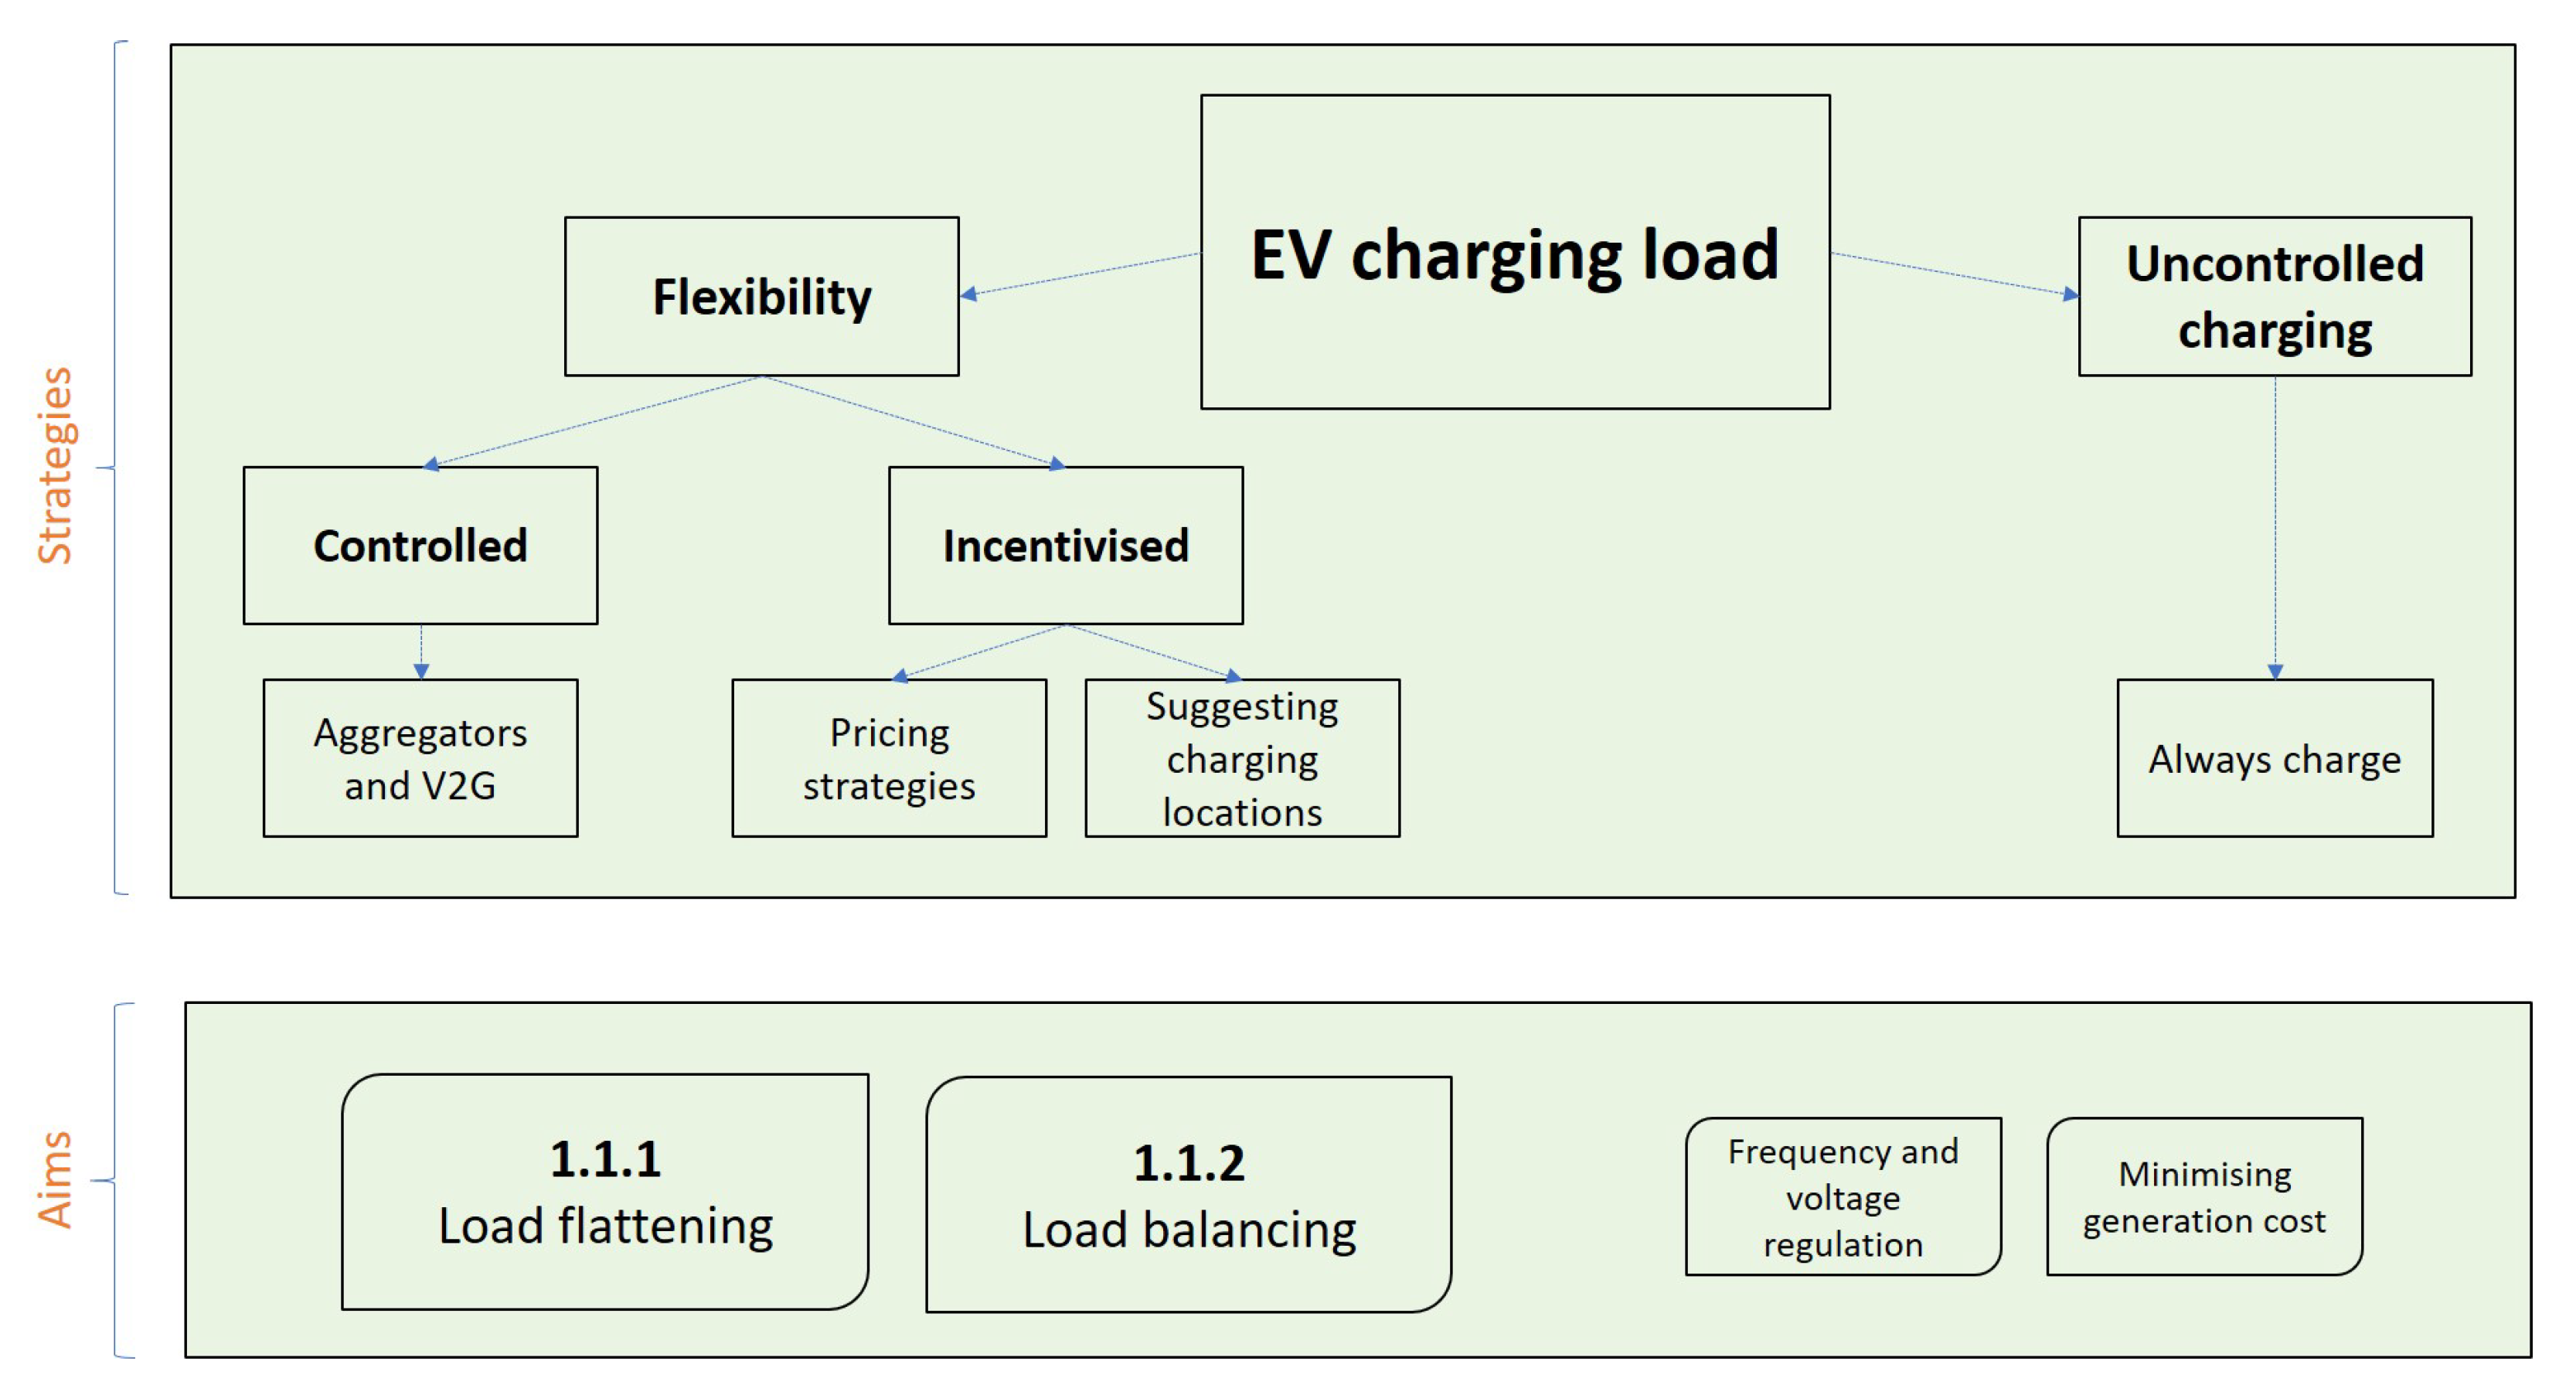
1.1. Aims and Strategies for EV Charging Schemes

Electricity distribution occurs such that at any point in time and space, the consumption has to be equal to the production in order to avoid severe consequences such as blackouts [11]. A significant rise in the number of EVs in circulation leads to an increase in electricity demand which could cause such a blackout if the balance in the grid is not effectively maintained. Therefore, EVs have an important role to play in maintaining this balance [5]. The purpose of this section is to explore the different aims and strategies required to overcome the potential difficulties caused by increased EV penetration. Figure 1 summarizes these aims and strategies. Incentivized flexibility and controlled flexibility are used to achieve specific aims while uncontrolled charging lets the market decide the prioritization of these aims. Load flattening and load balancing are the most common aims found in the literature and they are the focus of the following paragraphs.

1.1.1. Load Flattening

While some studies show minimal impact of EVs on peak load [12,13], the consensus in the field is that the grid will not be able to sustain its operations with the projected demand from EVs [6,9,14,15,16,17,18,19].
One of the first articles dealing with the impact of EVs on load management was written in 1983 [20]. In this article, EVs were suggested as a way to minimize the overall grid load factor f. This factor is defined as the ratio of the average load (L) over the maximum load in a given period of time: f = a v g ( L ) / m a x ( L ) . The maximization of this quantity results in a more efficient distribution of resources over time. The article proposed that using off-peak recharging of EVs will significantly increase the load factor. This means shifting the EV demand to times when the rest of the demand is low (e.g., night time) in order to flatten the load curve. The flexibility analysis produced in [21] suggests that it is possible to shift the EV charging to the afternoon and night valleys for different clusters of users without changing their behaviours. This could lead to peak reduction and load factor maximization with little change to users’ requirements and lifestyles.
Articles such as [22] strived to estimate the benefits of this kind of controlled or incentivized EV charging. However, these articles do not always account for potential mistakes in load forecasting, therefore the benefits calculated could be inaccurate. Hence, it is critical to improve EV load forecasting models in order to alleviate the risk of unrealistic optimization schedules for maximizing the load factor.

1.1.2. Load Balancing

An early article from 1997 [23] considered using EVs as a source of electricity for the grid when demand is high. In other words, using EVs plugged-in to the grid as an ancillary service or as way to bring flexibility to the overall shape of the load. According to a study focused on 400,000 EV charging transactions from 2012 to 2016 in the Netherlands, 75% of EVs connected at public EVSEs are already fully charged [24]. This study therefore supports the strategy of using fully recharged EVs which are still connected, as a source of energy in order to supply the grid. This paradigm shift, using what could be a major constraint and treating it as an opportunity, is called “vehicle-to-grid” (V2G).
Additionally, integrating renewable energy sources onto the grid is also the focus of numerous studies [7]. Many countries with climate related commitments are aiming to increase the share of renewables in their energy mix. However, the main drawback of renewable energies is their intermittent delivery of supply. Indeed, solar panels and wind farms are highly weather-dependent. In this context, EVs can adequately balance the energy coming from renewable power plants. This strategy consists in considering multiple EVs acting as a large battery or electricity storage system which can be discharged back into the grid when weather conditions do not allow renewable power plants to produce enough energy [19].
Although V2G has many advantages, one drawback is that it reduces battery lifetime by adding unnecessary cycles of charge and discharge to the vehicle [25]. Furthermore, this strategy requires the existence of global and local communication and monitoring channels which do not exist yet. These channels are necessary for the development of EVs in general and particularly for V2G and load balancing [26,27]. Finally, in order to ensure effective communication, EV load models are critical as they can reduce uncertainty and minimize contradicting signals from what is expected and what is observed by operations management.

1.2. Paper Structure and Contributions

The purpose of this article is to enable a better understanding of EV load data available and models produced in the literature. The main contributions of this article are as follows:
  • The results of an in-depth open data search with a structured list of datasets available for use
  • A comprehensive review of EV load models including their strengths, weaknesses and their application in the literature
  • A preliminary study on matching EV load models to six open datasets found in this research and not previously explored in the literature
The rest of the article is structured as follows. Section 2 defines EV load and its most common drivers. Section 3 presents the open data found which can be used to model EV load. Section 4 reviews EV load models comparing the different approaches taken. Section 5 explores charging session data not previously explored in the literature and suggestions are provided on the models reviewed that could be applied to these datasets. Finally, Section 6 highlights the current knowledge gaps and discusses the different options in order to pave the way for future work.

2. EV Load and Its Main Drivers in the Literature

EV load corresponds to the power or energy consumed at EVSEs over time. This information can also be directly derived from other closely related factors. In particular, knowing the arrival time and charge duration of EVs allows a deterministic reconstruction of EV load.

2.1. EV Load as a Model Output

EV load can be considered at different levels of aggregation. The total energy demand at all EVSEs can be referred to as the aggregated output of EV load models. The same model output can be envisaged in a disaggregated fashion. Two setups are widely used in practice. The first is vehicle-centric which considers the contribution of each EV member of a fleet to the aggregated load. The second is EVSE-centric which considers the perspective of one or multiple EVSEs. Neither approach is mutually exclusive and the two setups can be combined to model EV load.

2.1.1. Aggregated

The aggregated approach is shown in various articles such as [24,28] where the total EV load across multiple EVSEs is modelled. In [24] 1750 charging stations (2900 charging points) are used while [28] uses a single station with many charging piles. This kind of approach usually performs well due to the smoothness of the aggregated load curve assuming there are enough EVs or charging stations in scope. While they give a holistic view of the charging load, they can lack detail with regards to the temporal and spatial distribution of the load which is one of the key concerns raised in the literature [5].

2.1.2. Vehicle-Centric

In order to explore the finer details of EV load, a vehicle-centric approach can be adopted. In [29] individual EV loads are modelled in order to recover the aggregated load. This approach can be qualified as a vehicle-centric approach as it uses individual outputs of EVs. In this case, it is assessed in terms of aggregated load. The same can be said for [30] and [31] where individual behaviours are modelled. A similar study can be found in [32] where the EV load outputs are separated into urban and rural behaviours while [13] looks at public and residential charging. This can give a better understanding of the spatial and temporal properties of EV load.
Additionally, models which consider the spatial components of EV charge are detailed in [9,18]. For instance, in [18] four schedules for EVs are identified which enables one to better distinguish and evaluate their temporal impact on the grid. Furthermore, the spatial dimension is addressed by modelling EV charging locations. Both outputs are brought together in order to reconstruct the aggregated EV load.

2.1.3. EVSE-Centric

The EVSE-centric approach is rare in the literature as it usually is superseded by the vehicle-centric approach. However, there are some occurrences of such work for instance in ref. [12] where residential charge is envisaged from each household perspective. The authors used a bottom-up approach to forecast the aggregated EV load using each household individual load. The debate of using EVSE-centric over vehicle-centric approaches is illustrated in [33]. In this article, it was found that both approaches yield comparable prediction errors even though the EVSE-centric approach was slower to compute.

2.2. Input Data Used for EV Load Modelling

2.2.1. Battery

Battery inputs are variables which closely relate to the charging demand of EV load from a “physical/chemical” perspective. The most common ones used across the literature are the State of Charge (SoC), Energy Consumption (E) and battery capacity (C). Generally speaking, the SoC is the rate at which the battery is charged whether the EV is plugged-in, idle or travelling [34]. The SoC when the EV arrives at an EVSE is a critical influential factor of EV demand. This is referred to as the initial SoC ( S o C i n i t ) in the literature. By incorporating the distance travelled (D) by the EV, Equation (1) defines S o C i n i t as follows:
S o C i n i t = C E × D C
with C in kWh, E in kWh/km, D in km and S o C i n i t in %.
On one hand, battery capacity and other engine specifications are usually assumed to be known constants. Based on EU MERGE data, probability functions were derived to characterize EV specifications in [9]. On the other hand, the SoC and energy consumption evolve over time and with vehicle usage. Both are highly correlated and they can be deduced from each other from the formula above or by a set of assumptions. For instance, the initial SoC of EVs is assumed to be equal to 0%, 30%, 60% in [35] to match different scenarios. Similarly, the initial SoC is used as an input in [36] along with D, C and the charging rate of the EV charging model in [37]. Furthermore, in [30,38] battery specifications and stochastic characteristics are also part of model inputs. Finally, the EV load itself can be used as an input when considering time series approaches [33].

2.2.2. Travel

From this literature review, it appears that travel behaviours are the most widely used exogenous factor driving EV load models. It is important to distinguish between travel inputs extracted from travel surveys [14,39] or estimated pattern data [9,30,40] (which usually require further statistical treatment to be part of a model), and real-world traffic patterns (which are deduced either from pilot experiments [41] or direct GPS driving data [42]).
The input variables used in most papers (whether they are estimated or recorded) are the daily distance travelled and travel time. In [42] daily travel distance and individual trip distances distributions were extracted from a survey conducted between 2012 and 2013 in Beijing with real-world GPS data collected on 112 volunteer vehicle owners. Likewise, a pilot experiment was put in place for a week in Germany [41] in order to record the evolution of daily trips through GPS data.
When such exact data are not available, researchers use travel surveys instead [43]. These datasets hold valuable general information on drivers behaviours and can be used in order to estimate parameters of statistical distributions for daily distance travelled or travel time. However, they can lack accuracy as the information is usually collected through questionnaires. For instance, in [39] the authors used the 2009 National Household Travel Survey (NHTS) as well as the New-York State Transportation Federation Traffic Data Viewer in order to extract traffic statistics such as EV speed travelling from one charging station to another. In [14] daily trips from a single real-world vehicle from the NHTS is randomly assigned to a fictional EV used in the model. This procedure is applied to the desired number of EVs to obtain a fictional EV traffic. Similarly, [30] used Barcelona’s mobility patterns while [44] used the 2008 transportation data from the Dutch Ministry of Transportation in order to extract traffic statistics.

2.2.3. Weather

EV load models have stemmed from electrical load models. They have been developed over 100 plus years [45] and are comprised of some strongly established characteristics. One such characteristic is the thermosensitivity of electrical load [46]. In short, this means that some obvious patterns can be derived from analyzing both load demand and temperature. Thus, it is natural that the most frequently used input for EV load models is temperature and its traditionally associated statistics (e.g., average, maximum, minimum) ref. [12]. Even though temperature is used in most electrical load models it is rarely used in EV load models. Nevertheless, there exists reasonable arguments to include weather data in EV load models.
The influence of different weather variables on daily EV charging demand is explored in [47]. This includes, minimum, maximum and mean daily temperature as well as mean wind speed, maximum gust, rainfall, global radiation and sunny hours. The results of this study showed that temperature and specifically mean air temperature is the most correlated weather input to daily EV load relative to the others reaching a 27% correlation relationship in one of the regions considered.
Similarly, in [6] the authors argue that temperature can be used to model EV load as it is correlated to electricity prices and demand. However, there is no mention of other potential weather factors which could be included.
A relational analysis is used in [48] to assess the impact of weather factors on traffic volume in South Korea. It was found in this case study that maximum and average temperature as well as average humidity are the most influential weather factors on traffic volume. Average wind speed on the other hand is less influential and was discarded in their model.
Finally, it is also argued in [49] that temperature has a great impact on EV charging station load while wind and humidity were discarded.

2.2.4. Economy

Amongst the articles covered only a few include economical factors such as electricity prices [6,28,39], Gross Domestic Product (GDP) [30] or trends [40,47]. While some locations still provide free charging as an incentive to foster EV adoption, most public EVSEs have a charging price based off a subscription or peak/off-peak tariffs. However, China is one of the countries where real-time electricity pricing affects the price consumers pay at EVSEs. Thus, for [28] it is natural to include time of use tariffs as this study was made on EVs in China. In [39], the authors also include electricity prices as it can have an impact on the decision making undertaken by an EV driver when choosing which station to charge their vehicle.
Interestingly, GDP is included as a model input in [30] as it was shown in previous work [50,51,52] that GDP and other socio-economical variables such as place of residence and household characteristics have an impact on EV load and can be leveraged using an vehicle-centric approach. This is something worth exploring as these variables are easily accessible in travel surveys and general country statistics. They can be used to better anticipate charging behaviours in various locations of the grid. Global EV trend usage with uptake scenarios [40] or calculated trends [47] can also be used as model inputs.

2.2.5. Calendar

Temporal inputs are used in most model set-ups. They are easy to integrate and bring consistency as well as performance with the strong explanatory power they hold. They require no heavy statistical treatment as opposed to other variables (e.g., travel and battery) which makes them easy to use. For instance, in [8,31] day of the week and time of day are used in EV load models and more generally, EV load is derived in most research papers from day of the week, time of day and seasonal variation.

3. Open Data Search

Few review articles that deal with related topics to EV load modelling have included information regarding open data with associated references [53]. To the best of the authors’ knowledge, there exists no article at the time of writing which has attempted this type of endeavour for EV load models. Indeed, a great majority of articles produced in the EV load modelling domain are based off simulated data or information owned by private entities which are very rarely made available [28,49]. This prevents reproducible work and slows down research in the field.
Therefore, the objective is to fill this gap by providing the community with a structured and carefully selected list of open datasets ready to be used in order to foster data-driven research in the field. This open data search was possible in great part thanks to the open data inception initiative which gathers links to more than 3500 open data repositories on their website all across the world [54]. Links to the datasets are provided throughout this section and are up to date at the time of writing.

3.1. Research Criteria

This study focuses on datasets which give information on transactions between EVs and EVSEs. In other words, charging sessions.
Additionally, datasets holding information on exogenous variables such as traffic, travel surveys and air quality have also been considered. These variables are widely used in the domain in order to simulate travel behaviours especially when considering spatiotemporal models. Weather data are also used for EV load modelling and electrical load modelling in general [46]. However this type of information was excluded from this data research as global resources which provide high quality weather data already exist. For example, the riem package [55] written in R retrieves data from airport weather stations all over the world via the Iowa Environment Mesonet website. Alternatively, the National Oceanic and Atmospheric Administration (NOAA) also provides extensive weather data [56].
In terms of the perimeter of this research, the top 14 countries active in or associated with the EVI during the period covering 2018 to 2019 have been targeted. They are ranked by market share of electric cars according to the IEA [57]. This list includes, Norway, Iceland, Sweden, Netherlands, Finland, China, Portugal (as an observer), USA, Canada, France, New Zealand, United Kingdom, Germany and Japan [58].
Most of the repositories covered used native language, therefore, the use of direct query search was minimized as it can be approximate, especially in a foreign language. Thus the following standardized process was used for each repository covered: every time a categorical hierarchy was available, datasets under the following categories were searched for: “Environment”, “Natural Resources”, “Infrastructure”, “Transportation”, “Traffic”, “Climate and Weather”, “Urban Development”, “Planning”. If a category search was not enabled, then the following key words were used with their translated variants: “Travel (Survey)”, “Electric Vehicle (or Car)”, “Charge-Charging”, “Traffic”, “Station”, “Air Quality”, “Mobility”.

3.2. Open Datasets

Overall, more than 860 repositories have been explored and more than 60 relevant datasets have been found that are directly (endogenous) or indirectly (exogenous) useful for modelling EV load. Table 1. summarizes the results found across all countries covered with the most relevant datasets in each category. Regarding EVSE data, a distinction is made between real-time and historical charging session data. Historical data gives information on charging sessions which occurred in the past. This is the essential type of data sought to model EV load. Real-time data refers to EVSE occupation information which is updated on short time frames (every few minutes) and not stored. It requires regular scraping to be transformed into a historical charging session dataset and only then can it be leveraged for EV load modelling.
For each country the corresponding EV market share from the IEA [57] is provided as well as the estimated value of the number of EVs to which this market corresponds. The estimated number of EVs sold is calculated by using the number of passenger sales in 2019 given on [121] multiplied by the EV market share from the IEA [57]. In Figure 2, the national EV market share and estimated number of EVs sold are shown, coloured by the type of data available for each country. It is interesting to note that countries with the highest market share and number of EVs sold are not the ones for which historical charging session data was found. This demonstrates the existing gap between EV penetration in each country and the availability of open charging session data. First of all, countries for which historical charging session data was found will be discussed as it is the most relevant and rarest information to find. Then, the information available from countries without historical charging session data but with real-time charging session data will be outlined. Finally, the countries where only traffic information is available will be presented.

3.2.1. Countries with Historical Charging Session Data

Netherlands

6.6% national EV market share [57] equating to approximately 29,000 EVs sold in 2019 [121].
23 repositories were covered in the Netherlands with every type of relevant data found. First of all, ElaadNL [69] holds historical charging sessions which were studied in multiple papers [21,24]. With regards to traffic data, Onderweg in Netherlands is the national travel survey published on a yearly basis [71]. While its tables are quite hard to study as-is for non-native speakers, they are summarized in another website in English [70]. Real-time data on utilization and consumption at public EVSEs installed in Rotterdam can be found on the EV-BOX website which is one of the EVSE providers [67]. Registered vehicles [72] and public EVSE locations are also available (e.g., in Eindhoven [68]). Additionally, historical traffic data from 2010 extracted from 24,000 measure points which stores information on vehicles such as speed and travel time [122] was found.

USA

2.4% national EV market share [57] equating to approximately 130,000 EVs sold in 2019 [121].
The open data search for the USA was extensive. Around 370 repositories were covered in the analysis. Among them three relevant charging session datasets were found [82,83,84]. The first provides a continuous dump of session data from 2018 on EV sessions recorded at city-owned EVSEs in Boulder (Colorado) [82]. The second gives the same information for charging sessions of EVs in the city of Palo Alto (California) from 2011 to 2017 [83]. Finally, the third provides us with an aggregated monthly view of transactions in the city of Evanston (Illinois) between 2016 and 2017 [84]. Furthermore, a charging session open dataset from Caltech, which is continuously updated in collaboration with Power Flex, is available at [85] and an exploration of this dataset was produced in [123]. On top of these charging session datasets, EVSE locations are also available from the Alternative Fuels Data Center [81], as well as many travel surveys including the National Household Travel Survey (NHTS) [43], which are frequently used to simulate EV behaviours from conventional vehicles. In particular, a mobility survey was performed in April 2019 for the City of Boulder on 203 residents. Information extracted from [87] brought together with the EV charging session dataset of the city of Boulder [82] could lead to more consistent and accurate representation of EV load than by using the more general NHTS. Finally, a large proportion of states share traffic volumes in various municipalities across the country (e.g., the city of Houston [86]).

France

2.1% national EV market share [57] equating to approximately 46,000 EVs sold in 2019 [121].
France (mainland) also has a large number of open data repositories. In total, 151 repositories were explored. Among them all kinds of relevant data were found. Firstly, charging sessions were recorded from April to May 2017 on Belib’ stations in Paris [95]. Furthermore, the Paris Data website provides the Belib’ real time availability of public EVSEs in Paris [97] which can be scraped on a regular basis via an API in order to reconstruct a historical dataset. Regarding private EVSEs, the charging sessions of a fleet of EVs owned by SAP Labs France have been recorded from June 2017 [96]. This dataset is updated every three months. On top of charging session data, registered vehicles across the territory [101], traffic counts in numerous cities [98], real-time traffic [99], and a national travel survey [100] are available in order to perform a spatiotemporal analysis of EV load. Different road traffic open data repositories are gathered on the Cerema website [124].

United Kingdom

2.1% national EV market share [57] equating to approximately 50,000 EVs sold in 2019 [121].
72 repositories were covered for the UK mainland which yielded multiple charging session datasets. Two of them are situated in Scotland: Dundee City [106] and Perth and Kinross City Councils [107]. The former gathers two years of charging session data from 2017 to 2018 while the latter covers four years from 2016 to 2019 to the granularity of each session. Additionally, the UK government led an EVSE analysis over the year 2017, with domestics [125], and public [126,127] chargers. The raw datasets available include charging session data for each type of EVSE. There were also some initial trials led by the UK power networks in 2013–2014 which can yield useful information [128]. Public EVSE locations are available in numerous municipalities of the UK [105] as well as a national charging point registry [104] with real-time [108] and historical traffic counts [109]. Moreover, yearly national surveys are also available [110].

3.2.2. Countries with Real-Time but No Historical Charging Session Data

Norway

46.4% national EV market share [57] equating to approximately 69,000 EVs sold in 2019 [121].
Norway is by far the country which has the highest penetration rate of EVs to date. Thus, it is no surprise that some highly relevant data for EV load modelling was found regardless of a relatively small number of repositories available (13). Norway was an early-mover in fostering EV adoption. In 2009, the first large investments were made by cities and the government with Oslo being the major contributor [2]. The most relevant data feed comes from the NOBIL database API [59]. This service provides (after benefiting of an API key from NOBIL) real-time information on EVSEs all across Norway, Sweden, Finland and Denmark (e.g., location, usage, details). Historical dumps do not seem to be available through the API, however a regular scraping may be put in place in agreement with NOBIL in order to reconstruct historical data. Other data sources which describes exogenous variables are available such as traffic volumes [60,61] and vehicle registrations by fuel types [62] which gives an overview of the trend in EV adoption.

Sweden

7.9% national EV market share [57] equating to approximately 28,000 EVs sold in 2019 [121].
Sweden, with 18 repositories covered, also benefits from the NOBIL API which gathers real-time information on public EVSEs activity across the territory [59]. Some of NOBIL’s information is gathered on an external Swedish website which provides historical statistics on EV public charge use [129]. On top of that data source, the map of public EVSEs [65] and statistics on newly registered vehicles per county, town and fuel type on a monthly basis are also available [66]. This latter dataset can be used in load forecasting models as a variable explaining the trend in EV usage particularly thanks to its monthly granularity.

Finland

4.7% national EV market share [57] equating to approximately 5700 EVs sold in 2019 [121].
Finland is also one of the countries which has adopted the NOBIL database API [59]. Amongst the 20 repositories covered, exogenous information with traffic in real time in a few municipalities (e.g., the city of Tampere was found [130]) as well as registered vehicles between 1922 and 2019 [74] and average distance travelled by vehicles between 1980 and 2015 [73]. Even though these sources, provide us with extensive historical data, the most recent years are the most relevant for EV load models. These datasets can give an overall understanding of the overall traffic trends in Finland.

Germany

2% national EV market share [57] equating to approximately 69,000 EVs sold in 2019 [121].
With regards to Germany, the most relevant datasets found among the 52 repositories covered were real-time public EVSE usage [113] and real-time traffic data [114] in the city of Bonn. Scraping both sources and associating these can lead to precise EV load models. In addition, travel surveys at fine levels of details are available from the German Mobility Panel [117] as well as the Rheinisch-Westfälisches Institute (RWI) [116]. The RWI dataset was used for a study on mobility patterns in [131]. Furthermore, the number of vehicles registered [118] and traffic counts in several municipalities [115] can give an understanding of the trend in EV usage across the country. Finally, as for most other countries, public EVSE locations are also available [112].

3.2.3. Countries with Traffic Data and No Charging Session Data

Iceland

17.2% national EV market share [57] equating to approximately 3100 EVs sold in 2019 [121].
As for Iceland, 4 repositories were covered and the most relevant datasets found do not include any charging sessions but descriptive statistics on transports in Reykjavik [63] as well as vehicles distance and fuel consumption between 1995 and 2019 [64]. This can enable an understanding of the trends in EV adoption and high-level travel behaviours. However, limited analysis can be conducted as real charging session data are unavailable and would have to be simulated from other markets. Additionally, no real-world traffic data or travel survey was found which also limits spatial studies.

China

4.5% national EV market share [57] equating to approximately 1,100,000 EVs sold in 2019 [121].
Being the country with the largest volume of EVs, China is at the forefront of EV deployment worldwide. However, this research did not result in finding any charging session data for China. One explanation for this is that more than 90% of EVSEs are owned by private firms [132]. Most of the articles which use data from charging stations on Chinese territory do not make it available as it is usually part of an agreement between the researcher and the entity owning the data. Nevertheless some relevant traffic data [76], ref. [77] for the whole territory was found and travel surveys [78] as well as EVSE locations [75] specifically in Hong-Kong.

Portugal

3.9% national EV market share [57] equating to approximately 8900 EVs sold in 2019 [121].
Regarding Portugal’s open data, traffic statistics with the number of vehicles registered by type and fuel was found [80]. Additionally, EVSE locations in Lisbon were also available [79]. No charging session data was found.

Canada

2.3% national EV market share [57] equating to approximately 13,000 EVs sold in 2019 [121].
Being the co-lead of the EVI activities along with China [57], Canada is a major player in the field of EV deployment. Around 76 repositories were explored with numerous travel surveys which describe various aspects of drivers’ behaviours [92]. Traffic volumes [91] and EV registrations [93] are also available with details on EVSEs available for public use in some municipalities (e.g., the city of Edmonton [89]). Even though no historical nor real-time charging session data was found, there exists an EV Home Charging Program [90] which gathers residential charging session data. However, this dataset is not open at the time of writing but might be accessed with the relevant access grants.

New Zealand

2.1% national EV market share [57] equating to approximately 2300 EVs sold in 2019 [121].
For New Zealand, 22 repositories were covered with successful findings in traffic statistics and vehicle registrations. Several locations in New Plymouth record traffic count [102] and the number of vehicles registered by type across the country is also available [103]. This data as-is is difficult to exploit for EV load modelling as it lacks EVSE locations and charging sessions.

Japan

1.1% national EV market share [57] equating to approximately 48,000 EVs sold in 2019 [121].
Finally, with Japan, 14 repositories which did not contain any charging session or station location information were covered. Nevertheless, exogenous data can be extracted with numerous travel surveys [119] and some statistics on registered vehicles [120].

4. EV Load Models

The scope of this review focuses on papers detailing an EV load model as defined in Section 2. Most often, the model output is the power or energy demand at EVSEs but it can also be closely related features (e.g., EVs arrival/departure times, charging durations) from which the load can be reconstructed. The papers presented in this review were selected from literature search engines with the following keywords: “Electric”, “Vehicle”, “Load”, “Model (or Modelling)”. In particular, the focus was given on presenting a wide variety of methods to encompass multiple modelling settings.
The purpose of this section is to enable an understanding of the strengths and weaknessess of the methodologies proposed to model EV load. From the papers considered for this review, EV load models can be segmented into three categories: statistical characterization, stochastic processes and machine learning models. The comprehensive list of models considered in this review is presented in Appendix A, Table A1.

4.1. Statistical Characterization

The goal of statistical characterization models is to produce a distributional analysis for the outputs shall it be data-driven [24] or entirely deduced from exogenous variables such as travel data and statistical assumptions [14]. The different characterizations of EV load and proxy variables such as charging duration or inter-arrival time are summarized in Table 2.
In [14], the authors did not benefit from any EVSE data. Nevertheless, they used the NHTS [43] ICEV behaviours from 2009 to derive EV travel patterns in order to simulate an EV fleet and characterize their behaviours. In their work, the simulation showed that the power consumption can be seen as a normal distribution without any loss of accuracy. This can be true in practice, however, it is usually more consistent to assign distributions which are defined on R + as it is unrealistic to observe negative power demand in that context. It is however convenient for model conciseness and computational speed.
In [13] a statistical analysis is conducted on data extracted from an EV trial conducted in Victoria (Australia) on 33 EVs on a 3-month period. This article showed that the Weibull distribution was the best fit for charging duration compared to the exponential and lognormal laws. They have also characterized the time to the next charging event as a mixture of two lognormal distributions. This is a vehicle-centric approach which considers the time to next charge from the EV perspective. These characterizations were used on a Monte-Carlo simulation which created 4000 EVs by random sampling and assessed their overall impact on the grid. While these distributions are more consistent than a Gaussian distribution, they still fail to capture the irregularity of EV drivers’ behaviours hidden in the data.
In [24], a dataset provided by Elaad NL [69] has been studied. This paper characterizes EV load through a mixture of beta distributions. Its parameters are optimized by minimizing the Root Mean Squared Error (RMSE) of the point-wise difference with the empirical distribution. Additionally, Kolmogorov–Smirnov testing was used to assess the goodness-of-fit. From the observations that weekly charging sessions present two peaks (namely a morning and a late afternoon peak) it was reasonable to consider a mixture of distributions to account for the different modes. In [133], 13 different charging session profiles were identified using Gaussian mixture clustering based on data provided by the G4 cities of the Netherlands. Other recent studies complement this work by using Gaussian mixtures to model the triplet (arrival time, charging duration, energy consumed) in order to characterize EV load. In [123] the triplet is modelled by a multivariate Gaussian mixture while in [134] only the couple (charging duration, energy consumed) is modelled by a Gaussian mixture with the arrival time modelled by an exponential distribution. The results produced are more accurate than for elementary distributions. However, they are structurally limited to the joint use of few covariates which keeps from fully integrating exogenous information.
A few articles also modelled EV load with a kernel density estimator (KDE). Two main types have been used in the literature: the Gaussian kernel density estimator (GKDE) and the diffusion kernel density estimator (DKDE). These methods are highly versatile because no prior knowledge over the distribution is hypothesized. Thus, they can reach high accuracy when fitting empirical data at the cost of weak interpretability. Looking at [135], a GKDE is used to estimate daily trip distance and end time of the last trip. Both variables are critical for EV charging schedules and this method improves the accuracy of the distributions compared to parametric methods. A similar conclusion is drawn in [136] from a GKDE estimating the triplet (arrival time, charging duration, charging capacity). In [137,138] the authors have compared both the GKDE and DKDE when estimating EV load. Thanks to its optimal bandwidth selection process, DKDE was found to produce better load estimations. Finally, in order to make the best of both GKDE (which is less sensitive to outliers) and DKDE (which has a higher overall accuracy), [139] has proposed a hybrid density estimator (HKDE). This HKDE reached significantly better root-mean square performance in estimating the EV load than the DKDE and GKDE on their own on the dataset used for this study.

4.2. Stochastic Processes

In the context of EV load models, three main types of stochastic processes have been detailed in the literature: purely temporal, spatiotemporal and queuing theory viewpoints. The various stochastic processes presented are summarized in Table 3.

4.2.1. Temporal

One of the early works on EV temporal load models was completed in [15] where the authors explored the stochastic nature of EV load by using probabilistic travel patterns to determine initial SoC and starting time of battery charge. In particular, assuming battery type is known, recharge starting time is then assumed to be a random variable with a probability density function (pdf) determined by the tariff structure (scenarios) and patterns of EV usage. Initial SoC is also considered as a random variable dependent on the total distance travelled since last charge. Introducing a lognormal pdf for the daily distance driven, the initial SoC can be derived assuming a linear discharge (also assuming that it was fully recharged originally). Finally, they obtain a discretized version of the stochastic process of the load on half hourly intervals for a single EV which is then extended to an arbitrary number of EVs.
In [140], the authors defined a temporal stochastic process modelling charging patterns at a public EVSE with a Markov Chain comprising three states: unoccupied, charging and plugged-in but not charging. Essentially, the Markov Chains setup assumes that the current state of the process, conditionally to all past states, only depends on the previous state. It simplifies the calculation and has been extensively studied in the literature through many applications [143]. In [140], after initializing the transition probability matrix which drives the path of the process they let the system evolve and assess the revenue made by the charging station.
Auto-regressive integrated moving averages (ARIMA) are a particular type of temporal process. Box and Jenkins [144] formalized a precise methodology to estimate the different orders of ARIMA processes. In [37] the ARIMA process is quantized on hours of the day. In other words, 24 sub-processes are estimated in their model. The final process obtained is thus a day-ahead hourly forecaster of EV load. In a following paper [141], they improved the performance of their model by forecasting separately conventional load and EV load. The results obtained in this paper reinforces the argument that EV load is structurally different from conventional load and requires specific load forecasting models.
Similarly, in [44] the authors modelled household EV load demand by using stochastic behaviours of three random variables: start-time of trip, end-time of trip and travelled distance. With a vehicle-centric approach, they present a Monte Carlo simulation method to derive overall system load. A particularity of this model is that it used a copula to characterize the multivariate distribution function of model variables. Then, using typical EV charging profiles, they derived the electricity demand at different EV uptake levels while observing the grid impacts.
Purely temporal models are particularly suited for one EVSE or one EV. They are not consistent for modelling cluster of EVSEs which require spatial considerations.

4.2.2. Spatiotemporal

Spatiotemporal models are usually designed for disaggregated approaches. The EV load at different stations is modelled separately using temporal features as well as travel patterns. They are rare in the literature as they require the combination or simulation of both the charging sessions and EV trips. Furthermore, they are limited as they cannot scale to large geographical scopes. Nevertheless, they can explore in fine details the intricacy of the relationship between EVs and EVSEs in specific regions.
In [9], the authors introduced a spatiotemporal model using Monte-Carlo simulation to specifically assess EV load demand in urban areas. The core of this method lies in the origin-destination analysis used to determine daily travel patterns of EVs. Additionally, probability functions to describe EV characteristics were identified. Using both travel patterns and EV characteristics, they ran a Monte-Carlo estimation of EV charging load for each busbar. By construction, this model can also be used for probabilistic assessment which indicates the branches most vulnerable to potential overloading.
In [18], the authors modelled both temporal and spatial stochastic aspects of PHEV owners behaviours to then derive their pdf. They modelled the temporal dimension with a uniform distribution for the start and end of charging time. As for the spatial dimension, they described the number of PHEVs arriving at an EVSE by a Poisson process according to driving behavior and traffic state. Assuming that both dimensions are independent, they derived the joint spatiotemporal pdf by multiplying both individual pdfs for charging times and arrival at EVSE. Ultimately, they expressed the effect on the daily load curve under various number of PHEVs for 150 PHEVs dispersed in the test system.
Finally, [32] proposed another probabilistic approach to characterize the spatiotemporal diversity of EV charging demand specifically on peak load demand. A Monte-Carlo simulation was used to evaluate the impacts of charging demand on the grid in urban and rural environments. It showed that this diversity of location helped the grid handle the demand better.

4.2.3. Queuing Theory

Queuing theory models often use Kendall’s shorthand notation which describes the arrival (A), the serving time (B) and the number of servers (C) in a compact form: A/B/C. EV load models are a suitable context for this theory as it was detailed in numerous articles [16,29,38,39,142].
One of the early works on EV load modelling was performed in [29]. This simple theoretical approach proposed to use an M / M / n m a x queue where the two first components characterizes the Poisson processes for the number of EVs arriving at a public EVSE and the number of EVs served while n m a x refers to the number of maximum parallel charging EVs at charging points. A case study was conducted on the first car produced by Tesla, the Roadster Model, in order to assess the stochastic power demand output from the model.
The same queuing model was also used in [38] and was compared to a Monte-Carlo simulation in order to ultimately fit a distribution for the entire load demand of PHEVs. Additionally, in [142] the authors also used this queuing model and complemented it with a fluid traffic model in order to look at EV charging load on highway charging stations.
In a more general fashion, the authors of [16] have opted for an M t / G I t / queue where the number of arrivals follows an inhomogeneous Poisson process (indicating that the intensity function varies over time), the serving time is a general time-dependent distribution with an infinite amount of servers or EVSEs in the EV load context. Using some established results of queuing theory and previous work on estimating non-homogenous Poisson process rates, the authors managed to forecast each disaggregated intensity function for day-ahead forecasting. This paper is the only one found for stochastic processes applied to EV load which uses both travel patterns from the NHTS and real charging session data.
Thus, one important advantage of queuing network analysis applied in a spatiotemporal context of EV load is that it can capture interactions among multiple charging stations. In that sense, BCMP networks (named after their inventors: Baskett, Chandy, Muntz and Palacios) introduced in [145] were applied in [39] to produce an EV load model. BCMP networks are a type of queuing network which yield a product-form stationary distribution. This kind of network is commonly used to study interconnected queues. In the EV load context, it means that it enables the model to take into account the potential shift of users from one station to another and control it to envisage different scenarios.
It is clear that queuing models are to be reserved for theoretical considerations rather than for operational implementation. Nevertheless, thanks to their solid mathematical foundations, they bring great insights for understanding EV load behaviours especially when EVSE data are scarce.

4.3. Machine Learning

Four machine learning branches have mainly been explored for modelling EV load: Linear Model (LM), Support Vector Machine (SVM), Random Forest (RF) and Artificial Neural Network (ANN). In [31] the authors compare decision trees/tables, SVM and ANN. SVM demonstrated the best performance while the ANN and decision trees are 10 times quicker to test on new data. A limitation of this work is that the dataset does not come from real charging session data but an aggregated distributional analysis produced by ECOtotality [146]. In [147], SVM, RF, k-Nearest Neighbours (k-NN) and a method called Modified Pattern-based Sequence Forecasting (MPSF) which uses k-means are compared. They found that SVMs and RF reach the best performance with regards to the Mean Absolute Error while k-NN and MPSF achieve better performance with regards to the Symmetric Mean Absolute Percentage Error. Since, k-NN and MPSF are much faster to compute predictions, they concluded that MPSF and k-NN were better suited for operational use. The different machine learning branches studied for EV load models are gathered in Table 4.

4.3.1. Linear Model

It is common practice to start addressing a machine learning problem with simple models such as LM. In [148,149] LM was chosen as a first step to implement a smart charging strategy. This gives a more realistic operational context as opposed to other articles which skip predictive models before implementing an optimal charging strategy. Furthermore, in [150] an assessment of model inputs is presented using LM. They found that the voltage level of each EV had a critical influence over their model. However, these models are limited as they cannot capture irregular patterns in the data which is expected across EV drivers.

4.3.2. Support Vector Machines

SVM were originally defined by Vapnik [153]. In a nutshell, the idea behind this algorithm is to find the hyperplane which maximizes the margin between different sets of populations. It is easy to implement but yields relatively long training times when working with large datasets.
In the context of EV load, SVM were compared to a Monte-Carlo forecasting technique in [8] and showed a better performance on a theoretical charging session dataset. Additionally, in [33] SVMs are used alongside other machine learning algorithms in order to model EV load from a vehicle-centric as well as from an EVSE-centric perspective. Because the EVSE-centric approach requires more data, it demonstrates a significantly longer running time as expected for SVMs. This study used a dataset extracted from UCLA campus parking lots. Thus, it is unlikely that these kinds of models will scale adequately for a larger scope of charging stations. Furthermore, articles using SVMs are now becoming rare as other alternatives with similar or better performances can be found.

4.3.3. Random Forests

RF is a learning algorithm which was popularized by Leo Breiman [154]. In short, it is an ensemble method which uses decision trees as elementary components for its construction.
On top of SVMs, [33] also used RF to model EV load. The few hyperparameters required to be tuned (e.g., number of trees, sampling rates) enables a fast and easy implementation with the possibility to iterate rapidly. In [12], RF demonstrated their ability to forecast day-ahead EV load charging blocks for households in an EVSE-centric fashion. As mentioned in previous paragraphs, the EVSE-centric approach can be difficult to implement as it requires large amounts of data and complex modelling. Thus, the use of RF for this kind of disaggregated approaches is adequate. [151] precisely illustrates the ability of RF to handle the EV load problem from both time and spatial dimensions. This article shows that RF can model both a single station as well as a group of stations considering spatial and temporal inputs. Single station models are more accurate as they have more consistent behaviours while the group of station models is slightly less accurate in terms of the mean absolute percentage error but brings a more holistic view to the problem. Other ensemble methods which stemmed from the same area of machine learning such as gradient boosting could also be considered [149,155].

4.3.4. Neural Networks

ANNs were initially presented by Frank Rosenblatt in 1958 [156] in their most elementary form in the name of the perceptron. They were extended shortly afterwards to the Multi-Layer Perceptron (MLP). After being forgotten for a few decades, ANNs have experienced a rebound in interest from the end of the 80s in particular with the formulation of the backpropagation algorithm [157] and the breakthroughs in computer vision with Convolutional Neural Networks (CNN) [158].
In [41] an MLP with tilted loss function is used for probabilistic forecasting of EV load. It is compared with a kernel density estimator as well as quantile regression and it showed the best performance using the same inputs and outputs. It is quite common across various scientific fields that ANNs reach the highest performance on many problems compared to other machine learning or statistical methods. The main drawback is the lack of interpretability of such models which are highly complex [159,160]. Elaborate ANN architectures such as CNNs [49] and Recurrent Neural Networks (RNNs) [28] have been explored for modelling EV load. [152] compares 12 different architectures including CNNs, RNNs. In this last article, the Long Short-Term Memory (LSTM) architecture showed the best performance on the dataset studied. From all these articles it is challenging to decide which ANN architecture is the best overall for EV load modelling. However, some clear conclusions can be made. RNNs are particularly performant as they take into account historical EV load values. In the current operational context, this is information that is hard to obtain at fine time steps. Thus, until real-time communication channels are available, it is likely that the most useful ANN models will be CNNs or RNNs with larger timesteps.

5. Matching EV Load Models to Open Datasets: A Preliminary Study

Six datasets dealing with historical charging session information have been selected for their completeness and accessibility: Boulder [82], Palo Alto [83], Dundee, [106], Perth, [107], Paris [95] and Domestics UK [125]. According to this research, none of these datasets were used in the EV load modelling literature so far. The purpose of this section is to identify the variables available and to enable a high-level understanding of charging behaviours. In addition, an association of the six datasets selected with the models reviewed in Section 4 is proposed.

5.1. Variables and Data Quality

The fields available in each of the six datasets selected are summarized in Figure 3. These six datasets provide us with session start and end times as well as the energy consumed. With the exception of the Domestics UK dataset, the station address (location), and the power level of the charging port are available in these datasets. In addition, the Palo Alto and Boulder datasets contain gasoline and greenhouse gases (GHGs) savings as well as the charge duration which represents the amount of time the vehicle was plugged-in and actively charging. This is different to the park duration which also captures the time a vehicle was plugged-in and no longer charging which is a variable only given in the Palo Alto dataset. However, this park duration can be deduced from the session start and end times in the remaining datasets. Finally, for customer specific information, the Paris data provides a unique identifier per customer badge and the Palo Alto dataset gives the post code registered by the driver. Information regarding postcodes is interesting for models that include travel inputs such as the distance between the driver’s home and stations nearby.
Additionally, a data quality analysis was conducted on the six datasets. In [152], outliers were identified by using a set threshold from the variability between current and previous values. Instead, in this analysis, fixed boundaries were chosen and the following set thresholds were observed:
  • Charge and/or Park Duration has to be positive and less than 24 h
  • Energy Consumption needs to be positive and less than 100 kWh
The first criterion is important as some datasets have some obvious errors in the end times column which are set in 1970. This might indicate a manipulation error from the customer which led to a computational mistake along the process of data collection. Additionally, as most charging sessions last for a few hours, charging sessions that lasted for more than a day were discarded.
Similarly, recorded energy consumption values for Perth [107] and Dundee [106] are highly variable, reaching anomalously negative and highly positive values indicative of potential errors. The 100 kWh upper bound was chosen as it is close to the highest capacity of the Tesla Model S which is the EV with the largest battery capacity amongst the most widespread models [161].
If a transaction does not fit these criteria, it is discarded from the following analysis. This preparation had very little impact on the Palo Alto dataset with only 0.17% of transactions discarded, while the Boulder, Dundee, Perth, Paris and Domestics UK datasets have seen 8%, 11%, 4%, 14% and 7% of their data discarded respectively.

5.2. Exploratory Analysis

Figure 4 shows the trend in the total number of transactions per day over each dataset specific time frame. Due to increasing EV uptake [1], an increase in EV charging sessions is expected as illustrated by Palo Alto and Perth. However, this is not the case for Boulder and Dundee. Instead, a decreasing number of charging sessions at the end of each time series can be observed. This could be due to external factors such as an increase in charging session prices. As for the Domestics UK, only 1 year of data are available which indicates that the plot shown describes the yearly cycle rather than the long-term trend. Similarly, the Paris data cannot be extrapolated as it only represents two months of data.
Overall statistics of the six datasets in scope are provided in Table 5. The dataset which covers the largest time frame is from the city of Palo Alto with 6 years, followed by Perth with 4 years, Boulder with a little over 2 years, Dundee with 2 years, Domestics UK with 1 years and Paris with 2 months. In terms of the transactions (or sessions), Domestics UK records the largest number of transactions. Moreover, Dundee and Boulder both cover 2 years of data but Dundee has close to three times more transactions. Naturally, there are consistently more transactions on weekdays than on weekends in total and on average across all datasets. Furthermore, the average park duration and charge duration varies significantly across the datasets. Indeed, while for Palo Alto the average park duration is around 2 h and 40 min, in Perth it is closer to 1 h and 15 min, so less than half of the time. Additionally, the average Park Duration for Domestics UK is greater than 9 h which is expected as this dataset describes residential charge instead of public charge for the others. The Charge duration on the other hand is relatively close for Boulder and Palo Alto which are both American cities (located in Colorado and California). Finally, the average energy demand is consistently between 8 to 11 kWh across all datasets.

5.3. Suggested Matching of EV Load Models with the Datasets Considered

From this exploratory analysis, some suggestions can be given on how to match the EV load models reviewed in Section 4 with the six datasets presented above. These suggestions are summarised in Table 6. The first criterion identified for this selection is whether the dataset describes public charging or residential charging. Only two of the models reviewed deal with residential charging and will thus be assigned to the Domestics UK dataset. They would benefit from the large number of records and the customer identifier provided in this dataset. Thus, it is a good setup for vehicle-centric approaches [44] and machine learning models [12].
Looking now at public charging sessions, Boulder and Palo Alto are the only two datasets which gathered GHG and gasoline savings. These fields are rather uncommon across charging session datasets and they can enable an environmental impact analysis of EVs. However, it would be limited to EV usage rather than a holistic environmental impact with lifecyle assessments [163]. Thus, no mention of this kind of analysis was found in the articles reviewed.
Nevertheless, Palo Alto also possesses the driver’s post code. With this knowledge, fine spatiotemporal processes can be derived as proposed in [32]. Additionally, the large amount of records available is suited to test the scalability of queuing models [16,39] and spatiotemporal processes [9,18] which require travel information. It also provides an ideal setup for deep learning models which require large training sets [28,33,41,49,152].
As discussed in Section 3, Boulder not only holds a charging session dataset but also a travel survey led in 2018 with a focus on EVs [87]. It is a rather qualitative survey and can be used in combination with the NHTS [43] to address the more specific behaviours inherent to the city of Boulder. With both travel and charging session data, this is also a favourable setup to apply spatiotemporal models [9,18,32]. Considering that this dataset is continuously updated and holds recent data, it would also be interesting to apply models which were precisely built for operational use such as [147,151] in the hope of taking consistent conclusions with real-world applications.
The Paris dataset holds customer identifier information which encourages vehicle-centric approaches. However, the small amount of data deters the use of models which leverage numerous parameters. Instead, statistical characterization techniques with unimodal distributions could yield a sufficient approximation of the phenomenon as proposed in [13,14] along with LM [148,149,150]. The remaining statistical characterization models (mixtures [13,24,123,133,134] and KDEs [135,136,137,138,139]) can capture diverse patterns and thus could be applied to medium-sized datasets. The Paris dataset could also be used to verify the consistency of simple queuing models as they usually struggle to find concrete applications [29,142].
As Perth and Dundee are two neighbouring cities of the UK, it would be interesting to compare the difference in charging behaviours between them. Considering that they have the same fields, it would be interesting to independently compare their behaviours as despite their closeness, it is unlikely that there is a significant spatial impact between these for public charging. Thus, temporal processes produced in [15,37,140,141] would be well suited. Additionally, thanks to the medium-size of both datasets, SVM models described in [8,33] could also be a good option here.

6. Discussion and Future Work

The purpose of this section is to highlight and discuss the current gaps and limitations from both open data and EV load models perspectives (Table 7).

6.1. Data Usage and Privacy Issues

With this article, the community has clear visibility on a carefully selected list of open datasets useful for modelling EV load (see Suplementary Materials). In most research papers, datasets obtained from system operators or other entities were not explicitly made available and no clear indication was given on how to retrieve them if it was possible. Our hope is to foster the practice of sharing Supplementary Materials with both the data used and code produced in order to encourage reproducible work in the field.
While the open data search provides visibility on charging session and traffic data, no repositories merging both was found. Thus, it is likely that the standard will remain to manipulate separate datasets for charging and traffic data as it is already the case in the literature [39,41,48] at least in the near future. As such, different locations and different grains of data will still need to be leveraged in order to perform a complete data-driven spatiotemporal description of EV load.
Battery inputs are intrinsically complex to obtain. It would involve establishing an Internet of Things (IOT) between EVs, charging stations and controllers when considering a smart charging scenario [26,27]. This type of work is currently in progress [41] and the community could benefit from new types of information for EV load models in the near future. However, so far, the articles which include these variables simulate them from prior statistical distributions.
Some of the datasets presented in Section 3 provide unique identifiers for vehicles and even driver’s registered post codes [83]. However, data regulations (e.g., GDPR in Europe [164]) may prevent spreading battery and travel inputs openly. Thus, more elaborate and complex models will be required in order to capture hidden information for disaggregated approaches.
The other variables of interest pinpointed in this review are easier to retrieve. For example, weather information can be obtained from the R package riem for a wide range of locations [55] or on the NOAA website [56]. If finer information is required, meteorological grid models can be used for that purpose. Economical and calendar variables can be tailored for each analysis depending on the grain chosen.

6.2. Other Types of Relevant Data

The open data search presented in Section 3 mainly focuses on charging session and traffic data. However, it is also possible to consider general electrical load open data [53]. Indeed, if a region switches to EVs in a given time period, this change can reflect on the regional load curve. In this context, EV load would be a latent or hidden variable contributing to the general electrical load.
In addition, grid networks data [173] and big cities’ electrical load data [165] are becoming more and more available. Combining them with charging session and traffic data may lead to models which have a holistic and data-driven understanding of the reality.
To model the load of specific appliances with general electrical load data, Non-Intrusive Load Monitoring (NILM) methodologies have received a lot of interest in the related literature [174,175]. The question addressed is whether it is possible to identify and characterize EV load within a general electrical load curve [166,167].
Synthetic data can also be used in order to produce EV load models. In most research papers, simulators rely heavily on assumptions derived from travel surveys and not so much on real charging session data [14,15,140]. Nevertheless, a data-driven simulator has been recently proposed in [134] which was trained on real-world charging sessions and thus can represent more accurately real world charging behaviours.
Finally, there are semi-open or closed data. Most of these closed datasets are related to residential load [90,176] as it is less feasible to retrieve them without raising data privacy concerns.

6.3. Composite Approaches

From a methodology perspective, it is interesting to note that very few stochastic processes approaches used real data [16]. These models are usually theoretical and can be useful for mid-term or long-term scenarios but less relevant for short-term forecasting. Alternatively, the machine learning and statistical characterization approaches presented were highly data-driven.
In the corpus of articles considered in this review, there exists no article that deals both with stochastic processes and machine learning algorithms in the context of EV load models. Thus, it would be interesting to compare them in terms of performance but also to assess what they can bring to each other in a composite model [168,169,170].
Furthermore, it was shown in many articles reviewed in Section 4 that the influx of vehicles at EVSEs is highly time dependent. Consequently, homogenous poisson processes used in articles from the corpus will not be enough to capture the reality of drivers’ behaviours [18]. More elaborate processes such as inhomegenous poisson or self-exciting point processes [177] have to be considered to account for this time dependence. Using these stochastic processes hand in hand with machine learning algorithms will foster consistency, conciseness and performance of EV load models.
Finally, another gap brought to light in this review is the lack of work on stacking models or bottom-up approaches [12] which are indeed more costly from a computational perspective but can bring a deeper understanding of EV load.

6.4. Link with Optimization

As mentioned in the introduction, EV load models are part of a two-step process. Firstly, behaviours relating to EV load demand must be understood and then current schedules optimized depending on the aim (e.g., load flattening or load balancing). The articles introducing methodologies for optimizing charging schedules usually assume a clear knowledge of the future short-term demand. It is less common to see articles which account for the potential uncertainty of EV load models. This is also due to the fact that there has been less focus given to probabilistic EV load models which could yield confidence intervals for evaluating risks of surpassing the energy supply at a given time. Additionally, probabilistic forecasting proposes a more exhaustive representation of the demand as it does not solely focus on the mean demand.
Solutions which include both forecasting and optimization aspects in the same model or process are required [6,178]. Again, using the same data for this purpose is essential, as it enables the development of solutions by researchers specialized in different fields such as forecasting and optimization. To unify both, methodologies can be also developed using reinforcement learning [172]. In addition, specific losses related to the exploitation of probabilistic forecasts in smart charging strategies could be relevant [171].

7. Conclusions

In this paper, the reader is provided with a comprehensive list of open data that can be used to model EV load. Additionally, an organized review of EV load models is presented. Finally, six datasets are explored to provide recommendations on how they can be matched to the EV load models reviewed. The open data search focused on the top 14 countries of the EVI ranked by national EV market share. A total of 860+ open data repositories was covered which yielded more than 60 open datasets relevant for modelling EV load.
Across the literature, a wide spectrum of EV load models were reviewed. This includes statistical characterization models from parametric (unimodal distributions and mixtures) to non-parametrical estimation (KDE). Furthermore, stochastic processes with purely temporal models, spatiotemporal models and queues were also included. Finally, machine learning models including LM, SVM, RF and ANN were reviewed. From the open data research, six datasets which have not been previously studied in the literature were considered. Recommendations were provided on how the models reviewed could be matched to each dataset.
Points to consider for future work involving EV associated data include: the regulatory landscape, accessibility and the ability to merge data sources (e.g., travel and charge). This will involve bridging gaps between various stakeholders to establish a comprehensive IOT. As for future work in EV load modelling, composite approaches and links with optimization are to be explored further.
We hope that this article will encourage the use of the open datasets and models reviewed in order to foster reproducible work and breakthroughs in the field of EV load modelling.

Supplementary Materials

The code used to analyze the datasets in Section 5 is available at this GitHub repository (accessed on 17 March 2021).

Author Contributions

Y.A.-O. defined the scope of the review, performed the open data search, analyzed the data and drafted the paper. Y.G. assessed the relevance of papers reviewed and the data analysis. P.M. and J.-M.P., provided formal analysis of the review. H.Y. included industrial considerations. All authors have read and agreed to the published version of the manuscript.

Funding

This research received no external funding.

Acknowledgments

The authors would like to acknowledge the contribution of Benjamin Mousseau and Emma Chieusse-Gérard from EDF Energy who brought to our knowledge the existence of the Domestics UK dataset as well as Emma Yule from Edinburgh University who kindly proofread the article.

Conflicts of Interest

The authors declare no conflict of interest.

Abbreviations

The following abbreviations are used in this manuscript:
EVElectric Vehicle
ICEVInternal Combustion Engine Vehicle
IEAInternational Energy Agency
EVIElectric Vehicle Initiative
EVSEElectric Vehicle Supply Equipment
V2GVehicle-to-Grid
SoCState of Charge
EEnergy Consumption
CBattery Capacity
S o C i n i t Initial State of Charge
DDistance Travelled
NHTSNational Household Travel Survey
GDPGross Domestic Product
NOAANational Oceanic and Atmospheric Administration
RWIRheinisch-Westfälisches Institute
RMSERoot Mean Squared Error
KDEKernel Density Estimator
GKDEGaussian Kernel Density Estimator
DKDEDiffusion Kernel Density Estimator
HKDEHybrid Kernel Density Estimator
pdfprobabilty density function
ARIMAAuto-Regressive Integrated Moving Average
LMLinear Model
SVMSupport Vector Machine
RFRandom Forest
ANNArtificial Neural Network
k-NNk-Nearest Neighbours
MPSFModified Pattern-based Sequence Forecasting
MLPMulti-Layer Perceptron
CNNConvolutional Neural Network
RNNRecurrent Neural Network
LSTMLong Short-Term Memory
GHGGreenhouse Gases
IOTInternet of Things
NILMNon-Intrusive Load Monitoring

Appendix A. EV Load Models

Table A1. Exhaustive list of models presented in Section 4 with the input dataset(s) used (if applicable), the approach taken (Aggregated, Vehicle-centric or EVSE-centric) and the output variable(s) modelled. For the input datasets, the data repositories or data reports are provided as references when they were clearly made available by the authors of the paper.
StudyModel(s)Output Variable(s)ApproachInput Dataset(s)
[8]SVM and Monte-CarloPower DemandVehicle-centricBeijing Olympic Games EV charging station
[9]Monte-Carlo Simulation with origin destination analysisPower DemandVehicle-centricEU merge EV database
[12]RFPower DemandVehicle-centric and EVSE-centricCharging sessions from Pecan Street [176]
[13]Weibull and Lognormal DistributionsCharge Duration, Daily Charge Frequency, Energy Demand, Time to next chargeVehicle-centricCharging sessions from the Victorian EV Trial [179]
[14]Gaussian DistributionPower DemandVehicle-centricNHTS daily trips [43]
[15]Temporal stochastic process with scenariosPower DemandVehicle-centricEV charging load for lead-acid and lithium-ion batteries and UK National Travel Survey [180]
[16] M t / G I t / queuePower DemandVehicle-centric and EVSE-centricNHTS [43], charging sessions from the UC Davis PH&EV center [181]
[18]Spatiotemporal stochastic process with uniform and poisson distributions on different schedules and state transitionsPower DemandVehicle-centric and aggregatedBMW Mini E (PHEV) battery characteristics from the smart grid integration project (Shanghai expo garden)
[24]Beta MixtureNumber of plugged-in and plugged-out EVs, Charge DurationAggregated and vehicle-centricCharging sessions from ElaadNL [69]
[28]ANN, RNN, LSTM and Gated Recurrent Units (GRU)Energy DemandAggregatedCharging sessions in Shenzhen
29] M / M / n m a x queuePower DemandVehicle-centric and EVSE-centricTesla Roadster EV characteristics [182]
[31]Decision trees/tables, SVM, ANNPower DemandAggregatedResidential charging sessions provided by ECOtatility [146], public EVSE data pilot EV project in France
[32]Spatiotemporal monte-carlo simulation based on EV trial dataPower DemandVehicle-centricCharging sessions and EV journeys from the Switch EV trial
[33]MPSF, SVM and RFEnergy Demand (Charging Profile)Vehicle-centric and EVSE-centricCharging sessions from UCLA campus data
[37]ARIMA and rule-based probabilistic modelPower Demand (via the SoC after charge)Vehicle-centricPJM historical load data [183], EV drivers simulated data from the Power Systems Engineering Research Center [184]
[38] M / M / n m a x queuePower DemandVehicle-centric and EVSE-centricEV drivers simulated data from the Power Systems Engineering Research Center [184]
[39]BCMP networkPower DemandVehicle-centric and EVSE-centricNHTS [43], New York State Transportation Federation Traffic Data Viewer [185] and Ontario Electricity prices 1
[41]Quantile regression, MLP and KDETrip Distance and Parking DurationVehicle-centricParking events derived from trip data from MiD2008 [186]
[44]Monte-Carlo Simulation with copulas and scenariosEnergy Demand (via initial SoC)Vehicle-centricTransportation data from the Dutch Ministry of Transportation [187]
[49]Lion algorithm with Niche Immunity for a CNNPower DemandAggregatedCharging sessions in one charging station in Beijing
[123]Gaussian MixtureArrival Time, Charge Duration, Energy DemandVehicle-centricCharging sessions from the ACN data [85]
[133]Gaussian MixtureClusters of EV user profiles-Charging sessions provided by the G4 cities of the Netherlands
[134]Poisson Distribution and Gaussian MixtureArrival Time, Charge Duration, Energy DemandVehicle-centricCharging sessions from ElaadNL [69]
[135]GKDEDaily Trip Distance and end time of last tripVehicle-centricNHTS daily trips [43]
[136]GKDEArrival Time, Charge Duration, Charge CapacityVehicle-centricCharging sessions from an EV charging service company platform in Nanjing
[137]GKDE and DKDECharge Duration and Energy DemandVehicle-centricCharging sessions from UCLA campus
[138]GKDE and DKDECharge Duration, Energy DemandVehicle-centricCharging sessions from UCLA campus and from My Electric Avenue Project trial [188]
[139]HKDECharge Duration and Energy DemandVehicle-centricCharging sessions from UCLA campus and from My Electric Avenue Project trial [188]
[140]3-state temporal Markov ChainEnergy DemandVehicle-centric-
[141]ARIMA and rule-based probabilistic modelPower Demand (via the SoC after charge)Vehicle-centricPJM historical load data [183]
[142] M / M / n m a x queuePower DemandVehicle-centric and EVSE-centricTraffic fluid model [189]
[147]MPSF, kNN, SVM and RFEnergy DemandEVSE-centricCharging sessions from UCLA campus data
[148]Mean estimation and Linear RegressionEnergy Demand (Charging Profile)Vehicle-centricCharging sessions from UCLA campus data
[149]Linear Regression, Gradient Boosting, ANNDeparture timeVehicle-centricEV charging records from SAP Walldorf
[150]Linear RegressionPower Demand (Charging Speed)AggregatedCharging sessions from EVNET and NUON energy providers in Amsterdam
[151]RF, SVM and Decition treeEnergy Demand (Charging capacity)EVSE-centricCharging sessions in Shenzhen
[152]ANN, RNN, GRU, Stacked auto-encoders and LSTMPower DemandAggregatedCharging sessions in Shenzhen
1 The link provided in the article is no longer available online.

References

  1. International Energy Agency. Global EV Outlook 2019: Scaling-Up the Transition to Electric Mobility; OECD: Paris, France, 2019. [Google Scholar] [CrossRef]
  2. Kvisle, H. The Norwegian Charging Station Database for Electromobility (NOBIL). World Electr. Veh. J. 2012, 5, 702–707. [Google Scholar] [CrossRef] [Green Version]
  3. International Energy Agency. Electric Vehicle Stock in the EV30@30 Scenario. Library Catalog. Available online: www.iea.org (accessed on 13 April 2021).
  4. Clean Energy Ministerial. Electric Vehicles Initiative. Available online: www.cleanenergyministerial.org/initiative-clean-energy-ministerial/electric-vehicles-initiative (accessed on 17 March 2021).
  5. Galus, M.D.; Vayá, M.G.; Krause, T.; Andersson, G. The role of electric vehicles in smart grids: The role of electric vehicles in smart grids. Wiley Interdiscip. Rev. Energy Environ. 2013, 2, 384–400. [Google Scholar] [CrossRef]
  6. Lopez, K.L.; Gagne, C.; Gardner, M.A. Demand-Side Management Using Deep Learning for Smart Charging of Electric Vehicles. IEEE Trans. Smart Grid 2019, 10, 2683–2691. [Google Scholar] [CrossRef]
  7. Fachrizal, R.; Shepero, M.; van der Meer, D.; Munkhammar, J.; Widén, J. Smart charging of electric vehicles considering photovoltaic power production and electricity consumption: A review. eTransportation 2020, 4, 100056. [Google Scholar] [CrossRef]
  8. Xydas, E.S.; Marmaras, C.E.; Cipcigan, L.M.; Hassan, A.S.; Jenkins, N. Forecasting Electric Vehicle charging demand using Support Vector Machines. In Proceedings of the 2013 48th International Universities’ Power Engineering Conference (UPEC), Dublin, Ireland, 2–5 September 2013; pp. 1–6. [Google Scholar] [CrossRef]
  9. Mu, Y.; Wu, J.; Jenkins, N.; Jia, H.; Wang, C. A Spatial–Temporal model for grid impact analysis of plug-in electric vehicles. Appl. Energy 2014, 114, 456–465. [Google Scholar] [CrossRef] [Green Version]
  10. Tie, S.F.; Tan, C.W. A review of energy sources and energy management system in electric vehicles. Renew. Sustain. Energy Rev. 2013, 20, 82–102. [Google Scholar] [CrossRef]
  11. Yamashita, K.; Li, J.; Zhang, P.; Liu, C.C. Analysis and control of major blackout events. In Proceedings of the 2009 IEEE/PES Power Systems Conference and Exposition, Seattle, WA, USA, 15–18 March 2009; pp. 1–4. [Google Scholar] [CrossRef]
  12. Gerossier, A.; Girard, R.; Kariniotakis, G. Modeling and Forecasting Electric Vehicle Consumption Profiles. Energies 2019, 12, 1341. [Google Scholar] [CrossRef] [Green Version]
  13. Khoo, Y.B.; Wang, C.H.; Paevere, P.; Higgins, A. Statistical modeling of Electric Vehicle electricity consumption in the Victorian EV Trial, Australia. Transp. Res. Part D Transp. Environ. 2014, 32, 263–277. [Google Scholar] [CrossRef]
  14. Sun, K.; Sarker, M.R.; Ortega-Vazquez, M.A. Statistical characterization of electric vehicle charging in different locations of the grid. In Proceedings of the 2015 IEEE Power & Energy Society General Meeting, Denver, CO, USA, 26–30 July 2015; pp. 1–5. [Google Scholar] [CrossRef]
  15. Qian, K.; Zhou, C.; Allan, M.; Yuan, Y. Modeling of Load Demand Due to EV Battery Charging in Distribution Systems. IEEE Trans. Power Syst. 2011, 26, 802–810. [Google Scholar] [CrossRef]
  16. Alizadeh, M.; Scaglione, A.; Davies, J.; Kurani, K.S. A Scalable Stochastic Model for the Electricity Demand of Electric and Plug-In Hybrid Vehicles. IEEE Trans. Smart Grid 2014, 5, 848–860. [Google Scholar] [CrossRef]
  17. Xu, N.Z.; Chung, C.Y. Challenges in Future Competition of Electric Vehicle Charging Management and Solutions. IEEE Trans. Smart Grid 2015, 6, 1323–1331. [Google Scholar] [CrossRef]
  18. Jiang, H.; Ren, H.; Sun, C.; Watts, D. The temporal-spatial stochastic model of plug-in hybrid electric vehicles. In Proceedings of the 2017 IEEE PES Innovative Smart Grid Technologies Conference Europe (ISGT-Europe), Torino, Italy, 26–29 September 2017; pp. 1–6. [Google Scholar] [CrossRef]
  19. Richardson, D.B. Electric vehicles and the electric grid: A review of modeling approaches, Impacts, and renewable energy integration. Renew. Sustain. Energy Rev. 2013, 19, 247–254. [Google Scholar] [CrossRef]
  20. Heydt, G.T. The impact of electric vehicle deployment on load management straregies. IEEE Trans. Power Appar. Syst. 1983, 5, 1253–1259. [Google Scholar] [CrossRef]
  21. Sadeghianpourhamami, N.; Refa, N.; Strobbe, M.; Develder, C. Quantitive analysis of electric vehicle flexibility: A data-driven approach. Int. J. Electr. Power Energy Syst. 2018, 95, 451–462. [Google Scholar] [CrossRef] [Green Version]
  22. Kara, E.C.; Macdonald, J.S.; Black, D.; Bérges, M.; Hug, G.; Kiliccote, S. Estimating the benefits of electric vehicle smart charging at non-residential locations: A data-driven approach. Appl. Energy 2015, 155, 515–525. [Google Scholar] [CrossRef] [Green Version]
  23. Kempton, W.; Letendre, S.E. Electric vehicles as a new power source for electric utilities. Transp. Res. Part D Transp. Environ. 1997, 2, 157–175. [Google Scholar] [CrossRef]
  24. Flammini, M.G.; Prettico, G.; Julea, A.; Fulli, G.; Mazza, A.; Chicco, G. Statistical characterisation of the real transaction data gathered from electric vehicle charging stations. Electr. Power Syst. Res. 2019, 166, 136–150. [Google Scholar] [CrossRef]
  25. Saldaña, G.; San Martin, J.I.; Zamora, I.; Asensio, F.J.; Oñederra, O. Electric Vehicle into the Grid: Charging Methodologies Aimed at Providing Ancillary Services Considering Battery Degradation. Energies 2019, 12, 2443. [Google Scholar] [CrossRef] [Green Version]
  26. Chokkalingam, B.; Padmanaban, S.; Siano, P.; Krishnamoorthy, R.; Selvaraj, R. Real-Time Forecasting of EV Charging Station Scheduling for Smart Energy Systems. Energies 2017, 10, 377. [Google Scholar] [CrossRef] [Green Version]
  27. Ahmed, M.A.; El-Sharkawy, M.R.; Kim, Y.C. Remote Monitoring of Electric Vehicle ChargingStations in Smart Campus Parking Lot. J. Mod. Power Syst. Clean Energy 2020, 8, 124–132. [Google Scholar] [CrossRef]
  28. Zhu, J.; Yang, Z.; Guo, Y.; Zhang, J.; Yang, H. Short-Term Load Forecasting for Electric Vehicle Charging Stations Based on Deep Learning Approaches. Appl. Sci. 2019, 9, 1723. [Google Scholar] [CrossRef] [Green Version]
  29. Garcia-Valle, R.; Vlachogiannis, J.G. Letter to the Editor: Electric Vehicle Demand Model for Load Flow Studies. Electr. Power Components Syst. 2009, 37, 577–582. [Google Scholar] [CrossRef] [Green Version]
  30. Olivella-Rosell, P.; Villafafila-Robles, R.; Sumper, A.; Bergas-Jané, J. Probabilistic Agent-Based Model of Electric Vehicle Charging Demand to Analyse the Impact on Distribution Networks. Energies 2015, 8, 4160–4187. [Google Scholar] [CrossRef]
  31. Xydas, S.; Marmaras, C.; Cipcigan, L.; Hassan, A.; Jenkins, N. Electric Vehicle Load Forecasting using Data Mining Methods. In Proceedings of the Hybrid and Electric Vehicles Conference (HEVC), London, UK, 6–7 November 2013; Institution of Engineering and Technology: London, UK, 2013; p. 10.1. [Google Scholar] [CrossRef]
  32. Neaimeh, M.; Wardle, R.; Jenkins, A.M.; Yi, J.; Hill, G.; Lyons, P.F.; Hübner, Y.; Blythe, P.T.; Taylor, P.C. A probabilistic approach to combining smart meter and electric vehicle charging data to investigate distribution network impacts. Appl. Energy 2015, 157, 688–698. [Google Scholar] [CrossRef] [Green Version]
  33. Majidpour, M.; Qiu, C.; Chu, P.; Pota, H.R.; Gadh, R. Forecasting the EV charging load based on customer profile or station measurement? Appl. Energy 2016, 163, 134–141. [Google Scholar] [CrossRef] [Green Version]
  34. Li, J.; Klee Barillas, J.; Guenther, C.; Danzer, M.A. A comparative study of state of charge estimation algorithms for LiFePO4 batteries used in electric vehicles. J. Power Sources 2013, 230, 244–250. [Google Scholar] [CrossRef]
  35. Topić, J.; Škugor, B.; Deur, J. Neural Network-Based Modeling of Electric Vehicle Energy Demand and All Electric Range. Energies 2019, 12, 1396. [Google Scholar] [CrossRef] [Green Version]
  36. Amini, M.H.; Moghaddam, M.P. Probabilistic modelling of electric vehicles’ parking lots charging demand. In Proceedings of the 2013 21st Iranian Conference on Electrical Engineering (ICEE), Mashhad, Iran, 14–16 May 2013; pp. 1–4. [Google Scholar] [CrossRef]
  37. Amini, M.; Karabasoglu, O.; Ilic, M.D.; Boroojeni, K.G.; Iyengar, S.S. ARIMA-based demand forecasting method considering probabilistic model of electric vehicles’ parking lots. In Proceedings of the 2015 IEEE Power & Energy Society General Meeting, Denver, CO, USA, 26–30 July 2015; pp. 1–5. [Google Scholar] [CrossRef]
  38. Li, G.; Zhang, X.P. Modeling of Plug-in Hybrid Electric Vehicle Charging Demand in Probabilistic Power Flow Calculations. IEEE Trans. Smart Grid 2012, 3, 492–499. [Google Scholar] [CrossRef]
  39. Liang, H.; Sharma, I.; Zhuang, W.; Bhattacharya, K. Plug-in electric vehicle charging demand estimation based on queueing network analysis. In Proceedings of the 2014 IEEE PES General Meeting|Conference & Exposition, National Harbor, MD, USA, 27–31 July 2014; pp. 1–5. [Google Scholar] [CrossRef]
  40. Paevere, P.; Higgins, A.; Ren, Z.; Horn, M.; Grozev, G.; McNamara, C. Spatio-temporal modelling of electric vehicle charging demand and impacts on peak household electrical load. Sustain. Sci. 2014, 9, 61–76. [Google Scholar] [CrossRef]
  41. Huber, J.; Dann, D.; Weinhardt, C. Probabilistic forecasts of time and energy flexibility in battery electric vehicle charging. Appl. Energy 2020, 262, 114525. [Google Scholar] [CrossRef]
  42. Wang, H. Energy consumption of electric vehicles based on real-world driving patterns: A case study of Beijing. Appl. Energy 2015, 157, 710–719. [Google Scholar] [CrossRef]
  43. National Household Travel Survey. Available online: nhts.ornl.gov (accessed on 17 March 2021).
  44. Lojowska, A.; Kurowicka, D.; Papaefthymiou, G.; van der Sluis, L. Stochastic Modeling of Power Demand Due to EVs Using Copula. IEEE Trans. Power Syst. 2012, 27, 1960–1968. [Google Scholar] [CrossRef]
  45. Hong, T.; Fan, S. Probabilistic electric load forecasting: A tutorial review. Int. J. Forecast. 2016, 32, 914–938. [Google Scholar] [CrossRef]
  46. Gaillard, P.; Goude, Y.; Nedellec, R. Additive models and robust aggregation for GEFCom2014 probabilistic electric load and electricity price forecasting. Int. J. Forecast. 2016, 32, 1038–1050. [Google Scholar] [CrossRef]
  47. Xydas, E.; Marmaras, C.; Cipcigan, L.M.; Jenkins, N.; Carroll, S.; Barker, M. A data-driven approach for characterising the charging demand of electric vehicles: A UK case study. Appl. Energy 2016, 162, 763–771. [Google Scholar] [CrossRef] [Green Version]
  48. Arias, M.B.; Bae, S. Electric vehicle charging demand forecasting model based on big data technologies. Appl. Energy 2016, 183, 327–339. [Google Scholar] [CrossRef]
  49. Li, Y.; Huang, Y.; Zhang, M. Short-Term Load Forecasting for Electric Vehicle Charging Station Based on Niche Immunity Lion Algorithm and Convolutional Neural Network. Energies 2018, 11, 1253. [Google Scholar] [CrossRef] [Green Version]
  50. Valsera-Naranjo, E.; Sumper, A.; Villafafila-Robles, R.; Martínez-Vicente, D. Probabilistic Method to Assess the Impact of Charging of Electric Vehicles on Distribution Grids. Energies 2012, 5, 1503–1531. [Google Scholar] [CrossRef] [Green Version]
  51. Huang, S.; Infield, D. The potential of domestic electric vehicles to contribute to Power System Operation through vehicle to grid technology. In Proceedings of the 2009 44th International Universities Power Engineering Conference (UPEC), Glasgow, UK, 1–4 September 2009; pp. 1–5. [Google Scholar]
  52. Kelly, J.C.; MacDonald, J.S.; Keoleian, G.A. Time-dependent plug-in hybrid electric vehicle charging based on national driving patterns and demographics. Appl. Energy 2012, 94, 395–405. [Google Scholar] [CrossRef]
  53. Wang, Y.; Chen, Q.; Hong, T.; Kang, C. Review of Smart Meter Data Analytics: Applications, Methodologies, and Challenges. IEEE Trans. Smart Grid 2019, 10, 3125–3148. [Google Scholar] [CrossRef] [Green Version]
  54. Open Data Inception. Library Catalog. Available online: data.opendatasoft.com (accessed on 17 March 2021).
  55. Salmon, M. riem: Accesses Weather Data from the Iowa Environment Mesonet, 2016. Library Catalog. Available online: cran.r-project.org (accessed on 13 April 2020).
  56. National Oceanic and Atmospheric Administration (NOAA). Data Access|National Centers for Environmental Information (NCEI) Formerly Known as National Climatic Data Center (NCDC). Library Catalog. Available online: www.ncdc.noaa.gov/data-access (accessed on 17 March 2021).
  57. International Energy Agency. Electric Car Market Shares in Electric Vehicle Initiative Countries, 2019. Library Catalog. Available online: www.iea.org (accessed on 17 March 2021).
  58. Electric Vehicle Market Statistics 2020—How Many Electric Cars in UK? Available online: www.nextgreencar.com/electric-cars/statistics/ (accessed on 17 March 2021).
  59. NOBIL. NOBIL Database. Library Catalog. Available online: info.nobil.no/eng (accessed on 17 March 2021).
  60. DataNorge. Traffic Volumes. Library Catalog. Available online: data.norge.no (accessed on 17 March 2021).
  61. StatisticsNorway. Road Traffic Volumes, by Main Type of Vehicle, Type of Fuel and Age of Vehicle 2005–2019. Library Catalog. Available online: www.ssb.no (accessed on 17 March 2021).
  62. StatisticsNorway. Registered Vehicles. Library Catalog. Available online: www.ssb.no (accessed on 17 March 2021).
  63. Reykjavík. Reykjavík Transport. Library Catalog. Available online: opingogn.is (accessed on 17 March 2021).
  64. StatisticsIceland. Registered Motor Vehicles. Library Catalog. Available online: www.statice.is (accessed on 17 March 2021).
  65. ElbilSverige. Charging Point Locations in Nordic Countries. Library Catalog. Available online: www.elbilsverige.se (accessed on 17 March 2021).
  66. StatisticsSweden. Registered Vehicles. Library Catalog. Available online: www.statistikdatabasen.scb.se (accessed on 17 March 2021).
  67. RotterdamOpenData. Charging Point Locations and Usage in Rotterdam. Library Catalog. Available online: rotterdamopendata.nl (accessed on 17 March 2021).
  68. EindhovenOpenData. Charging Point Locations in Eindhoven. Library Catalog. Available online: data.eindhoven.nl (accessed on 17 March 2021).
  69. Elaad NL. Data Analytics. Library Catalog. Available online: www.elaad.nl/research/data-analytics/ (accessed on 17 March 2021).
  70. CBS. Centraal Bureau Voor De Statistiek: Motor vehicles; type, age class. Available online: opendata.cbs.nl/statline/ (accessed on 17 March 2021).
  71. CBS. Centraal Bureau Voor De Statistiek: Onderzoek Onderweg in Nederland—ODiN 2018, 2019. Library Catalog. Available online: easy.dans.knaw.nl (accessed on 17 March 2021).
  72. CBS. Centraal Bureau Voor De Statistiek: Mobility by Person, Transport Mode and Region. Library Catalog. Available online: opendata.cbs.nl/statline/ (accessed on 17 March 2021).
  73. StatisticsFinland. Average Commuting Distance by Year. Library Catalog. Available online: pxnet2.stat.fi (accessed on 17 March 2021).
  74. StatisticsFinland. Number of Vehicles Registered by Year, Vehicle Class and Information. Library Catalog. Available online: Pxnet2.stat.fi (accessed on 17 March 2021).
  75. Data Gov Hong-Kong. Statistics on Passenger, Visitor and Vehicular Traffic. Library Catalog. Available online: data.gov.hk (accessed on 17 March 2021).
  76. StatsGov. China Statistical Yearbook 2018. Library Catalog. Available online: www.stats.gov.cn/tjsj/ndsj/2018/indexeh.htm (accessed on 17 March 2021).
  77. Data Gov Hong-Kong. Details of HK Electric EV Charging Stations. Library Catalog. Available online: data.gov.hk (accessed on 17 March 2021).
  78. Data Gov Hong-Kong. Traffic Surveys in Kowloon East. Library Catalog. Available online: data.gov.hk (accessed on 17 March 2021).
  79. DadosGOV. Charging Stations E-mobility in Lisbon. Library Catalog. Available online: dados.gov.pt (accessed on 17 March 2021).
  80. PORDATA. Traffic Satistics in Portugal. Library Catalog. Available online: www.pordata.pt (accessed on 17 March 2021).
  81. US Department of Energy. Alternative Fuels Data Center. Library Catalog. Available online: afdc.energy.gov/datadownload (accessed on 17 March 2021).
  82. Makram, L. Electric Vehicle Charging Stations: Energy Consumption & Savings. Library Catalog. Available online: open-data.bouldercolorado.gov (accessed on 17 March 2021).
  83. City of Palo Alto. Electric Vehicle Charging Station Usage (July 2011–December 2017) · Open Data. Library Catalog. Available online: data.cityofpaloalto.org (accessed on 17 March 2021).
  84. City of Evanston. City-Owned Electric Vehicle Charging Station Usage January 2016 to August 2017|Open Data. Library Catalog. Available online: data.cityofevanston.org (accessed on 17 March 2021).
  85. ACN-Data—A Public EV Charging Dataset. Library Catalog. Available online: ev.caltech.edu/dataset (accessed on 17 March 2021).
  86. City of Houston. Traffic Counts in the City of Houston. Library Catalog. Available online: cohgis-mycity.opendata.arcgis.com (accessed on 17 March 2021).
  87. Skerpan, B. Resident Mobility Survey. Library Catalog. Available online: open-data.bouldercolorado.gov (accessed on 17 March 2021).
  88. New York State. Electric Vehicles per County|Open Data NY. Library Catalog. Available online: data.ny.gov (accessed on 17 March 2021).
  89. City of Edmonton. Public Charging Stations for Electric Vehicles. Library Catalog. Available online: data.edmonton.ca (accessed on 17 March 2021).
  90. OpenGovOntario. Electric Vehicle Home Charging Program Applicant Data. Library Catalog. Available online: data.ontario.ca (accessed on 17 March 2021).
  91. TrafficDataProgram. Annual Traffic Volumes 2004–2010 in British Columbia. Library Catalog. Available online: catalogue.data.gov.bc.ca (accessed on 17 March 2021).
  92. CanadaGov. Canadian Travel Survey, Travel in Canada, by Travel Duration. Library Catalog. Available online: open.canada.ca (accessed on 17 March 2021).
  93. Milot, G. Electric and Hybrid Vehicles–CKAN. Library Catalog. Available online: donnees.ville.montreal.qc.ca (accessed on 17 March 2021).
  94. IRVE. Charging Point Locations for Electric Vehicles. Library Catalog. Available online: opendata.reseaux-energies.fr (accessed on 17 March 2021).
  95. DataGouv. Charging Sessions April–May 2017 in Paris. Library Catalog. Available online: www.data.gouv.fr (accessed on 17 March 2021).
  96. SAPLabs. Electric Vehicle Charging Transactions of SAP Labs France Company Fleet. Available online: https://search.sap.com (accessed on 17 March 2021).
  97. ParisData. Belib’ Availability in Real-Time. Library Catalog. Available online: opendata.paris.fr (accessed on 17 March 2021).
  98. ParisData. Historical Traffic Counts in Paris. Library Catalog. Available online: opendata.paris.fr (accessed on 17 March 2021).
  99. RennesMétropole. Real-Time Traffic in Rennes. Library Catalog. Available online: data.rennesmetropole.fr (accessed on 17 March 2021).
  100. INSEE. Travel Survey 2015: Home to Work. Library Catalog. Available online: data.grandparissud.fr (accessed on 17 March 2021).
  101. INSEE. Registered Vehicles in France from 1990 to 2018. Library Catalog. Available online: www.insee.fr (accessed on 17 March 2021).
  102. New Plymouth District Council. Traffic Counts in New Plymouth. Library Catalog. Available online: www.newplymouthnz.com (accessed on 17 March 2021).
  103. StatsNZ. Motor Vehicles Registered. Library Catalog. Available online: archive.stats.govt.nz (accessed on 17 March 2021).
  104. Office for Low Emission Vehicles. National Charge Point Registry. Library Catalog. 2012. Available online: data.gov.uk (accessed on 17 March 2021).
  105. Sunderland City Council. Charge Your Car. Library Catalog. Available online: www.sunderland.gov.uk/chargeyourcar (accessed on 17 March 2021).
  106. TransportTeam. Electric Vehicle Charging Sessions Dundee. Library Catalog. Available online: data.dundeecity.gov.uk (accessed on 17 March 2021).
  107. Open Data Team. Electric Vehicle Charging Station Usage in Perth and Kinross. Library Catalog. Available online: data.pkc.gov.uk (accessed on 17 March 2021).
  108. Radford, A. Birmingham and West Midlands Real-Time Traffic Data. Library Catalog. Available online: data.birmingham.gov.uk (accessed on 17 March 2021).
  109. Department for Transport. Traffic Flows, Borough. Library Catalog. Available online: data.london.gov.uk (accessed on 17 March 2021).
  110. UKDataService. National Travel Survey 2002–2017. Library Catalog. Available online: www.ukdataservice.ac.uk (accessed on 17 March 2021).
  111. Smith, O. How Many Left? Library Catalog. Available online: www.howmanyleft.co.uk (accessed on 17 March 2021).
  112. Offenes Daten Portal. Charging Point Locations in Moers. Library Catalog. Available online: www.offenesdatenportal.de (accessed on 17 March 2021).
  113. Open Data Bonn. Charging Point Locations and Usage in Real-Time in Bonn. Library Catalog. Available online: opendata.bonn.de (accessed on 17 March 2021).
  114. Open Data Bonn. Real-Time Traffic in Bonn. Library Catalog. Available online: opendata.bonn.de (accessed on 17 March 2021).
  115. Open Data Bayern. Traffic Volumes in Bayern. Library Catalog. Available online: opendata.bayern.de (accessed on 17 March 2021).
  116. FDZ Ruhr am RWI, Research Data Center. Library Catalog. Available online: www.rwi-essen.de (accessed on 17 March 2021).
  117. Ecke, L. German Mobility Panel—Startseite. Library Catalog. 2020. Available online: mobilitaetspanel.ifv.kit.edu/english/index.php (accessed on 17 March 2021).
  118. Bochum. Registered Vehicles in Bochum. Library Catalog. Available online: www.bochum.de (accessed on 17 March 2021).
  119. MLIT. Travel Survey in Japan from April 2019. Library Catalog. Available online: www.mlit.go.jp (accessed on 17 March 2021).
  120. e Stat. Registered Vehicles in Japan. Library Catalog. Available online: www.e-stat.go.jp (accessed on 17 March 2021).
  121. Passenger Car Sales by Country, around the World. Library Catalog. Available online: www.theglobaleconomy.com (accessed on 17 March 2021).
  122. Nationale Databank Wegverkeersgegevens. Real-Time and Historical Traffic in the Netherlands. Library Catalog. Available online: opendata.ndw.nu (accessed on 17 March 2021).
  123. Lee, Z.J.; Li, T.; Low, S.H. ACN-Data: Analysis and Applications of an Open EV Charging Dataset. In Proceedings of the Tenth ACM International Conference on Future Energy Systems, Phoenix, AZ, USA, 25–28 June 2019; pp. 139–149. [Google Scholar] [CrossRef]
  124. Cerema. Road Traffic Open Data. Library Catalog. 2020. Available online: trafic-routier.data.cerema.fr (accessed on 17 March 2021).
  125. Department for Transport. Domestics Chargepoint Analysis 2017. Library Catalog. 2018. Available online: data.gov.uk (accessed on 17 March 2021).
  126. Department for Transport. Rapid Chargepoint Analysis 2017. Library Catalog. 2018. Available online: www.gov.uk (accessed on 17 March 2021).
  127. Department for Transport. Fast Chargepoint Analysis 2017. Library Catalog. 2018. Available online: www.gov.uk (accessed on 17 March 2021).
  128. LondonDatastore. Low Carbon London Electric Vehicle Load Profiles. Library Catalog. Available online: data.london.gov.uk (accessed on 17 March 2021).
  129. Elbilsstatistik. Laddinfrastatistik. Library Catalog. Available online: www.elbilsstatistik.se (accessed on 17 March 2021).
  130. Tampere. Tampere Real-Time Traffic. Library Catalog. Available online: data.tampere.fi (accessed on 17 March 2021).
  131. Breidenbach, P.; Eilers, L. RWI-GEO-GRID: Socio-economic data on grid level. Publisher: De Gruyter Oldenbourg Section: Jahrbücher für Nationalökonomie und Statistik. Jahrbücher Natl. Stat. 2018, 238, 609–616. [Google Scholar] [CrossRef]
  132. Yuanyuan, L. China Installed More than 1000 EV Charging Stations per day in 2019. Library Catalog. 2020. Available online: www.renewableenergyworld.com (accessed on 17 March 2021).
  133. Helmus, J.R.; Lees, M.H.; van den Hoed, R. A data driven typology of electric vehicle user types and charging sessions. Transp. Res. Part C Emerg. Technol. 2020, 115, 102637. [Google Scholar] [CrossRef]
  134. Lahariya, M.; Benoit, D.; Develder, C. Poster: Defining a synthetic data generator for realistic electric vehicle charging sessions. In Proceedings of the Eleventh ACM International Conference on Future Energy Systems, Melbourne, Australia, 22–26 June 2020; p. 2. [Google Scholar] [CrossRef]
  135. Liang, M.; Li, W.; Yu, J.; Shi, L. Kernel-based electric vehicle charging load modeling with improved latin hypercube sampling. In Proceedings of the 2015 IEEE Power & Energy Society General Meeting, Denver, CO, USA, 26–30 July 2015; pp. 1–5. [Google Scholar] [CrossRef]
  136. Chen, L.; Huang, X.; Zhang, H. Modeling the Charging Behaviors for Electric Vehicles Based on Ternary Symmetric Kernel Density Estimation. Energies 2020, 13, 1551. [Google Scholar] [CrossRef] [Green Version]
  137. Khaki, B.; Chung, Y.W.; Chu, C.; Gadh, R. Nonparametric User Behavior Prediction for Distributed EV Charging Scheduling. In Proceedings of the 2018 IEEE Power & Energy Society General Meeting (PESGM), Portland, OR, USA, 5–10 August 2018; pp. 1–5. [Google Scholar] [CrossRef]
  138. Khaki, B.; Chung, Y.W.; Chu, C.; Gadh, R. Probabilistic Electric Vehicle Load Management in Distribution Grids. In Proceedings of the 2019 IEEE Transportation Electrification Conference and Expo (ITEC), Detroit, MI, USA, 19–21 June 2019; pp. 1–6. [Google Scholar] [CrossRef]
  139. Chung, Y.W.; Khaki, B.; Chu, C.; Gadh, R. Electric Vehicle User Behavior Prediction Using Hybrid Kernel Density Estimator. In Proceedings of the 2018 IEEE International Conference on Probabilistic Methods Applied to Power Systems (PMAPS), Boise, ID, USA, 23–28 June 2018; pp. 1–6. [Google Scholar] [CrossRef]
  140. Sokorai, P.; Fleischhacker, A.; Lettner, G.; Auer, H. Stochastic Modeling of the Charging Behavior of Electromobility. World Electr. Veh. J. 2018, 9, 44. [Google Scholar] [CrossRef] [Green Version]
  141. Amini, M.H.; Kargarian, A.; Karabasoglu, O. ARIMA-based decoupled time series forecasting of electric vehicle charging demand for stochastic power system operation. Electr. Power Syst. Res. 2016, 140, 378–390. [Google Scholar] [CrossRef]
  142. Bae, S.; Kwasinski, A. Spatial and Temporal Model of Electric Vehicle Charging Demand. IEEE Trans. Smart Grid 2012, 3, 394–403. [Google Scholar] [CrossRef]
  143. Häggström, O. Finite Markov Chains and Algorithmic Applications (London Mathematical Society Student Texts); Cambridge University Press: Cambridge, UK, 2002. [Google Scholar] [CrossRef] [Green Version]
  144. Box, G.E.P.; Jenkins, G.M.; Reinsel, G.C.; Ljung, G.M. Time Series Analysis: Forecasting and Control, 5th ed.; Wiley Series in Probability and Statistics; John Wiley & Sons Inc.: Hoboken, NJ, USA, 2016. [Google Scholar]
  145. Baskett, F.; Chandy, K.M.; Muntz, R.R.; Palacios, F.G. Open, Closed, and Mixed Networks of Queues with Different Classes of Customers. J. ACM 1975, 22, 248–260. [Google Scholar] [CrossRef]
  146. The EV Project—Overview. Library Catalog. 2010. Available online: web.archive.org/web/20101128153912/http://theevproject.com/overview.php (accessed on 17 March 2021).
  147. Majidpour, M.; Qiu, C.; Chu, P.; Gadh, R.; Pota, H.R. A novel forecasting algorithm for electric vehicle charging stations. In Proceedings of the 2014 International Conference on Connected Vehicles and Expo (ICCVE), Vienna, Austria, 3–7 November 2014; pp. 1035–1040. [Google Scholar] [CrossRef]
  148. Xiong, Y.; Chu, C.C.; Gadh, R.; Wang, B. Distributed optimal vehicle grid integration strategy with user behavior prediction. In Proceedings of the 2017 IEEE Power & Energy Society General Meeting, Chicago, IL, USA, 16–20 July 2017; pp. 1–5. [Google Scholar] [CrossRef] [Green Version]
  149. Frendo, O.; Gaertner, N.; Stuckenschmidt, H. Improving Smart Charging Prioritization by Predicting Electric Vehicle Departure Time. IEEE Trans. Intell. Transp. Syst. 2020, 1–8. [Google Scholar] [CrossRef]
  150. Mies, J.; Helmus, J.; van den Hoed, R. Estimating the Charging Profile of Individual Charge Sessions of Electric Vehicles in The Netherlands. World Electr. Veh. J. 2018, 9, 17. [Google Scholar] [CrossRef] [Green Version]
  151. Lu, Y.; Li, Y.; Xie, D.; Wei, E.; Bao, X.; Chen, H.; Zhong, X. The Application of Improved Random Forest Algorithm on the Prediction of Electric Vehicle Charging Load. Energies 2018, 11, 3207. [Google Scholar] [CrossRef] [Green Version]
  152. Zhu, J.; Yang, Z.; Mourshed, M.; Guo, Y.; Zhou, Y.; Chang, Y.; Wei, Y.; Feng, S. Electric Vehicle Charging Load Forecasting: A Comparative Study of Deep Learning Approaches. Energies 2019, 12, 2692. [Google Scholar] [CrossRef] [Green Version]
  153. Vapnik, V.N. The Nature of Statistical Learning Theory; Springer: New York, NY, USA, 1995. [Google Scholar] [CrossRef]
  154. Breiman, L. Random Forest. Mach. Learn. 2001, 45, 5–32. [Google Scholar] [CrossRef] [Green Version]
  155. Buzna, L.; Falco, P.D.; Khormali, S.; Proto, D.; Straka, M. Electric vehicle load forecasting: A comparison between time series and machine learning approaches. In Proceedings of the International Conference on Energy Transition in the Mediterranean Area, Cagliari, Italy, 28–30 May 2019; p. 5. [Google Scholar]
  156. Rosenblatt, F. The perceptron: A probabilistic model for information storage and organization in the brain. Psychol. Rev. 1958, 65, 386–408. [Google Scholar] [CrossRef] [Green Version]
  157. Rumelhart, D.E.; Hinton, G.E.; Williams, R.J. Learning Internal Representations by Error Propagation; Technical Report ICS-8506; Institute for Cognitive Science: San Diego, CA, USA, 1985. [Google Scholar]
  158. LeCun, Y.; Boser, B.; Denker, J.S.; Henderson, D.; Howard, R.E.; Hubbard, W.; Jackel, L.D. Backpropagation Applied to Handwritten Zip Code Recognition. Neural Comput. 1989, 1, 541–551. [Google Scholar] [CrossRef]
  159. Chakraborty, S.; Tomsett, R.; Raghavendra, R.; Harborne, D.; Alzantot, M.; Cerutti, F.; Srivastava, M.; Preece, A.; Julier, S.; Rao, R.M.; et al. Interpretability of deep learning models: A survey of results. In Proceedings of the 2017 IEEE SmartWorld, Ubiquitous Intelligence & Computing, Advanced & Trusted Computed, Scalable Computing & Communications, Cloud & Big Data Computing, Internet of People and Smart City Innovation (SmartWorld/SCALCOM/UIC/ATC/CBDCom/IOP/SCI), San Francisco, CA, USA, 4–8 August 2017; pp. 1–6. [Google Scholar] [CrossRef]
  160. Zhang, Q.; Zhu, S.C. Visual Interpretability for Deep Learning: A Survey. arXiv 2018, arXiv:1802.00614. [Google Scholar] [CrossRef] [Green Version]
  161. Vynakov, O.F.; Savolova, E.V.; Skrynnyk, A.I. Modern Electric Cars of Tesla Motors Company. Autom. Technol. Bus. Process. 2016, 8, 9–18. [Google Scholar] [CrossRef] [Green Version]
  162. Wood, S. mgcv: Mixed GAM Computation Vehicle with Automatic Smoothness Estimation. Library Catalog. 2019. Available online: CRAN.R-project.org/package=mgcv (accessed on 30 June 2020).
  163. Burchart-Korol, D.; Jursova, S.; Folęga, P.; Korol, J.; Pustejovska, P.; Blaut, A. Environmental life cycle assessment of electric vehicles in Poland and the Czech Republic. J. Clean. Prod. 2018, 202, 476–487. [Google Scholar] [CrossRef]
  164. General Data Protection Regulation (GDPR)–Official Legal Text. Library Catalog. Available online: gdpr-info.eu (accessed on 17 March 2021).
  165. eCO2mix. Electrical Consumption in Cities Open Data. Library Catalog. Available online: www.data.gouv.fr (accessed on 17 March 2021).
  166. Zhang, P.; Zhou, C.; Stewart, B.G.; Hepburn, D.M.; Zhou, W.; Yu, J. An Improved Non-Intrusive Load Monitoring Method for Recognition of Electric Vehicle Battery Charging Load. Energy Procedia 2011, 12, 104–112. [Google Scholar] [CrossRef] [Green Version]
  167. Wang, S.; Du, L.; Ye, J.; Zhao, D. A Deep Generative Model for Non-intrusive Identification of EV Charging Profiles. IEEE Trans. Smart Grid 2020, 11, 4916–4927. [Google Scholar] [CrossRef]
  168. Du, N.; Dai, H.; Trivedi, R.; Upadhyay, U.; Gomez-Rodriguez, M.; Song, L. Recurrent Marked Temporal Point Processes: Embedding Event History to Vector. In Proceedings of the 22nd ACM SIGKDD International Conference on Knowledge Discovery and Data Mining–KDD ’16, San Francisco, CA, USA, 13–17 August 2016; pp. 1555–1564. [Google Scholar] [CrossRef]
  169. Xiao, S.; Yan, J.; Yang, X.; Zha, H.; Chu, S.M. Modeling the Intensity Function of Point Process via Recurrent Neural Networks. In Proceedings of the Thirty-First AAAI Conference on Artificial Intelligence, San Francisco, CA, USA, 4–9 February 2017; p. 7. [Google Scholar]
  170. Fallah, N.; Gu, H.; Mohammad, K.; Seyyedsalehi, S.A.; Nourijelyani, K.; Eshraghian, M.R. Nonlinear Poisson regression using neural networks: A simulation study. Neural Comput. Appl. 2009, 18, 939–943. [Google Scholar] [CrossRef]
  171. Capezza, C.; Palumbo, B.; Goude, Y.; Wood, S.N.; Fasiolo, M. Additive stacking for disaggregate electricity demand forecasting. arXiv 2020, arXiv:2005.10092. [Google Scholar]
  172. Sadeghianpourhamami, N.; Deleu, J.; Develder, C. Achieving Scalable Model-Free Demand Response in Charging an Electric Vehicle Fleet with Reinforcement Learning. In Proceedings of the Ninth International Conference on Future Energy Systems—e-Energy ’18, Karlsruhe, Germany, 12–15 June 2018; pp. 411–413. [Google Scholar] [CrossRef]
  173. Enedis. Grid Map Open Data. Library Catalog. Available online: data.enedis.fr (accessed on 17 March 2021).
  174. Makonin, S.; Popowich, F. Nonintrusive load monitoring (NILM) performance evaluation. Energy Effic. 2015, 8, 809–814. [Google Scholar] [CrossRef]
  175. Salem, H.; Sayed-Mouchaweh, M. A Semi-supervised and Online Learning Approach for Non-Intrusive Load Monitoring. In Machine Learning and Knowledge Discovery in Databases; Lecture Notes in Computer Science; Brefeld, U., Fromont, E., Hotho, A., Knobbe, A., Maathuis, M., Robardet, C., Eds.; Springer International Publishing: Cham, Switzerland, 2020; pp. 585–601. [Google Scholar] [CrossRef]
  176. Pecan Street Data. Library Catalog. Available online: www.pecanstreet.org (accessed on 17 March 2021).
  177. Laub, P.J.; Taimre, T.; Pollett, P.K. Hawkes Processes. arXiv 2015, arXiv:1507.02822. [Google Scholar]
  178. Frendo, O.; Graf, J.; Gaertner, N.; Stuckenschmidt, H. Data-driven smart charging for heterogeneous electric vehicle fleets. Energy AI 2020, 1, 100007. [Google Scholar] [CrossRef]
  179. Department of Transport. Creating a Market: Victorian Electric Vehicle Trial Mid-Term Report; Technical Report; State Government of Victoria: Melbourne, VIC, Australia, 2013.
  180. GOV.UK. National Travel Survey. Library Catalog. Available online: www.gov.uk (accessed on 23 November 2020).
  181. UCDavis. Plug-In Hybrid & Electric Vehicles Research Center. Library Catalog. Available online: phev.ucdavis.edu (accessed on 23 November 2020).
  182. Tesla Motors, Electric Cars, Solar & Clean Energy. Available online: https://www.tesla.com/ (accessed on 17 March 2021).
  183. PJM. Markets & Operations, District of Columbia. Library Catalog. Available online: www.pjm.com/markets-and-operations (accessed on 23 November 2020).
  184. Dominguez-Garcia, A.D.; Heydt, G.T.; Suryanarayanan, S. Implications of the Smart Grid Initiative on Distribution Engineering; Technical Report; Power Systems Engineering Research Center: Tempe, AZ, USA, 2011. [Google Scholar]
  185. NewYorkState. Traffic Data Viewer. Library Catalog. Available online: www.dot.ny.gov/tdv (accessed on 23 November 2020).
  186. Huber, J.; Höffer, J.; Thumm, J.; Weinhardt, C. Parking Events Derived from Trip Data from MiD2008. Library Catalog. 2019. Available online: publikationen.bibliothek.kit.edu/1000098024 (accessed on 23 November 2020).
  187. Ministerie van Verkeer en Waterstaat, Rijkswaterstaat, Dienst Verkeer en Scheepvaart, Mobiliteitsonderzoek Nederland 2008. Library Catalog. 2008. Available online: easy.dans.knaw.nl (accessed on 23 November 2020).
  188. Engineering Products and Training Courses|EA Technology. Library Catalog. Available online: eatechnology.com (accessed on 23 November 2020).
  189. Leung, K.; Massey, W.; Whitt, W. Traffic models for wireless communication networks. IEEE J. Sel. Areas Commun. 1994, 12, 1353–1364. [Google Scholar] [CrossRef]
Figure 1. The variety of strategies envisaged for handling Electric Vehicle (EV) load and their associated aims.
Energies 14 02233 g001
Figure 2. For each of the 14 countries in scope, the national EV market share [57] and the estimated number of EVs sold [121] is shown: HCS refers to historical charging session data, RTCS refers to real-time charging session data and T refers to traffic counts and/or travel survey data.
Energies 14 02233 g002
Figure 3. Fields available (in green) and missing (in grey) in the six datasets selected.
Energies 14 02233 g003
Figure 4. The black dots represent the daily number of sessions while the red curve is the output of a generalized additive model used to estimate the trend (mgcv package in Ref. [162]).
Energies 14 02233 g004
Table 1. The most relevant open dataset available found in this research with the associated references.
CountriesEVSE DataExogenous Data
LocationCharging SessionsTraffic
Counts
Travel
Survey
Registered
Vehicles
HistoricalReal-Time
Norway[59] [59][60,61] [62]
Iceland [63] [64]
Sweden[65] [59] [66]
Netherlands[67,68][69][67][70][71][72]
Finland[59] [59][73] [74]
China[75] [76,77][78]
Portugal[79] [80]
USA[81][82,83,84,85] [86][43,87][88]
Canada[89][90] [91][92][93]
France[94][95,96][97][98,99][100][101]
New Zealand [102] [103]
UK[104,105][106,107] [108,109][110][111]
Germany[112] [113][114,115][116,117][118]
Japan [119][120]
Table 2. Statistical characterization models for EV load.
ModelStrengthsWeaknessesRef
GaussianParticularly suited for large simulationsUnrealistic as negative values have a non-zero probability[14]
Weibull, Lognormal, ExponentialRapid implementation while providing an approximation consistent with realityFail to capture significantly diverse behaviours in the data[13]
Mixtures (e.g., Beta, Gaussian)Captures significantly different users’ behaviours in the data and respects real-world constraintsUnsuitable for medium or large dimension problems with numerous covariates[24,123,133,134]
KDEHighly versatile model as no explicit prior on the distribution is requiredWeak interpretability power in addition to a sensitivity to outliers[135,136,137,138,139]
Table 3. Stochastic processes for EV load.
ModelStrengthsWeaknessesRef
TemporalAdequate for modelling one EVSE or one EVGenerally assumes independence between EVSEs[15,37,44,140,141]
SpatiotemporalSuited for modelling clusters of charging stations simultaneouslyLarge increase in complexity with scale[9,18,32]
QueuesEasily scalable with strong theoretical groundsRestricts reality with simplifying assumptions[16,29,39,142]
Table 4. Machine learning models for EV load.
ModelStrengthsWeaknessesRef
Linear ModelEasily interpretable with fast implementationStructurally limited for capturing complex and irregular patterns[148,149,150]
Support Vector MachinesEasy implementation and effective in high-dimensional spacesNot suitable for large and complex datasets which are not linearly separable even in high-dimensional spaces[8,31,33,147]
Random ForestVersatile model with no prior assumptions on the shape of the dataWeak interpretability with no ability to extrapolate from training data[12,33,147,151]
Neural NetworksCan reach the highest level of performanceArchitecture selection process can be laborious with long training time[28,31,33,41,49,152]
Table 5. Overall statistics and high-level information for the six datasets in scope.
Charging Session DatasetBoulderPalo AltoDundeePerthParisDomestics UK
First
Transaction
Date
1 January 201829 July 20119 January 20179 January 20161 April 20171 January 2017
Last
Transaction
Date
31 March 202031 July 20175 December 20188 December 201930 May 201731 December 2017
Total
Transactions
All18,052133,32947,05163,93642252,956,198
Weekdays13,487101,48634,43446,60749072,208,695
Weekends456531,84312,61717,3291555747,503
Average
Transactions
Weekdays2365173601018495
Weekends205116055867119
Park
Duration (h)
Mean-2.72.291.241.79.16
Standard
Deviation
-2.414.562.132.936.49
Charge
Duration (h)
Mean1.812.05----
Standard
Deviation
1.341.39----
Energy
Demand (kWh)
Mean8.428.189.1611.018.518.88
Standard
Deviation
7.086.766.538.496.717.55
Table 6. Charging session datasets with associated EV load models suggested.
Charging Session DatasetSpecificitiesEV Load ModelsModels References
Boulder [82]Public Charging Sessions
Medium-sized Dataset
GHG and Gasoline Savings
2 years
Spatiotemporal
RF
Mixtures
KDE
[9,18,32]
[147,151]
[24,123,133,134]
[135,136,137,138,139]
Palo Alto [83]Public Charging Sessions
Large Dataset
Driver’s Post Code
6 years
Spatiotemporal
Queues
ANN
[9,18,32]
[16,39]
[28,33,41,49,152]
Dundee [106] and Perth [107]Public Charging Sessions
Medium-sized Datasets
2 years (Dundee) and 4 years (Perth)
Temporal
SVM
Mixtures
KDE
[15,37,140,141]
[8,33]
[24,123,133,134]
[135,136,137,138,139]
Paris [95]Public Charging Sessions
Small dataset
Customer Identifier
2 months
Unimodal distributions
LM
Queues
[13,14]
[148,149,150]
[29,142]
Domestics UK [125]Residential charging sessions
Large dataset
Customer Identifier
1 year
Temporal
RF
[44]
[12]
Table 7. Gaps and future work for EV load data and models. Section 6.1 and Section 6.2 deal with data prospects and limitations while Section 6.3 and Section 6.4 describe new ways of modelling and tie EV load models to optimization of charging schedules.
SectionKeywordsReferences
Data6.1 Usage and privacy issuesVariables[55,56]
Accessibility[41]
Regulations[164]
6.2 Other types of relevant dataGeneral Electrical Load[53,165]
Non-Intrusive Load Monitoring[166,167]
Synthetic data[134]
Models6.3 Composite ApproachesStochastic Processes[168,169]
Machine Learning[170]
6.4 Link with optimizationSmart Charging[6]
Probabilistic Approach[171]
Reinforcement Learning[172]
Publisher’s Note: MDPI stays neutral with regard to jurisdictional claims in published maps and institutional affiliations.

